Article

Radiological Risk Parameters of the Phosphorite Deposits, Gebel Qulu El Sabaya: Natural Radioactivity and Geochemical Characteristics

1
Geology Department, Faculty of Science, Al-Azhar University, Cairo 11884, Egypt
2
Institute of Physics and Technology, Ural Federal University, 620002 Yekaterinburg, Russia
3
Physics Department, Faculty of Science, Al-Azhar University, Assiut Branch, Assiut 71524, Egypt
4
Department of Physics, College of Science, Princess Nourah Bint Abdulrahman University, P.O. Box 84428, Riyadh 11671, Saudi Arabia
5
Department of Chemistry, Physics, and Environment, Faculty of Sciences and Environment, INPOLDE Research Center, Dunarea de Jos University of Galati, 47 Domneasca Street, 800008 Galati, Romania
6
Geology Department, Faculty of Science, Minia University, El-Minia 61519, Egypt
7
Geology Department, Faculty of Science, Al-Azhar University, Assiut Branch, Assiut 71524, Egypt
8
Geology Department, Faculty of Science, South Valley University, Qena 83523, Egypt
*
Authors to whom correspondence should be addressed.
Minerals 2022, 12(11), 1385; https://doi.org/10.3390/min12111385
Submission received: 22 August 2022 / Revised: 25 October 2022 / Accepted: 28 October 2022 / Published: 30 October 2022
(This article belongs to the Special Issue Natural Radionuclides in the Mineral Processing and Metallurgy)

Abstract

:
This study investigates the distribution of natural radioactivity and geological, geochemical, and environmental risk assessments of phosphorite deposits to determine their suitability for international applications (such as phosphoric acid and phosphatic fertilizers). The examined Late Cretaceous phosphorite deposits belong to the Duwi Formation, which is well exposed on the southern scarp boundary at the central part of Abu Tartur Plateau, Gebel Qulu El Sabaya, East Dakhla Oasis. This formation is classified into lower phosphorite, middle shale, and upper phosphorite members. The lower phosphorite ranges in thickness from 2 to 3.5 m and mainly comprises apatite (possibly francolite), dolomite, calcite, quartz, hematite, anhydrite, and kaolinite. They contain an average concentration of CaO (38.35 wt.%), P2O5 (24.92 wt.%), SiO2 (7.19 wt.%), Fe2O3 (4.18 wt.%), MgO (3.99 wt.%), F (1.59 wt.%), Al2O3 (1.84 wt.%), Na2O (1.33 wt.%), and K2O (0.22 wt.%). Natural radioactivity and radiological parameters were investigated for fifteen samples of phosphorites using a NaI (Tl) scintillation detector. Absorbed dose rates, outdoor and indoor annual effective dose, radium equivalent activity, external and internal hazard, and excess cancer risk values are higher than the recommended levels, reflecting that exposure to these deposits for a long time may lead to health risks to human organs.

1. Introduction

The sedimentary, igneous, and metamorphic rocks are widely distributed and cover vast areas of the Egyptian Sinai, Eastern, and Western Deserts [1,2,3,4,5,6,7]. Egyptian phosphorite deposits belong to the Duwi Formation as a part of the Mediterranean phosphorite belt, which extends from the African (west) to the Asian (east) Arab countries. Egyptian phosphorite occurrences are subdivided by [8] into three belts, east-west trending. The economic occurrences are restricted to the central facies belt, confined to the following localities, the Red Sea coast from Safaga to Quseir; the Nile Valley between Idfu and Qena; and the Western Desert between Kharga and Dakhla oases (Abu Tartur area). The Phosphorite (Duwi) Formation is conformably overlain by the Dakhla Formation and is assigned to Upper Campanian to Early Maastrichtian age [8,9,10,11]. In the present study, the Gebel Qulu El Sabaya sector is extended east-west for about 13 km along the southern scarp boundary at the central part of Abu Tartur Plateau, located about 15 km north of the Dakhla–Kharga road (Figure 1).
In general, the lithostratigraphic section of Gebel Qulu El Sabaya is based on the Quseir shale Member of the Nubia Formation, overlain by the Duwi Formation and Dakhla Formation at the top. The Duwi Formation comprises three members; the lower one is the productive phosphorite. The lower member of the Duwi Formation in the Abu Tartur area represents a productive phosphorite bed with a thickness ranging from 0.7 up to 10 m, while the middle member is composed of black shale and siltstone with a thickness ranging from 12 to 28 m [12]. On the other hand, the upper member has three thin phosphatic bands intercalated with black shale with a total thickness ranging from 0.7 to 1 m. The Duwi Formation is unconformably overlying the Quseir shale member with an undulating surface where the non-oxidized phosphorite rocks were deposited in a reducing environment and changed to a yellowish-brown color by subsequent chemical oxidation processes [13,14]. The geochemistry of phosphorites and their main mineral constituent, francolite, have been widely studied due to their economic importance. Variability in the chemical composition of francolite may reflect the difference in original composition and modification during diagenesis [15]. All sedimentary phosphorites, everywhere in the world, are mainly composed of carbonate fluorapatite (traditionally known as francolite), but the fluorine content increases with age.
The phosphorite rocks were considered a natural source of uranium, where the uranium-bearing minerals were formed in the sedimentary phosphorite during deposition and digenesis by the seawater. Apatite is a common mineral that contains high concentrations of uranium, which range from 30 to 300 ppm, and may reach up to 500 ppm in phosphorite reworked in the marine environment. The main uranium components in phosphorite are U+4 and U+6. The tetravalent form is partially replaced by Ca+2 in the apatite lattice because of their similar ionic radii, while the hexavalent one is enriched in the ore by adsorption onto the mineral surface [16]. Abu Tartur phosphorite contains the highest recorded concentration of REEs (up to 2000 ppm) [17]. They stated that the Abu Tartur phosphorite has the lowest uranium content at about 24 ppm, relative to El Sibaiya phosphorite at 85 ppm and the Red Sea phosphorite at 68 ppm. The rare earth elements (REEs) patterns of marine phosphorite are useful indicators of marine depositional environments [18]. However, REEs signatures can be altered by burial digenesis or by surface weathering [19].
This study deals with stratigraphical, petrographical, mineralogical, and geochemical investigations of the lower phosphorite member of the Duwi Formation at Gebel Qulu El Sabaya in order to identify the thickness and principal constituents of this phosphorite member. In addition, natural radioactivity and radiological parameters were applied to deduce their impact on human organs.

2. Materials and Methods

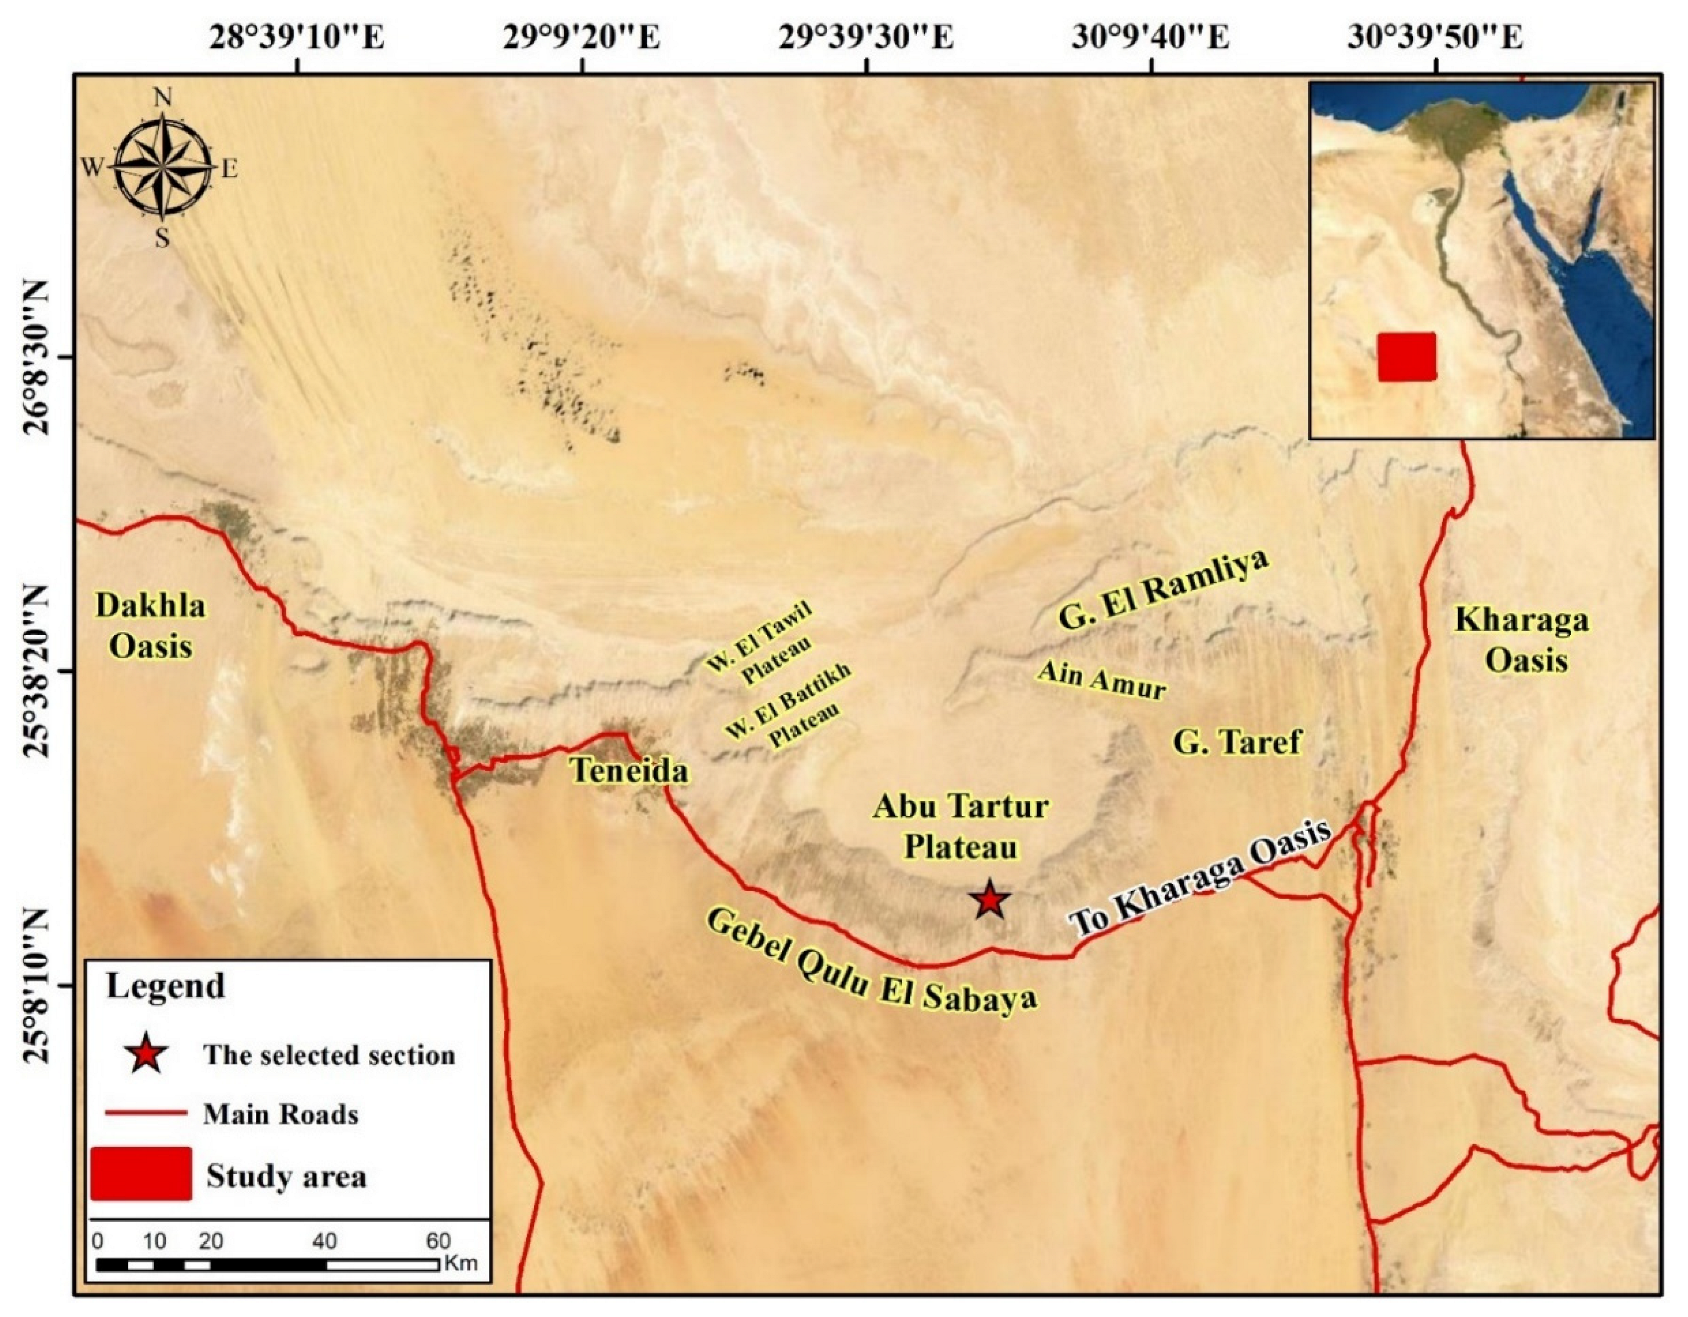
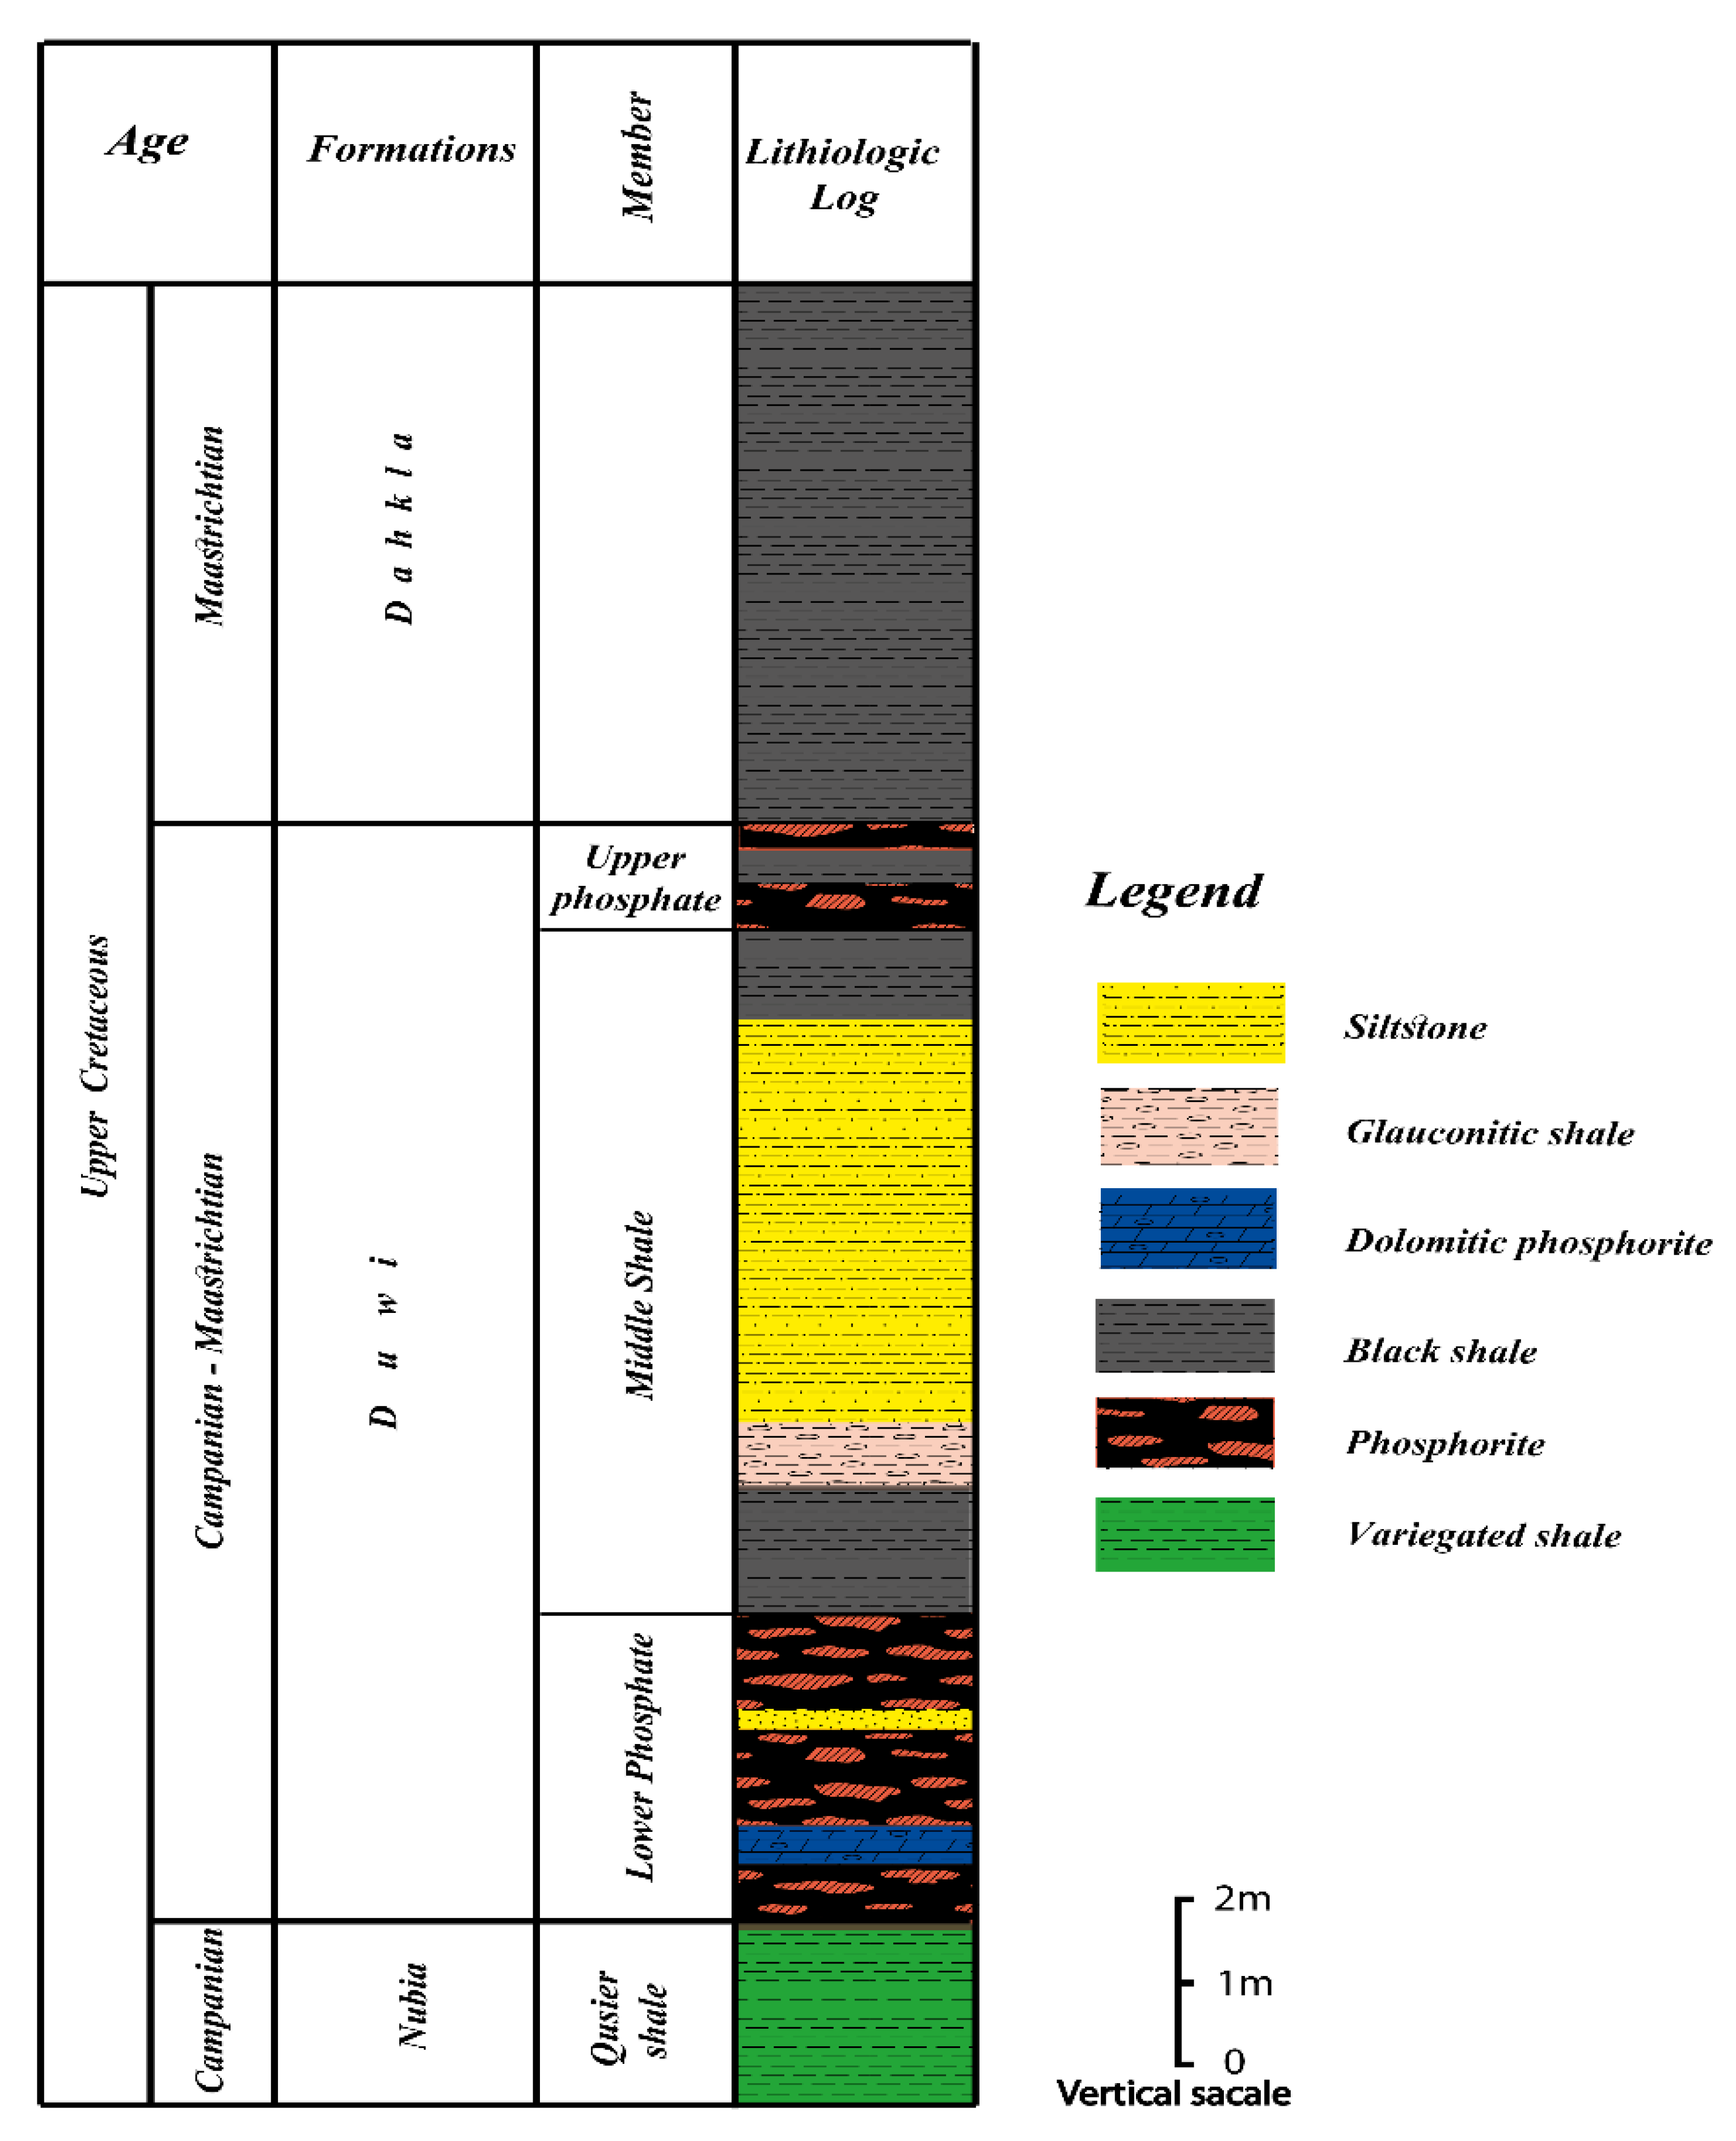
2.1. Geological Setting
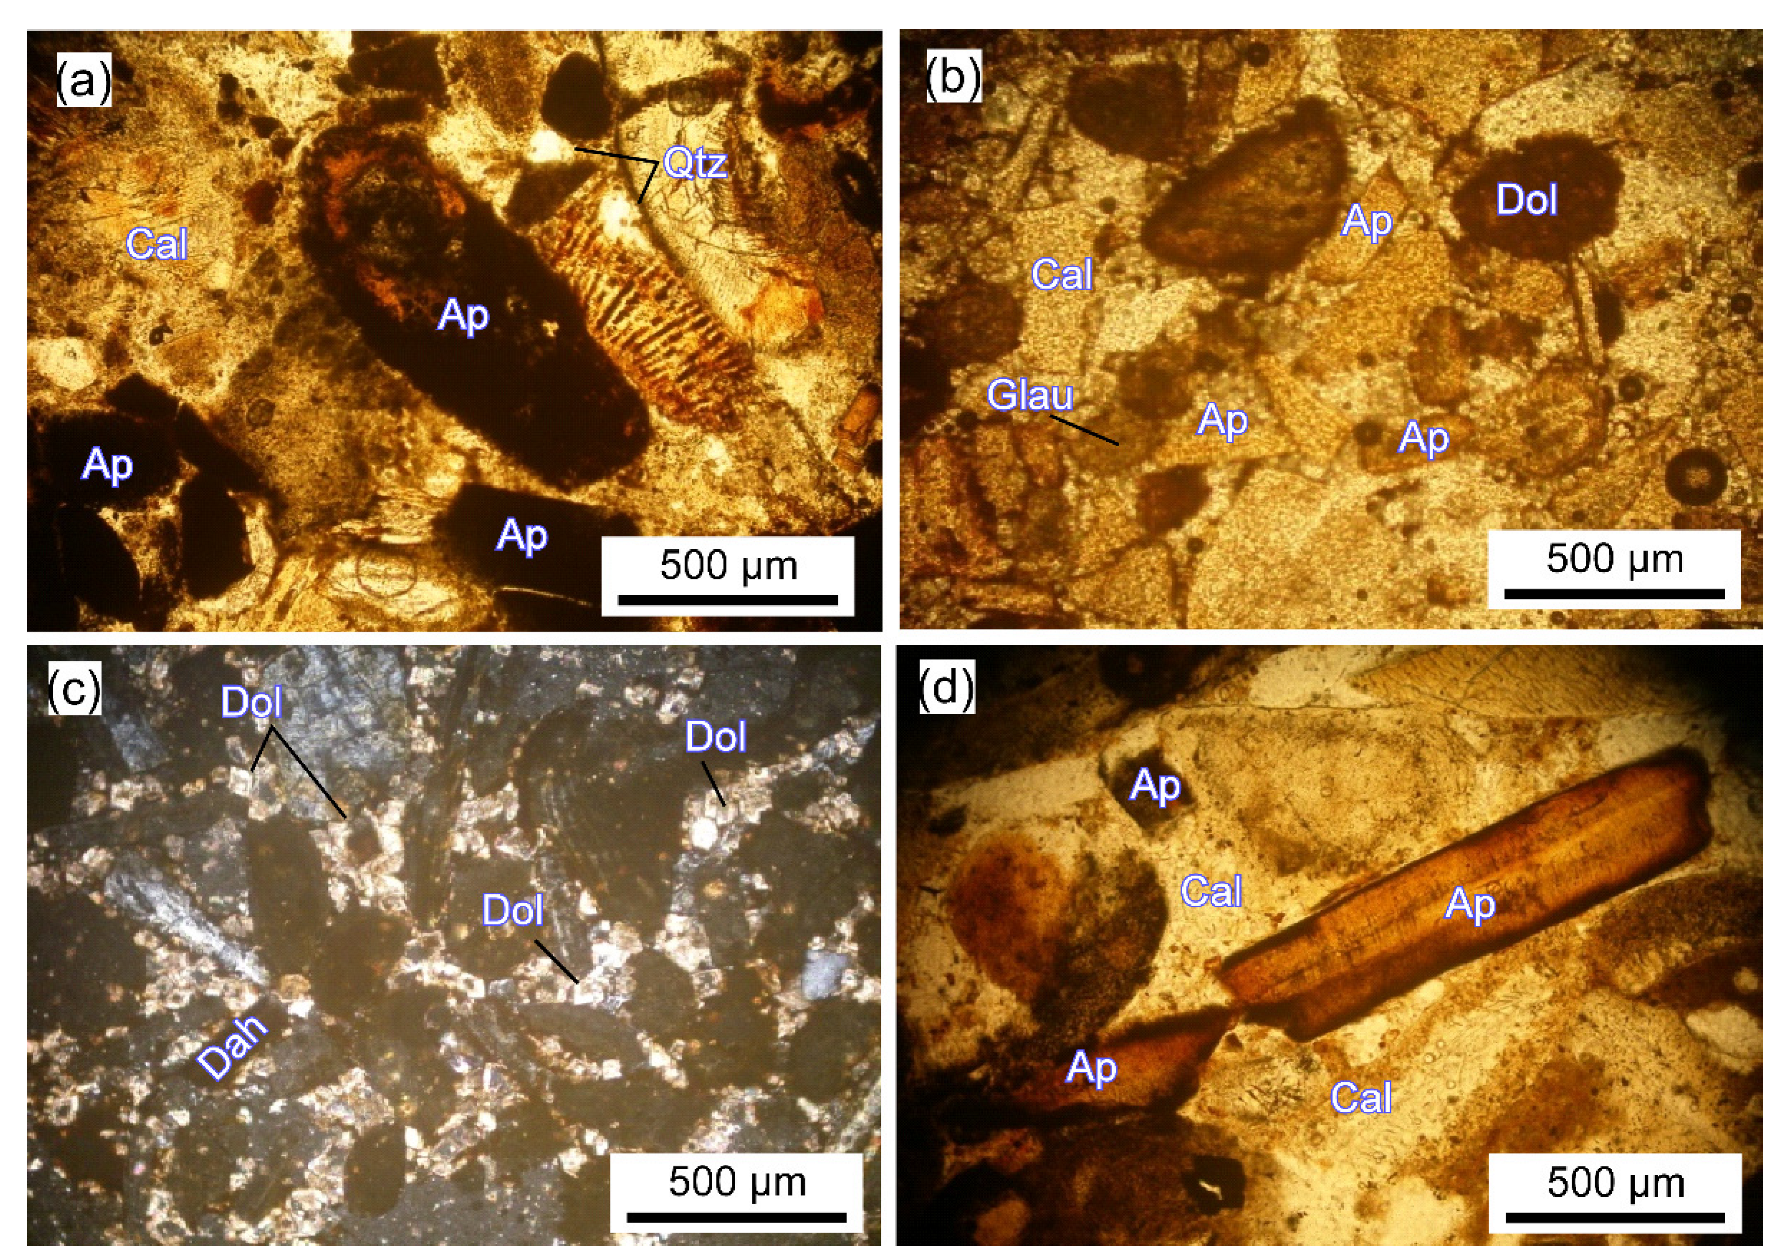
The Western Desert covers more than 65% of Egypt, spreading from the Nile Valley to the Libyan border. It is a plateau desert with several oases, including Kharga, Farafra, Dakhla, and Beris. It initially developed during the Neotethys opening in the Late Triassic and Early Jurassic periods.
Phosphorite beds are exposed in the stratigraphic section of Gebel Qulu El Sabaya. Herein, the Duwi Formation unconformably overlies the Campanian variegated Quseir shale member of the Nubia Formation with undulating erosion contacts and is conformably overlain by the marine laminated Maestrichtian grey to black shale and marls of the Dakhla Formation (Figure 2). The Duwi Formation is made up of coarse-fine phosphorite grains intercalated with dolomitic phosphorite, glauconitic shale, and black shale lenses in the lower part and glauconitic shale in the middle, with hard dolomitic phosphorite beds intercalated with black shale bands in the upper part. An undulating surface and conglomerate bed characterize the unconformable boundary between the Quseir Member and the overlying Duwi Formation, like the Abu Tartur area [13,14]. The Duwi Formation in the studied area is classified after Issawi et al. [9,10] and [14] into lower phosphorite (I), middle shale (II), and upper phosphorite (III) members (Figure 2).
The lower phosphorite member consists of moderately hard oxidized phosphorite of yellowish-brown color intercalated with black shale lenses with an average thickness of 0.4 m. The total thickness of this member ranges from 2 to 3.5 m with an average of 2.5 m, which could be considered the economic phosphorite beds in the studied area (Figure 2).
The middle shale member is mainly composed of glauconitic shale, siltstone, and grey shale, characterized by cracking filled with gypsum and ferruginous staining. This member has a thickness range of 0.3 to 1.1 m with an average of 0.8 m (Figure 2).
The upper phosphorite member comprises hard dolomitic phosphate beds intercalated with grey-to-black shale lenses. Its thickness varies from 0.2 to 0.3 m, with an average of 0.25 m (Figure 2).

2.2. Petrography

The investigated phosphorite samples of the Gebel Qulu El Sabaya area microscopically show two principal constituents: phosphatic components (apatite, fish bone fragments, and shark teeth) and non-phosphatic components (dolomite, calcite, and iron oxides) as cement materials (Figure 3). The phosphate grains are generally angular to sub-rounded, elongated in shape, and yellowish brown in color (Figure 3a,b,d), which could be reflective of the effect of oxidation of pyrite mineral and the formation of iron oxyhydroxides [14].
Fishbone fragments are generally elongated to sub-angular in shape (Figure 3b). Bone fragments and teeth of different sizes and shapes are common as clastic allelochemical constituents. On the other hand, the non-phosphate cementing components are mostly composed of microcrystalline dolomite, glauconite, calcite grains, and iron oxides (Figure 3b,c). The replacement of phosphate grains by cementing material (dolomite rhombus) reflects the digenetic process effect (Figure 3c).

2.3. Sampling and Analytical Techniques

Fifteen representative samples were collected from Gebel Qulu El Sabaya sections to cover most of the lower phosphorite members at Gebel Qulu El Sabaya. The petrographic characteristics were microscopically investigated for five representative samples. These samples were prepared and subjected to complete wet chemical analysis to estimate their major oxides. At the same time, the trace elements were measured using an XRF (X-ray fluorescence) Philips X-ray spectrometer in the laboratories of the Nuclear Materials Authority. Rare earth elements (REEs) were analyzed using induced Couple Plasma (ICP). The concentrations of uranium (ppm), thorium (ppm), radium (ppm), and potassium (%) in different rock types were detected γ-spectrometric by using a multi-channel analyzer with a 76 × 76 mm NaI detector [20]. These samples are grinded and preserved in plastic containers for at least 21 days to accumulate free radon and other isotope emissions. The stability spectrometer channels change due to variations in power supply and amplification of the photomultiplier tube.
An empty sealed beaker with the same geometry as the samples was used to evaluate the background around the detector. With 12 h of measurement time, the Genie 2000 (Canberra) software was used to analyze the spectrum. The 226Ra activity was evaluated using γ-peaks of 214Pb (0.3519 MeV (36.7%)) and of 214Bi (0.6093 MeV (46.1%), 1.1203 MeV (15%), 1.7286 MeV (3.05%), and 1.764 MeV (15.9%)). The 232Th activity was estimated using γ-peaks of 228Ac (0.9112 MeV (29%)), 212Pb (0.2386 MeV (43.6%)), and 208Tl (0.5831 MeV (84.5%). The 40K activity was estimated using a self γ-peak of 1.461 MeV (10.7%).

2.4. Energy and Efficiency Calibration

Variations influence the stability of the energy of the spectrometer channels in the power supply, voltage, and photomultiplier tube amplification characteristics. The characteristics of the power supply and the photomultiplier are impacted by temperature. To ensure that the instrument accurately records the gamma radiation energy of the radioactive elements, a permanent calibration is performed using radioactive calibration sources like 137C (made in channel 662) and 57Co (122.1 keV, manufactured in channel 122): First, the 137Cs source is used for gain adjustments before the 57Co source is used for zero alterations, and second, the 137Cs source is usually used as a minimum technique.
The efficiencies was estimated experimentally using standard sources (IAEA-314) with particular activity for Radium-226 (732 Bqkg−1) and Thorium-232 (17.8 ppm). According to an academic program in MATLAB, the absolute efficiency at any interesting energy varied from 10 to 1764 keV. For Quality Assurance, the uncertainty of activity u(A) was evaluated using the following formula.
u ( A ) = A [ u ( N p ) N p ] 2 + [ u ( η ) η ] 2 + [ u ( m ) m ] 2 + [ u ( P γ ) P γ ] 2
where u(Np), u(η), u(m), and u(), respectively, stand for the absolute efficiency for each gamma line discovered in the same number of channels in the sample, sample mass, and absolute transition probability of decay. Computer “analysis” software calculated the uncertainty of each individual net-peak area.

3. Results and Discussion

3.1. Geochemical Characteristics

3.1.1. Major Oxides

The collected phosphorite samples of the Gebel Qulu El Sabaya area were subjected to chemical analysis to determine the content of the major oxide (Table 1 and Figure 4). Results show that the studied phosphorite deposits are dominated by CaO (36–41 wt.% with an average of 38.35 wt.%), P2O5 (22–27.4 wt.% with an average of 24.92 wt.%), SiO2 (5.4–9.2 wt.% with an average of 7.19 wt.%), MgO (3–3.4 wt.% with an average of 3.99 wt.%), and Fe2O3 (3–4.8 wt.% with an average of 4.18 wt.%).
The average content of Al2O3 and F is 1.84 wt.% and 1.59 wt.%, respectively. However, Na2O and K2O are minor constituents, showing averages of 1.33 wt.% and 0.22 wt.%, respectively. Traditionally, CaO and P2O5 are the main components of apatite minerals, while Fe2O3 and MgO content is related to the presence of hematite and dolomite minerals, respectively. On the other hand, the observed variation in the P2O5 content from one sample to another (22–27.4 wt.% P2O5) could reflect the digenetic and geochemical processes that cause limited replacement of P2O5 by other components such as SiO2, MgO, and Fe2O3. The microscopic examination indicated the replacement of phosphate particles by cementing materials. This reduces the grade of the phosphorite. Generally, the P2O5, Fe2O3, and MgO contents are widely used for quality evaluation in the industry.
Phosphorite ore deposits into three grades: high (with more than 27 wt.% of P2O5), medium (27 to 23 wt.% P2O5), and low (with less than 23 wt.% of P2O5) [21]. According to that classification, the studied phosphorite of Gebel Qulu El Sabaya is considered a medium grade (an average of 24.92 wt.% P2O5). This phosphorite, compared with other Egyptian phosphorites, is nearly similar in P2O5 relative to Abu Tartur [12] and Sibaiya phosphorites according to [22] and higher in Fe2O3 and MgO content (Table 2). This variation may be due to a slight difference in the depositional environment or geochemical process.

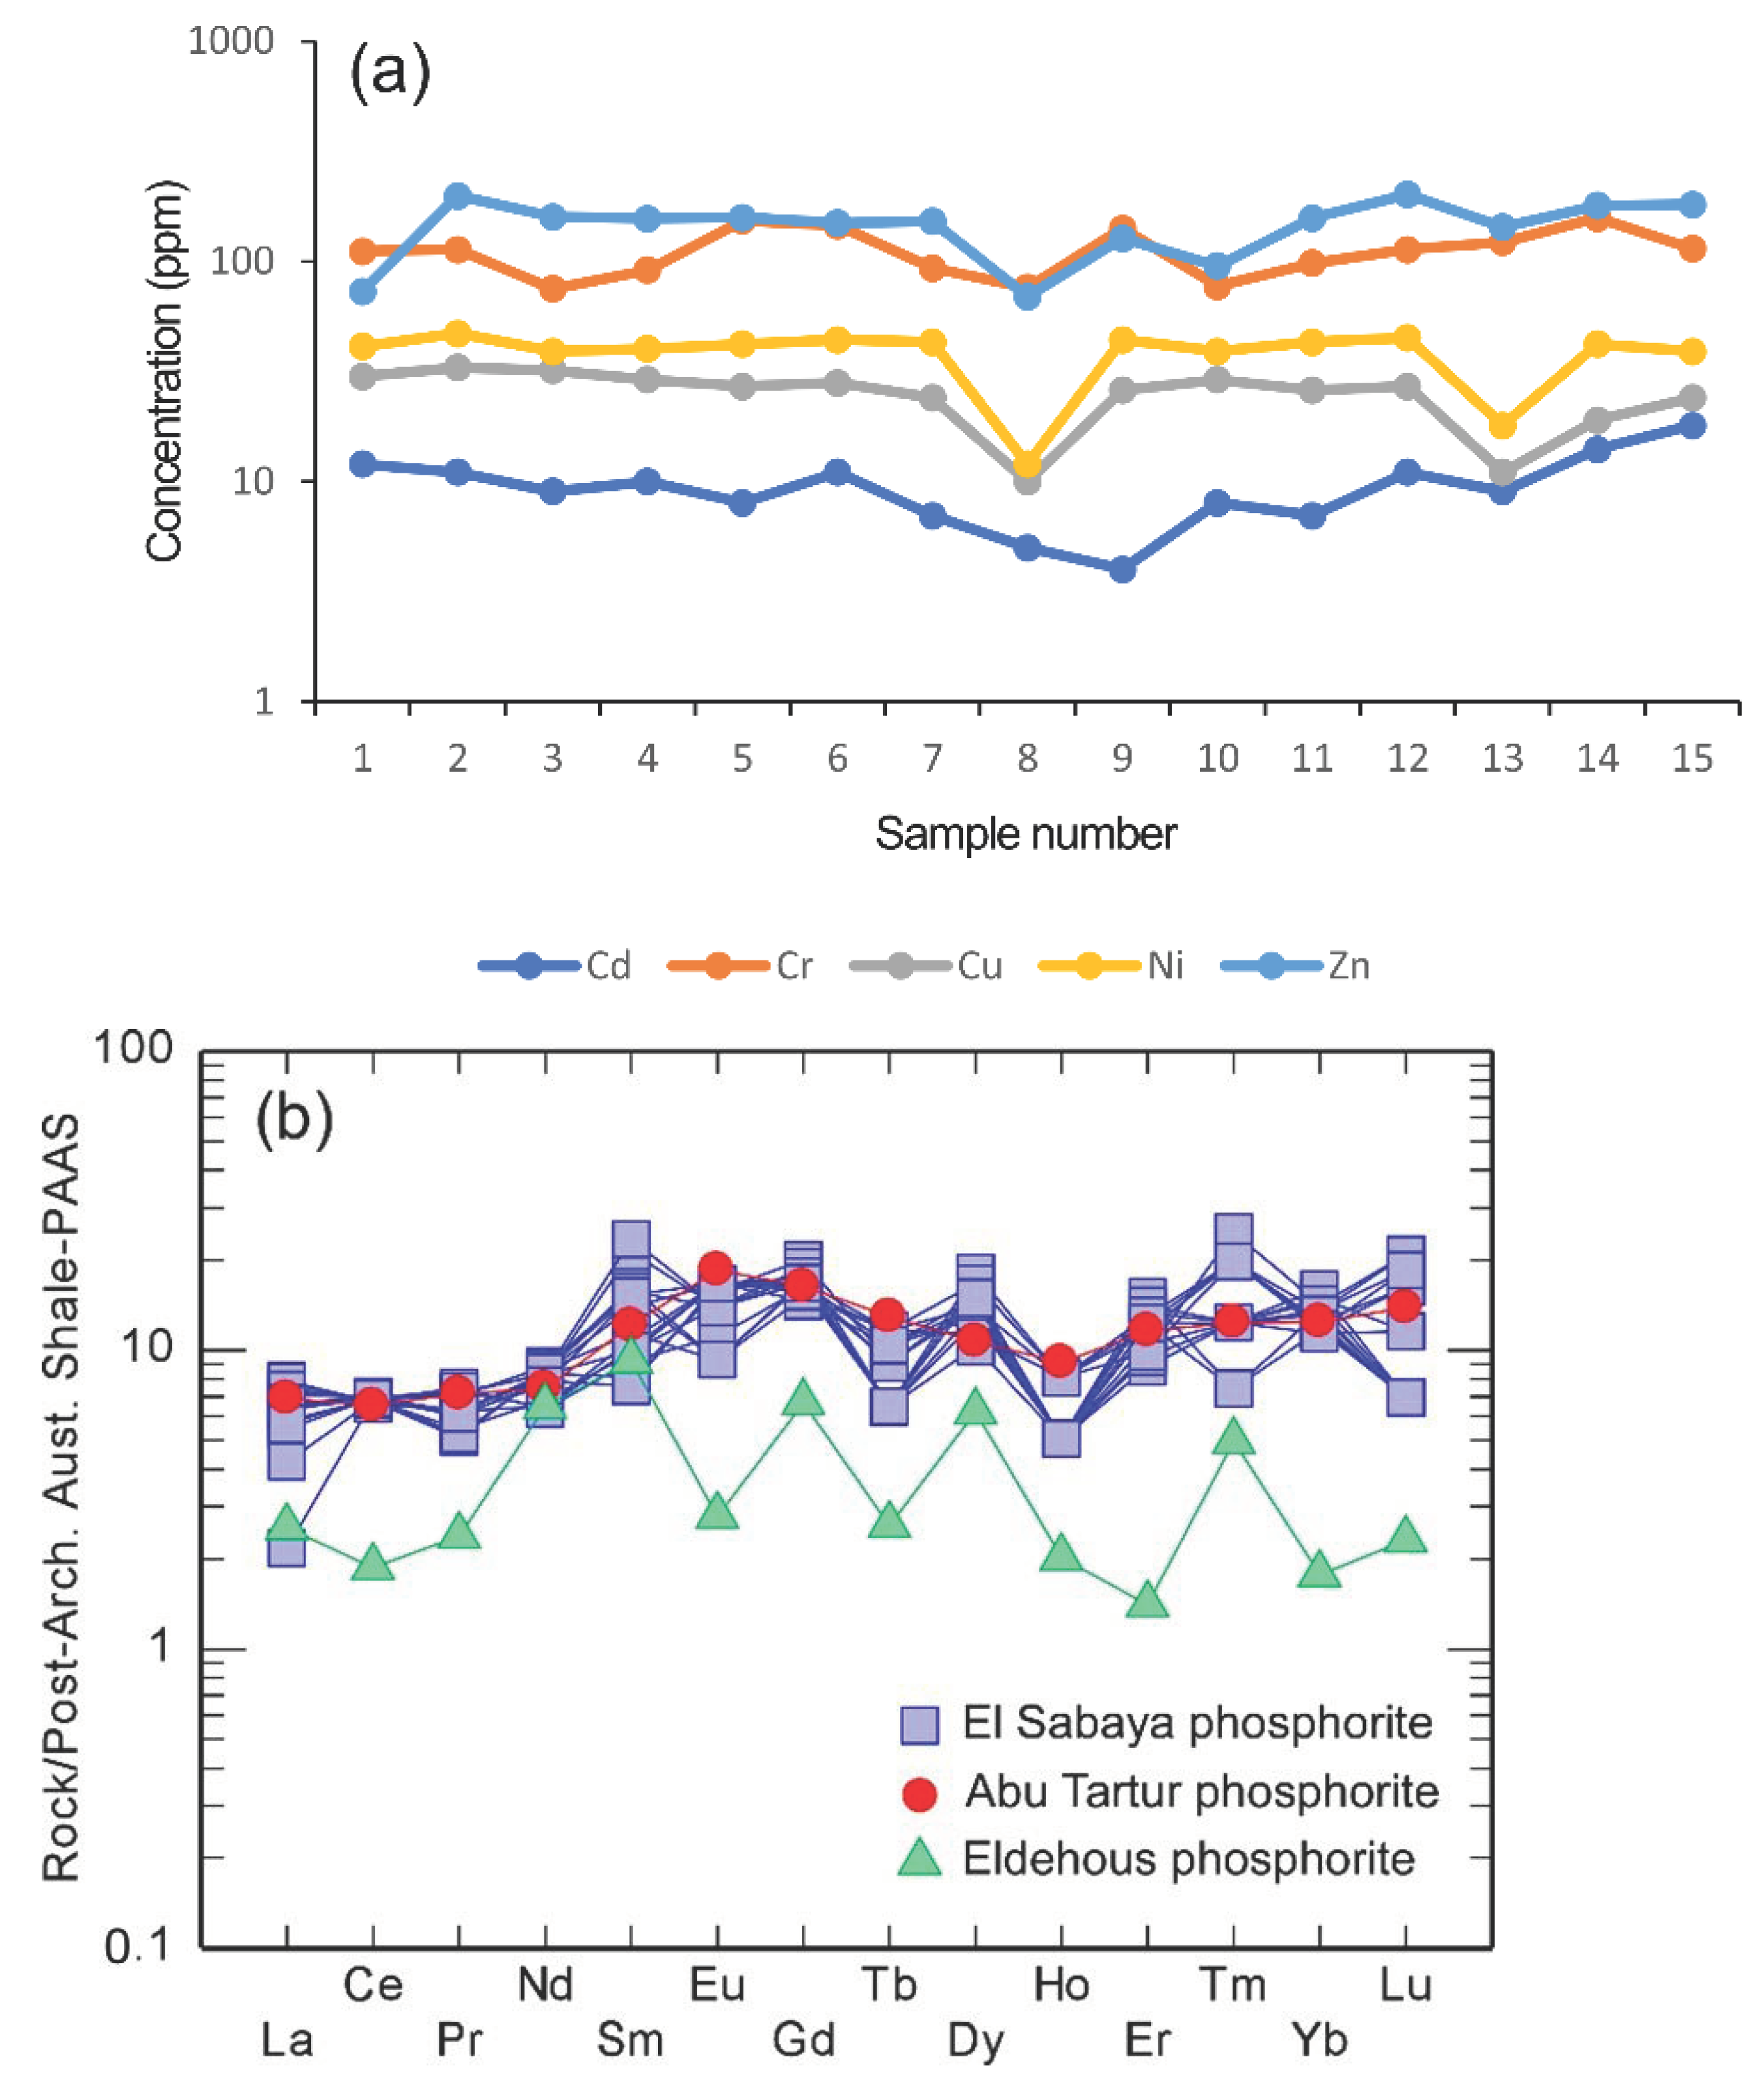
3.1.2. Trace Elements

The concentration of trace elements in Gebel Qulu El Sabaya phosphorite samples is shown in (Table 1, Figure 5a). Cd (ranges from 4 ppm to 18 ppm with an average of 10 ppm), Cr (from 75 ppm to 757 ppm, avg.= 112 ppm), Pb (2–12 ppm, avg.= 6 ppm), Cu (10–33 ppm; avg.= 25 ppm), and Ni (18–47 ppm, avg.= 39 ppm). They reveal a wide variation, particularly in Zn content, in the studied phosphorite samples, ranging from 69 ppm to 201 ppm with an average of 146 ppm. Zn content is attributed to the presence of the sulfate phase in phosphorites [23].

3.1.3. Rare Earth Elements (REEs)

The geochemistry and economic importance of REEs in the Western Desert phosphorite were first considered by El-Kammar [24], who reported REEs abnormality in Abu Tartur phosphorite. Then, Dardir and Kobtan [25] reported on the economic potentiality of REEs in Abu Tartur phosphorite (about 1718 gm/ton, on average). Amin and Zidan [17] stated that the average REEs content in Abu Tartur phosphorite is 2000 ppm. In addition, REEs contained in phosphorite may be extracted as a by-product during phosphoric acid production [13]. Gebel Qulu El Sabaya phosphorite samples exhibit total REEs content ranging from 1200 to 1538 ppm with an average of 1430 ppm (Table 1). Furthermore, the increase in REEs concentration from the west to east is most likely related to depositional and diagenetic factors. On the other hand, the average total REEs content recorded in the studied phosphorite is nearly like that of Abu Tartur phosphorite at 1407 ppm [25] and higher than that recorded in Eldehous phosphorite at 616 ppm [26].
Normalization of REEs to the Post Archean Australian Shale (PASS) values [27] is shown in Figure 5b. The normalized REE pattern shows that the Gebel Qulu El Sabaya phosphorite is characterized by a slight negative Eu anomaly (Figure 5b). El-Kammar and El-Kammar [28] stated that the Dakhla phosphorite could generally be described as Ce and Eu deficit. Additionally, the plots show that Gebel Qulu El Sabaya phosphorites have a very similar REEs pattern to Abu Tartur phosphorites (Figure 5b). This non-conventional distribution is not comparable to seawater and many other marine phosphorites, characterized by large negative Ce anomalies [29,30,31,32,33,34].
Accordingly, the authors believe that seawater is not the only ultimate source of REEs in the studied phosphorite. This behavior could be related to the influence of heavy detrital minerals like monazite admixed with the studied phosphorite. Similar behavior was previously described in East Sibaiya phosphorite [35] and Gabal Tarawan phosphorite of Kharga Oasis [26]. Hassan and El-Kammar [36] stated that the shallow nature of the depositional basin of Abu Tartur phosphorite maintained a higher influx of heavy detrital minerals than other Egyptian phosphorites. They added that this case seems to apply to most Western Desert phosphorites.

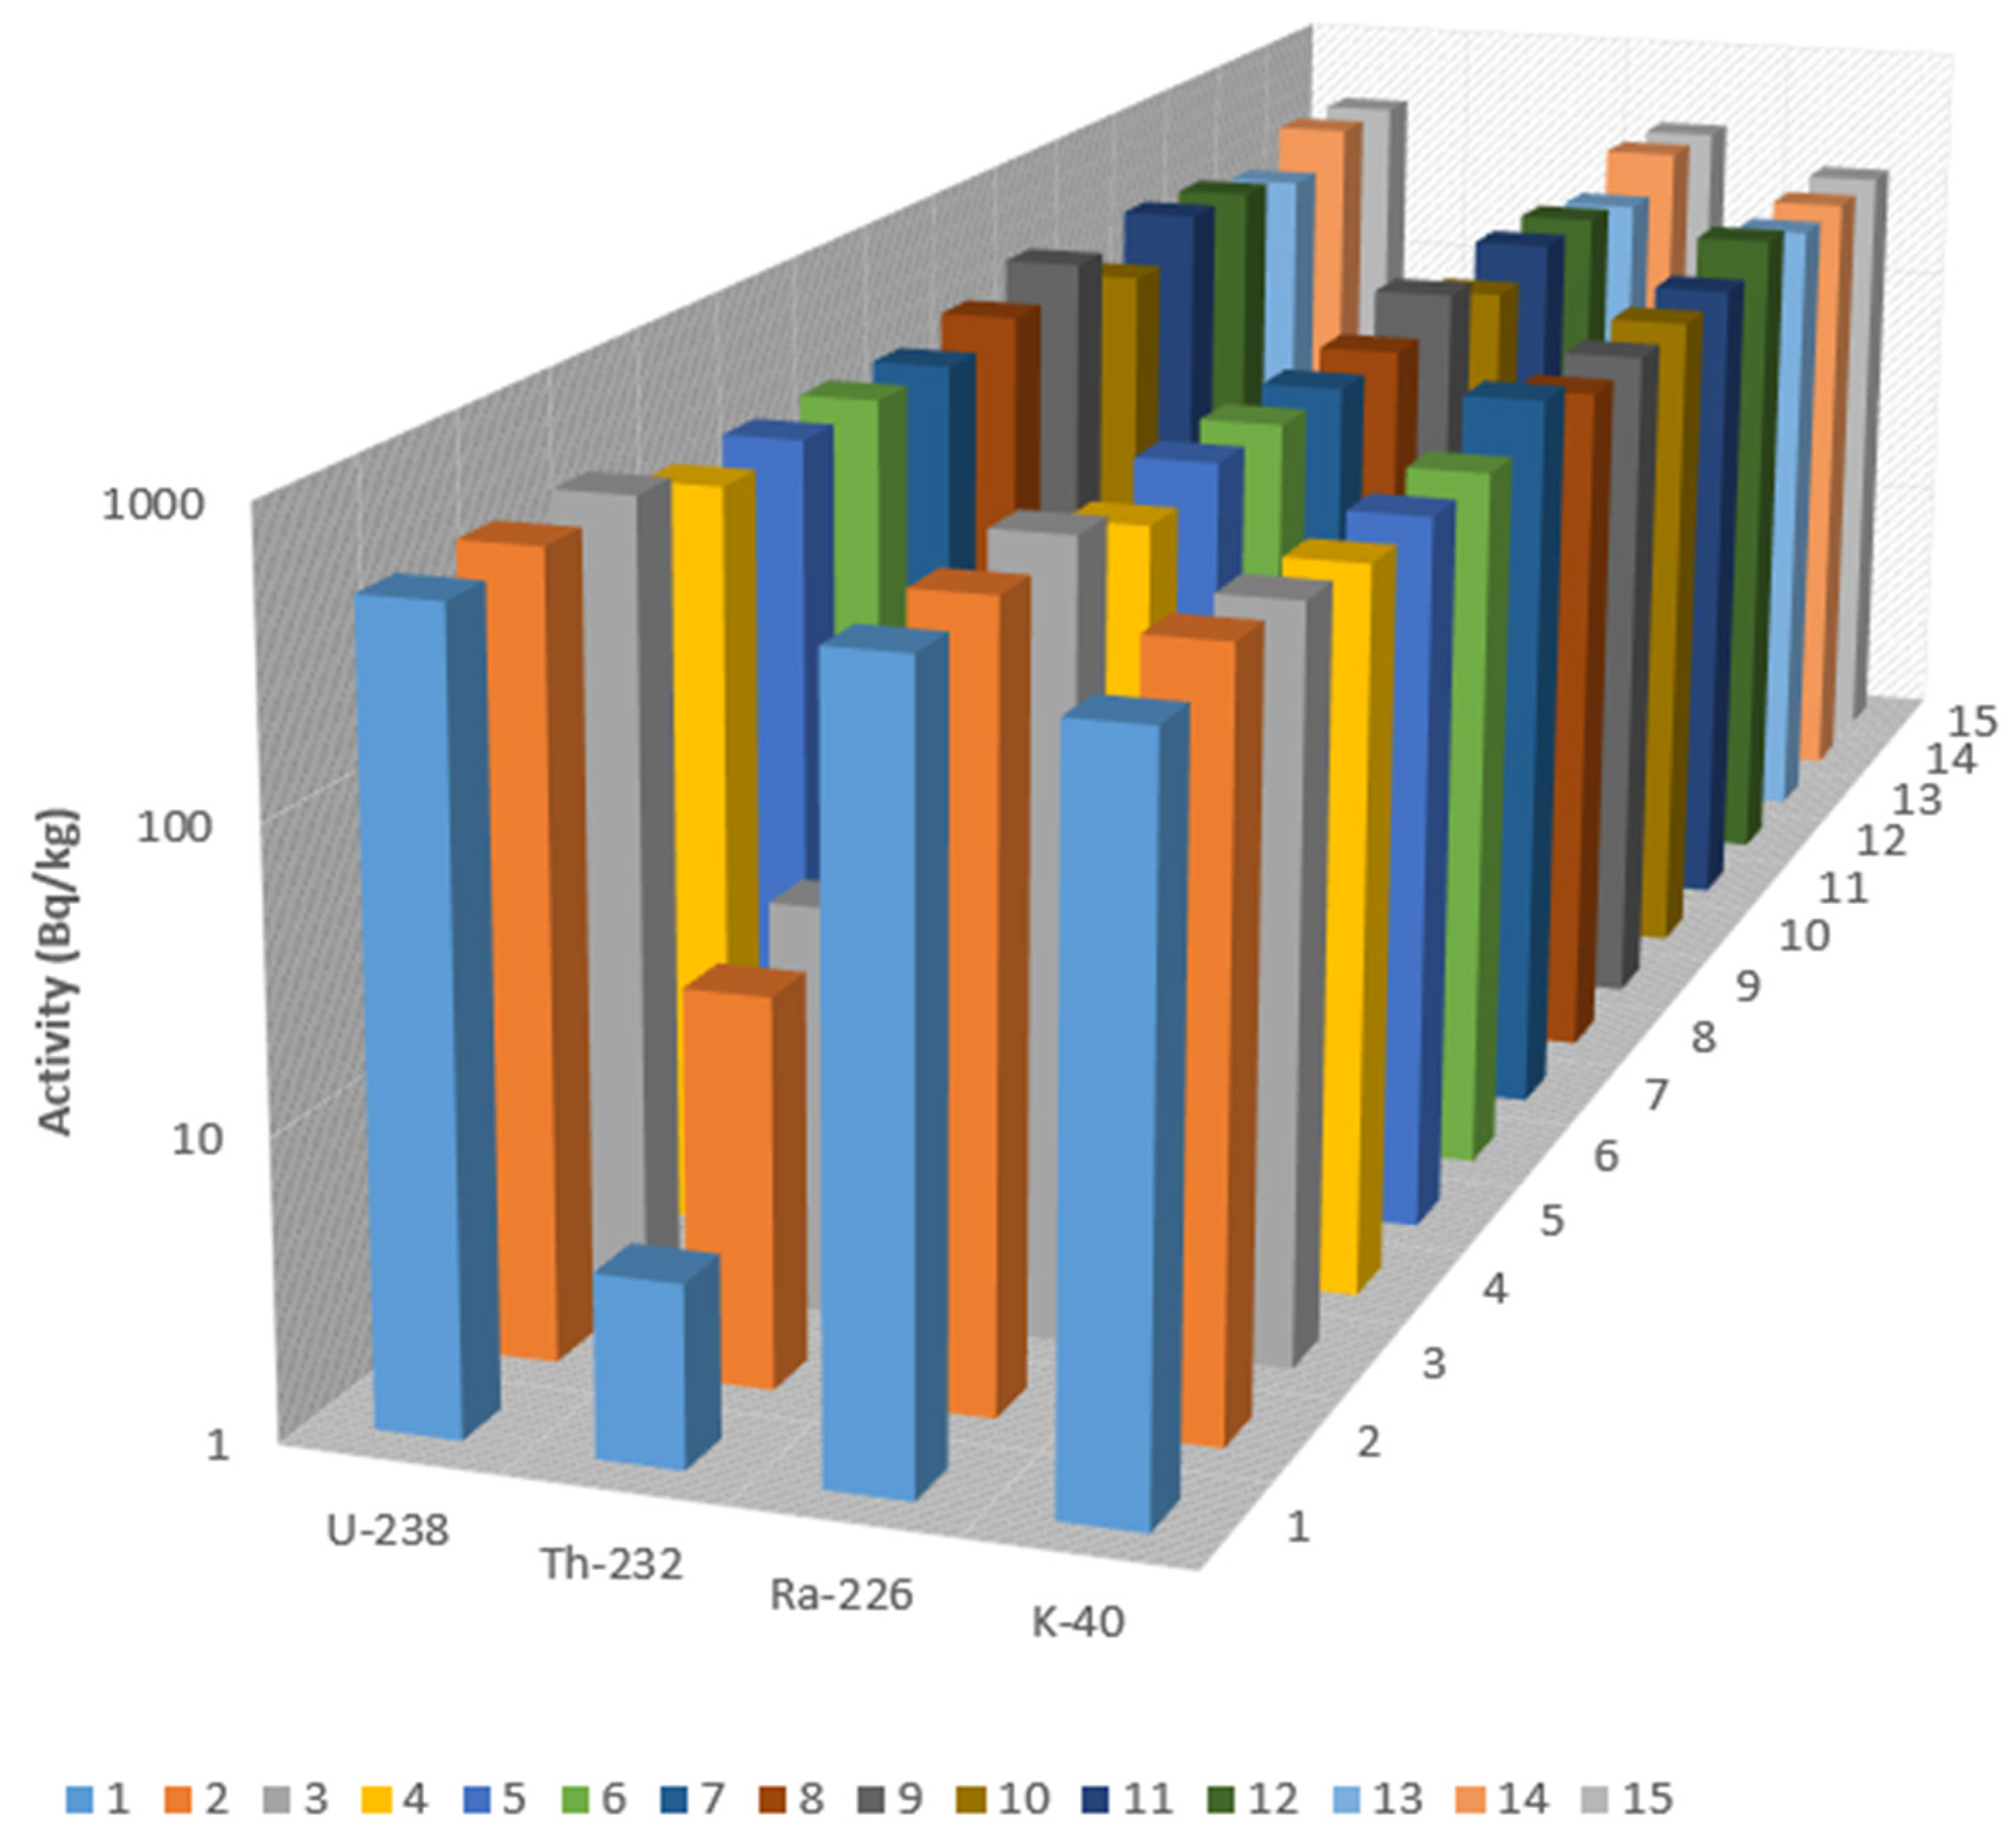
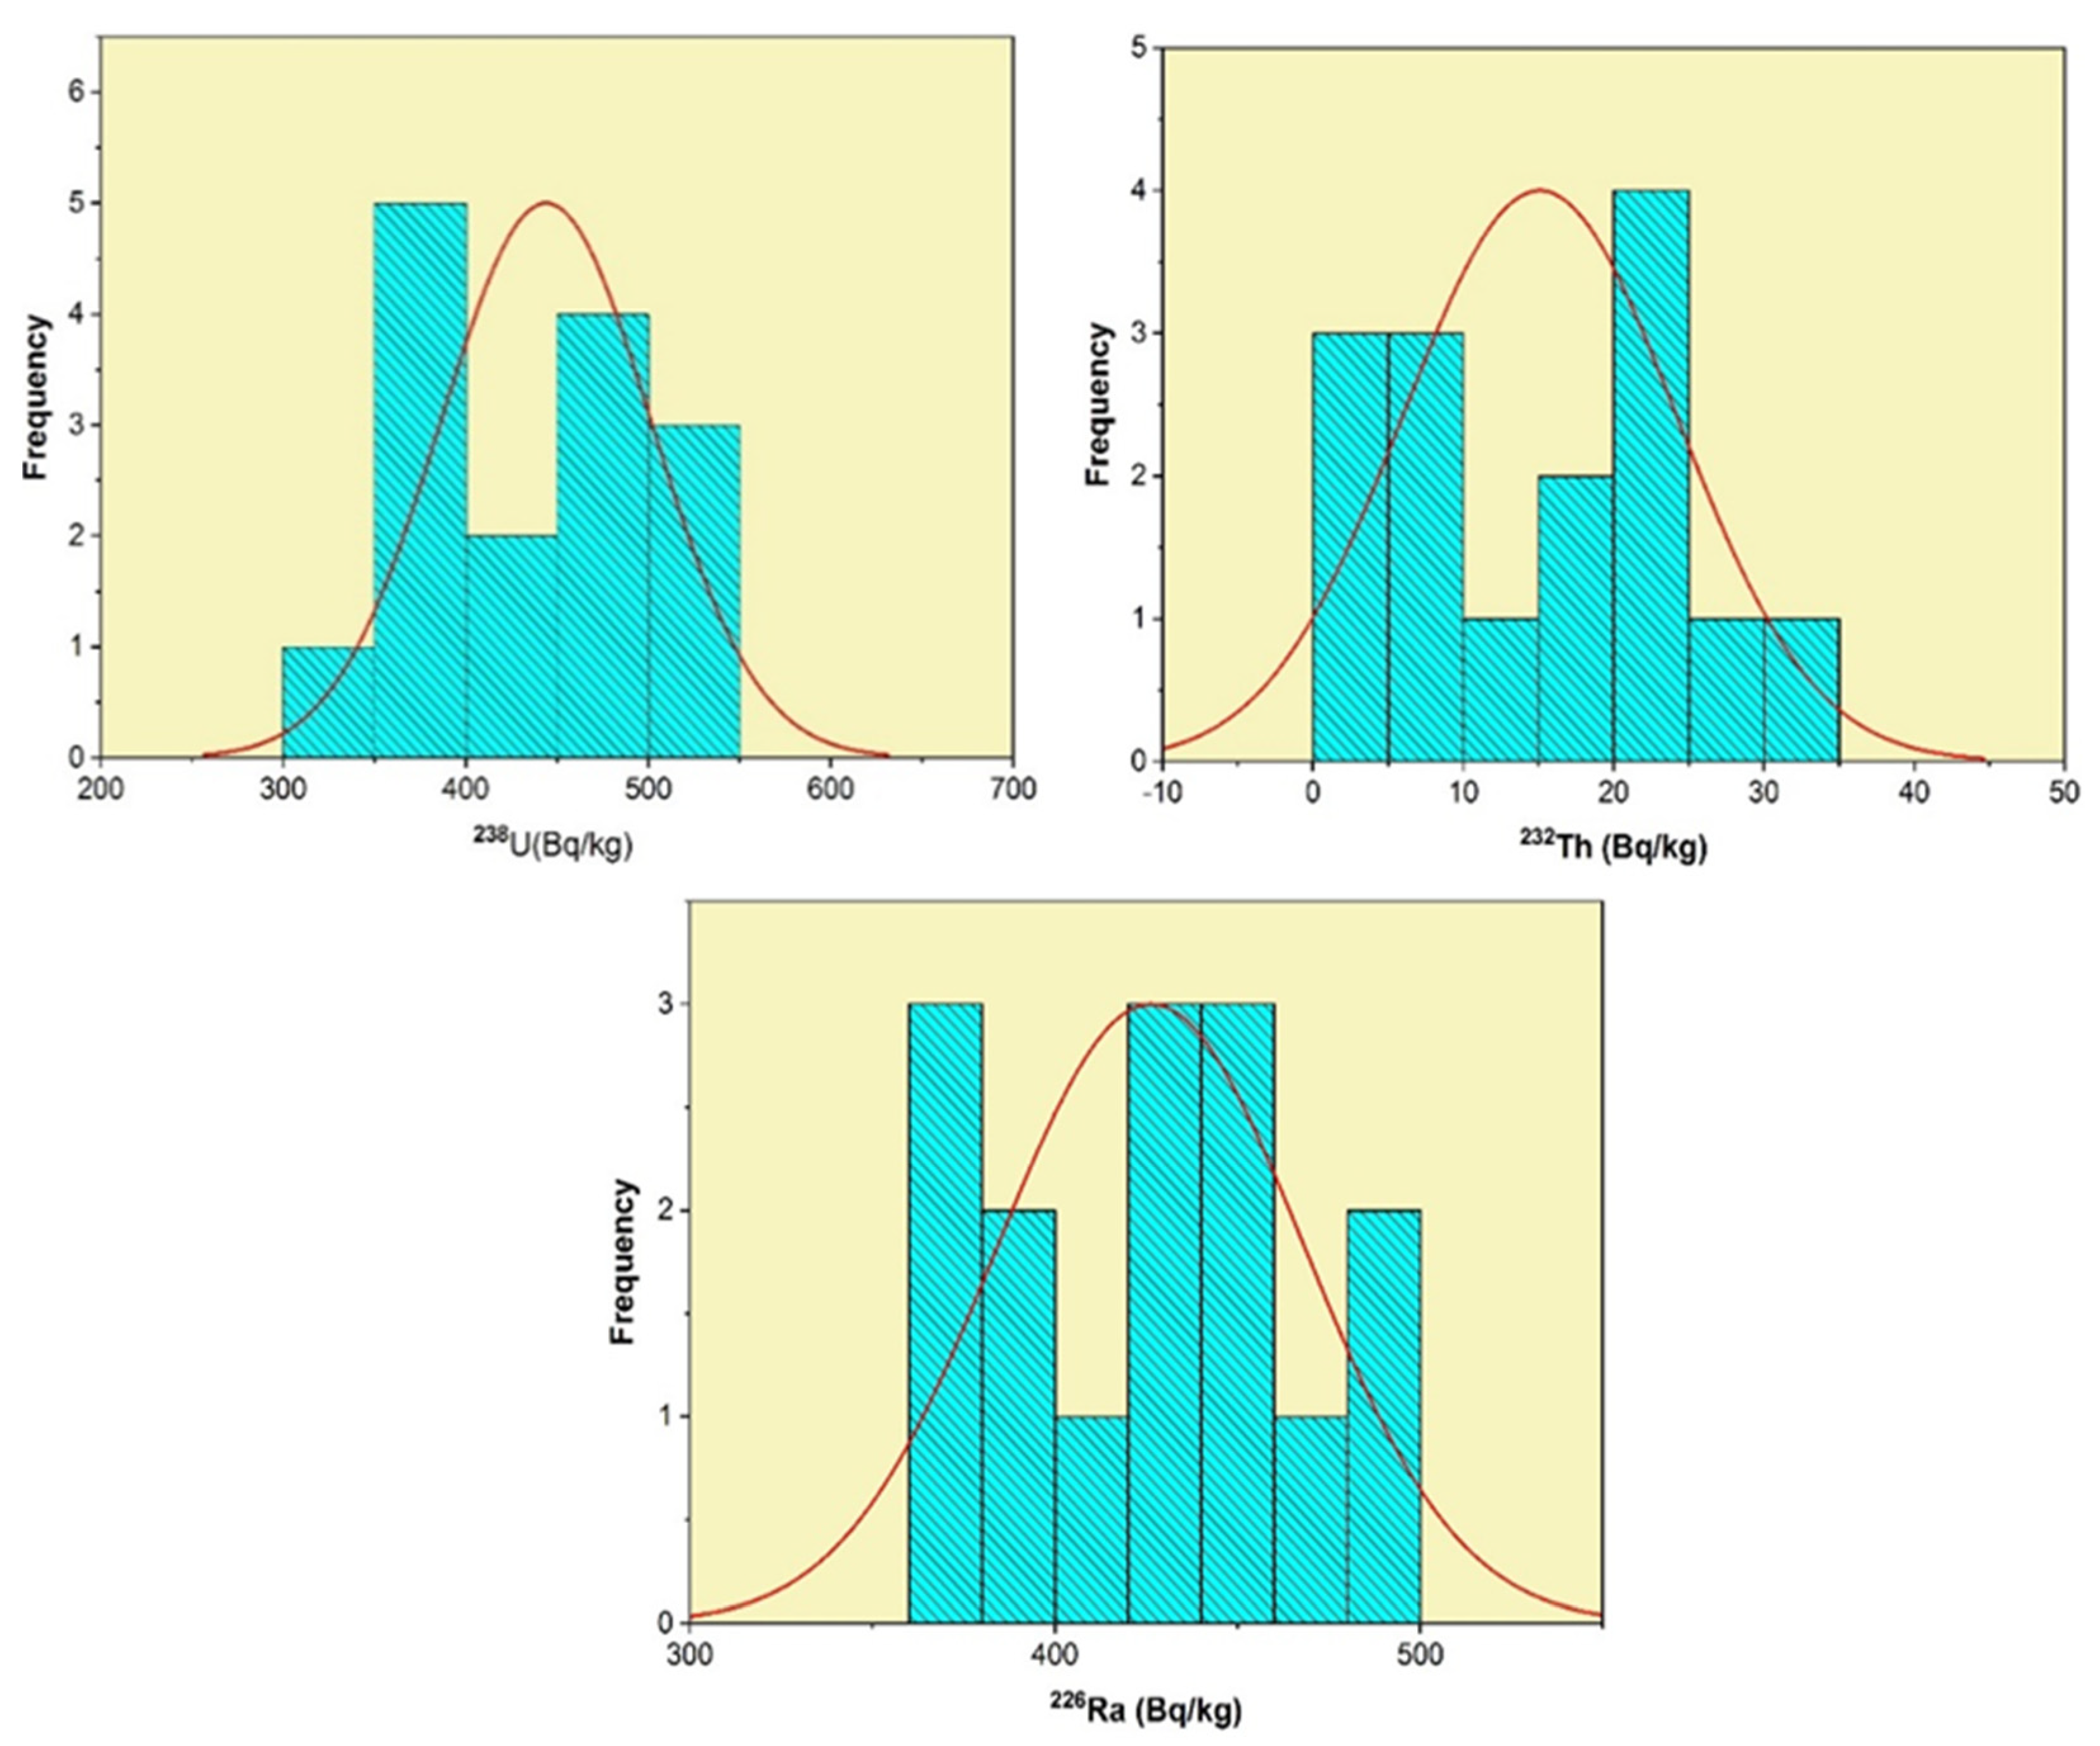
3.2. Radioactivity Concentrations

Radiometrically, it is found that the equivalent uranium content (eU) in Gebel Qulu El Sabaya phosphorite ranges from 28 ppm to 42 ppm with an average of 36 ppm, which is slightly higher than the chemical uranium (cU), which attains values ranging between 22 ppm and 36 ppm with an average of 30 ppm. However, the Ra content ranges from 33 to 44 ppm with an average of 38.4 ppm (Table 3). Uranium enrichment in phosphorite may be ascribed to apatite lattice and/or adsorbed on the cement [37]. The geochemical relations of U with some major and trace elements of Sinai phosphates mentioned that U is associated with carbonate-apatite and was derived from seawater (i.e., syngenetic origin) [38]. The average radiometric uranium content of the studied phosphorite at 35 ppm is higher than that of El Ziat phosphorite (27 ppm) [19] and Abu Tartur phosphorite (23 ppm) [13]. On the contrary, it is lower than those of Sibaiya phosphorites [13], Red Sea phosphorites [13], and Morocco phosphorites [20]. The eU/eTh ratio is widely used as a geochemical indicator for uranium migration and re-mobilization. This ratio ranges from 4–42, reflecting a high degree of uranium mobilization. In addition, P-factor (eU/Ra) [39] as well as D-factor (Uc/eU) [40] are used for uranium migration and re-mobilization. eU/Ra and Uc/eU ratios of the examined phosphorites are less than unity (avg. = 93 and 0.83, respectively), reflecting the removal of uranium. However, uranium mobilization can be calculated using the [41] equation (eUm = eU-eTh/3.5). The results are more than one (av. 9.81), suggesting U enrichment. 238U, 232Th, 226Ra, and 40K (Bq/kg) activity concentrations for the examined Qulu El Sabaya phosphorites are given in Figure 6. This figure reveals the measured activity concentrations (Bq/kg) of 15 samples that were measured radiometrically using the NaI technique. It is noticeable that the studied rocks show a wide variation in their 238U (av. 462.93 ± 55.76 Bq/kg), 232Th (av. 12.12 ± 3.3 Bq/kg), and 226Ra (av. 432.9 ± 47.96 Bq/kg) concentrations, which are higher than the recommended values of UNSCAR [42,43].

3.3. Radiological Risk Parameters

From 238U, 232Th, 226Ra, and 40K (Bq/kg) activity concentrations for the examined Qulu El Sabaya phosphorites, we computed the radiological hazards indices given in Table 4. This table reveals the computed radiological hazards, minimum, maximum, mean, and standard deviation of 15 samples that were measured radiometrically using the NaI technique. The distribution frequency histogram of rocks under investigation was determined by analyzing all related radionuclides (238U, 226Ra, and 232Th; Figure 7). The frequency distributions of activity concentration of all the radionuclides were analyzed, and the histograms are given in Figure 7. The 226Ra, 232Th, and 40K graphs show that these radionuclides demonstrate a normal (bell-shape) distribution. Without a degree of multi-modality. This multi-modal feature of the radioelements demonstrates the complexity of Gebel Qulu El Sabaya samples.
Radiological risk parameters were calculated for Qulu El Sabaya in order to infer the radiation effect on human organs during extraction or mining processes. These assessments include absorbed gamma dose, annual (outdoor and indoor) effective dose, radium equivalent activity, external and internal hazard indices, and excess cancer risk (Table 4).
Absorbed gamma-dose rate (Dair)
The absorbed gamma-dose rate was used to assess the gamma rays that were released >1 m from the Earth’s surface [42,43]. 238U, 232Th, and 40K activity concentrations are used to estimate the Dair as the following:
Dair (nGy/h) = 0.430 U + 0.666 Th + 0.042 K
where Th, U, and K are 232Th, 238U, and 40K activity concentrations, respectively.
Radium equivalent activity (Raeq)
Radium equivalent activity is ascribed to internal as well as external particles of alpha. 232Th, 226Ra, and 40K activity limits are used to manifest the Raeq index [44,45]:
Raeq (Bqkg−1) = Ra + 1.43 Th + 0.077 K
where Th, Ra, and K are 232Th, 226Ra, and 40K activity concentrations.
Annual effective dose (AED)
Absorbed dose (Dair) results, a conversion factor of 0.7 Sv/Gy, indoor and outdoor occupancy factors 0. 8 and 0.2, respectively, are used to estimate AED [46,47]:
AEDout (mSv/y) = Dair (nGy/h) × 8.76 (h) × 0.2 × 0.7 (Sv/Gy) × 10−3
AEDin (mSv/y) = Dair (nGy/h) × 8.76 (h) × 0.8 × 0.7 (Sv/Gy) × 10−3
External and internal radiation indices (Hex &Hin)
Hin and Hex can be measured to infer the radiation effect on human organs. They can be estimated using the following equations [45,48,49,50]:
Hin = U/185 + Th/259 + K/4810 ≤1
Hex = U/370 + Th/259 + K/4810 ≤1
Excess lifetime cancer index (ELCR)
ELCR can be calculated using outdoor annual effective dose, over a lifetime (DL = 70 years) and cancer index (RP = 0.05 Sv) as in this equation:
ELCR = AED × DL × RP
The obtained results of radiological risk parameters (activity concentrations ± standard deviation), including absorbed gamma dose (av. 245 ± 20), annual (outdoor (av. 0.3 ± 0.03) and radium equivalent activity (av. 520 ± 42), external (av. 1.49 ± 0.13) and internal (av. 2.74 ± 28) hazard indices, and excess cancer risk (av. 1.05 ± 0.09) are higher than the acceptable worldwide levels [48], reflecting that the exposure for these deposits for a long time may lead to risk on human organs.

4. Conclusions

The current work discusses stratigraphical, petrographical, radioactivity, and geochemical investigations of the lower phosphorite member of the Gebel Qulu El Sabaya area. It is classified into lower phosphorite (most economical), middle shale, and upper phosphorite members. The former has a total thickness ranging from 2 to 3.5 m and consists of apatite, quartz, hematite, anhydrite, and kaolinite. Geochemically, the lower phosphorite member has high REEs content (av. 1430 ppm), and their patterns reveal a slight negative Eu anomaly. Radiological parameters such as absorbed dose rates, outdoor annual effective dose, radium equivalent activity, external and internal hazard, and excess cancer risk values are higher than the recommended levels, reflecting that exposure to these deposits for a long time may lead to health risks on human organs. Therefore, caution must be taken during the mining of phosphorite or using it as fertilizer.

Author Contributions

Conceptualization, E.S.R.L.; Data curation, E.S.R.L., D.A.S., E.S.R.L., A.E., H.A.A. and H.M.H.Z.; Formal analysis, D.A.S., E.S.R.L., H.A.A. and H.M.H.Z.; Funding acquisition, A.E. and H.M.H.Z.; Investigation, D.F., R.M.E.A., E.S.R.L., H.A.A. and H.M.H.Z.; Methodology, R.M.E.A., E.S.R.L., A.E., H.A.A., B.M.A. and H.M.H.Z.; Project administration, A.E.; Resources, E.S.R.L., B.M.A. and H.M.H.Z.; Software, D.F., R.M.E.A., E.S.R.L., H.A.A. and H.M.H.Z.; Supervision, A.E.; Validation, E.S.R.L., H.A.A. and H.M.H.Z.; Visualization, H.M.H.Z., B.M.A.; Writing—original draft, E.S.R.L., D.A.S., D.F., A.E., H.A.A. and H.M.H.Z.; Writing—review and editing, D.A.S., R.M.E.A., E.S.R.L., A.E., H.A.A., D.F. and H.M.H.Z. All authors have read and agreed to the published version of the manuscript.

Funding

The authors would like to express their gratitude to Princess Nourah bint Abdulrahman University Researchers Supporting Project (grant no. PNURSP2022R32), Princess Nourah bint Abdulrahman University, Riyadh, Saudi Arabia.

Data Availability Statement

The data presented in this study are available on request from the corresponding authors.

Acknowledgments

The authors would like to express their gratitude to Princess Nourah bint Abdulrahman University Researchers Supporting Project (grant no. PNURSP2022R32), Princess Nourah bint Abdulrahman University, Riyadh, Saudi Arabia. The author A.E acknowledges the support of “Dunarea de Jos” University of Galati, Romania.

Conflicts of Interest

The authors declare no conflict of interest.

References

  1. Khaleal, F.M.; Saleh, G.M.; Lasheen, E.S.R.; Lentz, D.R. Occurrences and Genesis of Emerald and Other Beryls Mineralization in Egypt: A Review. Phys. Chem. Earth Parts A B C 2022, 128, 103266. [Google Scholar] [CrossRef]
  2. Saleh, G.M.; Kamar, M.S.; Lasheen, E.S.R.; Ibrahim, I.H.; Azer, M.K. Whole Rock and Mineral Chemistry of the Rare Metals-Bearing Mylonitic Rocks, Abu Rusheid Borehole, South Eastern Desert, Egypt. J. Afr. Earth Sci. 2022, 196, 104736. [Google Scholar] [CrossRef]
  3. Lasheen, E.S.R.; Saleh, G.M.; Khaleal, F.M.; Alwetaishi, M. Petrogenesis of Neoproterozoic Ultramafic Rocks, Wadi Ibib–Wadi Shani, South Eastern Desert, Egypt: Constraints from Whole Rock and Mineral Chemistry. Appl. Sci. 2021, 11, 10524. [Google Scholar] [CrossRef]
  4. Hamdy, M.M.; Lasheen, E.S.R.; Abdelwahab, W. Gold-Bearing Listwaenites in Ophiolitic Ultramafics from the Eastern Desert of Egypt: Subduction Zone-Related Alteration of Neoproterozoic Mantle? J. Afr. Earth Sci. 2022, 193, 104574. [Google Scholar] [CrossRef]
  5. Lasheen, E.S.R.; Mohamed, W.H.; Ene, A.; Awad, H.A.; Azer, M.K. Implementation of Petrographical and Aeromagnetic Data to Determine Depth and Structural Trend of Homrit Waggat Area, Central Eastern Desert, Egypt. Appl. Sci. 2022, 12, 8782. [Google Scholar] [CrossRef]
  6. Ali, S.; Ntaflos, T.; Sami, M. Geochemistry of Khor Um-Safi Ophiolitic Serpentinites, Central Eastern Desert, Egypt: Implications for Neoproterozoic Arc-Basin System in the Arabian-Nubian Shield. Geochemistry 2021, 81, 125690. [Google Scholar] [CrossRef]
  7. Abdel-Karim, A.-A.; Azer, M.; Sami, M. Petrogenesis and Tectonic Implications of the Maladob Ring Complex in the South Eastern Desert, Egypt: New Insights from Mineral Chemistry and Whole-Rock Geochemistry. Int. J. Earth Sci. 2021, 110, 53–80. [Google Scholar] [CrossRef]
  8. Hermina, M.H. Review on the Phosphate Deposits of Egypt. In Proceedings of the Second Arab Conference of Mineral Resources, Santiago, Chile, 13 April–21 May 1972. [Google Scholar]
  9. Issawi, B.; Hassan, M.Y.; Saad, E.N. Geology of Abu Tartur Plateau, Western Desert, Egypt. Ann. Geol. Surv. Egypt 1978, 8, 91–127. [Google Scholar]
  10. Issawi, B.; El Hinnawi, M.; Francis, M.; Mazhar, A. The Phanerozoic Geology of Egypt. A Geodynamic Approach. Special Publ. No. 76. Geol. Surv. Cairo Egypt 1999, 76, 462. [Google Scholar]
  11. Fathy, D.; Wagreich, M.; Ntaflos, T.; Sami, M. Provenance Characterization of Campanian Lacustrine Organic-Rich Mudstones on the Southern Tethyan Margin, Egypt. ACS Earth Space Chem. 2021, 5, 197–209. [Google Scholar] [CrossRef]
  12. Zidan, I.H. Geological and Mineralogical Studies of Abu Tartur Phosphates, Western Desert-Egypt; Al-Azhar University: Cairo, Egypt, 1998. [Google Scholar]
  13. Zidan, I.H. Geological, Mineralogical and Geochemical Studies of Abu Tartur Area. Western Desert, Egypt; Al Azhar University: Cairo, Egypt, 2002. [Google Scholar]
  14. Zidan, I.H. Evaluation of Phosphorite and Uranium in Lower Member, Duwi Formation at Kummer Area South Esna, West Nile Valley, Egypt. J. Sedimentol. Soc. Egypt 2013, 21, 143–154. [Google Scholar]
  15. Jarvis, I.; Burnett, W.; Nathan, Y. Phosphorite Geochemistry: State-of-the-Art and Environmental Concerns. Eclogae Geol. Helv. 1994, 87, 643–700. [Google Scholar]
  16. Slansky, M. Geology of Sedimentary Phosphates; Originally Published in French in 1980; Cambridge University Press: Cambridge, UK, 2009. [Google Scholar] [CrossRef]
  17. Amin, M.M.; Zidan, I.H. Rare Earth Elements Recovery and Preparation of Phosphoric Acid from Abu-Tartur Phosphate Rock Using Penicillium Simplicissimum. Chem. Technol. Indian J. 2014, 10, 57–61. [Google Scholar]
  18. Ilyin, A.V. Rare-Earth Geochemistry of “old” Phosphorites and Probability of Syngenetic Precipitation and Accumulation of Phosphate. Chem. Geol. 1998, 144, 243–256. [Google Scholar] [CrossRef]
  19. Hannigan, R.E.; Sholkovitz, E.R. The Development of Middle Rare Earth Element Enrichments in Freshwaters: Weathering of Phosphate Minerals. Chem. Geol. 2001, 175, 495–508. [Google Scholar] [CrossRef]
  20. Zakaly, H.M.; Uosif, M.A.; Madkour, H.; Tammam, M.; Issa, S.; Elsaman, R.; El-Taher, A. Assessment of Natural Radionuclides and Heavy Metal Concentrations in Marine Sediments in View of Tourism Activities in Hurghada City, Northern Red Sea, Egypt. J. Phys. Sci. 2019, 30, 21–47. [Google Scholar] [CrossRef]
  21. Zidan, I.H. Evaluation of Phosphorite and Uranium Resources of Duwi Formation at Helal Area, South Esna, East Nile Valley, Egypt. Sedimentol. Egypt 2017, 23, 63–80. [Google Scholar]
  22. Negm, S.H. Mineralogical and Geochemical Studies of the Duwi Formation Phosphatic Rock in El-Sibaiya. East Area. Nile Vally Egypt; Minufiya University: Al Minufiyah, Egypt, 2009. [Google Scholar]
  23. Altschuler, Z.A. The Geochemistry of Trace Elements in Marine Phosphorites, Part I. Characteristic Abundances and Enrichment. In Marine Phosphorites; The Society for Sedimentary Geology: Tulsa, OK, USA, 1980; pp. 19–30. [Google Scholar] [CrossRef]
  24. El-Kammar, A. Comparative Geochemical and Mineralogical Studies on Egyptian Phosphorites; Cairo University: Cairo, Egypt, 1974. [Google Scholar]
  25. Dardir, A.A.; Kobtan, S.M. Preliminary Evaluation of the Rare-Earth Elements in Sector Abu Tartur Phosphorites. Ann. Geol. Surv. Egypt 1980, 10, 909–921. [Google Scholar]
  26. El-Sankary, M.; Mahdy, A. The Heavy Minerals Associating Phosphorites of the Western Desert of Egypt: Possible Supplier of Trace Elements and provenance indicator. In Proceedings of the 7th International Conference on Geochemistry, Alexandria, Egypt, 6–7 September 2006; Volume II, pp. 15–30. [Google Scholar]
  27. Taylor, S.R.; McLennan, S.M. The Continental Crust: Its Composition and Evolution; U.S. Department of Energy: Germantown, MD, USA, 1985.
  28. El-Kammar, A.; El-Kammar, M. On the Trace Elements Composition of the Egyptian Phosphorites: A New Approach. In Proceedings of the 6th International Conference on the Geology of the Arab World, Giza, Egypt, 21–24 February 2002; Cairo University: Cairo, Egypt, 2002; pp. 227–244. [Google Scholar]
  29. Elderfield, H.; Greaves, M.J. The Rare Earth Elements in Seawater. Nature 1982, 296, 214–219. [Google Scholar] [CrossRef]
  30. Kolodny, Y. Phosphorite. In Encyclopedia of Paleoclimatology and Ancient Environments; Gornitz, V., Ed.; Encyclopedia of Earth Sciences Series; Springer: Dordrecht, The Netherlands, 2009. [Google Scholar] [CrossRef]
  31. McArthur, J.M.; Walsh, J.N. Rare-Earth Geochemistry of Phosphorites. Chem. Geol. 1984, 47, 191–220. [Google Scholar] [CrossRef]
  32. De Baar, H.J.W.; Bacon, M.P.; Brewer, P.G.; Bruland, K.W. Rare Earth Elements in the Pacific and Atlantic Oceans. Geochim. Cosmochim. Acta 1985, 49, 1943–1959. [Google Scholar] [CrossRef]
  33. Piper, D.; Baedecker, P.; Crock, J.; Geology, W.B.-M. Undefined Rare Earth Elements in the Phosphatic-Enriched Sediment of the Peru Shelf; Elsevier: Amsterdam, The Netherlands, 1988. [Google Scholar]
  34. Bonnot-Courtois, C.; Flicoteaux, R. Distribution of Rare-Earth and Some Trace Elements in Tertiary Phosphorites from the Senegal Basin and Their Weathering Products. Chem. Geol. 1989, 75, 311–328. [Google Scholar] [CrossRef]
  35. El Gemmizi, M.A.; Ali, M.M. Contribution of heavy minerals to the trace elements from East Sebaiya phosphorites, Egypt. Proc. 2nd Int. Conf. Geol. Arab World, Cairo Univ. 1999; 145–153. [Google Scholar]
  36. Hassan, F.; El-Kammar, A. Environmental Conditions Affecting the Distribution of Uranium and Rare Earth Elements in Egyptian Phosphorites. Egypt. J. Pet. 1975, 19, 169–178. [Google Scholar]
  37. Lucas, J.; Flicoteaux, R.; Nathan, Y.; Prevot, L.; Shahar, Y. Different Aspects of Phosphorite Weathering. In Marine Phosphorites; The Society for Sedimentary Geology: Tulsa, OK, USA, 1980; pp. 41–51. [Google Scholar] [CrossRef]
  38. Guirgues, N.R. Geological and Geochemical Studies on Some Phosphate Exposures, East-Central Sinai, Egypt; Mansoura University: Mansoura, Egypt, 2005. [Google Scholar]
  39. Hussein, A.H. Lecture Course in Nuclear Geology; NMA Egypt; Ain Shams University: Cairo, Egypt, 1978; 101p. [Google Scholar]
  40. Hansink, J.D. Equilibrium Analysis of a Sandstone Roll-Front Uranium Deposit. 1976. Available online: https://inis.iaea.org (accessed on 20 August 2022).
  41. Wignall, P.B.; Myers, K.J. Interpreting Benthic Oxygen Levels in Mudrocks: A New Approach. Geology 1988, 16, 452–455. [Google Scholar] [CrossRef]
  42. UNSCEAR. Sources and Effects of Ionizing Radiation; UNSCEAR 2000 Report to the General Assembly, with Scientific Annexes; United Nations Scientific Committee on the Effects of Atomic Radiation: Vienna, Austria, 2000; ISBN 92-1-142238-8. [Google Scholar]
  43. UNSCEAR. Sources and Effects of Ionizing Radiation; United Nations Scientific Committee on the Effects of Atomic Radiation: Vienna, Austria, 2008; Volume 1, ISBN 9789211422740. [Google Scholar]
  44. Ravisankar, R.; Chandramohan, J.; Chandrasekaran, A.; Prince Prakash Jebakumar, J.; Vijayalakshmi, I.; Vijayagopal, P.; Venkatraman, B. Assessments of Radioactivity Concentration of Natural Radionuclides and Radiological Hazard Indices in Sediment Samples from the East Coast of Tamilnadu, India with Statistical Approach. Mar. Pollut. Bull. 2015, 97, 419–430. [Google Scholar] [CrossRef]
  45. Kamar, M.S.; Salem, I.A.; El-Aassy, I.E.; El-Sayed, A.A.; Zakaly, H.M.H.; Alzahrani, A.M.; Saeed, E.; Lasheen, R. An Extended Investigation of High-Level Natural Radioactivity and Geochemistry of Neoproterozoic Dokhan Volcanics: A Case Study of Wadi Gebeiy, Southwestern Sinai, Egypt. Sustainability 2022, 14, 9291. [Google Scholar] [CrossRef]
  46. Abbasi, A. Calculation of Gamma Radiation Dose Rate and Radon Concentration Due to Granites Used as Building Materials in Iran. Radiat. Prot. Dosim. 2013, 155, 335–342. [Google Scholar] [CrossRef]
  47. Zakaly, H.M.H.; Uosif, M.A.M.; Issa, S.A.M.; Tekin, H.O.; Madkour, H.; Tammam, M.; El-Taher, A.; Alharshan, G.A.; Mostafa, M.Y.A. An Extended Assessment of Natural Radioactivity in the Sediments of the Mid-Region of the Egyptian Red Sea Coast. Mar. Pollut. Bull. 2021, 171, 112658. [Google Scholar] [CrossRef]
  48. UNSCEAR. 2008 Sources and Effects of Ionising Radiation; Report to the General Assembly with Scientific Annexes; UNSCEAR: New York, NY, USA, 2010. [Google Scholar]
  49. Lasheen, E.S.R.; Azer, M.K.; Ene, A.; Abdelwahab, W.; Zakaly, H.M.H.; Awad, H.A.; Kawady, N.A. Radiological Hazards and Natural Radionuclide Distribution in Granitic Rocks of Homrit Waggat Area, Central Eastern Desert, Egypt. Materials 2022, 15, 4069. [Google Scholar] [CrossRef]
  50. Alharshan, G.A.; Kamar, M.S.; Lasheen, E.S.R.; Ene, A.; Uosif, M.A.M.; Awad, H.A.; Issa, S.A.M.; Zakaly, H.M.H. Distribution of Radionuclides and Radiological Health Assessment in Seih-Sidri Area, Southwestern Sinai. Int. J. Environ. Res. Public. Health 2022, 19, 10717. [Google Scholar] [CrossRef] [PubMed]
Figure 1. Location map of the studied Gebel Qulu El Sabaya, East Dakhla Oasis.
Minerals 12 01385 g001
Figure 2. The general lithostratigraphic section of exposed rock units at Gebel Qulu El Sabaya, the southern scarp in the central part of the Abu Tartur Plateau.
Minerals 12 01385 g002
Figure 3. Photomicrographs showing (a) Apatite (Ap) grains with bone fragments embedded in calcite (Cal) and silica (Qtz) matrix; (b) Apatite grains elongated to surrounded with bone fragments and shark teeth, glauconite (Gaul), and dolomite (Dol) embedded in carbonate cement; (c) Dahlite (Dah) and dolomite grains with bone fragments embedded in carbonate cement; and (d) Elongated apatite (Ap) grains with bone fragments embedded in carbonate cement.
Minerals 12 01385 g003
Figure 4. (a,b) Distribution curves of the major oxides (wt.%) in phosphorite samples.
Minerals 12 01385 g004
Figure 5. (a) Trace elements distribution curves of the examined phosphorite samples; and (b) REEs-normalized to Post Archean Australian Shale (PASS) [27] of the examined phosphorite and compared with the average REEs of Abu Tartur phosphorite [25] and Eldehous phosphorite [26].
Minerals 12 01385 g005
Figure 6. The samples represent the radiometric measurements of 238U, 226Ra, 232Th, and 40K (Bq/Kg).
Minerals 12 01385 g006
Figure 7. Frequency distribution histograms of 238U, 232Th, and 226Ra activity concentrations, respectively.
Minerals 12 01385 g007
Table 1. Whole rock {major (wt.%), trace (ppm), and REEs (ppm)} analysis of Gebel Qulu El Sabaya phosphorite samples.
S.NO.123456789101112131415
CaO373839413836403738393837383941
P2O5222426272423272326252524252528
SiO2986589697677776
Fe2O3544455454435353
MgO653355353434343
F212312111221212
Al2O3222222221222222
Na2O112111111211211
K2O000000000000000
L.O.I.1091112117159107916121411
Cd1211910811754871191418
Cr111113759115314593761417798113122157114
Cu303332292728241026292627111924
Ni414739404244431244394345184239
Zn731981591561581491526912795157201143179181
Pb261095732611363912
U332935353026222736242729323028
Y615611265236228217211255100218268.548603611605
La24020828530127627124716183298280221254250216
Ce554549543533543555535540540526542546552550549
Pr455563556264456648556453544654
Nd288273283220298218290215230283280268283285258
Sm85118906087566351544555421307784
Eu181510181518101218171518151810
Gd757870817876797568938878827378
Tb759585958757598
Dy655865786085534865656368737870
Ho555858858555585
Er332535283035333833432728403735
Tm5538588583510585
Yb414238354538333834333540373332
Lu353738393739385
TREEs146414411502143715151445141612681200148014671393153814801409
Table 2. Comparison of the examined major oxides (wt.%) of Qulu El Sabaya phosphorites with some Egyptian phosphorites.
AreasCaOP2O5SiO2Fe2O3MgOAl2O3Na2OK2O
Gebel Qulu El Sabaya (present study)38.3524.927.194.183.991.841.330.22
El Ziat phosphorite [19]38.7224.757.33.383.41.70.920.2
Eldehous phosphorites [10]35.322.710.64.86.91.91.80.2
Abu Tartur [13]402553320.60.14
Sibaiya Phosphorite [13]3625182.232.41.790.880.22
Table 3. Radiometric measurements (ppm) of the examined phosphorites compared with other phosphorites.
S.NO.eUeTheRaeU/eTheU/eRacU/eUcU
139140391133
24054181129
34164471135
43143381135
53253861130
63283741126
731236161122
83573651127
942144421136
1028233141124
1138139381127
123653871129
133143381132
1441343141130
1540241201128
Min.2813341122
Max.42844421136
Average36438161130
El Ziat phosphorite [19]27-25----
Eldehous phosphorites [10]35-35----
Abu Tartur phosphorites [13]23-19----
Sibaiya phosphorites [13]85-89----
Red Sea phosphorites [13])68-69----
Table 4. Variable radiological parameters of Gebel Qulu El Sabaya phosphorites.
UmAbsorbedHinHexAEDoutRaeq
(Bq/kg)
ELCR
S.NonGy/h(mSv)
110.86223.782.691.390.27473.880.96
210242.512.841.500.30512.911.04
310249.222.911.540.31549.571.07
47.71189.202.211.170.23413.510.81
57.71197.222.291.220.24474.790.85
66.86205.302.331.260.25481.020.88
78.29187.762.191.150.23442.490.81
88218.602.521.350.27464.140.94
911.71239.782.901.490.29518.281.03
107.43167.821.971.030.21401.960.72
1110.57218.452.631.350.27462.780.94
128.86221.312.571.360.27479.850.95
137.71189.202.211.170.23413.510.81
1410.86239.832.861.490.29518.731.03
1510.86231.812.781.440.28490.761.00
Min7.71189.202.211.170.23413.510.81
Max10.86239.832.861.490.29518.731.03
Av.9.81220.282.611.360.27474.330.95
Sd1.4822.220.290.140.0344.500.10
Note, Um = Uranium mobilization.
Publisher’s Note: MDPI stays neutral with regard to jurisdictional claims in published maps and institutional affiliations.

