Article

Flotation Performance and Gas Dispersion Properties in a Laboratory Flotation Cell

by
Francisco Femenias
1,
Miguel Maldonado
1,*,
Nicolas Miranda
1 and
Leopoldo Gutierrez
2
1
Department of Metallurgical Engineering, University of Santiago, Santiago 9160000, Chile
2
Department of Metallurgical Engineering, University of Concepcion, Concepcion 4070386, Chile
*
Author to whom correspondence should be addressed.
Minerals 2022, 12(11), 1351; https://doi.org/10.3390/min12111351
Submission received: 29 August 2022 / Revised: 10 October 2022 / Accepted: 10 October 2022 / Published: 25 October 2022
(This article belongs to the Special Issue Hydrodynamics and Gas Dispersion in Flotation)

Abstract

:
Flotation is a complex process that exhibits high dimensionality which makes modeling and optimization very challenging. One technique to alleviate the dimensionality problem is to combine variables together into more informative ones. Bubble surface area flux and air recovery are examples of dimensionality reduction. Gas holdup also captures the effect of a plurality of variables including gas rate, bubble size, surfactant type, and concentration. This work makes use of a dual flotation–conductivity cell to explore the relationship between gas dispersion properties, including frother concentration and flotation performance. Results demonstrate that gas holdup effectively captured the effect of gas rate and frother concentration and better correlates to flotation performance.

1. Introduction

Flotation is a complex process whose performance is a result of the interaction of several subsystems, involving particle, chemical, operational, and machine factors [1]. It exhibits high dimensionality, which makes modeling and optimization very challenging [2,3]. One way to reduce dimensionality is to search for the minimum set of variables or a combination of variables that predicts flotation performance. For example, air recovery, a variable related to froth stability, can be expressed as a combination of froth velocity, gas rate, and the froth height over the cell lip [4,5]. This variable is central in the Peak Air Recovery (PAR) strategy for flotation bank optimization [5].
Collection zone performance depends on the hydrodynamic conditions created. Gas dispersion properties have been considered the key hydrodynamic characteristic in flotation [6]. Gas dispersion properties include bubble size, superficial gas velocity, and gas holdup. Bubble surface area flux, a combination of gas velocity and bubble size is another example of dimensionality reduction. Gas holdup also captures the effect of several variables including gas rate, bubble size, and surfactant type and concentration [7,8,9,10]. A linear relationship has been established between bubble surface area flux and gas holdup in flotation columns [6,11,12,13].
The impact of gas dispersion properties on flotation performance has been studied. Massinaei et al. [11] carried out gas dispersion measurements in an industrial and pilot flotation column of the rougher circuit at Midbuk copper concentrator in Iran. It was found that the kinetics rate coefficient correlates linearly with gas holdup and bubble surface area flux. Lopez-Saucedo et al. [13] also found that gas holdup and bubble surface area flux correlated to Zn recovery and enrichment ratio in industrial columns in Los Peñoles group in Mexico. Interestingly, gas holdup outperforms bubble surface area flux in predicting metallurgical performance. Working in a pilot flotation column, Vazirizadeh et al. [14] found that the recovery of coarse particles was a function of gas holdup. Gas holdup has the advantage over the bubble surface area flux that it is easier to measure on a continuous basis in industrial flotation machines [15,16,17,18].
Although similar correlations between gas dispersion properties found in columns have also been observed in industrial mechanical cells [19,20] the key role that gas holdup plays to predict flotation performance in columns has not directly extended to mechanical cells [21]. Bubble surface area flux has stood out as the key one [22,23]. Difficulties in accurately measuring gas holdup in laboratory flotation cells have limited further investigations in a more controlled environment. In addition, computational fluid dynamics (CFD) applied to flotation machines usually disregard variations in internal gas dispersion variables [24].
Recently a dual flotation–conductivity cell has been developed to continuously measure gas holdup in a laboratory mechanical cell based on the measurements of the electrical conductivity of dispersions [25,26].
This work makes use of a dual flotation–conductivity cell to assess the interaction between gas dispersion properties and flotation performance. Emphasis is placed on establishing the correlation between recovery and gas holdup on a fully controlled mechanical flotation cell. In addition, the impact of frother concentration usually omitted in previous studies is here explicitly included. The paper is organized as follows: Section 2 describes gas holdup measurement in a laboratory mechanical cell and experimental testing conditions for two and three-phase systems; Section 3.1 shows experimental results of the interaction of gas dispersion properties when the cell operates continuously in a solution of water and MIBC; Section 3.2 focuses on the impact of gas dispersion variables on flotation performance. Finally, Section 4 presents the main conclusions.

2. Experimental Work

2.1. Gas Holdup Measurement

In this study, the method described in Maldonado et al., [25] to measure gas holdup in a laboratory flotation cell was implemented. The method comprises a laboratory Denver-type flotation cell whose vessel is equipped with an inner and outer electrode to measure the electrical conductivity of aerated suspensions. The inner electrode consists of a stainless-steel tube installed around the impeller shaft, whereas the outer electrode consists of the wall of the circular cross-section metallic flotation vessel itself as shown in Figure 1a,b. These electrodes are wired to a conductivity meter, Metler Toledo model M300 (See Figure 1c). The upper part of the vessel comprises an acrylic section that facilitates the observation of the pulp level and at the same time confines the electric field to the pulp zone.

2.2. Experimental

This study focused on the characterization of the gas dispersion properties in dual flotation–conductivity cell operating on a water–air continuous system and consequently, on their impact on the metallurgical performance achieved in batch flotation tests. The implemented setup and experimental conditions are described here below:

2.2.1. Gas Dispersion Testing

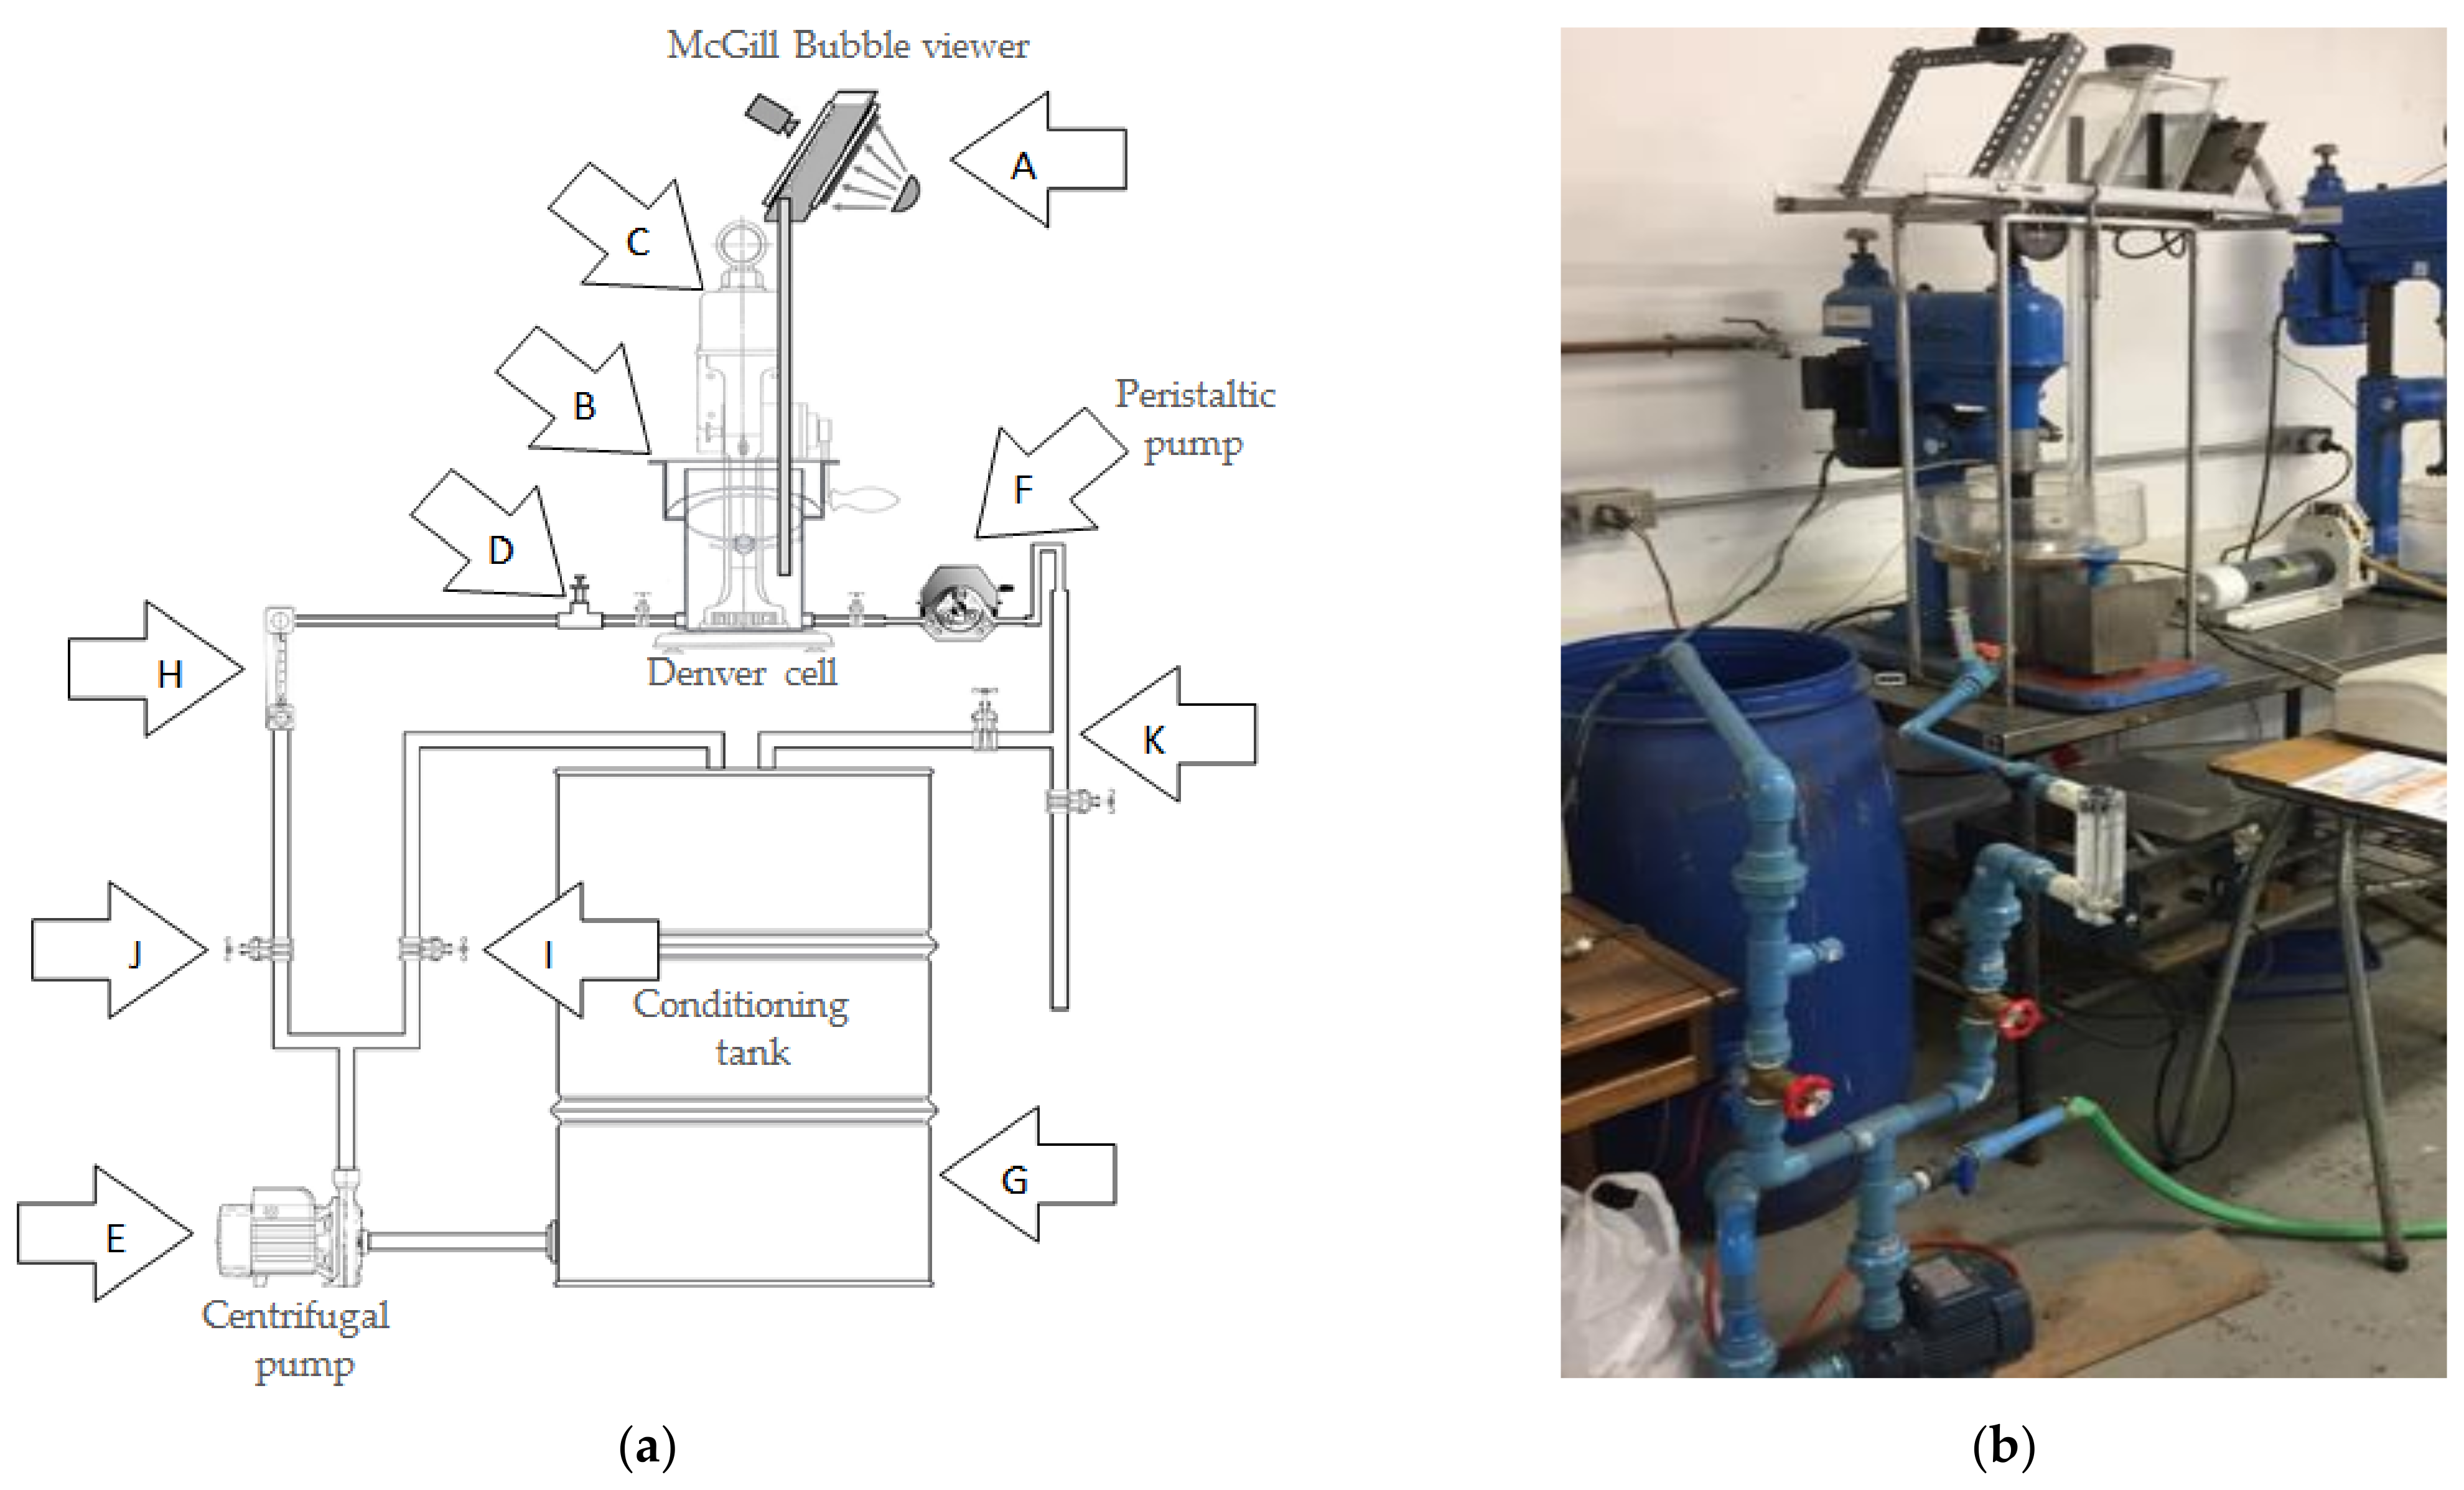
The setup implemented for measuring gas dispersion properties is depicted in Figure 2. It comprises a dual flotation–conductivity cell (B) that was continuously fed with a solution of water and frother pumped by a centrifugal pump (E) from the conditioning tank (G). Solution flow rate was manually regulated with the aid of a rotameter (H) and an arrangement of ball valves (I-J). Liquid level in the cell was manually controlled by visual inspection of the level and by adjusting the speed of a peristaltic pump installed at the discharge (F). Flotation cell impeller speed was kept fixed during the tests. Gas rate was regulated using an electronic mass flow controller (MKS 30GA). The McGill bubble viewer apparatus (A) was used to measure bubble size. Tested conditions are summarized in Table 1.

2.2.2. Metallurgical Performance Testing

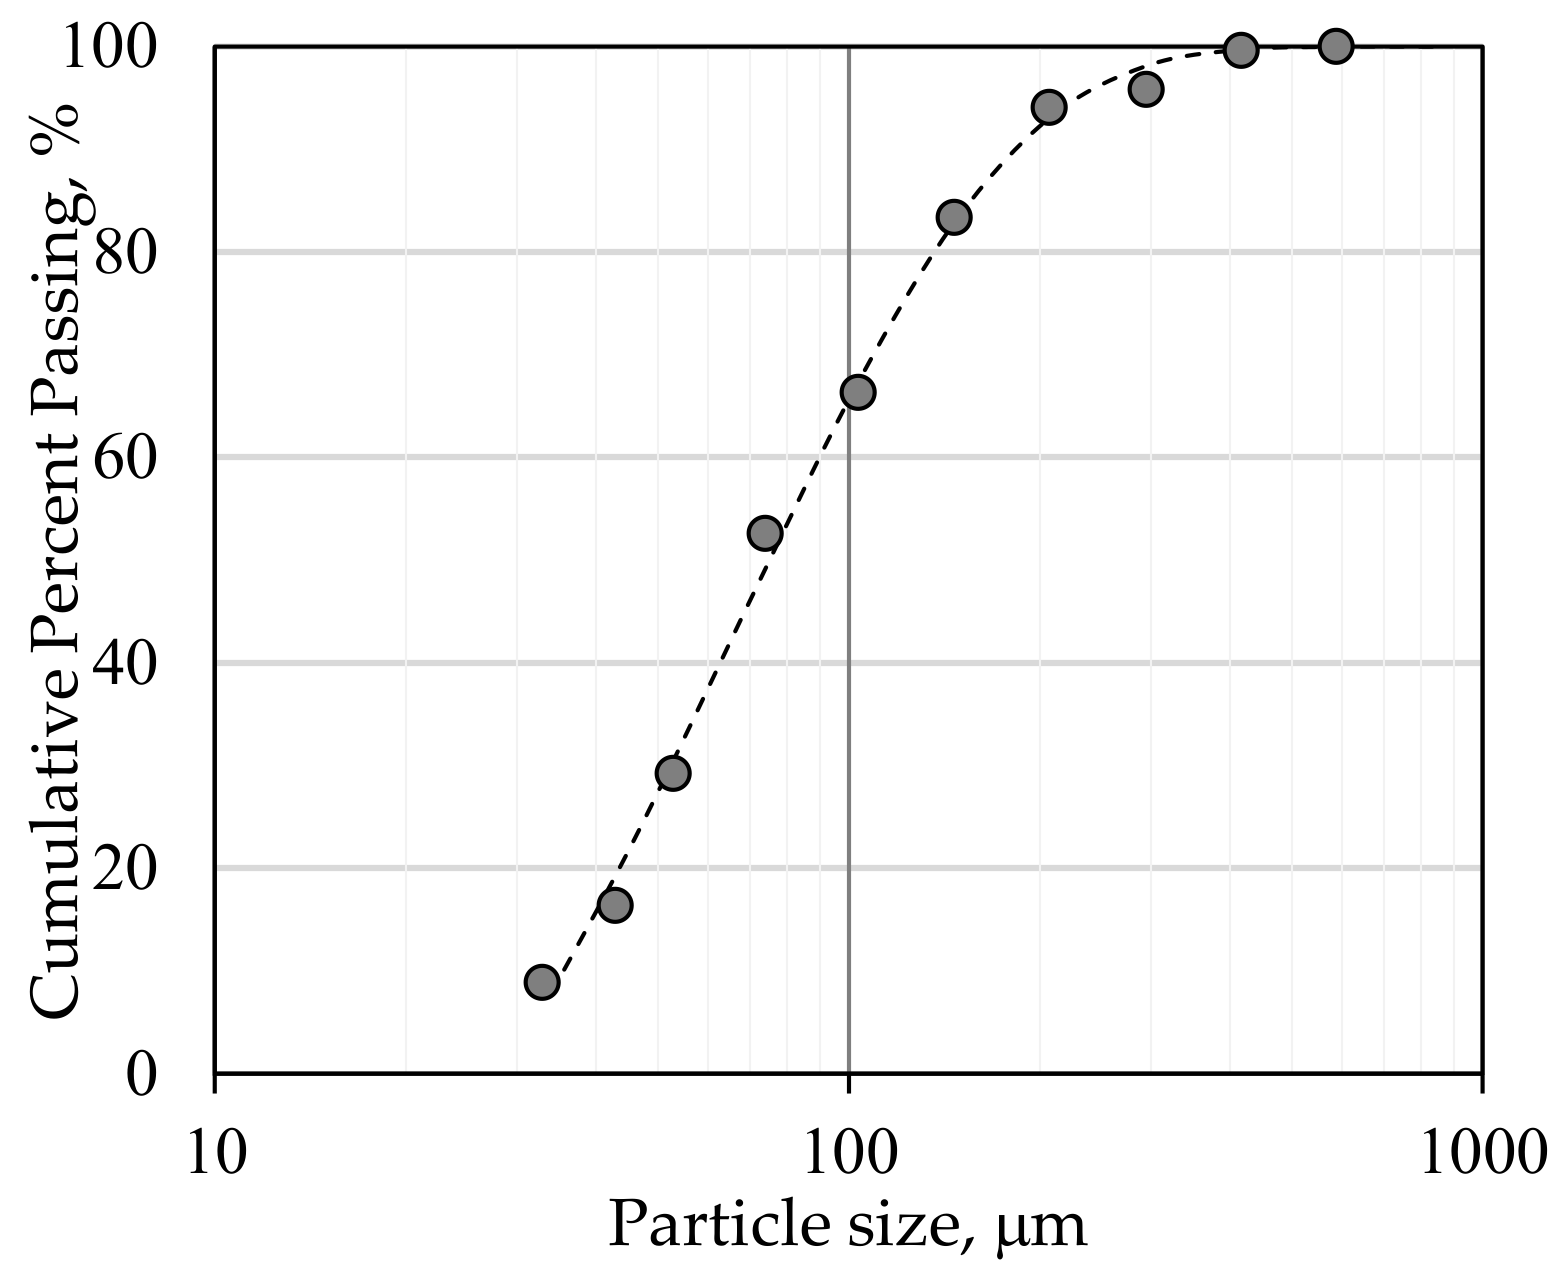
Once the gas dispersion characterization was completed, batch flotation tests were performed. Low-grade copper ore from a Chilean porphyry deposit having chalcopyrite as the dominant copper-bearing mineral was used. Table 2 shows the copper and iron feed grades measured for the tested conditions and Figure 3 shows the cumulative particle size distribution exhibiting a P80 parameter around 137 μm. These ore characteristics do not impose strong limitations on the achievable flotation performance as suggested in [27,28].
The testing conditions are presented in Table 3. Two MIBC frother concentrations were tested, namely, 5 and 20 ppm, which corresponded to concentrations below and beyond the critical coalescence concentration (CCC) which has been reported to vary between 7.4 ppm and 11.2 ppm [29,30].

3. Results

The experimental results from the gas dispersion and batch flotation testing are described in the following sections:

3.1. Gas Dispersion Testing

3.1.1. Bubble Size (d32)

Figure 4a shows the Sauter mean bubble diameter (d32) as a function of the superficial gas velocity for different concentrations of MIBC frother. It can be seen that for a given fixed frother concentration, the bubble size increases with gas rate as expected. Smaller bubbles were observed as frother concentration increased as shown in Figure 4b. The smallest Sauter bubble mean diameter measured, ca., 0.55 mm was obtained when the cell operated at the highest tested frother concentration, i.e., 60 ppm, and the lowest gas rate, i.e., 0.5 cm/s. As gas rate increased, the minimum, achievable bubble size also increased as expected.
It can also be observed from Figure 3 that the CCC, is in the range of 10 to 15 ppm. To study the effect of frother concentration on the metallurgical performance for batch flotation testing, a concentration below (5 ppm) and above the CCC (i.e., 20 ppm) was chosen.

3.1.2. Gas Holdup (εg)

Figure 5a shows the gas holdup as a function of the gas rate for different frother concentrations. It can be observed that for a given frother concentration, gas holdup increases linearly with gas rate. The use of higher frother concentrations produced higher gas holdups; however, the rate of increase in gas holdup reduced significantly beyond 20 ppm as observed in Figure 5b. This was expected as bubble size became largely insensitive to further increments in frother additions beyond 20 ppm as shown below.

3.1.3. Bubble Surface Area Flux (Sb)

The bubble surface area flux was calculated from the gas rate and Sauter mean bubble diameter as follows:
S b = 60 J g   cm s d 32   mm
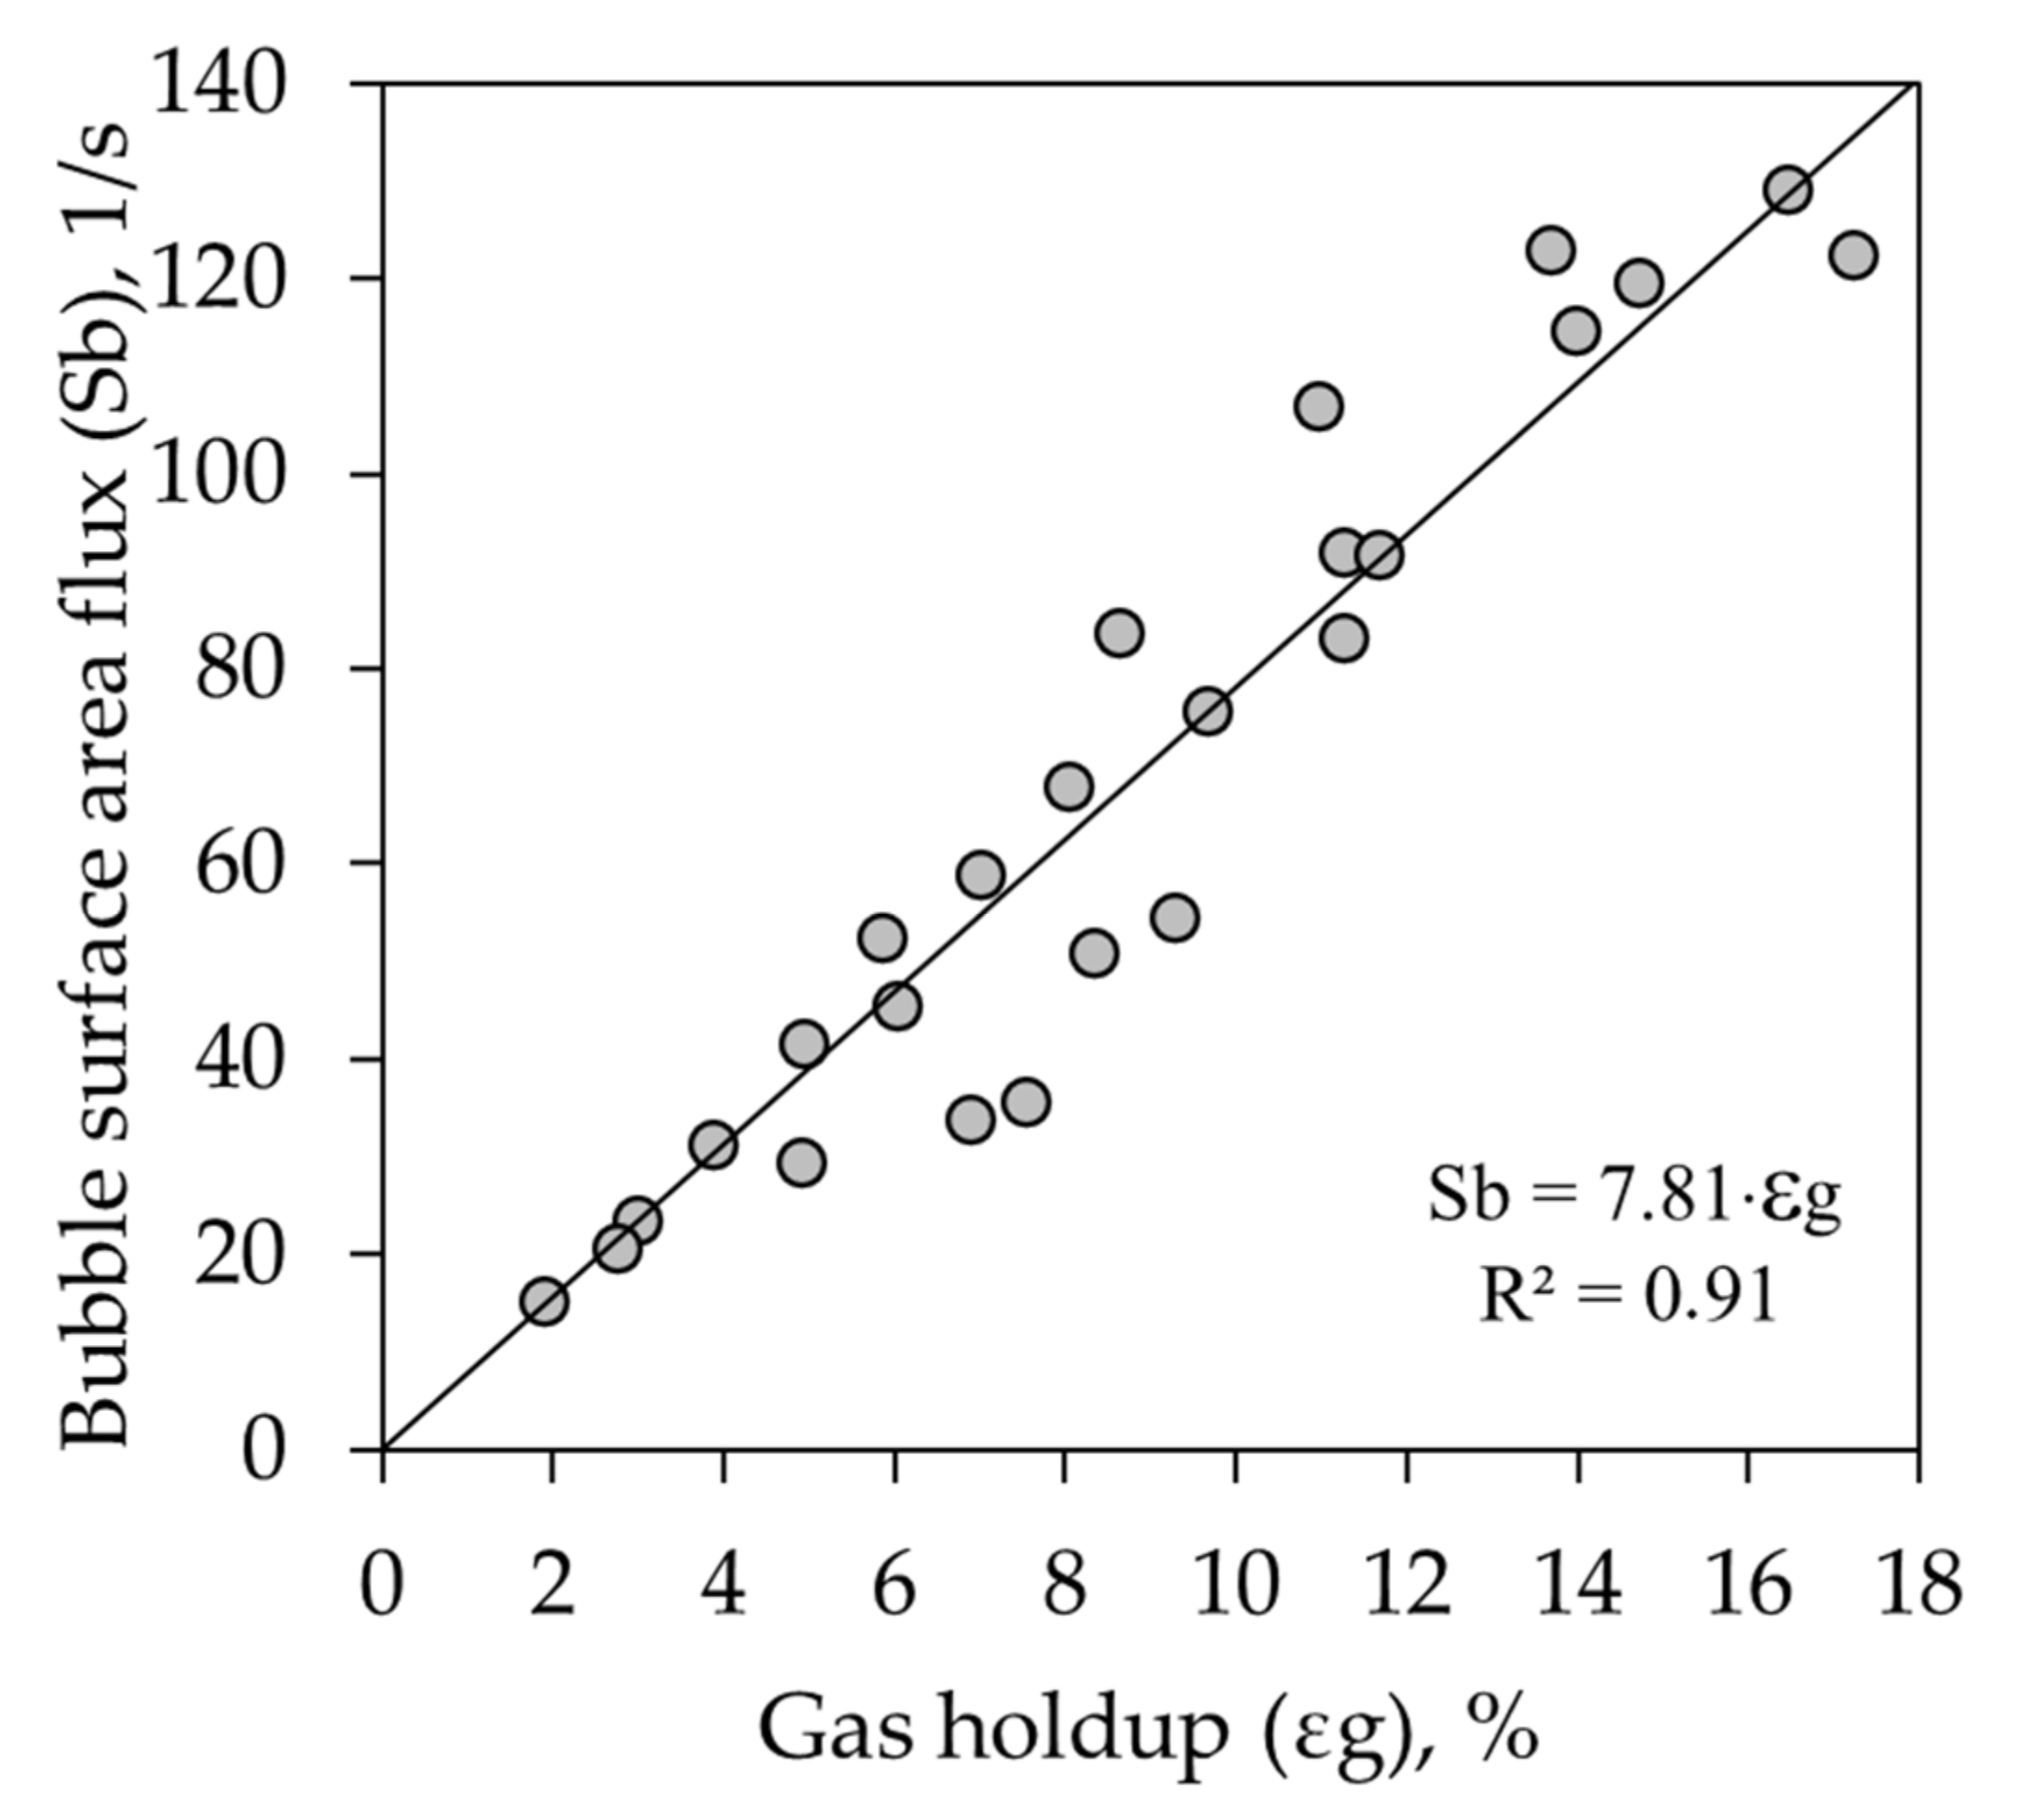
Similar relationships as those observed for gas holdup were also seen for the bubble surface area flux as shown in Figure 6. This is reasonable as, plotting the bubble surface area flux against gas holdup reveals a linear correlation regardless of gas rate and frother concentration (see Figure 7), extending previous reports on columns [6,11,13], although, with a higher slope (c.a. 7.81). The strong correlation between gas holdup and bubble surface area flux can be explained by the fact that both variables are affected by changes in gas rate and bubble size.

3.1.4. Water Recovery

Recovery of water was calculated as the ratio of the water overflow rate to the water feed flow rate. Foam depth was regulated at 2 cm during the whole test. Figure 8 shows the water recovery as a function of gas rate, bubble surface area flux, and gas holdup, respectively, for different frother concentrations. Most of the conditions tested did not produce a stable overflowing foam, and as a result, water recovery was null. Only testing conditions considering medium to high gas rates and frother concentrations beyond the CCC (i.e., 20 and 60 ppm in this case) produced non-zero water recoveries. For gas rate and bubble surface area flux, different frother concentrations produced significantly different recovery curves whereas for the gas holdup these trends tend to approach. Thus, gas holdup provided a higher correlation to water recovery as also reported in [31,32]. Increasing gas holdup, by either, increasing gas rate and/or frother concentration will increase water recovery and consequently entrainment [33,34].

3.2. Metallurgical Performance Testing

3.2.1. Gas Holdup in Two and Three-Phase System

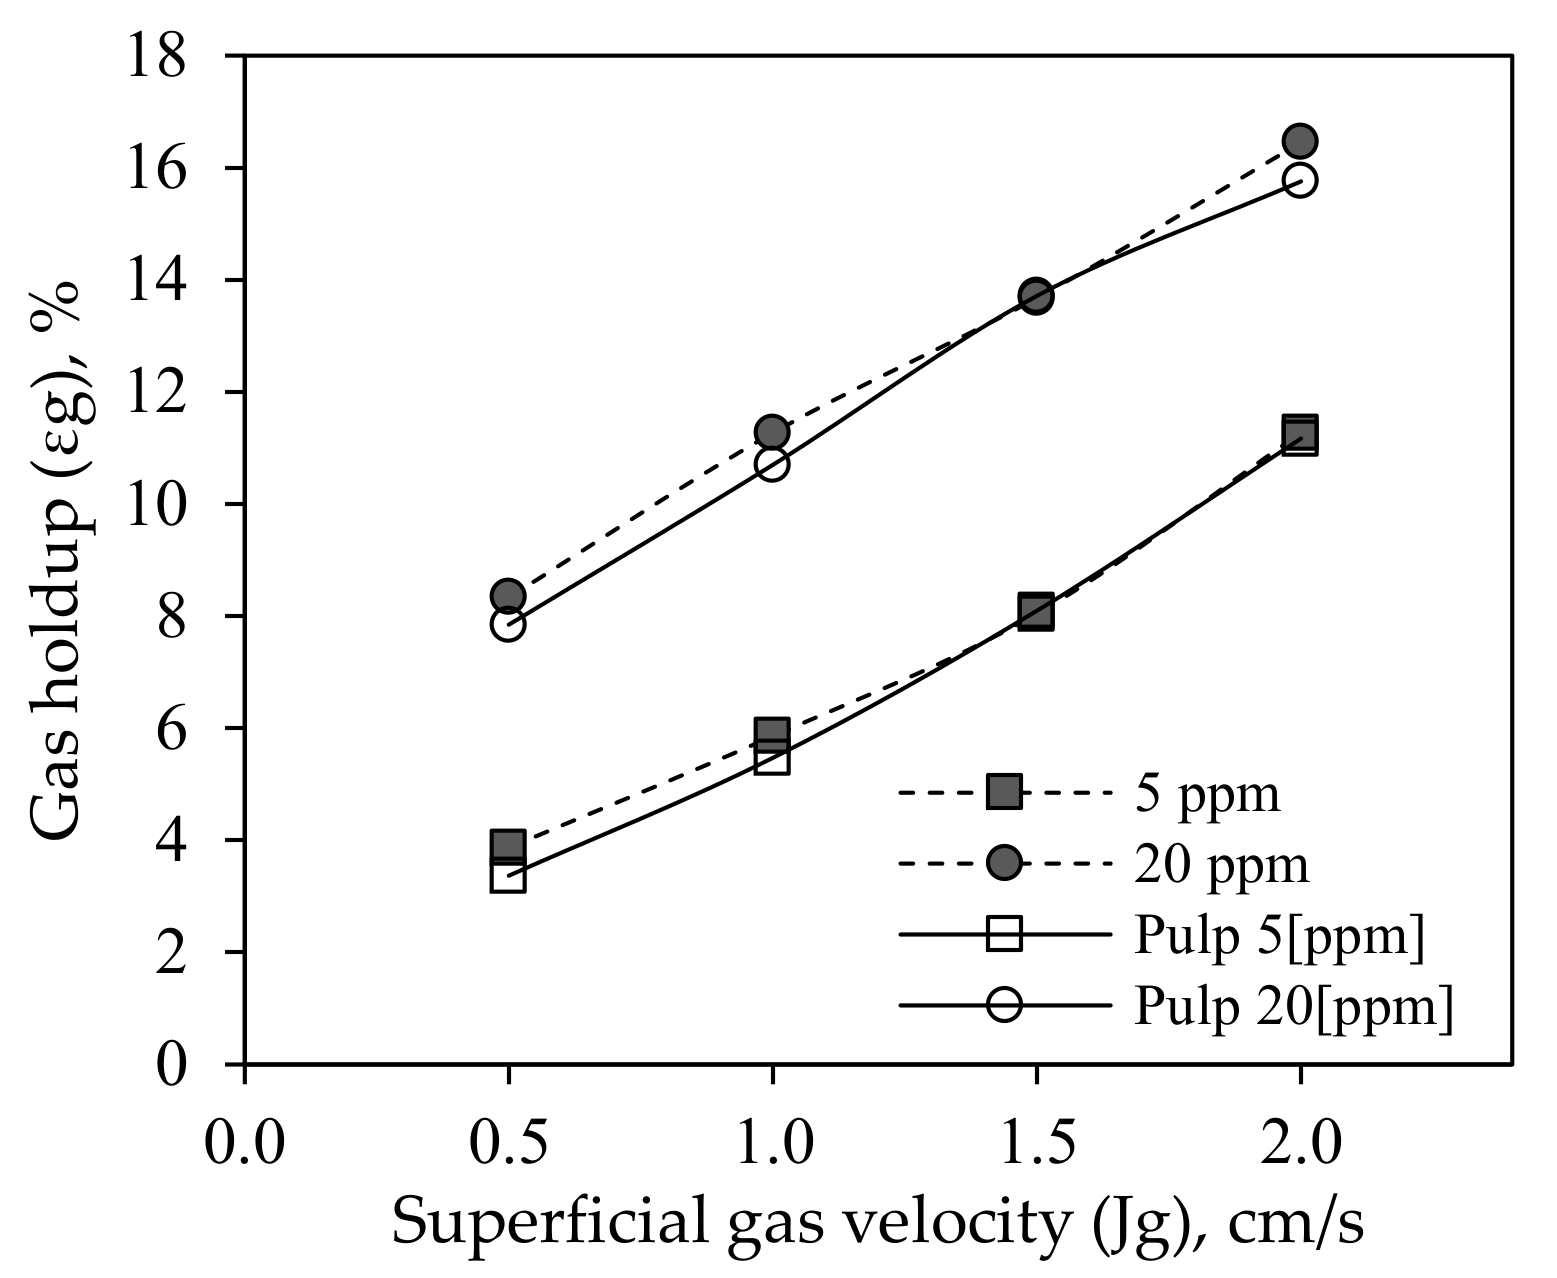
To study the impact of the gas dispersion properties on metallurgical performance, batch flotation tests were conducted. Gas holdup measurements from the application of Maxwell equation require the conductivity of water, suspension, and the aerated pulp as described in [25]. The electrical conductivity of water and particle suspension was sequentially measured at the beginning of batch tests. Figure 9 shows the relationship between gas holdup and superficial gas velocity for two frother concentrations 5 and 20 ppm and when the cell operated with liquid only and a suspension. It was observed that the εg-Jg relationship proved fairly invariant to the fluid type.

3.2.2. Batch Flotation Tests

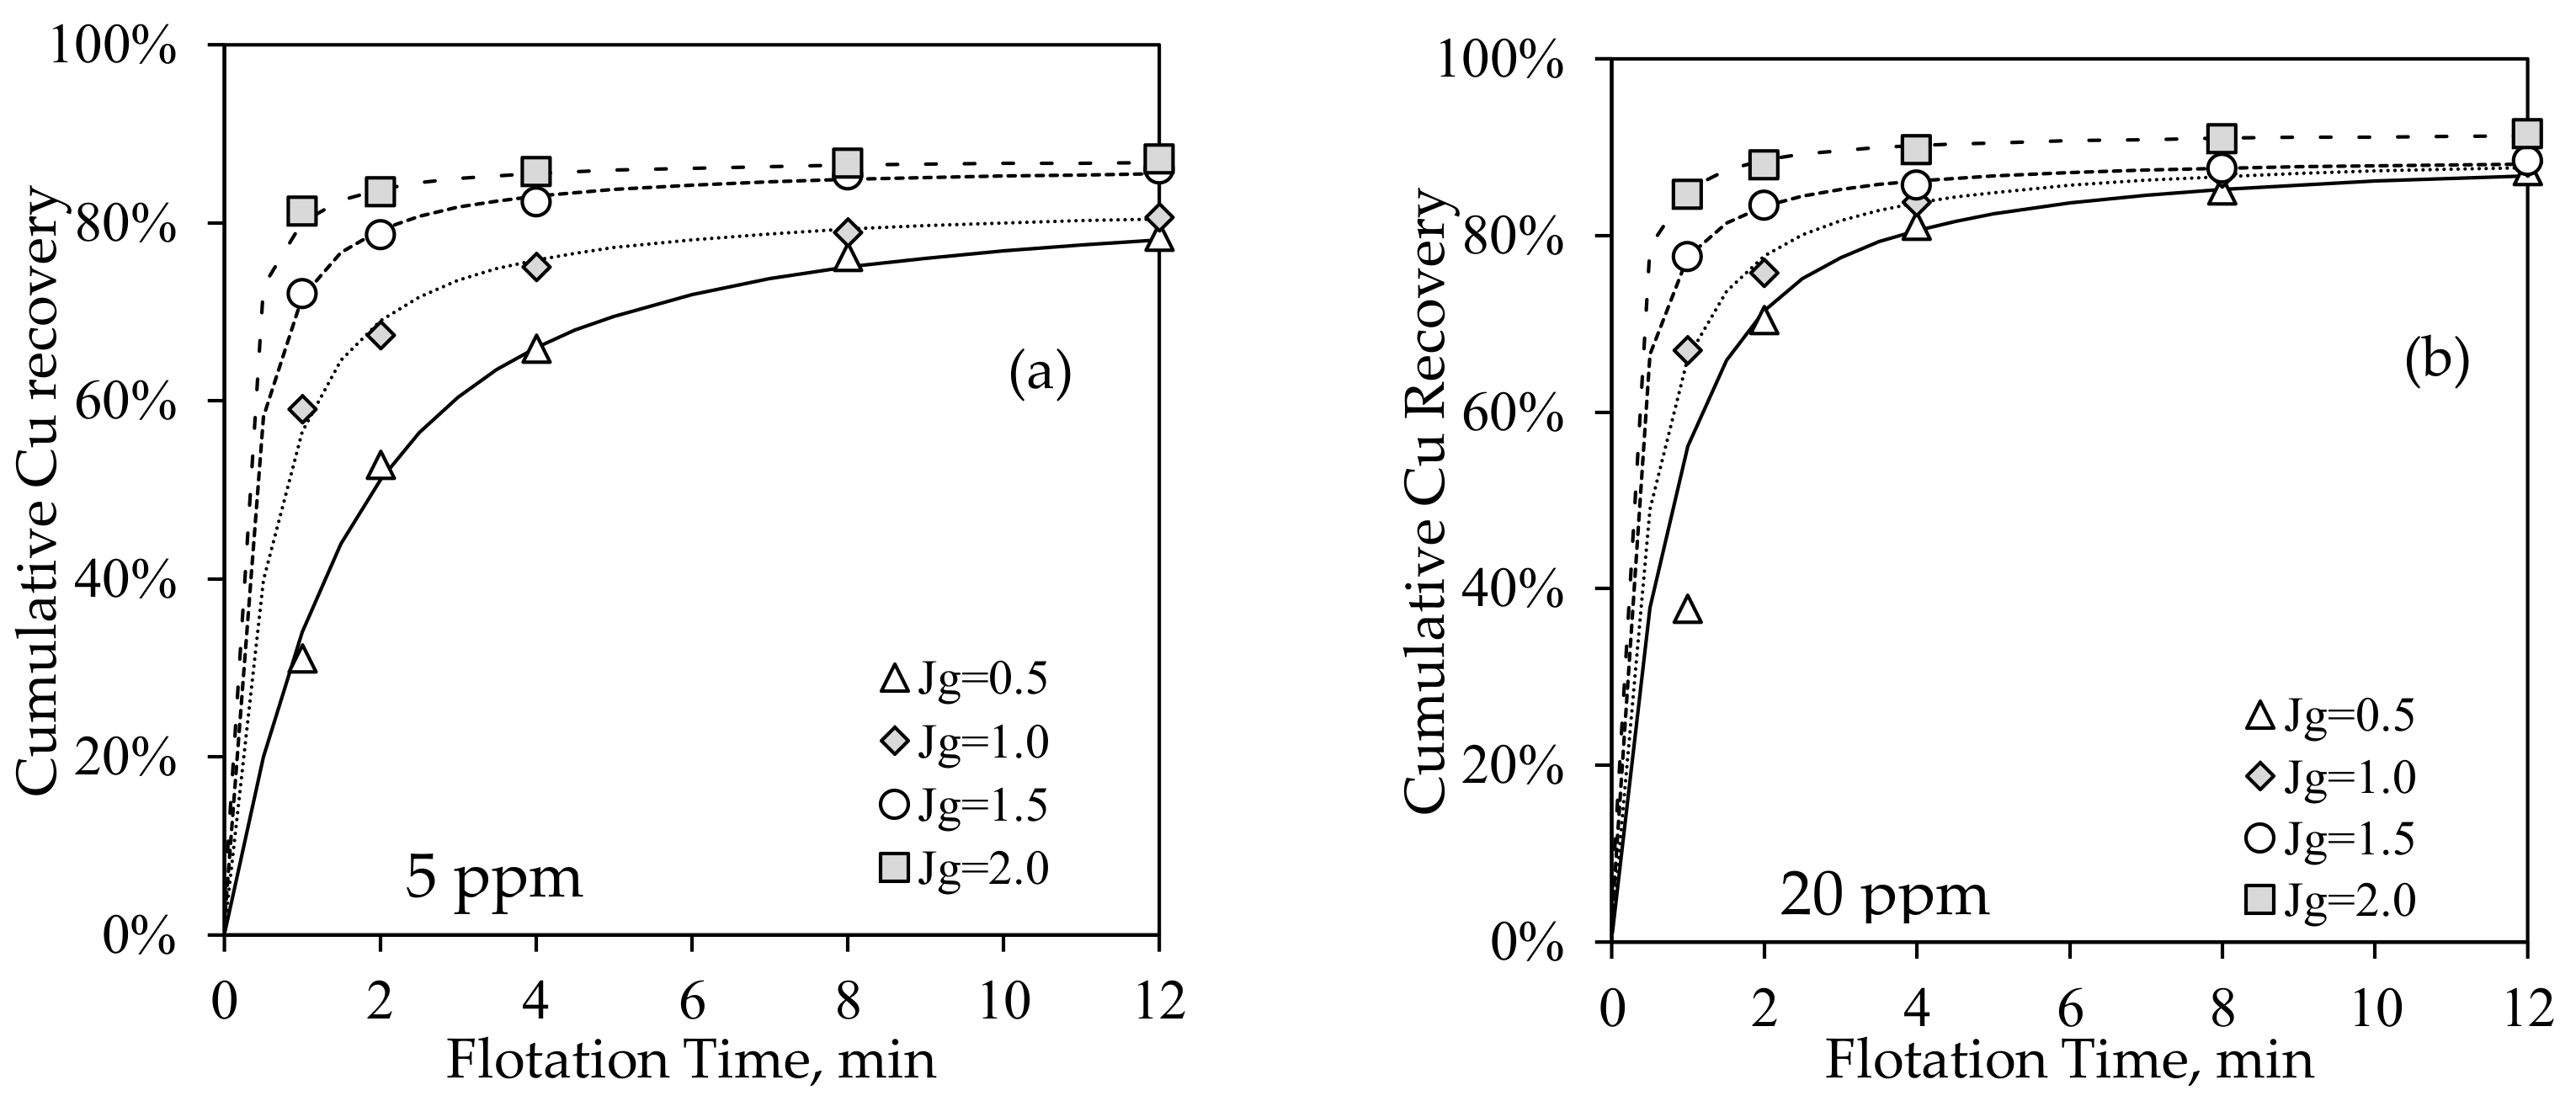
Batch flotation tests were conducted following the methodology described in [35], i.e., a water solution having the same frother concentration as that of the test was added regularly during the test to maintain 2 cm froth depth without scraping. Figure 10 shows the cumulative copper recovery curves for different gas rates and 5 and 20 ppm frother concentrations. For a given frother concentration, copper recovery increased with gas rate as expected. It can also be observed that flotation kinetics and maximum attained recovery tend to increase when changing frother concentration from 5 to 20 ppm. This can be explained by the increase in the bubble surface area available for particle collection and froth stability both achieved as bubble size reduces with frother [30,36,37].
A better picture of how the flotation performance varies with gas rate and frother concentration can be observed from the cumulative copper grade–recovery curves as shown in Figure 11. It can be seen that as the frother concentration is increased from 5 to 20 ppm copper concentrate grade reduced significantly, especially for high gas rates. This can be explained by the considerable increase in weight recovery as gas rate increases as shown in Figure 12, which in conjunction with the increase in water recovery for these conditions would suggest the recovery of gangue particles by entrainment.

3.2.3. Froth Flotation Kinetics Model

Figure 13 consists of an array of graphs where those in the first column show the cumulative copper recovery as a function of the superficial gas velocity for the two tested frother concentrations (5 and 20 ppm) and as the flotation time progresses. Similarly, the second column shows the experimental results for gas holdup. These relationships were calculated for five flotation times, i.e., 1, 2, 4, 8, and 12 min. It can be observed that the cumulative copper recovery up to any given flotation time increases with gas rate and gas holdup as a result of the increase in the surface area available for particle collection.
The impact of frother concentration on the cumulative Cu recovery–gas velocity relationship is represented by separated lines: as the frother concentration increased from 5 to 20 the lines shift upwards to higher copper recoveries. Increasing frother concentration for a fixed gas rate reduces bubble size and therefore increases the bubble surface area available for particle collection with the respective increment in recovery.
Interestingly, for any given flotation time, the cumulative copper recovery can be expressed as a power function of gas holdup regardless of the changes in frother concentration, although, some data scattering is observed at the beginning of the test, probably due to the initial transient condition.
Finally, Figure 14 shows that the incremental copper grade can be modeled as a monotonically decreasing exponential function of the gas holdup regardless of frother concentration. Scattering in the first two minutes is also here observed. Again, there is no unique relationship that relates the incremental grade to gas rate as the effect of frother concentration on bubble size and swarm velocity and its effect on water recovery and consequently entrainment is unobservable through the gas rate alone
This exponential reduction in the incremental concentrate grade with gas holdup can be explained by the increase in the water recovery and therefore entrainment as suggested by the weight recovery in Figure 15 for 12 min flotation time.

4. Conclusions

A dual flotation–conductivity laboratory flotation cell was implemented to study the effect of gas dispersion variables, including frother concentration, on the flotation performance. For a given flotation time, the cumulative copper recovery exhibited a fairly linear function of gas rate, and this relationship was modified by frother concentration. Specifically, the higher frother concentration tested, i.e., 20 ppm produced higher copper recoveries than those achieved for 5 ppm at any given gas rate. Interestingly, when plotting copper recovery against gas holdup, data collapse into a single power function of gas holdup regardless of the gas rate and frother concentration used. This behavior was also observed for the incremental copper grade where again, for a given flotation time, a single exponential function of gas holdup was observed. This demonstrates the advantage of using gas holdup to predict metallurgical performance as it captured and grouped the individual effects of gas rate and frother concentration into a single variable.

Author Contributions

Conceptualizacion, F.F. and M.M.; Methodology, F.F. and M.M.; Formal Analysis, F.F., M.M., N.M. and L.G.; Resources, M.M. and L.G.; Writing Original Draft Preparation, F.F. and M.M.; Writing-Review & Editing, N.M. and L.G. All authors have read and agreed to the published version of the manuscript.

Funding

This research was funded by the Chilean Council of Science and Technology through the project ANID/Fondecyt 1211705.

Data Availability Statement

Not applicable.

Acknowledgments

Maldonado would like to acknowledge support from the Chilean Council of Science and Technology through the project ANID/Fondecyt 1211705. Gutierrez also acknowledges support from ANID/FONDAP/15130015, ANID/ACT210030, and ANID/FSEQ210002.

Conflicts of Interest

The authors declare no conflict of interest.

References

  1. Klimpel, R.R.; Dhansen, R.; Fee, B.S. Selection of flotation reagents for mineral flotation. In Design and Installation of Concentration and Dewatering Circuit; Mular, A.L., Anderson, M.A., Eds.; Society of Mining Engineers: Englewood, CO, USA, 1986; Volume 26, pp. 384–404. [Google Scholar]
  2. Lynch, A.J.; Elber, L. Modelling and control of mineral processing plants. In Proceedings of the IFAC Mining, Mineral, and Metal Processing, Montreal, QC, Canada, 18–20 August 1980; pp. 25–32. [Google Scholar]
  3. Gomez-Flores, A.; Heyes, G.; Ilyas, S.; Kim, H. Prediction of grade and recovery in flotation from physicochemical and operational aspects using machine learning models. Miner. Eng. 2022, 183, 107627. [Google Scholar] [CrossRef]
  4. Hadler, K.; Cilliers, J.J. The relationship between the peak in air recovery and flotation bank performance. Miner. Eng. 2009, 22, 451–455. [Google Scholar] [CrossRef]
  5. Hadler, K.; Greyling, M.; Plint, N.; Cilliers, J.J. The effect of froth depth on air recovery and flotation performance. Miner. Eng. 2012, 36–38, 248–253. [Google Scholar] [CrossRef]
  6. Finch, J.A.; Xiao, J.; Hardie, C.; Gomez, C.O. Gas Dispersion Properties: Bubble surface area flux and gas hold-up. Miner. Eng. 2000, 13, 365–372. [Google Scholar] [CrossRef]
  7. Finch, J.; Dobby, G. Column Flotation; Pergamon Press: Oxford, UK, 1990. [Google Scholar]
  8. Cappuccitti, F.; Finch, J.A. Development of new frothers through hydrodynamic characterization. Miner. Eng. 2008, 21, 944–948. [Google Scholar] [CrossRef]
  9. Azgomi, F.; Gomez, C.O.; Finch, J.A. Correspondence of gas holdup and bubble size in presence of different frothers. Int. J. Miner. Process. 2007, 83, 1–11. [Google Scholar] [CrossRef]
  10. Quinn, J.J.; Kracht, W.; Gomez, C.O.; Gagnon, C.; Finch, J.A. Comparing the effect of salts and frother (MIBC) on gas dispersion and froth properties. Miner. Eng. 2007, 20, 1296–1302. [Google Scholar] [CrossRef]
  11. Massinaei, M.; Kolahdoozan, M.; Noaparast, M.; Oliazadeh, M.; Yianatos, J.; Shamsadini, R.; Yarahmadi, M. Hydrodynamic and kinetic characterization of industrial columns in rougher circuit. Miner. Eng. 2009, 22, 357–365. [Google Scholar] [CrossRef]
  12. Matiolo, E.; Testa, F.; Yianatos, J.; Rubio, J. On the gas dispersion measurements in the collection zone of flotation columns. Int. J. Miner. Process. 2011, 99, 78–83. [Google Scholar] [CrossRef]
  13. López-Saucedo, F.; Uribe-Salas, A.; Pérez-Garibay, R.; Magallanes-Hernández, L. Gas dispersion in column flotation and its effect on recovery and grade. Can. J. Metall. Mater. Sci. 2012, 51, 111–117. [Google Scholar] [CrossRef]
  14. Vazirizadeh, A.; Bouchard, J.; del Villar, R.; Ghasemzadeh Barvarz, M.; Duchesne, C. On the relationship between hydrodynamic characteristics and the kinetics of flotation. Part II: Model validation. Miner. Eng. 2015, 74, 198–206. [Google Scholar] [CrossRef]
  15. Gomez, C.O.; Cortés-López, F.; Finch, J.A. Industrial testing of a gas holdup sensor for flotation systems. Miner. Eng. 2003, 16, 493–501. [Google Scholar] [CrossRef]
  16. Amenlunxen, P.; Rothman, P. The on-line determination of bubble surface area flux using the CIDRA GH-100 sonar gas holdup meter. IFAC Proc. 2009, 42, 156–160. [Google Scholar] [CrossRef] [Green Version]
  17. Maldonado, M.; Gomez, C.O. A new approach to measure gas holdup in industrial flotation machines Part I: Demonstration of working principle. Miner. Eng. 2018, 118, 1–8. [Google Scholar] [CrossRef]
  18. Ramos, I.; Maldonado, M.; Meriño, D.; Bustos, P.; Henriquez, F.; Morales, M. A new approach to measure gas holdup in industrial flotation machines Part III: Industrial prototype design and assessment. Miner. Eng. 2022, 180, 107490. [Google Scholar] [CrossRef]
  19. Dahlke, R.; Gomez, C.; Finch, J.A. Operating range of a flotation cell determined from gas holdup vs. gas rate. Miner. Eng. 2005, 18, 977–980. [Google Scholar] [CrossRef]
  20. Vinnett, L.; Yianatos, Y.; Alvarez, M. Gas dispersion measurements in mechanical flotation cells: Industrial experience in Chilean concentrators. Miner. Eng. 2014, 57, 12–15. [Google Scholar] [CrossRef]
  21. Gorain, B.K.; Franzidis, J.P.; Manlapig, E.V. Studies on impeller type, impeller speed and air flow rate in an industrial: Scale flotation cell. Part 4: Effect of bubble surface area flux on flotation kinetics. Miner. Eng. 1997, 10, 367–379. [Google Scholar] [CrossRef]
  22. Gorain, B.K.; Franzidis, J.P.; Manlapig, E.V. Studies on impeller type, impeller speed and air flow rate in an industrial scale flotation cell. Part 5: Validation of k-Sb relationship and effect of froth depth. Miner. Eng. 1998, 11, 615–626. [Google Scholar] [CrossRef]
  23. Kracht, W.; Vallebuona, G.; Casali, A. Rate constant modelling for batch flotation, as a function of gas dispersion properties. Miner. Eng. 2005, 18, 1067–1076. [Google Scholar] [CrossRef]
  24. Koh, P.T.L.; Schwarz, M.P. CDF model of a self-aerating flotation cell. Int. J. Miner. Process. 2007, 85, 16–24. [Google Scholar] [CrossRef] [Green Version]
  25. Maldonado, M.; Pinto, A.; Gomez, C.O.; Becerra-Yoma, N. Electrode arrangements for continuous measurement of dispersion conductivity in lab flotation cells. Miner. Eng. 2017, 111, 1–4. [Google Scholar] [CrossRef]
  26. Maldonado, M.; Pinto, A.; Magne, L.; Gomez, C.O.; Finch, J.A. Gas hold-up estimation using Maxwell equation in flotation systems: Revisited. Miner. Eng. 2016, 98, 9–13. [Google Scholar] [CrossRef]
  27. Gontijo, C.; Fornasiero, D.; Ralston, J. The limits of fine and coarse particle flotation. Can. J. Chem. Eng. 2007, 85, 739–747. [Google Scholar] [CrossRef]
  28. Gomez-Flores, A.; Heyes, G.; Ilyas, S.; Kim, H. Effects of artificial impeller blade wear on bubble—particle interactions using CFD (k − ε and LES), PIV, and 3D printing. Miner. Eng. 2022, 186, 107766. [Google Scholar] [CrossRef]
  29. Grandón, F.; Alvarez, J.; Gómez, C. Frother dosage in laboratory flotation testing. In Proceedings of the 11th International Mineral Processing Conference (2015 Procemin), Santiago, Chile, 21–23 October 2015; pp. 1–11. [Google Scholar]
  30. Laskowski, J.S. Testing flotation frothers. Physicochem. Probl. Miner. Process. 2004, 38, 13–22. [Google Scholar]
  31. Moyo, P.; Gomez, C.O.; Finch, J.A. Characterizing frothers using water carrying rate. Can. Metall. Q. 2007, 46, 215–220. [Google Scholar] [CrossRef]
  32. Martinez, J.; Maldonado, M.; Gutierrez, L. A method to predict water recovery to predict water recovery rate in the collection and froth zone of flotation systems. Minerals 2020, 10, 630. [Google Scholar] [CrossRef]
  33. Smith, P.G.; Warren, L.J. Entrainment of Particles into Flotation Froths. Miner. Process. Extr. Metall. Rev. 1989, 5, 123–145. [Google Scholar] [CrossRef]
  34. Wang, L.; Peng, Y.; Runge, K.; Bradshaw, D. A review of entrainment: Mechanisms, contributing factor and modelling in flotation. Miner. Eng. 2015, 70, 77–91. [Google Scholar] [CrossRef]
  35. Runge, K.C. Laboratory Flotation Testing—An Essential Tool for Ore Characterisation. In Flotation Plan Optimation: A Metallurgical Guide to Identifying and Solving Problems in Flotation Plants; Greet, C.J., Ed.; Ausimm the Minerals Institute: Carlon, VIC, Australia, 2010; Chapter 9; pp. 155–173. [Google Scholar]
  36. Geldenhuys, S.; McFadzean, B. The effect of pulp bubble size on the dynamic froth stability measurement. Miner. Eng. 2019, 131, 164–169. [Google Scholar] [CrossRef]
  37. McFadzean, B.; Marozva, T.; Wiese, J. Flotation frother mixtures: Decoupling the sub-processes of froth stability, froth recovery and entrainment. Miner. Eng. 2016, 85, 72–79. [Google Scholar] [CrossRef]
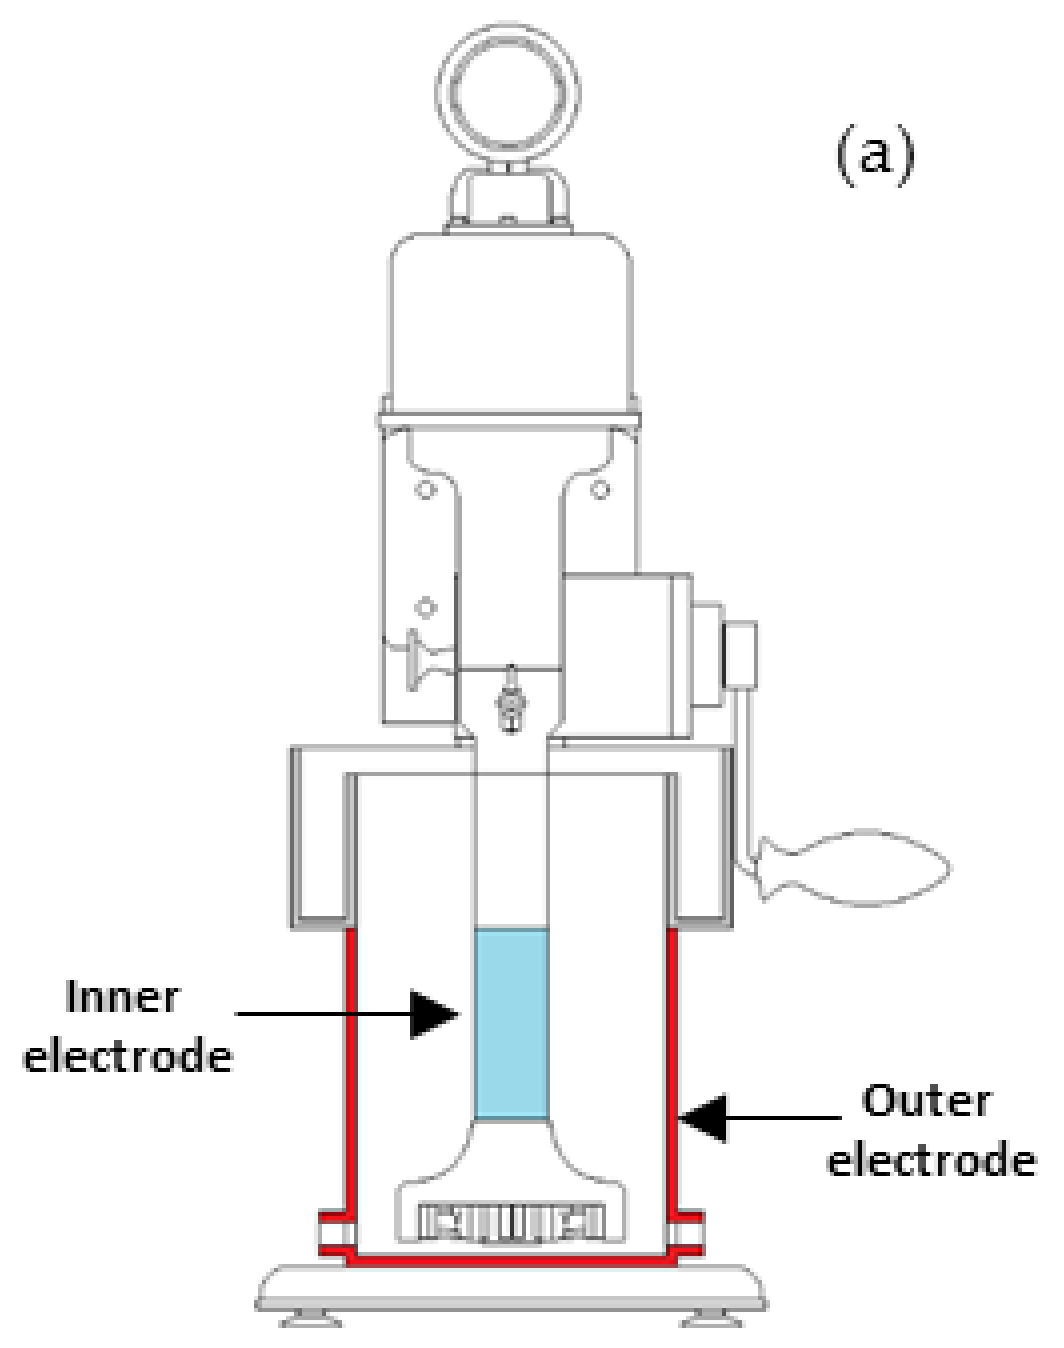
Figure 1. Dual flotation–conductivity cell. (a) Lateral view, (b) top view, (c) photograph of the flotation vessel and front panel of the conductivity meter M300 (Metler Toledo, Columbus, OH, USA).
Minerals 12 01351 g001aMinerals 12 01351 g001b
Figure 2. Gas dispersion testing rig. (a) Illustration, (b) photograph of the actual setup.
Minerals 12 01351 g002
Figure 3. Particle size distribution of the mineral used in the flotation tests.
Minerals 12 01351 g003
Figure 4. Bubble size as a function of (a) superficial gas velocity and (b) MIBC frother concentration.
Minerals 12 01351 g004
Figure 5. Gas hold-up as a function of (a) Superficial gas velocity, and (b) MIBC frother concentration.
Minerals 12 01351 g005
Figure 6. Bubble surface area flux (Sb) as a function of (a) the Superficial gas velocity and (b) MIBC frother concentration.
Minerals 12 01351 g006
Figure 7. Bubble surface area flux vs. gas holdup.
Minerals 12 01351 g007
Figure 8. Water recovery as a function of (a) superficial gas velocity, (b) bubble surface area flux, and (c) gas holdup.
Minerals 12 01351 g008
Figure 9. Gas holdup versus gas rate for a two and three-phase system.
Minerals 12 01351 g009
Figure 10. Batch flotation Cu recovery curves. (a) 5 ppm, (b) 20 ppm.
Minerals 12 01351 g010
Figure 11. Copper grade-recovery curves for different gas rates and two frother concentrations: (a) 5 ppm and (b) 20 ppm.
Minerals 12 01351 g011
Figure 12. Weight recovery for different gas rates and two frother concentrations: (a) 5 ppm and (b) 20 ppm.
Minerals 12 01351 g012
Figure 13. Copper recovery for batch flotation times as a function of superficial gas velocity (first column) and gas holdup (second column).
Minerals 12 01351 g013
Figure 14. Incremental Copper grade for batch flotation times as a function of superficial gas velocity (first column) and gas holdup (second column).
Minerals 12 01351 g014
Figure 15. Cumulative weight recovery as a function of gas holdup after 12 min of flotation.
Minerals 12 01351 g015
Table 1. Experimental conditions for gas dispersion study.
Levels
Manipulated VariablesTesting NumberUnits− −0++ +
Water solution rate1L/min 2
Superficial gas velocity (Jg)4cm/s0.51 1.52
Froth level1cm 2
Frother concentration5ppm25102060
Rotor speed1rpm 1000
Frother Type1 MIBC
Total number of tests20
Table 2. Copper and Iron feed grades.
5 [ppm]20 [ppm]Average
ElementJg = 0.5 cm/sJg = 1.0Jg = 1.5Jg = 2.0Jg = 0.5Jg = 1.0Jg = 1.5Jg = 2.0
CuT [%]0.500.490.500.500.510.500.510.500.50
Fe [%]5.205.065.295.275.335.165.195.205.20
Table 3. Experimental conditions for metallurgical performance study.
Levels
Manipulated VariablesTesting NumberUnits− −0+++
Feed rate (pulp)1L/min Batch
Superficial gas velocity (Jg)4cm/s0.51 1.52
Froth level1cm 2
Frother concentration2ppm 5 20
Rotor speed1rpm 1000
Percent solids1% 28–31
P801μm 137
Copper feed grade (%CuT)1% 0.5
Frother Type1 MIBC *
Collector Type1 SIBX *
Collector Concentration1g/t 20
pH1 10
Flotation time min124812
Total number of tests8
* MIBC and SIBX stand for Methyl Isobutyl Carbinol and Sodium Isobutyl Xanthate respectively.
Publisher’s Note: MDPI stays neutral with regard to jurisdictional claims in published maps and institutional affiliations.