Article

Application Study of Empirical Wavelet Transform in Time–Frequency Analysis of Electromagnetic Radiation Induced by Rock Fracture

1
School of Municipal and Environmental Engineering, Henan University of Urban Construction, Pingdingshan 467036, China
2
School of Civil and Resources Engineering, University of Science and Technology Beijing, Beijing 100083, China
3
School of Safety Engineering, China University of Mining and Technology, Xuzhou 221116, China
*
Author to whom correspondence should be addressed.
Minerals 2022, 12(10), 1307; https://doi.org/10.3390/min12101307
Submission received: 1 September 2022 / Revised: 12 October 2022 / Accepted: 14 October 2022 / Published: 17 October 2022

Abstract

:
The time–frequency characteristics of electromagnetic radiation (EMR) waveform induced by rock fracture are very important to the monitoring and early–warning using the EMR method for the mine rockburst. The empirical wavelet transform (EWT), as a waveform time–frequency analysis method, has the advantages of a clear theoretical basis, convenient calculation, and no modal aliasing. To apply EWT to the field of EMR time–frequency analysis, the operation of Fourier axis segmentation of EWT is improved. In detail, the adaptive selection method for a window width of closing operation and the adaptive determination method of segment number of Fourier axis are proposed for EWT. The Fourier axis obtained by short–time Fourier transform (STFT) is used in the EWT process, rather than that obtained by discrete Fourier transform (DFT), taking a better Fourier axis segmentation effect. The improved EWT together with Hilbert transform (HT) applied to the time–frequency analysis for the EMR waveform of rock fracture, and the time–frequency spectrum obtained by EWT–HT can well describe the time–frequency evolution characteristics. Compared with STFT and Hilbert–Huang transform (HHT), EWT–HT has significant advantages in time–frequency resolution and overcoming modal aliasing, providing a powerful tool for time–frequency analysis for the EMR waveform induced by rock fracture.

1. Introduction

In the process of rock failure under load, the accumulated energy in the rock will be released in the form of elastic wave, electromagnetic energy, thermal energy, etc., and these released energies are closely related to the internal fracture of rock and provide a rich means for monitoring the instability of rock mass [1,2,3,4]. As a monitoring technology based on the electromagnetic energy released by rock fracture, the EMR method has been widely used in the monitoring and early–warning field of the instability of underground structures such as mines, tunnels, and underground space, and plays an important role in mine rockburst monitoring and prevention [5,6,7,8,9]. At present, the EMR monitoring and early–warning indices mainly include the intensity, energy, and ringing count of the EMR waveform, while the frequency index has not been widely used yet [10,11]. However, the EMR is the result of internal crack propagation and the vibration of rock mass under load, and the time–frequency characteristics of the EMR waveform contain rich information about rock fracture [12,13,14].
In recent decades, the time–frequency characteristic of the EMR waveform has been obtained by in–depth study by many researchers. The experimental results and theoretical derivation of Frid et al. [15,16] and Rabinovitch et al. [17] showed that the maximum amplitude of the EMR signal was proportional to the crack velocity and the peak frequency depends on the crack width (i.e., the peak frequency is inversely proportional to the crack width and amplitude, and the amplitude increases with the crack expanding and begins to decay when the expanding stops). Li et al. [18] studied the relationship between the EMR frequency and the rock property parameters theoretically, and the results showed that the EMR frequency increased with the increasing elastic modulus and decreased with the increasing rock sample size and strength. The experimental study conducted by Song et al. [19] showed that the main–frequency increased from near 0 to 60 kHz and then decreased to less than 20 kHz with the increasing applied stress, and the theoretical study showed that the EMR frequency was inversely proportional to the crack length. Wei et al. [20] studied the Fourier spectra of EMR waveforms of rock fracture, and the results showed that at different stress levels, the main frequency decreased with the crack evolution, increased with the decrease in quartz content, and usually occurred at 0–20 kHz. These fruitful studies are of great significance to the analysis of the internal fracture of rock based on the time–frequency characteristics of the EMR waveform.
The waveform time–frequency analysis method is an important tool to study the characteristics of the EMR waveform induced by rock fracture. So far, there are various waveform time–frequency analysis methods. Fourier transform [21] makes it possible for people to observe signals from the frequency domain. As for a digital signal with a certain sampling frequency, its Fourier spectrum can be obtained by DFT. DFT has been widely used in the time–frequency analysis of the EMR signal of rock fracture [22,23,24,25]. However, since it needs the entire segment of an intercepted waveform to participate in DFT operation, the Fourier spectrum has no time dimension. To realize the localization of the signal both in the time domain and frequency domain, STFT was put forward [26]. STFT multiplies a time–frequency localized window function by a short–time digital signal for window processing, and then performs DFT; as a result, the time–frequency spectra at different times are calculated by moving the window with a certain step. Han et al. [27] used STFT to analyze the EMR signal of rock tension fracture induced by the breaking agent in the borehole of the rock mass. Although STFT can localize the DFT in the time domain and frequency domain to some extent, both high time and frequency resolutions cannot be achieved because of the existing window. To solve this problem, Huang et al. [28] proposed HHT. The core of HHT is the empirical mode decomposition (EMD) that can adaptively decompose the signal waveform according to its scale characteristics. EMD does not need the prespecified basis functions and human intervention, and its result is several intrinsic mode functions (IMFs). HT is applied to obtain the instantaneous amplitudes and frequencies of these IMFs, thereby, the high localization of the signal waveform in the time domain and frequency domain is realized. Zhang et al. [29] and Yin et al. [12] analyzed the time–frequency characteristics of the EMR waveforms of coal fracture, and the results show that HHT is suitable for analyzing the transient and nonstationary EMR signal. However, EMD still has some defects such as the lack of theoretical support in mathematics and the mode aliasing existing among IMFs [30,31]. To solve the modal aliasing problem, the ensemble empirical mode decomposition (EEMD) [32] was proposed. Although EEMD alleviates the phenomenon of modal aliasing to a certain extent, it greatly increases the calculation load and prolongs the calculation time because it needs to repeat EMD 50–100 times. Empirical wavelet transform (EWT) is a nonstationary and nonlinear signal decomposition method proposed by Gilles [33], and it is based on wavelet transform and narrowband signal analysis theory. In the process of EWT, a group of orthogonal wavelet filter banks based on the Meyer wavelet are constructed based on the divided Fourier spectrum, and a series of components with a tightly supported Fourier axis. Then, HT is performed on these components to obtain the time–frequency spectrum of the waveform. In theory, EWT not only avoids the end effect and mode aliasing phenomenon of EMD but also has low computational complexity and a small calculation amount. Therefore, EWT has been applied in many engineering fields [34,35,36,37], especially in mechanical fault detection.
Unlike the mechanical fault signal that can occur periodically, the EMR signal of rock fracture has the feature of transiency, nonstationary, and non–repeatability. Given the EMR characteristics, an adaptive segmentation method of Fourier axis for EWT was proposed in this paper, meaning that EWT can be used for the time–frequency analysis for the EMR waveform of rock fracture, which is of great significance to study the internal fracture of rock mass through the time–frequency characteristics and enrich and improve the monitoring and early–warning model of EMR for the mine rockburst.

2. EWT Theory

The specific steps of EWT are as follows [33]:
(1)
Fourier axis segmentation
Assuming that the digital signal is x(t), the Fourier spectrum with the normalized frequency ([0, π]) of x(t) can be obtained by DFT. Assuming that the objective is to divide the Fourier axis into N continuous parts Λn, the boundary of each continuous part can be defined as ωn, then Λn= [ωn−1, ωn], ω0 = 0, ωn = π, n = 1, 2, …, N, and 2τn region centered by the boundary ωn is defined as the transition zone where τn = γωn, γ < min[(ωnωn−1)/(ωn + ωn−1)].
(2)
Construction of Meyer wavelet filter
The wavelet filter of each segment Λn is constructed based on the Meyer wavelet. The empirical scaling function and empirical wavelet function are shown in Equations (1) and (2), respectively.
ϕ ^ n ω = 1 ,   ω     1 + γ ω n cos π 2 β 1 2 τ n ω 1 γ ω n 0 ,   other   ,   1 γ ω n     ω     1 + γ ω n
ψ ^ n ω = 1 ,   ω     1 + γ ω n cos π 2 β 1 2 τ n + 1 ω 1 γ ω n + 1 ,   1 γ ω n + 1     ω     1 + γ ω n + 1 sin π 2 β 1 2 τ n ω 1 γ ω n ,   1 γ ω n     ω     1 + γ ω n 0 ,   other  
where β(x) = x4 (35 − 84x + 70x2 − 20x3).
(3)
Signal decomposition and reconstruction
The detail coefficient and approximation coefficient of EWT are shown in Equations (3) and (4), respectively.
W f n , t = f   , ψ n = f   τ ψ n τ t ¯ d τ =   f ^   ω ψ ^ n ω ¯
W f 0 , t = f   , ϕ 1 = f   τ ϕ 1 τ t ¯ d τ =   f ^   ω ϕ ^ 1 ω ¯
where EWT is defined as Wf(n,t); “∧” represents Fourier transform; and “∨” represents the inverse Fourier transform.
Then, the reconstructed signal can be expressed as
W f n , t = f   , ψ n = f   τ ψ n τ t ¯ d τ =   f ^   ω ψ ^ n ω ¯
Following Equation (5), the empirical mode fk(t) can be obtained by
f 0 t = W f 0 , t * ϕ 1 t
f k t = W f k , t * ψ n t

3. Adaptive Segmentation Method of Fourier Axis

3.1. Conventional Segmentation Method of Fourier Axis

According to the EWT theory described in Section 2, the Fourier axis segmentation has a great influence on the result of EWT decomposition and then affects the time–frequency analysis. Ideally, we hope that the decomposition process is adaptive according to the signal characteristics, and each decomposed component is a tightly supported mode centered on a specific frequency. Gilles et al. [33] put forward a method of the automatic detection of the number of modes, in other words, (1) calculate all the local maximum amplitudes and their corresponding frequencies of the Fourier spectrum of the signal; (2) sort the local maximum amplitude magnitudes in descending as M1, M2, …, MM; and (3) count the number of local maximum amplitudes that are larger than the threshold of MM + α(M1MM) as n. Therefore, the value of α has a great influence on n. Gilles suggested that a value of α around 0.3 and 0.4 seems to give consistent results with a good separation of the Fourier axis and a suitable decomposition mode number. Then, take out the first n normalized frequencies (i.e., 0 < f < π) corresponding to the local maximum amplitudes arranged in descending order, and sort the n normalized frequencies together with 0 and π in ascending order. The center frequency between two consecutive frequencies is taken as a split point of the Fourier axis. As a result, the number of modes decomposed by EWT is N = n + 2.
We took the typical EMR waveform with a sampling frequency of 5 MHz obtained in the experiment as an example to introduce the EWT process. Figure 1a presents the EMR waveform, and Figure 1b describes the result of conventional Fourier axis segmentation. In this example, when α = 0.3, two local maxima are obtained. Based on these two local maxima, it is difficult to separate the Fourier axis properly. As shown in Figure 1b, when α = 0.2, seven local maxima marked by red circles in the Fourier spectrum were obtained, and then the Fourier axis was segmented into nine parts. The Fourier spectrum of the EMR waveform was complex, and there were often two or more high maxima close to each other, exemplarily marked by the black oval boxes in Figure 1b. In this way, using the conventional method of the Fourier axis segmentation, these adjacent local maxima will be easily divided to form different filter banks, and then over–decomposition will occur, which is not conducive to the time–frequency analysis of EMR waveform. Therefore, the conventional method is not applicable to the Fourier axis segmentation of the typical EMR waveform to a certain extent.

3.2. An Improved Adaptive Segmentation Method of Fourier Axis

3.2.1. Closing Operation Theory

The Fourier spectrum of the EMR waveform of rock fracture is complex, and it is a key problem to reasonably divide the adjacent local maxima into the same filter bank. The erosion operator and dilation operator in mathematical morphology are widely used in digital image filtering [38,39]. The principle of the erosion operation is to seek the minimum value of the user-defined structural element (window) of a dataset and then replace other elements of this window with the minimum value. For a one-dimensional dataset X = {X1, X2, …, Xn}, when the window width is B, the dataset after the erosion operation is E = {E1, E2, …, En,}.
E i = min X 1 ,   ,   X i + B ,   1     i     B                         min X i B ,   , X i + B ,   B   <   i   <   n B             min X i B ,   ,   X n ,   n B     i     n                
The erosion operation has the function of eroding the edges of the dataset and forcing the set to shrink inward. If the window width is large enough, the object with a small area and little effect can be removed. In contrast, the principle of the dilation operation is to seek the maximum value of the user-defined window and then replace other elements with the maximum value. The dataset after the dilation operation is D = {D1, D2, …, Dn}.
D i = max X 1 ,   ,   X i + B ,   1     i     B                         max X i B ,   , X i + B ,   B   <   i   <   n B             max X i B ,   ,   X n ,   n B     i     n                
The dilation operation can increase the values of elements and make the dataset expand outside. An appropriate window width can fill the holes in the set to make it more complete.
The closing operation is performing the dilation operation first and then the erosion operation. According to Equations (8) and (9), in an ideal case, the closing operation with an appropriate window width can make one local maximum represent the adjacent local maxima around it, and then realize more appropriate Fourier axis segmentation.

3.2.2. Adaptive Selection of Window Width of the Closing Operation

When a signal with a certain length N is subjected to DFT, its half-spectrum curve will be composed of N/2 points. In the actual situation, the EMR waveforms have different lengths (i.e., the sampling point numbers of the waveforms participating in DFT are inconsistent). In this case, it is a key problem to select the window width for the closing operation. The ultimate purpose of EWT-HT is to draw the 2D or 3D Hilbert spectrum. Although the frequency resolution obtained by HT for each component is infinite, the time–frequency spectrum must be drawn based on a finite frequency resolution. In other words, in the process of drawing a time–frequency spectrum, the instantaneous amplitudes corresponding to the infinitely accurate instantaneous frequencies are accumulated to the frequency points with limited accuracy based on a frequency resolution called the drawing frequency resolution. The drawing frequency resolution, sampling frequency, and sampling point number of the waveform can be used to select the window width for the closing operation. To ensure that only one local maximum existing in the bandwidth of the drawing frequency resolution participates in the Fourier axis segmentation, this paper proposes an adaptive method to determine the window width B for the closing operation, and it can be expressed as
B = round   ( p N f s   f d 2 )
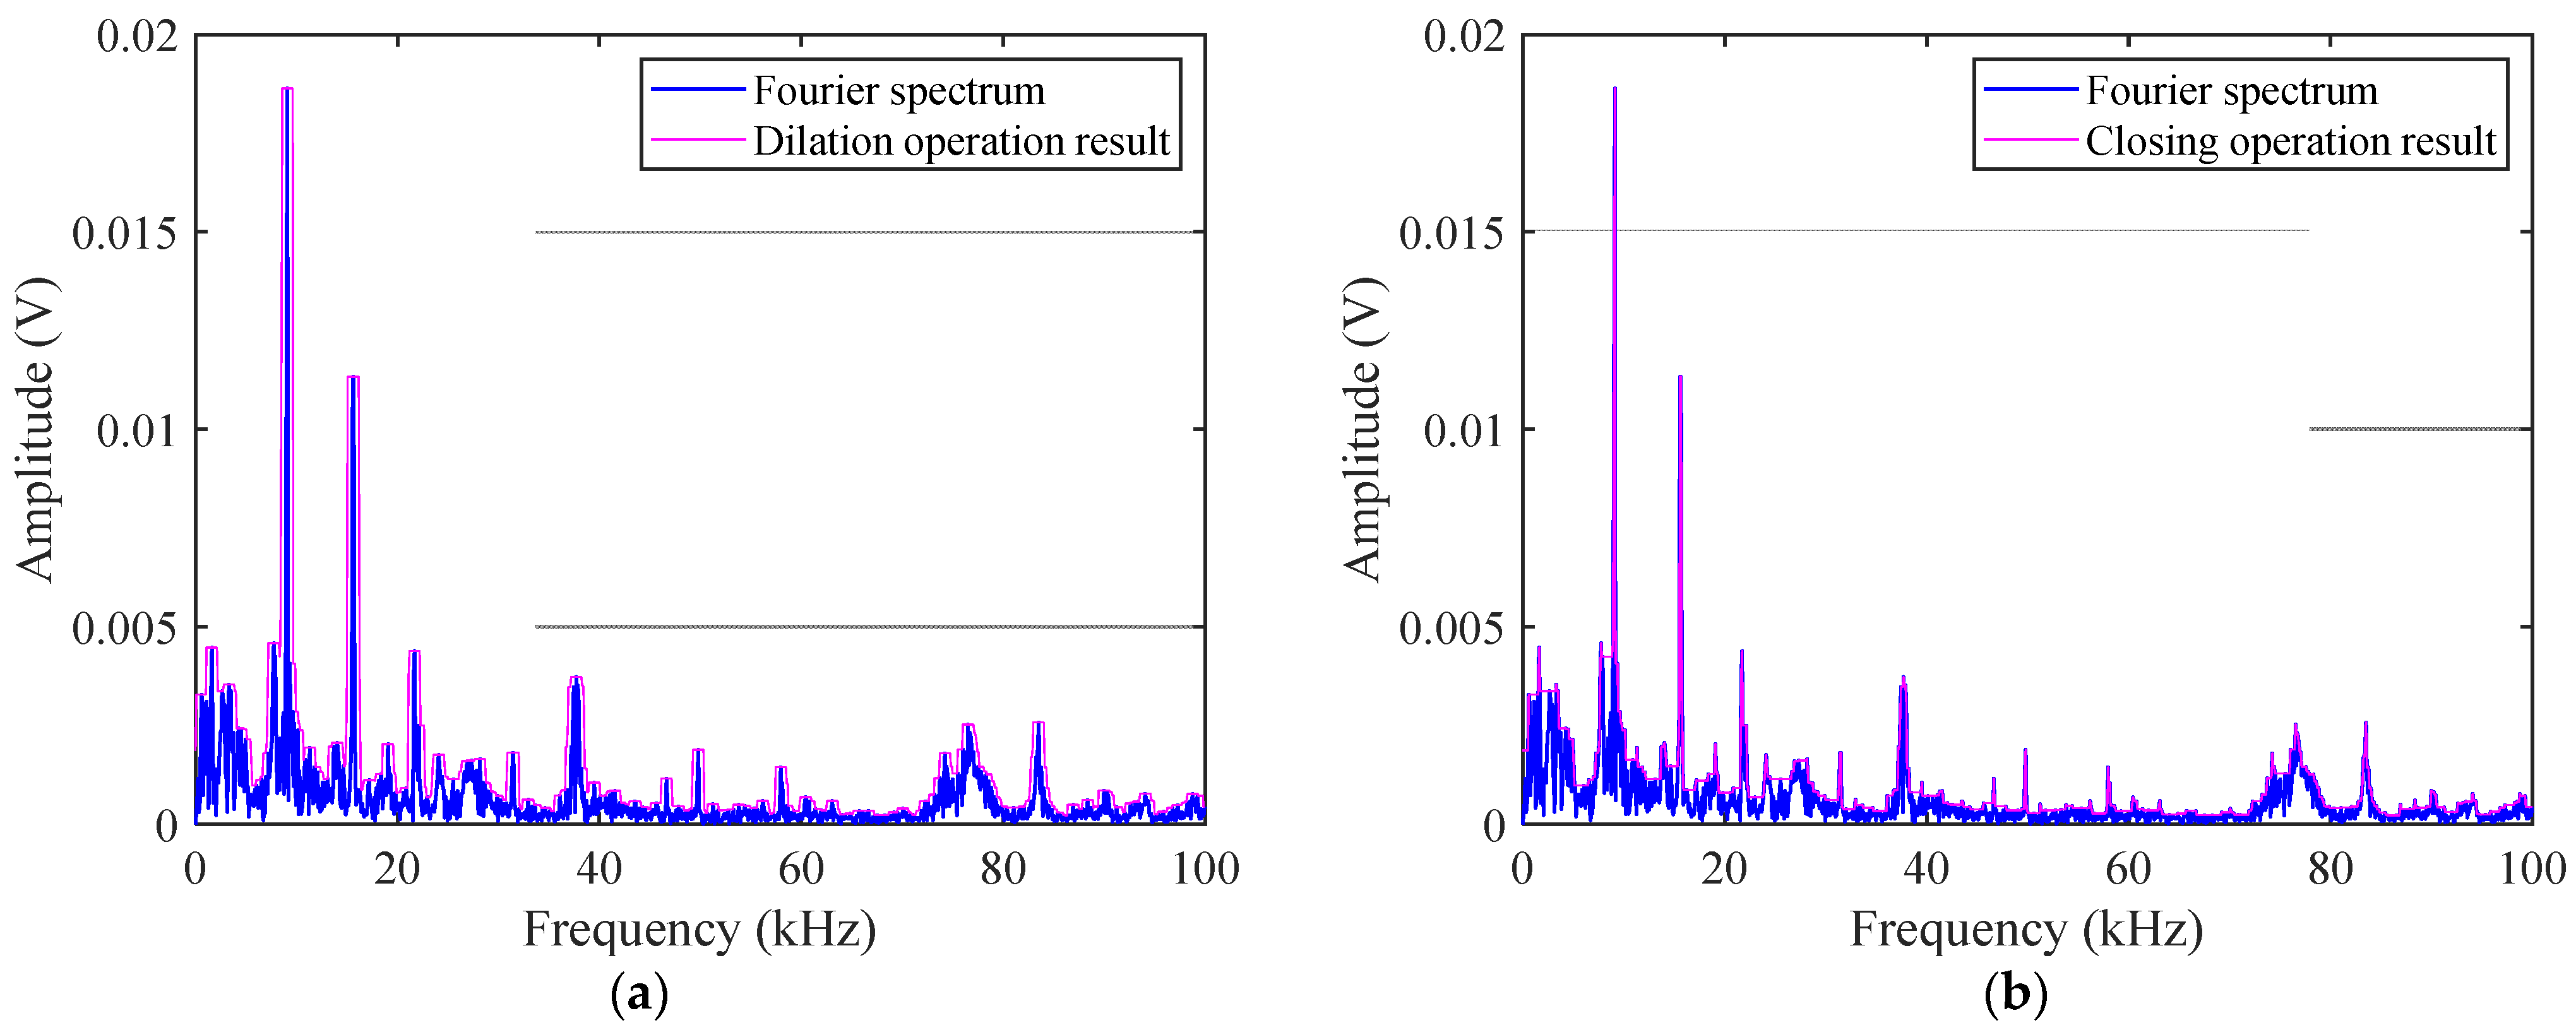
where pN is the sampling point number of the signal waveform; fs is the sampling frequency; and fd is the drawing frequency resolution. Specific parameters of the example EMR waveform are as follows: fs is 5 MHz, the duration of the intercepted EMR waveform is 11.749 ms (i.e., pN is 58745), and fd is 1 kHz. According to Equation (10), the window width B is six, ensuring that the local maxima existing in the frequency band of 1 kHz can be represented by one significant local maximum. The result of the dilation operation (i.e., the first step of the closing operation) is shown in Figure 2a. It can be seen that the adjacent local maxima are covered by the same value marked by the magenta curve, and the maximum width of the same value is 1 kHz, ensuring that any two significant local maxima with an interval bandwidth less than 1 kHz can be divided together into the same part of the Fourier axis. Figure 2b presents the result of the erosion operation after the dilation operation. Multiple maxima next to each other are represented by the same feature local maximum, which lays the foundation for dividing the Fourier axis into tightly supported segments with feature local maxima as the centers.

3.2.3. Adaptive Determination of Segment Number of Fourier Axis

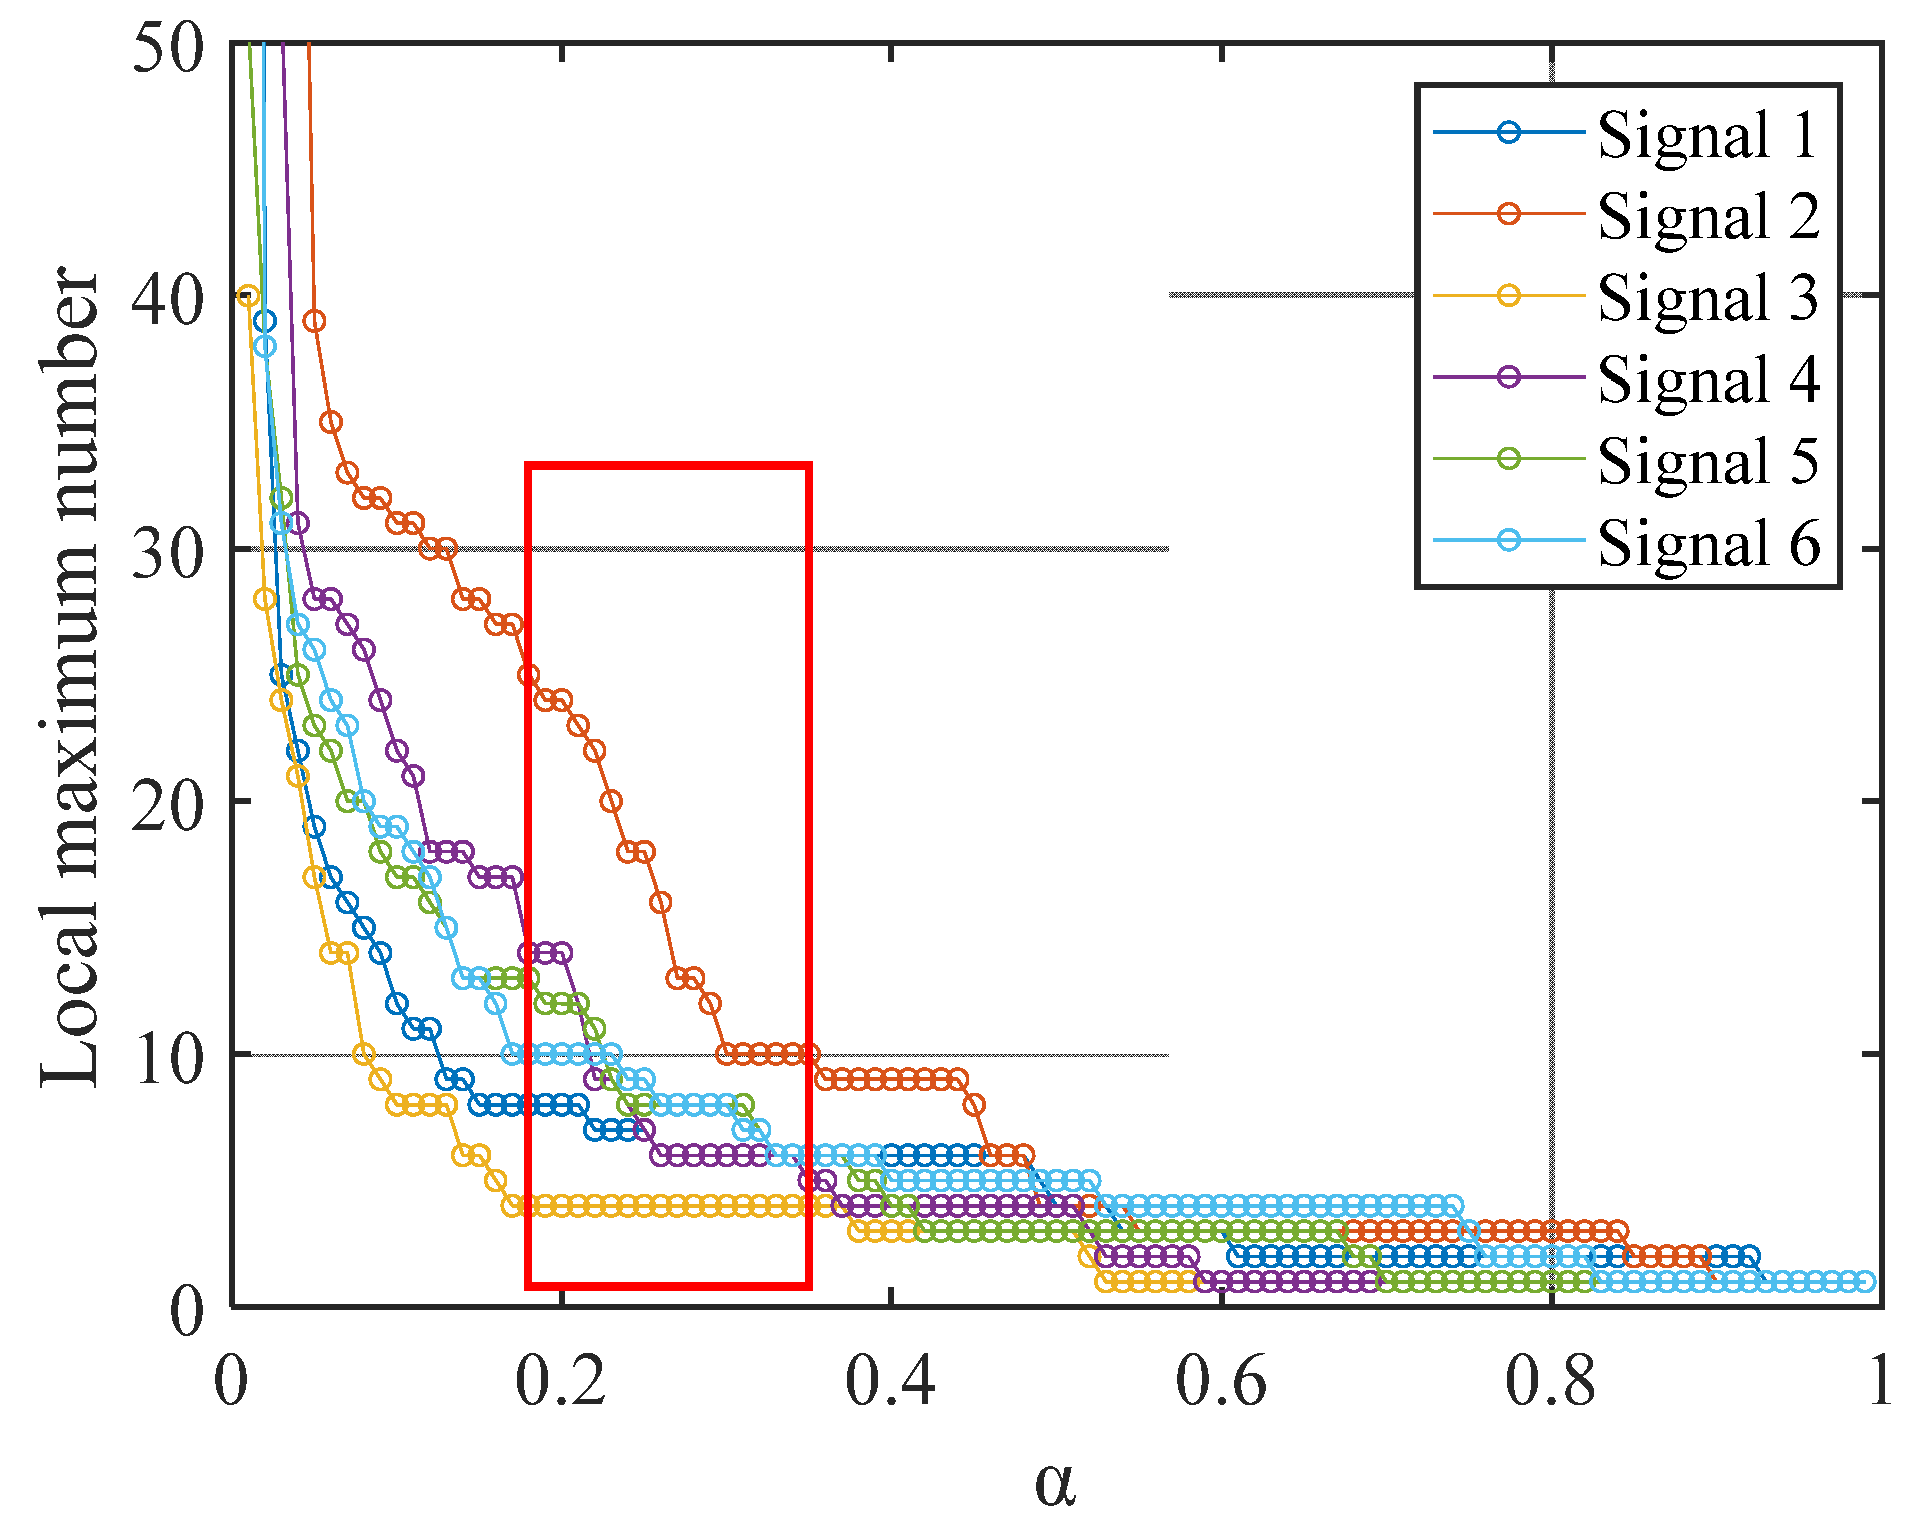
Based on the result of the closing operation with adaptively selected window width for the Fourier spectrum, the local maxima of the closing operation curve can be obtained. The threshold value used to count the number of local maxima participating in the Fourier axis segmentation can be obtained by MM + α(M1MM). The different values of α will raise the different thresholds and the different local maximum numbers. Figure 3 presents the variation in the local maximum numbers along with the different thresholds with α of 0.01, 0.02,..., and 0.99. With the increasing α, the number of the local maxima above the thresholds decreases rapidly at the beginning and then decreases slowly in a stepwise manner. Meanwhile, the local maxima number maintains constant on several consecutive points, implying that the EWT results are also constant. According to the variation characteristics of the local maxima number, we took the number of invariant points as five or six, in other words, during each calculation, the threshold value is calculated with α of 0.01, 0.02, …, 0.99, until there are five or six points on that the local maximum number that remain unchanged, and a value of α is obtained. As shown in the local area marked by the red box in Figure 3, the obtained value of α usually appears in 0.18–0.35, and the corresponding local maximum number in 4–10. In addition, if the number of the finally obtained local maxima above the threshold is less than five, while the number of the total local maxima is larger than five, the first five maxima (i.e., M1, …, M5) are forcibly selected to participate in the segmentation of the Fourier axis. The frequency points corresponding to these local maxima together with 0 and π provide a basis for Fourier axis segmentation.
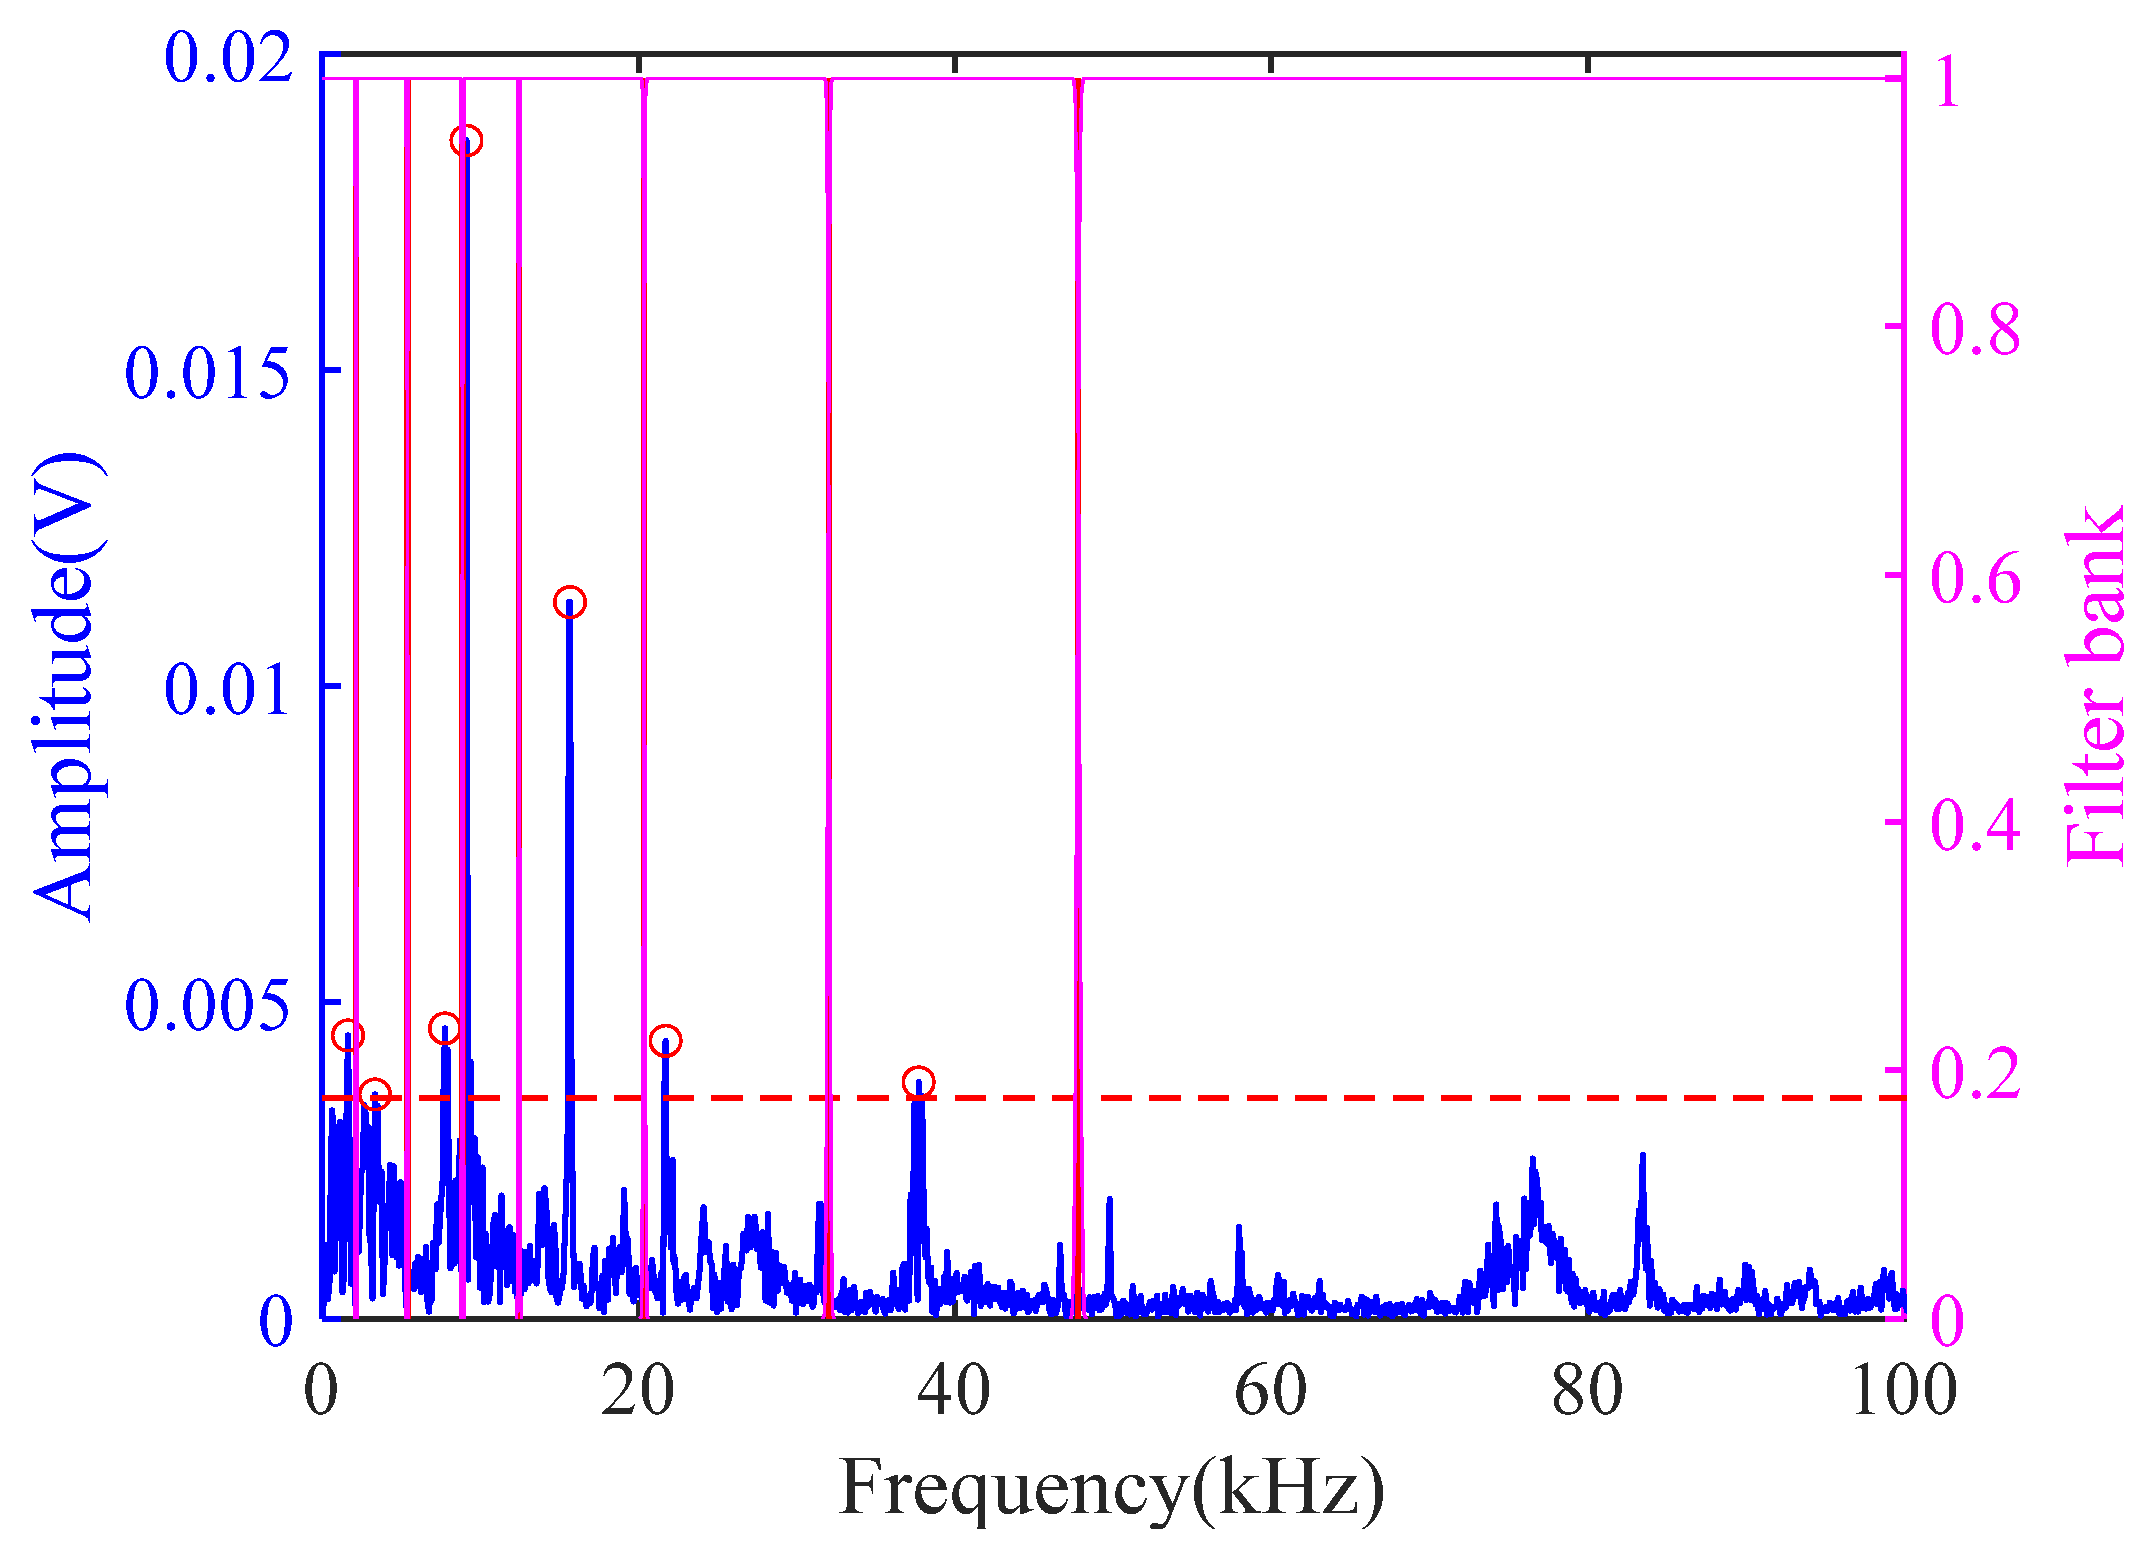
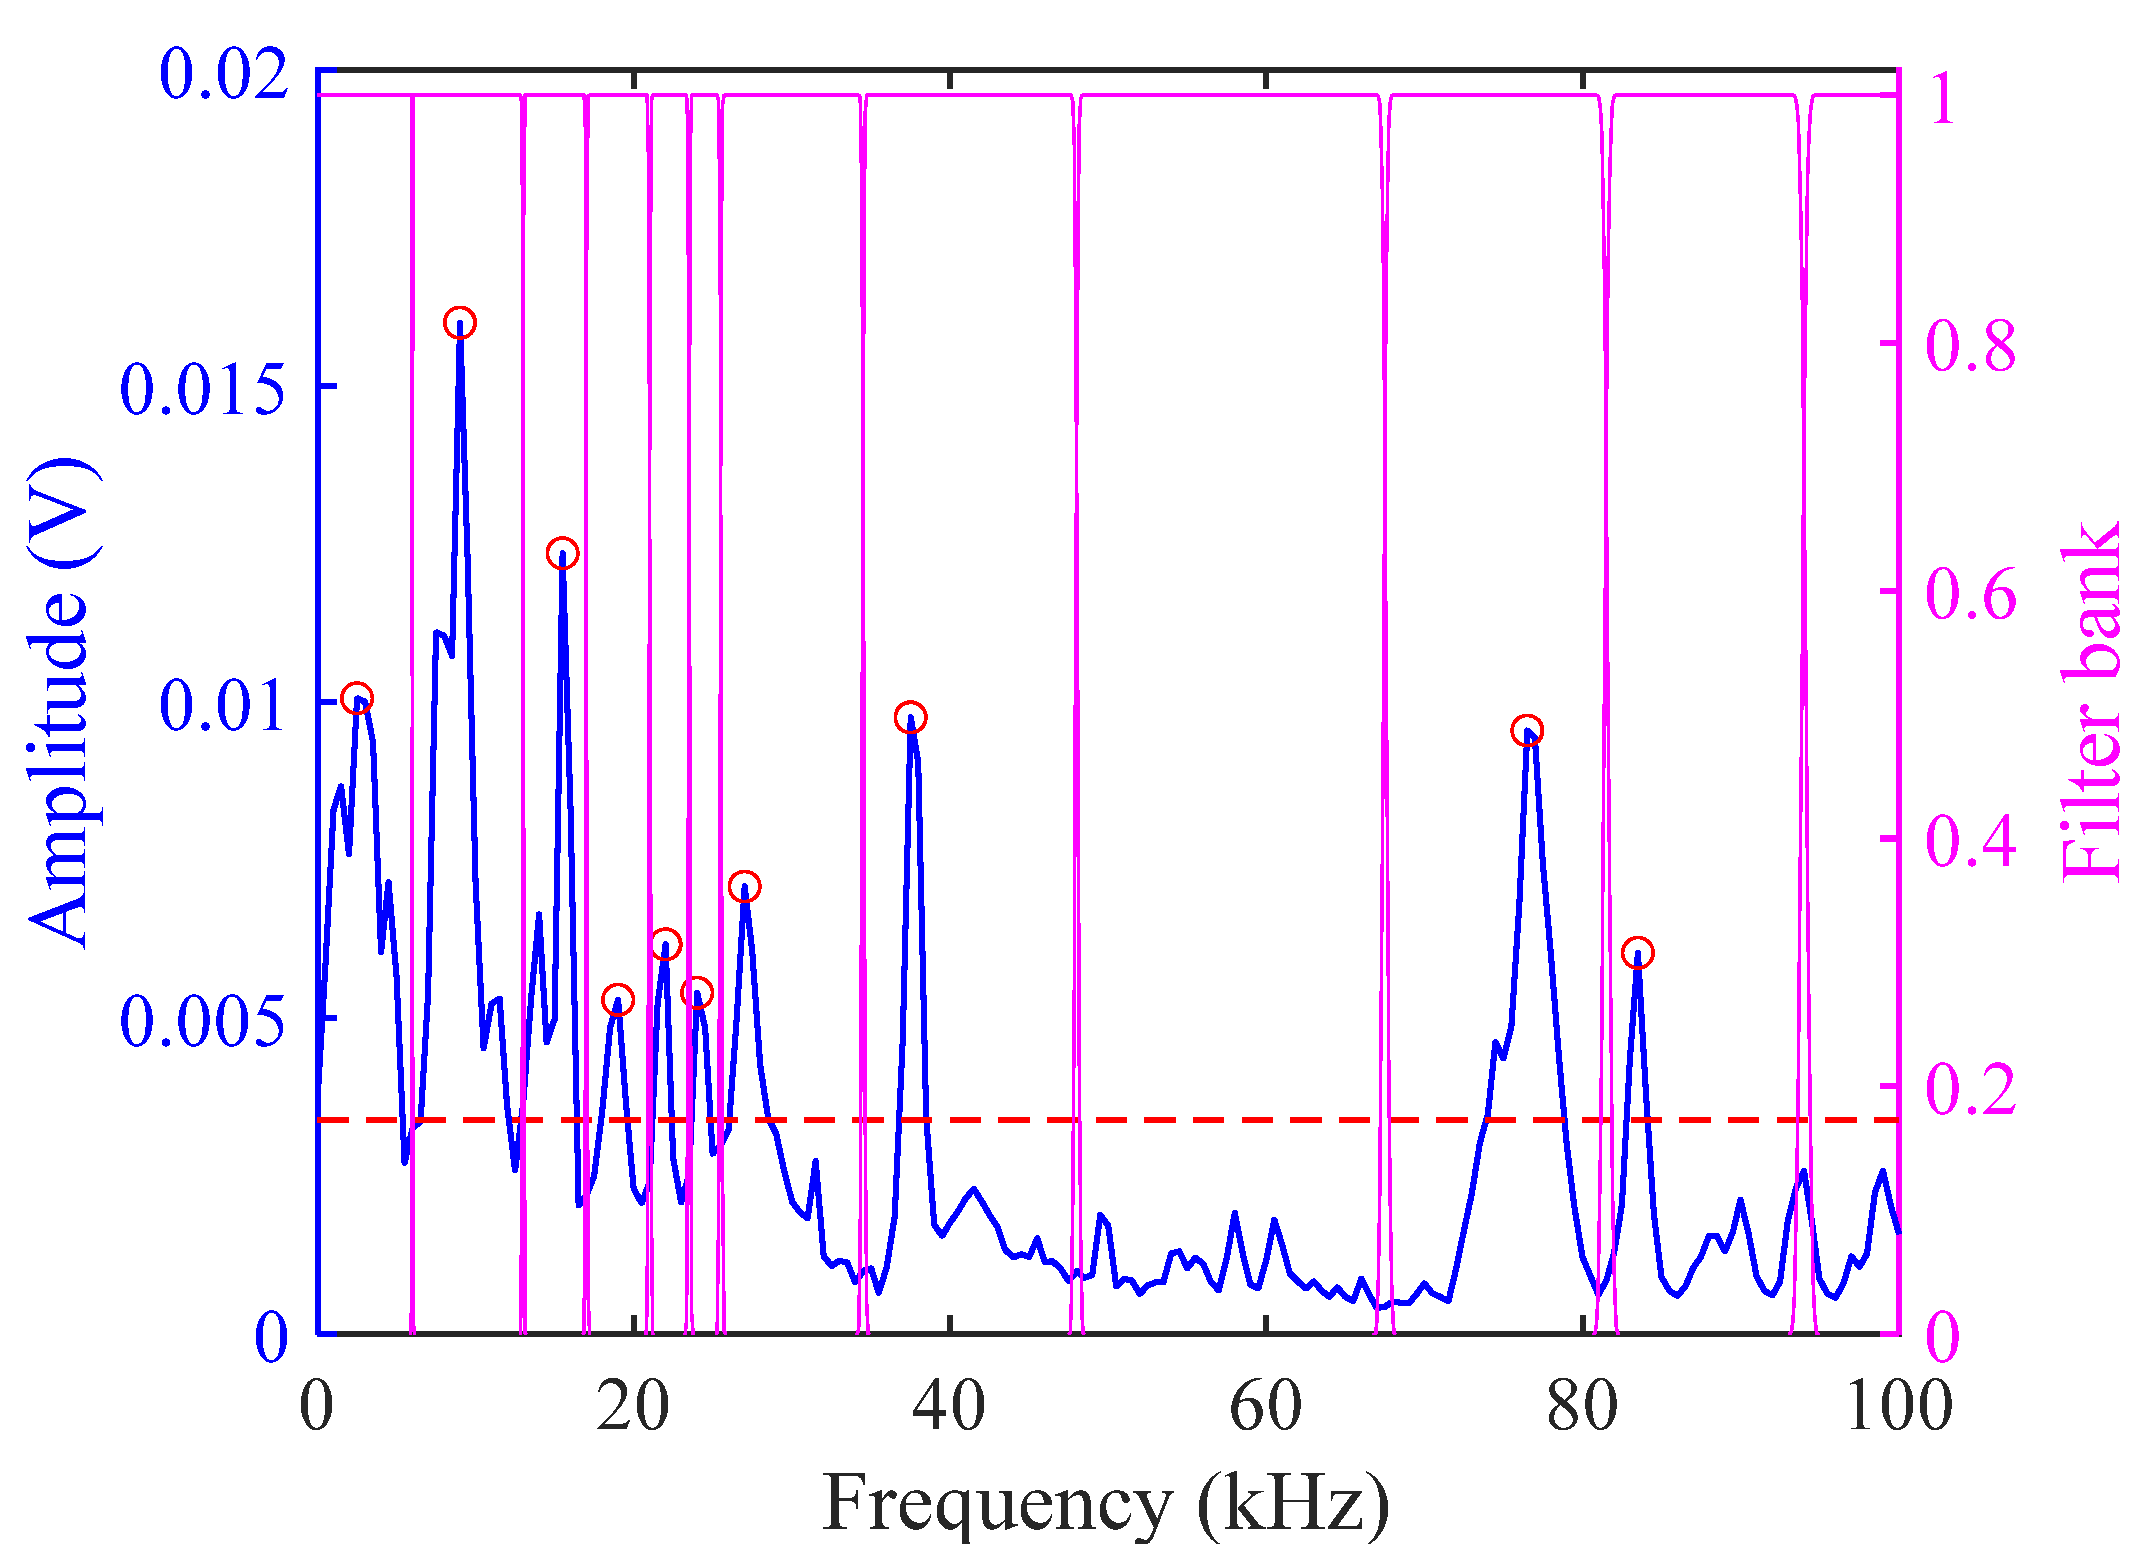
To minimize the influence of Fourier axis segmentation on EWT, the split point takes the local minimum value of the Fourier spectrum of the area corresponding to the intersection of the middle 3/5 area of two adjacent frequency points and the local minimum values of the closing operation result. If there is no intersection, the local minimum value of the Fourier spectrum of the 3/5 area is taken as the split point. In addition, (1) if the closing operation curve rises monotonically between 0 and the first frequency point, this section will not be divided; (2) to ensure that the component corresponding to the last obtained local maximum is decomposed pertinently, this frequency point plus 10 times the drawing frequency resolution (i.e., 10 kHz) serves as a split point; (3) between the frequency of this split point and π, the midpoint of these two frequency points is taken as a split point. Thus, in general, if there are n local maxima, the final Fourier axis will be divided into n + 2 or n + 3 segments. For the Fourier axis of the example EMR waveform, MM, M1, and α are 0.0186 V, 0.1519 mV, and 0.18, respectively, so the threshold is 0.0035 V, as shown by the red dotted line in Figure 4. The number of local maxima larger than the threshold is seven, and then the Fourier axis is divided into nine segments corresponding to nine filter banks, as shown by the magenta lines in Figure 4. Compared with the result of the conventional Fourier axis segmentation shown in Figure 1b, the segmentation result shown in Figure 4 avoids the phenomenon that the adjacent local maxima are improperly separated. Moreover, the segmentation lines all lie on the local minimum values of the segments of the Fourier spectrum, and keep a distance of at least 1/5 of the segment width from the local maxima, minimizing the adverse impact of Fourier axis division on the signal time–frequency analysis.

3.2.4. Decomposition of EMR Waveform

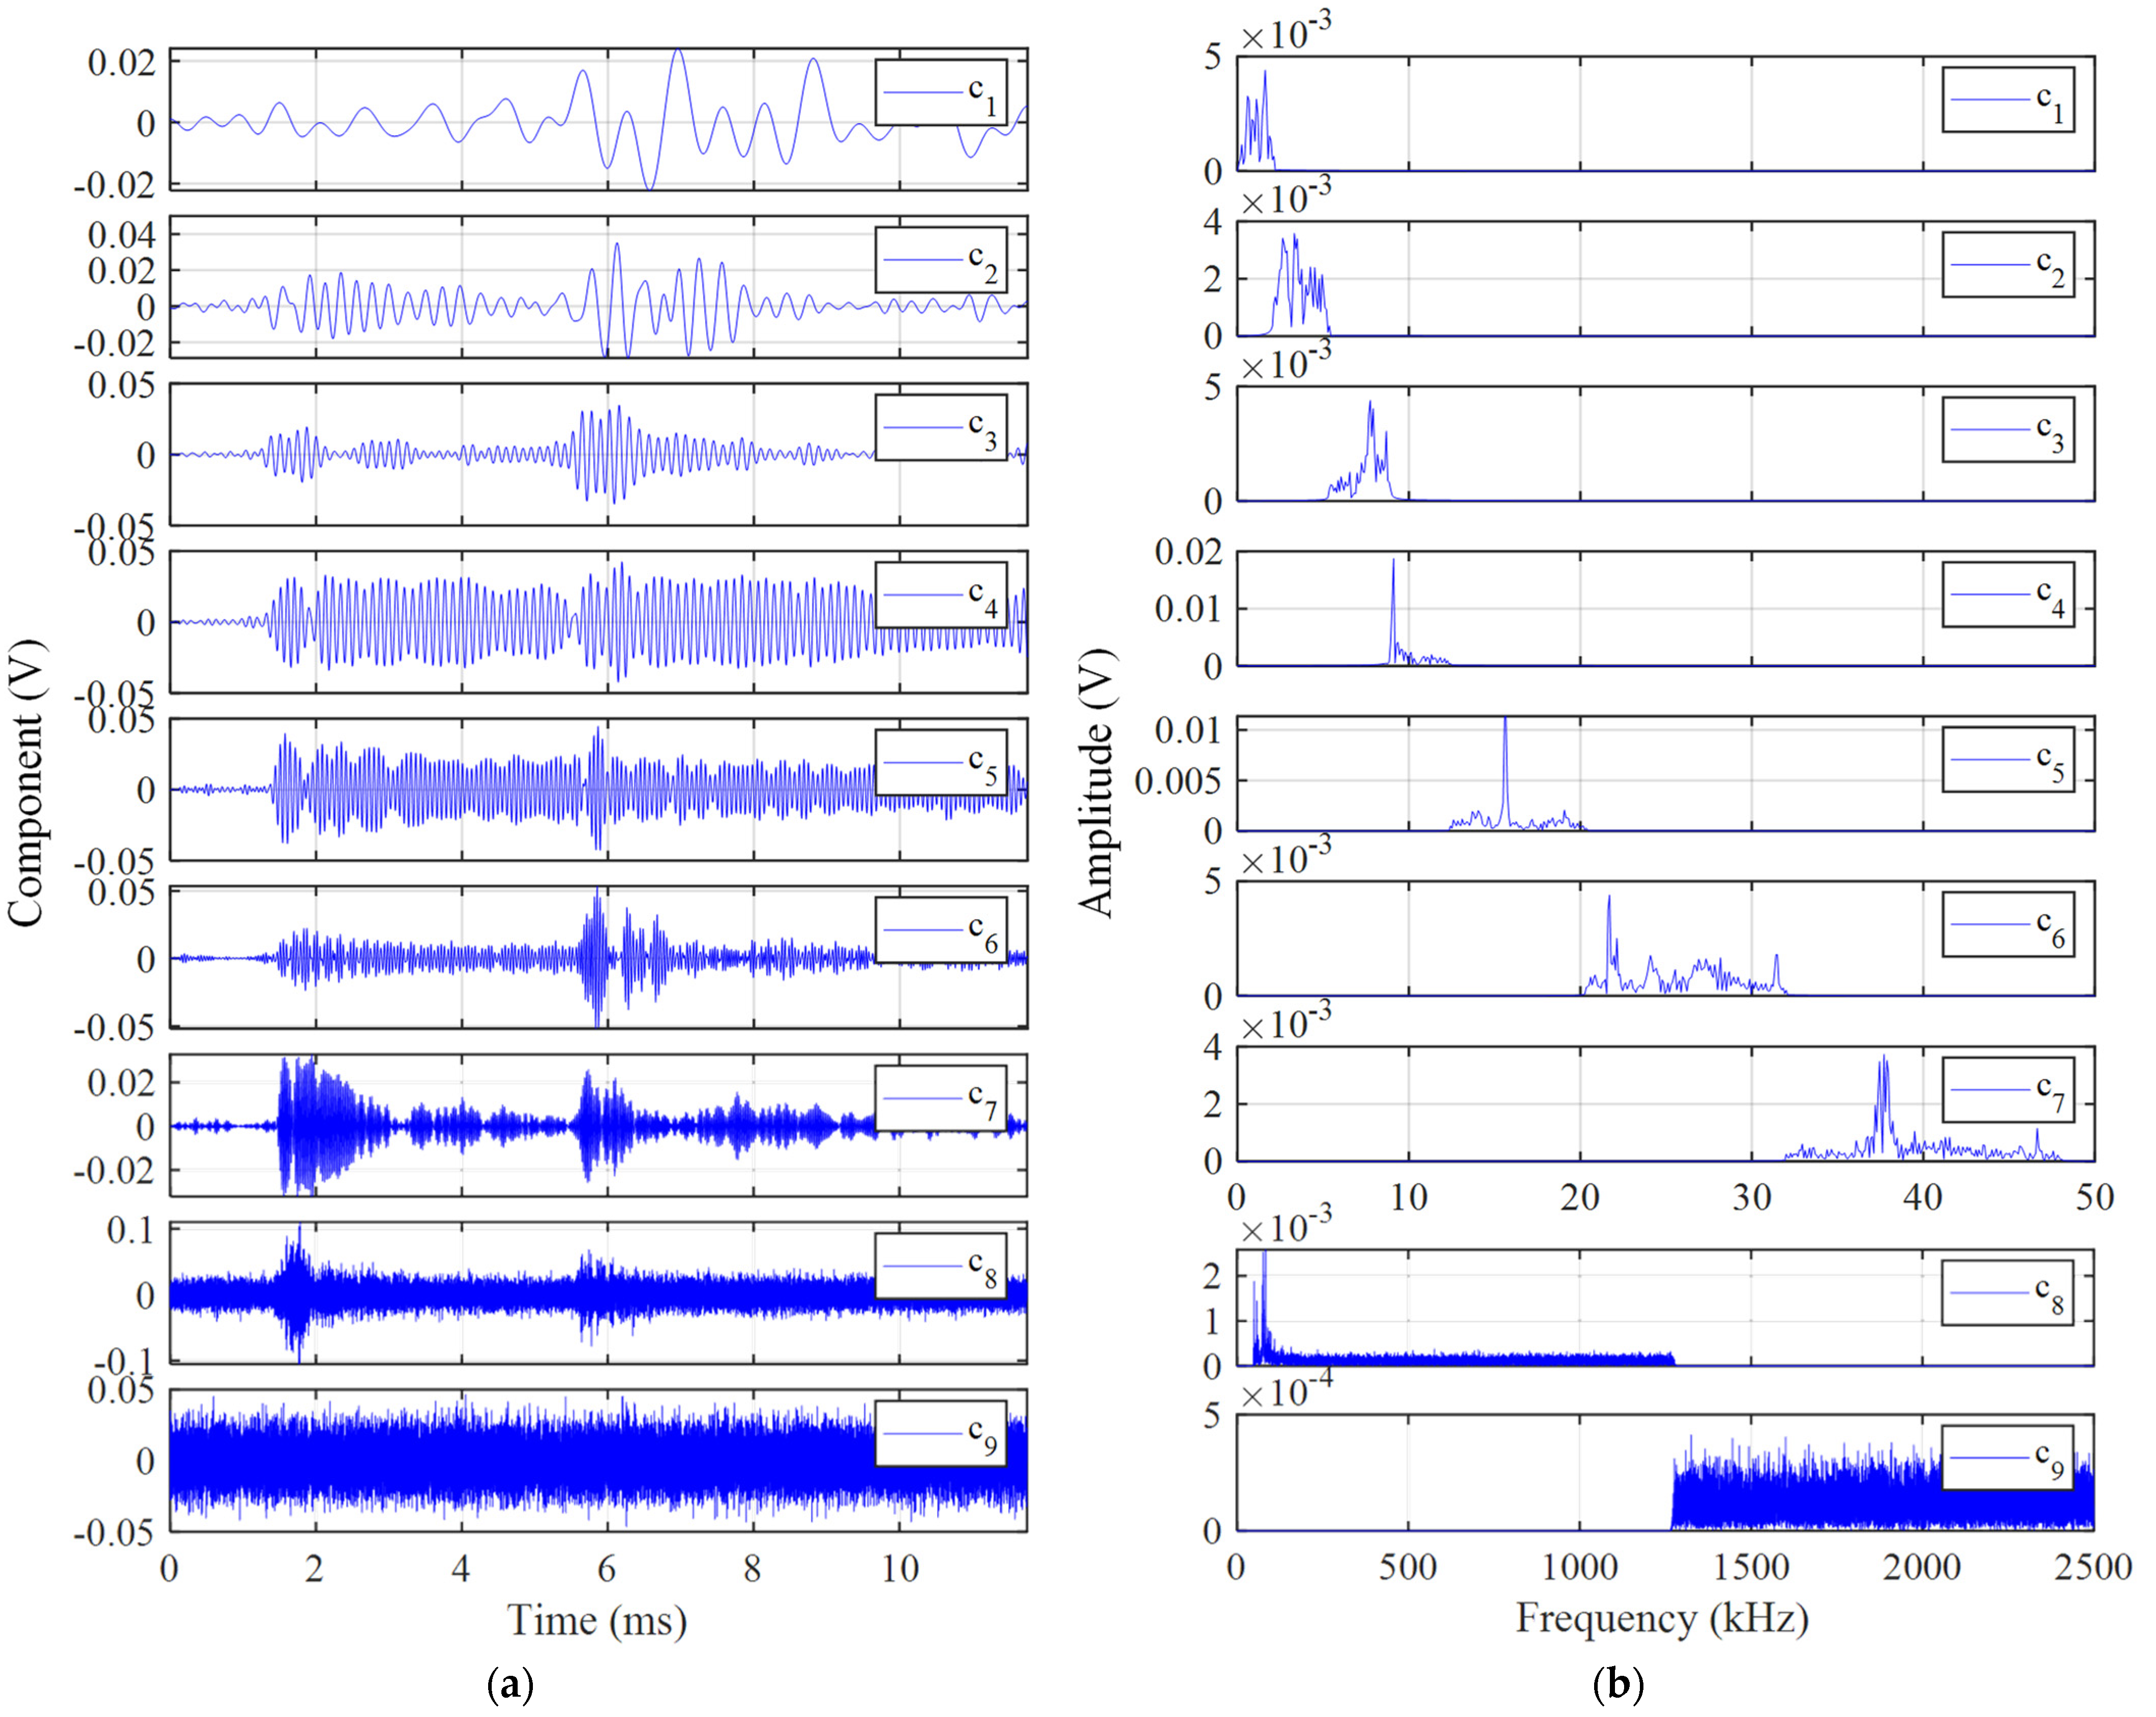
Based on the filter banks shown in Figure 4, the example EMR waveform is decomposed into nine components (i.e., c1, c2, …, c9), as shown in Figure 5a. These components fluctuate uniformly on the time domain, and the fluctuation amplitude suddenly increases when the effective signal appears, indicating that the frequency they contain is relatively single. Figure 5b presents the Fourier spectra of these nine components. The Fourier spectrum of each component was exactly the segmented Fourier spectrum shown in Figure 4, and there was no modal aliasing phenomenon among these nine components in the frequency domain. However, it is noteworthy that the c8 component still contained a strong effective signal component that has not been extracted. The Hilbert spectrum of the example EMR waveform was obtained via HT, as shown in Figure 6. Except for the c8 component, each component rarely appeared in mode aliasing, and the high amplitude frequency band was relatively concentrated, which can clearly describe the time–frequency evolution characteristics below 42 kHz.
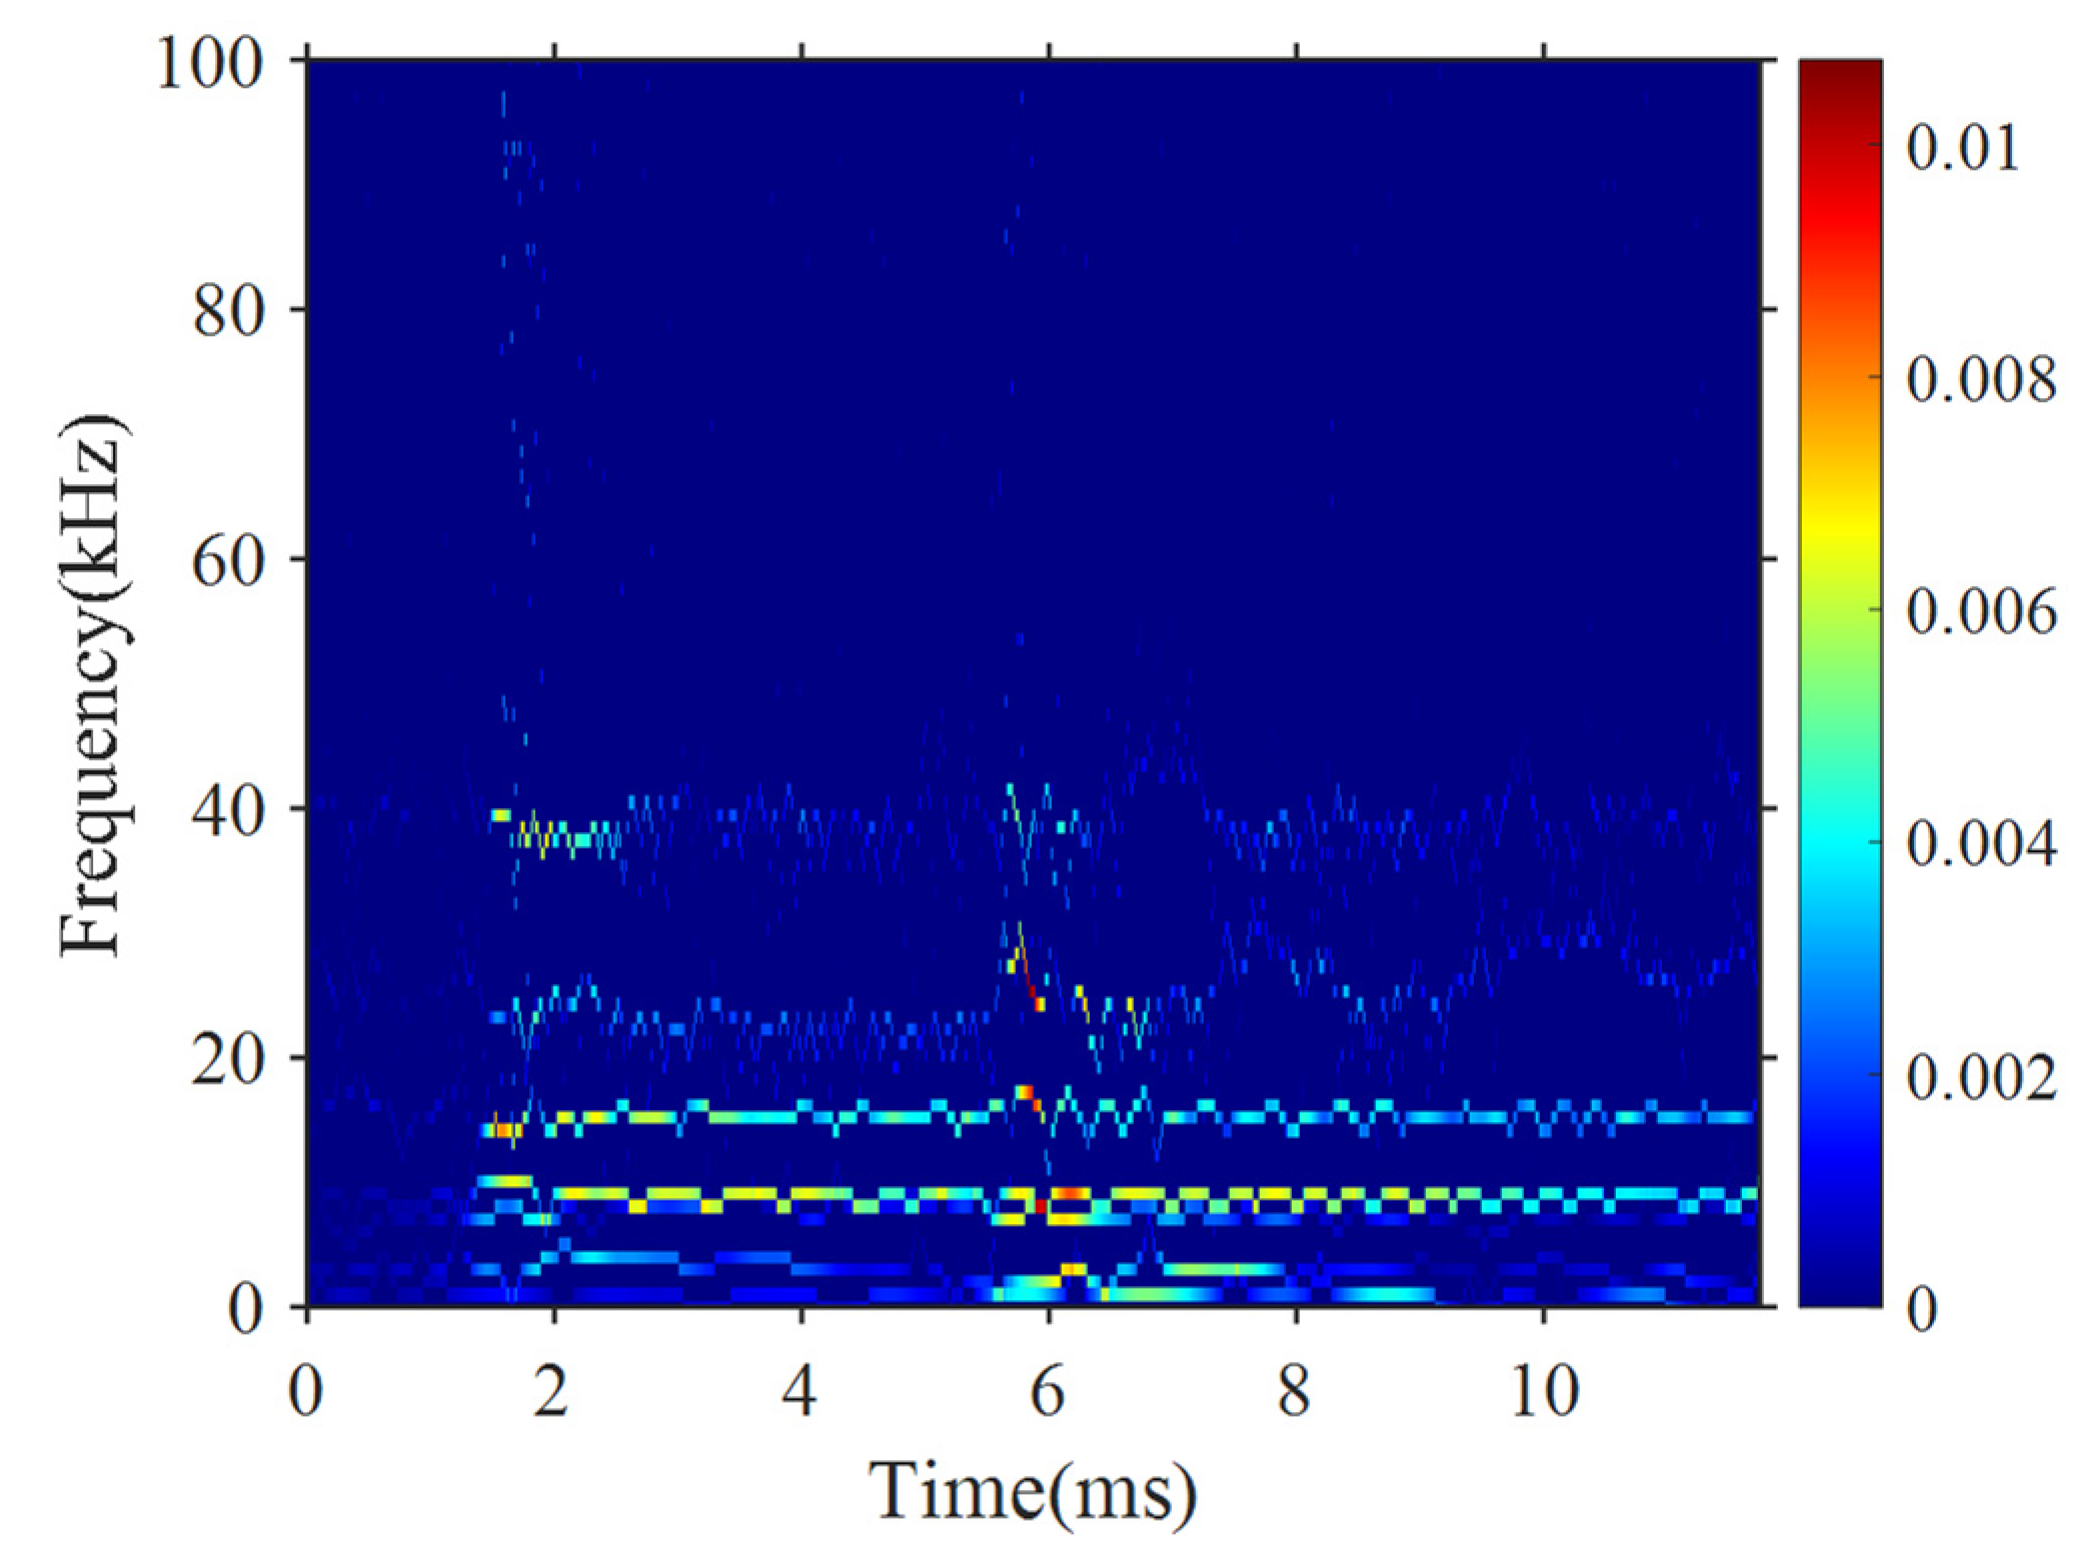
Figure 7 presents the time–frequency spectrum of the example EMR waveform obtained by STFT. The STFT adopts Hamming window with a window width of 1 ms (i.e., 5000 sampling points), the window sliding step size is 1 μs (i.e., five sampling points), and the signal length participating in DFT of STFT is 1 ms, so the frequency resolution of the spectrum is 1 kHz. Comparing Figure 6 and Figure 7, it can be seen that the components around 77.0 kHz and 83.5 kHz were not effectively decomposed by EWT. This is because the 77.0 kHz and 83.5 kHz frequency points were not effectively segmented in the Fourier axis, but were together segmented into c8, as shown in Figure 4. The deeper reason is that the object of DFT is the whole waveform, so the Fourier spectrum has no time dimension. However, the actual EMR waveform often has some frequency components, with high amplitudes appearing for a short time. Although the amplitudes are relatively large, the amplitudes of the frequency points are still relatively small in the Fourier spectrum, making it difficult to separate the short–time high amplitude frequency components based on the Fourier spectrum obtained by DFT.

3.2.5. Fourier Axis Segmentation Based on STFT and Closing Operation

To solve the problem that short–time high amplitude frequency components cannot be well extracted, the segmentation method of the Fourier axis was further improved, and an adaptive segmentation method of the Fourier axis based on STFT and closing operation is proposed. First, the time–frequency spectrum is obtained by STFT, and the frequency resolution of STFT is half of the final drawing frequency resolution of the time–frequency spectrum obtained by EWT–HHT. In this example, the frequency resolution of STFT shall be 0.5 kHz, that is, the Hamming window width and the signal length participating in DFT shall be 2 ms (i.e., 10,000 sampling points). The maximum amplitude corresponding to each frequency point is obtained based on the time–frequency spectrum of STFT, as shown in Figure 8. Compared with the Fourier spectrum obtained by DFT shown in Figure 4, the local maximum amplitudes of components around 2.5 kHz, 19 kHz, 24 kHz, 27 kHz, 77.0 kHz, and 83.5 kHz, as shown in Figure 8, increased significantly. For the Fourier axis obtained by STFT, the closing operation was performed with the window width B = 1, according to the method mentioned in Section 3.2.3, MM, M1, and α were 0.0160 V, 0.8070 mV, and 0.17, respectively, so the threshold was 0.0034 V. The number of the local maxima above the threshold was 10, as shown by the red circles in Figure 8. In the Fourier axis segmentation, sometimes two adjacent local maximum frequencies were far apart. Taking 37.5 kHz and 77.0 kHz, as shown in Figure 8, as an example, if only one split point is set between them according to Section 3.2.3, these components decomposed by EWT will be mixed with other low–amplitude components to some extent, which is not conducive for presenting the evolution characteristics of high–amplitude frequency components. Therefore, to better divide the Fourier axis, if the split point is more than 10 times the drawing frequency resolution (i.e., 10 kHz) from the adjacent frequency of local maximum, a new split point is forcibly added at the position of 10 kHz from the adjacent frequency point. As a result, there are two split lines between 37.5 kHz and 77.0 kHz, and this Fourier axis is divided into 13 segments. The split lines and filter banks below 100 kHz are shown in Figure 8.
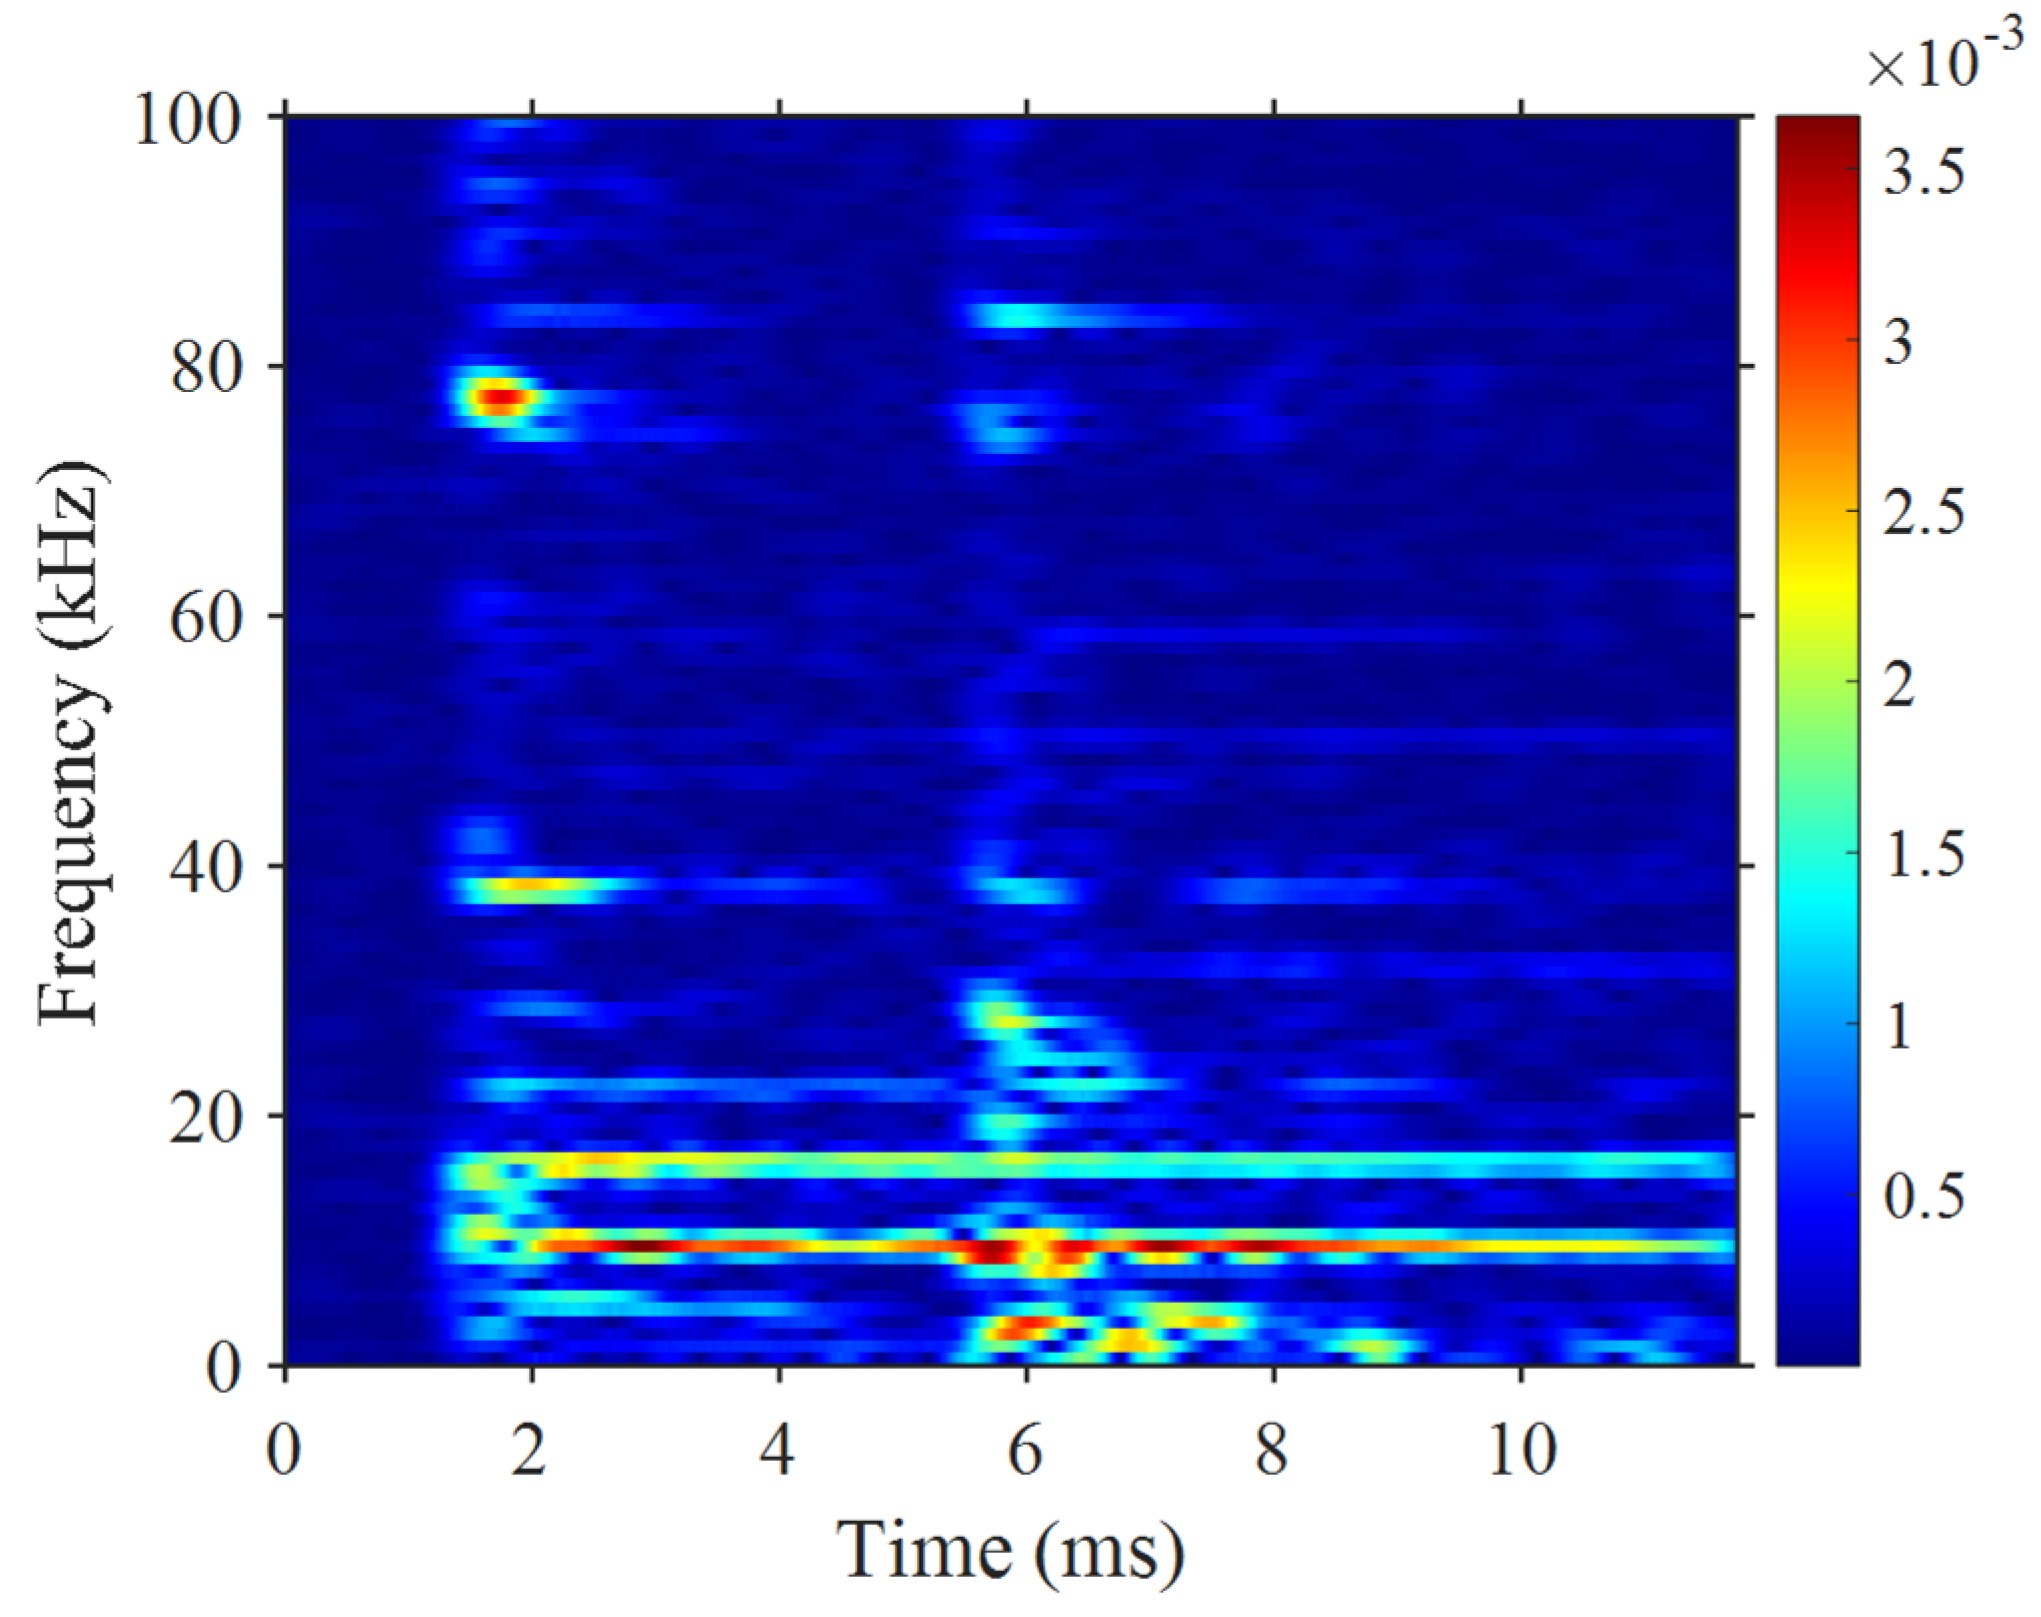
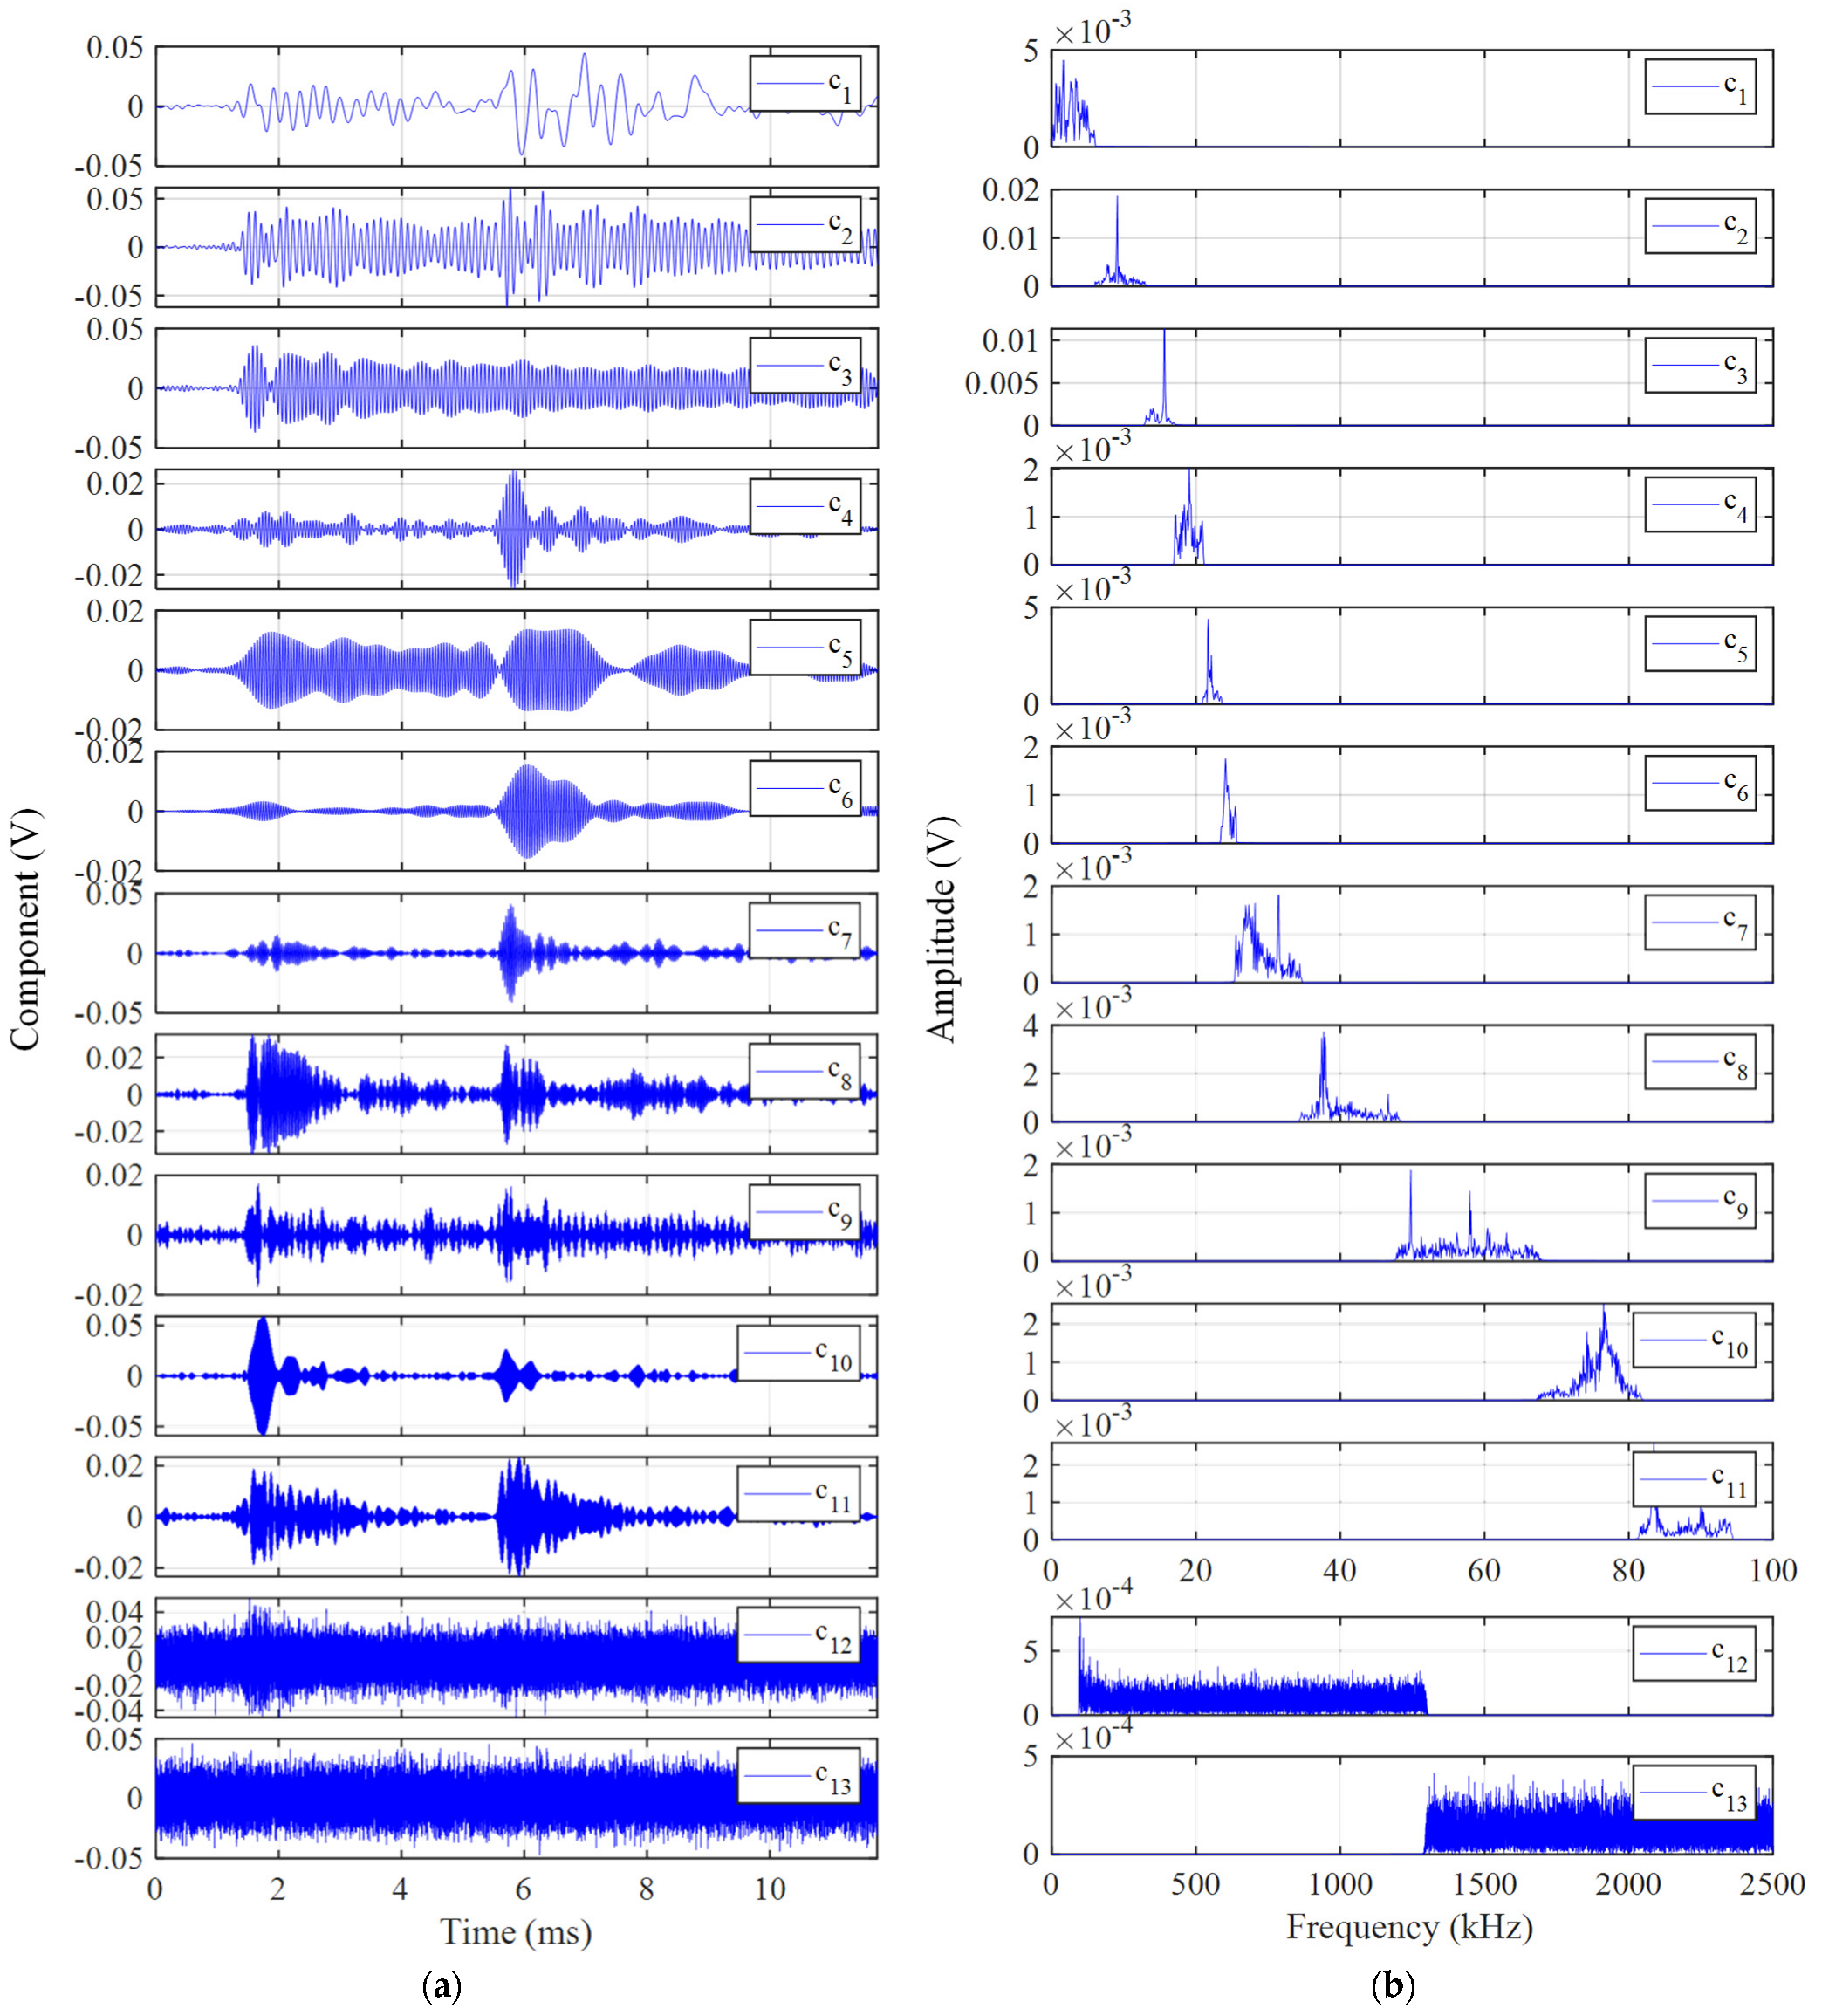
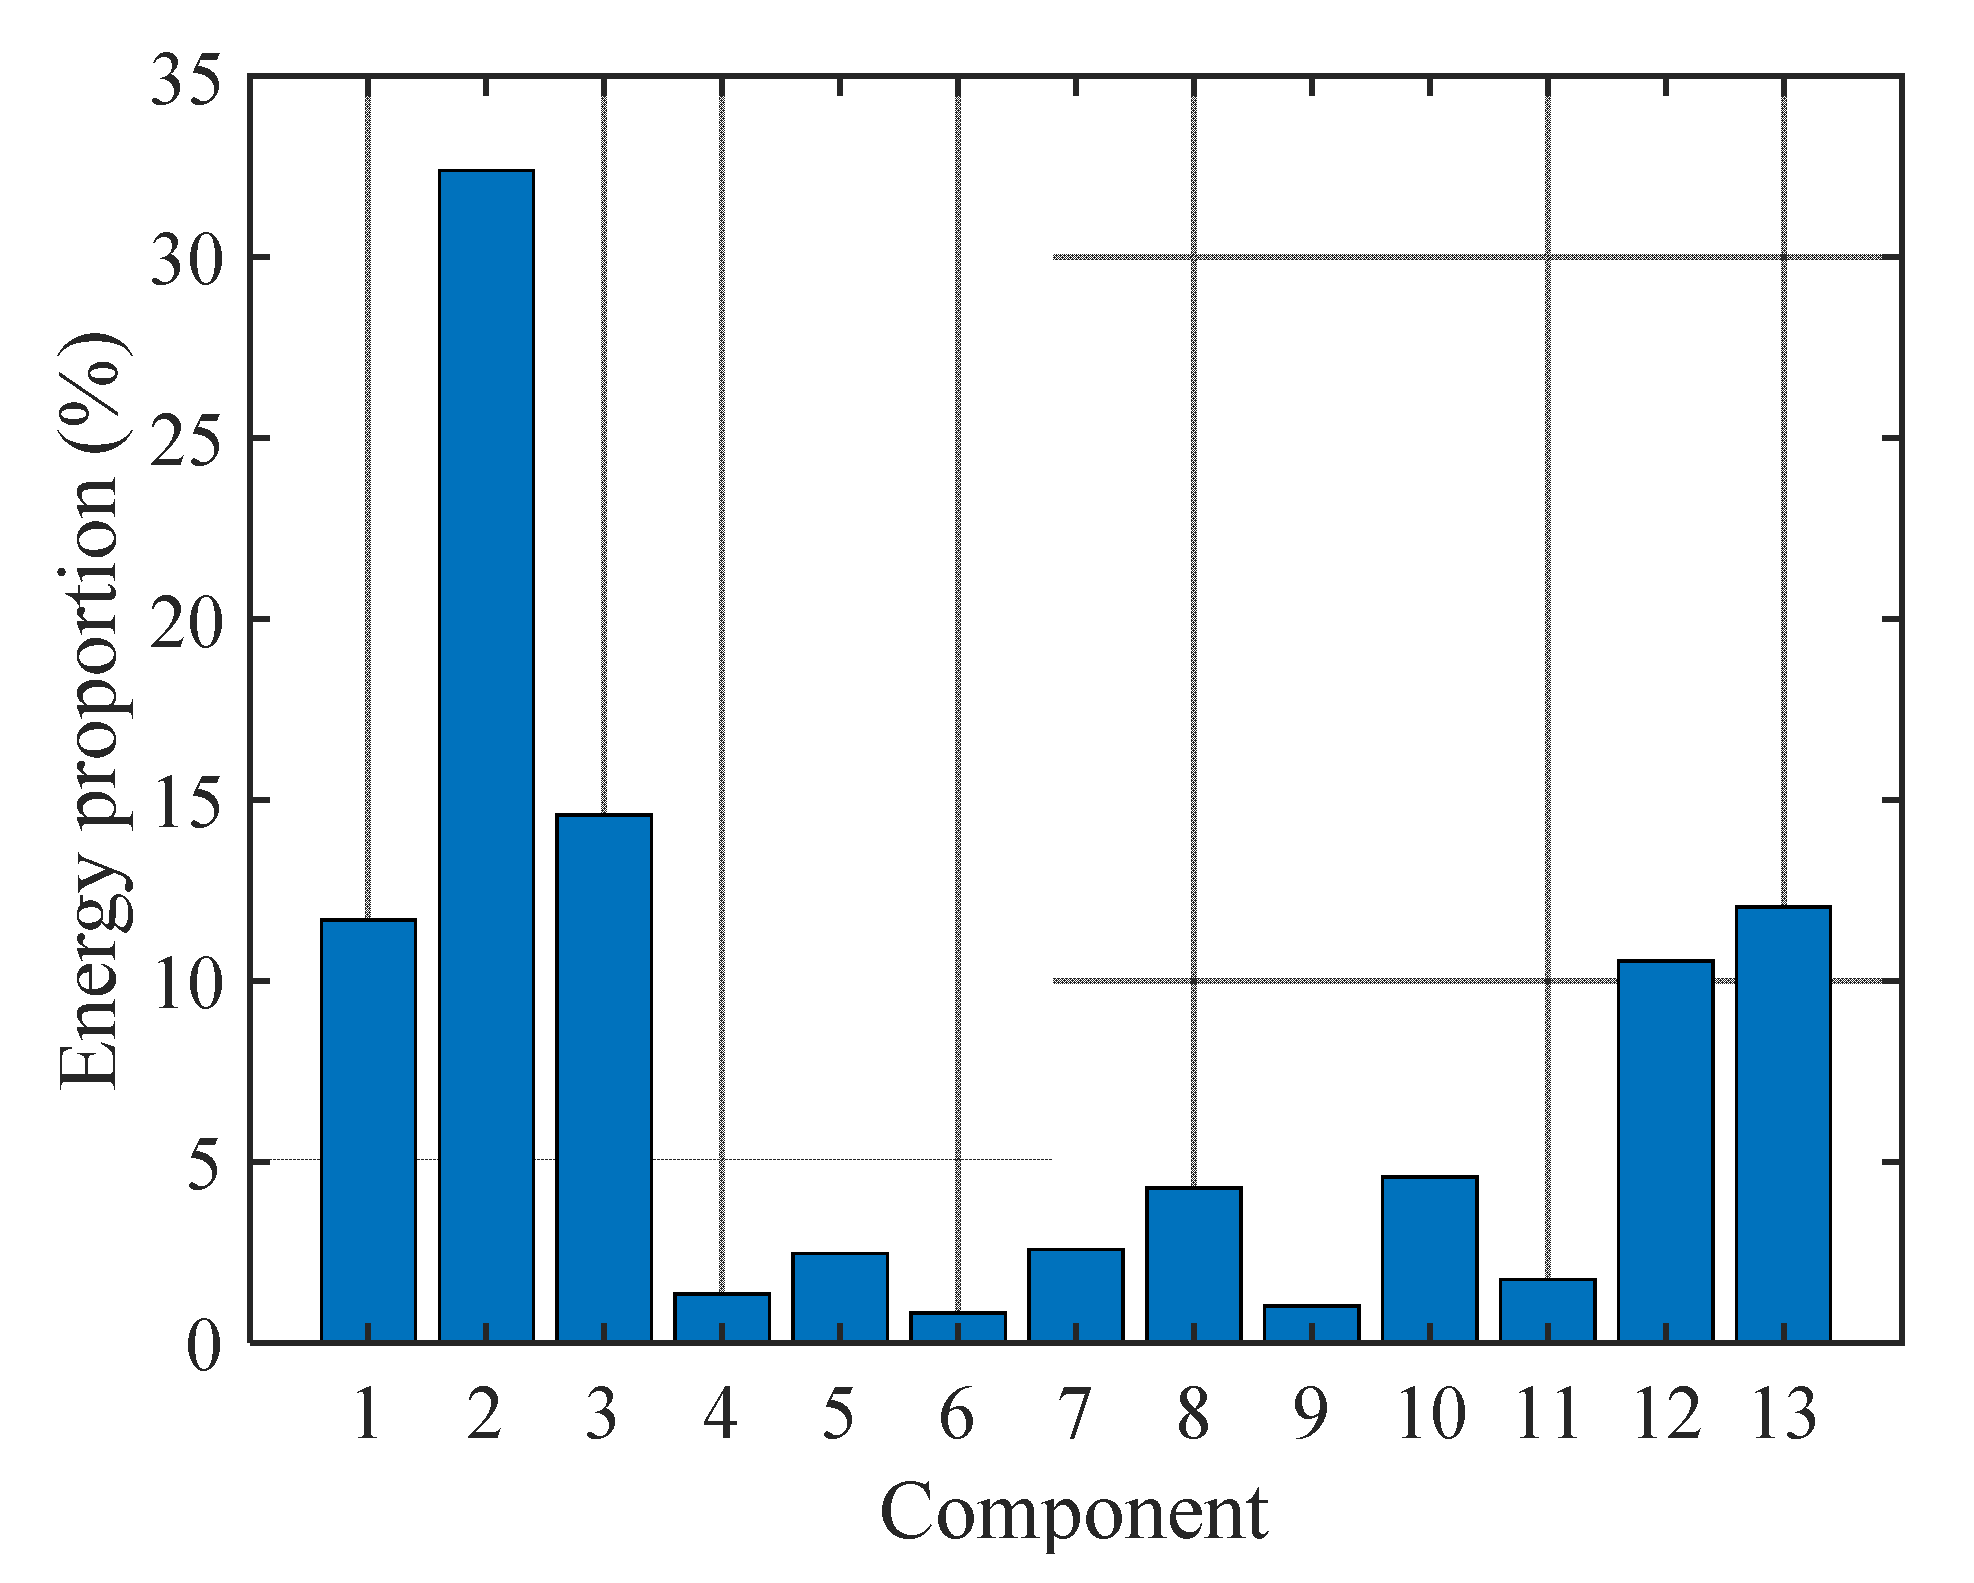
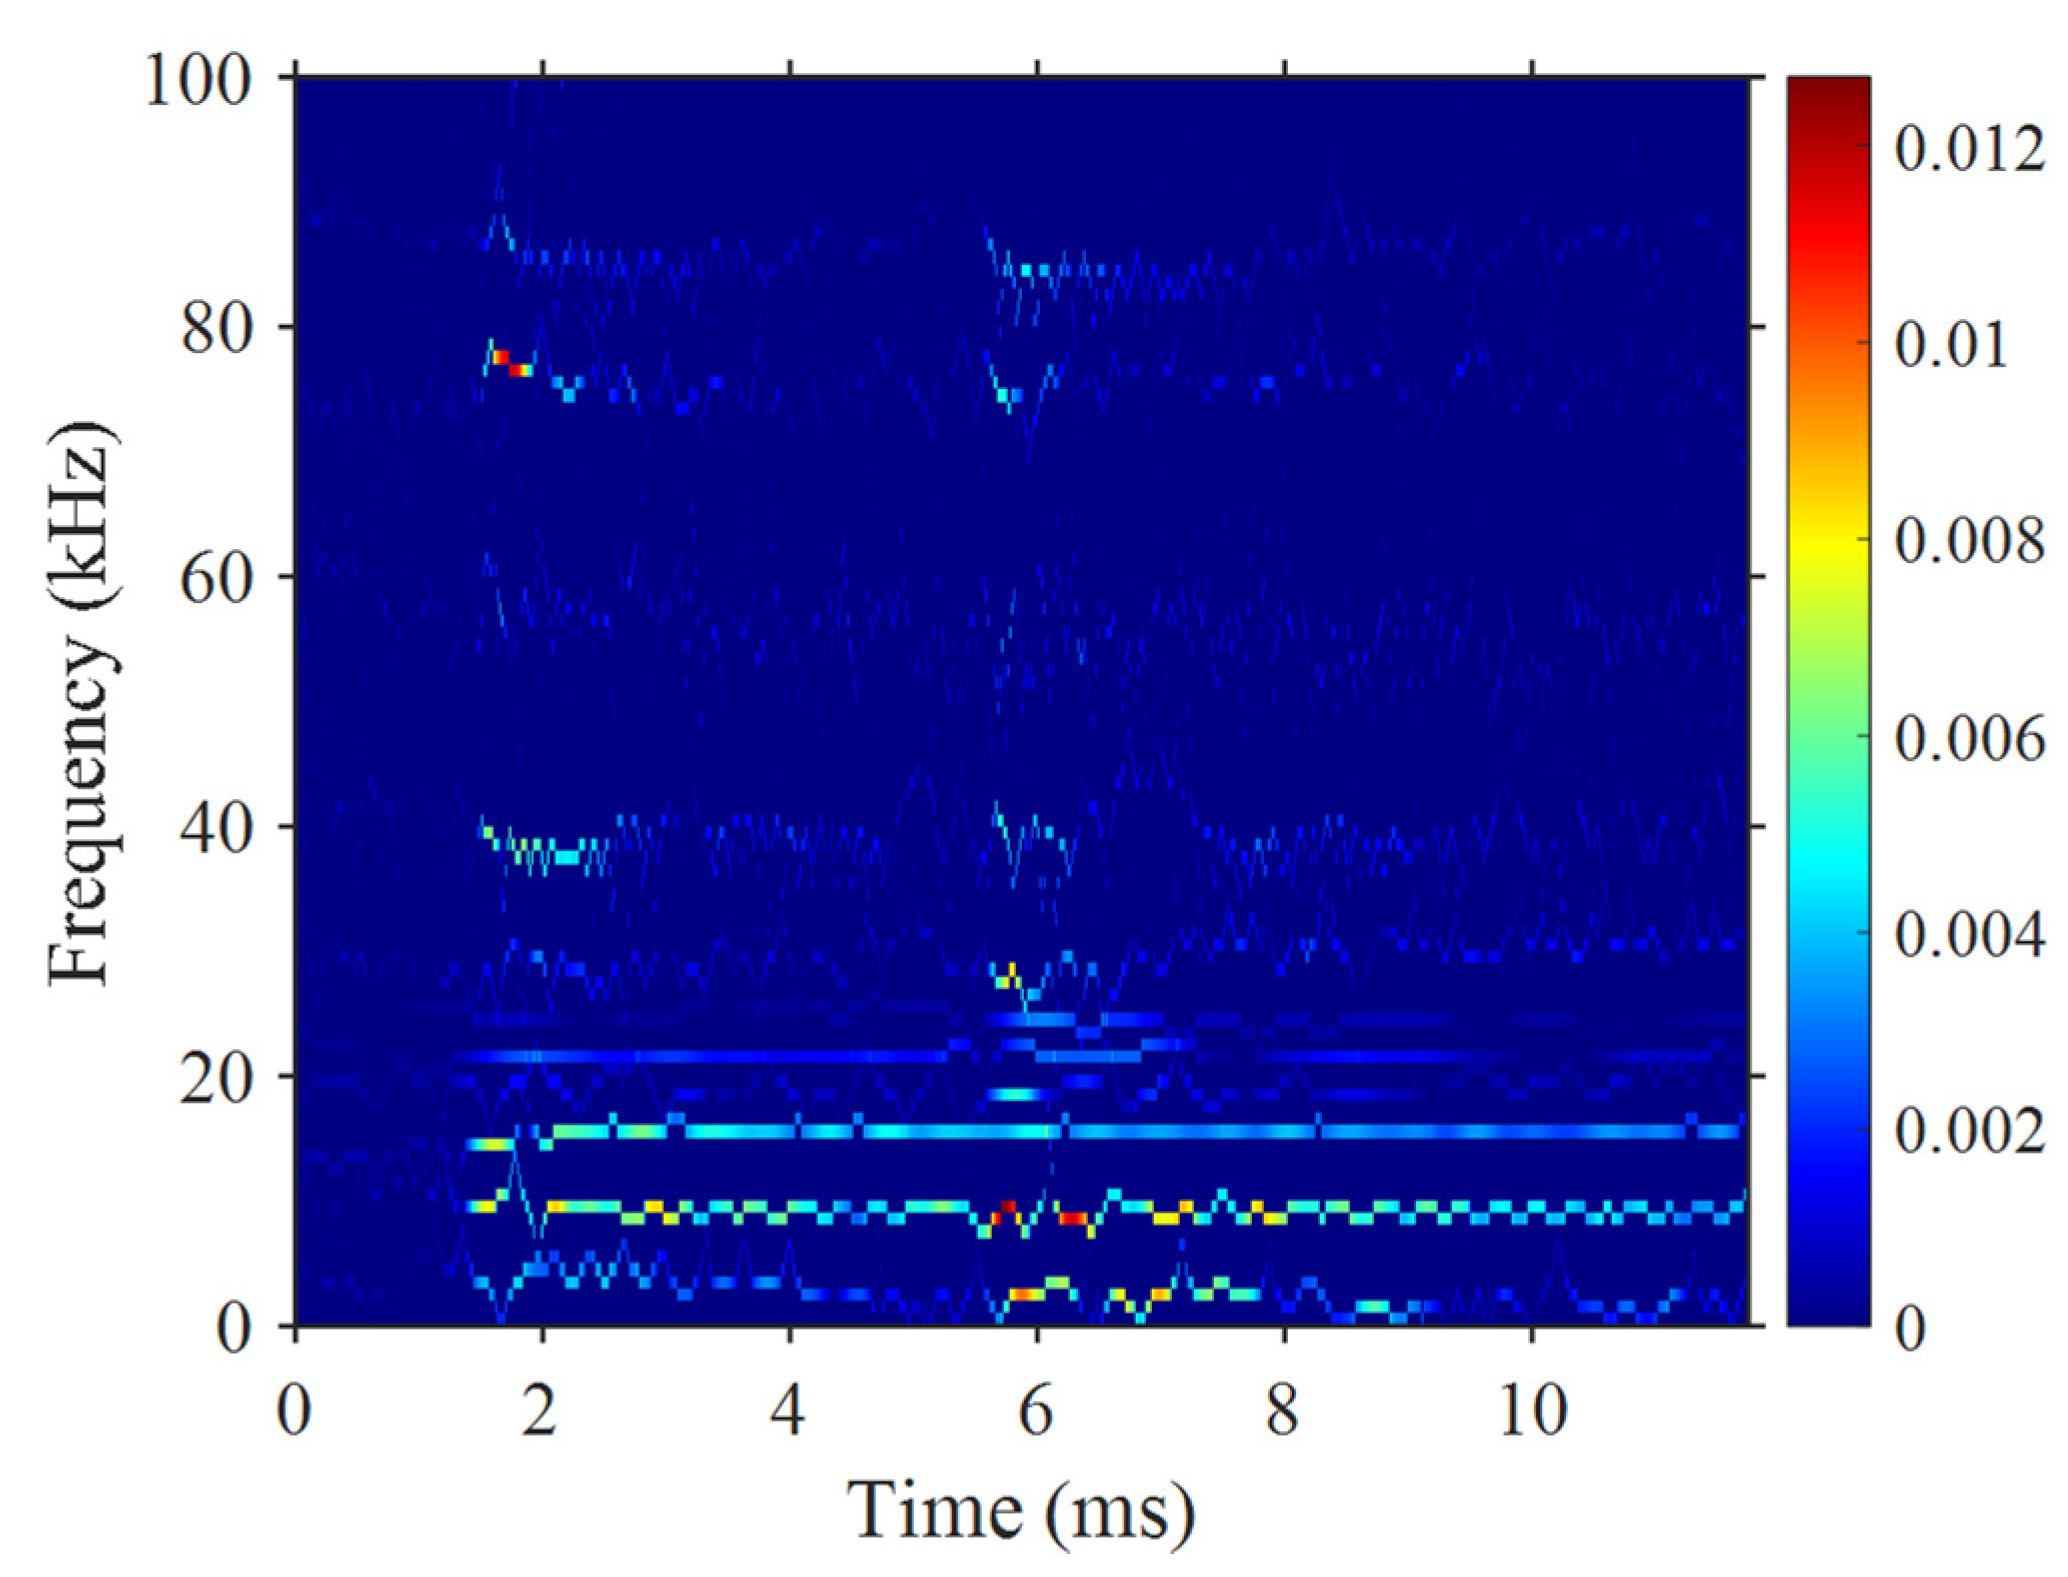
Figure 9a shows the 13 components of the EMR waveform decomposed by EWT based on STFT and closing operation, and Figure 9b shows the Fourier spectrum of each decomposed component. The Fourier spectra do not overlap others, and the combination of these Fourier spectra is exactly the Fourier spectrum of the entire EMR waveform. Compared with Figure 5b, the component of 34–94 kHz was reasonably divided into c8c11, therefore the components around 77.0 kHz and 83.5 kHz with short–time high amplitude fluctuation characteristics are well divided into different components. In addition, the intensities of c12, shown in Figure 9a, and c8, shown in Figure 5a, were 0.0513 V and 0.1101 V, respectively, and the maximum amplitudes of the Fourier spectra of these two components were 7.64 × 10⁻⁴ V and 2.53 × 10⁻³ V, respectively, indicating that the effective component of the EMR waveform was properly decomposed. Figure 10 presents the energy proportions of the 13 components. The frequency bands of c12 and c13 on the Fourier axis were 94–1.3 MHz and 1.3–2.5 MHz, respectively, and their widths were relatively larger. Therefore, even though the amplitudes of c12 and c13 were small, the total energies were still relatively large, accounting for 10.5% and 12.0%, respectively. Except for c12 and c13, the energy proportions of c1, c2, and c3 with the frequency bands of 0–6 kHz, 6–13 kHz, and 13–17 kHz were 11.7%, 32.4%, and 14.6%, respectively, which were significantly larger than that of other components. As shown in Figure 9a, c1, c2, and c3 not only had large amplitudes but also long durations, and almost throughout the entire effective waveform, which is consistent with the presented evolution characteristics of the time–frequency spectrum shown in Figure 11. The components around 77.0 kHz and 83.5 kHz were decomposed effectively into c10 and c11 with the frequency bands of 67.5–81.5 kHz and 81.5–94.0 kHz, respectively. As shown in Figure 9a, c10 and c11 contained the typical short–time high amplitude fluctuation, and their energy proportions were 4.6% and 1.7%, respectively. Compared to Figure 6, Figure 11 well describes the short–time high amplitude fluctuation characteristics of the components around 77.0 kHz and 83.5 kHz. Comparing Figure 7 and Figure 11, the time–frequency spectrum obtained by EWT–HT was more refined than that obtained by STFT in both the frequency and time resolutions.

4. EWT–HT Application in Time–Frequency Analysis for EMR Waveform of Rock Fracture

4.1. Experimental System

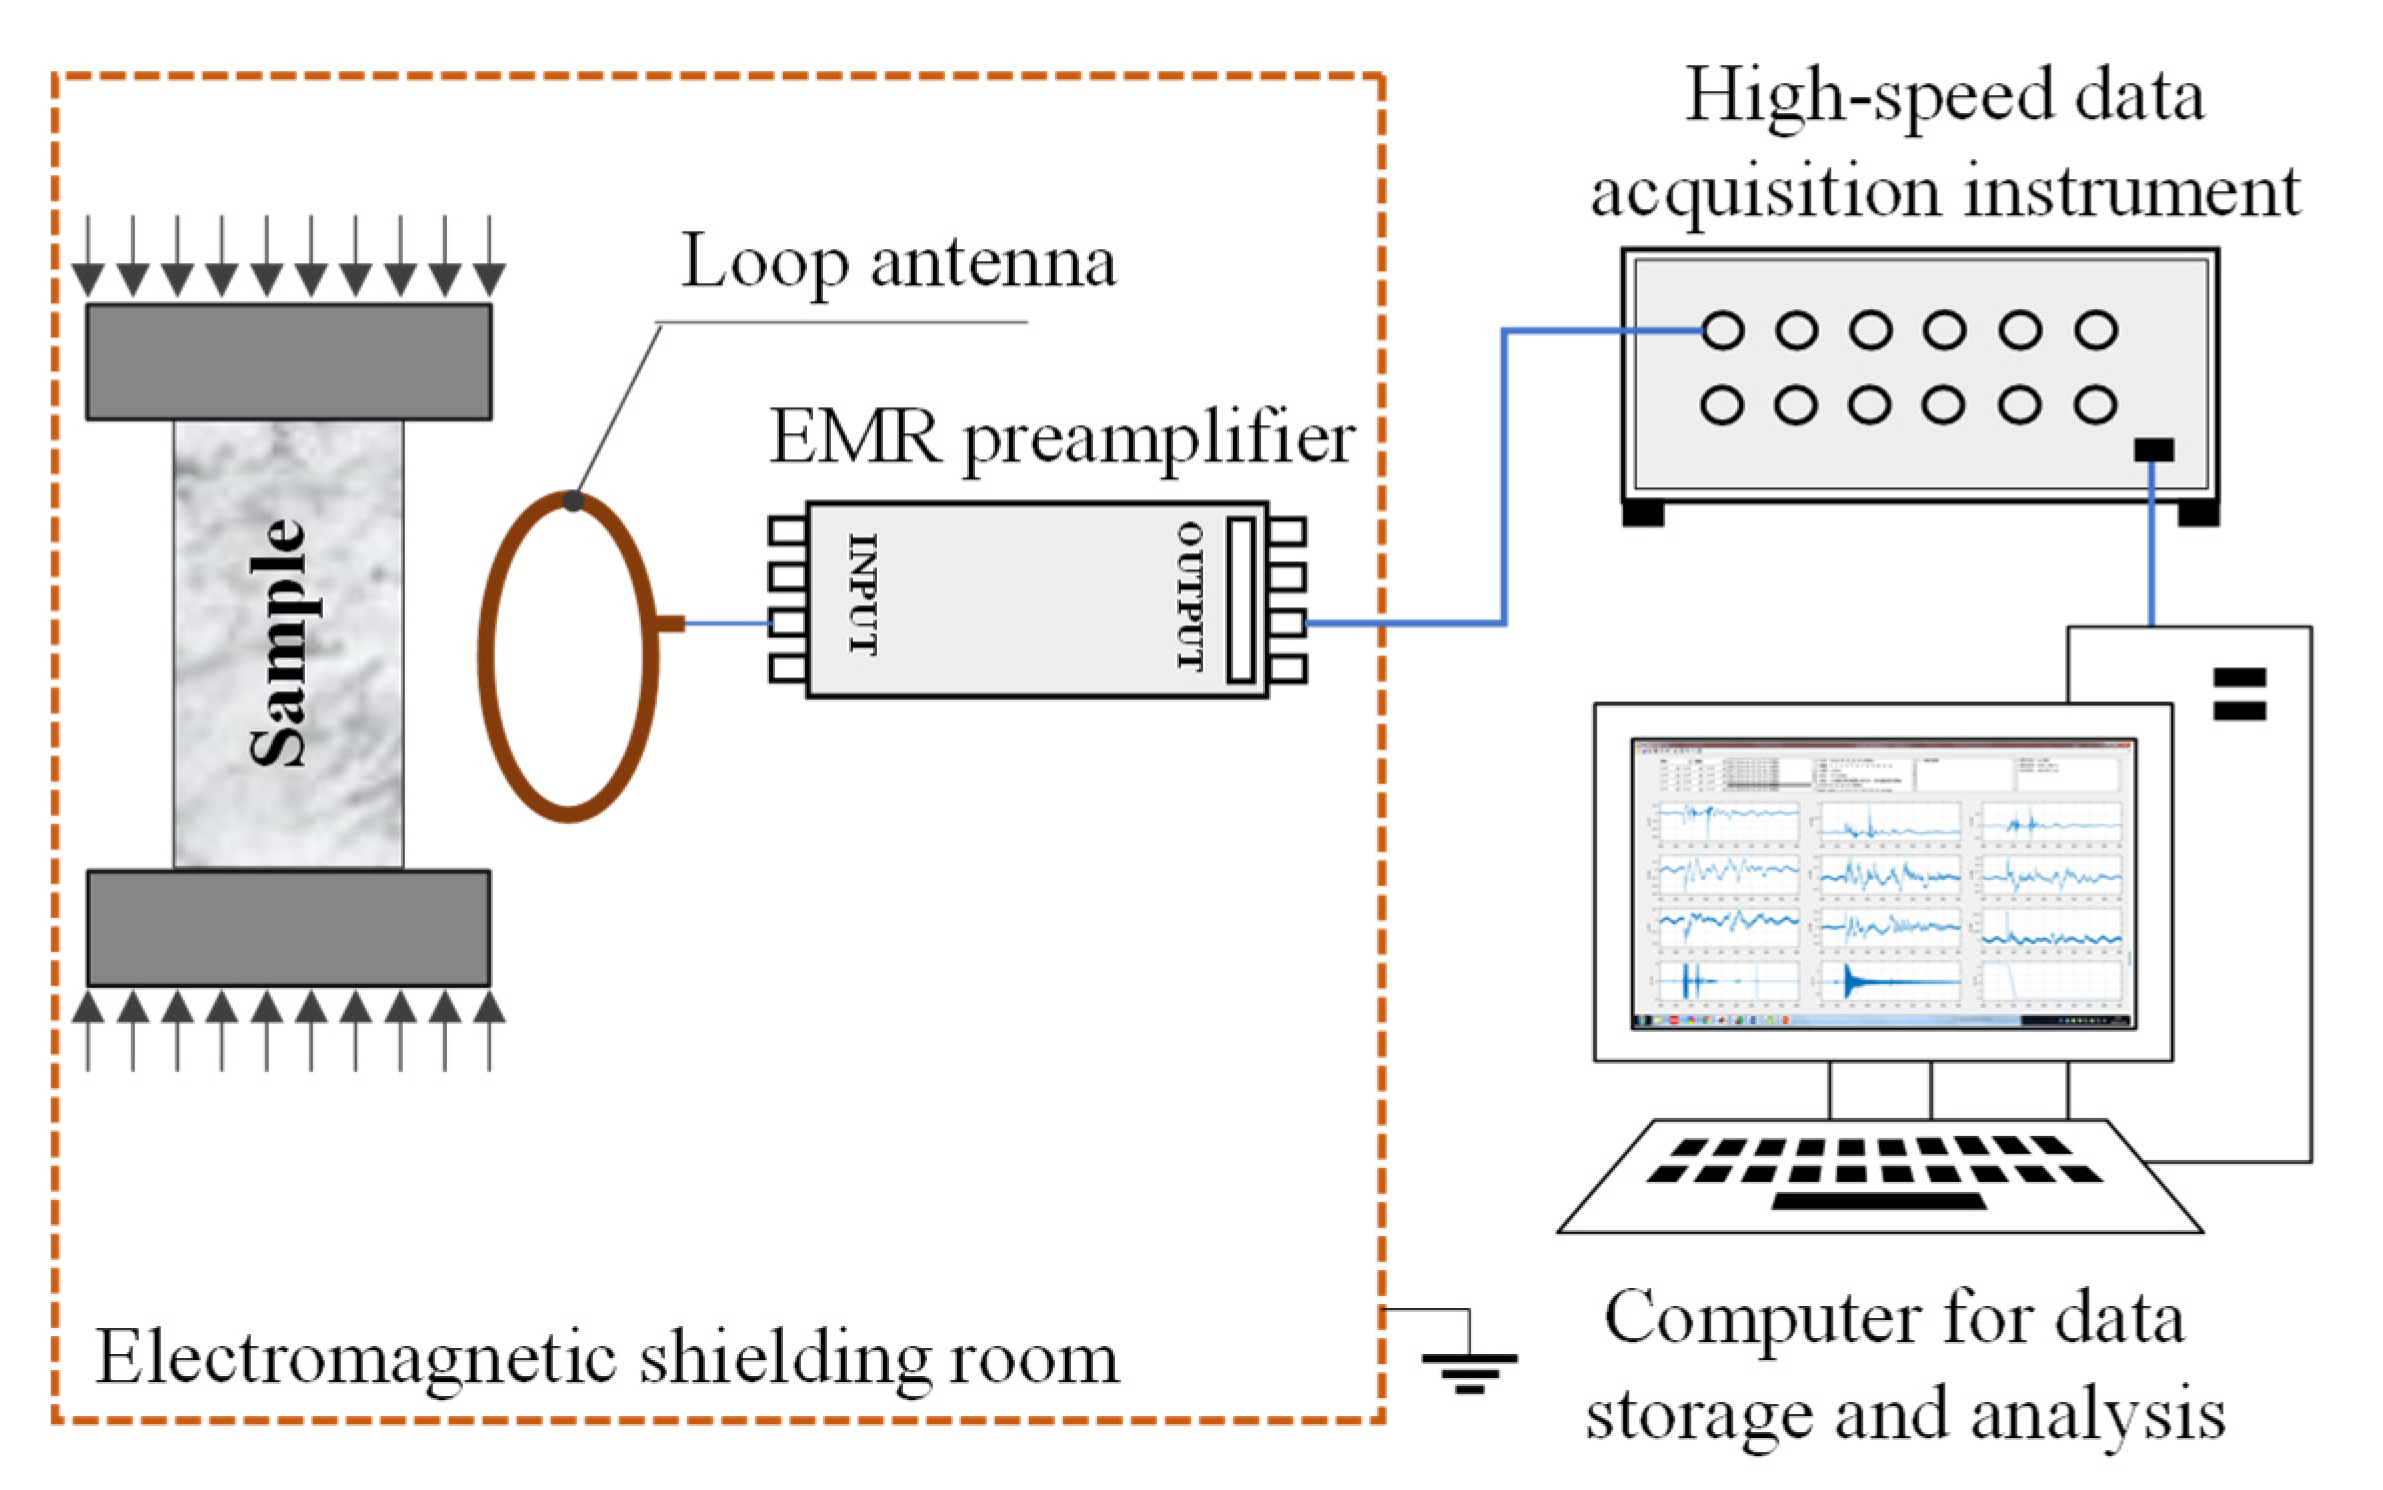
The schematic diagram of the experimental system is shown in Figure 12. The YAW–600 pressure tester was adopted for loading, and its maximum load is 600 kN, the load resolution is 3 N, and the displacement resolution is 0.3 μm. The data acquisition system is composed of a high–speed data acquisition instrument and a high–performance computer. The data acquisition instrument has 12 channels, an A/D accuracy of 16 bits, and a maximum sampling frequency of 10 MHz. A SAS–560 loop antenna with a response frequency range of 20 Hz–2 MHz was used to sense the EMR signal. The EMR preamplifier matched with the SAS–560 loop antenna had four channels (i.e., two channels for 0–10 MHz and two channels for 10 kHz–10 MHz), and its amplification multiple ranged from 50 dB to 80 dB. The experiments were conducted in a GP1A electromagnetic shielding room with shielding effectiveness of 14 kHz ≥ 75 dB, 100 kHz ≥ 95 dB, 200 kHz ≥ 100 dB, and 50–103 MHz ≥ 110 dB.
The rock samples were taken from the Wudong coal mine, Midong District, Urumqi, Xinjiang Uygur Autonomous Region, China, and processed into standard cylinders with a diameter of 50 mm and a length of 100 mm.
The rock samples were loaded by displacement control with a loading speed of 2 μm/s. The sampling frequency of the data acquisition instrument was set to 5 MHz. The 10 kHz–10 MHz channel of the EMR preamplifier was used to amplify the EMR signal with an amplification multiple of 64 dB.

4.2. Response of EMR Signal on Rock Fracture

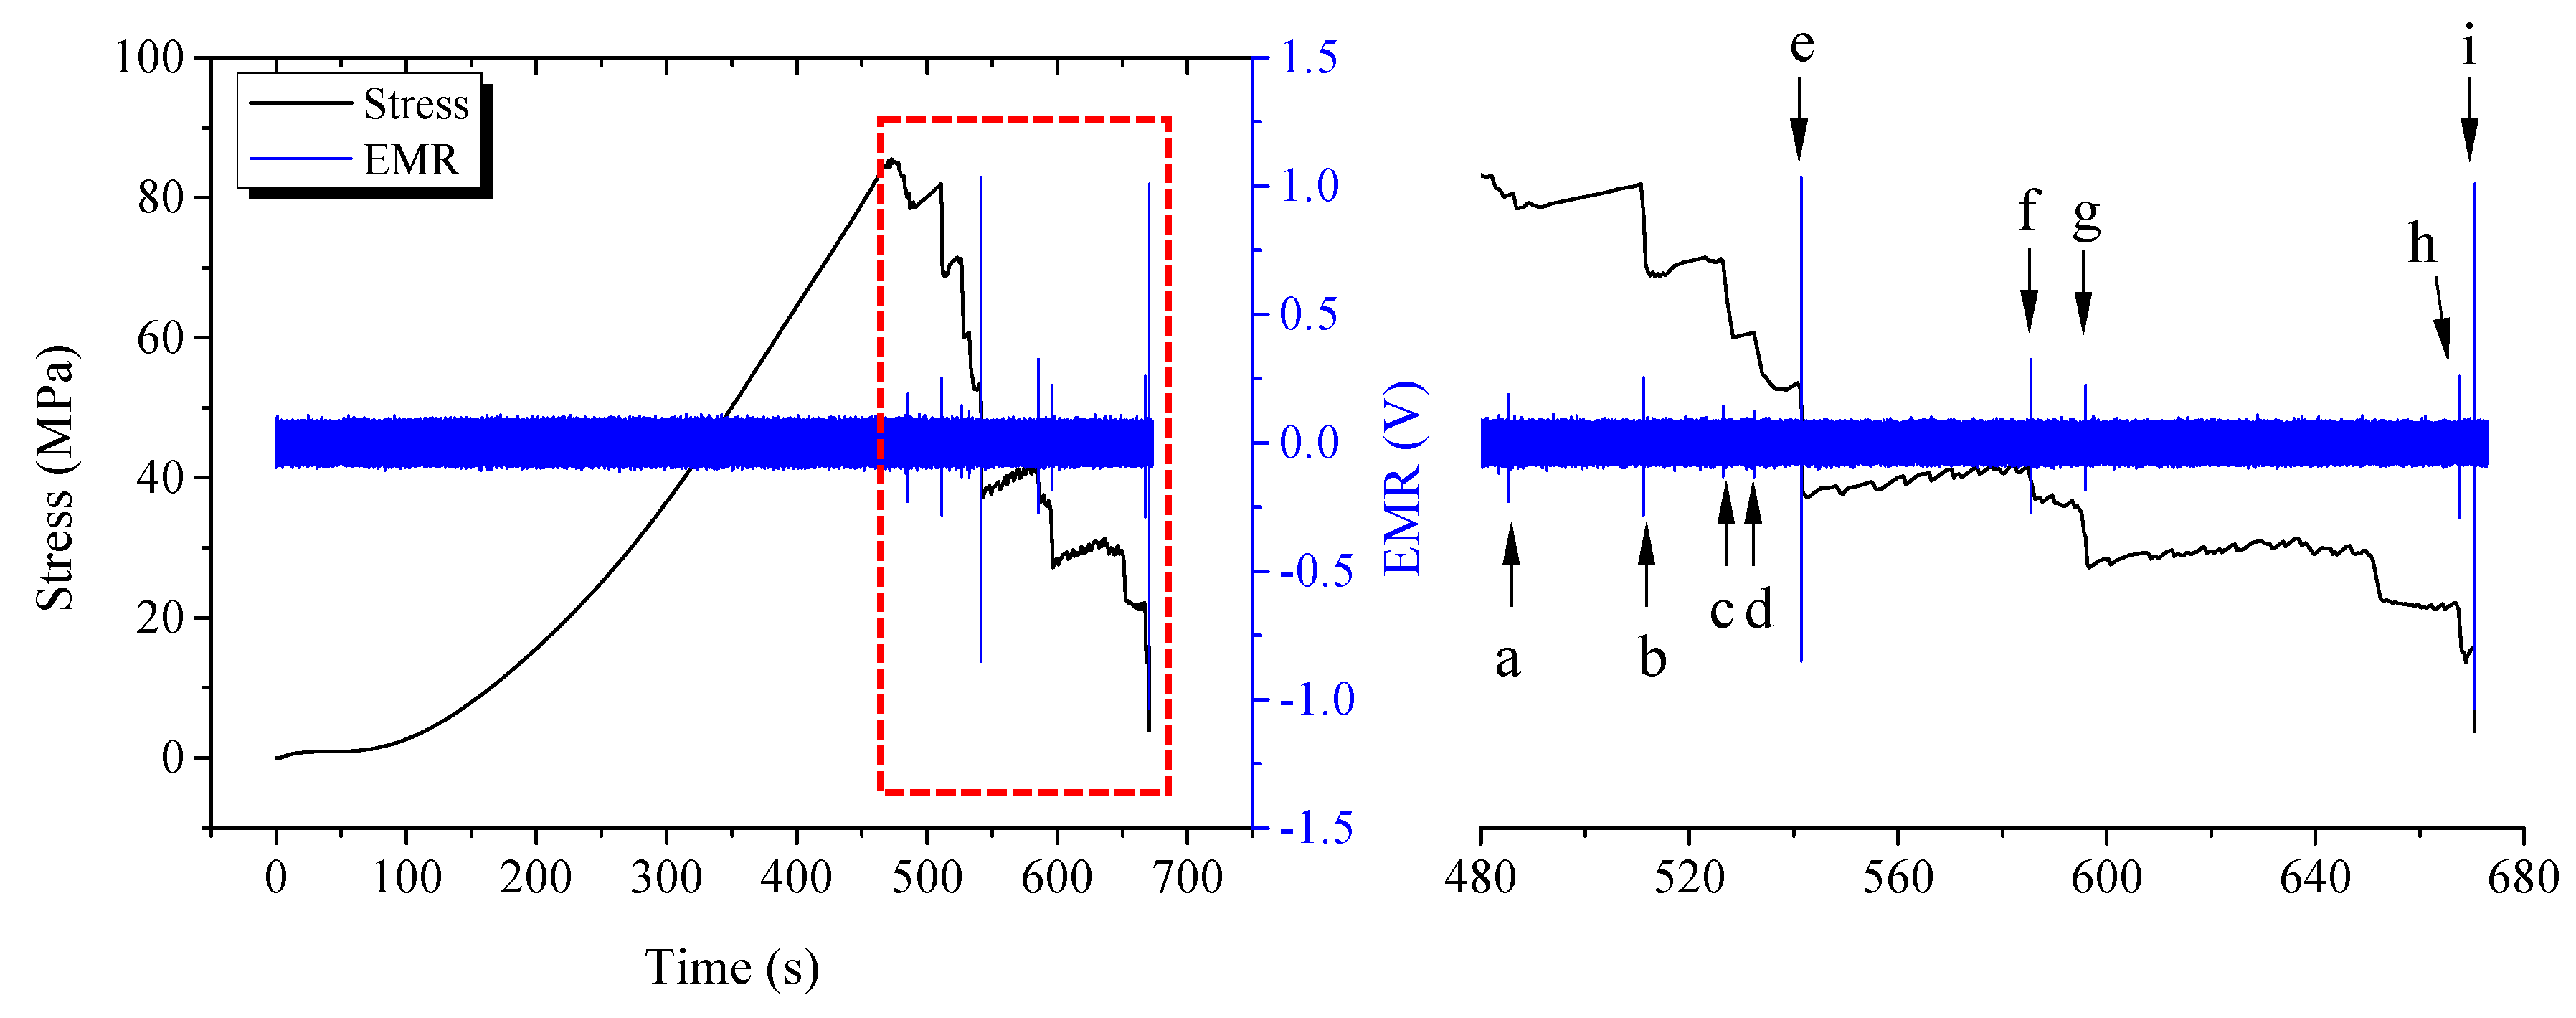
Figure 13 shows the stress curve and EMR signal of the rock sample during the entire loading process. The example rock sample had a peak stress of 85.52 MPa and an elastic modulus of 14.28 GPa. Before the peak stress, the stress almost increased monotonically, and there was no significant stress drop and EMR signal at this stage. From the enlarged view on the right side of Figure 13, it can be seen that the rock sample was rapidly destabilized and destroyed after the peak stress, resulting in a large number of significant stress drops and EMR signals. The experimental results in the literature [40,41,42,43,44] indicate that whether before or after the peak stress, the EMR signals are generally accompanied by stress drops. Not only EMR but the electrical signal pressure–stimulated current (PSC) also had a significant response when approaching the fracture load levels [45,46,47]. Since the example rock sample was fine sandstone and relatively hard and brittle, the significant fractures or stress drops were mainly concentrated at the stage after the peak stress. The significant EMR signals were numbered a, b, …, and i. In the failure stage of the rock sample, some significant fractures were accompanied by multiple EMR signals. For example, the waveform numbered i shown in Figure 13 contained two consecutive signals marked as i1 and i2, shown in Figure 14.

4.3. Time–Frequency Analysis for EMR Waveform

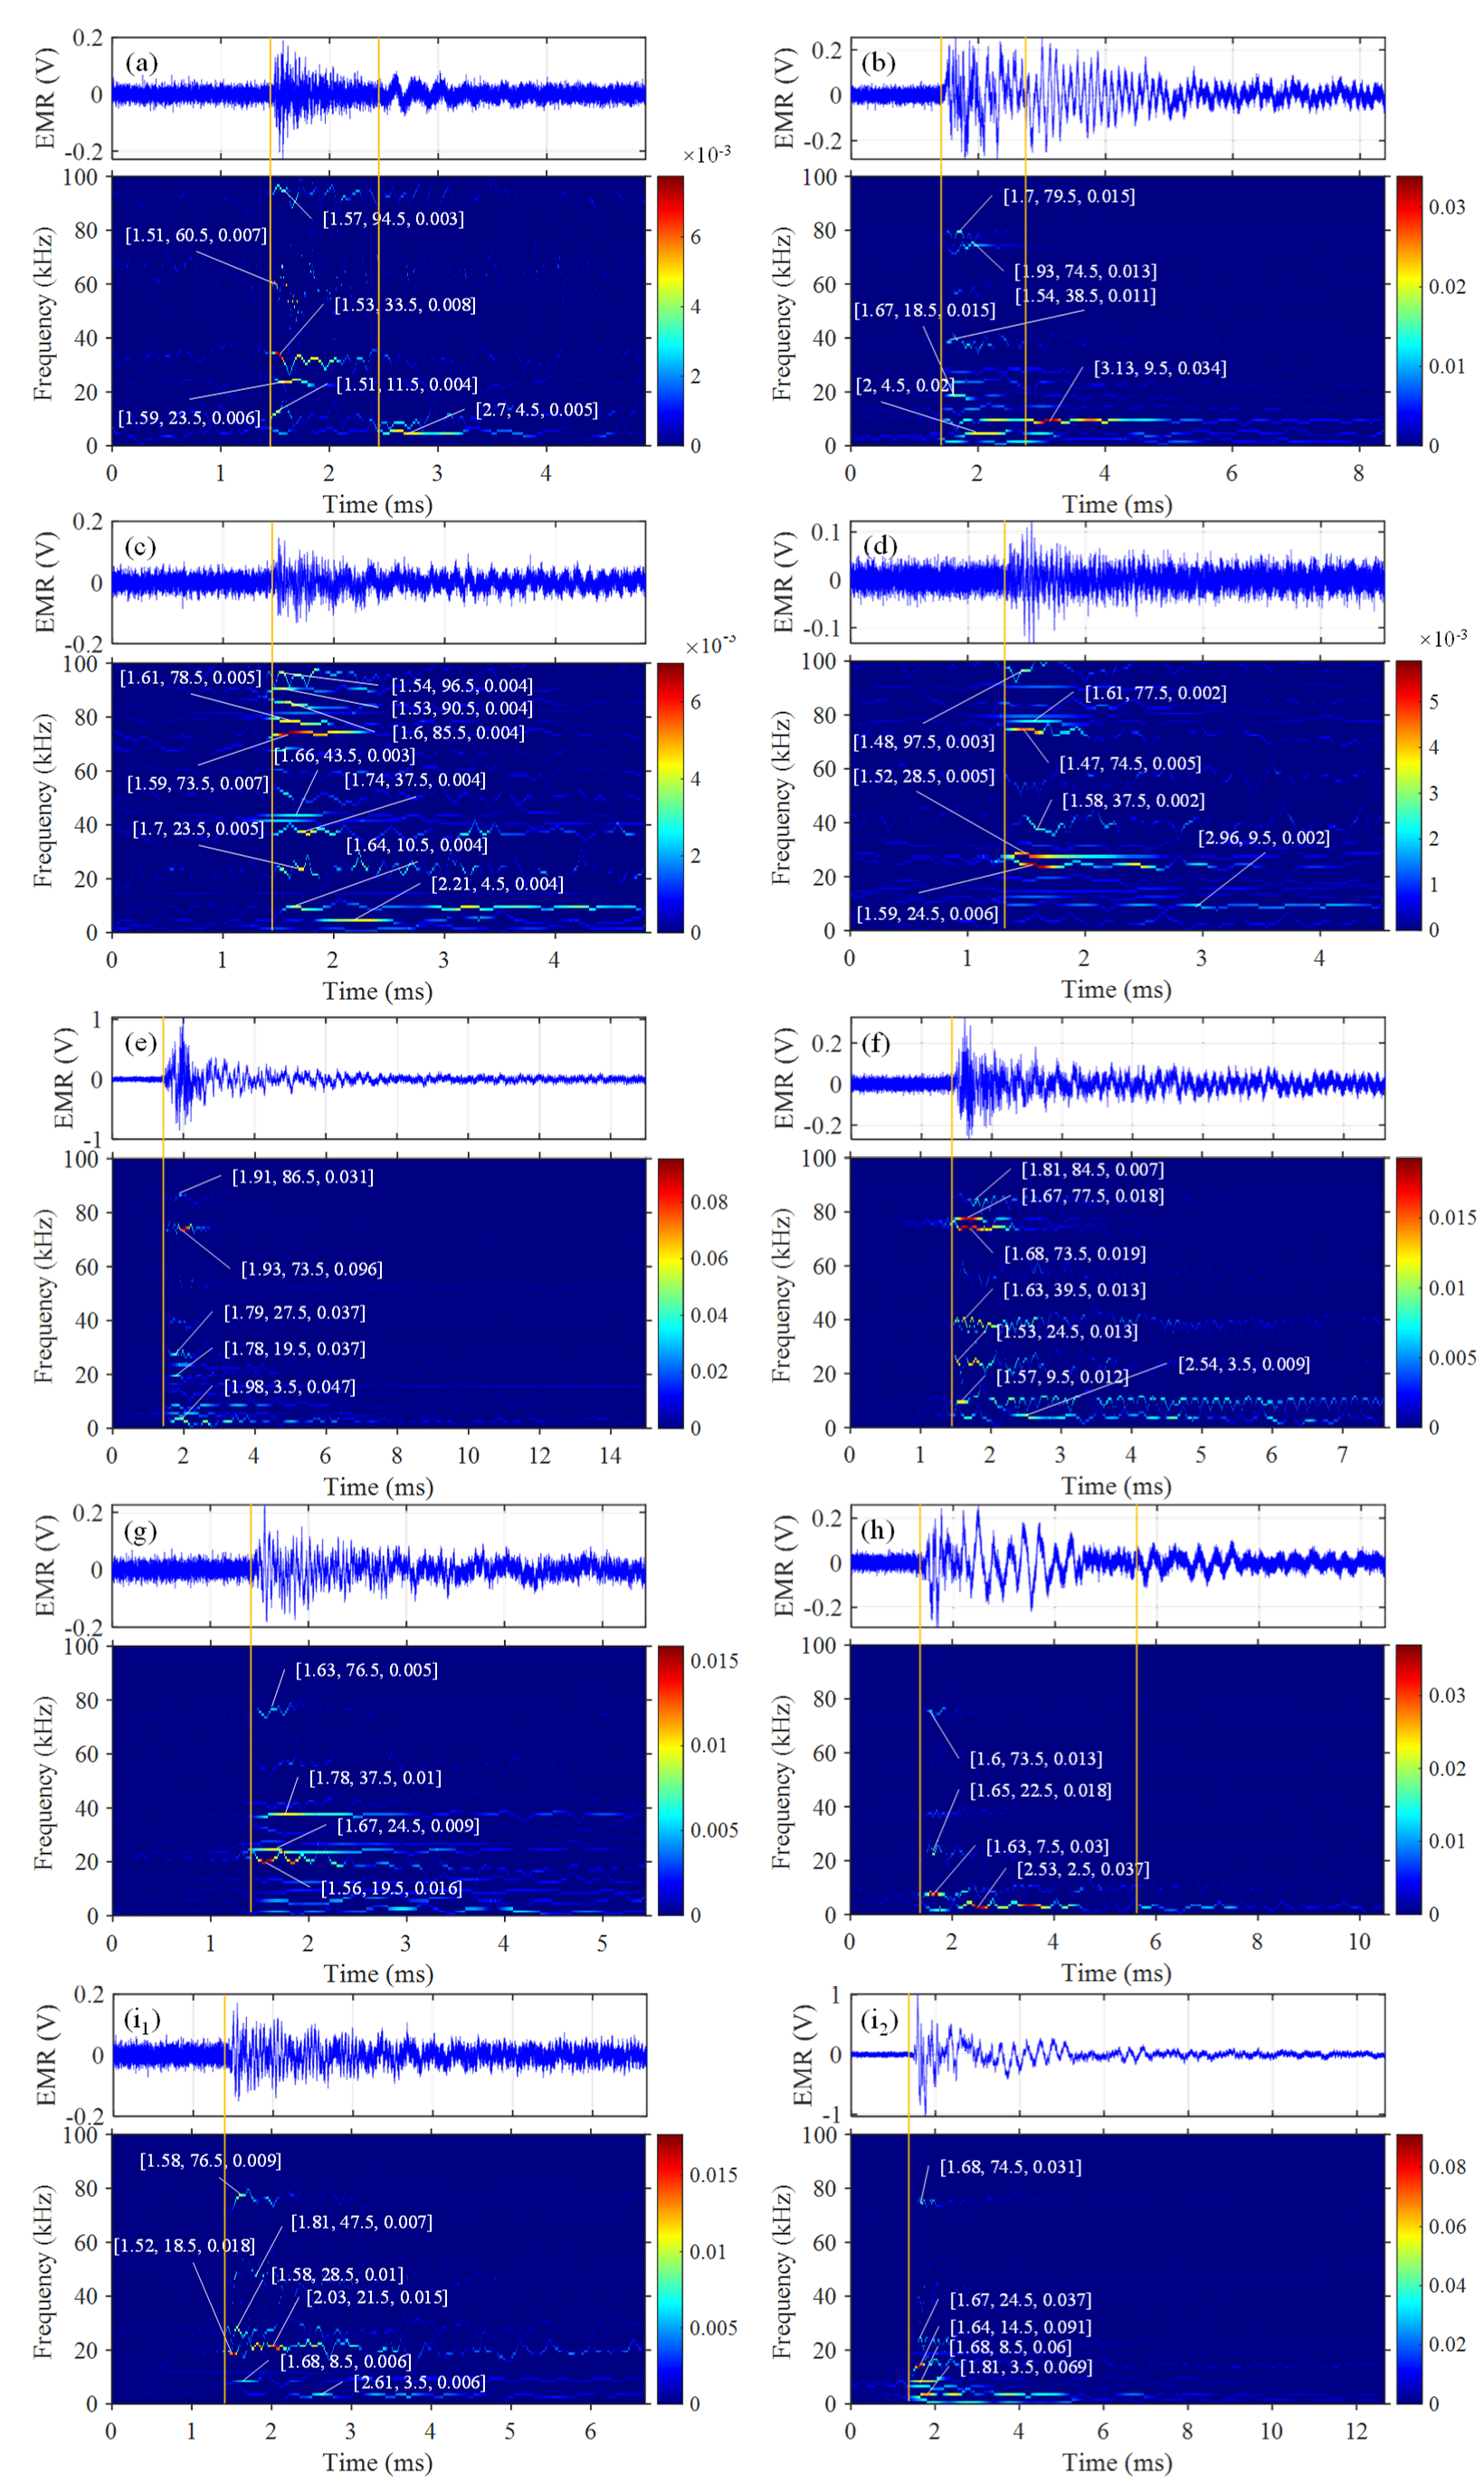
The EMR signals numbered a, b, …, and i in Figure 13 were decomposed by the improved EWT, and then their Hilbert spectra were obtained by HT. Figure 14 presents the waveforms and Hilbert spectra of these EMR signals. Since the frequency bands of these EMR signals are mainly below 100 kHz, this paper intercepted the time–frequency spectra below 100 kHz for analysis. Moreover, some significant feature points of the time–frequency spectra were marked as “[time, frequency, amplitude]” in Figure 14 to aid in the analysis. Table 1 lists the parameters of the EMR waveforms and their time–frequency spectra.
As shown in Figure 14a, the high amplitude component mainly fluctuated around 33.5 kHz after the waveform was triggered. In the meantime, the components of 11.5 kHz, 23.5 kHz, 60.5 kHz, and 94.5 kHz were also relatively significant. When the waveform decayed smoothly to 2.49 ms, the high–amplitude and low–frequency fluctuation with the main frequency of 4.5 kHz occurred, implying that a complex fracture occurred in the rock sample, and significant low–frequency fluctuations appeared on the crack surface. Then, the EMR waveform decayed smoothly with the main component of 4.5 kHz. As shown in Figure 14b, the 9.5 kHz component that runs through the entire waveform appears immediately after the waveform is triggered. There were also relatively high–frequency components of 74.5 kHz and 79.5 kHz with low amplitude, but they decayed rapidly. Furthermore, the components of 1.5 kHz, 4.5 kHz, 18.5 kHz, 23.5 kHz, and 35.5–40.5 kHz were also relatively significant. From 2.71 ms, the fluctuation amplitude of the 9.5 kHz component gradually increased and reached the maximum amplitude at 3.13 ms, implying that the vibration frequency of the internal crack surface changed greatly, showing a more concentrated trend. As shown in Figure 14c, the waveform intensity was relatively weak. After the waveform was triggered, it mainly fluctuated at 73.5 kHz where it was maintained for a long time until significant attenuation occurred at 2.2 ms. Meanwhile, the components of 4.5 kHz, 10.5 kHz, 23.5 kHz, 37.5 kHz, 41.5 kHz, 43.5 kHz, 78.5 kHz, 85.5 kHz, 90.5 kHz, and 96.5 kHz were also relatively significant. Notably, the lower frequency fluctuation of 4.5 kHz mainly occurred at 1.84–2.52 ms, and then the waveform mainly attenuated at 10.5 kHz from 2.81 ms. As shown in Figure 14d, the waveform intensity is the weakest among all the 10 EMR waveforms. After the waveform was triggered, the amplitudes of components of 24.5 kHz, 28.5 kHz, and 74.5 kHz rapidly enhanced. During this process, the components of 37.5 kHz, 77.5 kHz, and 97.5 kHz were also relatively significant. Then, the waveform attenuated with the main components of 9.5 kHz, 24.5 kHz, and 27.5 kHz. As shown in Figure 14e, the waveform amplitude increased rapidly after it was triggered. There was a high–amplitude transient fluctuation at 73.5 kHz, but it decayed quickly. The components of 2.5 kHz, 3.5 kHz, 5.5 kHz, 8.5 kHz, 19.5 kHz, 23.5 kHz, 27.5 kHz, and 86.5 kHz were also relatively significant. Then, the waveform mainly decayed with components below 15.5 kHz. As shown in Figure 14f, the components of 73.5 kHz and 77.5 kHz mainly fluctuated with high amplitude after the waveform was triggered. In the meantime, the components of 2.5 kHz, 9.5 kHz, 24.5 kHz, 39.5 kHz, and 84.5 kHz were also relatively significant. Notably, the components of 2.5 kHz and 9.5 kHz ran through the entire waveform and were the main components in the later attenuation process. As shown in Figure 14g, the waveform mainly fluctuated at 19.5 kHz, 24.5 kHz, and 37.5 kHz, and the 19.5 kHz component was the strongest. Furthermore, there were also relatively weak components of 1.5 kHz, 5.5 kHz, and 76.5 kHz. During the attenuation process, the frequencies of the components were not concentrated, but there was a relatively significant low–frequency component of 2.5 kHz. Compared with the waveforms shown in Figure 14a–g, the overall frequency of the waveform shown in Figure 14h was significantly lower. After the waveform was triggered, it mainly focused on the 7.5 kHz component, and there were also relatively weak components of 1.5 kHz, 22.5 kHz, and 73.5 kHz. Then, the frequency of the dominant component transferred from 7.5 kHz to 2.5 kHz, and 2.5 kHz was the main frequency component of the waveform attenuation. In addition, when the waveform decays to become calm, the fluctuation amplitude of the 2.5 kHz component increased significantly at 5.72 ms, which was very similar to the phenomenon in Figure 14a, indicating that a relatively complex fracture occurred in the rock sample. The EMR waveforms numbered i1 and i2 appeared almost simultaneously, and their arrival times were 686.4955 s and 686.5054 s, respectively, indicating that the internal fracture of the rock sample was severe and complex. As shown in Figure 14i1, after the waveform was triggered, it fluctuated at a high amplitude of 18.5 kHz and decayed rapidly, then the frequency rose to 21.5 kHz. The components around 8.5 kHz, 28.5 kHz, 47.5 kHz, and 76.5 kHz were also relatively significant. Subsequently, the waveform mainly attenuated with the components of 3.5 kHz and 21.5 kHz. As shown in Figure 14i2, the waveform intensity was 1.033 V, which approximated the intensity of the waveform shown in Figure 14e. However, compared with the waveform shown in Figure 14e, the overall frequency of this waveform was significantly lower. After the waveform was triggered, the high amplitude fluctuation around 14.5 kHz occurred and decayed rapidly. Meanwhile, the components around 2.5 kHz, 6.5 kHz 8.5 kHz, 27.5 kHz, and 74.5 kHz were also relatively significant, and the 3.5 kHz component dominated at the later stage of waveform attenuation.
From the above analysis, the time–frequency spectrum obtained by EWT–HT can well depict the time–frequency evolution characteristics of the EMR waveforms. The EMR waveform induced by rock fracture contained complex frequency components, and in the attenuation process, different frequency components showed different characteristics. In the early stage after peak stress, the EMR signal was prone to have a high amplitude component of 70–100 kHz, while in the later stage, the high amplitude component was prone to appear in 0–40 kHz, and most of the EMR waveforms decayed with lower frequency components of 0–25 kHz.

5. Discussion

HHT and STFT are also commonly used waveform time–frequency analysis methods. To further evaluate the time–frequency analysis effect of EWT–HT and its applicability to the EMR waveform of rock fracture, the time–frequency analysis results obtained by EWT–HT, HHT, and STFT were comparatively analyzed and discussed.
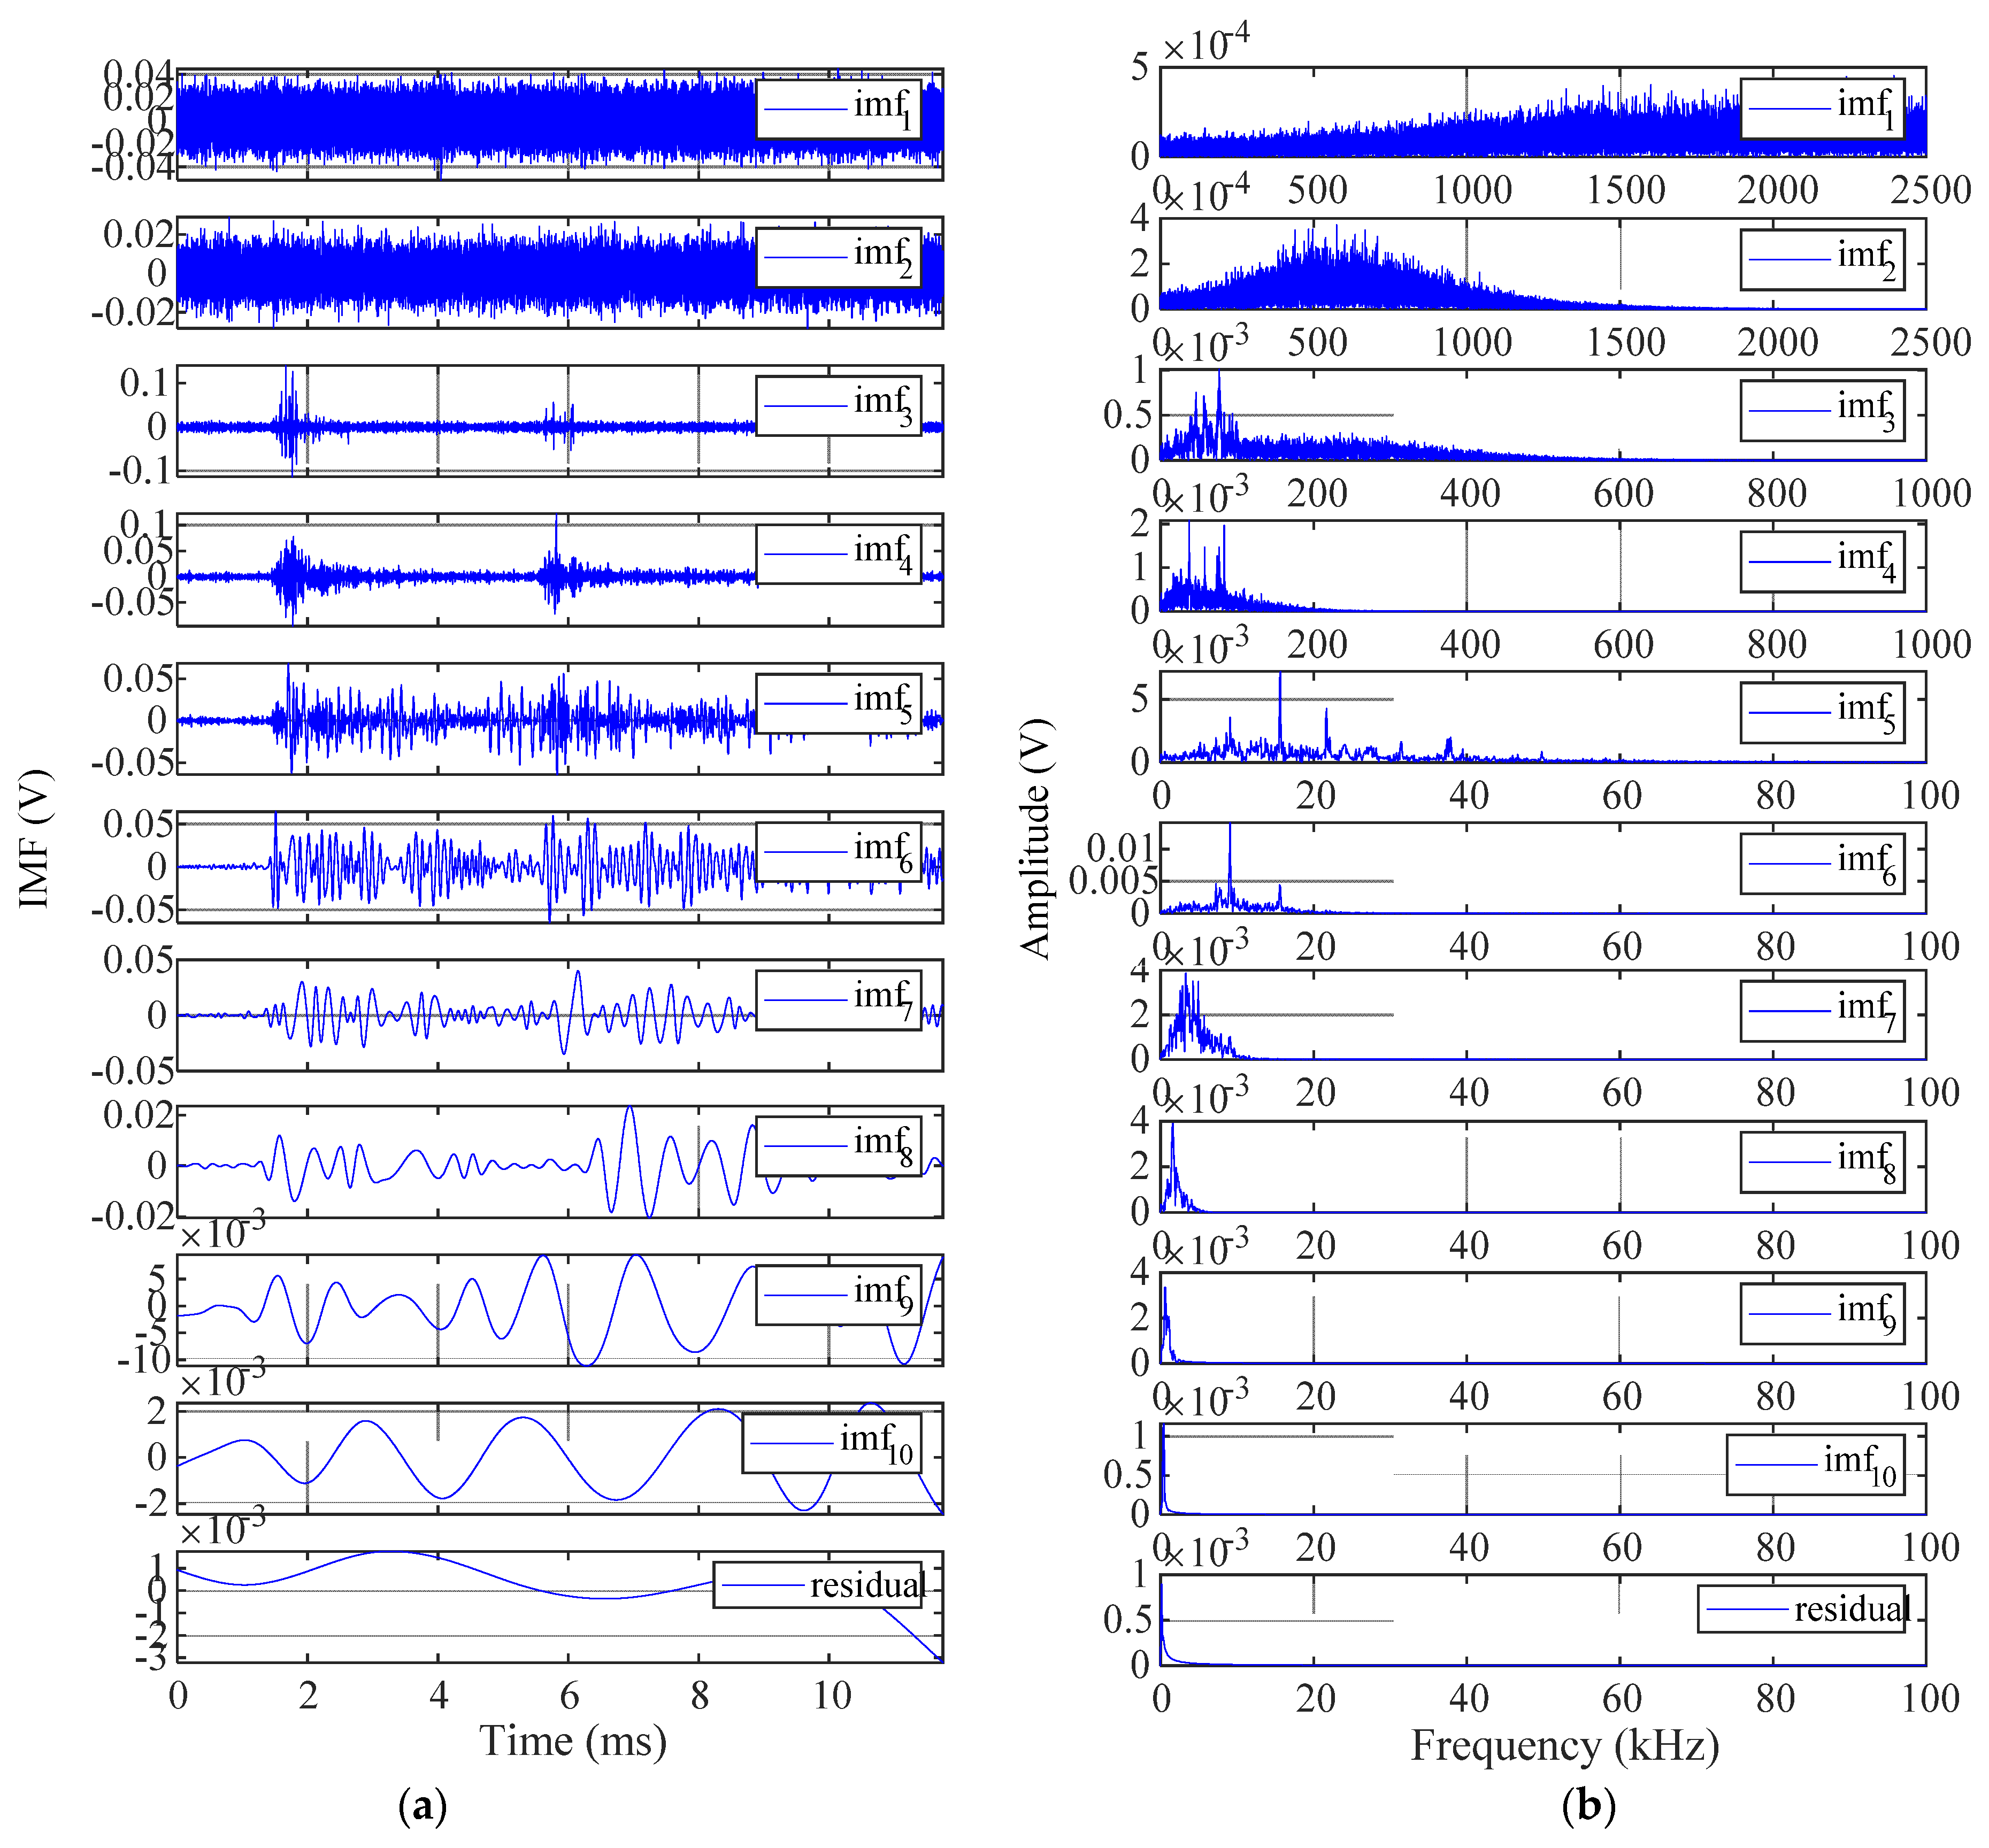
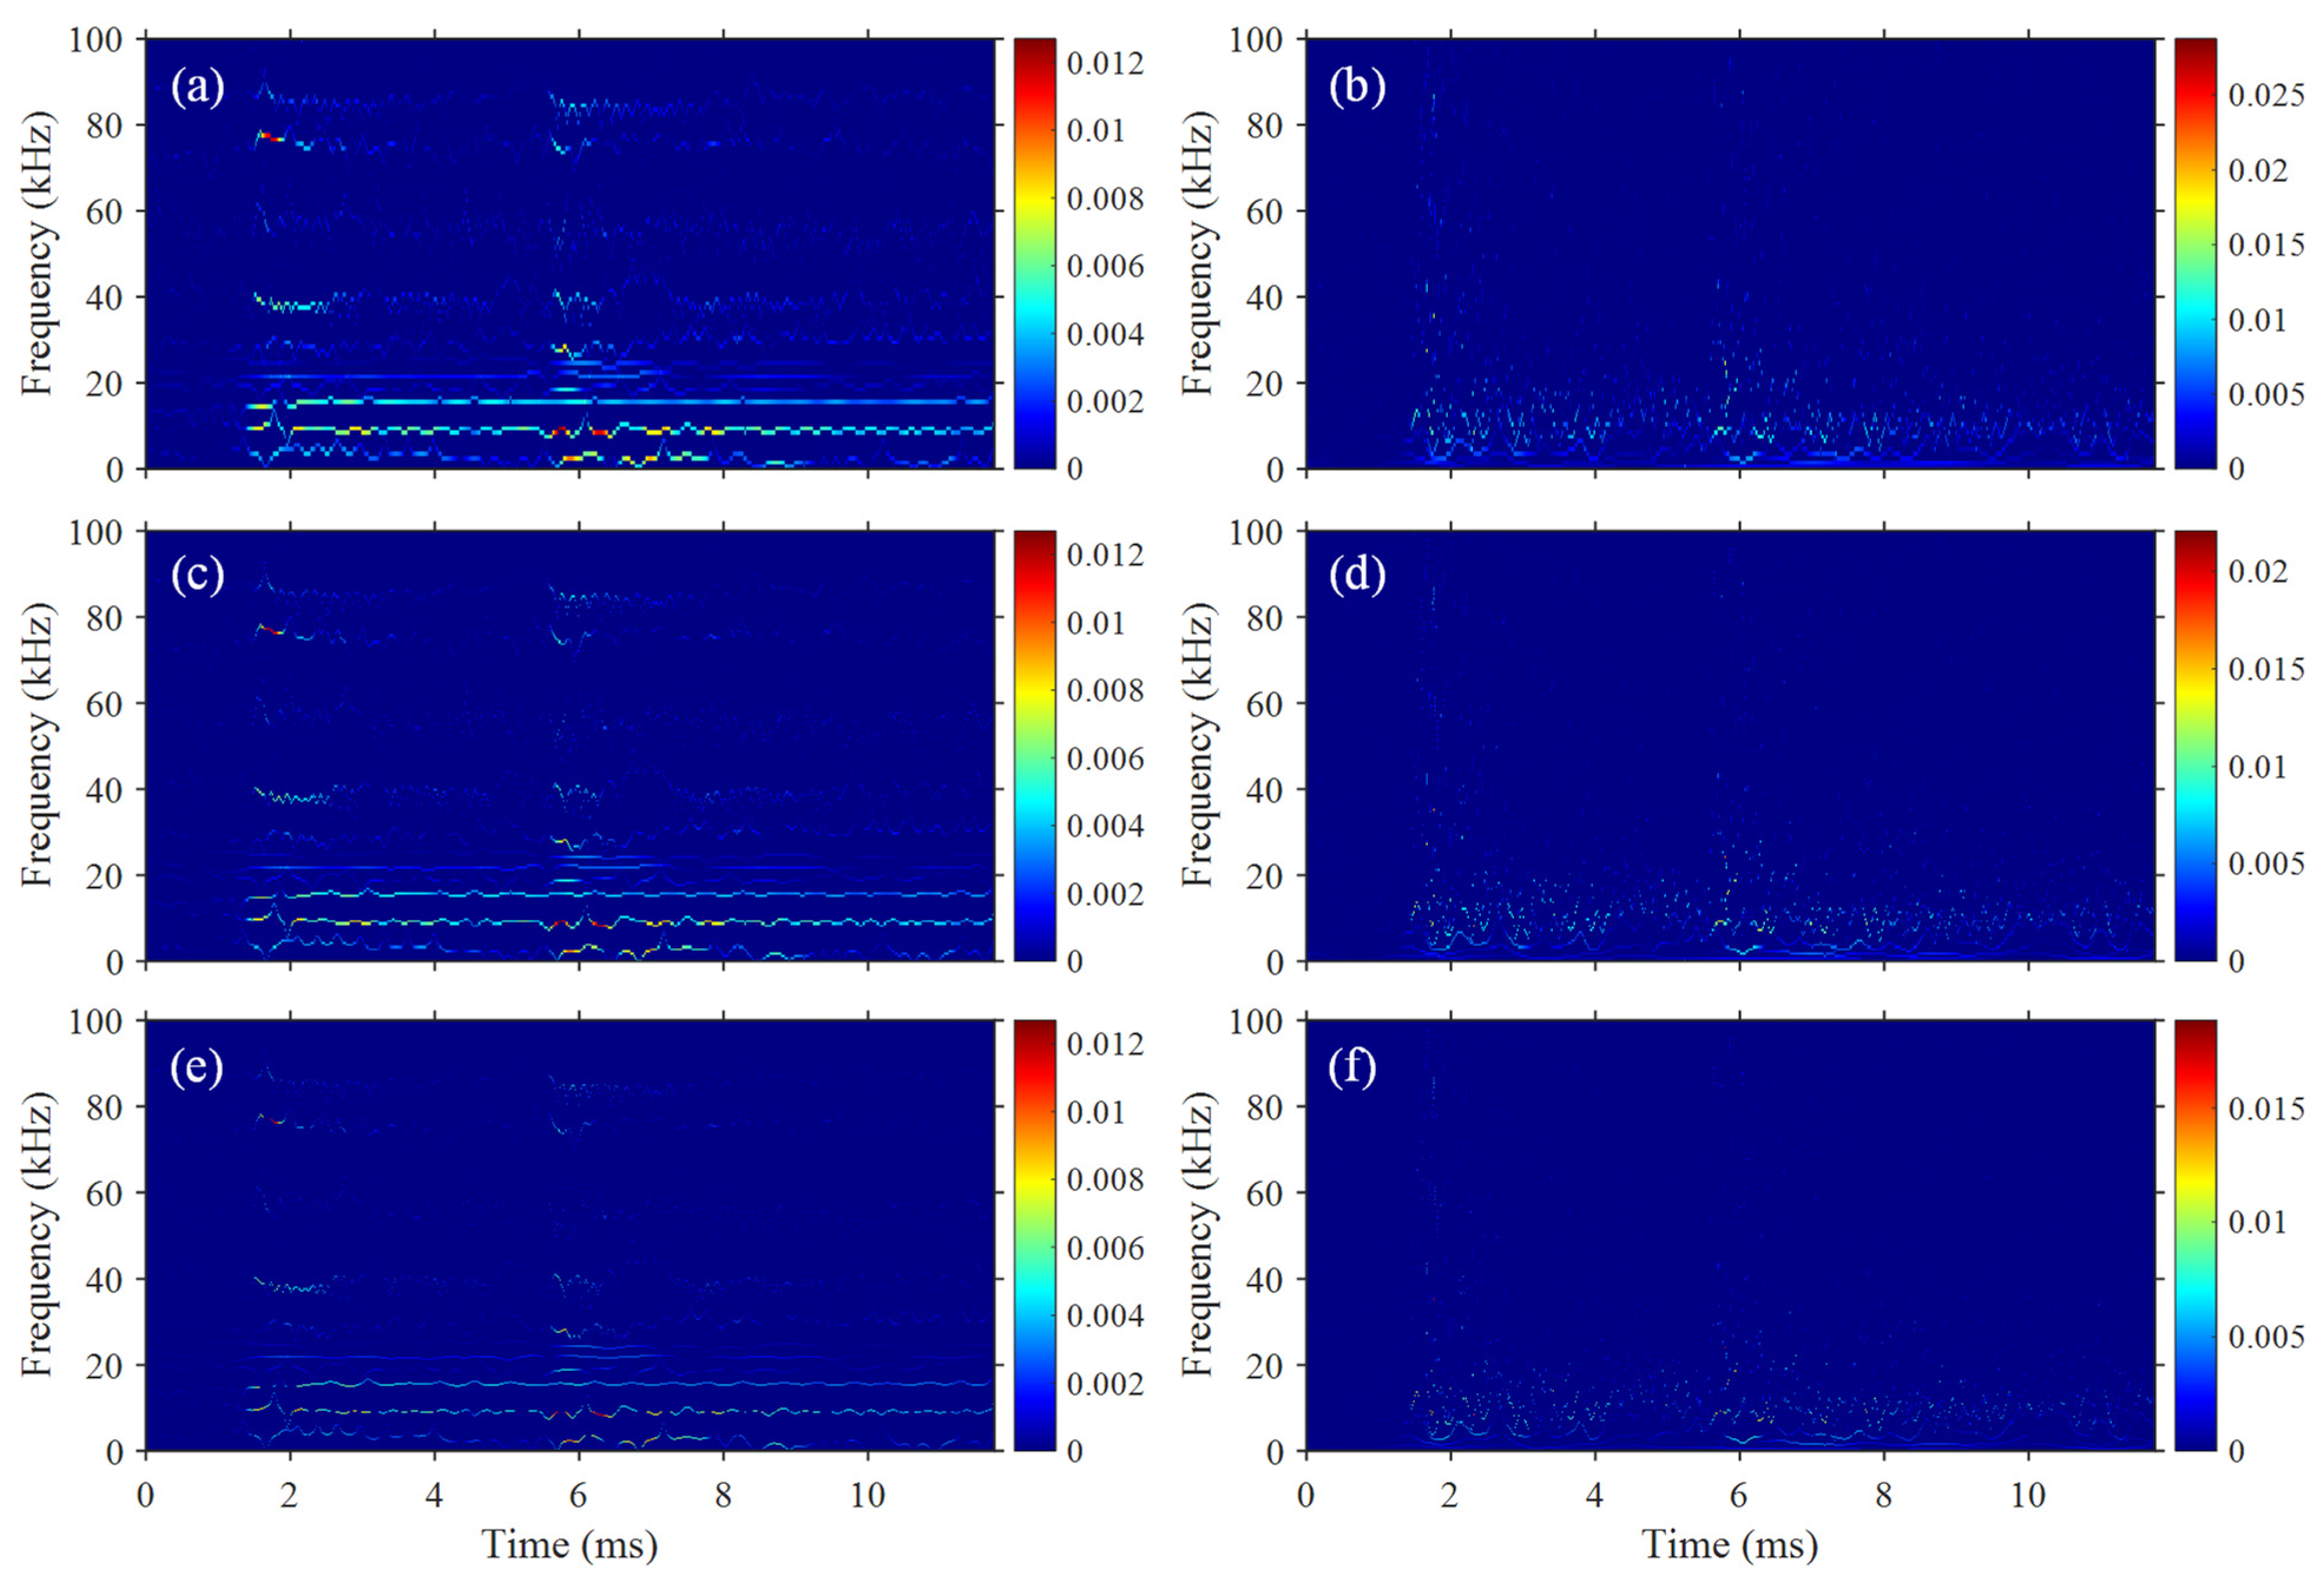
The ten components numbered imf1, imf2, …, and imf10 and the residual of the EMR waveform obtained by EMD and their Fourier spectra are shown in Figure 15a,b, respectively. Table 2 lists the statistics on the frequency band, intensity, and energy proportion of each IMF component. Imf1 and imf2 are the first two high–frequency components decomposed by EMD, and the effective waveform is decomposed mainly into imf3–imf10. The components of imf3–imf8 begin to fluctuate violently when the effective waveform is triggered, showing good time–domain characteristics. However, the frequency bands corresponding to each component overlapped in turn from imf10 to imf1, especially for the frequency points of 9.1 kHz and 15.6 kHz of imf6 and imf5, and the 35–86 kHz frequency bands of imf4 and imf3, indicating that there was a mode aliasing phenomenon among the components. The intensities and energy proportions of these four components were relatively large, which will have a great influence on the time–frequency spectrum obtained by HT. Figure 16 presents the time–frequency spectra obtained by EWT–HT and HHT with different drawing frequency resolutions of 1 kHz, 0.5 kHz, and 0.25 kHz. Because of the mode aliasing phenomenon existing among the components obtained by the EMD of HHT, the instantaneous frequency of each component fluctuated in a large range and was not concentrated. It is difficult to detect the continuous time–frequency evolution process and the maximum amplitude point in the time–frequency spectrum. To better detect the maximum amplitude point, the 3D time–frequency spectra obtained by HHT were drawn and shown in Figure 17. The high amplitude components often appeared in the form of dots rather than continuous curves, making it difficult to analyze the time–frequency evolution characteristics of the EMR waveform. However, the similarity between EWT–HT and HHT is that HT is used to obtain the time–frequency spectrum after waveform decomposition. Therefore, EWT–HT and HHT can take into account both the time and frequency resolutions, and possess the time resolution at the level of the sampling point and the theoretically infinite frequency resolution, which is well illustrated by the time–frequency spectra shown in Figure 16 with frequency resolutions of 1 kHz, 0.5 kHz, and 0.25 kHz.
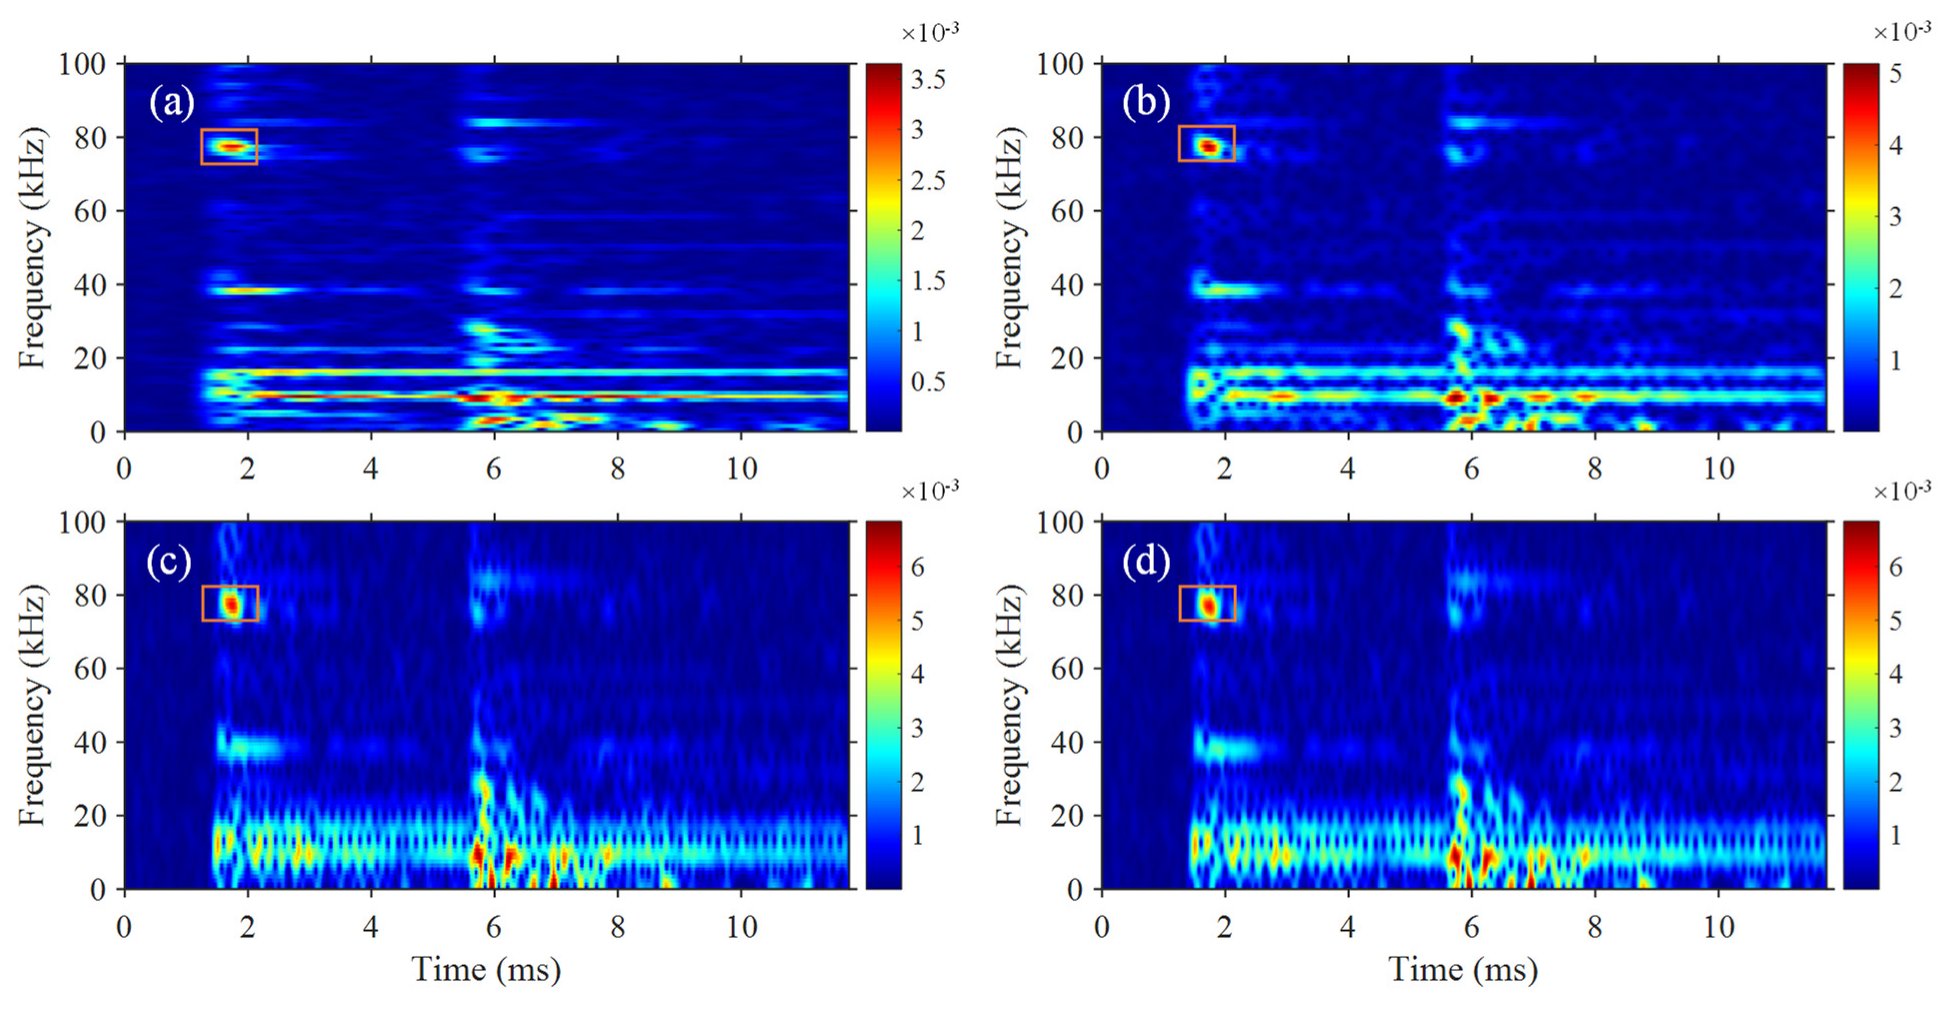
According to the STFT theory, the resolutions of STFT in the time domain and frequency domain cannot be taken care of both, that is, to improve its time resolution, the width of the STFT window must be reduced. Accordingly, to increase the frequency resolution, it is necessary to increase the width of the STFT window, or to increase the time length of the signal participating in the DFT of STFT by supplementing zero. Figure 18 presents the time–frequency spectra obtained by STFT with different window widths and the time lengths of the signal participating in DFT. The STFT parameters to obtain the time–frequency spectra shown in Figure 18a–c were as follows, respectively: the Hamming window widths were 1 ms, 0.5 ms, and 0.25 ms, the number of points participating in DFT was 5000, and the window sliding step size was five sampling points. For the 0.5 ms and 0.25 ms window widths, the signal after windowing was supplemented with zero to ensure the number of points participating in DFT was 5000. The STFT parameters of Figure 18d were as follows: the Hamming window width was 0.25 ms, and the number of points participating in DFT was 20,000 via adding zero. Comparing the magenta box areas shown in Figure 18a–c with the reduction in the Hamming window width, the red area in the box was shortened laterally and elongated longitudinally, indicating that its time resolution increased while the frequency resolution decreased. Compared to Figure 18c, although the frequency resolution of the time–frequency spectrum shown in Figure 18d was improved by adding zero, it only made the time–frequency spectrum smoother, and the red area in the magenta box did not change, indicating that the actual frequency resolution had not been improved. Although the time–frequency spectrum shown in Figure 18a has an actual frequency resolution of 1 kHz equaling the drawing frequency resolution of Figure 16a, there were other frequency components with relatively higher amplitude around its main frequency components, as shown in Figure 18a, making the main frequency components more blurred, while the main frequency components were clearer and more obvious in Figure 16a. Although the time–frequency spectrum shown in Figure 18d had a drawing time frequency of five sampling points, there was still a certain gap compared with the actual time resolution of five sampling points of Figure 16e because its Hamming window width was 0.25 ms. It is noteworthy that although the STFT result was not as good as that of EWT–HT in the time domain and frequency domain resolutions, the time–frequency spectrum distribution characteristics of these two results were generally consistent.

6. Conclusions

An adaptive segmentation method of the Fourier axis for EWT was proposed in this paper and applied to analyze the time–frequency characteristics of the EMR waveform induced by rock fracture. The following conclusions can be drawn:
(1)
The window width of the closing operation is one of the keys to Fourier axis segmentation, and it can be selected based on the drawing frequency resolution, the sampling frequency, and the number of sampling points of the waveform. The threshold value to detect the effective maxima can be determined by the adaptive ratio α.
(2)
Based on the Fourier axis obtained by STFT, where the short–time and high–amplitude components existing in the EMR waveform are well extracted, the Fourier axis segmentation is more effective than that directly based on DFT.
(3)
EWT–HT overcomes the modal aliasing of HHT and the inability of STFT to take into account the resolution in both the time and frequency domains. It can well describe the time–frequency evolution characteristics of the EMR waveform induced by rock fracture.

Author Contributions

Conceptualization, Q.L. and D.S.; Methodology, Q.L.; Software, Q.L.; Validation, X.W. and B.J.; Formal analysis, L.Q.; Investigation, Q.L.; Resources, S.Y.; Data curation, Q.L.; Writing—original draft preparation, Q.L.; Writing—review and editing, Q.L., X.W. and B.J.; Visualization, L.Q.; Supervision, D.S.; Project administration, X.W.; Funding acquisition, Q.L., B.J. and L.Q. All authors have read and agreed to the published version of the manuscript.

Funding

This work was financially supported by the provincial key R&D and promotion special (scientific problem tackling) project of Henan Province (Grant No. 222102320279), the Science and Technology Plan Project for Housing and Urban Rural Construction of Henan Province in 2021 (Grant No. K–2115), the Key Scientific Research Project Plan of Colleges and Universities in Henan Province (Grant No. 21A620001), the Youth Science Foundation Project of Henan Province (Grant No. 212300410105), and the National Natural Science Foundation of China (Grant No. 52004016).

Conflicts of Interest

The authors declare no conflict of interest.

References

  1. Zhao, Y.; Jiang, Y. Acoustic emission and thermal infrared precursors associated with bump-prone coal failure. Int. J. Coal Geol. 2010, 83, 11–20. [Google Scholar] [CrossRef]
  2. Ma, L.; Sun, H.; Zhang, Y.; Zhou, T.; Li, K.; Guo, J. Characteristics of Infrared Radiation of Coal Specimens Under Uniaxial Loading. Rock Mech. Rock Eng. 2016, 49, 1567–1572. [Google Scholar] [CrossRef]
  3. Frid, V.; Wang, E.Y.; Mulev, S.N.; Li, D.X. The fracture induced electromagnetic radiation: Approach and protocol for the stress state assessment for mining. Geotech. Geol. Eng. 2021, 39, 3285–3291. [Google Scholar] [CrossRef]
  4. Sharma, S.K.; Chauhan, V.S.; Sinapius, M. A review on deformation-induced electromagnetic radiation detection: History and current status of the technique. J. Mater. Sci. 2021, 56, 4500–4551. [Google Scholar] [CrossRef]
  5. Romanevich, K.V.; Lebedev, M.O.; Andrianov, S.V.; Mulev, S.N. Integrated Interpretation of the Results of Long-Term Geotechnical Monitoring in Underground Tunnels Using the Electromagnetic Radiation Method. Foundations 2022, 2, 561–580. [Google Scholar] [CrossRef]
  6. Qiu, L.; Li, Z.; Wang, E.; Liu, Z.; Ou, J.; Li, X.; Ali, M.; Zhang, Y.; Xia, S. Characteristics and precursor information of electromagnetic signals of mining-induced coal and gas outburst. J. Loss Prev. Process Ind. 2018, 54, 206–215. [Google Scholar] [CrossRef]
  7. Das, S.; Mallik, J.; Bandyopadhyay, K.; Das, A. Evaluation of maximum horizontal near-surface stress (SHmax) azimuth and its distribution along Narmada-Son Lineament, India by geogenic Electromagnetic Radiation (EMR) technique. J. Geodyn. 2020, 133, 101672. [Google Scholar] [CrossRef]
  8. Zhou, C.H.; Li, Y.A.; Yin, J.M.; Wang, Y.; Zhou, C.; Guo, X. Multivariate early warning method for rockbursts based on comprehensive microseismic and electromagnetic radiation monitoring. Chin. J. Geotech. Eng. 2020, 42, 457–466. [Google Scholar]
  9. Song, D.; Wang, E.; He, X.; Jia, H.; Qiu, L.; Chen, P.; Wang, S. Use electromagnetic radiation from fractures for mining-induced stress field assessment. J. Geophys. Eng. 2018, 15, 1093–1103. [Google Scholar] [CrossRef] [Green Version]
  10. Wang, E.; He, X.; Liu, X.; Xu, W. Comprehensive monitoring technique based on electromagnetic radiation and its applications to mine pressure. Saf. Sci. 2012, 50, 885–893. [Google Scholar] [CrossRef]
  11. Di, Y.; Wang, E. Rock burst precursor electromagnetic radiation signal recognition method and early warning application based on recurrent neural networks. Rock Mech. Rock Eng. 2021, 54, 1449–1461. [Google Scholar] [CrossRef]
  12. Yin, S.; Song, D.; Li, J.; He, X.; Qiu, L.; Lou, Q.; Wei, M.; Liu, Y. Research on electromagnetic radiation (EMR) waveform characteristics of coal failure process using Hilbert-Huang transform (HHT). Measurement 2022, 187, 110195. [Google Scholar] [CrossRef]
  13. Wang, H.; Wang, E.; Li, Z.; Shen, R.; Liu, X.; Gao, X.; Li, B.; Zhang, Q. Study on safety pressure of water jet breaking coal based on the characteristic analysis of electromagnetic radiation signal. Process Saf. Environ. Prot. 2020, 144, 284–296. [Google Scholar] [CrossRef]
  14. Qiu, L.; Liu, Z.; Wang, E.; Li, B. Early-warning of rock burst in coal mine by low-frequency electromagnetic radiation. Eng. Geol. 2020, 279, 105755. [Google Scholar] [CrossRef]
  15. Frid, V.; Rabinovitch, A.; Bahat, D. Fracture induced electromagnetic radiation. J. Phys. D Appl. Phys. 2003, 36, 1620–1628. [Google Scholar] [CrossRef] [Green Version]
  16. Frid, V.; Bahat, D.; Goldbaum, J.; Rabinovitcha, A. Experimental and theoretical investigations of electromagnetic radiation induced by rock fracture. Isr. J. Earth Sci. 2000, 49, 9–19. [Google Scholar]
  17. Rabinovitch, A.; Frid, V.; Bahat, D. Surface oscillations—A possible source of fracture induced electromagnetic radiation. Tectonophysics 2007, 431, 15–21. [Google Scholar] [CrossRef]
  18. Li, X.B.; Wan, G.X.; Zhou, Z.L. The relation between the frequency of electromagnetic radiation (EMR) induced by rock fracture and attribute parameters of rock masses. Chin. J. Geophys. 2009, 52, 253–259. (In Chinese) [Google Scholar]
  19. Song, D.; Wang, E.; Song, X.; Jin, P.; Qiu, L. Changes in frequency of electromagnetic radiation from loaded coal rock. Rock Mech. Rock Eng. 2016, 49, 291–302. [Google Scholar] [CrossRef]
  20. Wei, M.; Song, D.; He, X.; Li, Z.; Qiu, L.; Lou, Q. Effect of rock properties on electromagnetic radiation characteristics generated by rock fracture during uniaxial compression. Rock Mech. Rock Eng. 2020, 53, 5223–5238. [Google Scholar] [CrossRef]
  21. Loh, C.H.; Wu, T.C.; Huang, N.E. Application of the empirical mode decomposition-Hilbert spectrum method to identify near-fault ground-motion characteristics and structural responses. Bull. Seismol. Soc. Am. 2001, 91, 1339–1357. [Google Scholar] [CrossRef]
  22. Carpinteri, A.; Lacidogna, G.; Manuello, A.; Niccolini, G.; Schiavi, A.; Agosto, A. Mechanical and electromagnetic emissions related to stress-induced cracks. Exp. Tech. 2012, 36, 53–64. [Google Scholar] [CrossRef]
  23. Kong, B.; Wang, E.; Li, Z.; Wang, X.; Liu, X.; Li, N.; Yang, Y. Electromagnetic radiation characteristics and mechanical properties of deformed and fractured sandstone after high temperature treatment. Eng. Geol. 2016, 209, 82–92. [Google Scholar] [CrossRef]
  24. Qiu, L.; Zhu, Y.; Song, D.; He, X.; Wang, W.; Liu, Y.; Xiao, Y.; Wei, M.; Yin, S.; Liu, Q. Study on the nonlinear characteristics of EMR and AE during coal splitting tests. Minerals 2022, 12, 108. [Google Scholar] [CrossRef]
  25. Yin, S.; Song, D.; He, X.; Qiu, L.; Wei, M.; Wang, C.; Chen, Y.; Li, P.; Li, J. Time-frequency evolution law and generation mechanism of electromagnetic radiation in coal friction process. Eng. Geol. 2021, 294, 106377. [Google Scholar] [CrossRef]
  26. Sejdić, E.; Djurović, I.; Jiang, J. Time-frequency feature representation using energy concentration: An overview of recent advances. Digit. Signal Process. 2009, 19, 153–183. [Google Scholar] [CrossRef]
  27. Han, J.; Huang, S.; Zhao, W.; Wang, S. Stress excited electrical dipole model for electromagnetic emission induced in fractured rock. Int. J. Appl. Electrom. 2016, 52, 1023–1034. [Google Scholar] [CrossRef]
  28. Huang, N.E.; Shen, Z.; Long, S.R.; Wu, M.C.; Shih, H.H.; Zheng, Q.; Yen, N.C.; Tung, C.C.; Liu, H.H. The empirical mode decomposition and the Hilbert spectrum for nonlinear and non-stationary time series analysis. Proc. R. Soc. Lond. Ser. A Math. Phys. Eng. Sci. 1998, 454, 903–995. [Google Scholar] [CrossRef]
  29. Zhang, S.; Sun, X.; Li, C.; Xu, X.; Xiong, Z. The analysis of coal or rock electromagnetic radiation (EMR) signals based on Hilbert-Huang transform (HHT). Procedia Eng. 2011, 26, 689–698. [Google Scholar]
  30. Huang, N.E.; Wu, M.L.C.; Long, S.R.; Shen, S.S.P.; Qu, W.; Gloersen, P.; Fan, K.L. A confidence limit for the empirical mode decomposition and Hilbert spectral analysis. Proc. R. Soc. A Math. Phys. Eng. Sci. 2003, 459, 2317–2345. [Google Scholar] [CrossRef]
  31. Dätig, M.; Schlurmann, T. Performance and limitations of the Hilbert-Huang transformation (HHT) with an application to irregular water waves. Ocean Eng. 2004, 31, 1783–1834. [Google Scholar] [CrossRef]
  32. Wu, Z.; Huang, N.E. Ensemble empirical mode decomposition: A noise-assisted data analysis method. Adv. Adapt. Data Anal. 2009, 1, 1–41. [Google Scholar] [CrossRef]
  33. Gilles, J. Empirical wavelet transform. IEEE Trans. Signal Process. 2013, 61, 3999–4010. [Google Scholar] [CrossRef]
  34. Thirumala, T.; Umarikar, A.C.; Jain, T. Estimation of single-phase and three-phase power-quality indices using empirical wavelet transform. IEEE Trans. Power Deliv. 2015, 30, 445–454. [Google Scholar] [CrossRef]
  35. Bhattacharyya, A.; Pachori, R.B. A multivariate approach for patient-specific EEG seizure detection using empirical wavelet transform. IEEE Trans. Biomed. Eng. 2017, 64, 2003–2015. [Google Scholar] [CrossRef]
  36. Li, J.; Li, Y.; Li, Y.; Qian, Z. Downhole microseismic signal denoising via empirical wavelet transform and adaptive thresholding. J. Geophys. Eng. 2018, 15, 2469–2480. [Google Scholar] [CrossRef] [Green Version]
  37. Zhang, Q.; Ding, J.; Zhao, W. An adaptive boundary determination method for empirical wavelet transform and its application in wheelset-bearing fault detection in high-speed trains. Measurement 2021, 171, 108746. [Google Scholar] [CrossRef]
  38. Soille, P. Morphological Image Analysis: Principles and Applications, 2nd ed.; Springer: Berlin/Heidelberg, Germany, 2004. [Google Scholar]
  39. Yang, W.; Li, D.; Zhu, L.; Kang, Y.; Li, F. A new approach for image processing in foreign fiber detection. Comput. Electron. Agr. 2009, 68, 68–77. [Google Scholar] [CrossRef]
  40. Lou, Q.; Song, D.; He, X.; Li, Z.; Qiu, L.; Wei, M.; He, S. Correlations between acoustic and electromagnetic emissions and stress drop induced by burst-prone coal and rock fracture. Saf. Sci. 2019, 115, 310–319. [Google Scholar] [CrossRef]
  41. Fukui, K.; Okubo, S.; Terashima, T. Electromagnetic radiation from rock during uniaxial compression testing: The effects of rock characteristics and test conditions. Rock Mech. Rock Eng. 2005, 38, 411–423. [Google Scholar] [CrossRef]
  42. Carpinteri, A.; Lacidogna, G.; Borla, O.; Manuello, A.; Niccolini, G. Electromagnetic and neutron emissions from brittle rocks failure: Experimental evidence and geological implications. Sadhana 2012, 37, 59–78. [Google Scholar] [CrossRef] [Green Version]
  43. Yin, S.; Song, D.; He, X.; Lou, Q.; Qiu, L.; Li, Z.; Peng, C.; Li, J.; Liu, Y. Structural health monitoring of building rock based on stress drop and acoustic-electric energy release. Struct. Control Health Monit. 2022, 29, e2875. [Google Scholar] [CrossRef]
  44. Zhao, F.; Li, Y.; Ye, Z.; Fan, Y.; Zhang, S.; Wang, H.; Liu, Y. Research on Acoustic Emission and Electromagnetic Emission Characteristics of Rock Fragmentation at Different Loading Rates. Shock Vib. 2018, 2018, 4680879. [Google Scholar] [CrossRef] [Green Version]
  45. Triantis, D.; Pasiou, E.D.; Stavrakas, I.; Kourkoulis, S.K. Hidden Affinities Between Electric and Acoustic Activities in Brittle Materials at Near-Fracture Load Levels. Rock Mech. Rock Eng. 2022, 55, 1325–1342. [Google Scholar] [CrossRef]
  46. Triantis, D.; Vallianatos, F.; Stavrakas, I.; Hloupis, G. Relaxation phenomena of electrical signal emissions from rock following application of abrupt mechanical stress. Ann. Geophys. 2012, 55, 207–212. [Google Scholar] [CrossRef]
  47. Kourkoulis, S.K.; Pasiou, E.D.; Loukidis, A.; Stavrakas, I.; Triantis, D. Comparative Assessment of Criticality Indices Extracted from Acoustic and Electrical Signals Detected in Marble Specimens. Infrastructures 2022, 7, 15. [Google Scholar] [CrossRef]
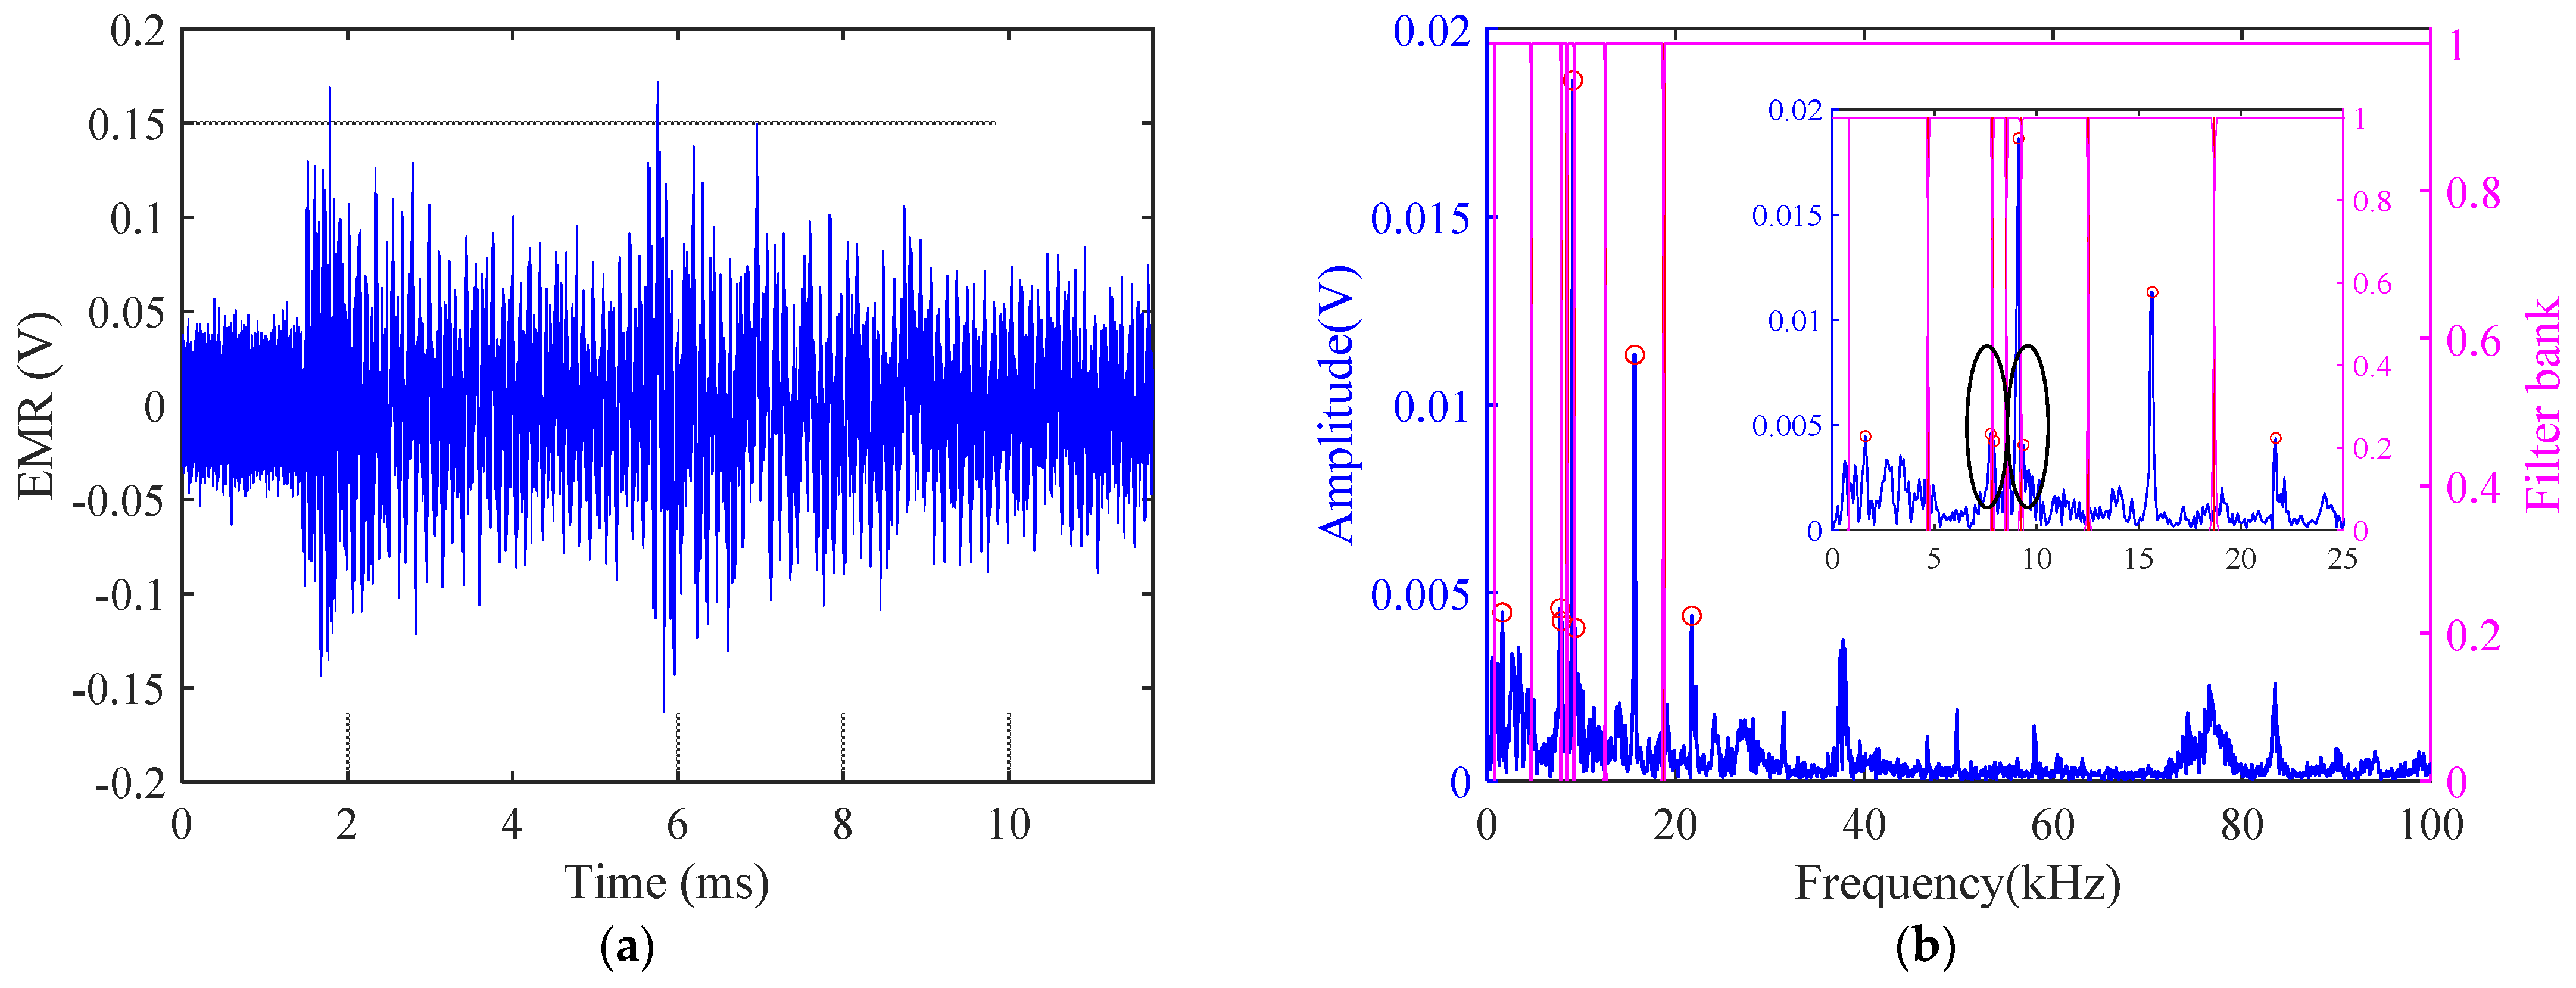
Figure 1. Example of conventional Fourier axis segmentation for EMR waveform: (a) EMR waveform; (b) result of Fourier axis segmentation.
Minerals 12 01307 g001
Figure 2. Closing operation process for Fourier axis: (a) dilation operation result; (b) closing operation result.
Minerals 12 01307 g002
Figure 3. Variation in the numbers of local maxima above the threshold along with α.
Minerals 12 01307 g003
Figure 4. Adaptive segmentation result of the Fourier axis based on DFT and closing operation.
Minerals 12 01307 g004
Figure 5. Result of EWT based on DFT and closing operation: (a) decomposed components of EMR waveform; (b) Fourier spectra of decomposed components.
Minerals 12 01307 g005
Figure 6. Time–frequency spectrum obtained by EWT–HT based on DFT and closing operation.
Minerals 12 01307 g006
Figure 7. Time–frequency spectrum obtained by STFT.
Minerals 12 01307 g007
Figure 8. Adaptive segmentation result of the Fourier axis based on STFT and closing operation.
Minerals 12 01307 g008
Figure 9. Results of EWT based on STFT and closing operation: (a) decomposed components of EMR waveform; (b) Fourier spectra of decomposed components.
Minerals 12 01307 g009
Figure 10. Energy proportion of each component obtained by EWT.
Minerals 12 01307 g010
Figure 11. Time–frequency spectrum obtained by EWT–HT based on STFT and closing operation.
Minerals 12 01307 g011
Figure 12. Schematic diagram of the experimental system.
Minerals 12 01307 g012
Figure 13. Stress curve and EMR signal of the rock sample under loading.
Minerals 12 01307 g013
Figure 14. Time–frequency spectra of EMR waveforms obtained by EWT–HT, the arrival times of EMR waveforms, respectively, are (a) 496.8817 s; (b) 523.3260 s; (c) 538.9143 s; (d) 545.0350 s; (e) 554.2411 s; (f) 599.3472 s; (g) 610.0992 s; (h) 683.4312 s; (i1) 686.4955 s; (i2) 686.5054 s.
Minerals 12 01307 g014
Figure 15. EMD results: (a) decomposed components of EMR waveform; (b) Fourier spectra of decomposed components.
Minerals 12 01307 g015
Figure 16. Comparison of the time–frequency spectra with different drawing frequency resolutions obtained by EWT–HT and HHT: (a) obtained by EWT–HT, 1 kHz; (b) obtained by HHT, 1 kHz; (c) obtained by EWT–HT, 0.5 kHz; (d) obtained by HHT, 0.5 kHz; (e) obtained by EWT–HT, 0.25 kHz; (f) obtained by HHT, 0.25 kHz.
Minerals 12 01307 g016
Figure 17. The 3D time–frequency spectra obtained by HHT, the drawing frequency resolutions are (a) 1 kHz; (b) 0.5 kHz; (c) 0.25 kHz, respectively.
Minerals 12 01307 g017
Figure 18. The time–frequency spectra obtained by STFT, the drawing frequency resolutions, and Hamming window widths were (a) 1 kHz and 1 ms; (b) 1 kHz and 0.5 ms; (c) 1 kHz and 0.25 ms; (d) 0.25 kHz and 0.25 ms, respectively.
Minerals 12 01307 g018
Table 1. Parameters of the EMR waveforms and their time–frequency spectra.
Waveform No.Arrival Time (s)Stress Level (after Peak Stress)Intensity (V)Maximum Amplitude (V)Corresponding Frequency (kHz)
a496.881794.3%0.2290.007733.5
b523.326095.9%0.2820.03399.5
c538.914383.4%0.1460.007073.5
d545.035071.0%0.1330.005924.5
e554.241162.6%1.0320.095373.5
f599.347247.1%0.3250.019373.5
g610.099241.0%0.2260.015919.5
h683.431225.9%0.2890.03692.5
i1686.495518.6%0.1720.017718.5
i2686.505418.6%1.0330.091114.5
Table 2. Parameters of the components obtained by EMD.
imf No.Frequency Band (kHz)Intensity (V)Energy Proportion (%)
imf10–25000.051515.8
imf20–15000.02884.3
imf30–5000.14095.8
imf40–2000.12229.6
imf50–700.068719.0
imf60–250.065129.8
imf70–130.04009.9
imf80–70.02363.5
imf90–20.01112.2
imf100–10.00250.1
Publisher’s Note: MDPI stays neutral with regard to jurisdictional claims in published maps and institutional affiliations.