Article

Combining 3D Geological Modeling and 3D Spectral Modeling for Deep Mineral Exploration in the Zhaoxian Gold Deposit, Shandong Province, China

1
School of Earth Sciences and Resources, China University of Geosciences (Beijing), Beijing 100083, China
2
Shandong Gold Mining Co., Ltd., Xincheng Gold Mine, Yantai 261438, China
3
MNR Key Laboratory for Exploration Theory & Technology of Critical Mineral Resources, China University of Geosciences (Beijing), Beijing 100083, China
4
Beijing Key Laboratory of Land and Resources Information Research and Development, Beijing 100083, China
5
School of Geography, Southwest University, Chongqing 400715, China
6
Shandong Provincial Engineering Laboratory of Application and Development of Big Data for Deep Gold Exploration, Weihai 264209, China
*
Author to whom correspondence should be addressed.
Minerals 2022, 12(10), 1272; https://doi.org/10.3390/min12101272
Submission received: 3 August 2022 / Revised: 29 September 2022 / Accepted: 4 October 2022 / Published: 9 October 2022
(This article belongs to the Special Issue 3D/4D Geological Modeling for Mineral Exploration)

Abstract

:
The Jiaodong Peninsula hosts the main large gold deposits and was the first gold production area in China; multisource and multiscale geoscience datasets are available. The area is the biggest drilling mineral-exploration zone in China. This study used three-dimensional (3D) modeling, geology, and ore body and alteration datasets to extract and synthesize mineralization information and analyze the exploration targeting in the Zhaoxian gold deposit in the northwestern Jiaodong Peninsula. The methodology and results are summarized as follows: The regional Jiaojia fault is the key exploration criterion of the gold deposit. The compression torsion characteristics and concave–convex section zones in the 3D deep environment are the main indicators of mineral exploration using 3D geological and ore-body modeling in the Zhaoxian gold deposit. The hyperspectral detailed measurement, interpretation, and data mining used drill-hole data (>1000 m) to analyze the vectors and trends of the ore body and ore-forming fault and the alteration-zone rocks in the Zhaoxian gold deposit. The short-wave infrared Pos2200 values and illite crystallinity in the alteration zone can be used to identify 3D deep gold mineralization and potential targets for mineral exploration. This research methodology can be globally used for other deep mineral explorations.

1. Introduction

As a universal currency, gold has anti-inflation and safe-haven functions. It has always played an important role in the global financial system, especially during financial crises, which highlights its safe-haven function. As such, gold is currently used as a reserve by most governments to maintain economic and material stability. In addition to the official gold reserves, gold is essential for industry, healthcare, and high-tech fields. For China, gold is a credit instrument related to foreign trade and economic cooperation [1]. The Jiaodong Peninsula is the most important gold-producing area in China and the third largest gold-mining area in the world, with proven gold resources exceeding 5000 t [2]. For a long time, researchers have carried out geological, geophysical, and geochemical works in the Jiaodong Gold Mine and accumulated abundant data, which provided an important basis for deep prospecting [2,3,4,5,6]. Since the implementation of the exploration breakthrough strategic action in 2011 [5,6,7], major exploration breakthroughs have been made in important gold belts such as Sanshandao, Jiaojia, and Zhaoping in Jiaodong [7]. By 2020, the prospecting depth had expanded from 500 m to 4000 m, forming large gold deposits such as Sanshandao, Jiaojia, Linglong, and Denggezhuang. Because of the metallogenic background, the mineralization and production environment are significantly different from those of other types of gold deposits known in the world; this type of deposit is named the Jiaodong-type gold deposit [5]. According to the different mineralization patterns, the gold deposits in this area can be subdivided into Jiaojia-, Linglong-, and Pengjiakuang-type gold deposits [6]. The Zhaoxian gold deposit is located in the northwest of the Jiaojia Gold Mine and is currently the mining area with the largest average exploration depth in China. In-depth analysis of the ore-body geological characteristics of this large gold mine will be of great significance for promoting deep ore prospecting in the Jiaojia ore field [8].
Recently, short-wavelength infrared (SWIR) spectroscopy has been widely applied in mineral exploration. Its wavelength range is between 1300 nm and 2500 nm, which can effectively identify minerals containing hydroxyl groups, amino groups, partial carbonates, and sulfates according to the difference between the reflection absorption of SWIR light and characteristic absorption peaks of the functional groups [9,10,11,12]. This method can quickly identify deep minerals and alteration zones in actual exploration and has been successfully applied to porphyry deposits, epithermal deposits, volcanogenic massive sulfide deposits, and some iron oxide–copper–gold (IOCG) deposits [13,14,15,16]. With the introduction of computer three-dimensional (3D) modeling technology, geological prospecting prediction has gradually developed from the two-dimensional (2D) plane to 3D space prediction. Three-dimensional geological modeling is a technology that provides 3D visualization through the integration of multisource and multiscale geoscience data [17,18,19]. Three-dimensional geological modeling allows capturing the geometry of structures at regional and local scales, visualizing the subsurface architecture of deposits and intrusions, and understanding fluid transport processes [20]. Data-driven geographic information system (GIS) based methods for integrating multisource and multisource spatial geoscience datasets have been widely used in mineral-potential mapping for exploration targeting in a data-rich mining area [18].
With the deep mineral-exploration work, SWIR-spectrum 3D alteration mapping has also been applied. For example, Harraden et al. (2013) carried out drill-hole SWIR exploration on the pebble-porphyry Cu–Au–Mo deposit in eastern North America, divided the wall-rock alteration zones in detail on the 3D scale of the mining area, and established the 3D geology and alteration model of the pebble deposit [21]. Chen et al. (2019) [22] performed mineral alteration mapping on the Tonglushan copper–gold deposit and established 3D attribute modeling based on the parameters of chlorite Pos2250 and kaolinite Pos2170, thus establishing altered-mineral-exploration targets in this area. Predecessors have conducted significant research on the altered minerals in the Jiaodong area, but most of them were based on element geochemistry, and no study has combined the SWIR spectrum and 3D modeling in this area. Therefore, this work aimed to use the SWIR spectroscopy measurement and interpretation of the altered-mineral datasets (depth > 1000 m) of the Zhaoxian gold deposit to identify the altered-mineral assemblage and zonation characteristics in the deep part of the mineralization area. By combining the SWIR and 3D geological modeling, the 3D multiparameter model of the altered minerals and the ore body can be quickly established; therefore, it is possible to compare and study the characteristics of alteration-zone minerals in depth and the spatial distribution of the mineralization in one dimension (1D), 2D, and 3D, and then make a 3D comprehensive prediction to optimize the favorable finding area and provide a basis for drilling verification.

2. Deposit Geology and Mineralization

The Zhaoxian gold deposit is located in the Jiaojia ore field of the northwestern Jiaodong Peninsula in China, which is approximately 15 km northeast of Laizhou City (Figure 1) [23]. The gold deposits in the region are controlled by NNE-trending faults, and their gold ore bodies are mostly hosted in the altered rocks within the footwalls of NNE–NE-trending faults. The deep part (1400 m to 2400 m) of the mining zone is bounded by the Jiaojia main fault surface [2,24]. The wall-rock lithology is Linglong granite and metamorphic rock of the Jiaodong Group, and the footwall is ore-bearing altered-rock zones and Linglong-series monzogranite (ca. 160 Ma) and Guojialing-series granodiorite (ca. 130 Ma) [18].
The altered rocks in the study area are distributed in strips, which are characterized by the superposition of various alterations and obvious alteration zoning (Figure 2) [3,18]. The altered rocks can be divided into the components of the main regional Jiaojia fault according to the alteration type, degree, and mineral assemblage. The hanging wall of the Jiaojia fault has sericite-granitized cataclastic rock and sericite granite zones, and the footwall has pyrite–sericite–quartz granitized cataclastic rock and pyrite–sericite–quartz granite zones. The gold ore body is mainly in disseminated, veinlet-disseminated, and veinlet forms (Figure 2). Pyrite is the main gold-bearing mineral, and the shallow zone is mostly enriched in pyrite–sericite–quartz cataclastic rocks, whereas the deep zone is mostly enriched in pyrite–sericite–quartz cataclastic rocks and pyrite–sericite–quartz granitized cataclastic rocks. The alteration develops along the wall rock of the fault structures, including potassium feldspar, hematite mineralization (reddenization), pyrite–sericite–quartz alteration, and carbonation, as well as chloritization, kaolinization, etc. Pyrite–sericite–quartz alteration is a general term for sericitization, silicification, and pyritization [8]. Pyrite-sericite-quartz altered rock and potassium-altered (reddenized) rock are usually gold-enrichment zones. The study area has multiperiod and multistage hydrothermal processes, which show the evolution and metasomatism of hydrothermal functions, coupled with multistage tectonic activities. According to the metallogenic relationships among the ore-controlling fault structures, hydrothermal veins, and gold mineralization, previous researchers have divided the hydrothermal metallogenesis into four stages, which are summarized in Table 1 [7,8,25].

3. Materials and Methods

3.1. 3D Geological Modeling

Three-dimensional geological modeling technology uses the knowledge of geology, geostatistics, space science, and other fields to model the possible extent of geological objects in deep geological bodies based on surface geological data, underground drill-hole data [26,27], etc. Modeling software enables 3D visualization, spatial feature analysis, geological interpretation, and resource evaluation [26,27]. This study used SKUA-GOCAD 18.0 (18.0, Emerson, St. Louis, MI, USA) to establish a 3D geological model of the Zhaoxian gold deposit. In this work, the geological data used included a geological map, several exploration sections, and 19 drill holes of more than 1400 m depths. The four-step 3D geological modeling method is given as follows.
(1) A 3D fault model is created based on 1:2000 exploration-line profile data. The image coordinates are corrected by MapGIS (6.7, Wuhan Zhongdi Information Engineering Co., Ltd., Wuhan, China) to obtain the fault-boundary lines, and then SKUA-GOCAD is used to connect the fault-boundary lines of adjacent profiles and perform surface smoothing.
(2) Based on the exploration-line profile and drill-hole data, the ore-body boundary vectorization is carried out to construct a 3D ore-body model of the developed gold deposit.
(3) According to the geological map, exploration-line profile, and drill-hole data, the formation surface profile is extracted. Based on the workflow of SKUA-GOCAD software, stratum modeling is carried out and the geological significance of curves is given. The block model is established to generate a 3D stratum model.
(4) A kriging spatial interpolation model is established using drill-hole geochemical data. The specific steps are to extract Au grade information first, then establish a grid model and generate ellipsoids using variogram analysis, and, finally, apply kriging for spatial interpolation.

3.2. Spectral Analysis

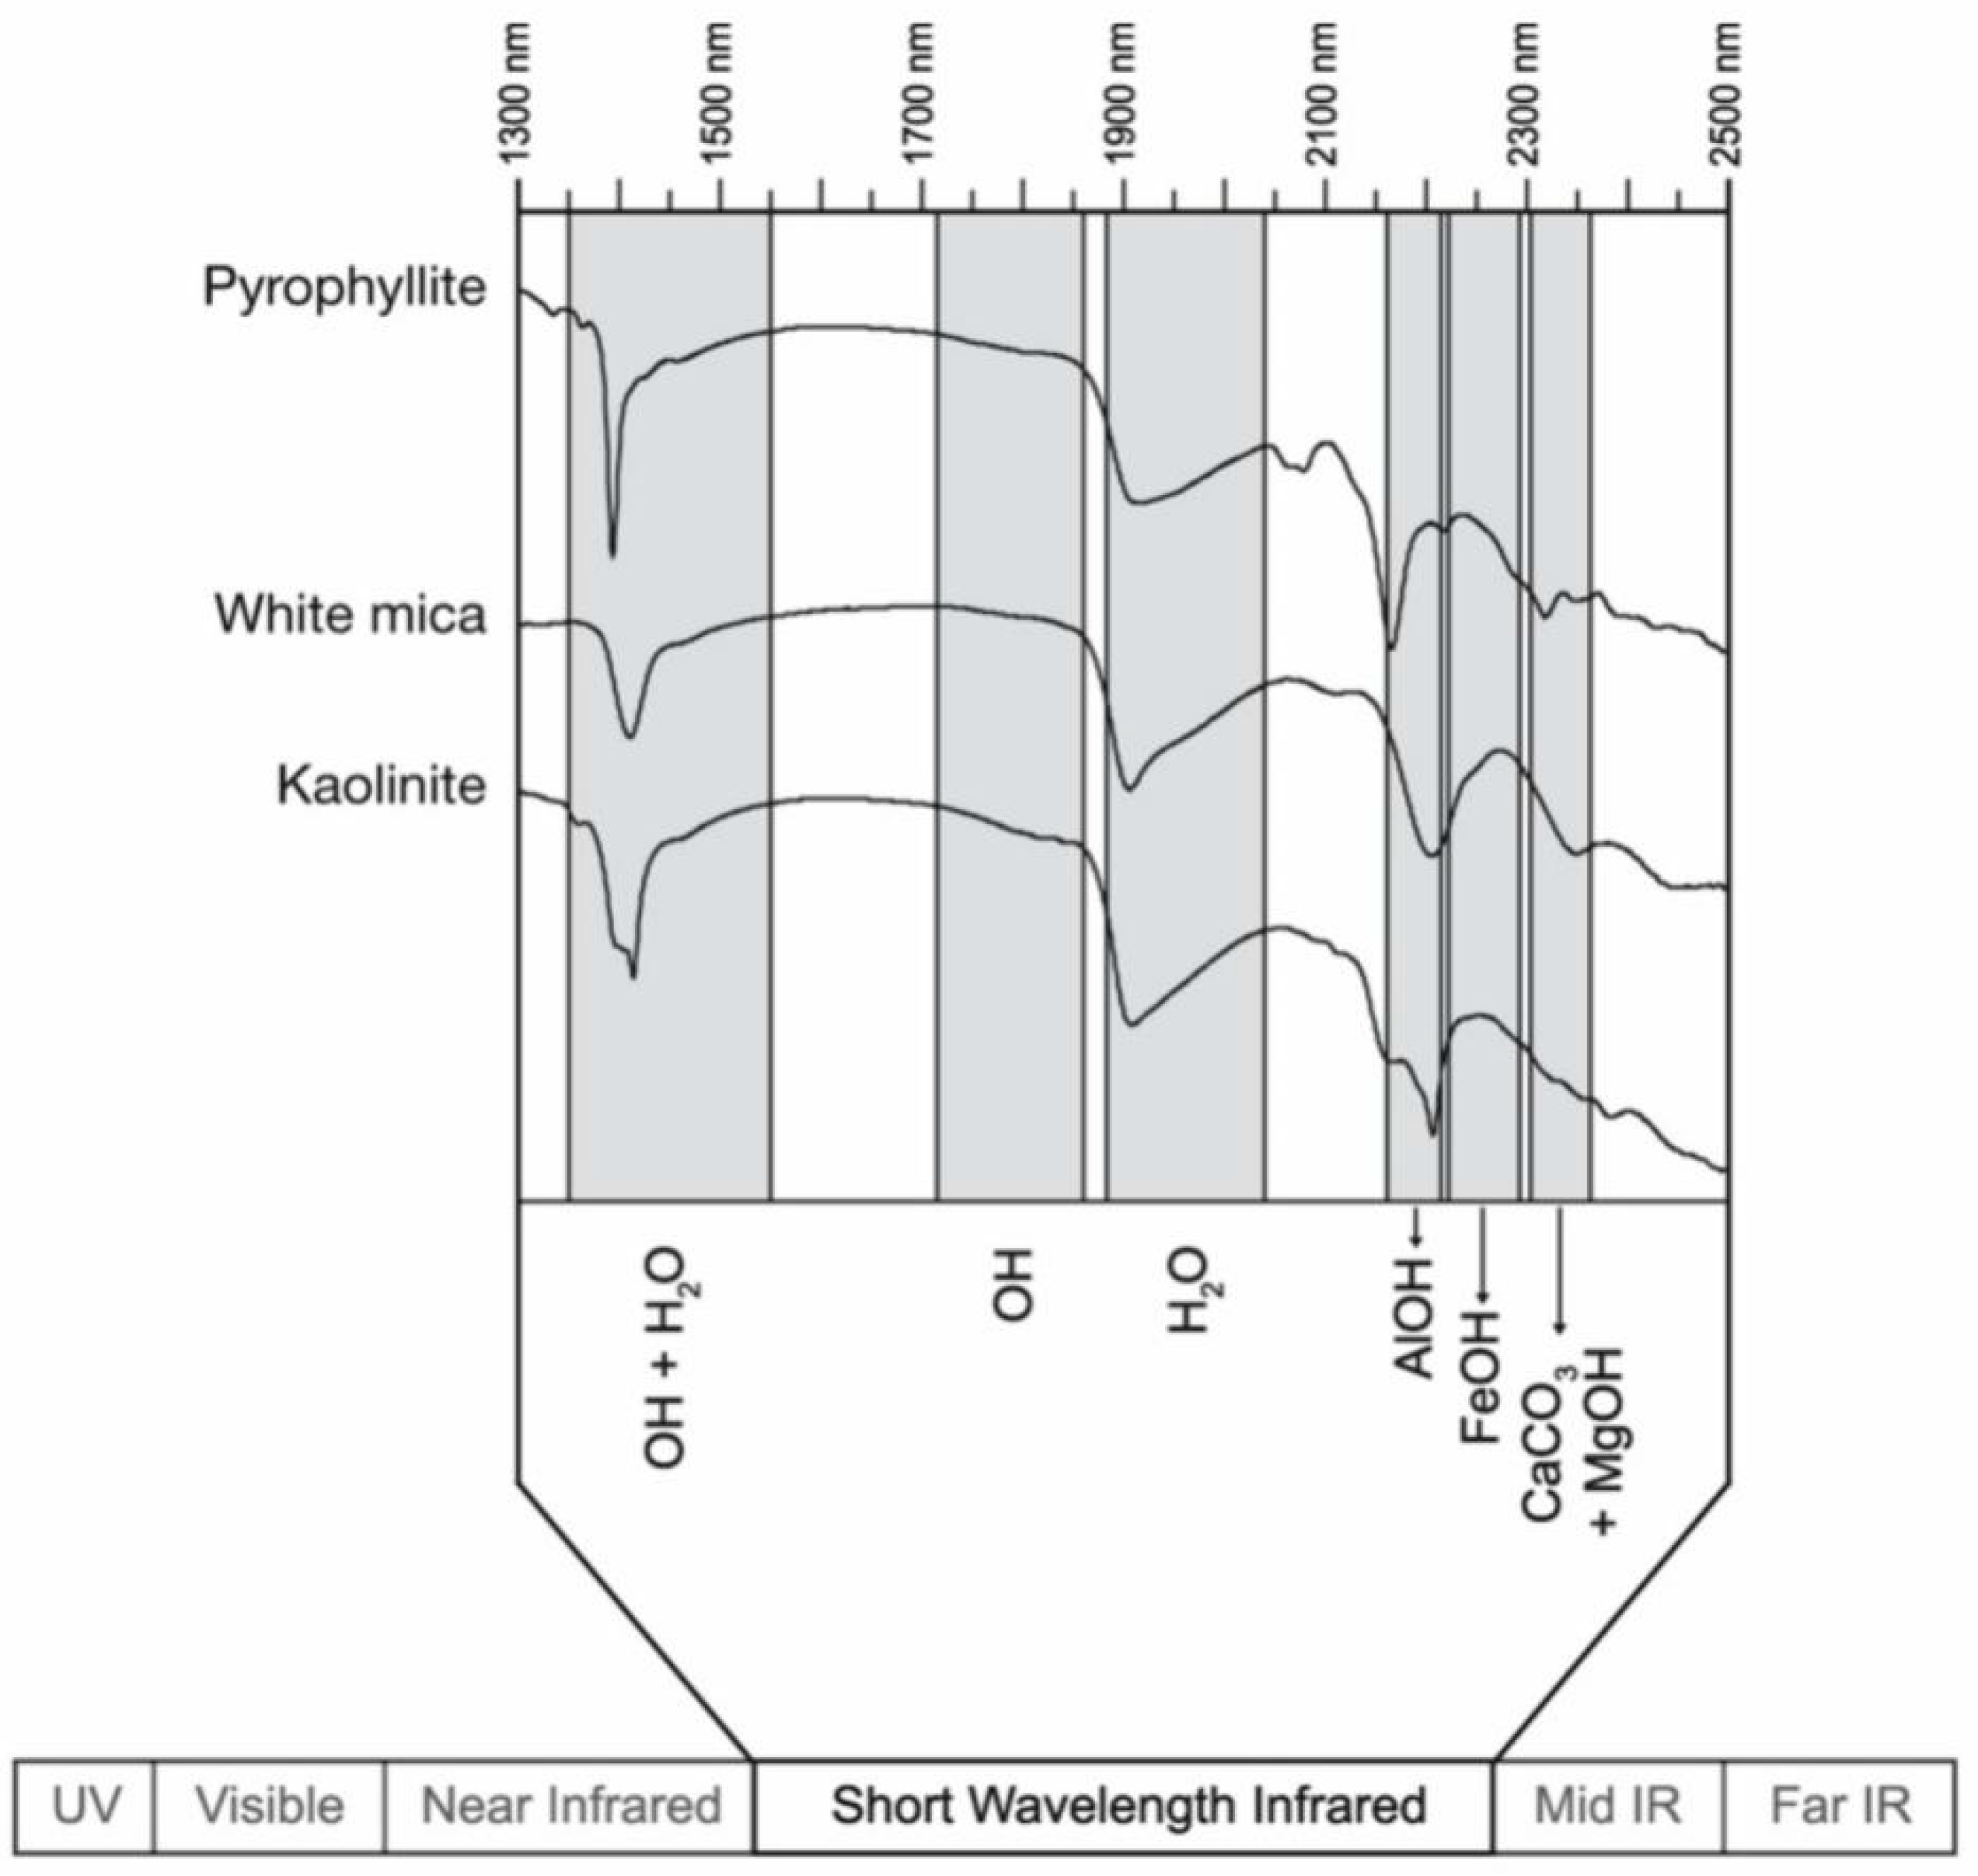
SWIR spectroscopy is based on the selective absorption characteristics of some specific groups in minerals to SWIR light. The spectral curves can be matched with the standard minerals or mineral assemblages in the spectral library through algorithms (such as The Spectral Assistant in Spectral Geologist (TSG8) software (TSGTM 8, CSIRO, North Ryde, Australia)) to identify minerals (Figure 3) [28,29]. When a sample is illuminated by light in a spectrometer, the molecular bonds in the minerals stretch and bend causing vibrations that result in the adsorption of certain wavelengths of light. In phyllosilicates (including white mica, kaolinite, and montmorillonite), the molecular bonds that cause such vibrations are mainly those in water and hydroxyl groups, including Al–OH, Mg–OH, and Fe–OH [30,31]. Furthermore, a scalar-extraction method has been constructed. This method takes the specific absorption characteristics of the spectrum as the research object (Figure 3), extracts the scalar in the spectral curve, and provides information about the mineral composition and displacement caused by changes in the cationic composition (for example, Tschermak substitution in muscovite) according to the scalar [32,33]. The use of scalars can improve traceability and comparability between different datasets [21].
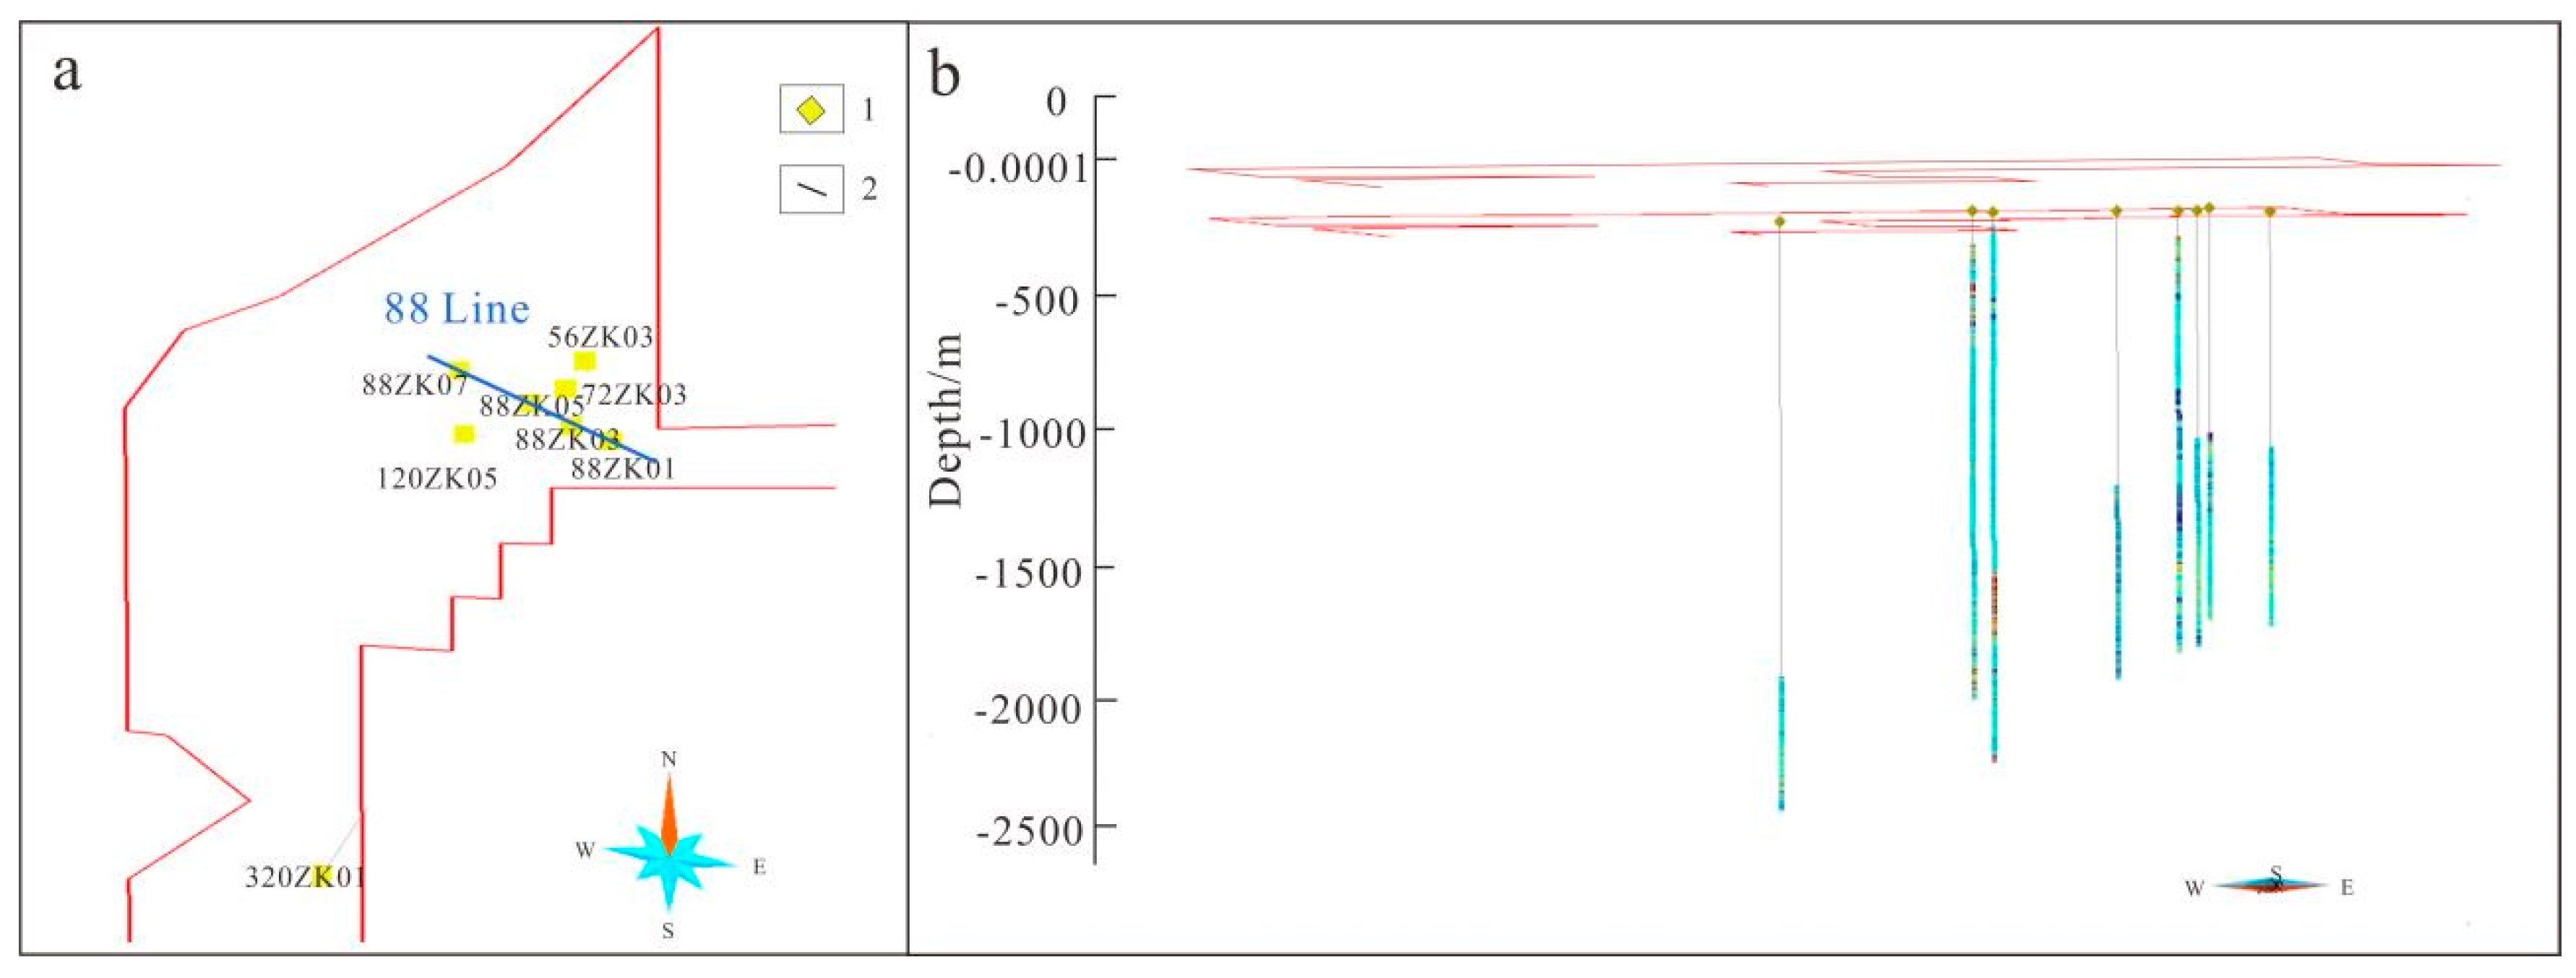
To comprehensively analyze the spectral characteristics of the study area and establish a 3D spectral model, the data involved in this work included five exploration lines in the Zhaoxian gold deposit area and a total of eight drill holes, of which the No. 88 Exploration Line was mainly used for the scalar extraction of layered silicates (Figure 4). Sample locations are roughly equidistant, and intensive sampling was carried out near the mineralization. The sample locations included the surrounding rock, alteration zone, and mineralization center. The spectral analysis of these samples identifies the fluid migration and element migration in the study area.
The SWIR spectrometer used in the study area is an oreXpress mineral analyzer (oreXpressTM, Spectral Evolution, Haverhill, MA, USA). The effective test wavelength range of the instrument is 350–2500 nm, which has a good signal-to-noise ratio (SNR) [23]. When the contact probe is used to test the sample, real-time mineral identification is carried out by spectral matching through proprietary EZ-ID spectral data acquisition software (1.4, Spectral Evolution, Haverhill, MA, USA), which has the United States Geological Survey and SpecMIN mineral libraries built in. The sampling bandwidth of the spectrometer is 1 nm, and the minimum scanning speed is 100 milliseconds. When performing spectral testing, the instrument needs to be preheated for 10–30 min, and then an international standard spectral whiteboard is used for calibration. During the testing process, the core was strictly guaranteed to be dry and clean.
Spectral Geologist software (TSG8) (TSGTM 8, CSIRO, North Ryde, Australia) was used to process the spectral data. The software matches the waveform of the spectral curve and the position of the absorption peak with the spectral library to determine mineral types and extract spectral information [34]. In the data processing, a Hull quotient removal of the spectral data was carried out. A baseline (Hull) was fitted to each reflectance spectrum. At each wavelength, the reflectance was divided by the corresponding value on the baseline (the Hull quotient) to remove the background effect [32,35]. The absorption characteristics of the spectrum can be enhanced by correcting the baseline [30].
This work adopted the PFIT (A TSG-provided method for extracting scalars to extract more accurate spectral feature parameters)processing method, which is based on the polynomial fitting of the spectral curve after removing the Hull quotient to extract the spectral features [9,10,36]. When analyzing layered silicate minerals in this work, the fourth derivative is calculated after removing the Hull quotient to obtain the fourth-derivative spectrum and extract the scalars. The minimum absorption peak position of Al–OH at 2200 nm and the absorption depths at 2200 nm, 1900 nm, and 2160 nm are extracted. The specific meanings are shown in Table 2.

4. Results

4.1. 3D Geological Model

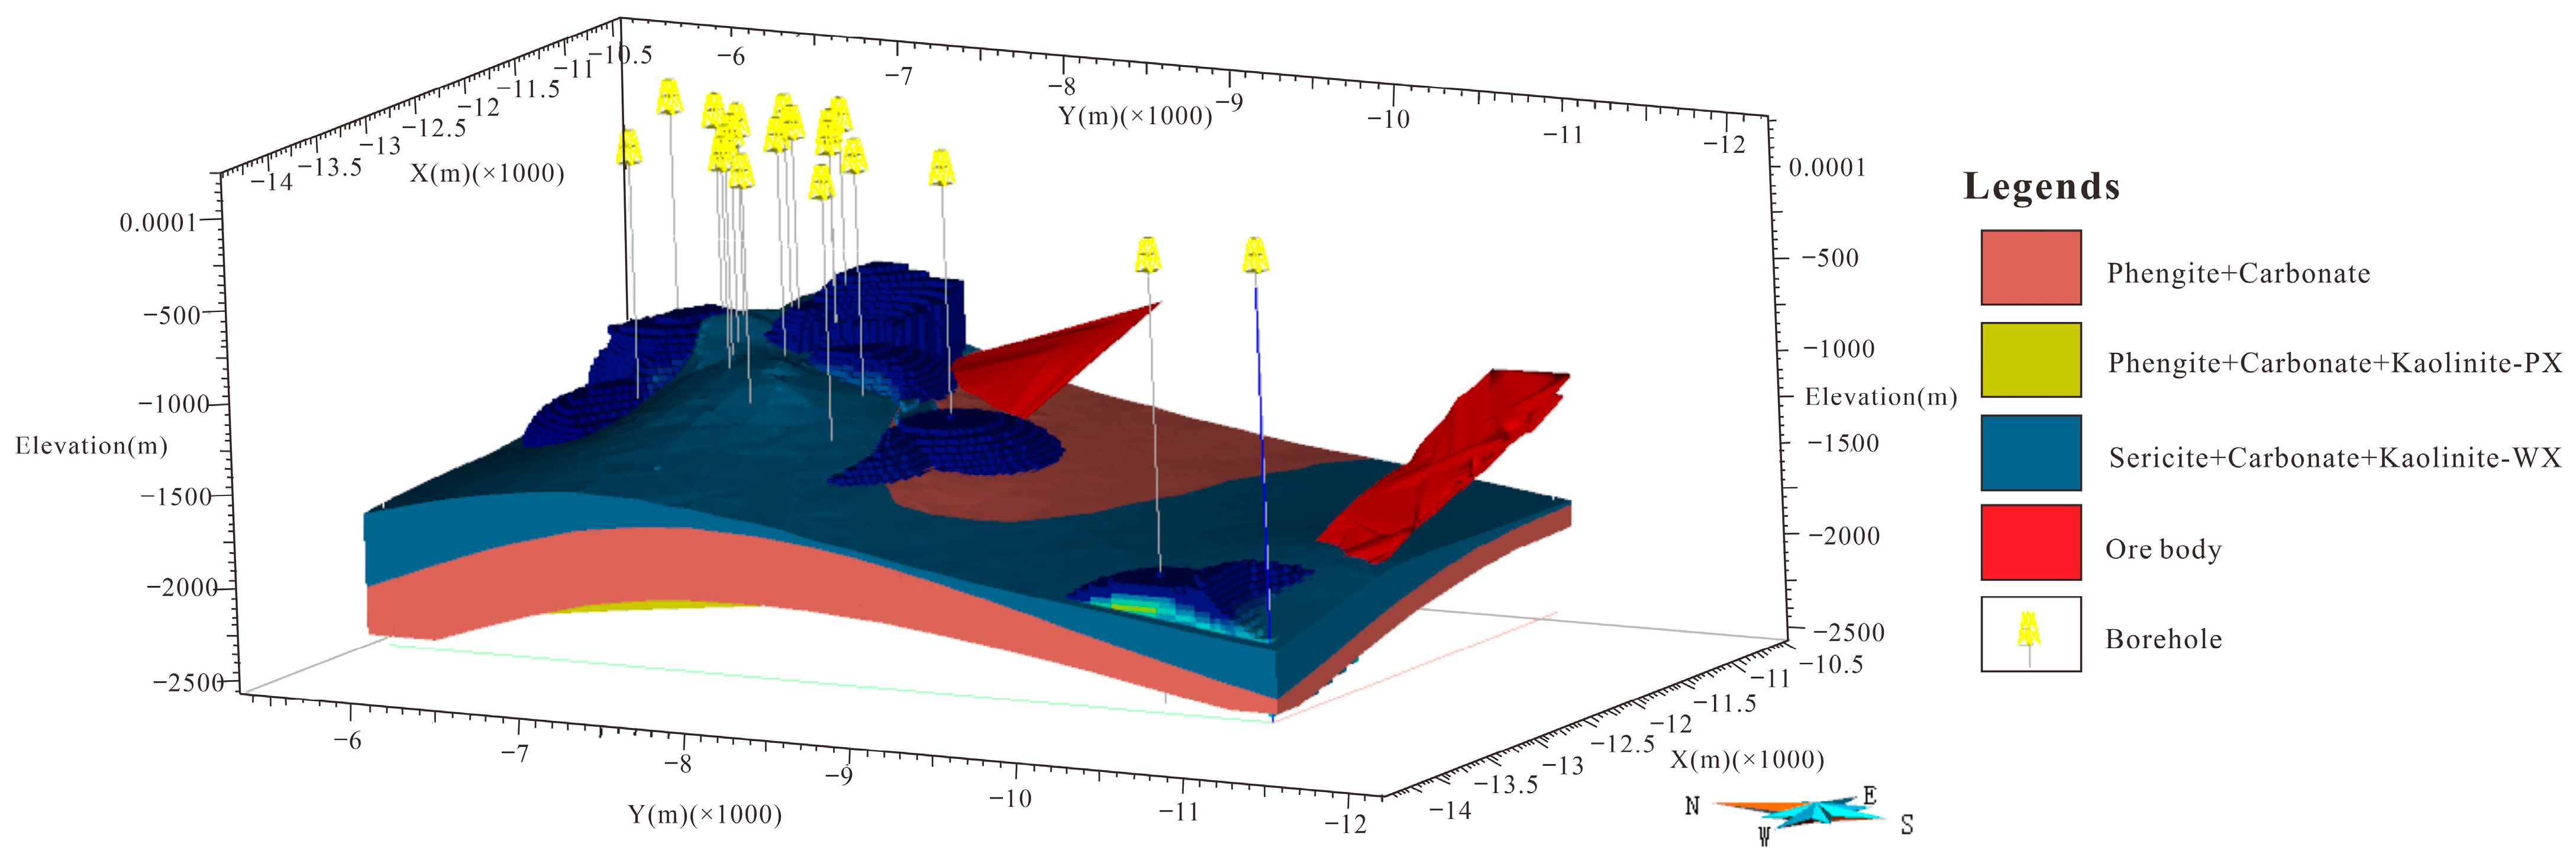
The 3D geological model used for alteration modeling in the Zhaoxian mining area includes a 3D fault model and a 3D ore-body and grade-interpolation model. A 3D structural alteration-zone model is constructed to constrain the spatial range of the alteration-zone mineral parameters and the Au grade-interpolation modeling.

4.1.1. 3D Fault Modeling

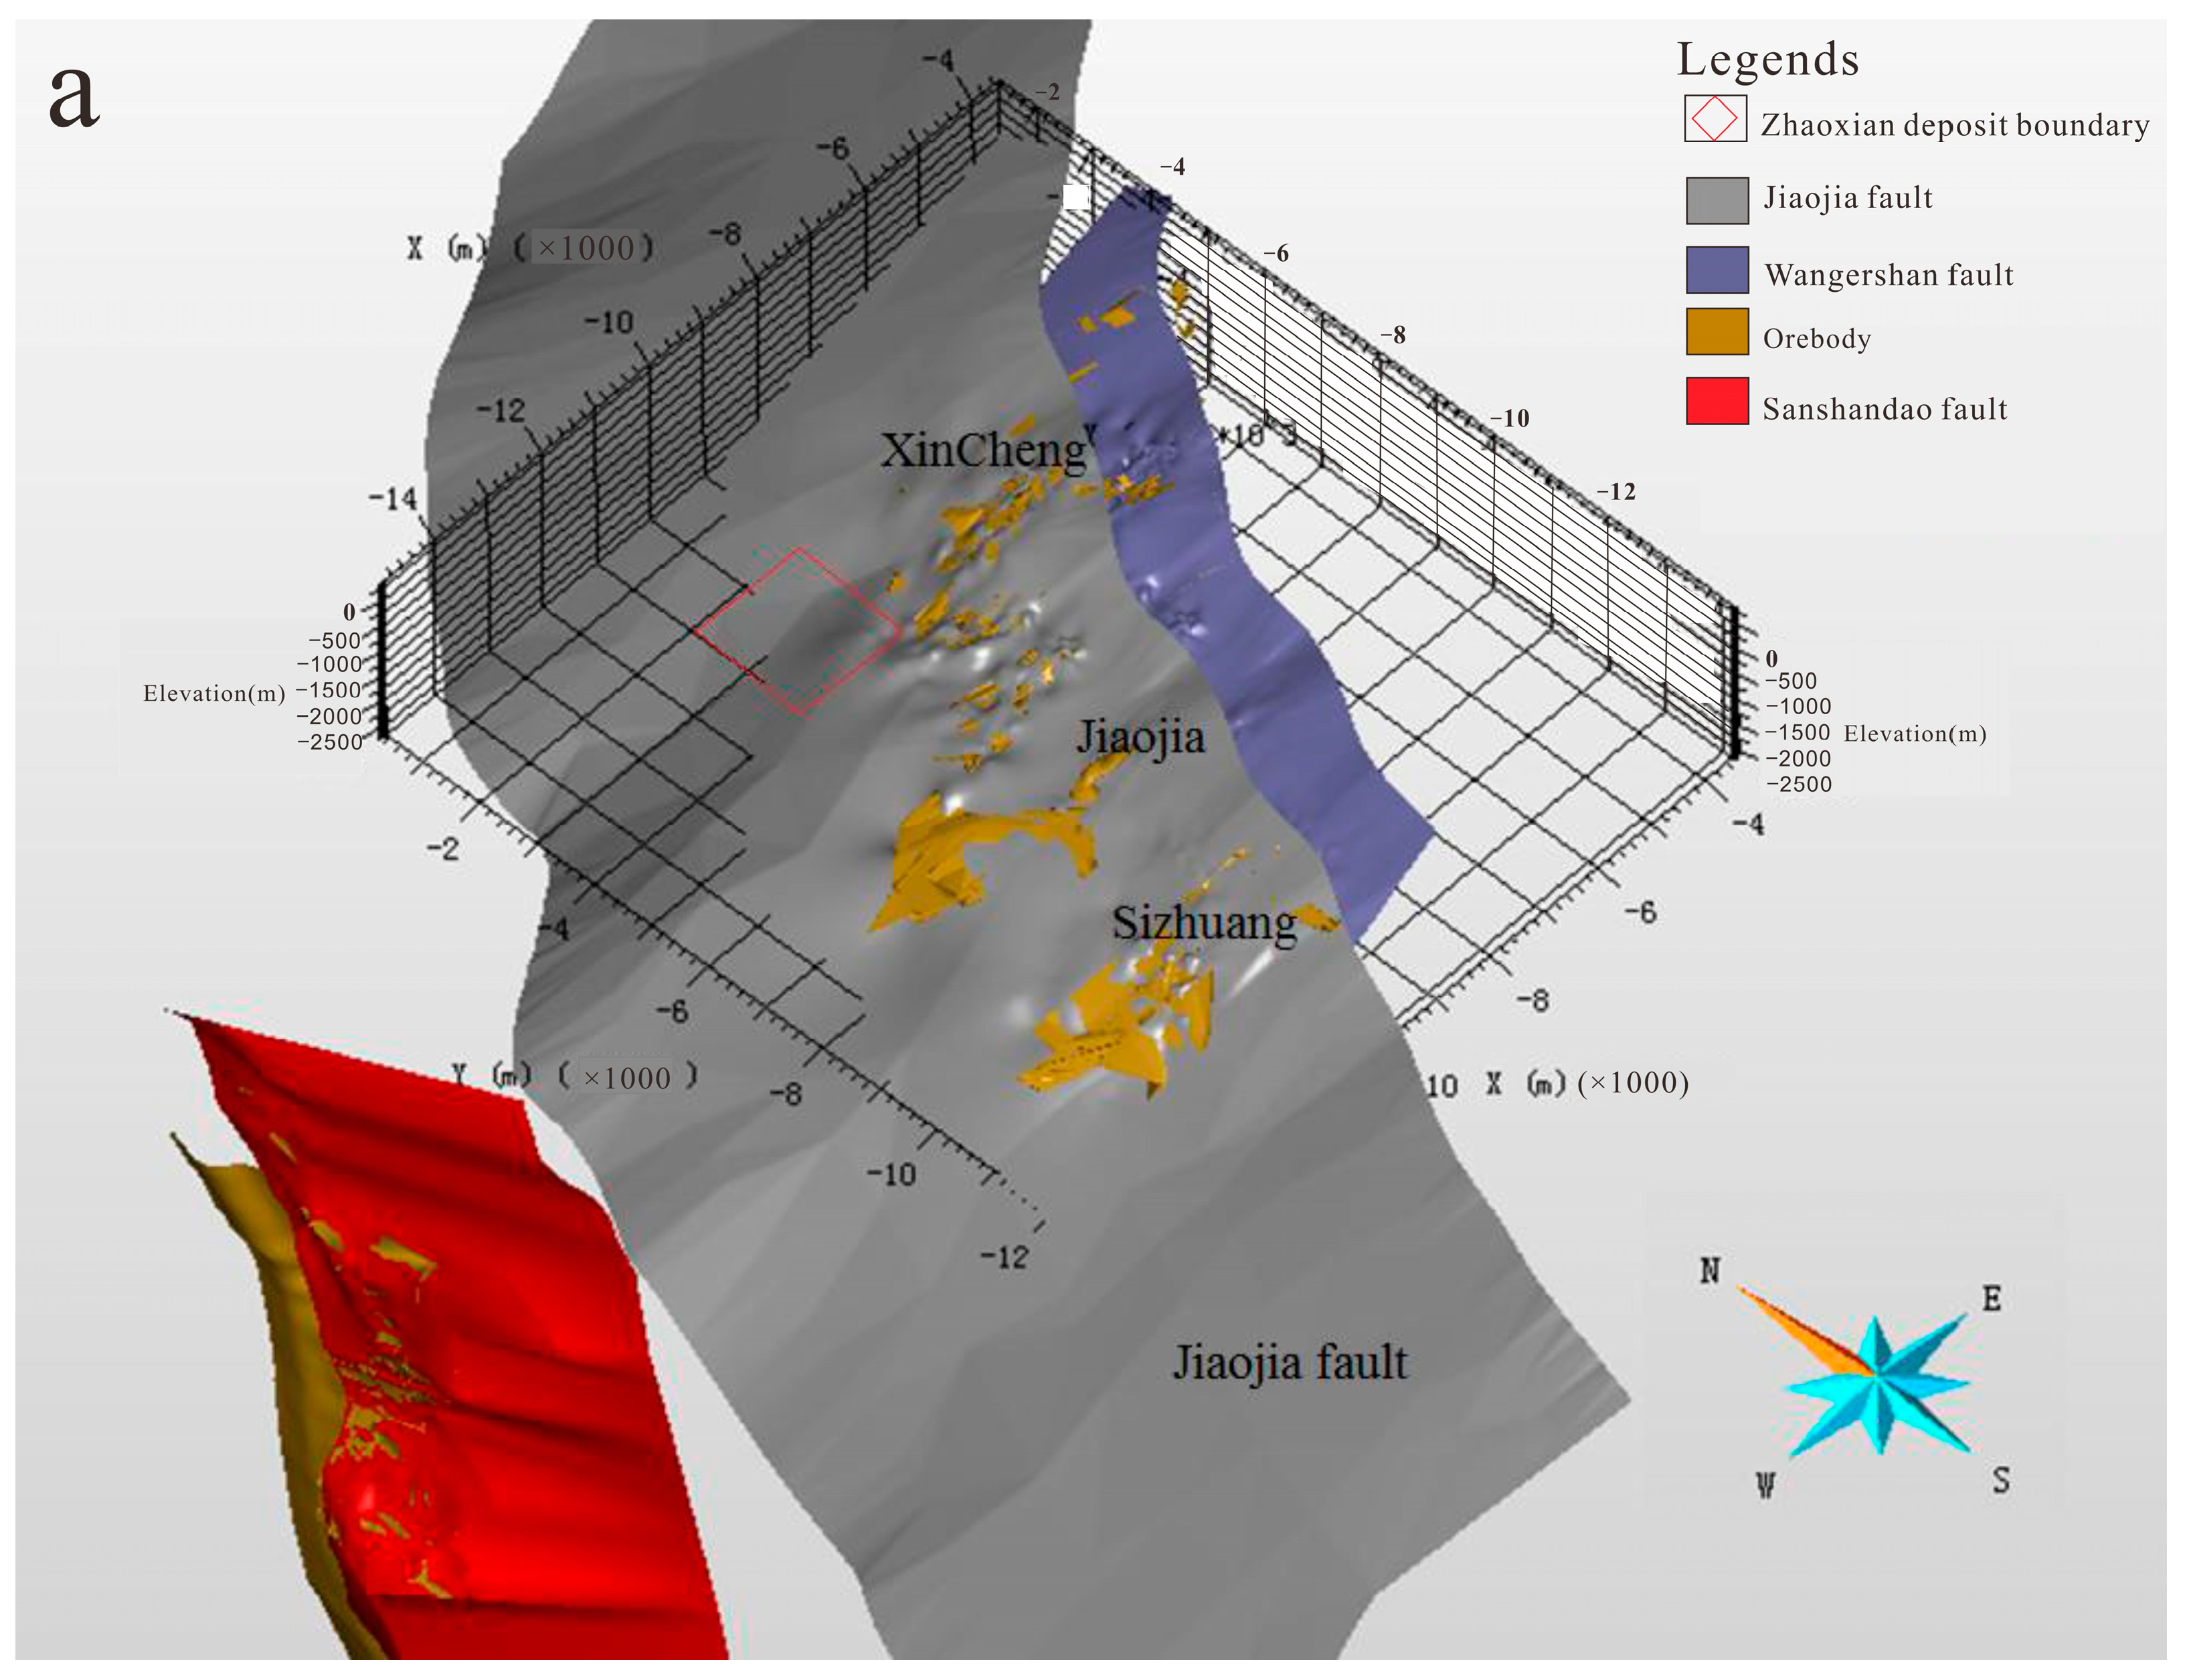
Using SKUA-GOCAD software, 3D ore-body and fault models of the Xincheng, Zhaoxian, Sizhuang, and Wang’ershan deposits were established from drill holes and geological sections, which can reflect the spatial location and geometry of the fault structures in the region, as well as the spatial correspondence between them and the main ore bodies. The 3D fault and ore-body model shown in Figure 5a was established by the location of the fault clay in the drill holes. The main fault surface is continuous and stable, extending from west to east; the fault controls the Xincheng, Zhaoxian, and Sizhuang gold deposits. The secondary faults in the footwall of the main fault zone, such as the Sanshandao and Wang’ershan faults, are relatively developed, and the occurrence changes of the main and secondary faults are in a gentle wave shape in the strike and tendency. The concave or convex zones in Figure 5a,b are the intrusion body boundaries of the Linglong-series monzogranite and the Guojialing-series granodiorite at depth. Additionally, the regional structure controls the distribution of gold ore bodies, keeping them close to the footwall with good continuity (Figure 5b).

4.1.2. 3D Ore-Body and Au Grade-Interpolation Modeling

The 3D gold-deposit ore-body modeling of the area uses the traditional explicit modeling method, including roughly determining the ore-body range using the ore-body boundary line determined from mining engineering and drill-hole datasets (Figure 5a, Figure 6). For this work, additional gold grade geochemistry datasets were acquired in the drill holes [18]. The constructed ore-body model is shown in Figure 6. The ore body has inclined veins and stable shape, and its occurrence is consistent with the fault (Figure 5b), most of which are distributed in the pyrite–sericite–quartz alteration zone (Figure 6). There is a close spatial and temporal relationship between the ore body and pyrite–sericite–quartz alteration zone.
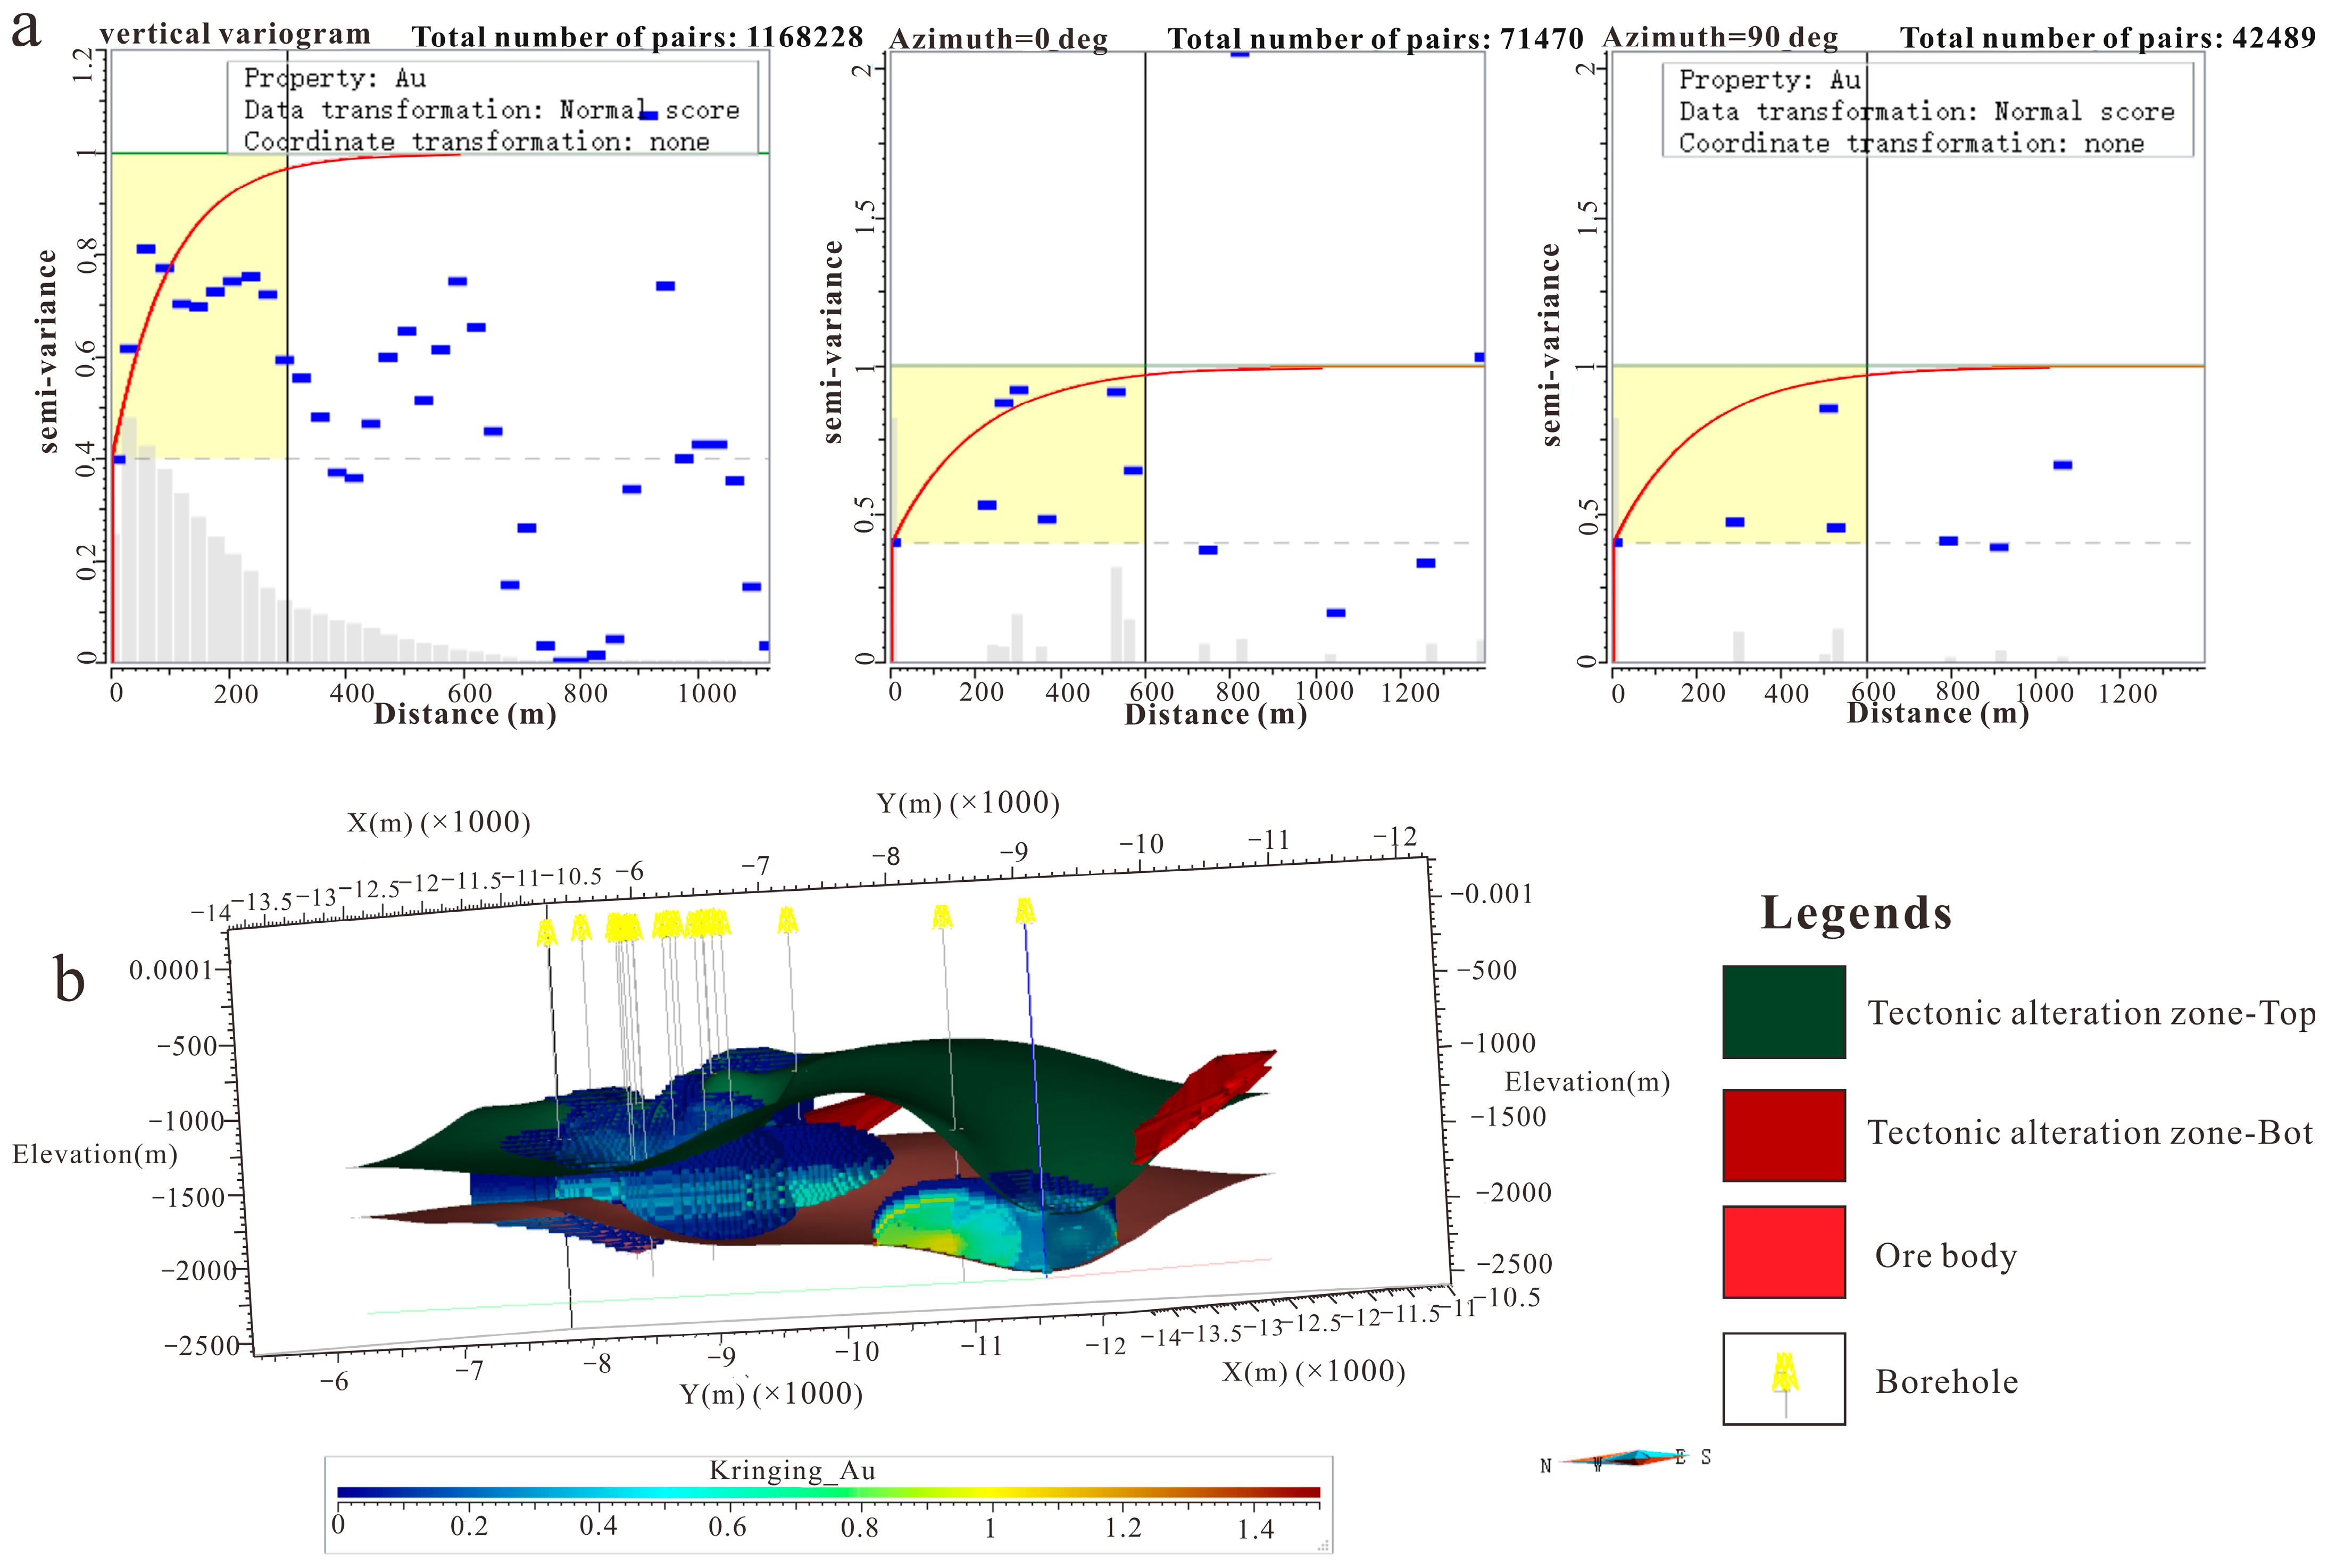
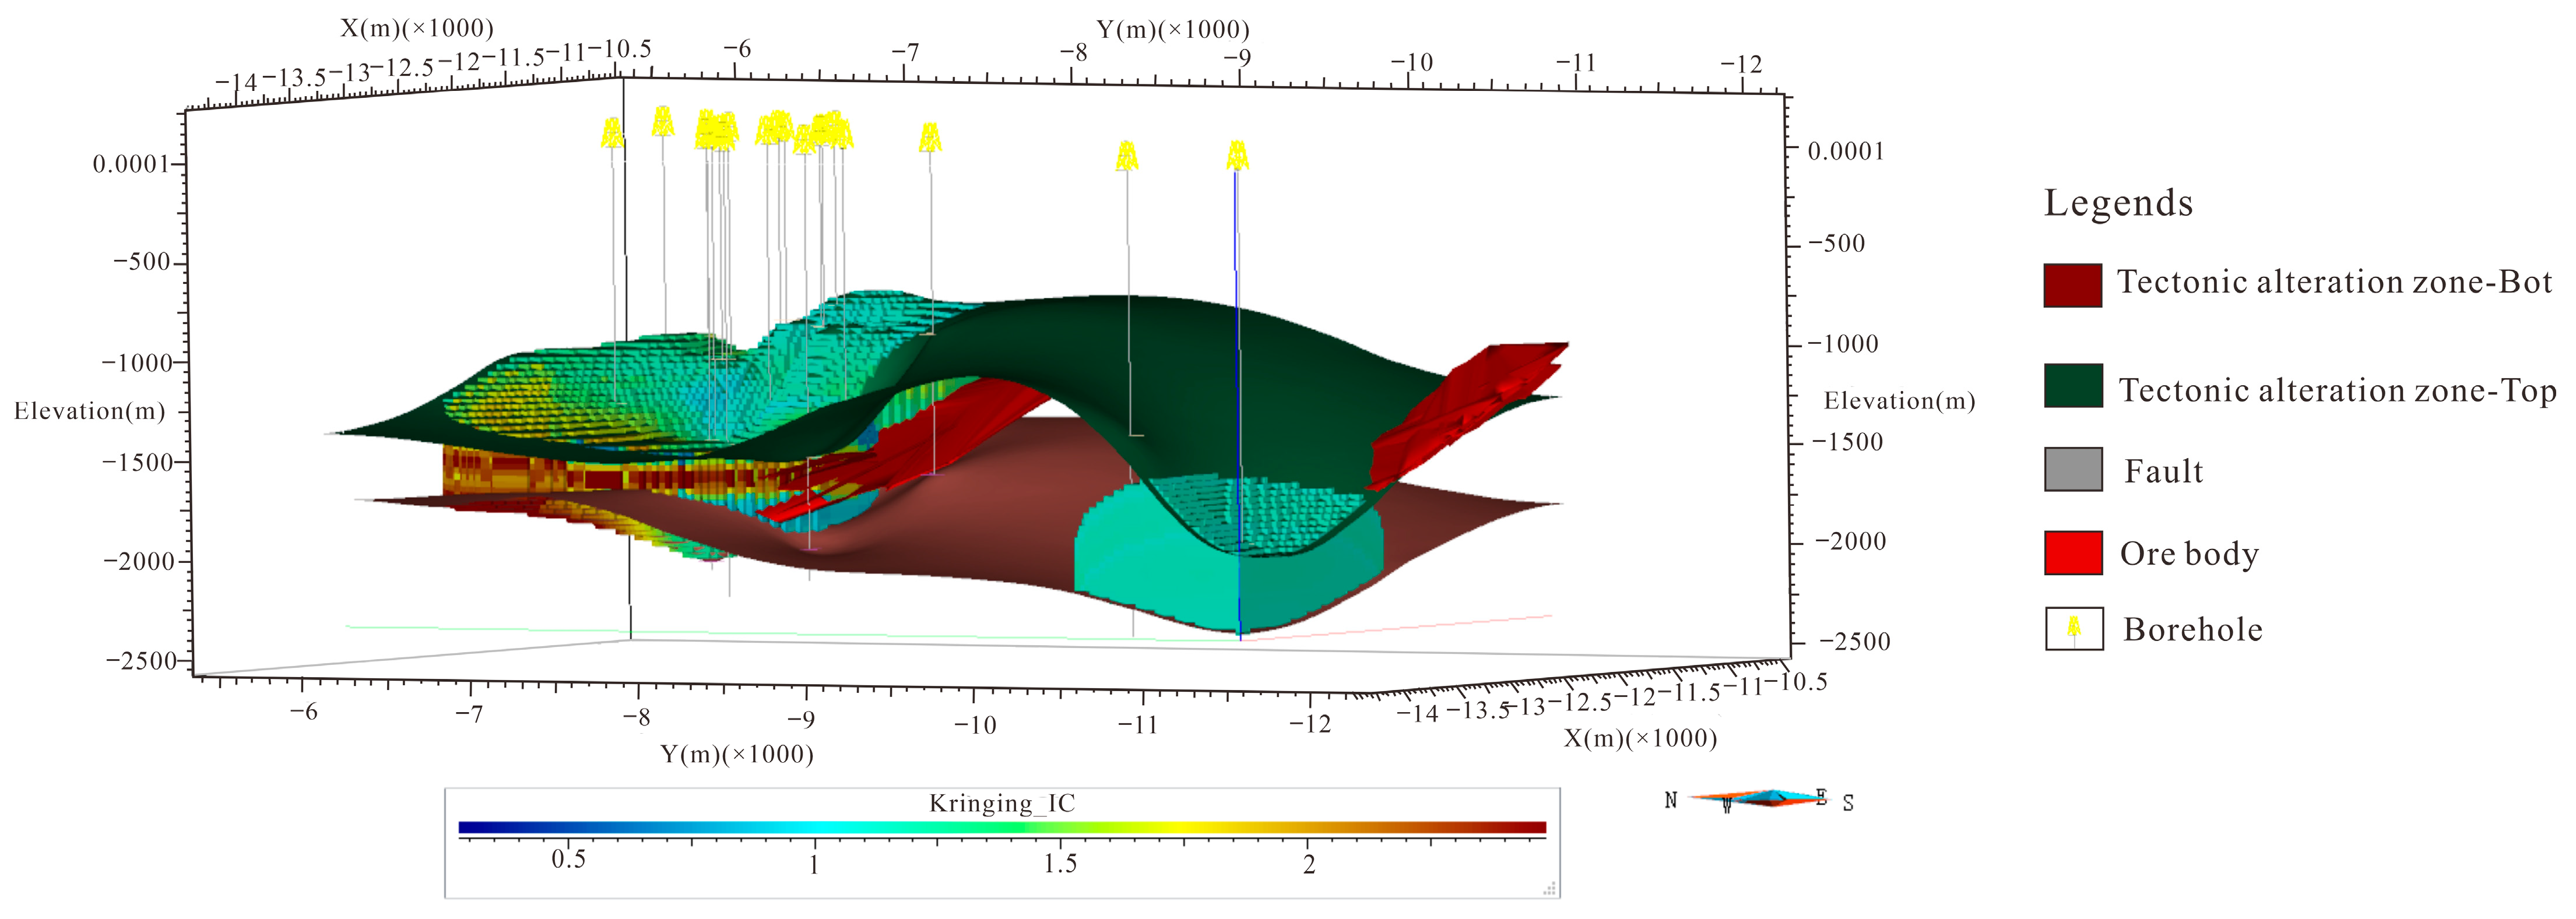
To intuitively display the spatial distribution behavior of the gold grades in the study area, this study used the drill-hole datasets to perform 3D explicit modeling. Through the geostatistical analysis of the gold grade data at different depths in the drill hole and calculations of the variograms in different directions, each ore block is given a search radius ellipsoid. This process estimates the average-grade space allocation of each ore block (Figure 7a). The 3D grade-interpolation model is shown in Figure 7b. The 3D grade-interpolation model is constrained by the alteration zone. From the interpolation results, there are numerous high-grade ore areas within the alteration zone, and within the constrained range, the grade gradually increases from shallow to deep.

4.1.3. 3D Alteration-Zone Modeling

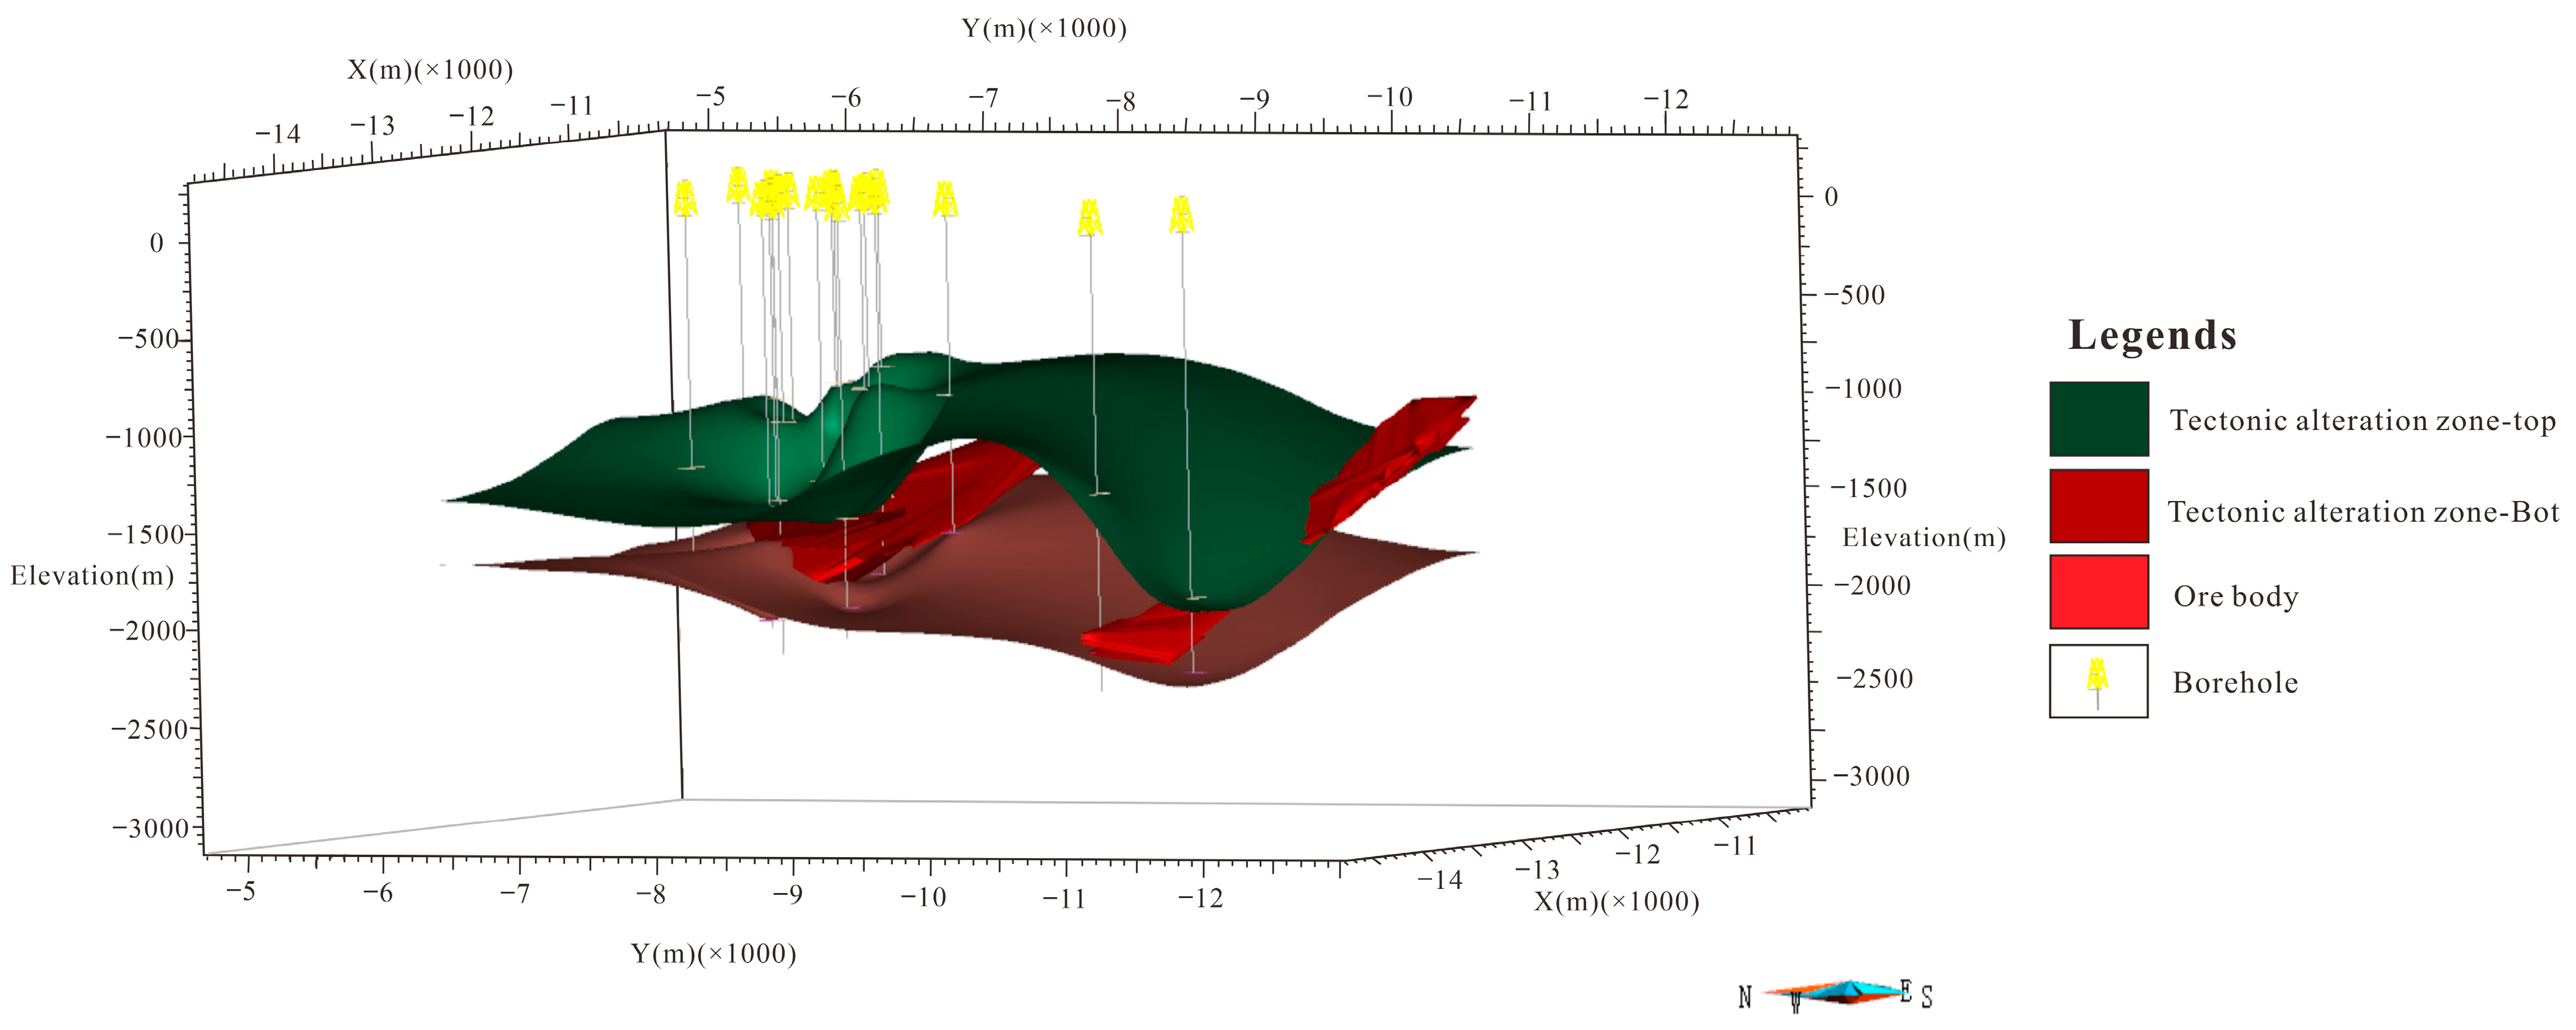
Here, the alteration-zone model is constructed based on the pyrite–sericite–quartz alteration lithology that is symmetrically distributed on the hanging and lower walls of the fault [38]. The outline of the unit is extracted from the 1:2000 exploration-line profile. The structural morphology and spatial distribution of the altered zone can be described by the altered structure model. The final 3D alteration-zone model is shown in Figure 8. The 3D model can better demonstrate the spatial correlations among the fracture structure, ore body, and alteration zone. The gold ore is mainly distributed in the footwall of the fault, and the morphology and distribution are controlled by the fracture. The range of the alteration zone is larger than the mineralization range, and its distribution is in the form of a belt, intersected by the main fracture surface.

4.2. Interpretation Based on SWIR Spectra

SWIR spectroscopy results identified the main alteration-mineral groups in the eight holes collected in the Zhaoxian gold deposit as white mica, carbonate (siderite and magnesite), kaolinite, smectite, and chlorite, with most minerals co-occurring with white mica. According to the spectral interpretation, the white mica of the Zhaoxian deposit mainly consists of muscovite, paragonite, phengite, muscovitic illlite, paragonitic illlite, and phengitic illlite; muscovitic illlite, for example, is an intermediate product of the conversion of muscovite to illite (the latter three are classified in this work as muscovite, paragonite, and phengite and not separately discussed).
Kaolinite is the most widely distributed clay mineral, an Al-rich silicate that forms through acidic alteration. The crystallinity of kaolinite can be identified by SWIR spectroscopy [34]. The mineral has typical double absorption peaks near 2160 nm and 2206 nm, the intensities of which depend on the type of kaolinite mineral and its crystallinity. Therefore, the influence of kaolinite on Pos2200 needs to be considered when a mixture of white mica and kaolinite is present [16,39,40]. In the Zhaoxian gold deposit, the kaolinite is mainly combined with white mica as a second major constituent, with only a small proportion being found as a single mineral.
In the Zhaoxian main ore-body zone, the chlorite is mainly found in deep granite in small quantities and always associated with muscovite and carbonate. Chlorite has diagnostic Fe–OH and Mg–OH absorptions centered at 2250 and 2350 nm. Because the Mg–OH in chlorite may be affected by the presence of carbonate, Fe–OH absorption is commonly used to determine the composition in the chlorite.

4.3. Alteration Features and Zonation

The ore bodies in the study area are controlled by the Jiaojia Fault and are mainly distributed in fractured, altered rocks [8]. Drill-hole cores are mainly concentrated in the northern part of the Zhaoxian gold deposit, and most of the ore bodies are present. The distribution of ore bodies along Line 88 is continuous, and their thicknesses are stable. Therefore, this study mainly focused on the Line 88 drill holes to study the cross-section of the ore body and host rock and to illustrate the spatial distribution of SWIR alteration-zone minerals.

4.3.1. No. 88 Exploration Line

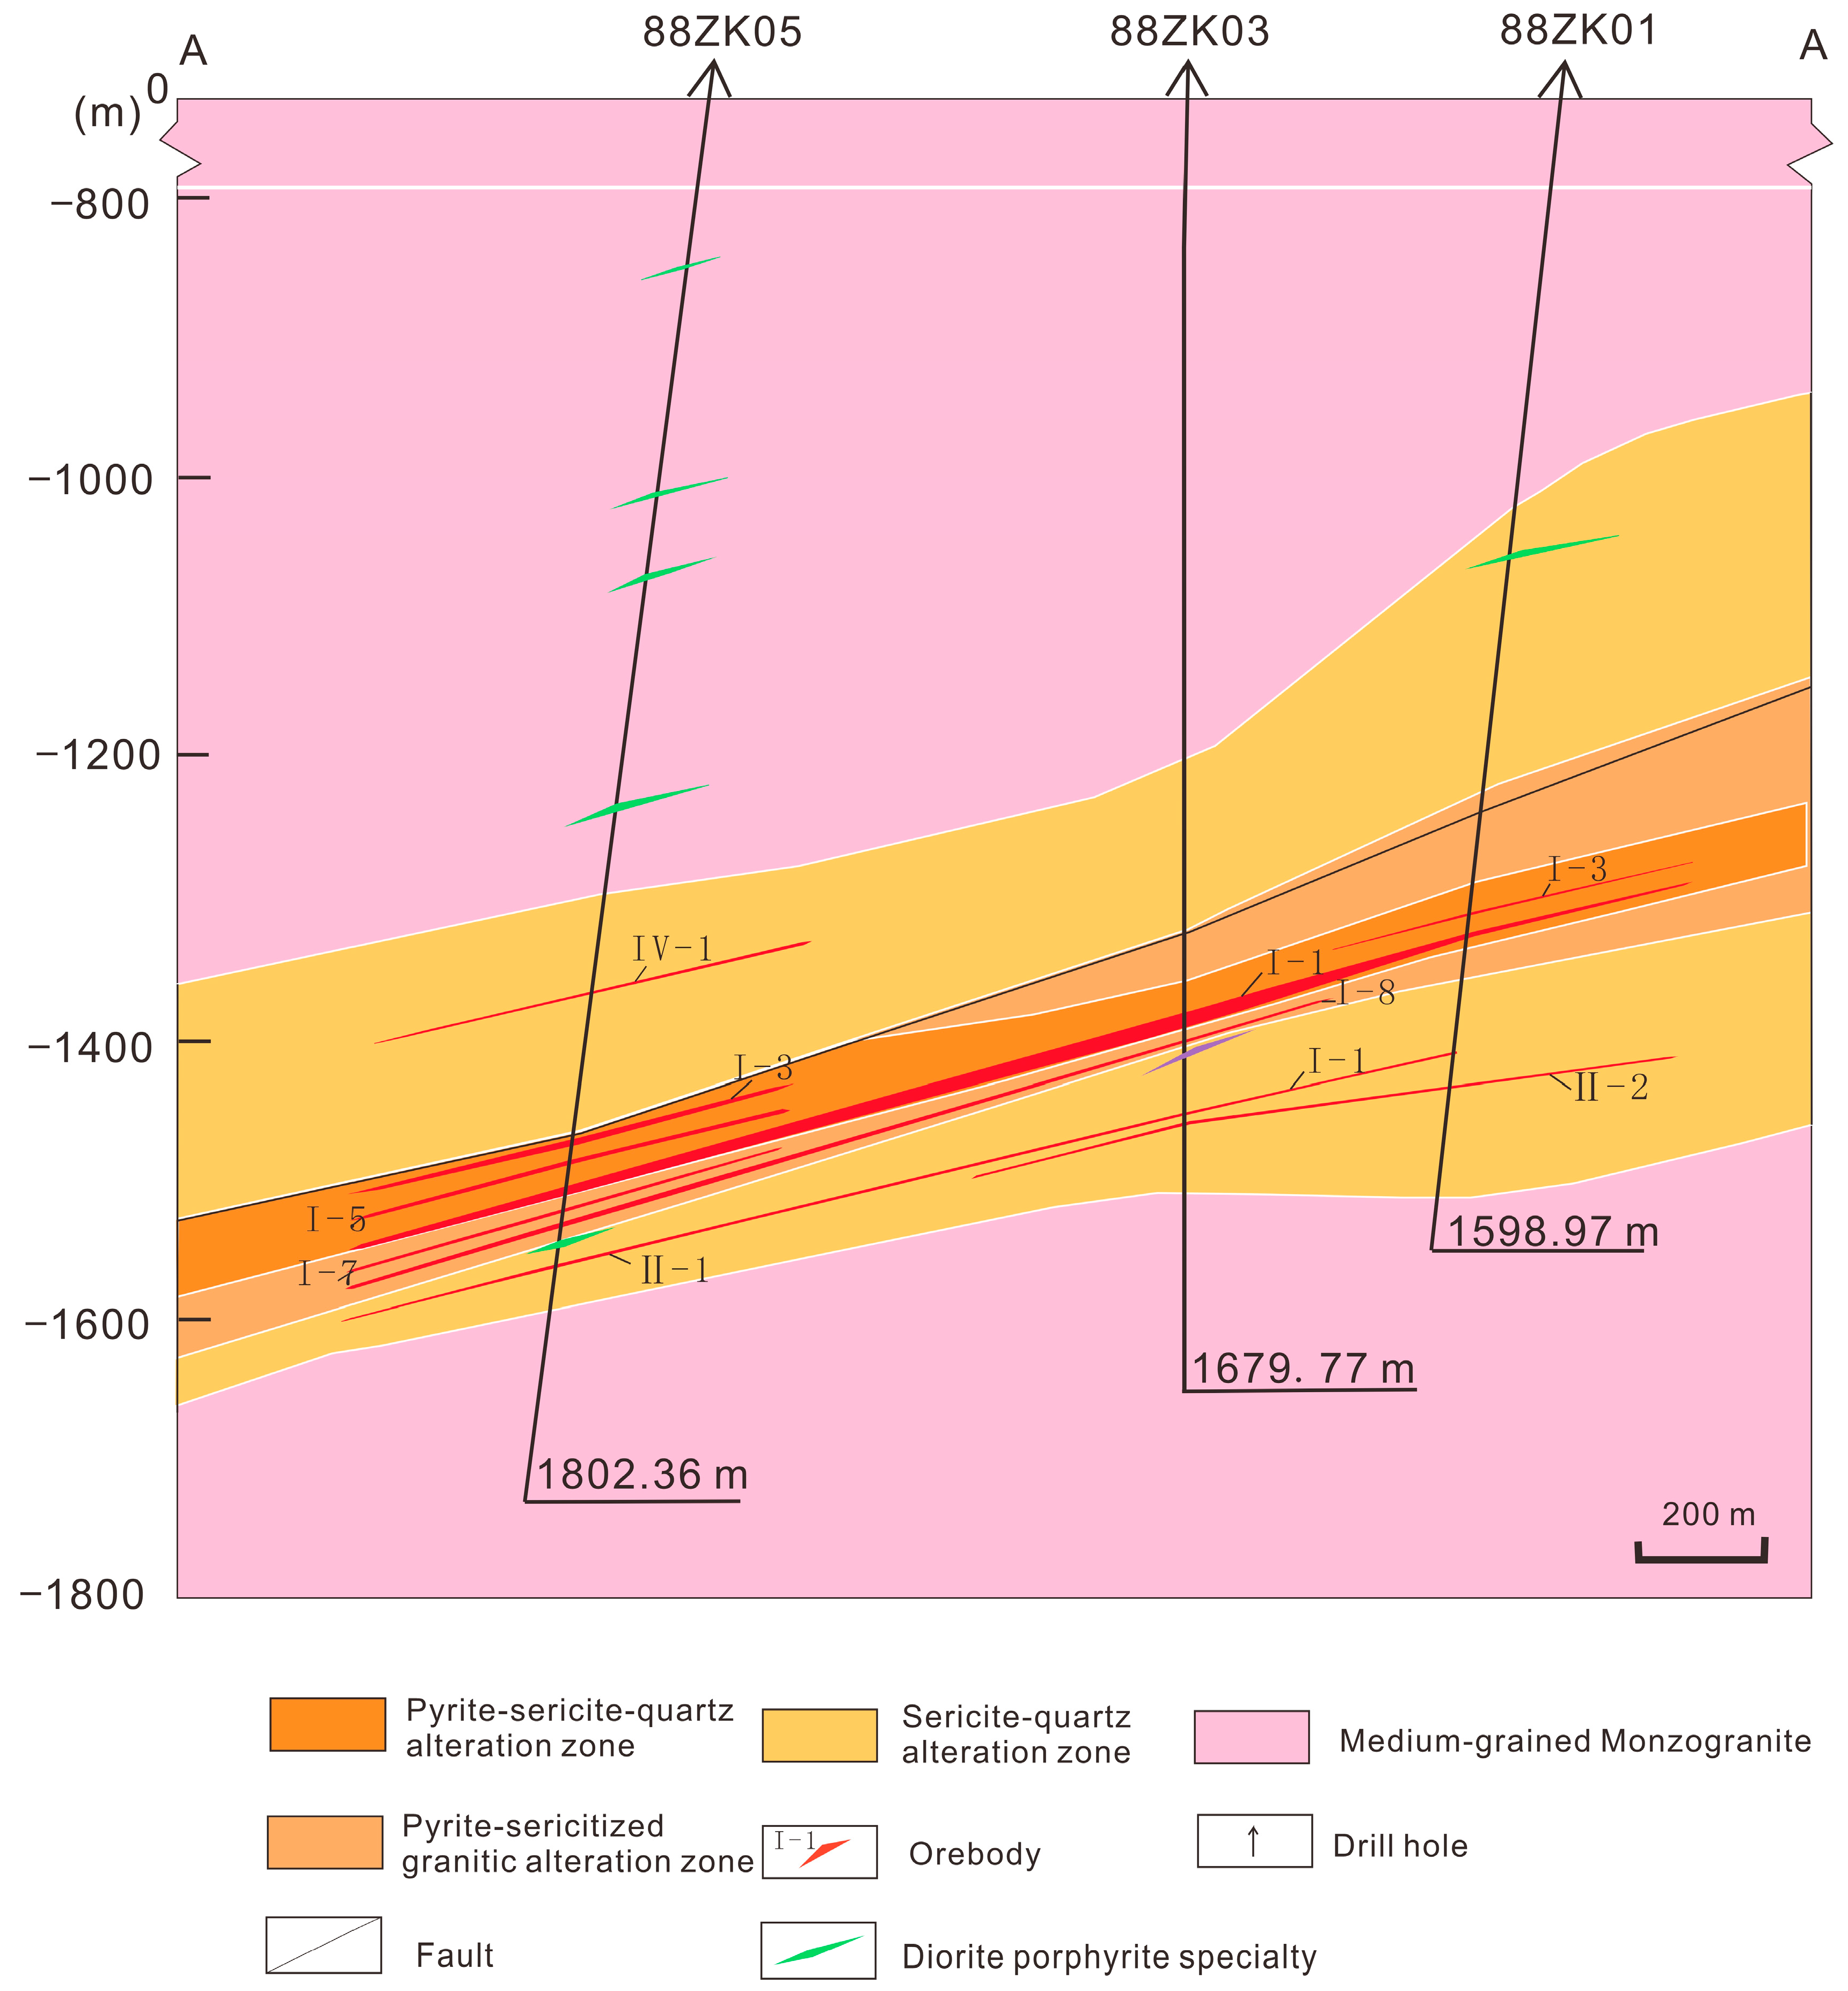
The No. 88 Exploration Line includes drill holes 88ZK01, 88ZK03, and 88ZK05 and crosses the hanging wall and footwall of the main fracture. The hanging wall of the main fracture is composed of medium-grained monzogranite and sericite-quartz altered rock. The ore bodies developed in the footwall of the fault zone, including most of the I, II-1, and II-2 ore bodies. Both ends of the ore bodies are pinched out, and their occurrence is controlled by the Jiaojia fault. From the center of the ore body to the outside, there is a symmetrical distribution of pyrite–sericite–quartz altered rock, pyrite-sericitized granitic altered rock, sericite–quartz altered rock,, and medium-grained monzonitic granites (Figure 9). The ore body is relatively simple, with strong continuity, and has good metallogenic conditions [8,23]. Ore body I is present in the pyrite–sericite–quartz cataclastic rocks and sericite-quartz granitic cataclastic rocks. Ore body II mainly exists in sericite-quartz granitic cataclastic rocks. All the drill holes penetrated the intact alteration zone.
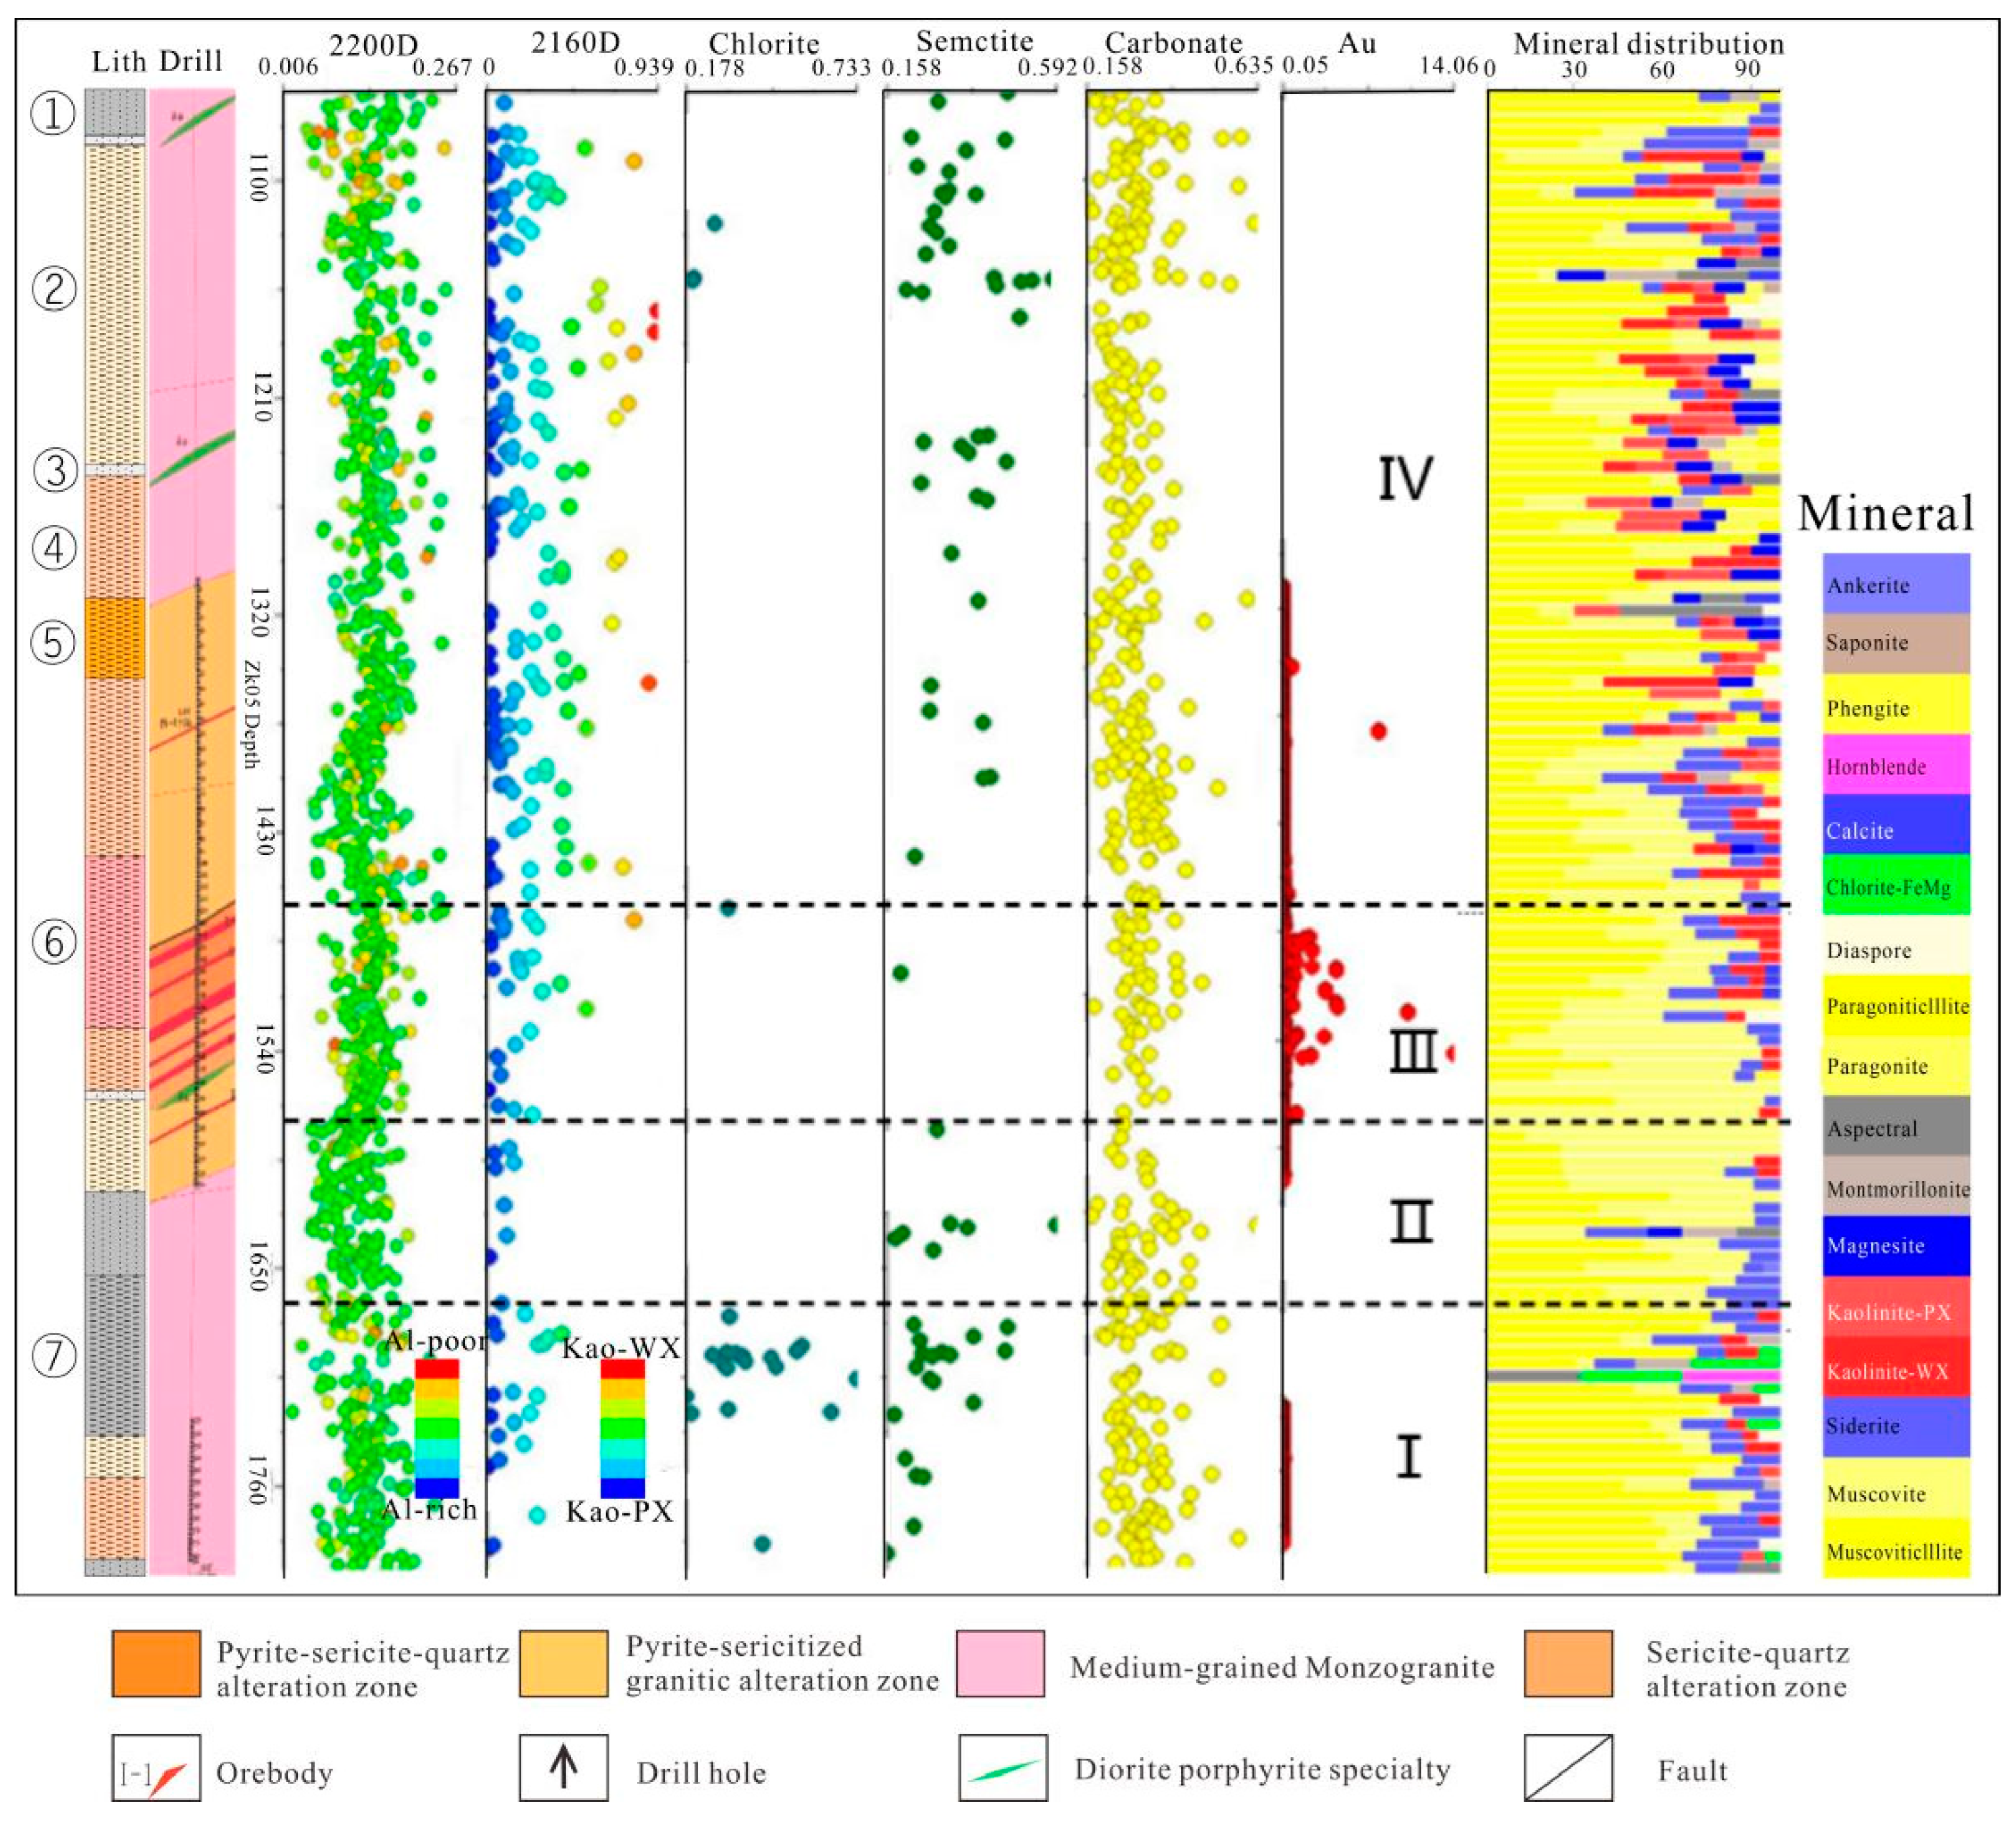
Drill-hole 88ZK01 is an oblique drill with a test depth of 905.46 m to 1594.99 m. SWIR spectroscopy indicates that it contains diorite and porphyrite interlayers. The lithology histogram can be described as follows. Five main alteration-zone mineral groups were extracted by SWIR spectroscopy, mainly white mica, kaolinite, smectite, carbonate, and other-Al–OH minerals; white mica was the main alteration-zone mineral (Figure 10). The mineralization is concentrated at approximately 1300 m to 1469 m. The type of sericite is muscovite, and its distribution basically corresponds to the mineralization. Kaolinite is less developed, and the muscovite–carbonate alteration zone is also developed. The distribution of alteration-zone minerals near the mineralization can be divided into five zones. The shallow depth of 1070 m is alteration-zone V, and the corresponding lithology is monzogranite. The main minerals are Al-rich sericite, carbonate, and a small quantity of montmorillonite, among which the carbonate is well-developed. The mineral assemblage can be preliminarily classified as the quartz–carbonate mineralization stage [23]. Alteration-zone IV extends from 1070 m to 1300 m, where large quantities of Al-rich sericite–kaolinite alteration-zone minerals are developed, and montmorillonite and carbonate are generally developed. This layer has a unique kaolinite mineral with good crystallinity (kaolinite-wx). The 1469–1546.2 m deep mineralization is alteration-zone II, and the mineral assemblage is sericite–carbonate and a small quantity of low-crystallinity kaolinite (kaolinite-px). The Pos2200 value of sericite in this zone is lower than it is in zone IV. Chlorite is developed only in the monzonitic granite formation of alteration-zone I at 1546.2 m, and the mineral assemblage is sericite–carbonate–chlorite. Generally, sericite is widely distributed in drill-hole 88ZK01, and there are obvious high Pos2200 values near the mineralization, which is developed in the pyrite–sericite–quartz cataclastic rock. The content of montmorillonite is low, there is no obvious regularity, and the carbonate alteration is relatively continuous (Figure 10).
Drill-hole 88ZK03 was vertically drilled and spectroscopically tested at depths of 870.39 m to 1679.77 m. There are gabbro interlayers near the mineralization, and potassic granite gneiss is developed in the deep part. There are tectonic cataclastic rocks near the Jiaojia fault zone. The lithology histogram is described as follows (Figure 11). The zoning of the mineral assemblages is the same as that of 88ZK01, where the shallow 870.39–1123.32 m area is alteration-zone V, and the corresponding lithology is monzogranite and sericite–quartz granite, mainly consisting of Al-rich muscovite and carbonate. Alteration-zone IV is located near the fault, with depths of 1123.32–1345.09 m, and the pyrite sericitization is obvious. The mineralization is roughly concentrated at 1345.0–1500 m in alteration-zone II, and strong pyrite–sericite–quartz and sericite alterations are developed in the cataclastic rock (Figure 11). A large quantity of phengite appears in this layer, and kaolinite is rare. Alteration-zone I, which is developed in potassic granitic gneiss at depths of 1621–1679.77 m, contains unique chlorite minerals with relative contents higher than those of 88ZK01.
The sampling depth of drill-hole 88ZK05 is deeper than that in the previous two drill holes, ranging from 1055.05 m to 1800 m. The drill hole passes through many ore veins, which pinch out on both sides. Compared with the previous two drill holes, the shallow area lacks pyrite–sericite–quartz granitoid cataclastic rock. The lithologic histogram for drill-hole 88ZK05 can be described as follows (Figure 12). Owing to the increased acquisition depth, there was no alteration-zone V. Alteration-zone I is located in the granitic cataclastic rocks and sericite–quartz cataclastic rocks at 1774.5–1800 m. Compared with the other two drill holes, the content of montmorillonite in this alteration zone is relatively high. Alteration-zone II developed at 1599–1774.5 m. Alteration-zone III is the mineralized zone. Unlike the other drilling holes, there is a small quantity of kaolinite near the mineralization. Alteration-zone IV is shallower than 1475 m. The 88ZK05 drill hole is quite different from the previous two drill holes owing to the mineralized area and multiple ore bodies. A large quantity of sericite and carbonate are continuously distributed in the drill hole, with high relative contents, including abundant kaolinite-wx (Figure 12).

4.3.2. Spatial Distribution of Alteration-Zone Minerals in the Section of No. 88 Exploration Line

The No. 88 Exploration Line has obvious alteration zoning, clearly recording the mineralization and alteration characteristics of the deposit area, and the deep mineralization is typical. The SWIR results can be used to divide the alteration-zone mineralization into five alteration zones. Alteration-zone I, which is located in the monzogranite strata, consists of sericite–chlorite and only appears in the deep mineralization. Additionally, with increasing depth, the relative content of chlorite also increases. Alteration-zone II is a sericite–carbonate zone, containing a small quantity of kaolinite-px, usually near the intersection of the pyrite–sericite–quartz granitized cataclastic rock and deep potassic granite zone. Alteration-zone III is a mineralized zone with abundant pyritic sericite; its lithology is mainly pyrite–sericite–quartz cataclastic rock and pyrite–sericite–quartz granitic cataclastic rock. The alteration-zone minerals are phengite–carbonate, with a few other minerals. Alteration-zone IV is the sericite–kaolinite-wx–carbonate zone, which is located in the hanging wall of the fault zone, and is characterized by the development of unique kaolinite-wx. Alteration-zone V is the sericite–carbonate zone, containing small quantities of kaolinite and montmorillonite. Generally, the minerals have obvious zonal distribution, in which phengite is mostly developed near the mineralization (Figure 10, Figure 11 and Figure 12). Kaolinite-wx develops on the hanging wall of the fault zone, and the position near the ore body contains almost no kaolinite. Moreover, chlorite only exists in the deep granite plutons far from the mineralization.

4.4. Spectral Characteristics of Sericite

Sericitization is the main alteration type of the Zhaoxian deposit; sericite is distributed in the center of the alteration zone and is closely related to gold mineralization [3]. Sericite is commonly used to describe fine-grained white mica (muscovite, phengite, and/or illite) developed in hydrothermally altered rocks [28]. Muscovite is a dioctahedral layered silicate. When the octahedral coordination cation undergoes Tschermak substitution, the octahedral aluminum is replaced by other cations (such as iron and magnesium) to form three common end members: muscovite, paragonite, and phengite [28]. Tschermak displacement is common in phengite solid solutions and involves coupled displacement between tetrahedral and octahedral layers ((Al↔Si)tet = (Al)↔{Fe2+,Mg}oct) [9]. When the temperature and pressure are changed, the Al in the octahedral position is replaced by other cations, and the ratio of Si to Al becomes greater than 3; that is, Al-poor muscovite (phengite) is formed [41].
The muscovite group has a diagnostic Al–OH absorption signature centered at 2200 nm, which is associated with the vibrations of the octahedral coordination atoms, the wavelength positions of which provide information about the mineral composition and shifts owing to changes in the cationic composition [21,31,41]. A useful parameter is the wavelength of the Al–OH band (Table 2), which increases with a decrease in Alvi. Because montmorillonite has similar SWIR spectral characteristics (1900 nm and 2200 nm) to muscovite, illite crystallinity values (IC=2200D/1900D) are also widely used to evaluate muscovite and montmorillonite crystallinity [21,37]. Other octahedral silicate minerals, such as kaolinite and montmorillonite, also have absorption features near 2200 nm that overlap with many muscovite features, even though they can be identified and separated on the basis of other specific spectral properties.

4.4.1. Al–OH Feature Wavelength Pos2200

The substitution of octahedral Al by other cations such as Fe and Mg is the main reason for the change in muscovite composition. Therefore, the wavelength of the Al–OH band can be used to spectroscopically quantify the octahedral cation composition (Alvi) of muscovite, reflect compositional changes, and infer fluid characteristics [31,40,42]. Sericite exhibits strong absorption near 2200 nm, which is called Pos2200. When Tschermak substitution occurs, the composition of cations in the octahedron changes; usually, Pos2200 > 2205 nm is Al-poor muscovite with high Fe and Mg content [41]. Furthermore, because kaolinite and montmorillonite also have absorption peaks near 2200 nm, when the muscovite-group minerals are mixed with these minerals, the absorption peak position of Al–OH will slightly change.
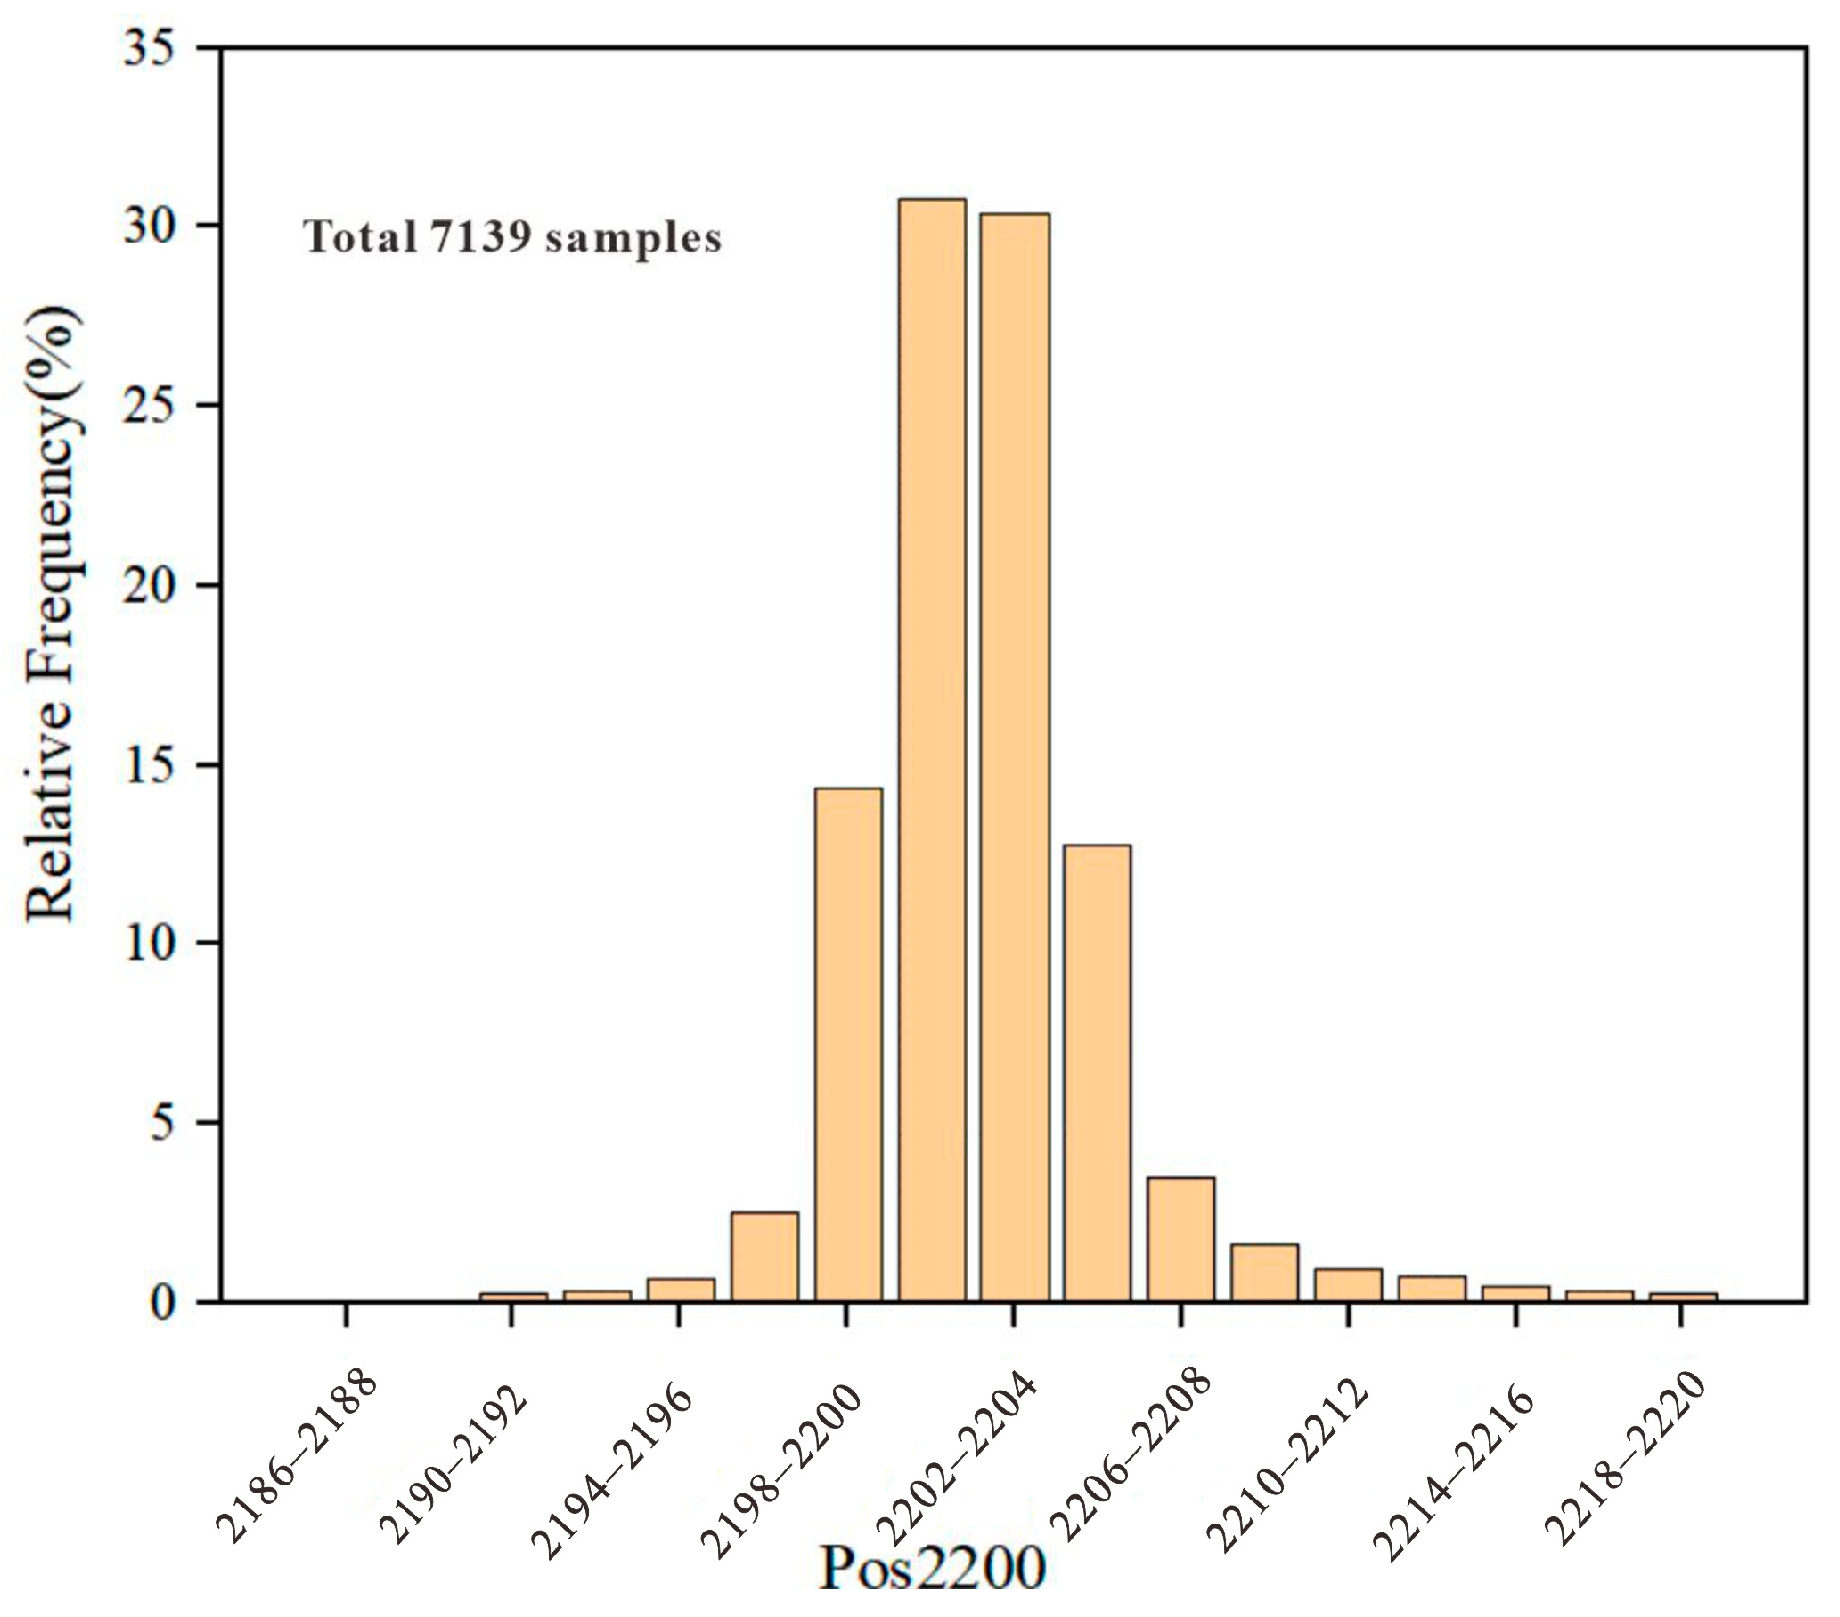
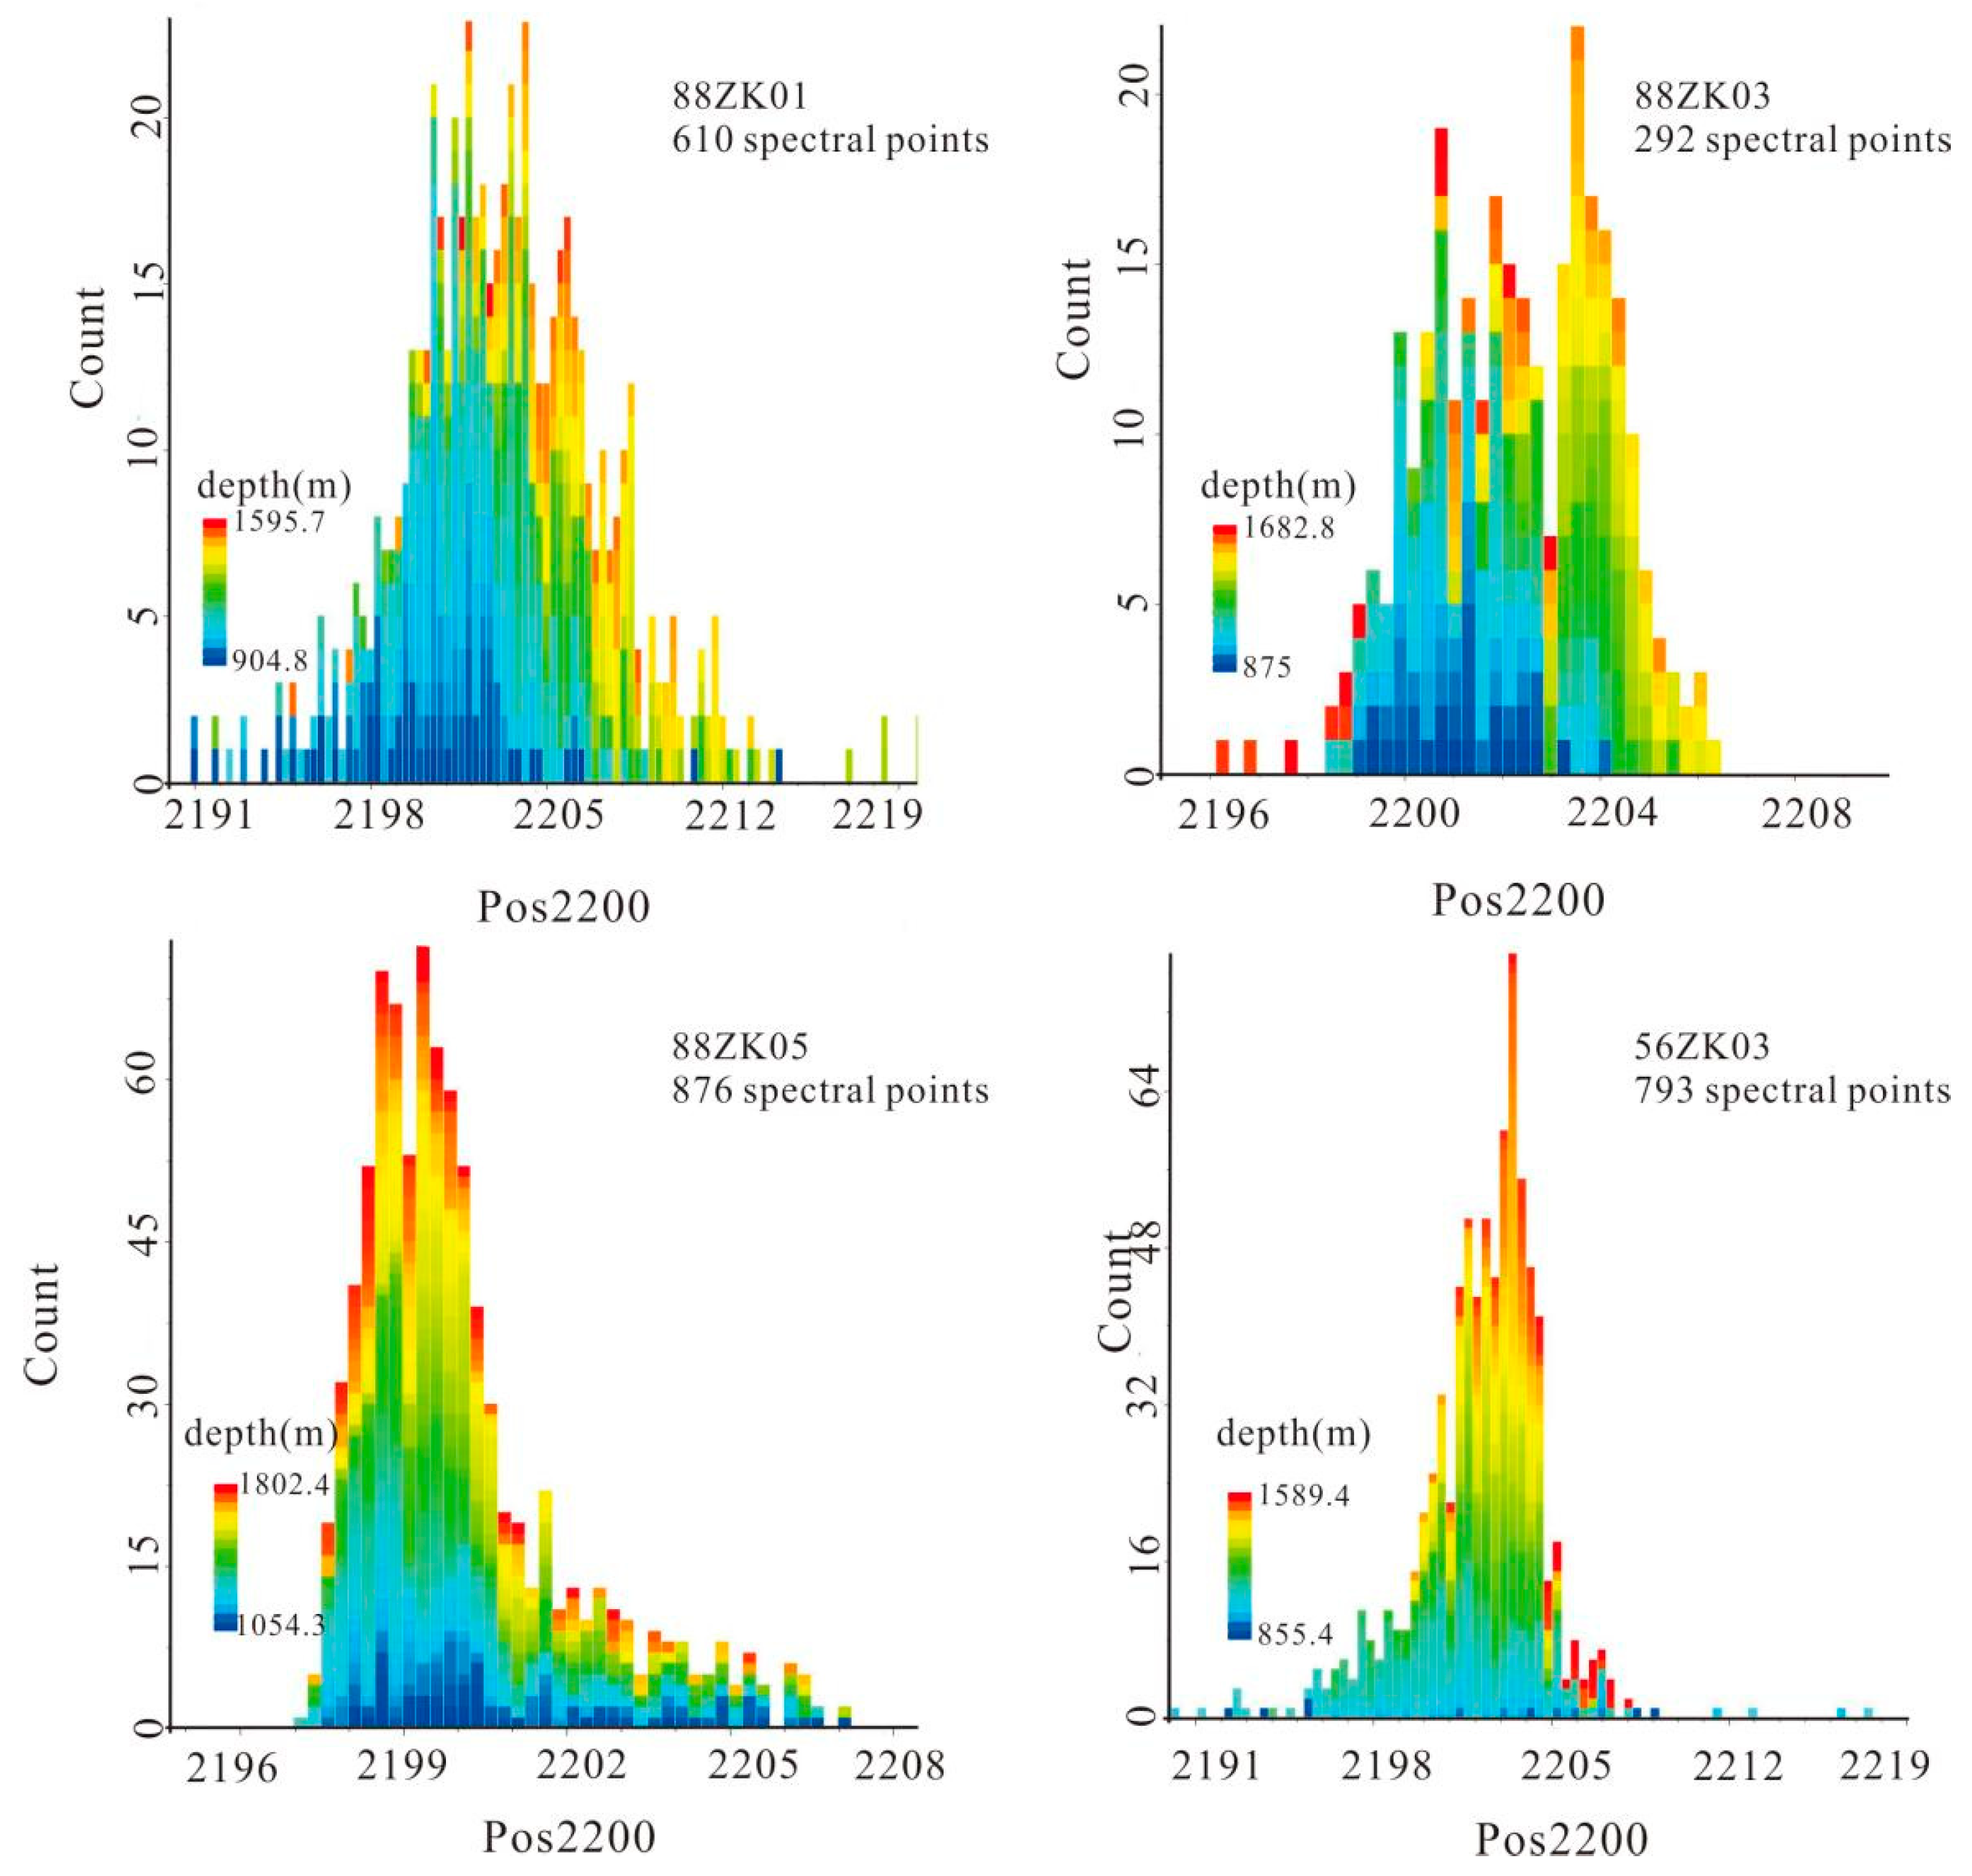
The sericite minerals identified by SWIR in the eight drill holes in the Zhaoxian mining area mainly include muscovite, paragonite, phengite, and illite. The minimum absorption peak position (Pos2200) of Al–OH is concentrated around 2200 nm, approximately at 2185–2220 nm with a normal distribution, indicating that the dolomite minerals in the study area are distinct (Figure 13). It can be seen from Figure 10 that Pos2200 > 2205 near the ore body is Al-poor muscovite. In the deep part of the mineralization, the Pos2200 value decreases, which reflects the significant correlation between mineralization, depth, and Al–OH wavelength. For the convenience of distinction and description, this study used Pos2205 as the division between muscovite and phengite.
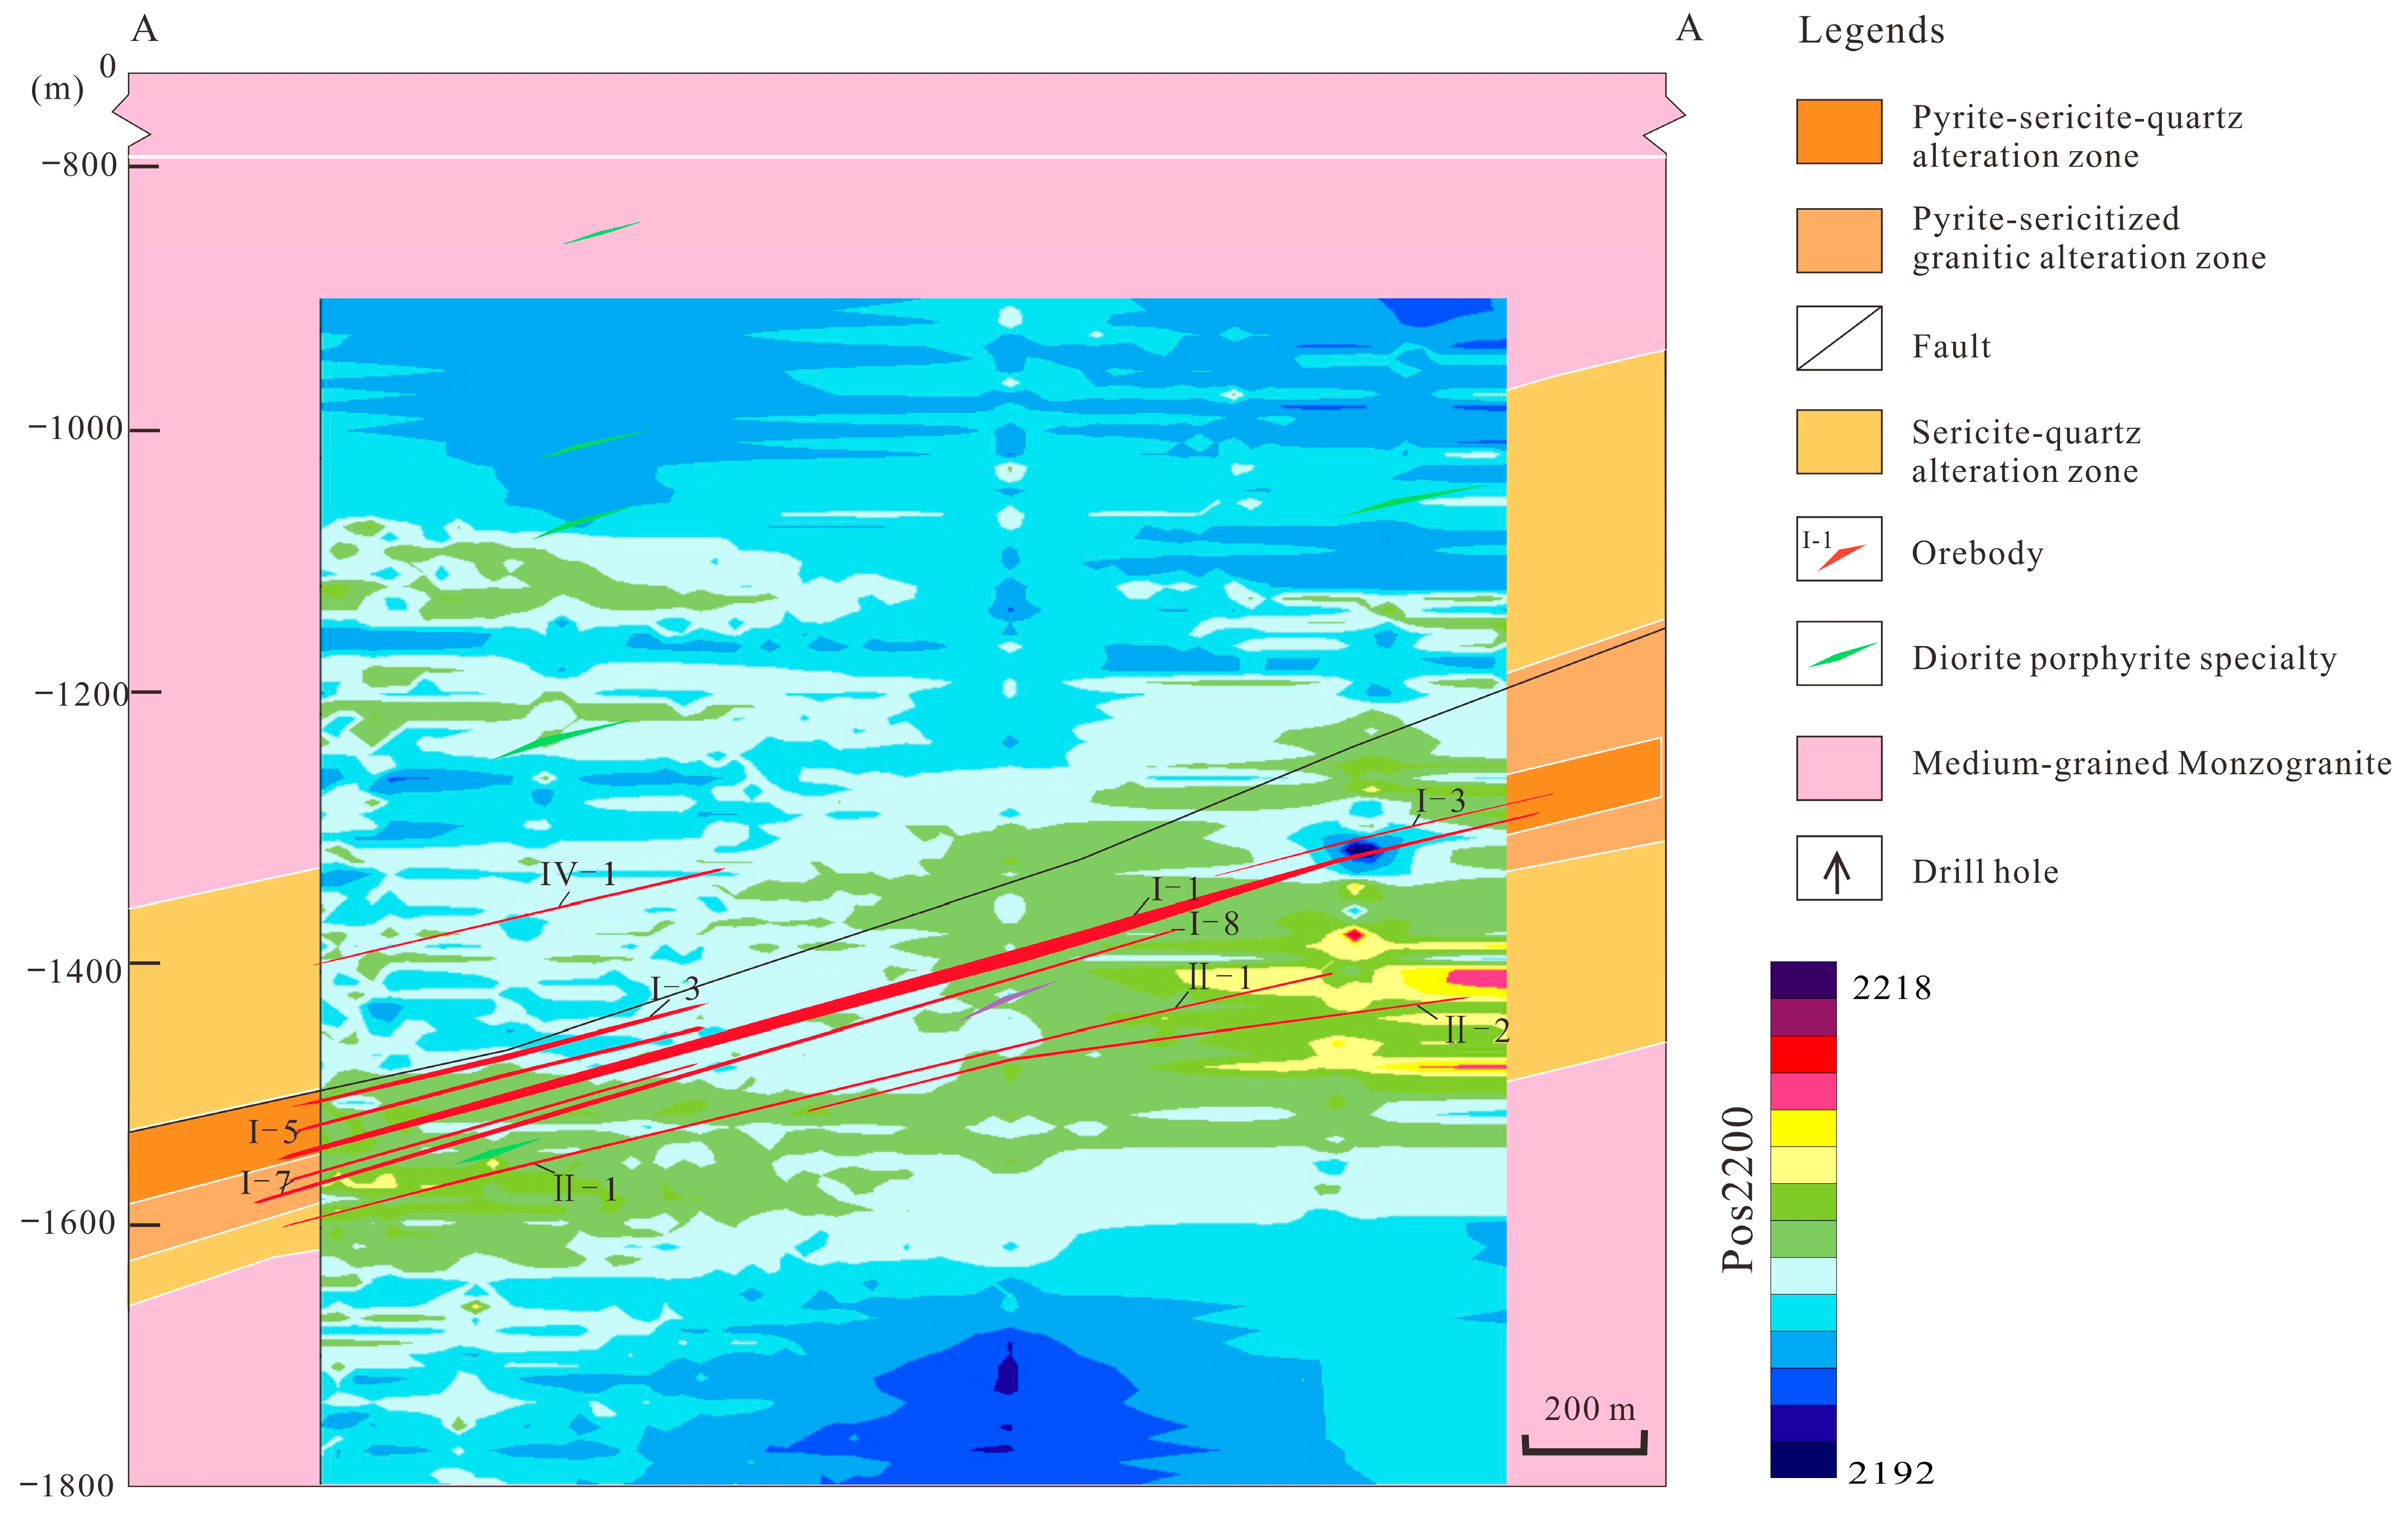
The Pos2200 values of the four selected drill holes passing through the main ore bodies are all in a normal distribution, which roughly shows that the Pos2200 wavelength of the shallow sericite is relatively short, generally less than 2204, indicating Al-rich muscovite. With the increase in depth, the Pos2200 value of sericite gradually increased to approximately 2208. According to Figure 13, the Pos2200 values of the selected drill holes passing through the main ore body at 800–1500 m depths have almost a normal distribution; as the depth increases, the Pos2200 values also increase (Figure 14). Conversely, because of the depth of 88ZK05, the Pos2200 value actually decreases in the deepest part. The study of the offset of Pos2200 reflects that the gold mineralization corresponds to high values of Pos2200. This phenomenon is more obvious in the contour profile, and the high value area of Pos2200 is basically consistent with the mineralization trend (Figure 15).

4.4.2. Al–OH Feature Depth 2200D

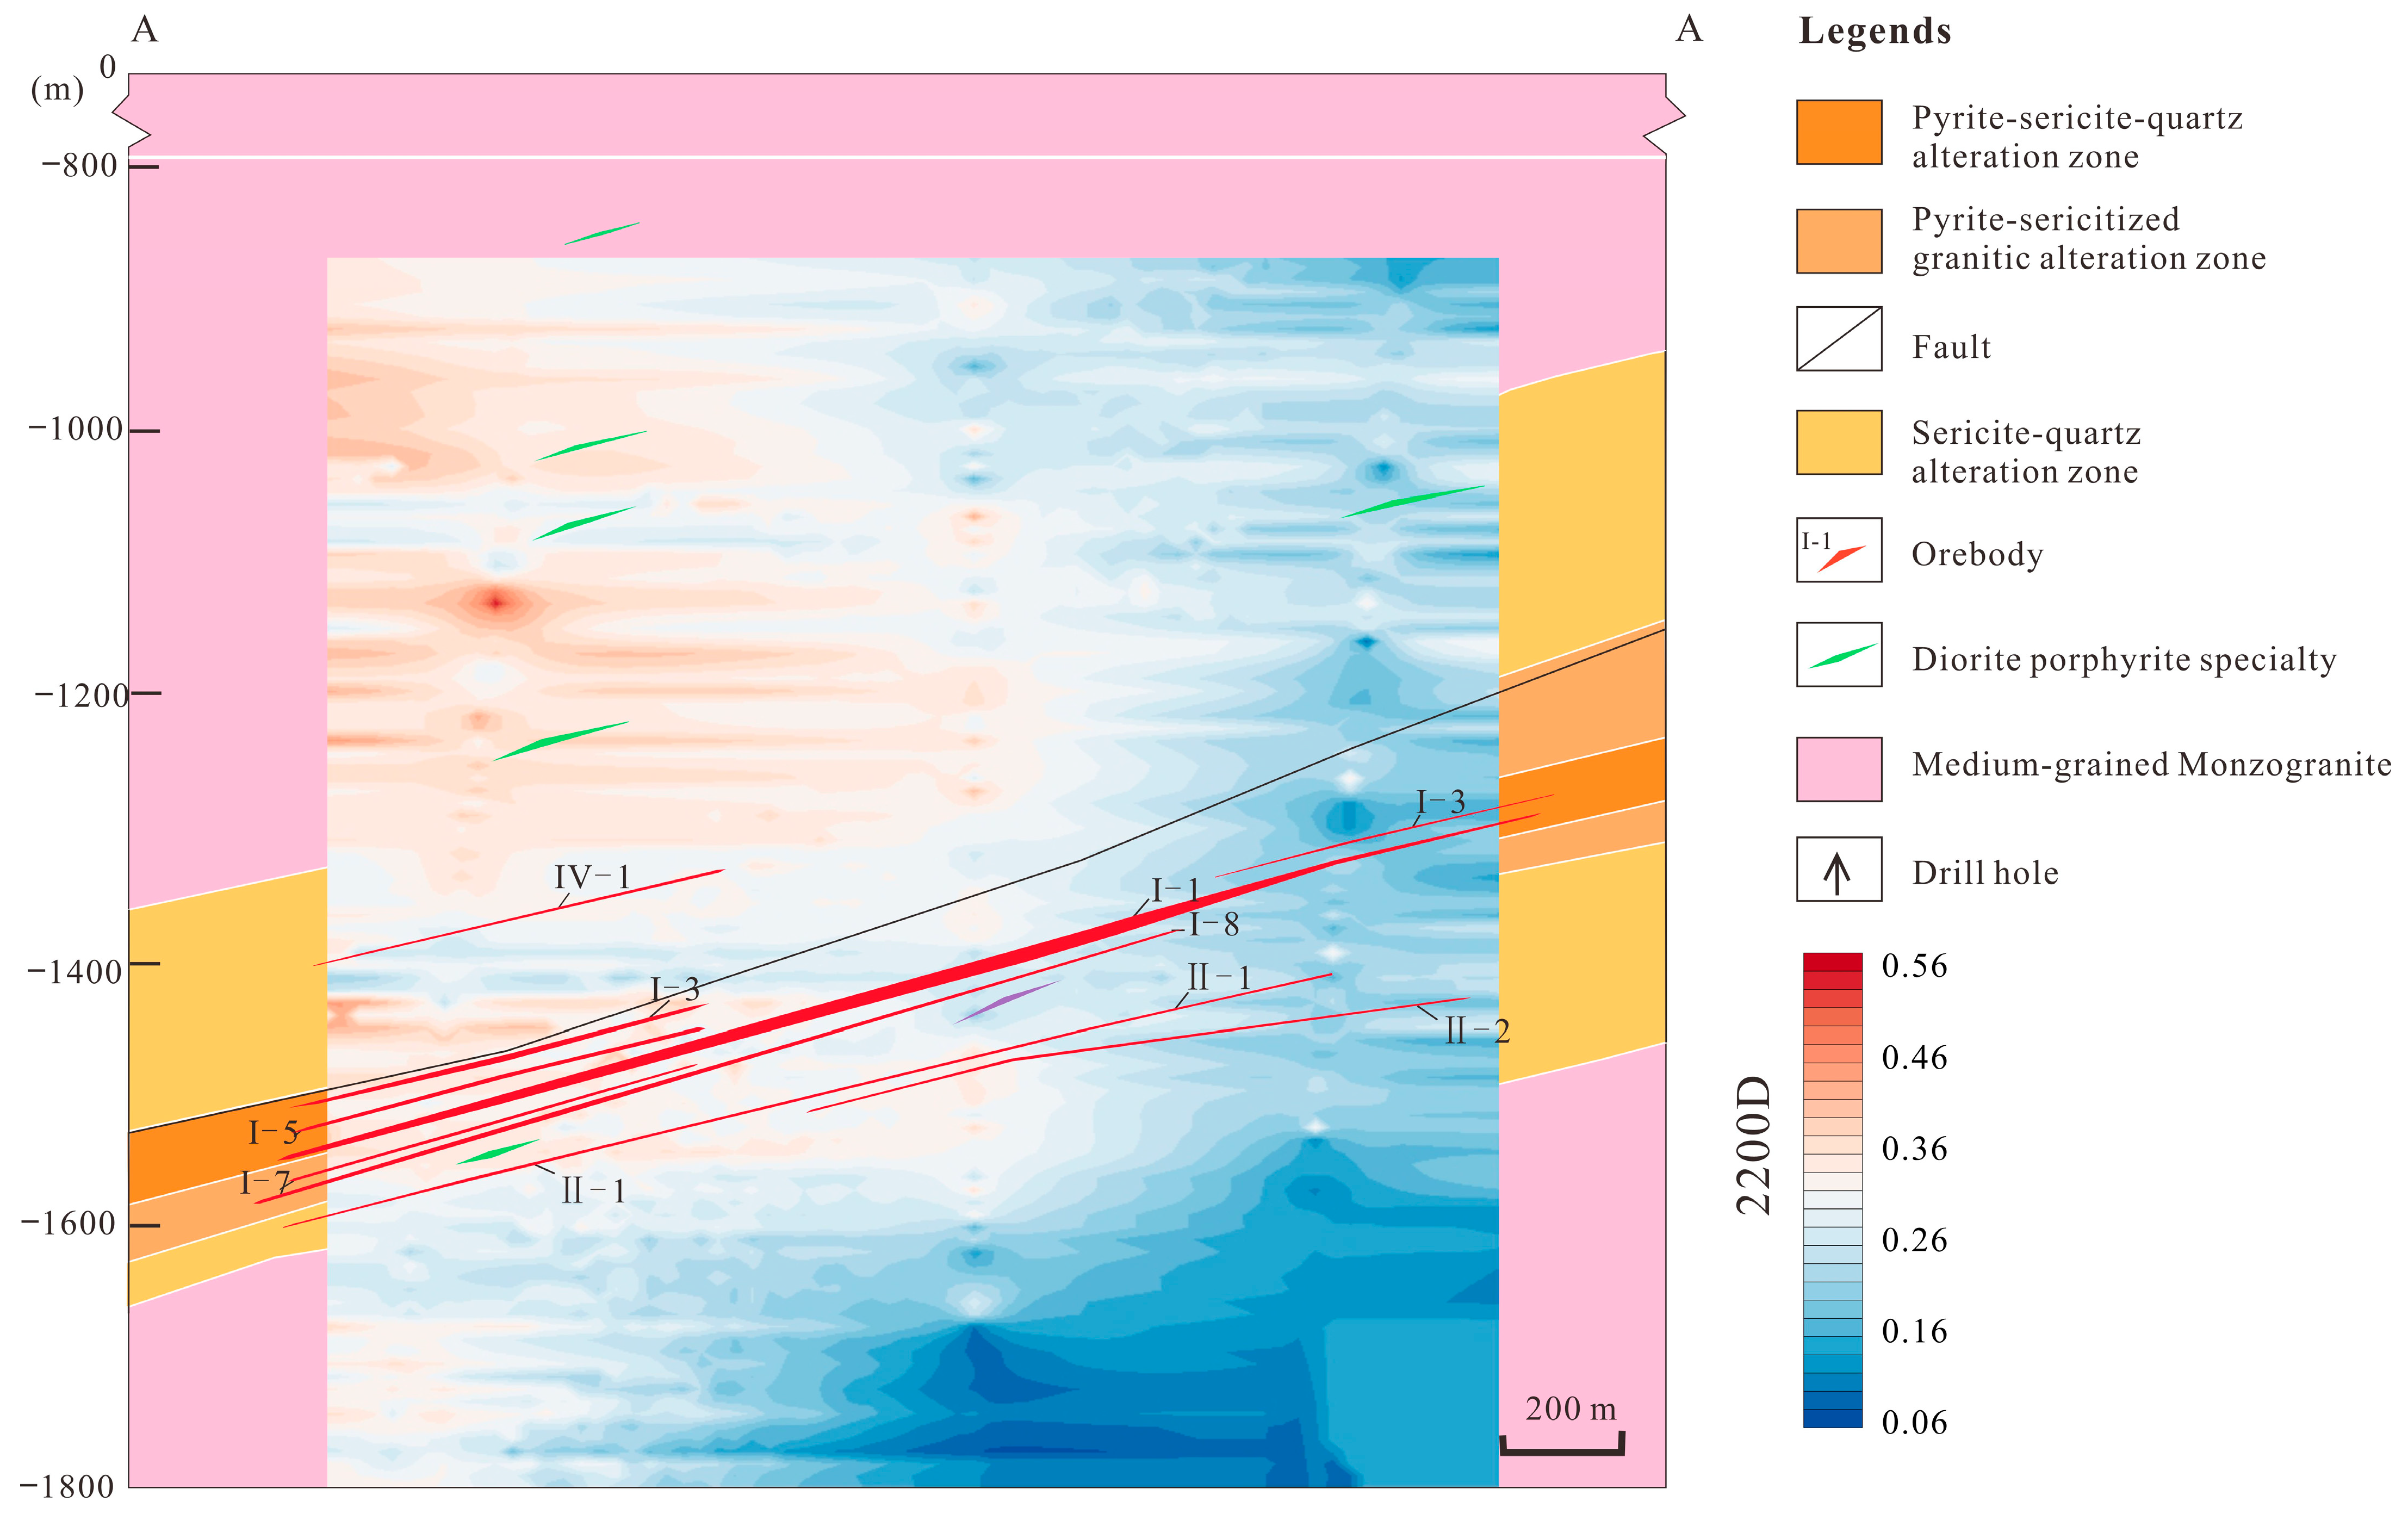
The quantity of infrared radiation absorbed is a function of the quantity of absorbing material in the sample. However, the absorption intensity is also affected to varying degrees by the physical conditions of the sample, such as the particle size and orientation of the absorbing minerals [15]. As a first approximation, the intensity of the Al–OH band was taken as an indication of the relative abundance of muscovite by assuming similar sample conditions for all pulverized core samples [31]. The intensity of the Al–OH band is the relative absorption depth of layered silicate minerals such as muscovite, kaolinite, and montmorillonite around 2200 nm, which is a fourth-order polynomial fitted between 2180 nm and 2220 nm of the Hull quotient. The derivative is followed by an extraction of relative depth, which indicates muscovite abundance. According to the contour profile, the 2200D in the No. 88 Exploration Line profile has a slight change in the vertical direction, and the correlation with the mineralization is not high, but the relative content of muscovite gradually increases from 88ZK01 to 88ZK05 in the horizontal direction (Figure 16).

4.4.3. Illite Crystallinity SWIR-IC Value

The illite crystallinity (SWIR-IC) value refers to the ratio of the absorption depth of sericite at 2200 nm to the absorption depth at 1900 nm. Numerous experiments have been conducted by predecessors. Compared with X-ray diffraction illite crystallinity (XRD-IC), the two have a good negative correlation [21]. Therefore, SWIR-IC, such as XRD-IC, can indicate the crystallinity of sericite minerals. The characteristic absorption peak at 1900 nm may indicate the water absorption of sericite. When the fluid temperature is relatively high, the muscovite minerals contain less crystalline water and have a high SWIR-IC value, so the degree of change in crystallinity can be used to reflect variations in mineral formation temperature [21,37,43].
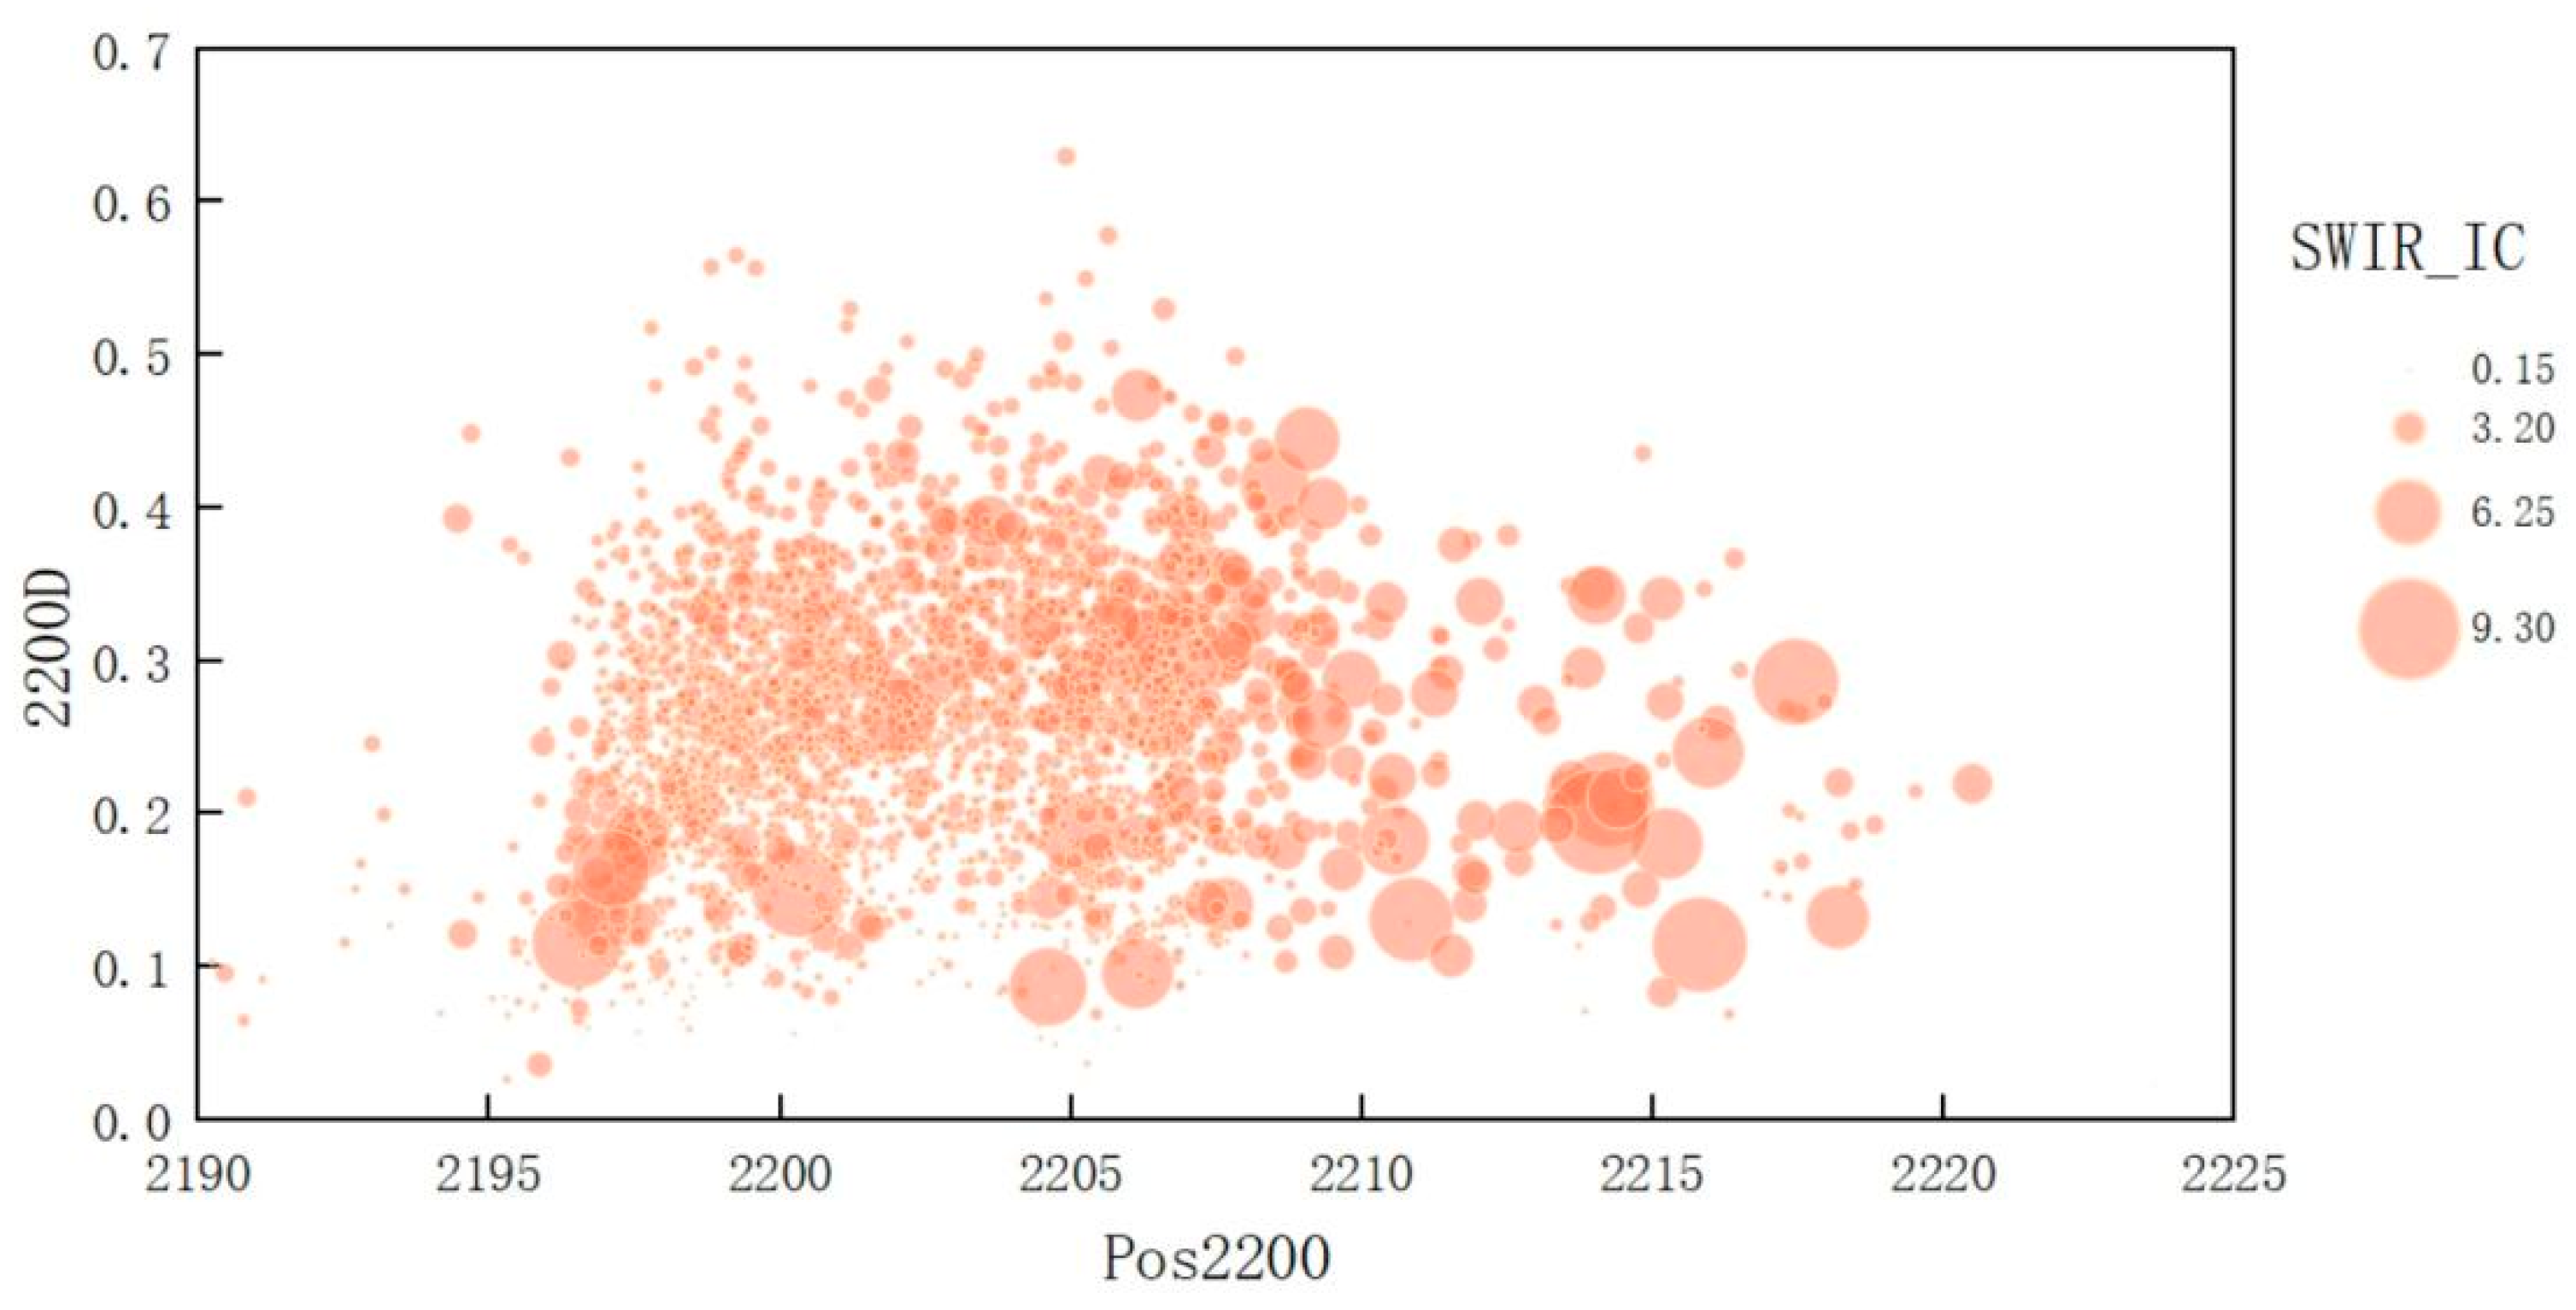
The SWIR-IC values in the study area varied from 0.2 to 3.8 with a majority concentrated between 0.5 and 1.5 (Figure 17). The crystallinities of the muscovite-group minerals in the drill holes were extracted and combined with the spatial locations of the drill holes to make a 2D contour map. As shown in Figure 16, the SWIR-IC values are relatively high near the ore body in the vertical direction, gradually decrease from the center of the mineralization to the sides, and are lower in the deeper areas of the mineralization. In the horizontal direction (Figure 17), the distribution of high IC values is generally consistent with the mineralization strike, thus confirming that the center of mineralization can be indicated by the IC values.

5. Discussion

5.1. Metallogenic Center Indication

The purpose of auxiliary exploration can be achieved by tracking the migration of ore-forming fluid and change in fluid composition through alteration zoning [21]. By using the SWIR-spectrum test, the alteration type in the rock core can be intuitively interpreted at the micron scale, and the boundary of the alteration zone can be refined through the spectral characteristic parameters and mineral abundance changes [21]. Based on spectral (hyperspectral) imaging, determining the best stratigraphic combination and mineralogical alteration type related to mineralization is carried out to determine the mining probability with similar stratigraphic and structural conditions [44,45].
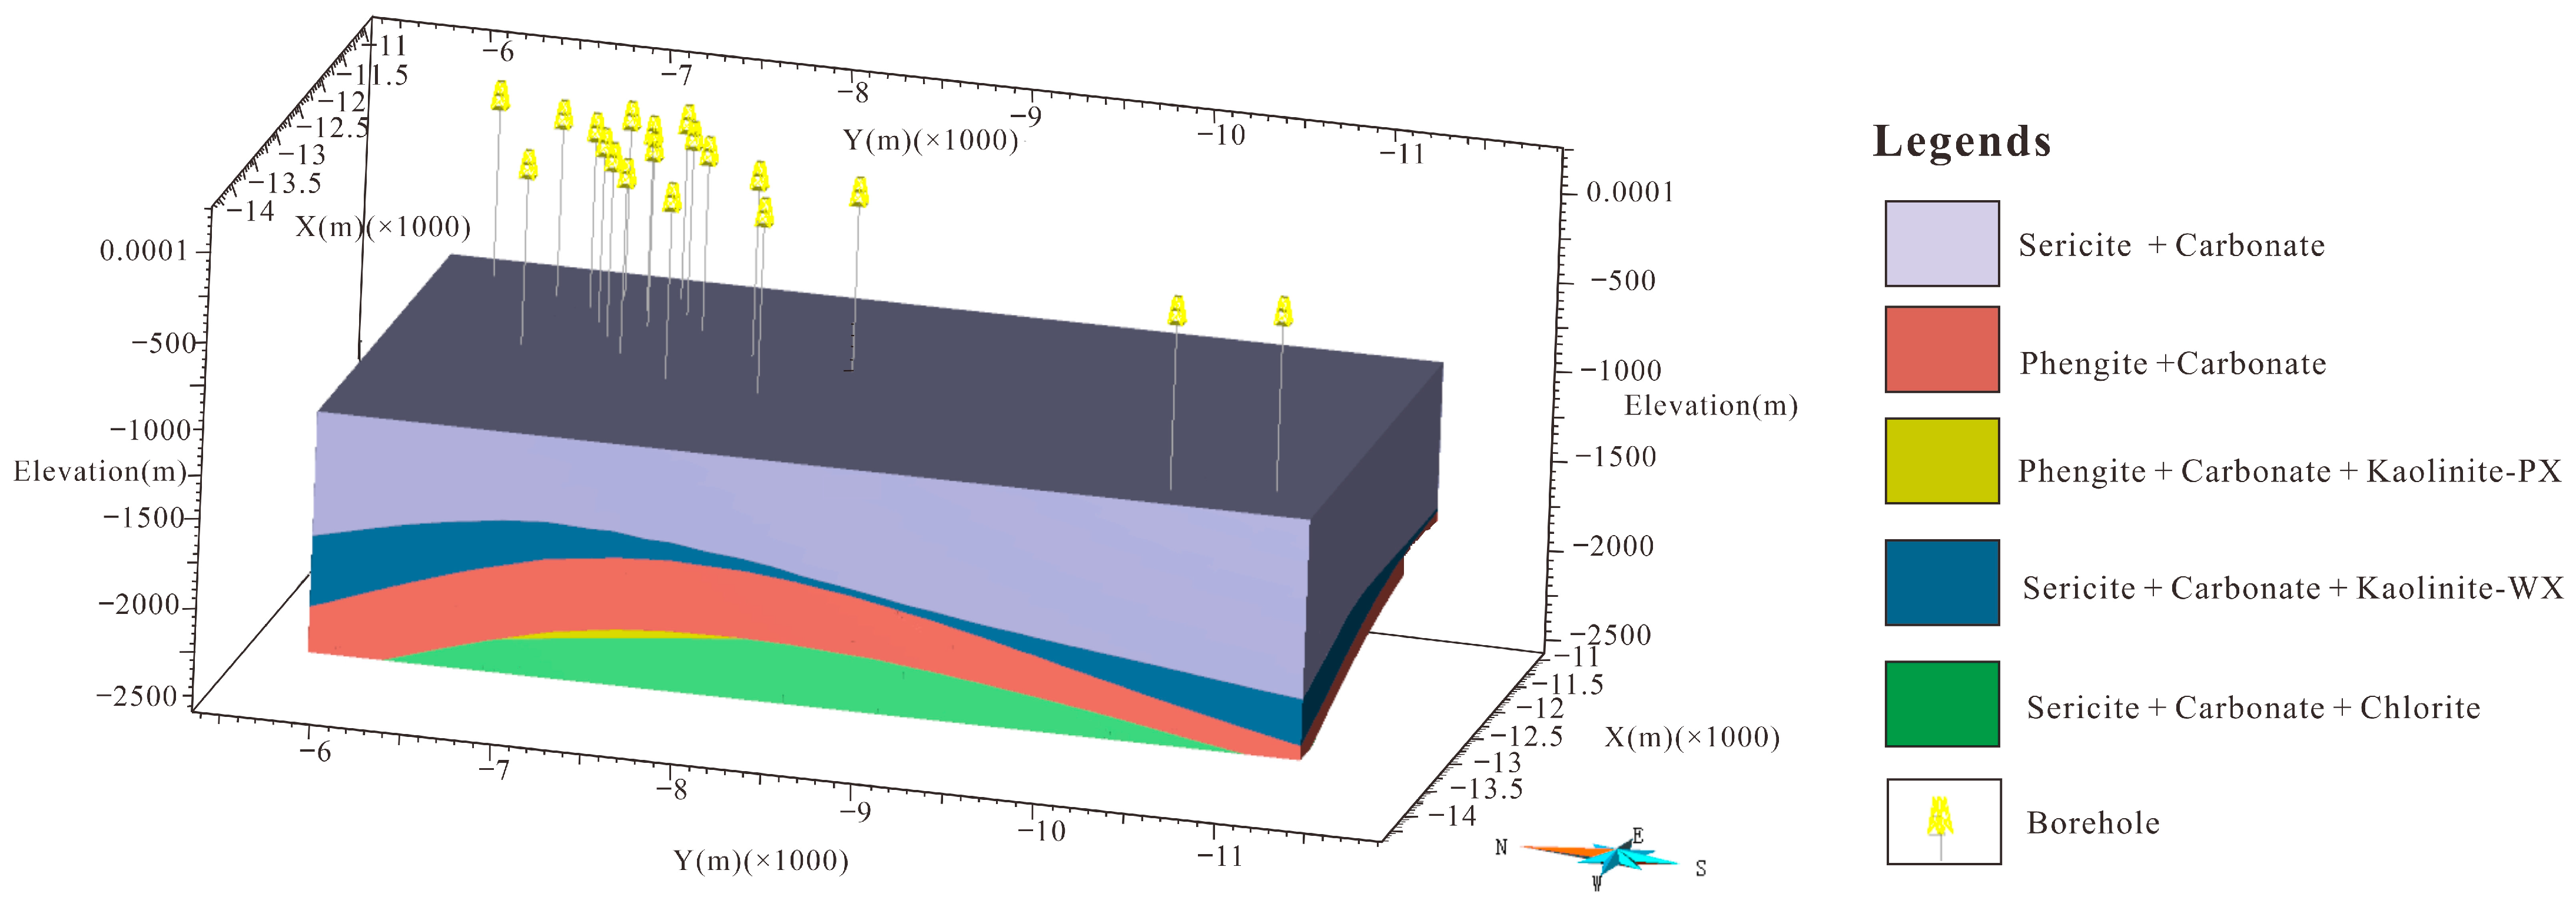
At the deposit scale, the common spatial zonation pattern in the Jiaojia gold deposit advances toward the hydrothermal center. According to the SWIR results, by establishing 3D alteration-zoning models (Figure 18 and Figure 19), the spatial distribution of mineral assemblages can be determined [46,47]. The model shows the location and geometry of the five alteration zones in the area, clearly reveals their spatial distributions, and confirms the 2D alteration-zoning model (Figure 18). The alteration zoning in this area is obvious, and the distribution is relatively stable. The phengite–carbonate alteration zone intersects with the ore body (Figure 19), which agrees well with, and can be a good indication of, the spatial distribution of the mineralization center. The alteration-zone minerals in the surrounding rocks are controlled by the original rock composition and structural zoning. The pyrite–sericite–quartz alteration zone in the footwall of the fault is close to the main fault plane. The pyrite–sericite–quartz alteration is strong, and the main alteration-zone minerals are developed in the center of the ore body. There were large quantities of phengite and carbonate minerals, followed by montmorillonite and a small quantity of kaolinite. Sericite and carbonate rocks are mainly developed in the monzogranite, in the quartz–carbonate stage, and are basically not mineralized. A small quantity of chlorite is developed in the deep granite. In addition to sericite, kaolinite has the most obvious spectral characteristics. The sericite–quartz granitized cataclastic rock on the hanging wall of the main fault surface is rich in kaolinite-wx, indicating an acidic and water-rich environment. Kaolinite was basically undeveloped in the mineralized section. The petrological and SWIR spectral characteristics show that the distribution of these minerals is related to mineralization temperature changes. To sum up, the presence of alteration-zone minerals such as phengite, kaolinite, and chlorite can be used as a direct indicator of the deep ore body of the Zhaoxian gold deposit.
In addition to refining the distribution of layered silicate mineralogy, the Al–OH datasets can be used to track the fluid path that forms the clay alteration and mineralization center [21]. Temperature and pH are the most important factors affecting the hydrothermal system [40]. Taking muscovite and phengite as examples, the increase in the pH value helps to replace Alvi with Fe2 + or Mg2 +, so that the Si/Alvi ratio increases and Pos2200 moves toward the long-wave direction. Therefore, muscovite is formed at a lower pH, whereas phengite is formed at a relatively high pH. According to previous studies, the crystallinity of layered silicate minerals can be used to infer the relative temperature change [9,29]. The greater the crystallinity, the higher the formation temperature [40]. Based on the results of the above analysis of the Al–OH spectral characteristics of sericite in the 1D and 2D space (Section 4.4), the Pos2200 and SWIR-IC values of Al–OH are strongly correlated (Figure 20) and closely associated with mineralization. As the spectral test data for the drill holes are relatively continuous, the 3D modeling for these two parameters can be established by referring to the method of grade modeling in Section 4.1.2. Figure 21 and Figure 22 are constructed by ordinary kriging interpolation in SKUA-GOCAD; the ranges of Pos2200 and SWIR-IC interpolation are constrained in the 3D space by the tectonic alteration zone, clearly reflecting that both Pos2200 and SWIR-IC have high values within the tectonic alteration zone and coincide with the ore body. The range of high values for Pos2200 is wider than the range of high values for SWIR-IC. Therefore, Pos2200 and illite crystallinity can be used as vectors and exploration tools to delineate hydrothermal centers.

5.2. Mineral-Exploration Indications

The 3D alteration-zoning model (Figure 19) shows the location and geometric shape of each alteration zone and the gold mineralization and ore body [21,48]. The model clearly displays the spatial relationships among different alteration types and the ore bodies and fault structures and confirms the relative positions of alteration zones. The alteration zone is relatively continuous, and the phengite zone and underlying kaolinite zone are basically consistent with the ore body enrichment [34,48]. Based on the regional spreading of 3D fracture structures and ore bodies, the main Jiaojia fault was shown to be the key to conducting mineral exploration in the area. By developing a 3D model, it is possible to visualize the geological characteristics of the hanging wall and footwall of the ore body’s occurrence stratum and their variations along the strike [49]. Understanding the spatial range of alteration-zone mineral assemblages and the relationship between the ore body and fault is of great significance for exploration around the deposit and is conducive to developing the mining plan [49]. In addition, based on the 3D geological model, the predecessors proposed a new method of building 3D mineral prospect with a convolutional neural network (CNN), thus reducing the uncertainty of exploration targets [50].
When the quantity of alteration-zone mineral data in the study area is sparse, the mineralized center can be roughly determined through the IC value, which is associated with the sulfide ore-forming stage in the gold deposit, and then the characteristic IC parameters of muscovite can be introduced to delineate the high-temperature core zone of the gold deposit [16]. In the Zhaoxian gold deposit, the exploration targets can be accurately located along with datasets such as the distribution of Al–OH absorption characteristics of sericite (Pos2200 and IC) with pyritization alteration, sericite–kaolinite and phengite alteration zones, the change in kaolinite crystallinity, hand specimen observation and microscopic identification, and geochemical data.
The results of alteration zoning provide an important reference for metallurgical test design. An accurate and comprehensive alteration combination diagram is crucial for optimizing the beneficiation process. The study of gold migration in the Zhaoxian gold deposit showed that each type of alteration accounts for different proportions of chalcopyrite and pyrite [25]. With the support of SWIR analysis, the alteration model established for the Zhaoxian gold deposit describes the precipitation characteristics of gold in different occurrence states, which is essential for the possible grinding and concentration processes in future prefeasibility work [21]. Additionally, because different layered silicate minerals have different flotation reactions, the layered silicate mineral assemblages identified by scalar extraction can help to understand the clay mineral content changes, thus helping to reduce the impact of clay minerals on flotation and bringing obvious economic benefits to mineral processing [51].

6. Conclusions

The analyses of the SWIR spectra show that muscovite, carbonate, kaolinite, montmorillonite, and chlorite are the main alteration-zone minerals in the Zhaoxian gold deposit, among which phengite is closely related to gold mineralization. The mineral assemblages in the study area have obvious zonality, and the changes between zones are gradual. Alteration-zone I consists of sericite–carbonate–chlorite and developed in deep granite. Phengite–carbonate zones are mainly distributed in alteration-zones II and III. Strong pyrite–sericite–quartz alteration is developed in alteration-zone III, and kaolinite is not developed, whereas alteration-zone II contains a small quantity of kaolinite-px. Sericite–carbonate–kaolinite-wx is developed in sericite–quartz granitized cataclastic rock (alteration-zone IV). Alteration-zone V (sericite–carbonate) is located in the monzogranite.
The 3D geological and spectral scalar models show that the study area has obvious tectonic control features, with spatial correlation between alteration zones, fracture structures, and ore bodies. The mineralization zone is a semiopen shear space and provides sufficient space for the water–rock metasomatic reaction of the fluid. The compressive torsional features and concave–convex section zone (depth 3000 m) are the main signs of 3D geological ore-body modeling in the Zhaoxian gold deposit for ore prospecting. A large quantity of high-crystallinity phengite was found near the mineralization and in the deep area, which indicates that a large quantity of gold in the fracture was precipitated in a hydrothermal environment with gradually lower temperatures and relatively higher pH.
The SWIR spectral features indicate that phengite is the proximal alteration-zone mineral to gold mineralization in a strong pyritic sericitization zone. Phengite with relatively high Pos2200 values (>2205 nm) as well as relatively high SWIR-IC values can correspond well to gold mineralization. Both Pos2200 and SWIR-IC can be used as mineralization indicators for the study area.

Author Contributions

Conceptualization, G.W.; methodology, B.L., X.L. and H.W.; software, B.L., X.L. and H.J.; validation, Y.P., X.Z. and H.W.; formal analysis, Y.P., X.Z., Z.Y. and H.W.; investigation, B.L. and G.W.; project administration, G.W. and X.L.; data curation, B.L., X.L. and G.W.; writing—original draft preparation, B.L.; writing—review and editing, G.W. All authors have read and agreed to the published version of the manuscript.

Funding

This research was funded by the open project of the Shandong Provincial Engineering Laboratory of Application and Development of Big Data for Deep Gold Exploration (Grant No. SDK202210) and National Key Research and Development Program of China (Grant No. 2022YFC2903604).

Data Availability Statement

The data presented in this study are available on request from the corresponding author. The data are not publicly available due to the confidentiality of some of the data.

Acknowledgments

The authors thank the Shandong Xincheng Gold Mining Co. Ltd. for its cooperation in field work. We are grateful to Ling Zuo for her constructive comments and discussion. We also thank Xuewei Shao for the improvements to the pictures.

Conflicts of Interest

The authors declare no conflict of interest.

References

  1. Li, P.; Li, J.; Ma, Z. Preference of China s gold resources overseas investment. China Min. Mag. 2021, 30, 23–29. (In Chinese) [Google Scholar]
  2. Deng, J.; Yang, L.-Q.; Groves, D.I.; Zhang, L.; Qiu, K.-F.; Wang, Q.-F. An integrated mineral system model for the gold deposits of the giant Jiaodong province, eastern China. Earth-Sci. Rev. 2020, 208, 103274. [Google Scholar] [CrossRef]
  3. Yang, L.; Deng, J.; Wang, Z.; Guo, L.; Li, R.; Groves, D.I.; Danyushevsky, L.V.; Zhang, C.; Zheng, X.; Zhao, H. Relationships between gold and pyrite at the Xincheng gold deposit, Jiaodong Peninsula, China; implications for gold source and deposition in a brittle epizonal environment. Econ. Geol. Bull. Soc. Econ. Geol. 2016, 111, 105–126. [Google Scholar] [CrossRef] [Green Version]
  4. Deng, J.; Wang, J.P.; Peng, R.M.; Liu, J.; Yang, L. Researches on deep ore prospecting. Miner. Depos. 2004, 23, 142–149. [Google Scholar]
  5. Yang, L.; Deng, J.; Wang, Z.L.; Liang, Z.; Guo, L.N.; Song, M.C.; Zheng, X.L. Mesozoic gold metallogenic system of the Jiaodong gold province, eastern China. Acta Petrol. Sin. 2014, 30, 2447–2467. [Google Scholar]
  6. Deng, J.; Wang, C.; Bagas, L.; Carranza, E.J.M.; Lu, Y. Cretaceous-Cenozoic tectonic history of the Jiaojia Fault and gold mineralization in the Jiaodong Peninsula, China: Constraints from zircon U-Pb, illite K-Ar, and apatite fission track thermochronometry. Miner. Depos. 2015, 50, 987–1006. [Google Scholar] [CrossRef]
  7. Yu, X.; Yang, D.; Li, D.; Shan, W.; Xiong, Y.; Chi, N.; Liu, P.; Yu, L. Mineralization characteristic and geological significance in 3000 m depth of Jiaojia gold metallogenic belt, Jiaodong Peninsula. Acta Petrol. Sin. 2019, 35, 2893–2910. [Google Scholar]
  8. Zhu, D.; Zhang, W.; Wang, Y.; Tian, J.; Liu, H.; Hou, J.; Gao, H.L. Characteristics of ore bodies and prospecting potential of Zhaoxian gold deposit in Laizhou City of Shandong Province. Shandong Land Resour. 2018, 34, 14–19. [Google Scholar]
  9. Duke, E.F. Near infrared spectra of muscovite, Tschermak substitution, and metamorphic reaction progress: Implications for remote sensing. Geology 1994, 22, 621–624. [Google Scholar] [CrossRef]
  10. Green, D.; Schodlok, M. Characterisation of carbonate minerals from hyperspectral TIR scanning using features at 14,000 and 11,300 nm. Aust. J. Earth Sci. 2016, 63, 951–957. [Google Scholar]
  11. Laukamp, C.; Cudahy, T.; Thomas, M.; Jones, M.; Cleverley, J.S.; Oliver, N.H. Hydrothermal mineral alteration patterns in the Mount Isa Inlier revealed by airborne hyperspectral data. Aust. J. Earth Sci. 2011, 58, 917–936. [Google Scholar] [CrossRef]
  12. Laukamp, C.; Salama, W.; Gonzalez-Alvarez, I. Proximal and remote spectroscopic characterisation of regolith in the Albany-Fraser Orogen (Western Australia). Ore Geol. Rev. 2016, 73, 540–554. [Google Scholar] [CrossRef]
  13. Thompson, A.J.; Hauff, P.L.; Robitaille, A.J. Alteration mapping in exploration: Application of short-wave infrared (SWIR) spectroscopy. SEG Discov. 1999, 39, 1–27. [Google Scholar] [CrossRef]
  14. Jones, S.; Herrmann, W.; Gemmell, J.B. Short-wavelength infrared spectral characteristics of the RW horizon: Implications for exploration in the Myra Falls volcanic-hosted massive sulfide camp, Vancouver Island, British Columbia, Canada. Econ. Geol. 2005, 100, 273–294. [Google Scholar] [CrossRef]
  15. Yang, K.; Browne, P.R.L.; Huntington, J.F.; Walshe, J.L. Characterising the hydrothermal alteration of the Broadlands–Ohaaki geothermal system, New Zealand, using short-wave infrared spectroscopy. J. Volcanol. Geotherm. Res. 2001, 106, 53–65. [Google Scholar] [CrossRef]
  16. Laakso, K.; Peter, J.M.; Rivard, B.; White, H.P. Short-wave infrared spectral and geochemical characteristics of hydrothermal alteration at the Archean Izok Lake Zn-Cu-Pb-Ag volcanogenic massive sulfide deposit, Nunavut, Canada: Application in exploration target vectoring. Econ. Geol. 2016, 111, 1223–1239. [Google Scholar] [CrossRef]
  17. de Kemp, E.A.; Schetselaar, E.M.; Hillier, M.J.; Lydon, J.W.; Ransom, P.W. Assessing the workflow for regional-scale 3D geologic modeling: An example from the Sullivan time horizon, Purcell Anticlinorium East Kootenay region, southeastern British Columbia. Interpretation 2016, 4, SM33–SM50. [Google Scholar] [CrossRef] [Green Version]
  18. Wang, G.; Zhang, Z.; Li, R.; Li, J.; Sha, D.; Zeng, Q.; Pang, Z.; Li, D.; Huang, L. Resource prediction and assessment based on 3D/4D big data modeling and deep integration in key ore districts of North China. Sci. China Earth Sci. 2021, 64, 1590–1606. [Google Scholar] [CrossRef]
  19. Malehmir, A.; Thunehed, H.; Tryggvason, A. The Paleoproterozoic Kristineberg mining area, northern Sweden: Results from integrated 3D geophysical and geologic modeling, and implications for targeting ore deposits3D geologic modeling. Geophysics 2009, 74, B9–B22. [Google Scholar] [CrossRef]
  20. Laudadio, A.B.; Schetselaar, E.; Mungall, J.; Houlé, M. 3D modeling of the Esker intrusive complex, Ring of Fire intrusive suite, McFaulds Lake greenstone belt, Superior Province: Implications for mineral exploration. Ore Geol. Rev. 2022, 145, 104886. [Google Scholar] [CrossRef]
  21. Harraden, C.L.; McNulty, B.; Gregory, M.J.; Lang, J.R. Shortwave infrared spectral analysis of hydrothermal alteration associated with the Pebble porphyry copper-gold-molybdenum deposit, Iliamna, Alaska. Econ. Geol. 2013, 108, 483–494. [Google Scholar] [CrossRef]
  22. Chen, H.; Zhang, S.; Chu, G.; Zhang, Y.; Cheng, J.; Tian, J.; Han, J. The short wave infrared (SWIR) spectral characteristics of alteration minerals and applications for ore exploration in the typical skarn-porphyry deposits, Edong ore district, eastern China. Acta Petrol. Sin. 2019, 35, 3629–3643. [Google Scholar]
  23. Shao, X.; Peng, Y.; Wang, G.; Zhao, X.; Tang, J.; Huang, L.; Liu, X.; Zhao, X. Application of SWIR, XRF and thermoelectricity analysis of pyrite in deep prospecting in the Xincheng gold orefield, Jiaodong peninsula. Earth Sci. Front. 2021, 28, 236. [Google Scholar]
  24. Song, M.C.; Song, Y.X.; Ding, Z.J.; Wei, X.F.; Sun, S.L.; Song, G.Z.; Zhang, J.J.; Zhang, P.J.; Wang, Y.G. The discovery of the Jiaojia and the Sanshandao giant gold deposits in Jiaodong Peninsula and discussion on the relevant issues. Geotecton. Metallog. 2019, 43, 92–110. [Google Scholar]
  25. Song, Y.; Song, Y.X.; Cui, S.X.; Jiang, H.L.; Yuan, W.H.; Wang, H.J. Characteristic comparison between shallow and deep-seated gold ore bodies in Jiaojia superlarge gold deposit, northwestern Shandong peninsula. Miner. Depos. 2011, 30, 923–932. [Google Scholar]
  26. Wang, G.; Zhu, Y.; Zhang, S.; Yan, C.; Song, Y.; Ma, Z.; Hong, D.; Chen, T. 3D geological modeling based on gravitational and magnetic data inversion in the Luanchuan ore region, Henan Province, China. J. Appl. Geophys. 2012, 80, 1–11. [Google Scholar] [CrossRef]
  27. Zeqiri, R. Geostatistical analysis of the nickel source in Gllavica mine, Kosovo. Min. Miner. Depos. 2020, 14, 53–58. [Google Scholar] [CrossRef]
  28. Zhou, Y.; Li, L.; Yang, K.; Xing, G.; Xiao, W.; Zhang, H.; Xiu, L.; Yao, Z.; Xie, Z. Hydrothermal alteration characteristics of the Chating Cu-Au deposit in Xuancheng City, Anhui Province, China: Significance of sericite alteration for Cu-Au exploration. Ore Geol. Rev. 2020, 127, 103844. [Google Scholar] [CrossRef]
  29. Zuo, L.; Wang, G.; Carranza, E.J.M.; Zhai, D.; Pang, Z.; Cao, K.; Mou, N.; Huang, L. Short-Wavelength Infrared Spectral Analysis and 3D Vector Modeling for Deep Exploration in the Weilasituo Magmatic–Hydrothermal Li–Sn Polymetallic Deposit, Inner Mongolia, NE China. Nat. Resour. Res. 2022. [Google Scholar] [CrossRef]
  30. Pontual, S.; Merry, N.; Gamson, P. Spectral Interpretation-Field Manual. In GMEX. Spectral Analysis Guides for Mineral Exploration; AusSpec International Pty: Kwinana, WA, Australia, 2008. [Google Scholar]
  31. Yang, K.; Huntington, J.; Gemmell, J.B.; Scott, K. Variations in composition and abundance of white mica in the hydrothermal alteration system at Hellyer, Tasmania, as revealed by infrared reflectance spectroscopy. J. Geochem. Explor. 2011, 108, 143–156. [Google Scholar] [CrossRef]
  32. Clark, R.N.; King, T.V.V.; Klejwa, M.; Swayze, G.A.; Vergo, N. High spectral resolution reflectance spectroscopy of minerals. J. Geophys. Res. Solid Earth 1990, 95, 12653–12680. [Google Scholar]
  33. Gaillard, N.; Williams-Jones, A.E.; Clark, J.R.; Lypaczewski, P.; Salvi, S.; Perrouty, S.; Piette-Lauzière, N.; Guilmette, C.; Linnen, R.L. Mica composition as a vector to gold mineralization: Deciphering hydrothermal and metamorphic effects in the Malartic district, Quebec. Ore Geol. Rev. 2018, 95, 789–820. [Google Scholar] [CrossRef] [Green Version]
  34. Haest, M.; Cudahy, T.; Laukamp, C.; Gregory, S. Quantitative mineralogy from infrared spectroscopic data; I, Validation of mineral abundance and composition scripts at the Rocklea Channel iron deposit in Western Australia. Econ. Geol. 2012, 107, 209–228. [Google Scholar] [CrossRef]
  35. Clark, R.N. Spectral properties of mixtures of montmorillonite and dark carbon grains: Implications for remote sensing minerals containing chemically and physically adsorbed water. J. Geophys. Res. Solid Earth 1983, 88, 635–644. [Google Scholar] [CrossRef]
  36. Doublier, M.P.; Roache, T.; Potel, S.; Laukamp, C. Short-wavelength infrared spectroscopy of chlorite can be used to determine very low metamorphic grades. Eur. J. Mineral. 2012, 24, 891–902. [Google Scholar] [CrossRef]
  37. Lampinen, H.M.; Laukamp, C.; Occhipinti, S.A.; Hardy, L. Mineral footprints of the Paleoproterozoic sediment-hosted Abra Pb-Zn-Cu-Au deposit Capricorn Orogen, Western Australia. Ore Geol. Rev. 2019, 104, 436–461. [Google Scholar] [CrossRef]
  38. Hosseini, S.T.; Asghari, O.; Emery, X. An enhanced direct sampling (DS) approach to model the geological domain with locally varying proportions: Application to Golgohar iron ore mine, Iran. Ore Geol. Rev. 2021, 139, 104452. [Google Scholar] [CrossRef]
  39. Zhang, S.; Chu, G.; Cheng, J.; Zhang, Y.; Tian, J.; Li, J.; Sun, S.; Wei, K. Short wavelength infrared (SWIR) spectroscopy of phyllosilicate minerals from the Tonglushan Cu-Au-Fe deposit, Eastern China: New exploration indicators for concealed skarn orebodies. Ore Geol. Rev. 2020, 122, 103516. [Google Scholar]
  40. Halley, S.; Dilles, J.H.; Tosdal, R.M. Footprints: Hydrothermal Alteration and Geochemical Dispersion Around Porphyry Copper Deposits. SEG Discov. 2015, 100, 1–17. [Google Scholar] [CrossRef]
  41. Wang, R.; Cudahy, T.; Laukamp, C.; Walshe, J.L.; Bath, A.; Mei, Y.; Young, C.; Roache, T.J.; Jenkins, A.; Roberts, M.; et al. White Mica as a Hyperspectral Tool in Exploration for the Sunrise Dam and Kanowna Belle Gold Deposits, Western Australia. Econ. Geol. 2017, 112, 1153–1176. [Google Scholar] [CrossRef]
  42. Yang, K.; Huntington, J.F.; Browne, P.R.; Ma, C. An infrared spectral reflectance study of hydrothermal alteration minerals from the Te Mihi sector of the Wairakei geothermal system, New Zealand. Geothermics 2000, 29, 377–392. [Google Scholar]
  43. Haest, M.; Cudahy, T.; Rodger, A.; Laukamp, C.; Martens, E.; Caccetta, M. Unmixing the effects of vegetation in airborne hyperspectral mineral maps over the Rock lea Dome iron-rich palaeochannel system (Western Australia). Remote Sens. Environ. 2013, 129, 17–31. [Google Scholar] [CrossRef]
  44. Sun, L.; Khan, S.; Shabestari, P. Integrated Hyperspectral and Geochemical Study of Sediment-Hosted Disseminated Gold at the Goldstrike District, Utah. Remote Sens. 2019, 11, 1987. [Google Scholar] [CrossRef]
  45. Khan, S.D.; Okyay, Ü.; Ahmad, L.; Shah, M.T. Characterization of Gold Mineralization in Northern Pakistan Using Imaging Spectroscopy. Photogramm. Eng. Remote Sens. 2018, 84, 425–434. [Google Scholar] [CrossRef]
  46. Wang, G.; Zhang, S.; Yan, C.; Pang, Z.; Wang, H.; Feng, Z.; Dong, H.; Cheng, H.; He, Y.; Li, R.; et al. Resource-environmental joint forecasting in the Luanchuan mining district, China through big data mining and 3D/4D modeling. Earth Sci. Front. 2021, 28, 139. [Google Scholar]
  47. Wang, G.; Li, R.; Carranza, E.J.; Zhang, S.; Yan, C.; Zhu, Y.; Qu, J.; Hong, D.; Song, Y.; Han, J.; et al. 3D geological modeling for prediction of subsurface Mo targets in the Luanchuan district, China. Ore Geol. Rev. 2015, 71, 592–610. [Google Scholar] [CrossRef]
  48. Haest, M.; Cudahy, T.; Laukamp, C.; Gregory, S. Quantitative mineralogy from infrared spectroscopic data. II. Three-dimensional mineralogical characterization of the Rocklea channel iron deposit, Western Australia. Econ. Geol. 2012, 107, 229–249. [Google Scholar] [CrossRef]
  49. Petlovanyi, M.V.; Ruskykh, V.V. Peculiarities of the underground mining of high-grade iron ores in anomalous geological conditions. J. Geol. Geogr. Geoecol. 2019, 28, 706–716. [Google Scholar] [CrossRef]
  50. Deng, H.; Zheng, Y.; Chen, J.; Yu, S.; Xiao, K.; Mao, X. Learning 3D mineral prospectivity from 3D geological models using convolutional neural networks: Application to a structure-controlled hydrothermal gold deposit. Comput. Geosci. 2022, 161, 105074. [Google Scholar] [CrossRef]
  51. Petlovanyi, M.; Ruskykh, V.; Zubko, S.; Medianyk, V. Dependence of the mined ores quality on the geological structure and properties of the hanging wall rocks. E3S Web Conf. 2020, 201, 01027. [Google Scholar]
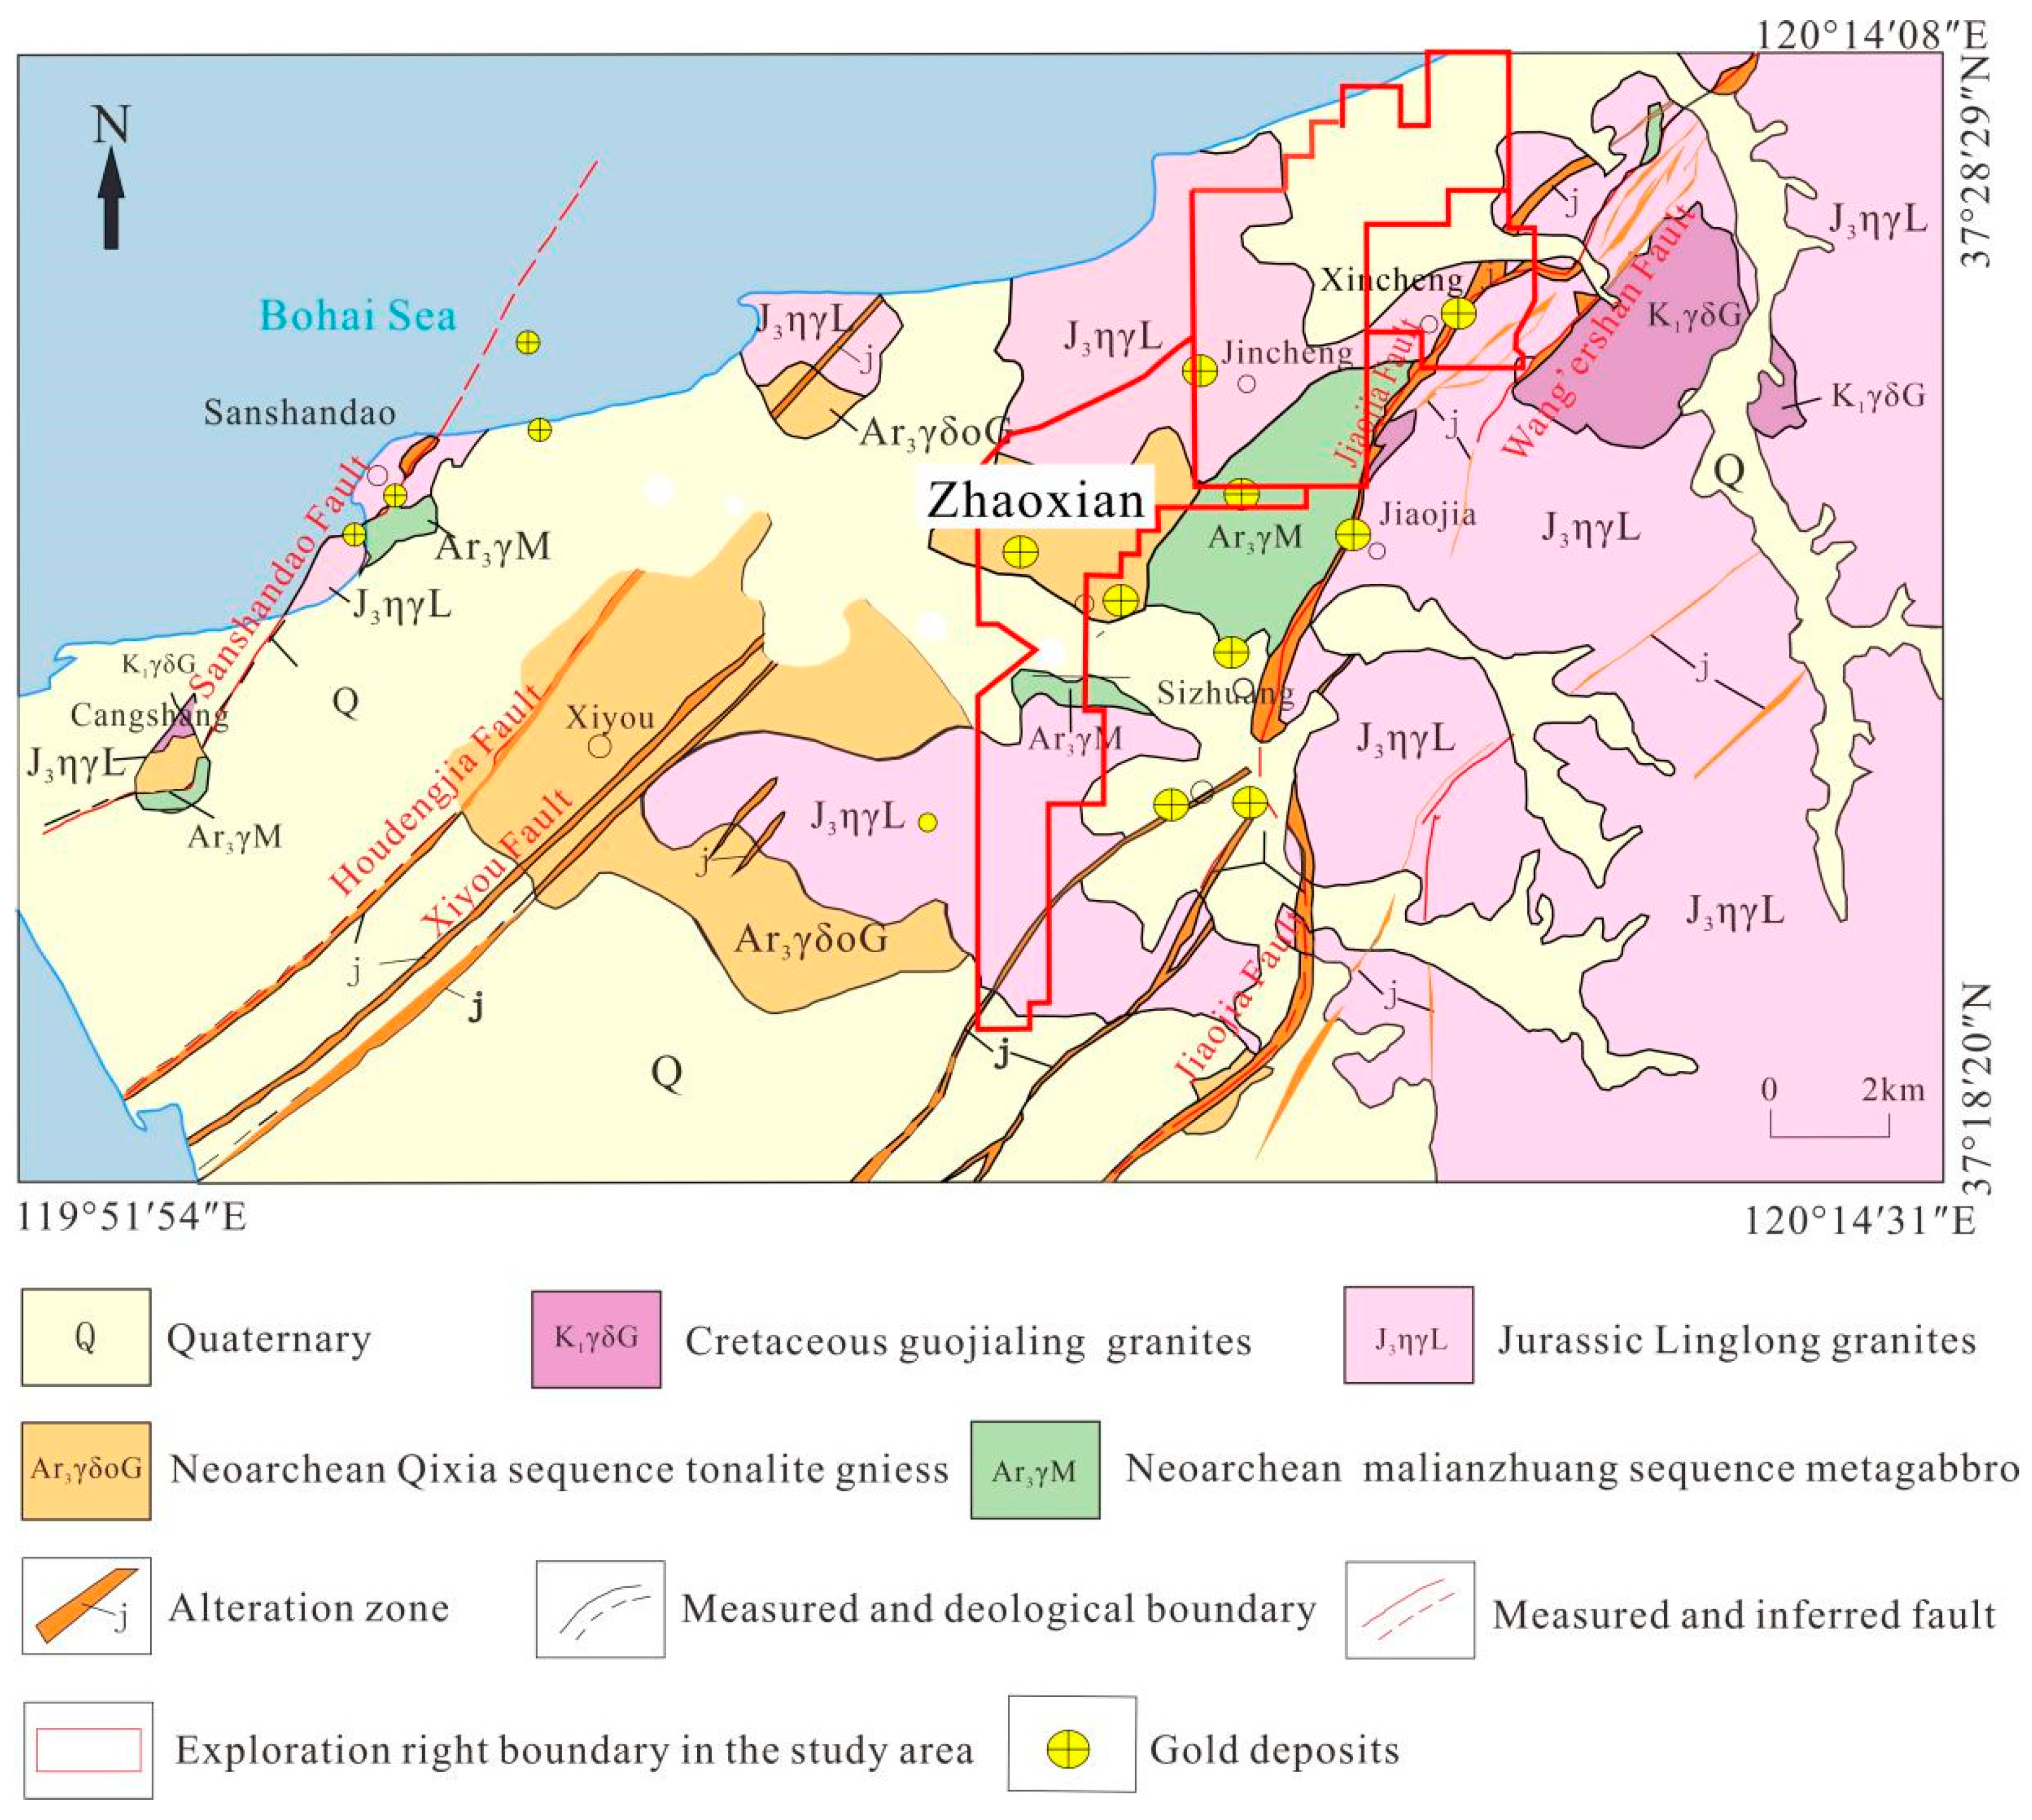
Figure 1. Simplified regional geologic map of the Jiaodong Peninsula (modified by [23]).
Minerals 12 01272 g001
Figure 2. Pyrite-type hand samples and ore-body microscope photos show the occurrence state of transparent minerals and gold (modified by [23]). (a)—Type I pyrite in sericitized granites (PyI); (b)—Type II pyrite in quartz pyrite veins (PyII); (c)—Type III pyrite in quartz sulfide ores (PyIII); (d)—Type IV pyrite in pyrite calcite vein ores (PyIV); (eh)—transparent mineral forms under polarized light microscopy; (il)—occurrence state of gold in different types of pyrite. Py—pyrite; Ser—sericite; Qtz—quartz; Cal—calcite; Pl—plagioclase; Ap—apatite; Ttn—sphene; Au—natural gold; Gn—galena.
Minerals 12 01272 g002
Figure 3. Common spectral profiles and absorption positions in short-wavelength infrared (SWIR) spectrometry (after GMEX, 2008 [30]).
Minerals 12 01272 g003
Figure 4. Locations of short-wavelength infrared (SWIR) test holes at the mine site ((a)—top view; (b)—side view).
Minerals 12 01272 g004
Figure 5. (a)—Northwestern Jiaodong Peninsula three-dimensional (3D) fault and ore-body model; (b)—3D ore-body and fault model of Zhaoxian gold deposit.
Minerals 12 01272 g005aMinerals 12 01272 g005b
Figure 6. Three-dimensional (3D) ore-body modeling of Zhaoxian gold deposit.
Minerals 12 01272 g006
Figure 7. Three-dimensional (3D) fault and grade-interpolation modeling of Zhaoxian gold deposit. (a)—Variograms in 3D environment in Jiaojia gold belt; (b)—3D grade-interpolation model of Zhaoxian gold deposit.
Minerals 12 01272 g007
Figure 8. Three-dimensional tectonic alteration-zone and ore-body modeling.(a)—front view; (b)—side view.
Minerals 12 01272 g008
Figure 9. Cross-section of No. 88 Exploration Line of Zhaoxian gold deposit.
Minerals 12 01272 g009
Figure 10. Distribution of alteration-zone minerals in drill-hole 88ZK01. ①—Sericite–quartz granitized cataclastic rock; ②—sericitized granite; ③—biotite monzogranite; ④—white diorite porphyrite; ⑤—sericite–quartz cataclastic rock; ⑥—pyrite–sericite–quartz granitic cataclastic rock; ⑦—pyrite–sericite–quartz cataclastic rock; ⑧—potassic sericite–quartz granitic cataclastic rock. 2200D indicates relative abundance of sericite minerals; 2160D indicates relative abundance of kaolinite; I—sericite–carbonate–chlorite alteration-zone; II—sericite–carbonate–kaolinite-px alteration-zone; III—phengite–carbonate–kaolinite-wx alteration-zone; IV—phengite–carbonate alteration-zone; V—sericite–carbonate alteration-zone.
Minerals 12 01272 g010
Figure 11. Distribution of alteration-zone minerals in drill-hole 88ZK03. ①—Biotite monzonitic granite; ②—sericite monzogranite; ③—pyrite–sericite–quartz granite; ④—pyrite–sericite–quartz granitic cataclastic rock; ⑤—tectonic cataclastic rock; ⑥—lithified cataclastic rock; ⑦—gabbro; ⑧—sericite–quartz cataclastic rock; ⑨—potassic granitic gneiss. 2200D indicates relative abundance of sericite-group minerals; ⑩—2160D indicates relative abundance of kaolinite; I—sericite–carbonate–chlorite alteration-zone; II—sericite–carbonate–kaolinite-px alteration-zone; III—phengite–carbonate–kaolinite-wx alteration-zone; IV—phengite–carbonate alteration-zone; V—sericite–carbonate alteration-zone.
Minerals 12 01272 g011
Figure 12. Distribution of alteration-zone minerals in drill-hole 88ZK05. ①—Biotite monzonitic granite; ②—sericite–quartz granitic cataclastic rock; ③—diorite porphyrite; ④—sericite–quartz cataclastic rock; ⑤—pyrite–sericite–quartz granitic cataclastic rock; ⑥—pyrite–sericite–quartz cataclastic rock; ⑦—biotite-bearing monzonitic granitic cataclastic rock. 2200D indicates relative abundance of sericite-group minerals; 2160D indicates relative abundance of kaolinite; I—sericite–carbonate–chlorite alteration-zone; II—sericite–carbonate–kaolinite-px alteration-zone; III—phengite–carbonate–kaolinite-wx alteration-zone; IV—phengite–carbonate alteration-zone.
Minerals 12 01272 g012
Figure 13. Relative frequencies of Al–OH Pos2200 in white mica.
Minerals 12 01272 g013
Figure 14. Wavelength relationship histogram of sericite Al–OH Pos2200 and depth.
Minerals 12 01272 g014
Figure 15. No. 88 Exploration Line diagram of two-dimensional spatial variation of characteristic absorption peak position of muscovite Al–OH Pos2200.
Minerals 12 01272 g015
Figure 16. No. 88 Exploration Line diagram of two-dimensional spatial variation of characteristic absorption depth of muscovite Al–OH 2200D.
Minerals 12 01272 g016
Figure 17. No. 88 Exploration Line diagram of two-dimensional spatial change in short-wave infrared illite crystallinity.
Minerals 12 01272 g017
Figure 18. Three-dimensional modeling of alteration zones in Zhaoxian gold deposit.
Minerals 12 01272 g018
Figure 19. Relationship between alteration zone and mineralization.
Minerals 12 01272 g019
Figure 20. Relationship between characteristic parameters of muscovite (2200D represents relative content of muscovite).
Minerals 12 01272 g020
Figure 21. Changes in Pos2200 values in alteration zone.
Minerals 12 01272 g021
Figure 22. Changes in short-wave infrared illite crystallinity values in alteration zone.
Minerals 12 01272 g022
Table 1. Characteristics of hydrothermal metallogenesis and pyrite in different stages.
Metallogenic StagePyrite DistributionParagenetic Mineral AssemblagesPyrite FormDegree of Mineralization
Pyrite-quartz–sericite stage (I)Irregular granular or idiomorphic coarse-grained crystalsPyrite, quartz, sericitePyrite quartz veinWeak
Quartz–pyrite stage (II)Fine-grained heteromorphic, veinlet, reticulatePyrite, sericite, chloritePyrite quartz crushingStrongest
Quartz–polymetallic sulfide stage (III)Fine-grained, veinlet, and disseminatedQuartz, pyrite (chalcopyrite), galena, sphalerite, etc.Quartz–polymetallic sulfide assemblageStrongest
Quartz–carbonate stage (IV)Veinlet or reticulateQuartz, carbonate, and a small amount of pyriteIntercalation of quartz calcite veinsNo
Table 2. Scalar quantity and extraction used to identify white mica, chlorite, and kaolinite in TSG8 (modified by [37]).
Scalar NameMineral GroupPlain DescriptionBase Algorithm
Al–OH feature depth (2200D)White micaRelative depth of the absorption feature near 2200 nm wavelength.On the spectrum with the hull quotient removed, the fourth-order polynomial fitting is performed near the relative absorption depth (near 2200 nm).
Al–OH feature wavelength (Pos2200)White micaShift of the absorption feature near 2200 nm because of Tschermak’s substitution of Al in white mica.On the spectrum with the hull quotient removed, the fourth-order polynomial fitting is performed near the position of the minimum absorption peak.
Kaolin group crystallinity (2160D)Kaolin groupThe crystallinity order of the kaolinite group minerals can be indicated by 2160D. The larger the relative value of 2160D, the better the crystallinity order.On the spectrum with the hull quotient removed, the fourth-order polynomial fitting is performed near the relative absorption depth (near 2160 nm).
Fe–OH feature depth (2250D)ChloriteRelative absorption depth of absorption feature at 2250 nm wavelength; indicative of Fe–OH mineral abundance.On the spectrum with the hull quotient removed, the fourth-order polynomial fitting is performed near the relative absorption depth (near 2250 nm).
Fe–OH feature wavelength (W2250)ChloriteEstimation of Mg/(Mg+Fe) in chlorite, where the wavelength position is caused by Mg, Fe, or relative Al, Fe3+, or Ca content.The minimum wavelength of 2250 nm absorption of the continuous medium is removed near 2250 nm, which is determined by four-band polynomial fitting around the band with the lowest reflectivity.
Mg–OH feature depth (W2350)ChloriteDepth of 2350 nm feature, evident in white mica, chlorite, and carbonate; used to separate white mica from Al-smectites, when Al–OH feature is present.On the spectrum with the hull quotient removed, the fourth-order polynomial fitting is performed near the position of the minimum absorption peak (near 2350 nm).
Publisher’s Note: MDPI stays neutral with regard to jurisdictional claims in published maps and institutional affiliations.