Article

Characteristics and Identification Method of Natural and Mine Earthquakes: A Case Study on the Hegang Mining Area

1
Key Laboratory of Earthquake Engineering and Engineering Vibration, Institute of Engineering Mechanics, China Earthquake Administration, Harbin 150080, China
2
Key Laboratory of Earthquake Disaster Mitigation, Ministry of Emergency Management, Harbin 150080, China
3
School of Mining Engineering, Heilongjiang University of Science and Technology, Harbin 150022, China
4
Heilongjiang Province Hydraulic Research Institute, Harbin 150006, China
5
School of Architecture and Civil Engineering, Harbin University of Science and Technology, Harbin 150080, China
*
Author to whom correspondence should be addressed.
Minerals 2022, 12(10), 1256; https://doi.org/10.3390/min12101256
Submission received: 30 August 2022 / Revised: 26 September 2022 / Accepted: 28 September 2022 / Published: 1 October 2022

Abstract

:
Accurate identification of natural and mine earthquakes in mining areas is of great significance to the construction of secondary disaster warning networks. Based on 490 records of natural and mine earthquakes in the Hegang area from 2006 to 2017, this paper compares and analyzes the ground motion characteristics of the research samples (150 earthquake records and 200 mine earthquake records) and selects the key identification parameters of dominant frequency, Pm/Tc, and Sm/Tc. The correct identification rate of the test samples (60 seismic records and 80 mine earthquake records) is 95.7%, 91.4%, and 93.6%, respectively, and the actual threat rate is 90.8%, 83.3%, and 86.3%, respectively. Finally, based on the selected key identification parameters, a “three-parameter comprehensive gradient discriminant method” is proposed. The correct identification rate and actual threat rate are 99.3% and 98.4%, respectively, which can basically accurately identify natural and mine earthquakes. It provides a certain method and theoretical support for the mining area vibration identification method, safety production, and disaster warning.

1. Introduction

As one of the three major energy sources in the world, coal accounts for one-third of global energy consumption. Due to China’s lack of oil, little gas, and relatively rich coal, coal will remain the most important basic energy and industrial raw material in China for a long time in the future. The Chinese Academy of Engineering predicts that the proportion of coal in primary energy consumption will remain around 50% in 2050. Before 2050, the coal-dominated energy structure will be difficult to change [1]. Natural earthquakes, also known as ground motion or ground vibration, area natural phenomenon of strong ground vibration caused by seismic waves generated during the rapid release of energy from the crust. It is an earthquake caused by dislocation and rupture at the edge of the plate and inside the plate due to the mutual extrusion and collision between the plates.
A mine earthquake is an induced earthquake caused by mining activities. It is the abnormal state of the stress in and around the mining area under the influence of internal regional stress and mining activities in the mining area. After accumulating a certain amount of energy in the local area, it is released by impact or gravity.
With the depletion of shallow coal resources, China has entered the deep coal mine environment, which is in the “high geostress, high geotemperature, high osmotic pressure and strong mining disturbance” complex conditions [2], and the frequency and intensity of mine earthquakes are increasing [3,4]. According to statistics, in the Hegang area, there have been an average of about 580 mine earthquakes every year in recent years. Moreover, earthquakes may also induce mine earthquakes and cause secondary disasters in coal mines, such as coal and gas outbursts, cock bursts, etc. Research has shown that the intensity value of an M3.5 mine earthquake in the Hegang mining area can reach 7 degrees, while the intensity of a general M5 earthquake in Heilongjiang can reach 7° [5]. Due to the shallow focus and high frequency of mine earthquakes, their seismic intensity in the meizoseismal area is much greater than that of natural earthquakes. In addition to the special environment of the mine, mine earthquakes are prone to show the characteristics of “serious disaster occurs after small earthquake” [6]. For example, on 9 June 2019, a magnitude 2.3 mine earthquake occurred in the Longjiabao mine industry, Jilin Province, resulting in 9 deaths and 10 injuries. Both mine earthquakes and earthquakes can cause serious threats to the safety of production and life in the mining area.
Recent research by the author has found that earthquakes or mine earthquakes can cause gas outbursts to varying degrees, and even gas explosions. In recent years, there have been many gas accidents caused by mine earthquakes, and there is a strong correlation between gas outbursts and mine earthquakes, which is shown in Table 1.
Statistics show that the natural and mine earthquake activities precede the occurrence of disasters and accidents, ranging from a few minutes to a few hours or even a few days, and this time interval gives sufficient time to deal with secondary disasters in the mining area. The analysis of the above disaster accidents shows several characteristics. (1) Magnitude affects the occurrence of secondary disasters. If the earthquake magnitude exceeds 3, it may induce coal mine disasters and accidents. However, a mine earthquake of more than magnitude 1 may induce coal mine disasters. (2) The hypocentral distance affects the occurrence of secondary disasters. It can be seen from the table that vibration can induce coal mine safety accidents, and vibration-induced coal mine disaster accidents are related to the distance between the focal of the seismic and the mining area, shown as “large earthquakes are required in the far field, and small earthquakes are required in the near field”.
Natural and mine earthquakes can cause gas disasters of varying degrees, and there is a strong correlation between gas outbursts and vibration, and it shows the characteristics of “serious disaster occurs after small earthquake”, which provides sufficient warning time. However, the measures taken to avoid disasters are very different for different types, levels, and impact areas of vibration. Therefore, the primary problem to be solved in this paper is the accurate identification of natural and mine earthquakes and providing certain guiding significance for the safety evaluation of mining areas.
Some research works have been previously conducted on the identification of natural and mine earthquakes. Lizurek [7] and Sagan [8] employed a full moment tensor inversion method to distinguish tectonic and artificial earthquakes in Poland. Holub [9] found that the tectonic and unnatural earthquakes in the Ostrava Karvina coal mine district were different in terms of energyfrequency during the earthquake. Kalab [10] investigated seismic and rockburst waveforms in the Upper Silesian coal basin in Poland. Holub [11] distinguished tectonic and mine earthquakes in the Ostrava-Karina mine district in the Czech Republic based on frequency energy distribution. Stec [12] studied earthquakes in the Upper Silesian coal basin in Poland and classified earthquakes into natural tectonic and mine earthquakes based on their energy and focal mechanism. Bischoff [13] studied seismic activities using spatial and temporal correlations based on a large number of earthquakes that had occurred in the Ruhr mining area and found their frequency–amplitude distributions. George [14] discussed the differences between natural and mine earthquakes in terms of maximum magnitude, aftershock attenuation rate, and stress release model. Koper [15] utilized the differences between local (ML) and coda/duration (MC) magnitudes to distinguish unnatural earthquakes from tectonic earthquakes in Utah. It was found that ML-MC mean mine-induced seismicity (MIS) was smaller for unnatural earthquakes than tectonic seismicity (TS). Rudzinski [16] performed signal analyses with both raw signal cross-correlation (CC) and binary signal cross-correlation (BCC) to identify mine-induced seismicity doublets of earthquakes in the Ruhr basin, Poland, and proved that mine activities were able to produce strong mine earthquakes.
In 1995, Zhao et al. [17] conducted a case study in the Beijing area based on local network data and discussed differences between natural and mine earthquakes, making him the first researcher in China to carry out comparative analyses on natural and mine earthquakes. In 2001, Zhang et al. [18] compared the differences between natural and mine earthquakes in terms of focal characteristics, first motion direction, occurrence time, maximum amplitude ratio, and period. In 2005, Liu et al. [19] selected the Morlet wavelet as a basis function to analyze the differences between natural and mine earthquakes in terms of energy attenuation factor and developed an identification method. In 2005, Sun et al. [20] investigated the differences between natural and mine earthquakes based on spectral characteristics, corner frequencies of longitudinal and transverse waves, and maximum spectral values of natural and mine earthquakes independently. In 2006, He et al. [21] extracted the signal characteristics of natural and mine earthquakes using the wavelet packet analysis method as the identification factor of both earthquake forms. The factor recognition rate was tested by natural and mine earthquake data obtained from Fushun Station in Liaoning Province. Results showed that the recognition success rate was high. In 2013, Wang et al. [22] used an FSS-3DBH underground seismometer to analyze the waveforms of mine earthquakes, blasting, and natural earthquakes in the Zoucheng area, Shandong Province. It was found that there were obvious differences in their waveforms, amplitudes, and frequencies. In 2015, Yang et al. [23] applied different indicators, including energy, amplitude ratio, period, surface wave, the first motion of P-wave, wave attenuation, and time performance, to differentiate natural earthquakes, blasting, and mine earthquakes. Jin et al. [24] and Xia [25] explored the differences among the abovementioned three types of tremors and determined the ranges of their dominant frequencies separately.
To sum up, the identification of natural and mine earthquakes is mainly from the aspects of ground motion characteristics, first motion direction of P-wave, amplitude ratio, dominant frequency, etc. However, at present, there is only qualitative recognition research, and there is no quantitative research on the accuracy of identification. Therefore, it is particularly important to give the basic ground motion characteristics and accurate identification methods of natural and mine earthquakes. Based on 490 records of natural and mine earthquakes at Hegang Station from 2006 to 2017, this paper compares and analyzes the three elements (amplitude, spectrum, duration), the first motion direction of P-wave, dominant frequency, Sm/Pm, Sm/Tc, and Pm/Tc parameter characteristics. The key identification parameters are selected, and an accurate identification method of natural and mine earthquakes is proposed.

2. Selection and Processing of Seismic Data

2.1. Introduction to the Research Area and Selection of Seismic Data

Hegang is located in the north of the Yi-Shu fault zone with active seismic activity. The Hegang mining area has rich and large coal resources and good coalfield occurrence conditions. There are eight coal mines in this area, the Junde, Xing an, Fuli, Xinlu, Nanshan, Yixin, Xinling and Xingshan mines. It is a large coal mining area with an annual output of over 10 million tons. The distribution of the Hegang Seismic Station is shown in Figure 1. During the monitoring process, the station can monitor natural and mine earthquakes at the same time, but the vibration waveforms and characteristics of the two are similar, and they are easily confused, which brings great inconvenience to earthquake monitoring and coal mine safety monitoring. Therefore, this paper takes the Hegang area as the research area and selects 490 records of natural and mine earthquakes at Hegang Station from 2006 to 2017, with 210 earthquakes and 280 mine earthquakes having magnitudes ranging from 1 to 3. The instrument models and parameters of the Hegang Seismic Station are shown in Table 2.

2.2. Seismic Data Processing

The seismic data collected in this paper were all three-directional data with a sampling time interval of 0.01 s. The record with the larger amplitude in the horizontal direction (NS and EW components) is extracted as the target record. The seismic data processing method applied in this work is as follows.
(1)
Baseline correction
During the playback of a digital seismic waveform, the seismic record of a digital seismograph often presents a zero-line drift, which is also called a direct current component. In this study, the drift is eliminated by subtracting its average value from the final data.
(2)
Fourier transform
Fourier transform is used to transform “time domain” signals into “frequency domain” signals and establish corresponding relations between them. The expression is:
F ( ω ) = f ( t ) e t ω t d t
Its inverse transformation is:
f ( t ) = 1 2 π F ( ω ) e t ω t d ω
where ω is angular frequency.
(3)
Instrument response correction
Digital seismic data were recorded in a dimensionless form (counts). However, in the application of digital seismic data, physical quantities with dimensions, including displacement, velocity, and acceleration, were required, and “counts” and physical quantities were linked using the transfer function of the instrument to obtain the required actual physical quantities. Real ground motions could be obtained through the deduction of instrument response according to seismic records. The transfer function of the seismometer employed in this study is CTS-1:
T ( ω ) = K m S 2 ( S 2 + K 11 S + K 12 ) ( S 2 + K 21 S + K 22 ) ( S 2 + K 31 S + K 32 ) ( S 2 + K 41 S + K 42 ) × 1 S 2 + K 51 S + K 52
where K = 2 × 1000 V·m−1 s−1 (double-ended differential output). The exact values of the parameters were tested in the factory and given in the user’s manual as m = 2.4206 × 10²⁰, K11 = 4πξ/T0 = 0.074.49*, K12 = 4πξ/T02 = 0.0027416*, K21 = 533.15, K22 = 142.123, K31 = 667.62, K41 = 488.71, K51 = 178.88, and K32 = K42 = K52 = 119 423.

3. Comparative Analysis of Basic Ground Motion Parameters between Mine Earthquake and Earthquake

After processing the original seismic data, the acceleration, velocity, and displacement time histories of the selected records were obtained. Peak Ground Acceleration(PGA), Peak Ground Velocity(PGV), and Peak Ground Displacement(PGD) were adopted as amplitude parameters, and the acceleration response spectrum was selected as the spectrum parameter. Bracket duration is adopted as the duration parameter. Due to the large number of event samples selected in this paper, the 6 groups summarized in Table 3 are considered for comparative analyses of amplitude, spectrum, and duration of typical natural and mine earthquakes in the Hegang area with similar magnitudes and focal points. The magnitude selected in this paper is the local earthquake magnitude ML. According to the logarithm of the maximum displacement amplitude of the S waveform recorded by the Hegang seismograph, the calculation formula is:
M L = log A μ + R 6 ( Δ )
In the formula, Aμ is the maximum displacement amplitude of S wave; the epicentral distance Δ is less than 15 km and R6 (Δ) is 2.46

3.1. Comparison and Analysis of Amplitude Parameters

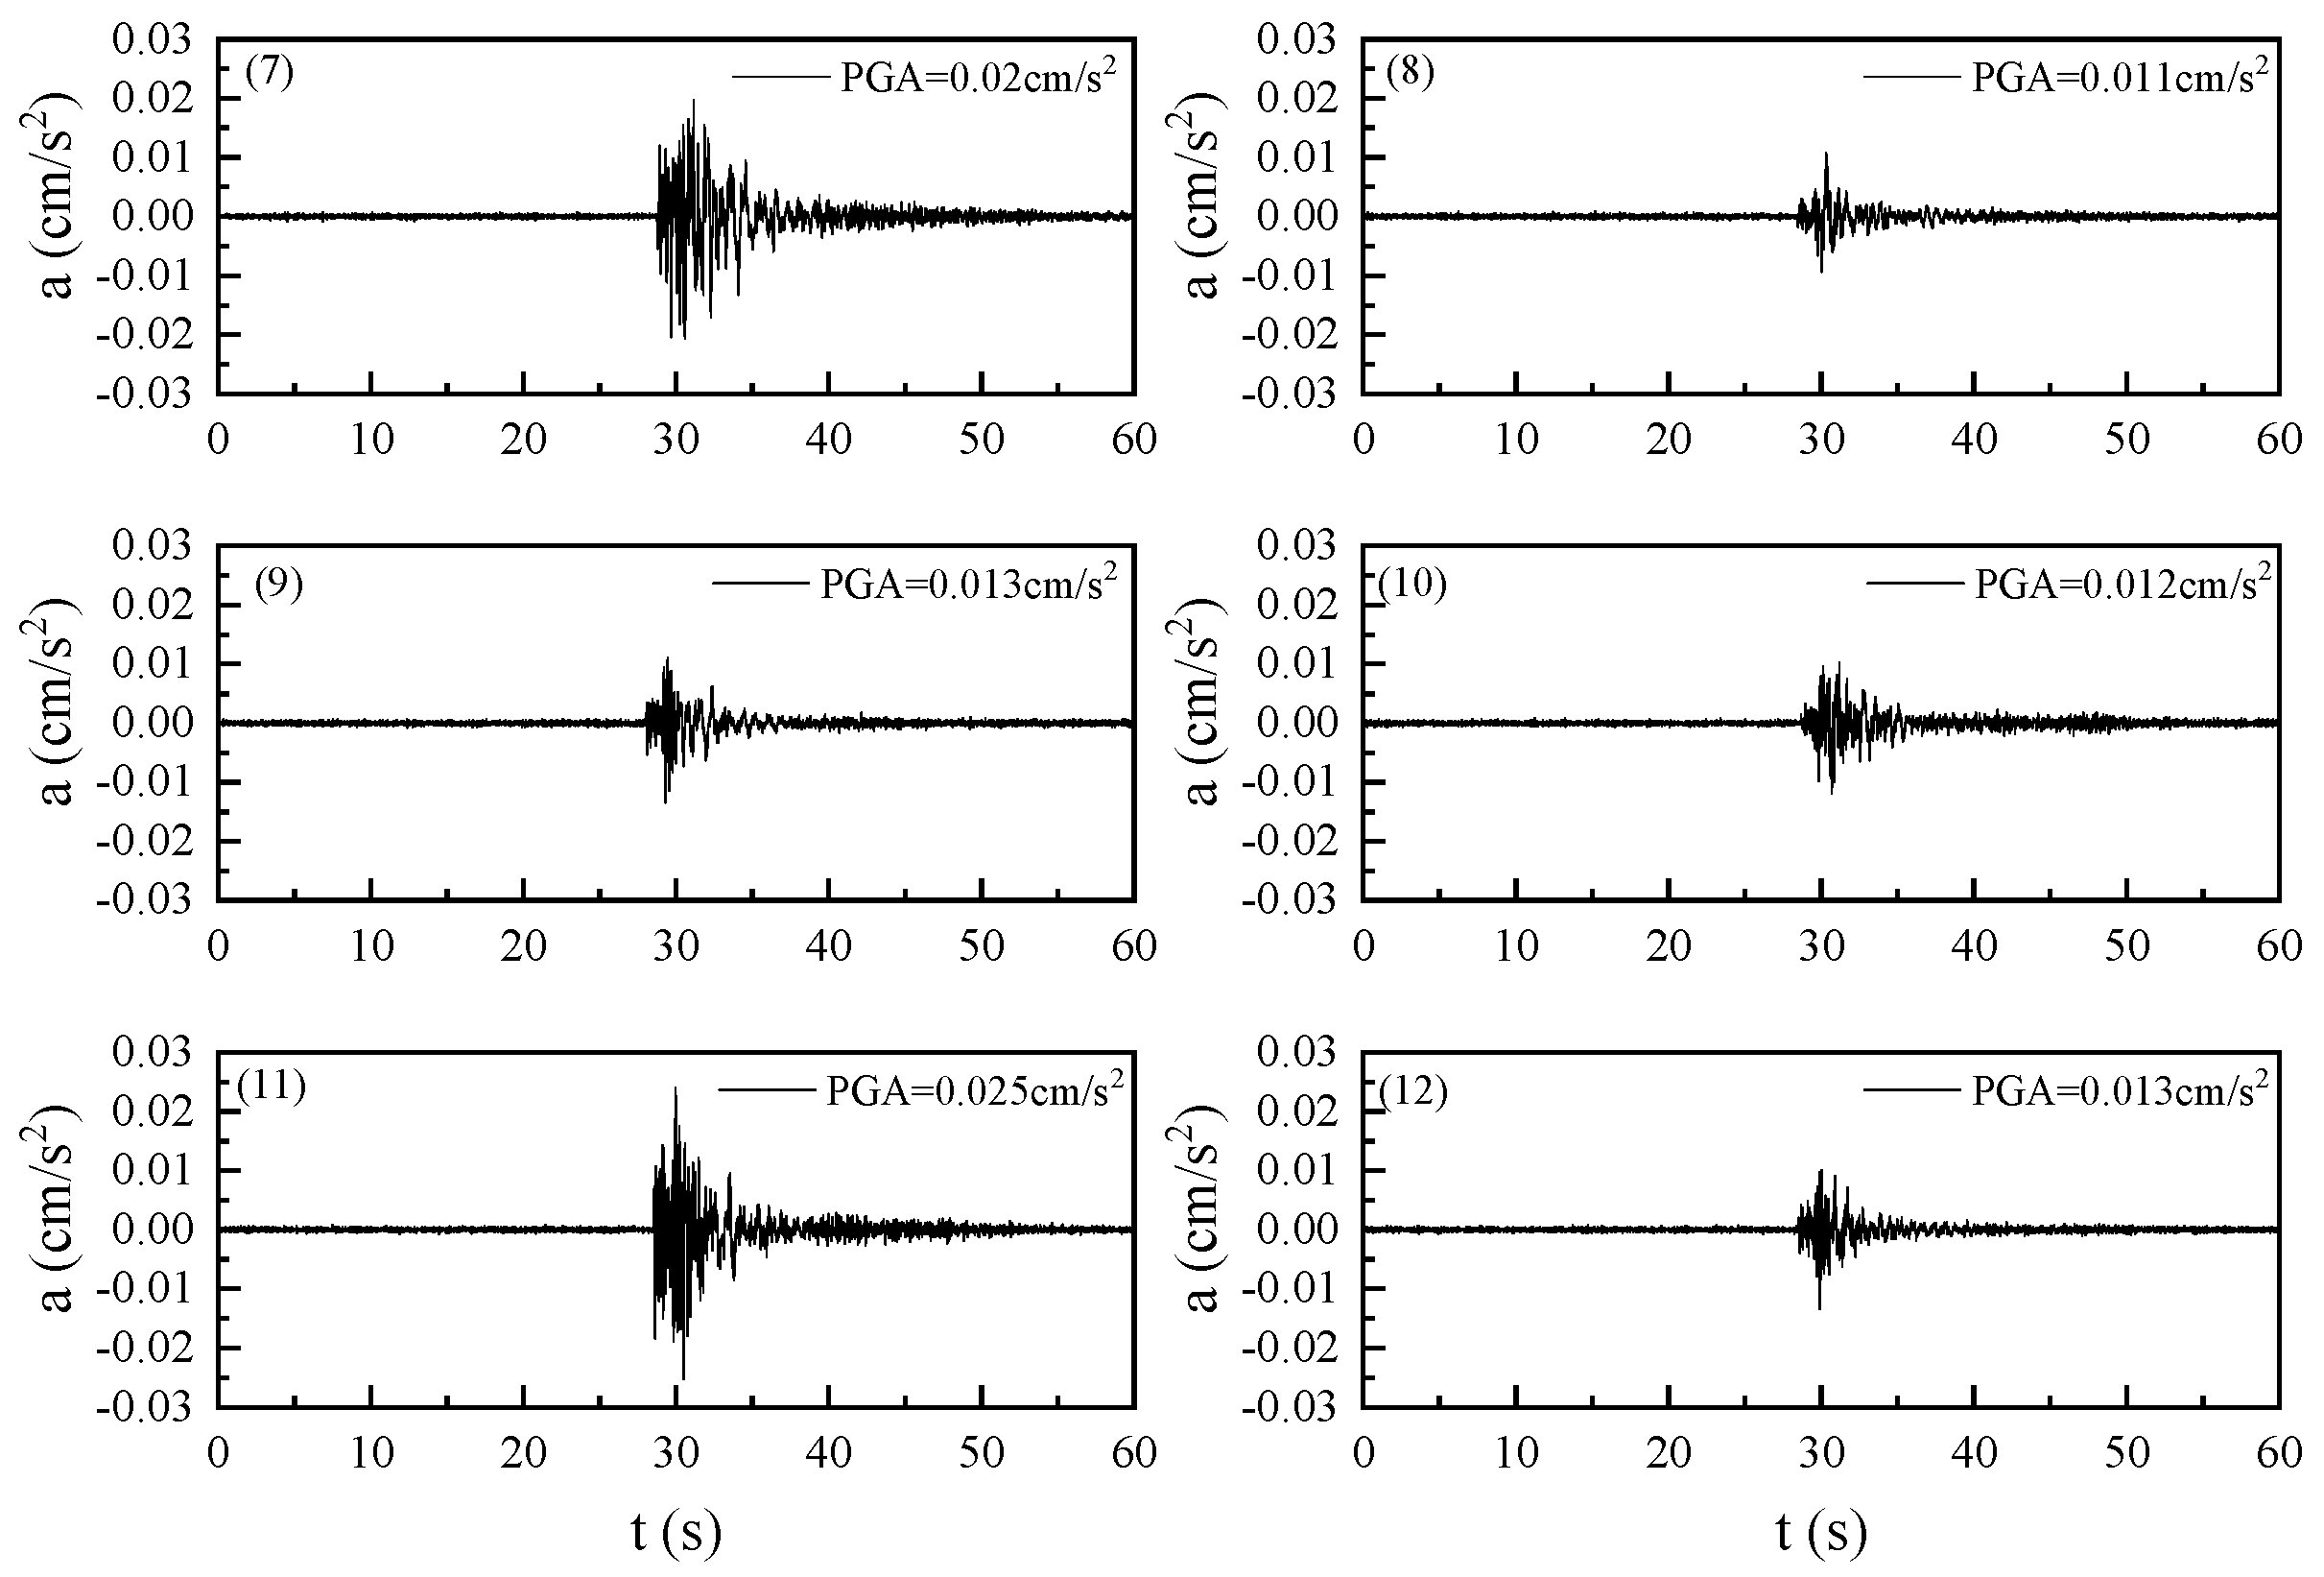
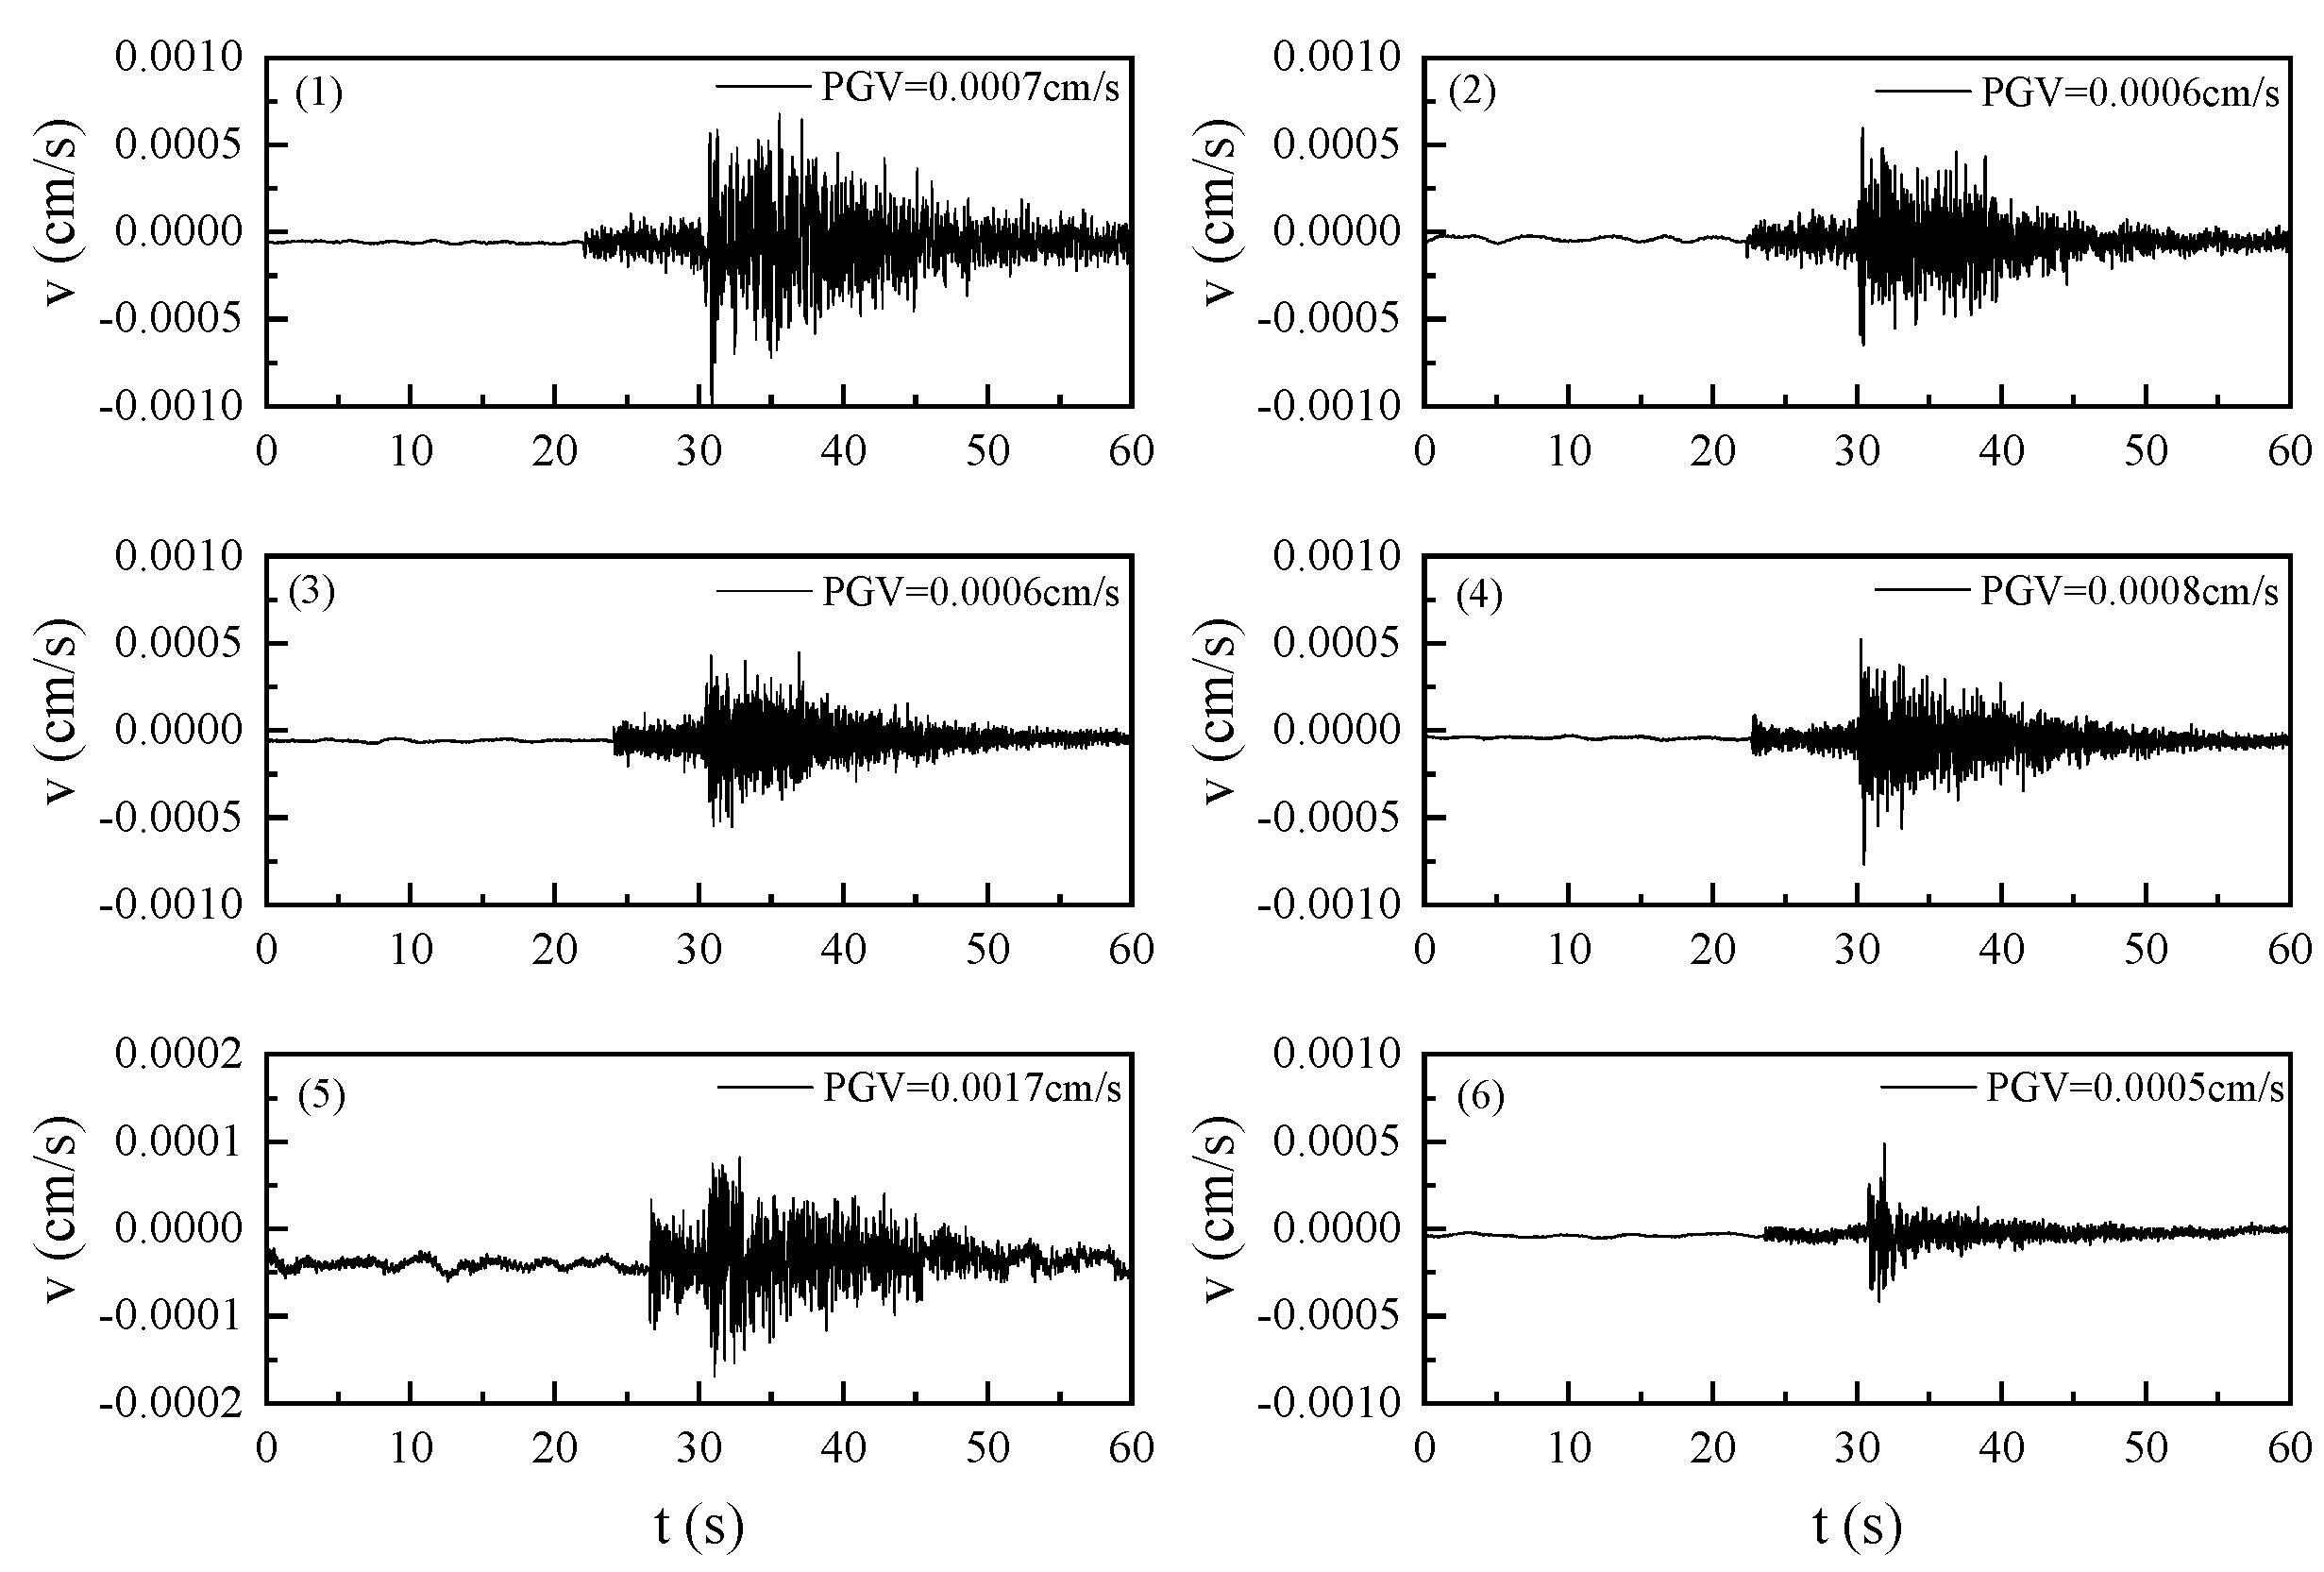
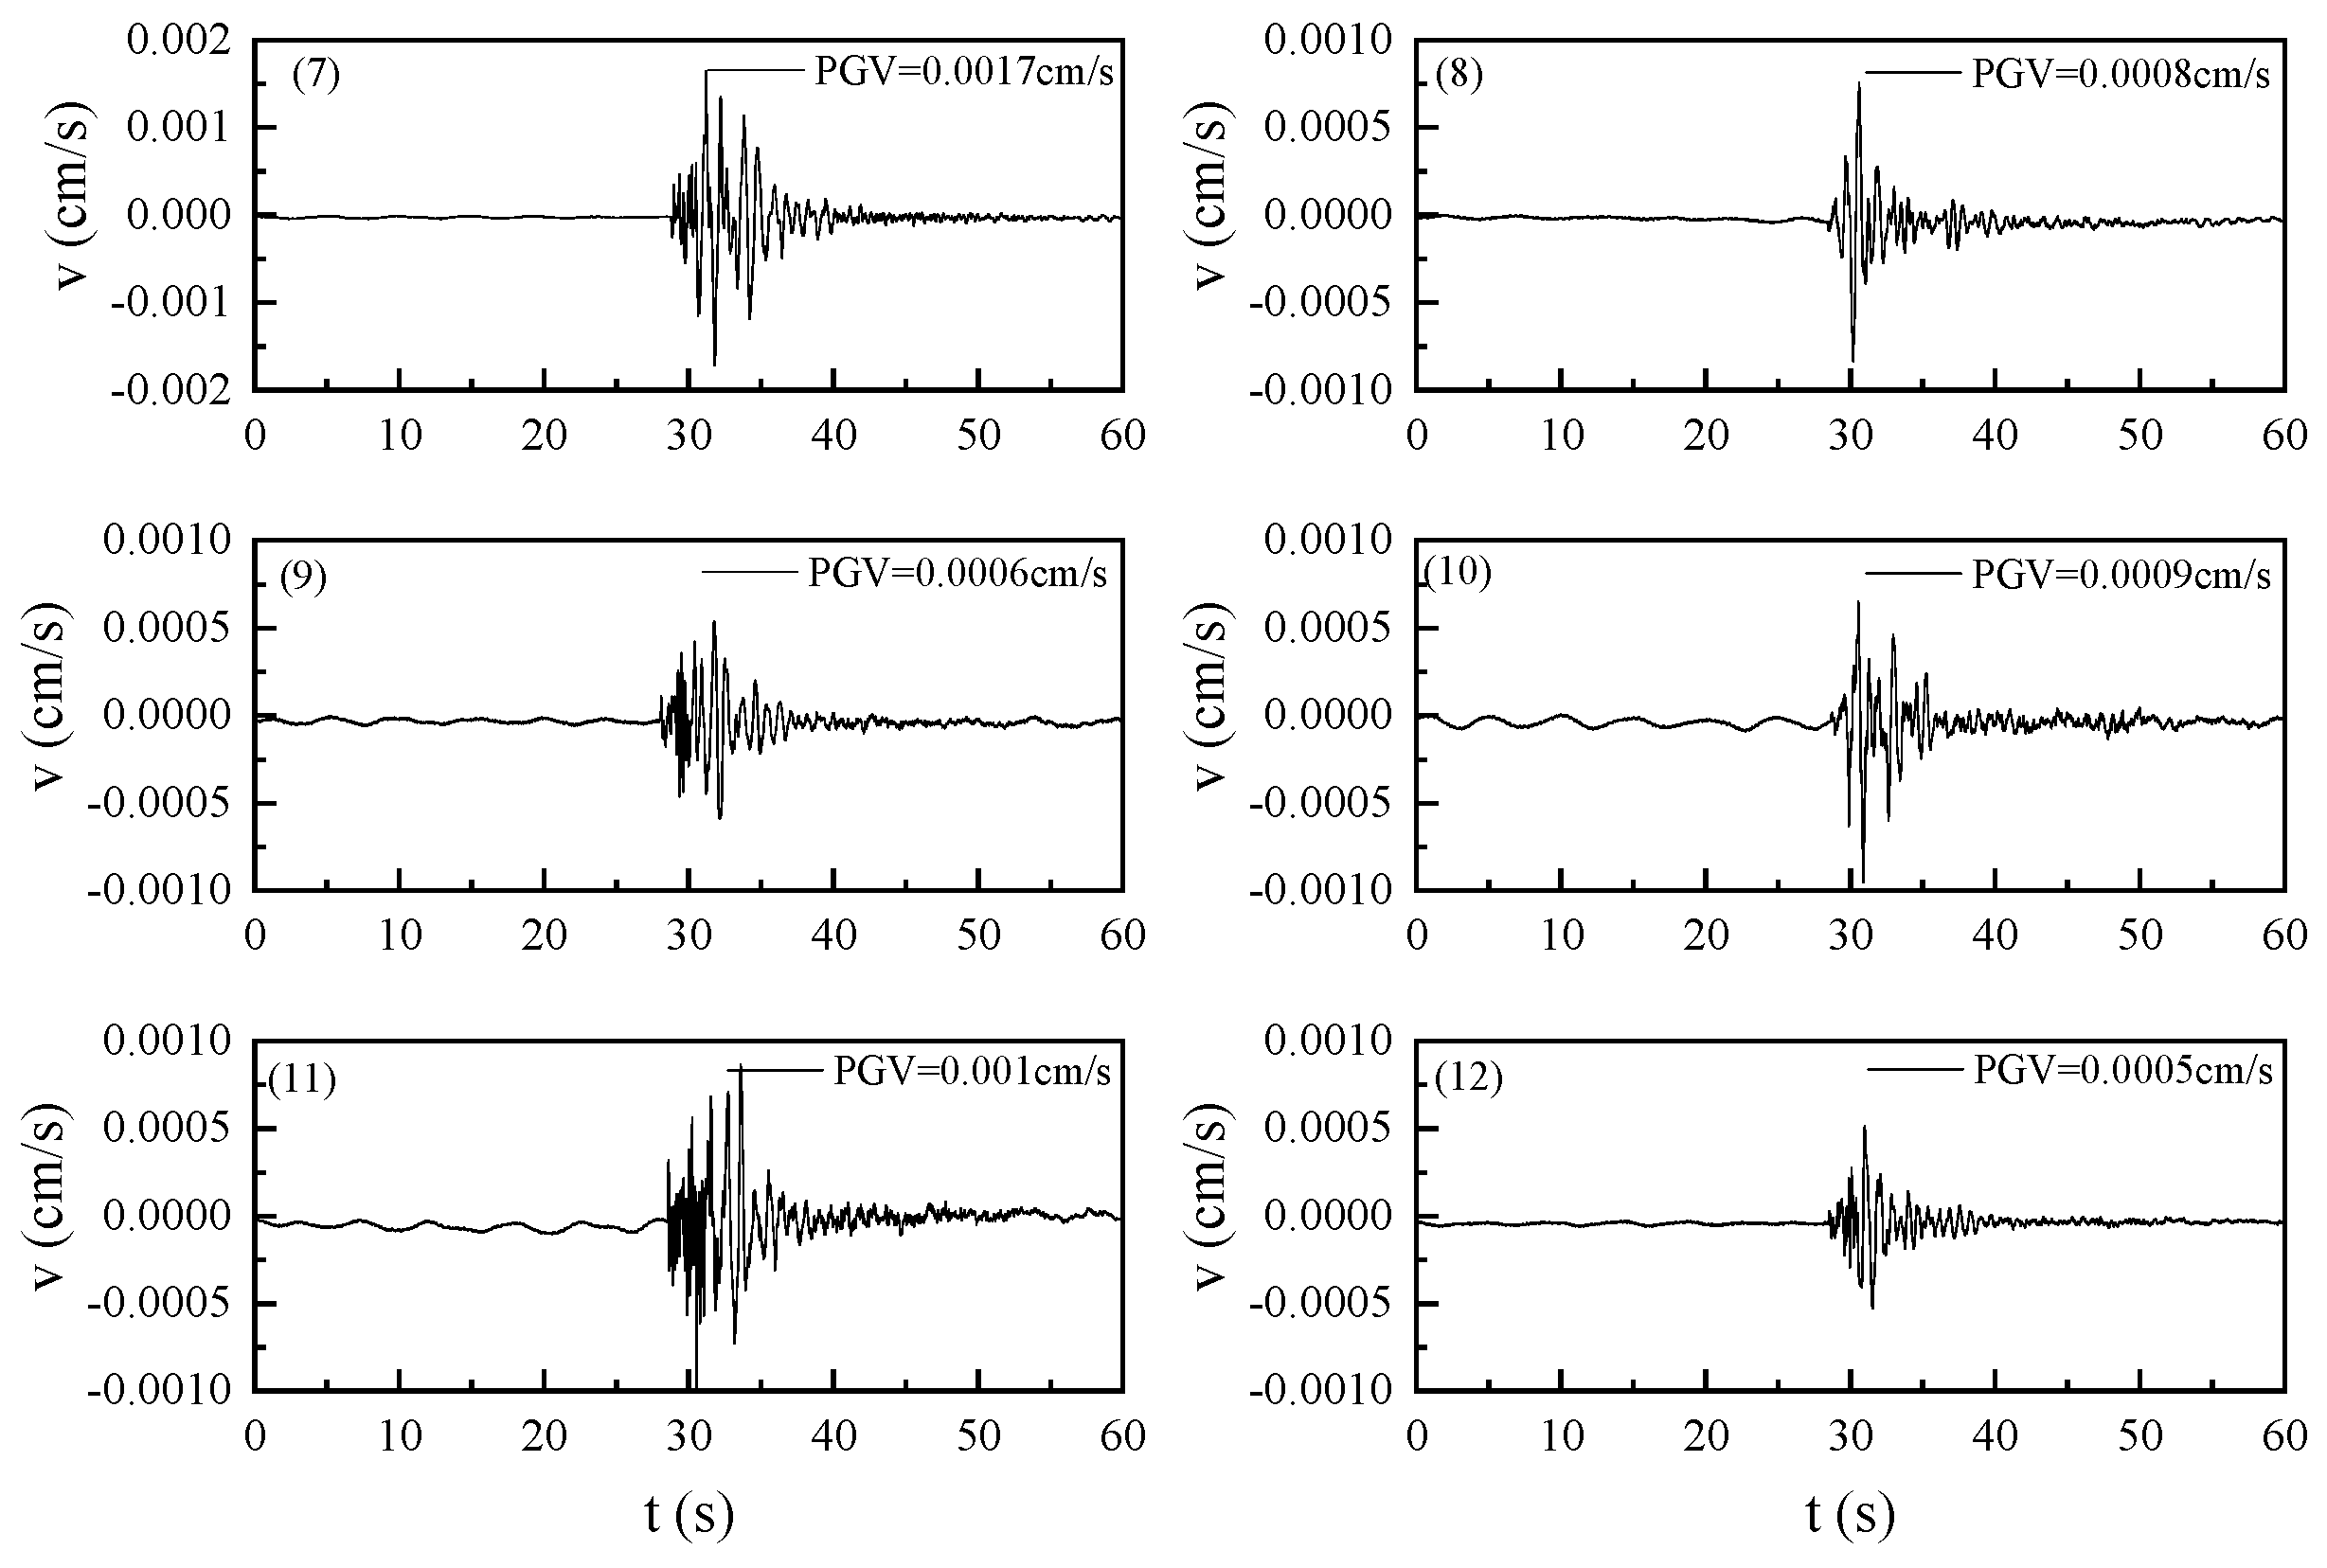
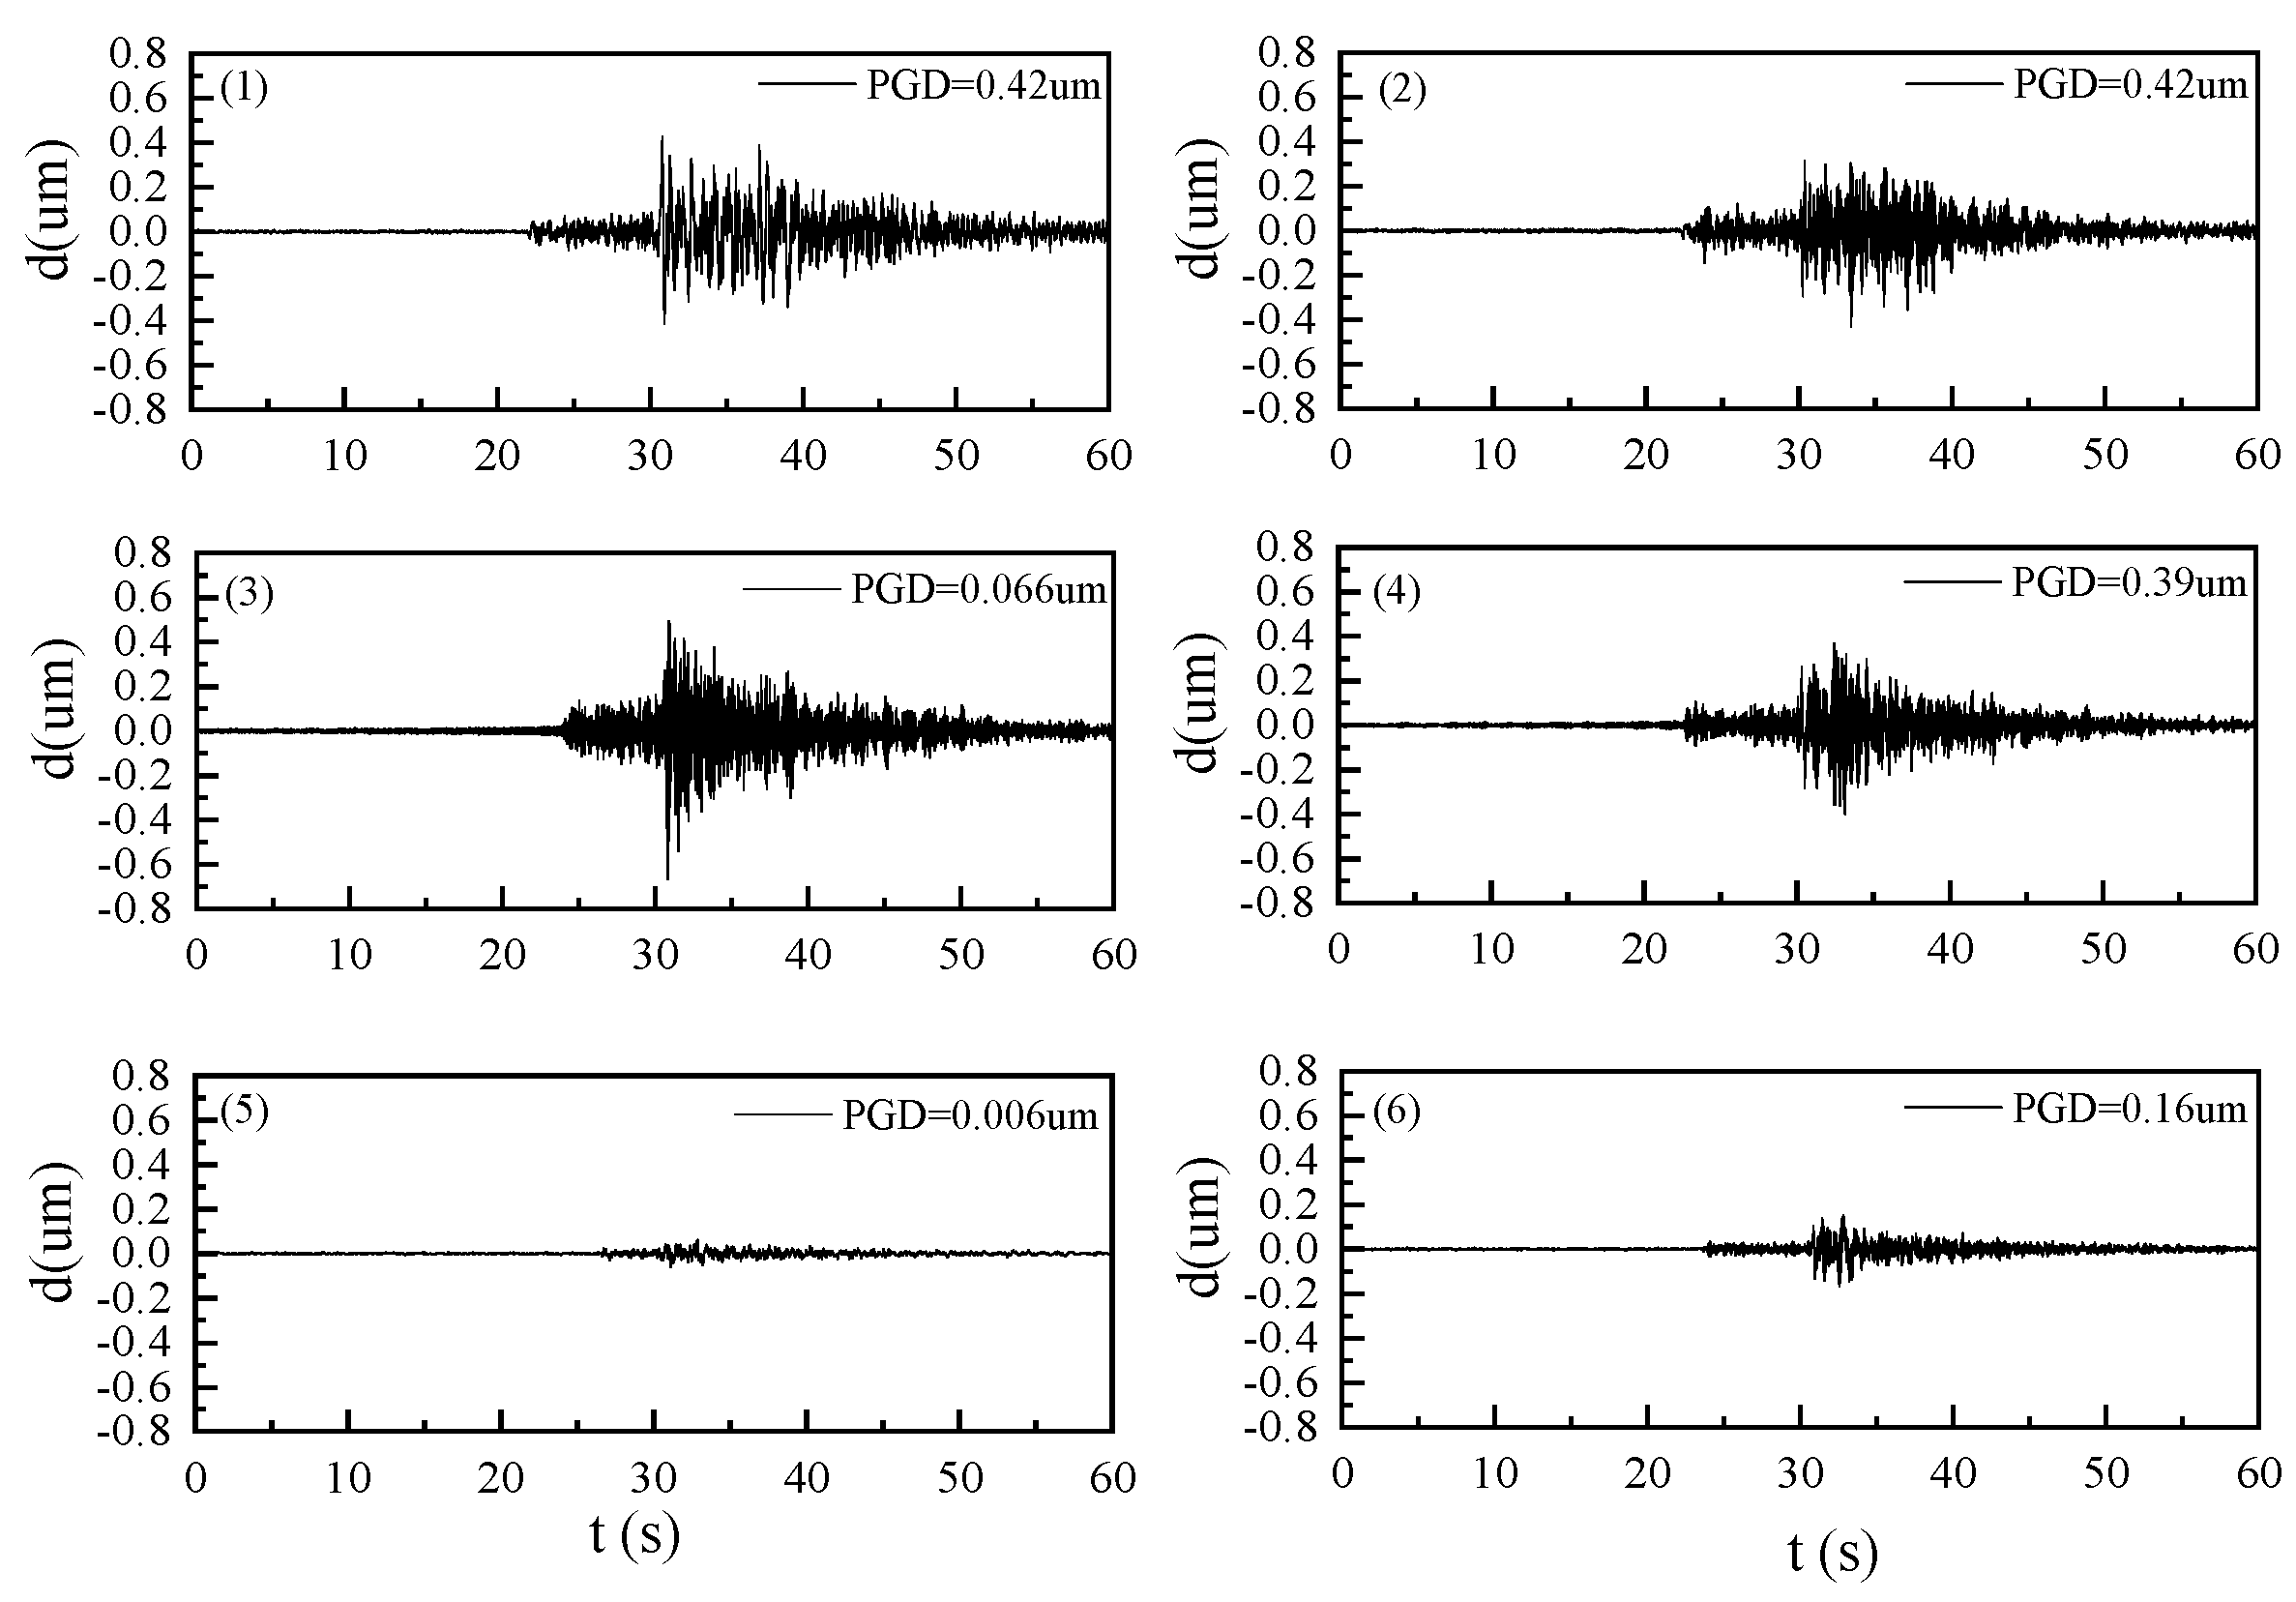
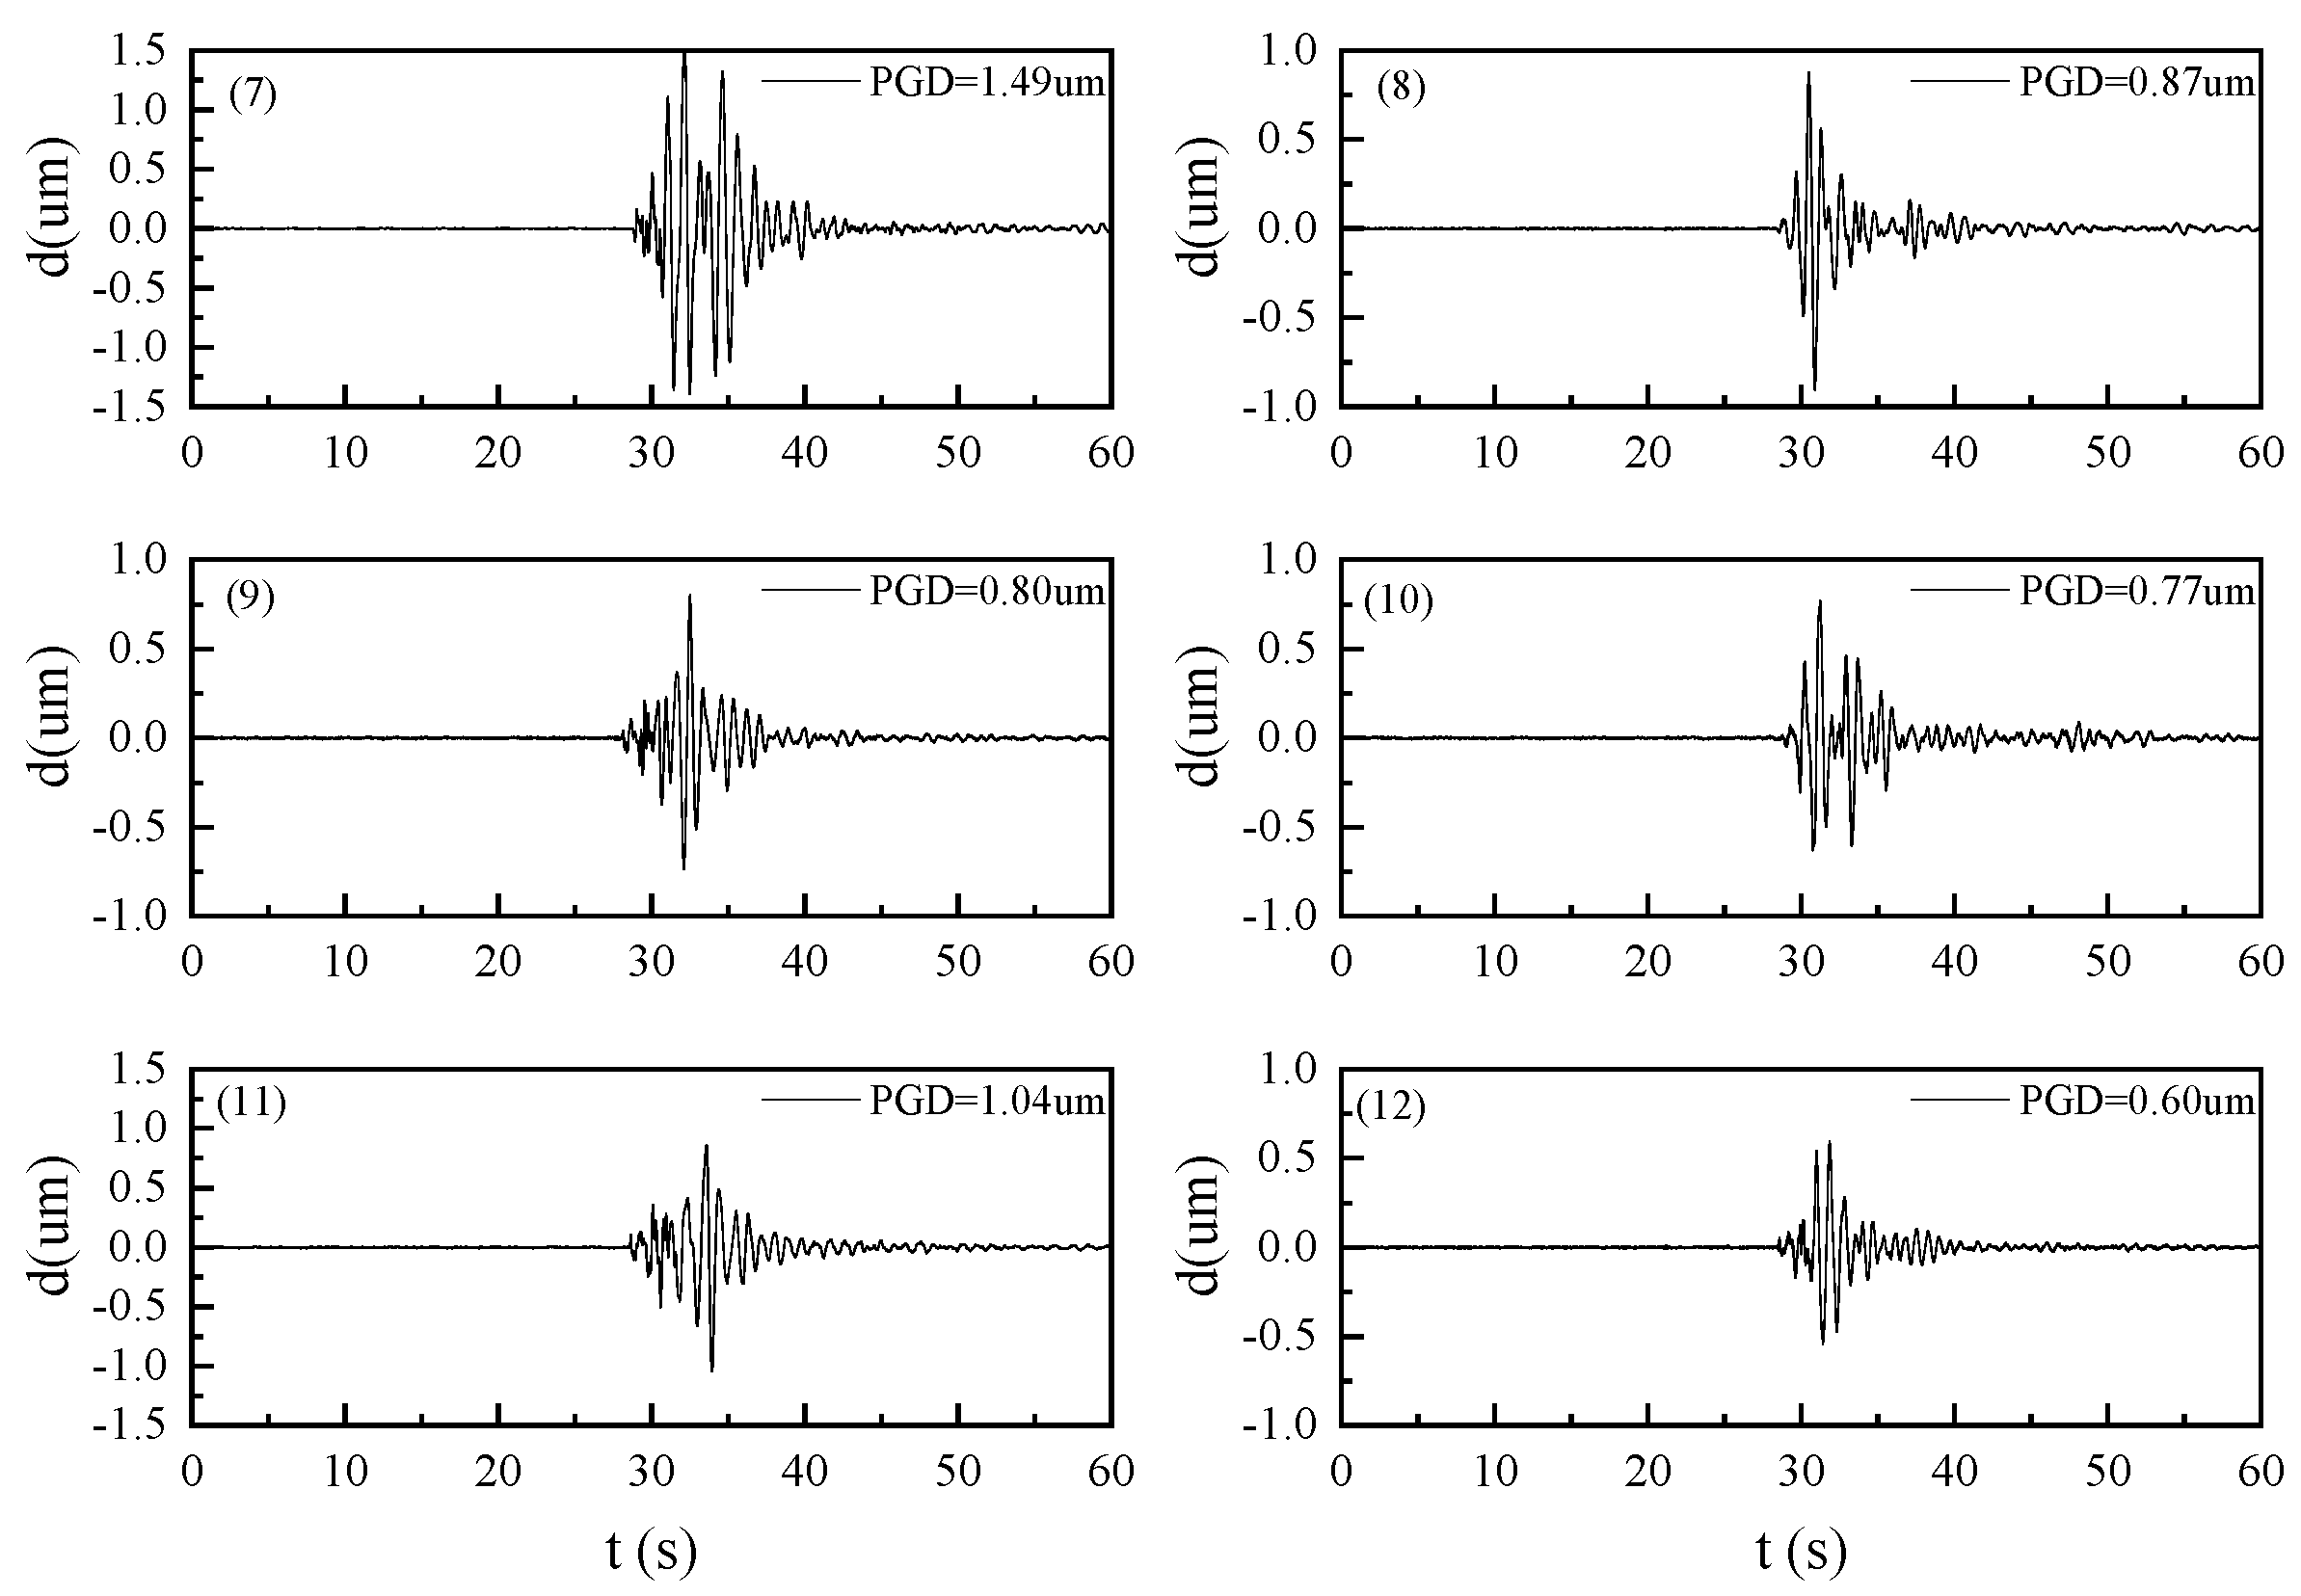
This section only analyzes the amplitude parameters of the natural and mine earthquakes recorded in Table 3. The event serial number in the table corresponds to the serial number in the figures. Figure 2 and Figure 3 are the acceleration time history curves of natural and mine earthquakes, respectively. It is evident from the figure that the peak acceleration PGA of natural and mine earthquakes is of the same order of magnitude, but the PGA of the earthquake is larger than that of the mine earthquake when the magnitude is comparable. The amplitude of the earthquake has a slower decay rate and a longer duration. Figure 4 and Figure 5 are the velocity time history curves of natural and mine earthquakes, respectively. The figure shows that the PGV of natural and mine earthquakes are almost the same, without a considerable difference. Figure 6 and Figure 7 are the displacement time history curves of natural and mine earthquakes, respectively. It can be seen from the figure that when the magnitude is equivalent, the peak displacement (PGD) of earthquake is significantly smaller than mine earthquake, which is consistent with the fact that small-magnitude mine earthquakes are more detrimental to the surface than natural earthquakes.
PGA, PGV, PGD, and PGV/PGA of different records are shown in Table 4. The PGV/PGA ratio is an important parameter of structural seismic response. When PGV/PGA > 0.2 s, the velocity pulse is relatively significant, and when PGV/PGA < 0.2 s, there is no obvious pulse phenomenon [26]. It can be seen in Table 3 that the PGV/PGA recorded by the listed natural and mine earthquakes are less than 0.2 s, so there is no significant pulse effect. However, the PGV/PGA ratio of mine earthquakes is generally greater than earthquakes, which may be caused by the combined action of magnitude, hypocentral distance, geological faults, site conditions, and so on.

3.2. Response Spectrum

Response spectrum is a method to describe the spectrum characteristics of ground motion. It not only reflects the important characteristics of the spectrum of ground motion but also the maximum response (acceleration, velocity, and displacement) of structures with different fundamental vibration periods to seismic action. It reasonably and simply reflects the relationship between seismic action and structural response. Therefore, it is widely used in structural seismic design [27,28].
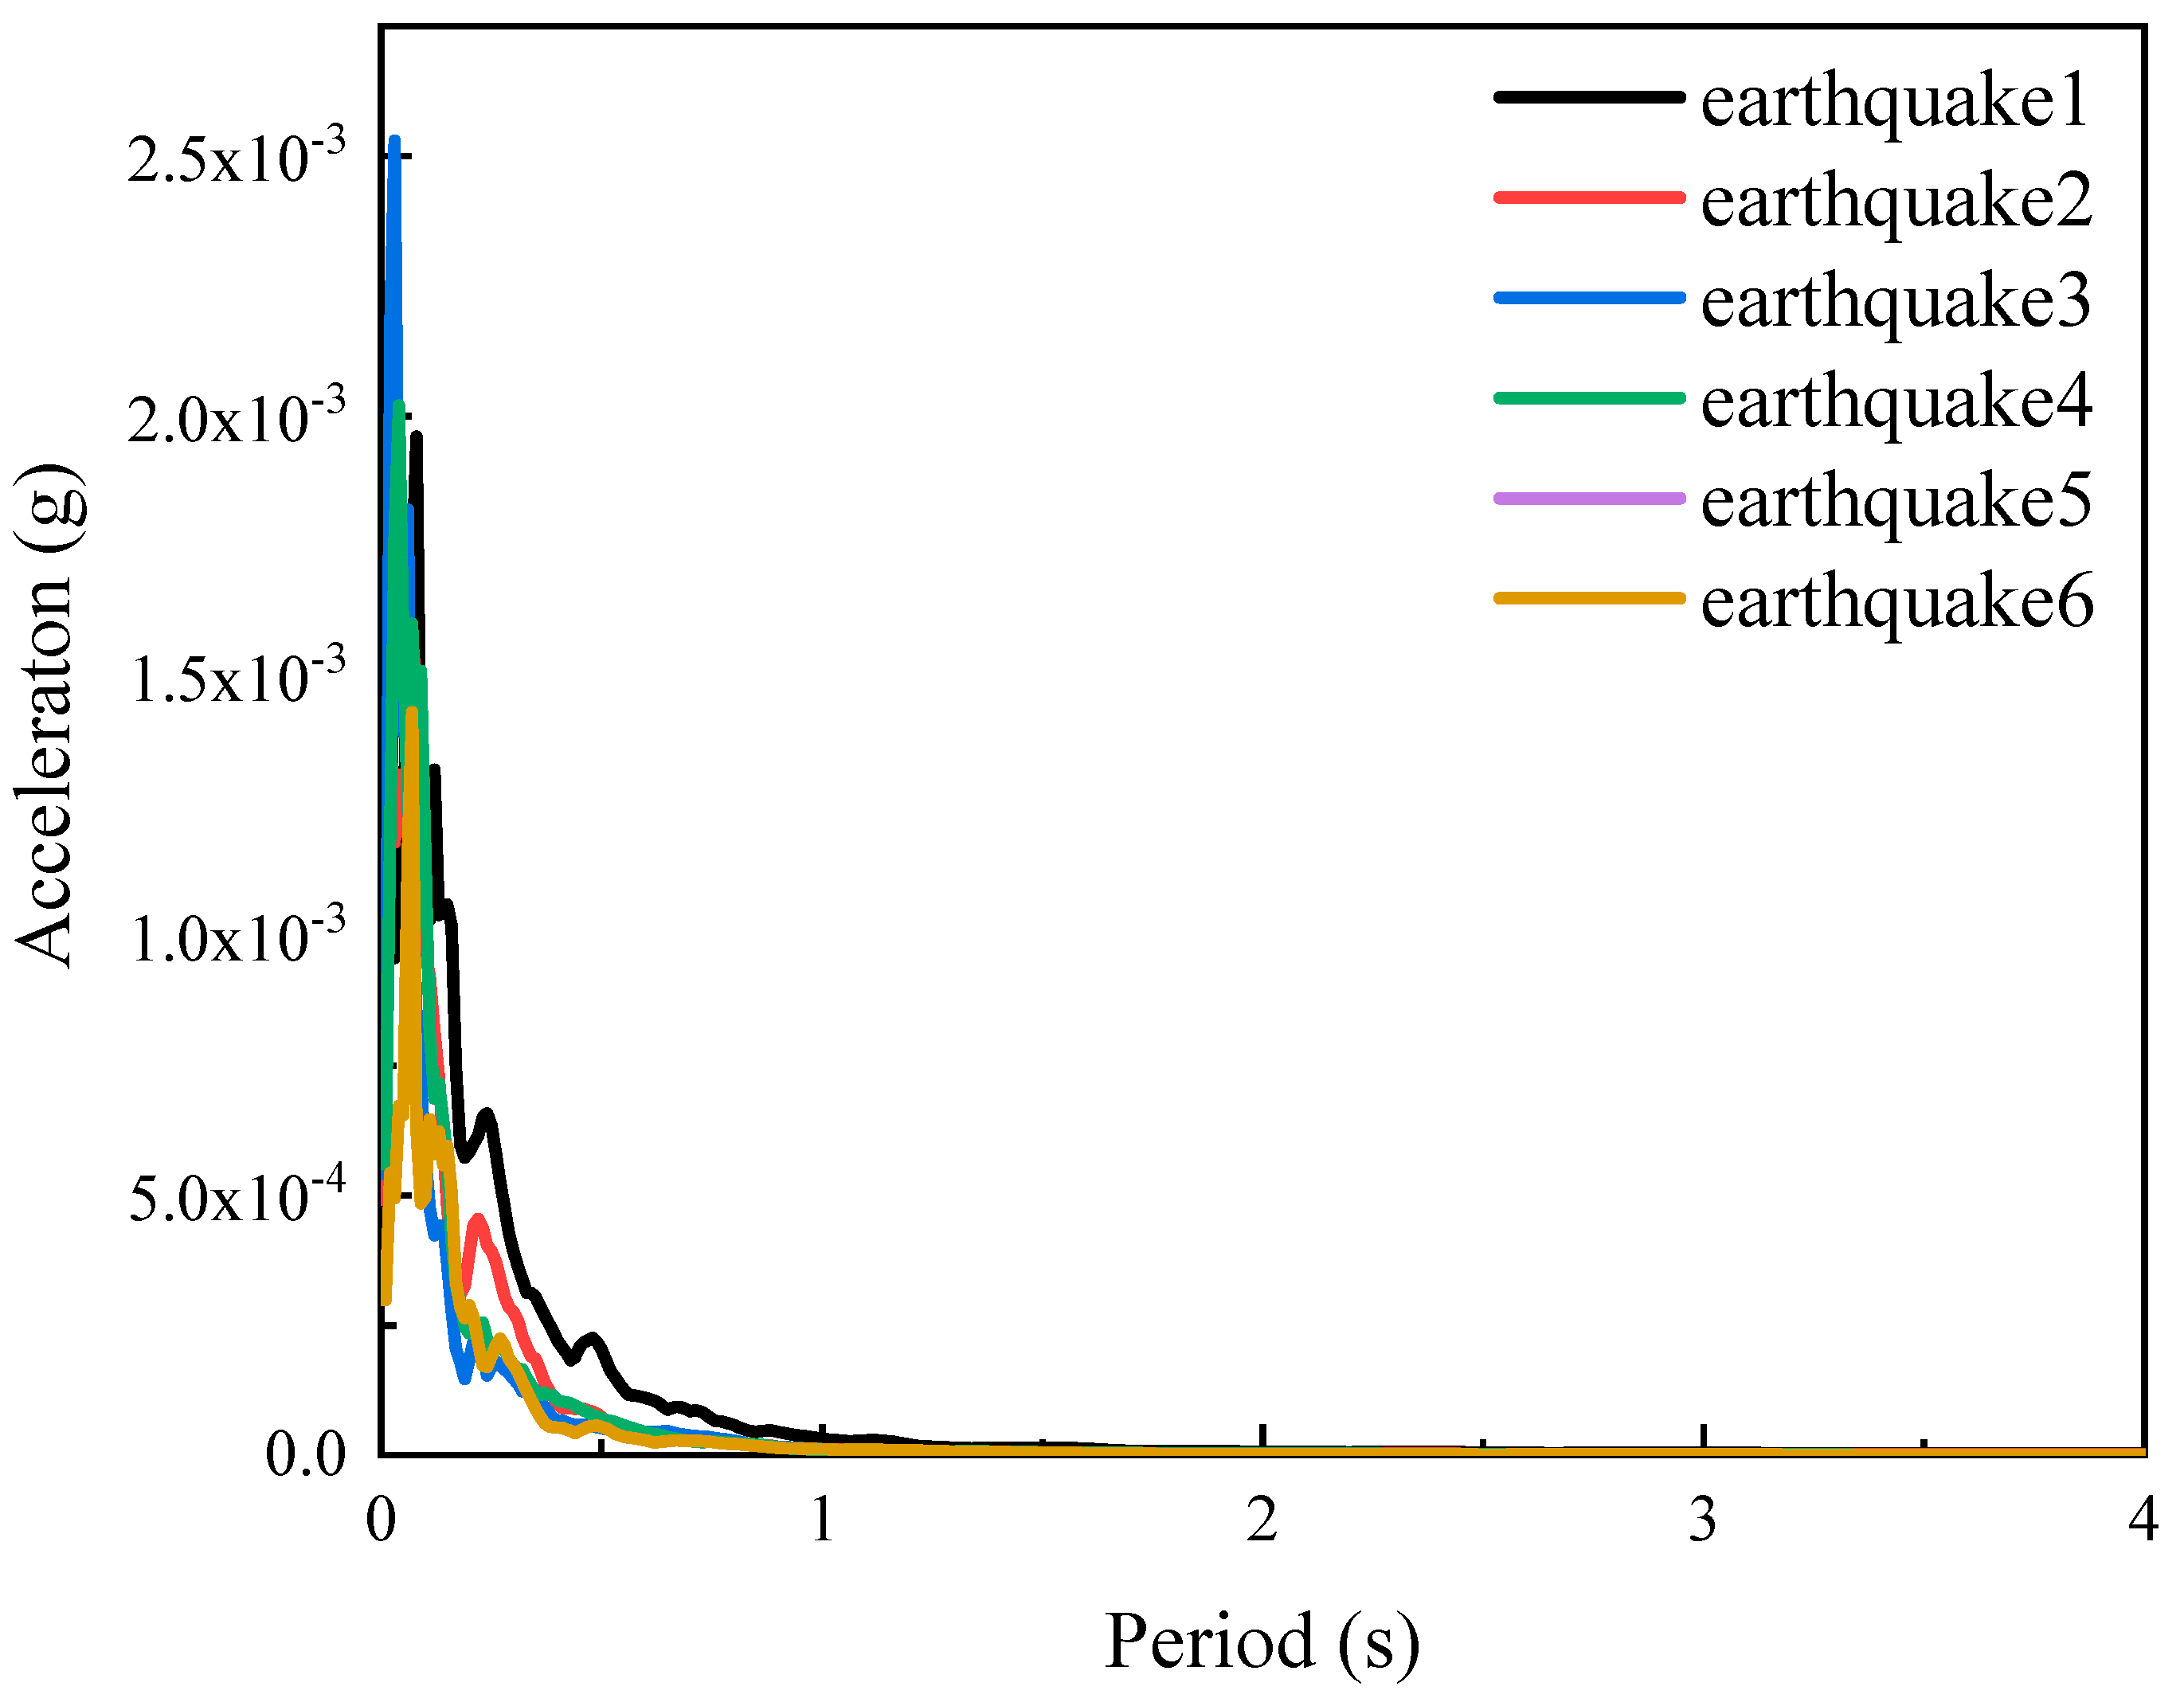
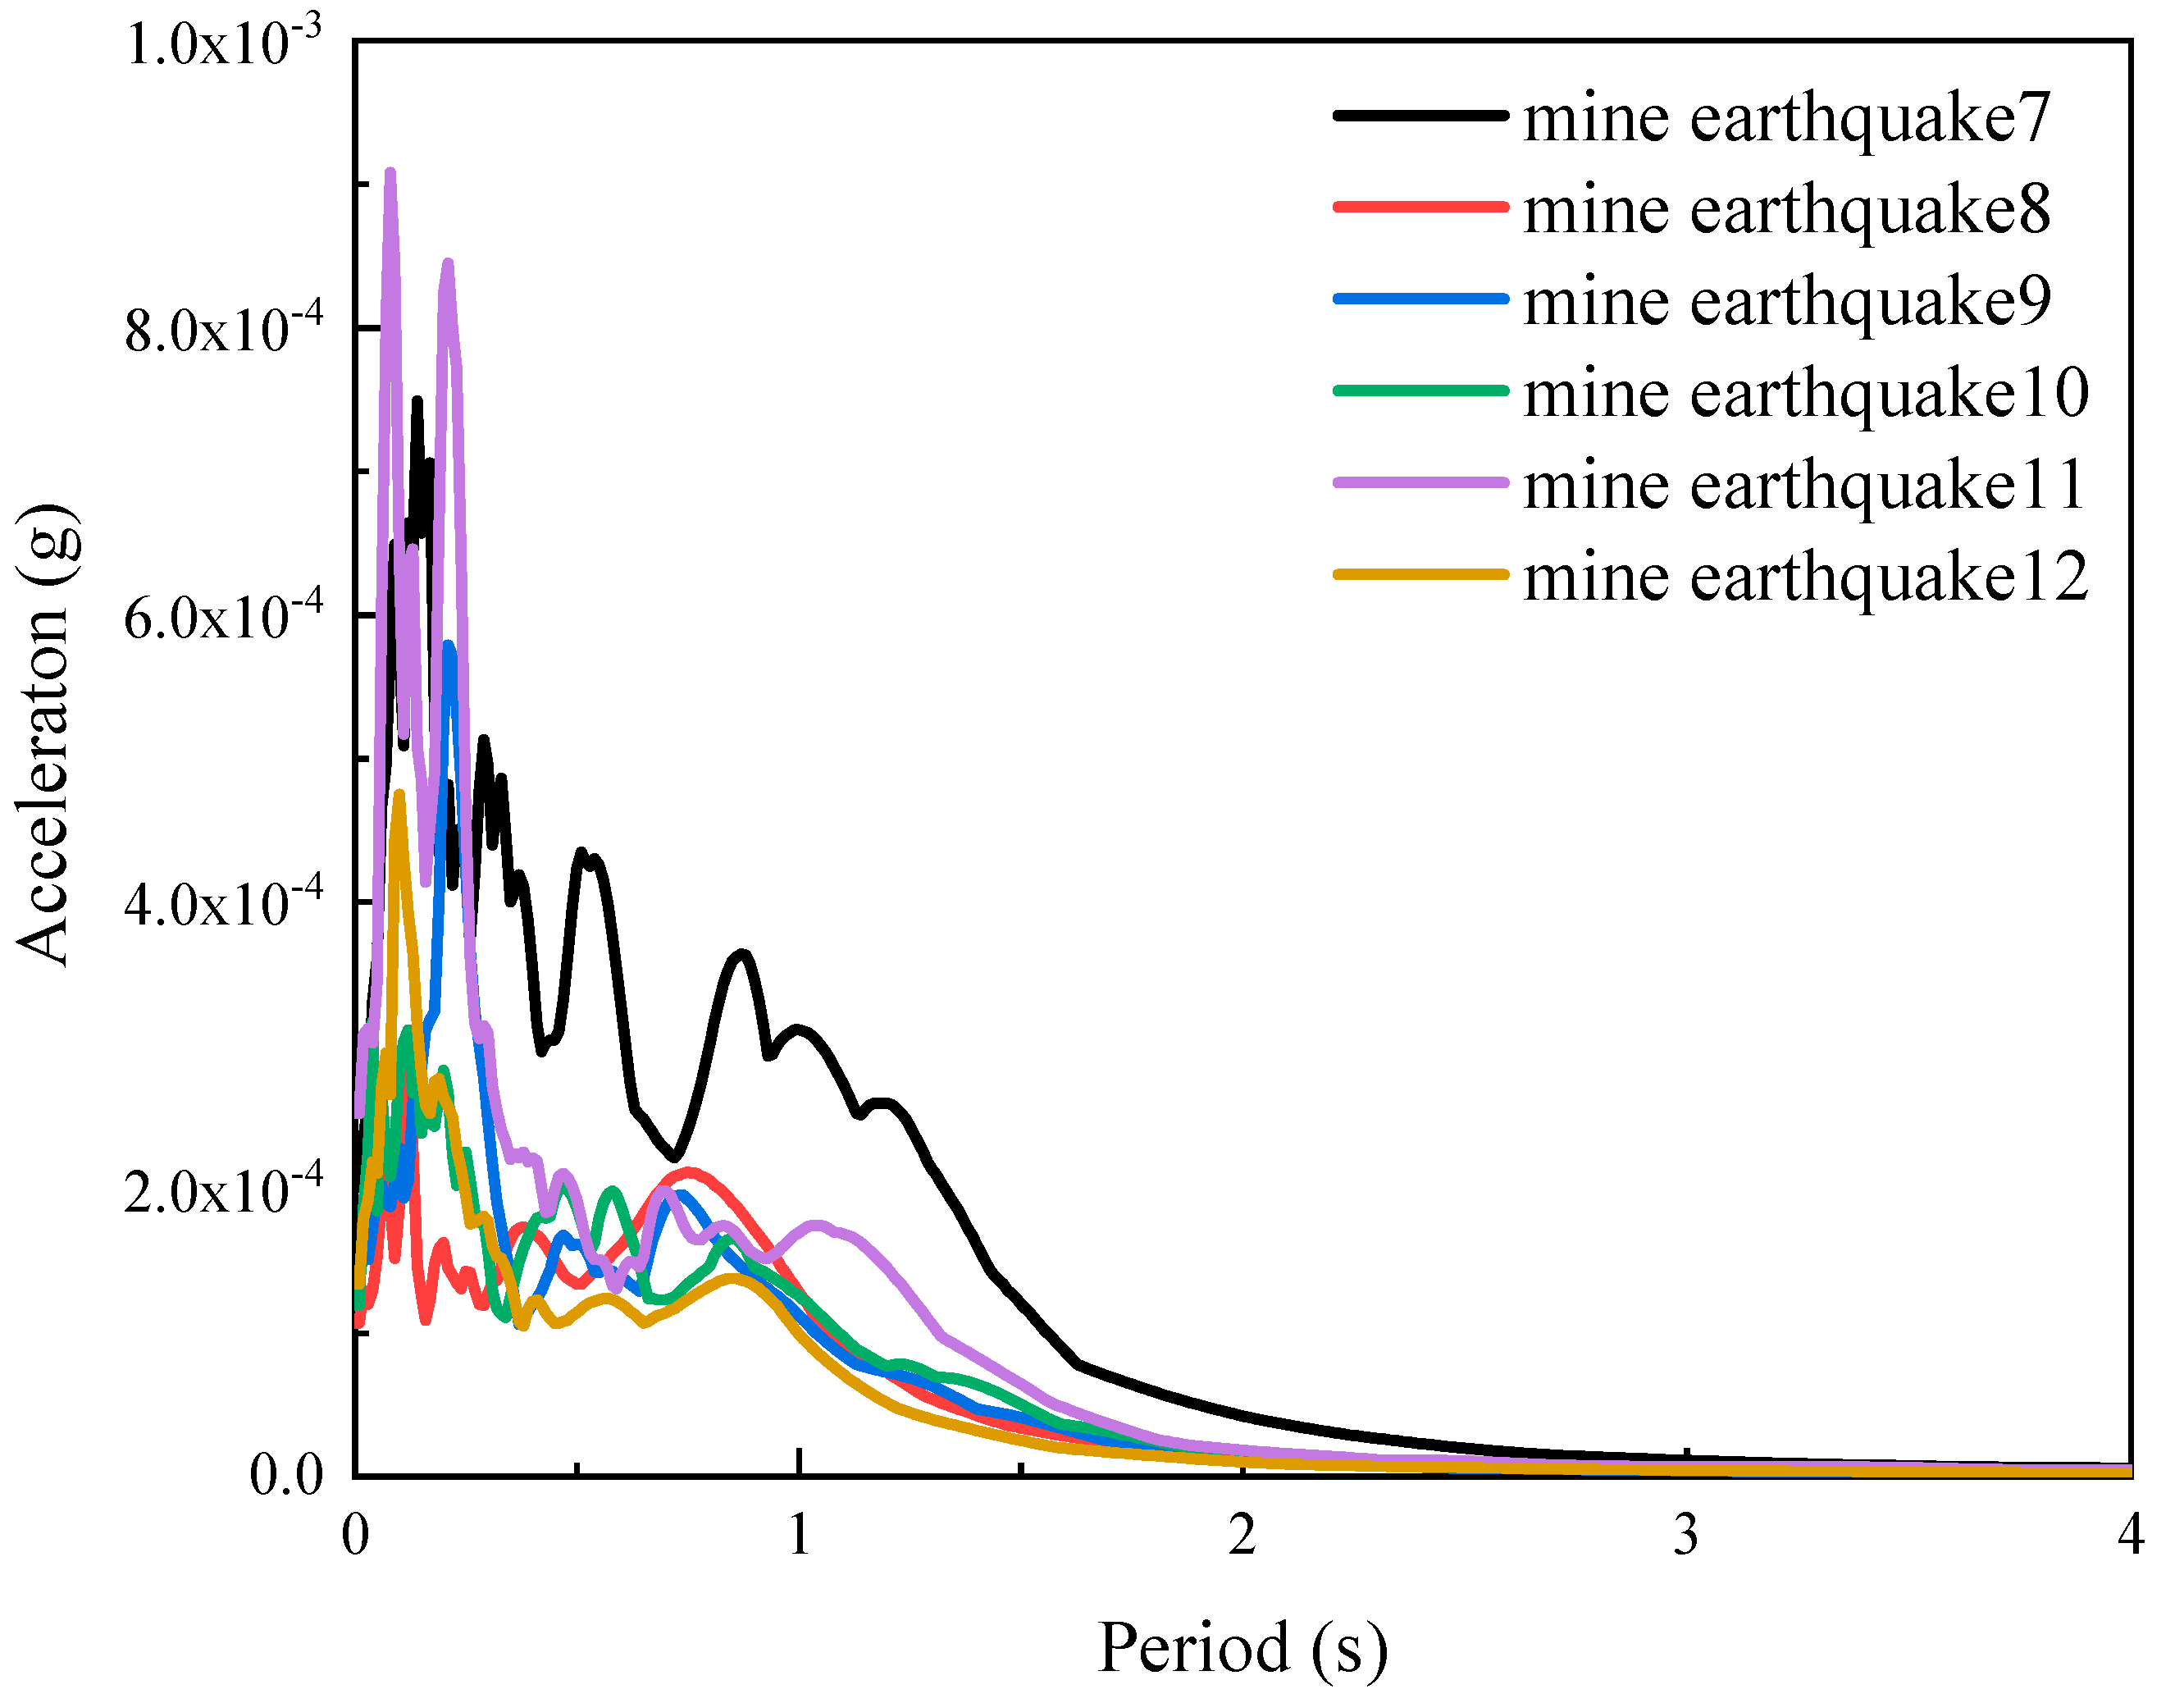
Figure 8 and Figure 9 shows the acceleration response spectra of the natural and mine earthquakes listed in Table 2 at a damping ratio of 5%, respectively. The figure shows that the acceleration response spectrum curve of the earthquake is “thin and high” as a whole, and the acceleration response spectrum curve of the mine earthquake is “fat and low” as a whole. The predominant period of the earthquake is concentrated within 0.1 s, while the mine earthquake is greater than 0.1 s. The peak value of mine earthquake is higher than that of earthquake, and it has the characteristics of high frequency and large amplitude. The acceleration response spectrum can provide a reference for the distinction between the two.
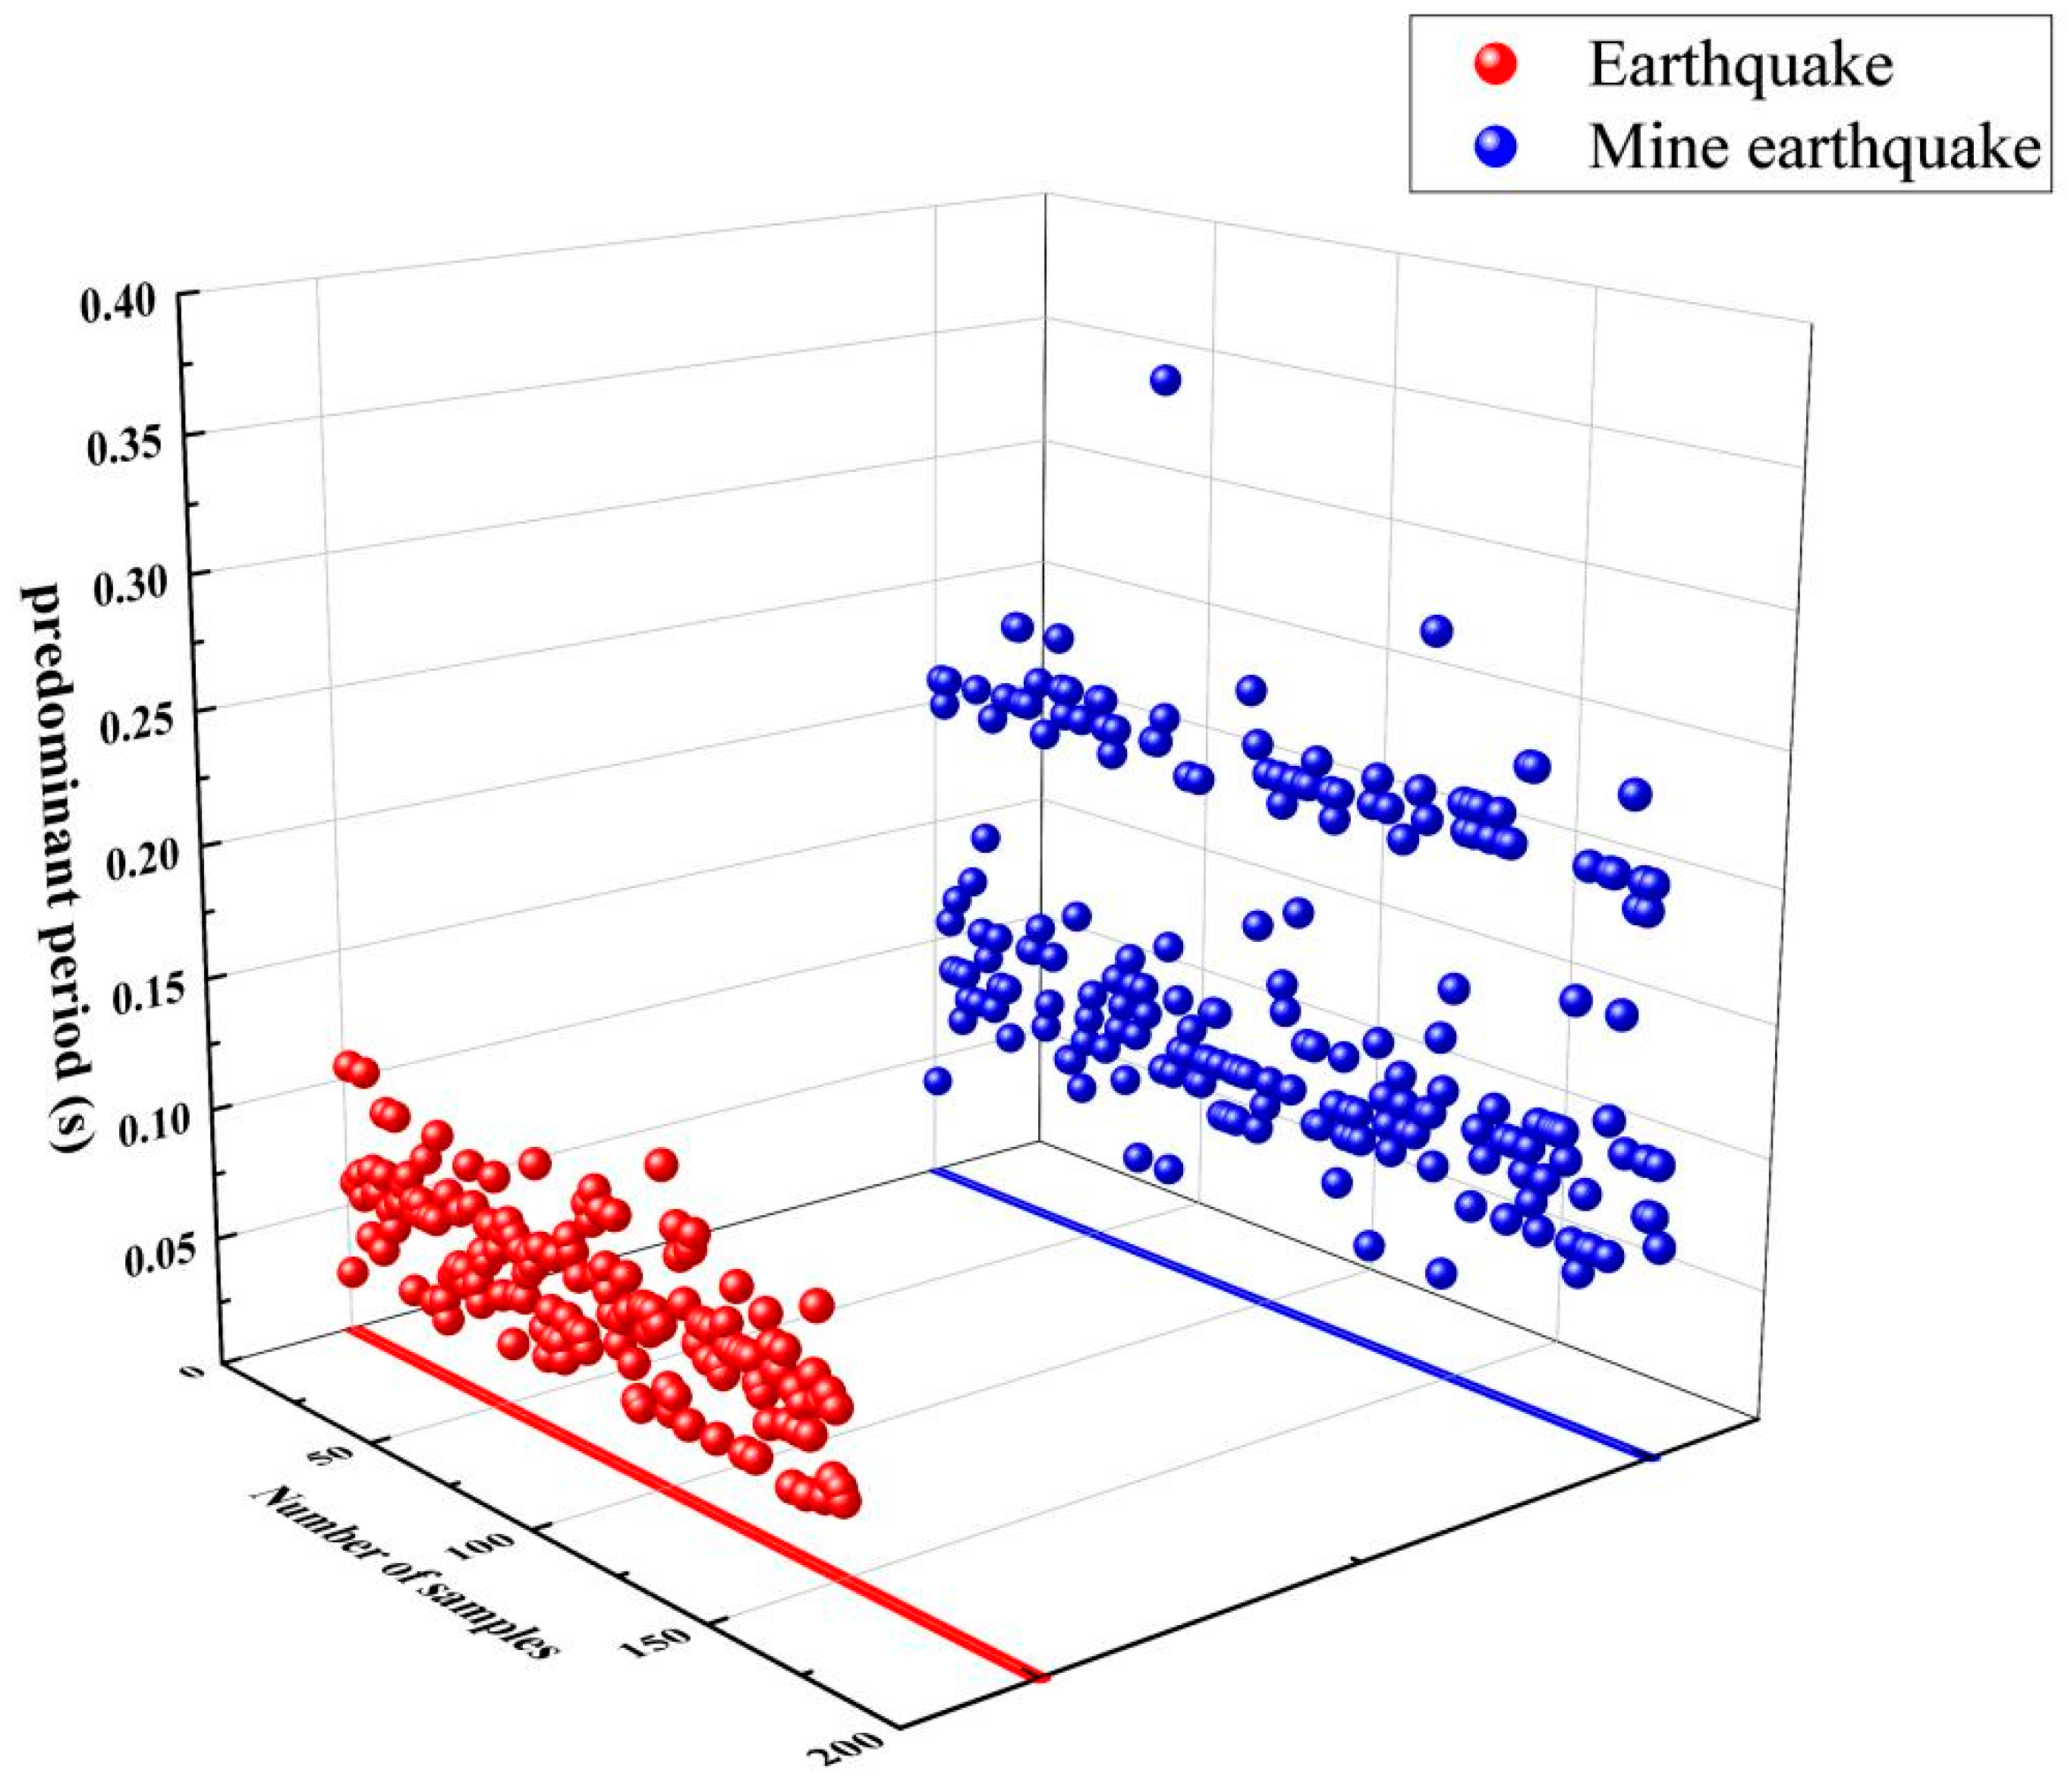
Figure 10 is a statistical graph of the predominant period of 150 earthquake records and 200 mine earthquake records in the study sample. The graph shows that the predominant period of earthquake records is less than 0.1 s except for a few points, and the average value of the predominant period is 0.064 s, while the predominant period of mine earthquake records is generally greater than that of earthquakes, and the average value of the predominant period is 0.13 s, see Table 5 for the specific statistical results.

3.3. Duration Comparison and Analysis

Duration, as one of the three elements of ground motion, is of great significance in seismic engineering. Commonly used indicators of duration include bracket duration, 90% energy duration, and 70% energy duration, etc. [29]. In this paper, bracket duration is selected as the duration indicator. The time interval corresponding to 20% of the peak acceleration of ground motion is taken as duration(Tc). Based on the vibration records of the samples studied in this paper, the duration of 150 earthquake records and 200 mine earthquake records are shown in Figure 11. The figure shows that the duration of earthquakes is generally higher than that of mine earthquakes. After calculation, the average duration of earthquake records is 21.4 s, and the average duration of mine earthquakes is 11.5 s.
To sum up, based on the analysis of amplitude characteristics of 6 typical earthquake and 6 mine earthquake records, there is no significant difference when the magnitude is close because the amplitude parameters are in the same order of magnitude. There are significant differences in the curve characteristics of the response spectrum, but in the characteristic parameters of the predominant period, because there is a large interaction area between the predominant period of the earthquake and the mine earthquake, it can not distinguish between the earthquake and the mine earthquake well. In terms of duration characteristic parameters, although the duration of earthquakes is generally greater than that of mine earthquakes, there are also many cases where the duration of mine earthquakes is greater than that of earthquakes. It can be seen from Figure 11 that there is a large interaction area between the two duration parameters. Considering comprehensively, although the three elements of ground motion (peak, spectrum, and duration) can distinguish some earthquakes from mine earthquakes, they cannot provide a quantitative distinguishing index, and the distinguishing effect is not ideal. There is no further quantitative discrimination of the three elements of ground motion, so other characteristic parameters are selected later.

4. Analysis of Identification Parameters of Natural and Mine Earthquakes

In recent years, with the continuous increase of coal mine depth and scale, the occurrence frequency of mine earthquakes has remarkably increased. The differences between mine and natural earthquakes have become a problem that needs to be solved at this stage. Among the identification parameters proposed by researchers around the world are energy attenuation factors, corner frequency, amplitude ratio, period, surface wave, first motion direction of P-wave, wave attenuation, time law, etc. With reference to the distinguishing method of natural and mine earthquakes, as well as blasting [30,31,32,33,34,35,36,37,38], combined with the author’s pre-study identification method, this paper selected the first motion direction of P-wave, dominant frequency, P-wave, and S-wave amplitude ratio (Sm/Pm). The amplitude to coda duration ratio (Sm/Tc and Pm/Tc) is analyzed as five identification parameters, and finally, the key identification parameters are selected.

4.1. First Motion Direction of P-Wave

The first motion direction of the seismic wave refers to the first vibration direction of surface particles when the seismic wave reaches the ground. It has extensively been implemented in the estimation of epicenter orientation and calculation of the focal mechanism.
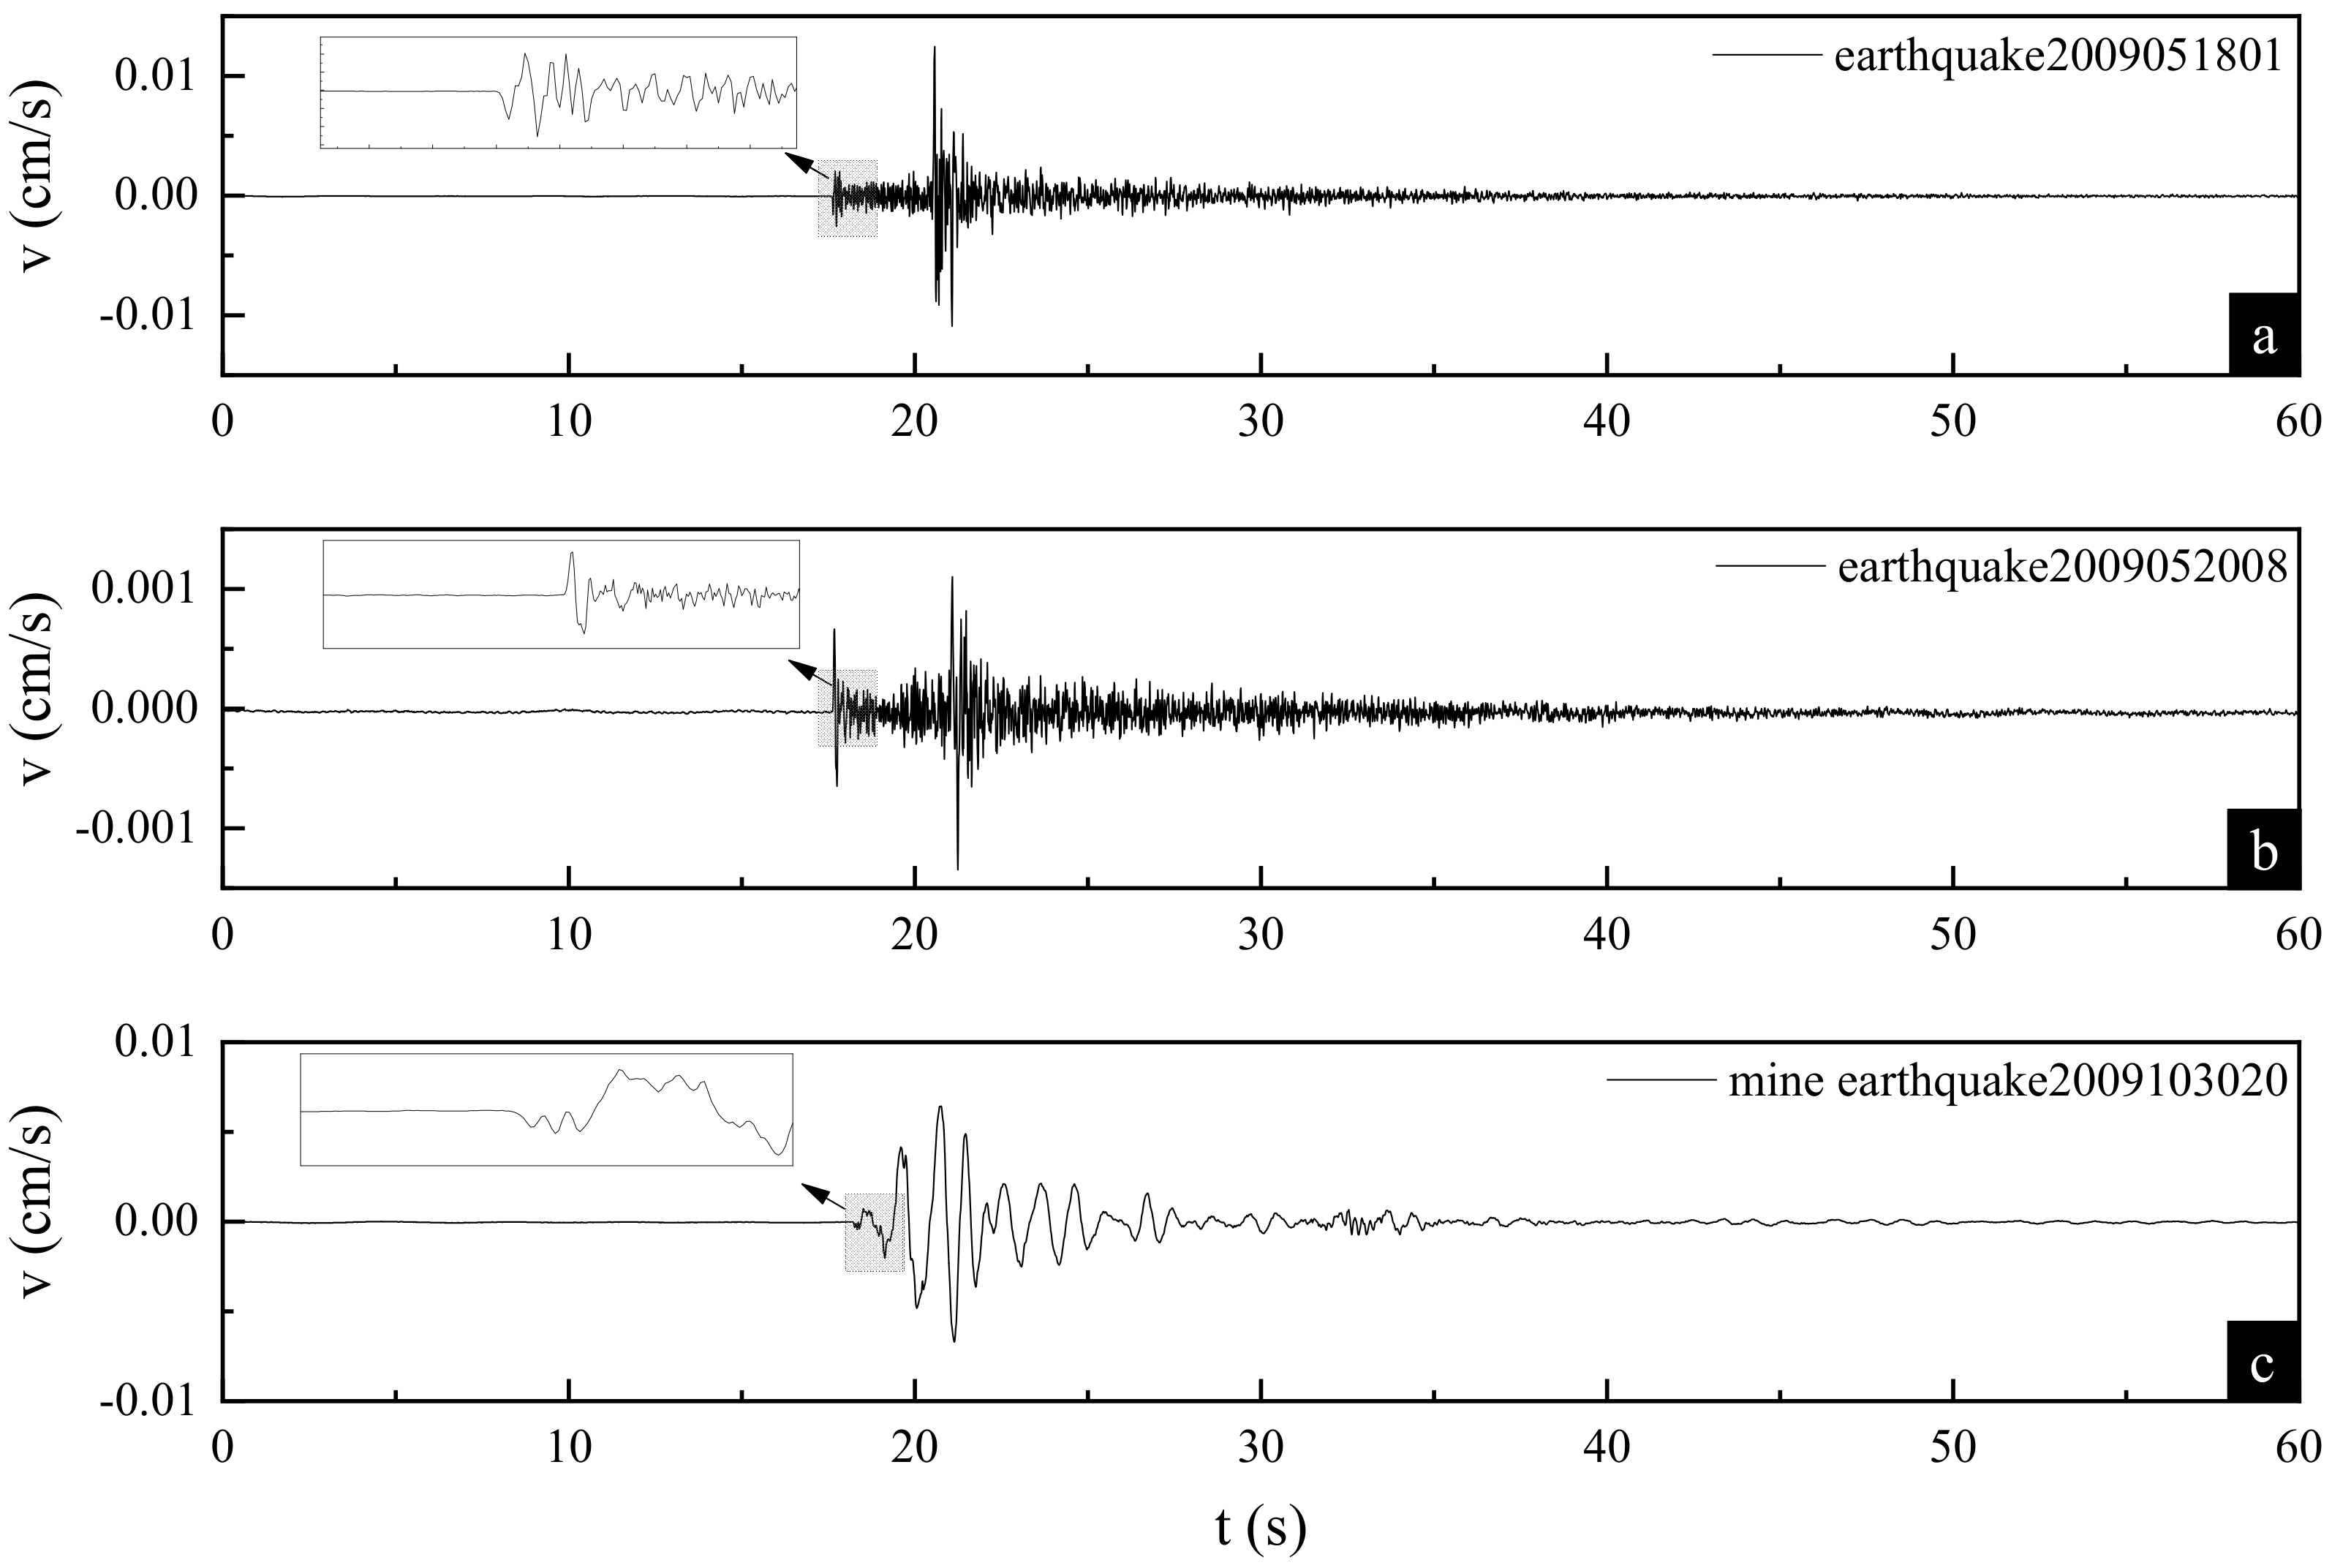
Figure 12 shows the first movement direction of the P-wave recorded by natural and mine earthquakes in the Hegang area. From Figure 12a,b, we can see that the first motion direction of P-waves in earthquake records has two directions; it is shown as up or down. This is because the earthquake breaks and dislocates the rock mass, producing compression waves and expansion waves. Therefore, the first motion direction of the P-wave shows up and down. Figure 12c shows that the first motion direction of the P-wave of the mine earthquake is downward, which is due to the shearing motion and collapse of the coal pillar caused by the coal tension. Therefore, the upward direction of the first motion of the P-wave basically belongs to earthquake, but it can not be used as the only criterion to distinguish between natural and mine earthquakes and can be used as the basic reference for distinguishing event types.

4.2. Fourier Response Spectrum and Dominant Frequency Analysis

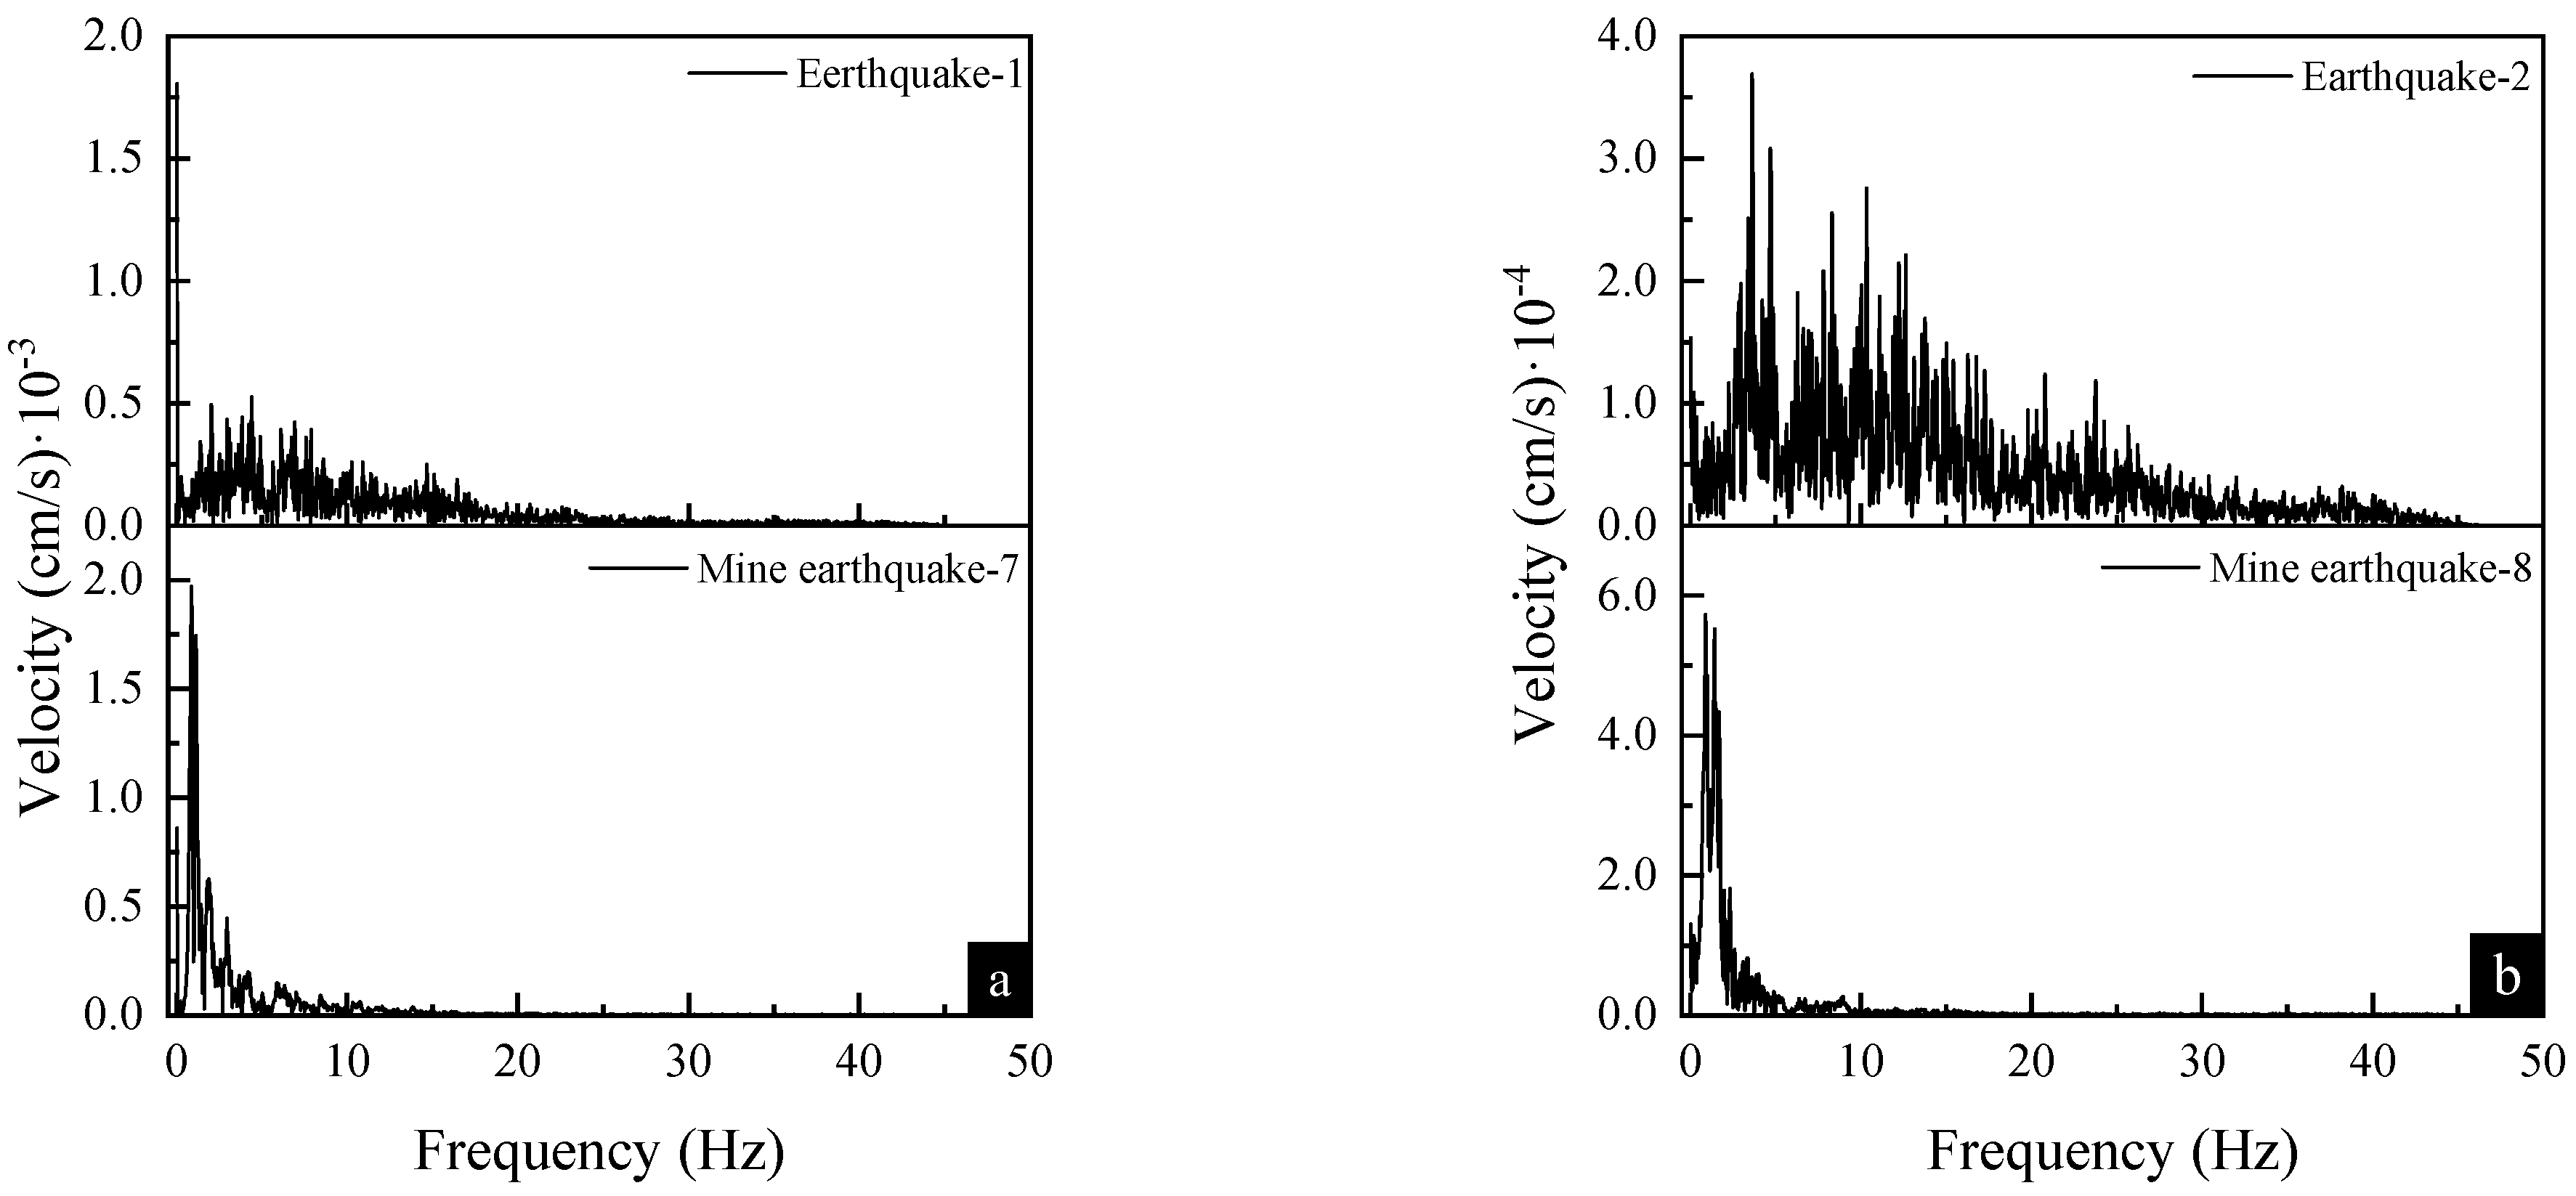
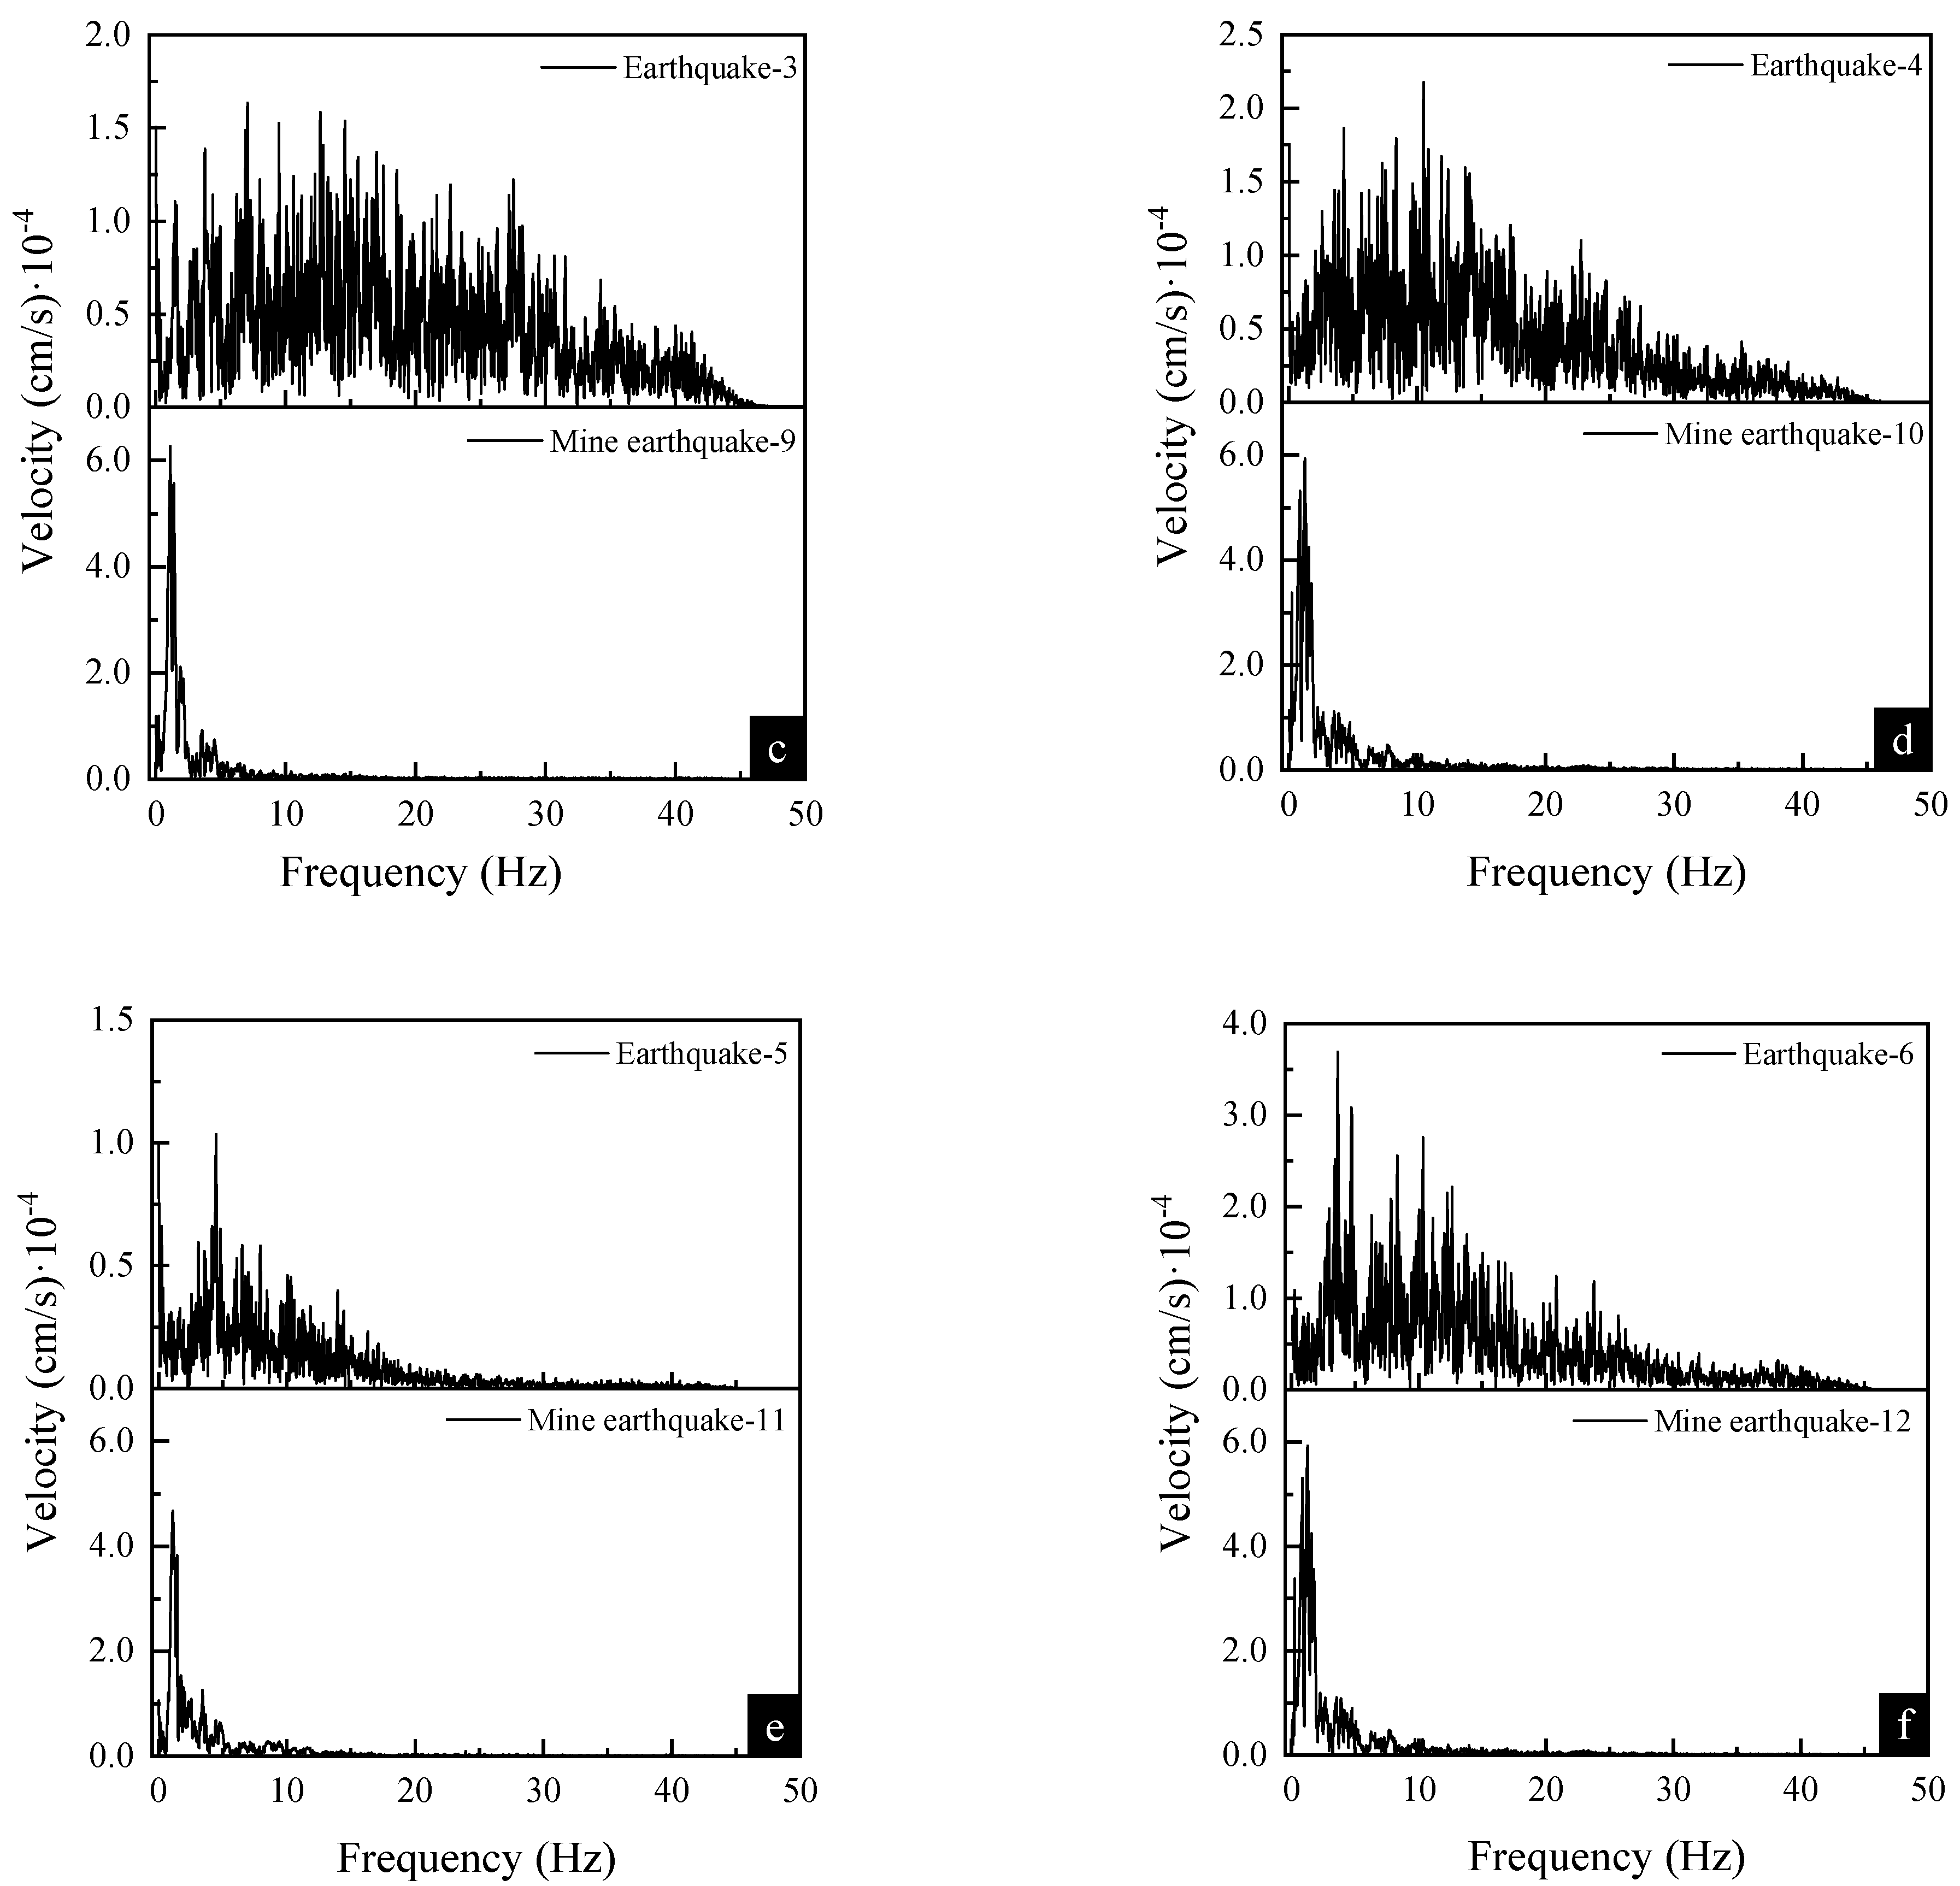
Since the amplitude only represents the intensity of ground motion at a certain time, the ground motion spectrum represents the frequency domain characteristics of ground motion. Therefore, in this paper, the vibration records are Fourier transformed, and the time-domain signals are converted into frequency-domain signals for analysis. Figure 13 shows the velocity Fourier spectrum of the natural and mine earthquake records listed in Table 3. From Figure 13, we can see that the dominant frequency band of the earthquake is greater than 0 Hz and less than 5 Hz. The dominant frequency bands of the mine earthquakes are 5–20 Hz. The amplitude of the mine earthquakes spectrum is generally higher than that of the earthquakes, but the frequency distribution of the earthquakes is richer than that of the mine earthquakes, and the attenuation of the high-frequency energy of the earthquake is slower than that of the mine earthquake.
In order to make the data more comparable, without changing the data correlation, and make the data more stable, the Fourier spectrum of the natural and mine earthquakes after logarithmic processing is taken, as shown in Figure 14. The frequency marked with circles is the dominant frequency.
Figure 14 shows that the peak value of the mine earthquake spectrum is larger than the earthquake, and the dominant frequency of the mine earthquake is smaller than the earthquake. The dominant frequency of the mine earthquake is about 1.0 Hz, while the dominant frequency of the earthquake is about 4.0 Hz. From the Fourier spectrum change curve, it is evident that the spectral amplitude of earthquake first increases and then decreases with the increase of frequency, and the change rate is slow. The spectral amplitude of mine tremor decreases with the increase in frequency, begins to decay at a large rate, and remains basically unchanged after the frequency reaches about 20 Hz. When the frequency of natural and mine earthquakes reaches 45 Hz, the spectral amplitude basically does not change and maintains a fixed value.
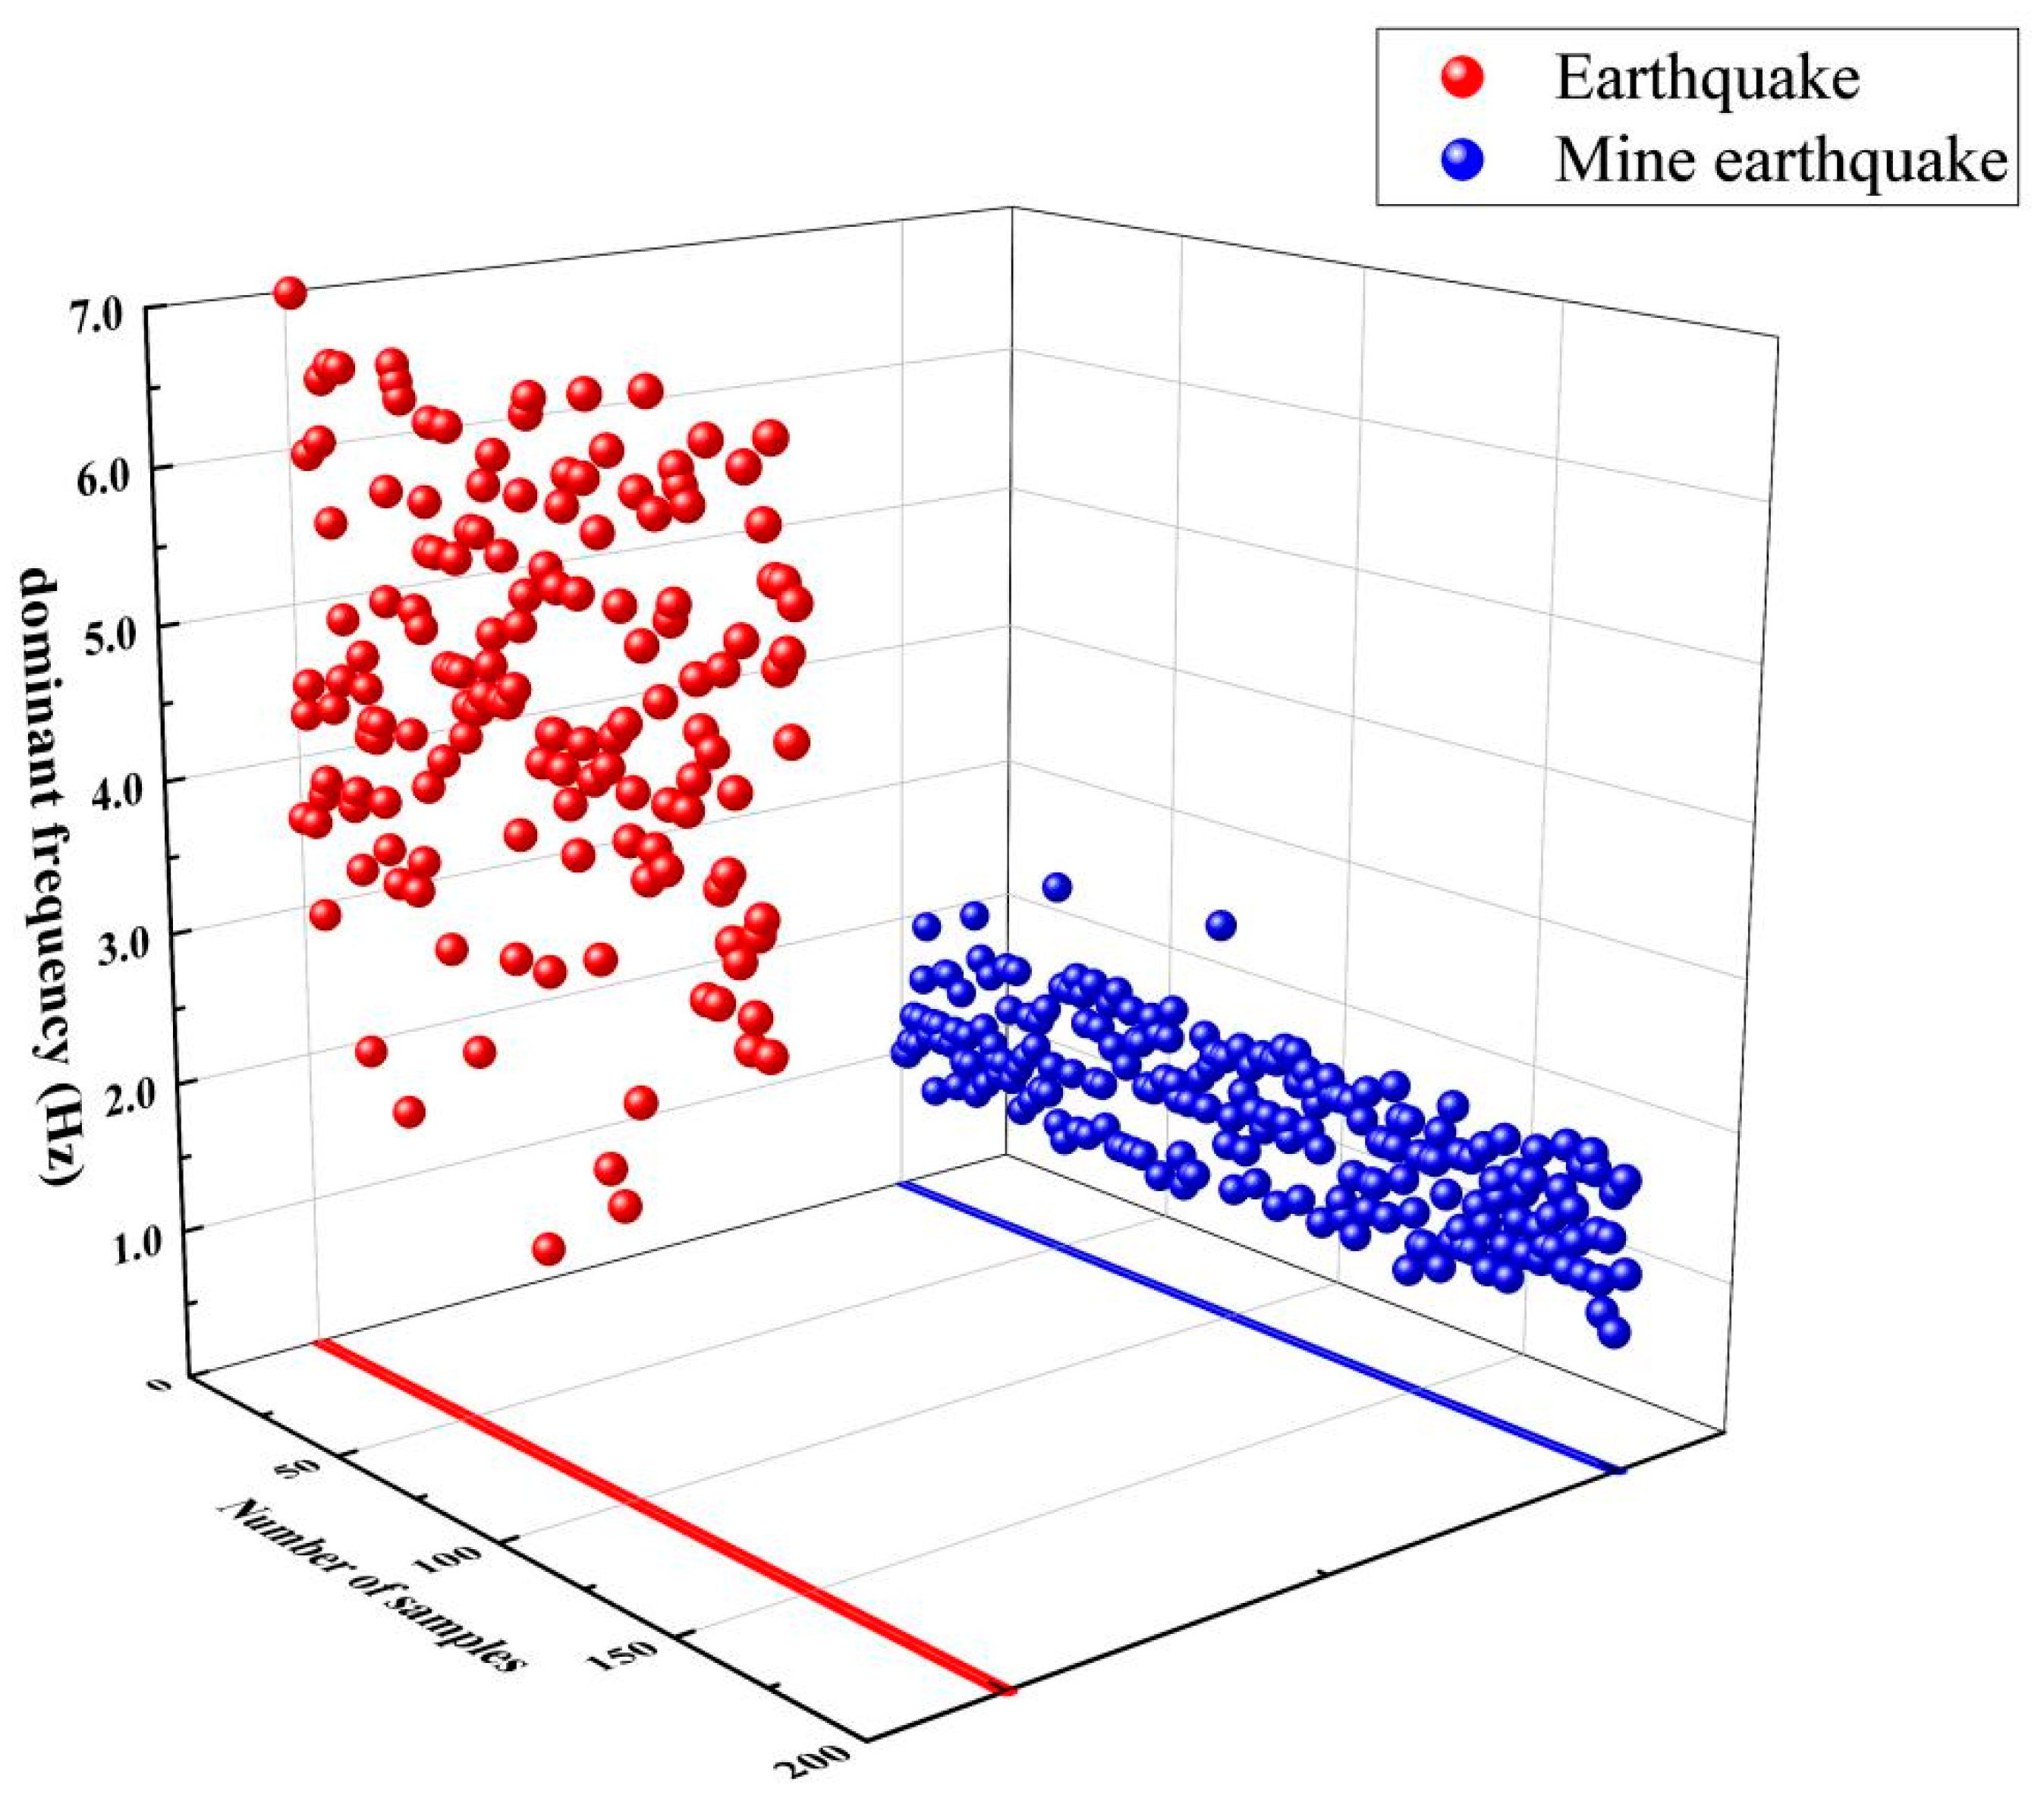
Figure 15 shows 150 earthquake records and 200 mine earthquake records based on the samples researched in this paper. The dominant frequencies of earthquakes and mine earthquake records are calculated and counted. Figure 15 shows that the dominant frequencies of earthquakes are centralized between 3–7 Hz and those of mine earthquakes are concentrated between 1–2 Hz. Therefore, the dominant frequency can be employed as an indicator to identify most natural and mine earthquakes.

4.3. Amplitude Ratio Comparison

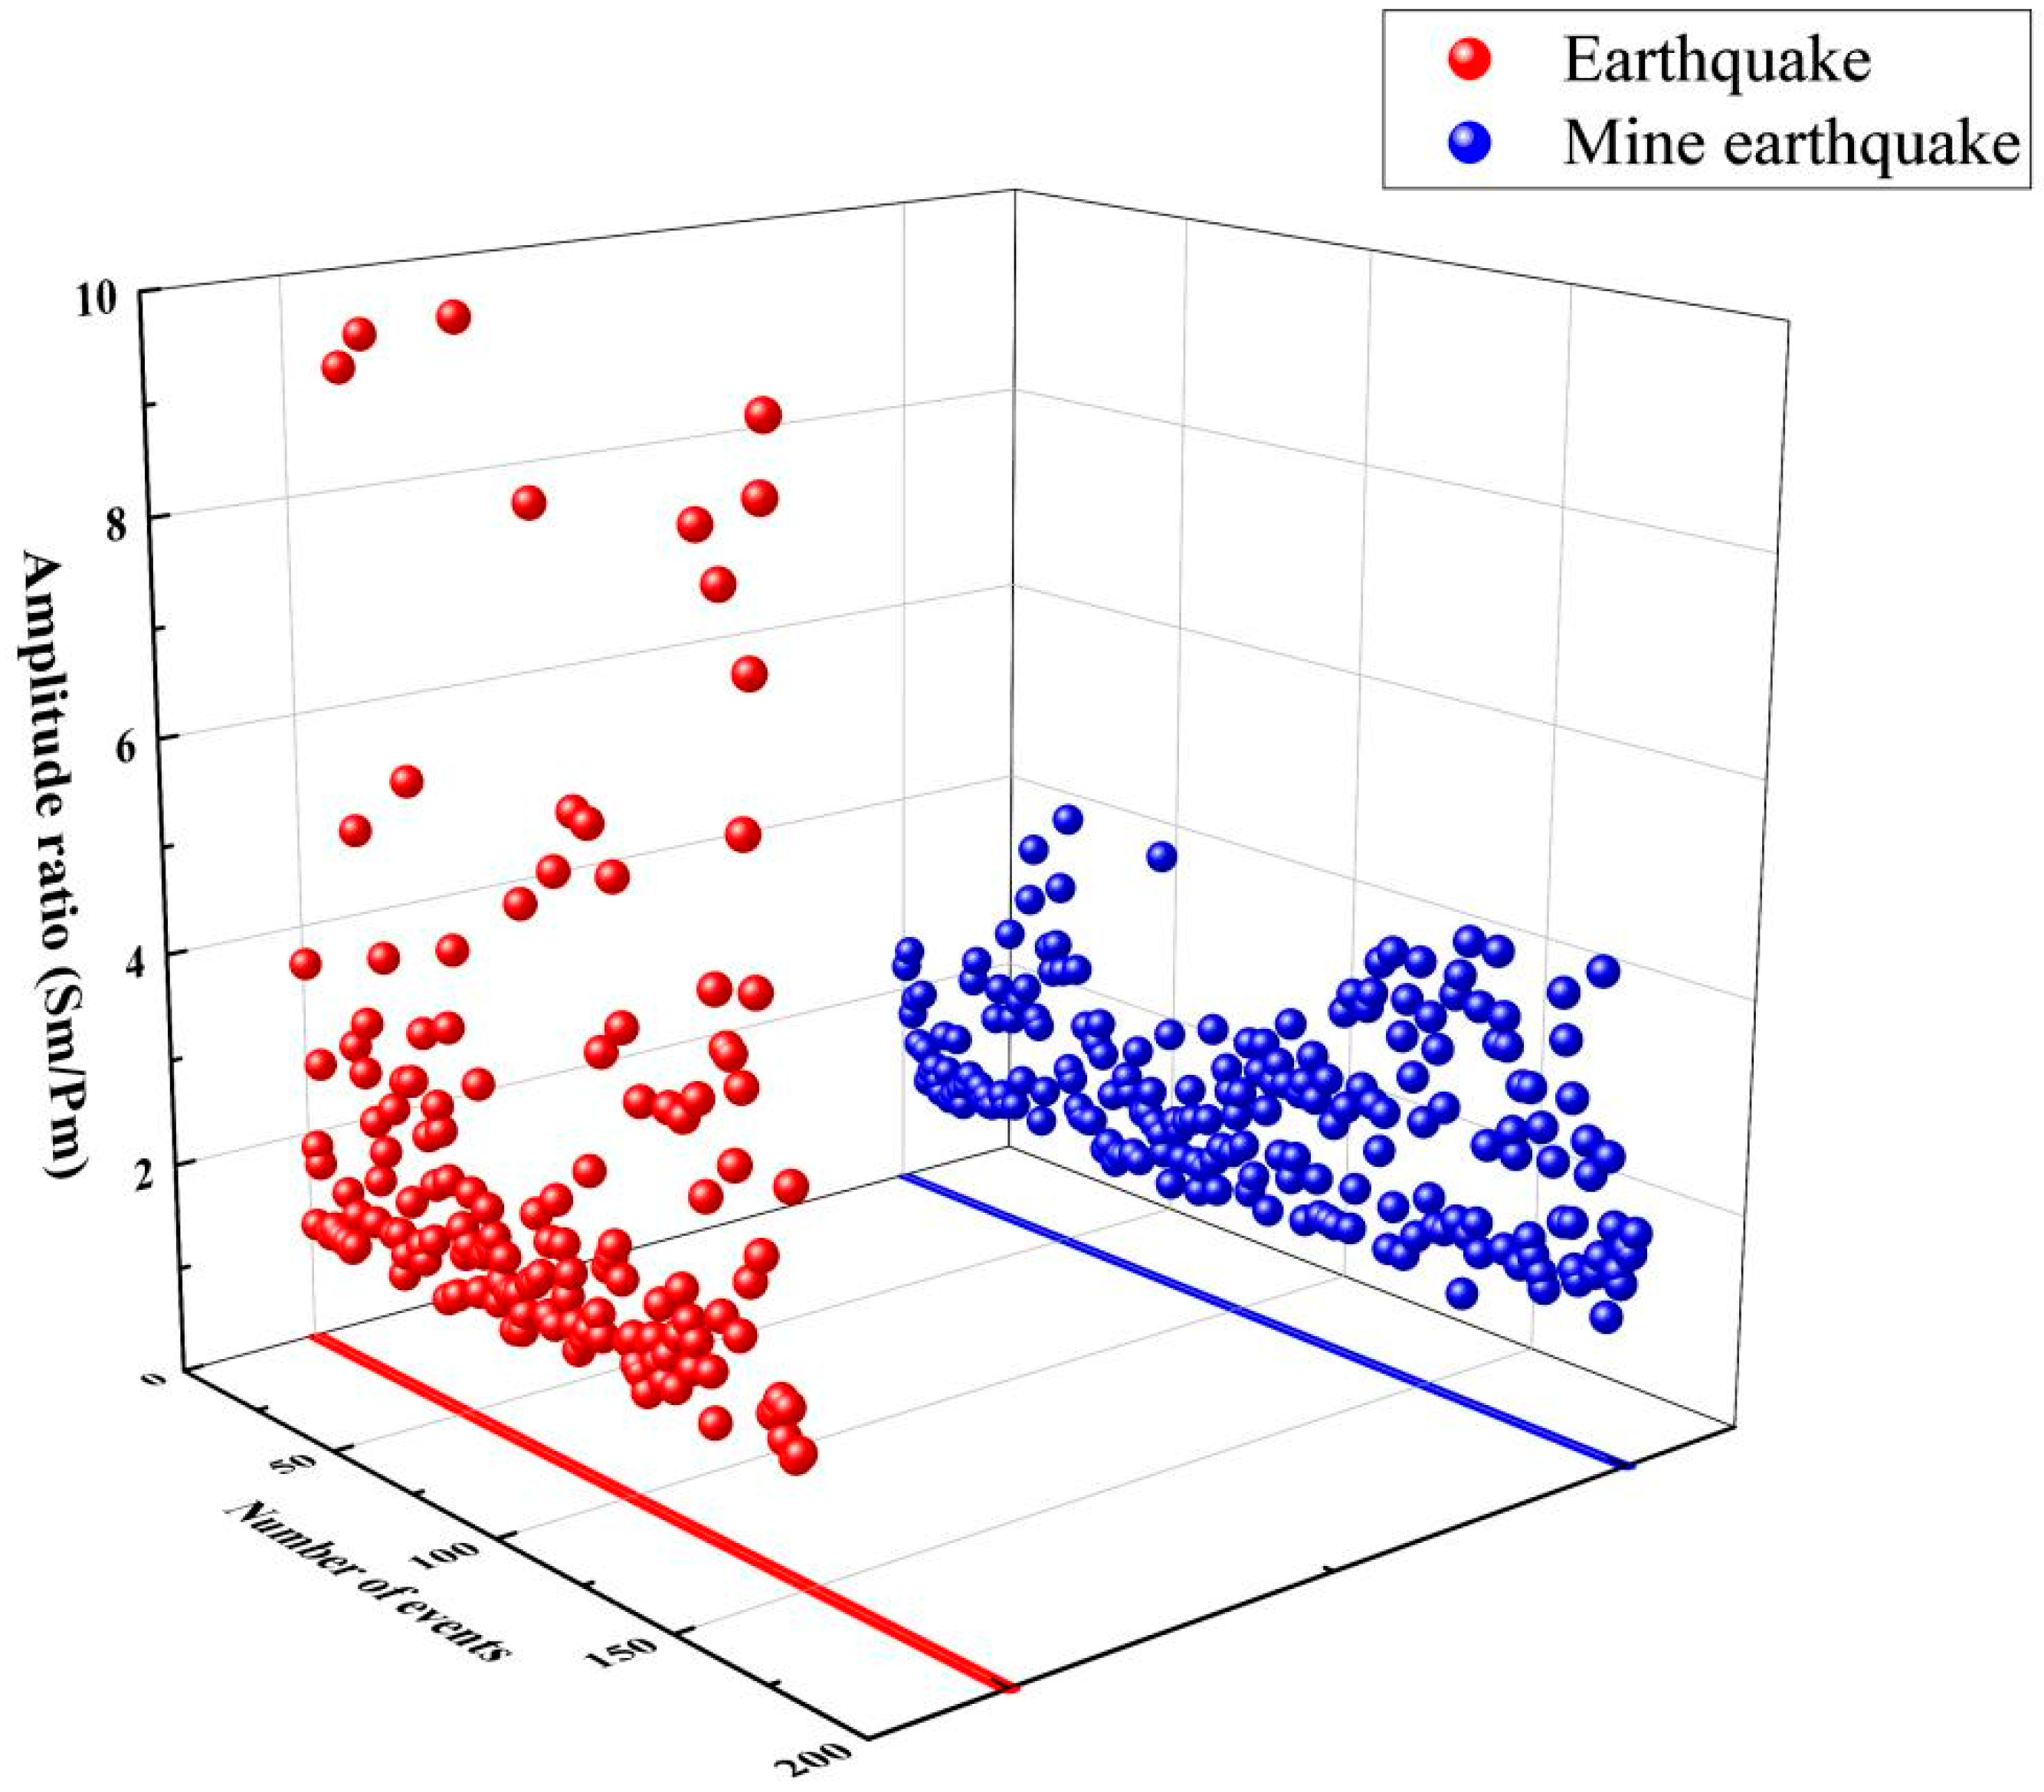
In seismic activities, most earthquakes produce strong S-waves due to the shear dislocations of rocks [39]. Mine earthquakes are induced by mines. Natural and mine earthquakes have similarities in terms of focal mechanisms. Sm and Pm are the maximum amplitudes of S and P waves. Therefore, the Sm/Pm amplitude ratio is selected as one of the calculation and analysis criteria. Moreover, the amplitude ratio could minimize the influence of magnitude, magnification of seismograph, and frequency characteristics [40,41].
In this paper, the Sm/Pm ratios of maximum amplitudes (maximum double amplitude/2) of S and vertical P-waves of the recorded 150 earthquakes and 200 mine earthquakes of the study sample are calculated, respectively. The results are shown in Figure 16. The obtained results show that: (1) the amplitude ratio Sm/Pm of natural and mine earthquakes are both greater than 1; (2) the amplitude ratio range of natural earthquakes is larger than that of mine earthquakes; (3) the amplitude ratios of most natural and mine earthquakes centralized between 1 and 2. The amplitude ratio of mine earthquakes is below 5, which could be surpassed by the amplitude ratios of some earthquakes. Therefore, tremors with amplitude ratios of greater than 5 must be earthquakes. The amplitude ratio Sm/Pm could not be treated as an index for distinguishing earthquakes from mine earthquakes.

4.4. Comparison between Amplitude and Coda Duration

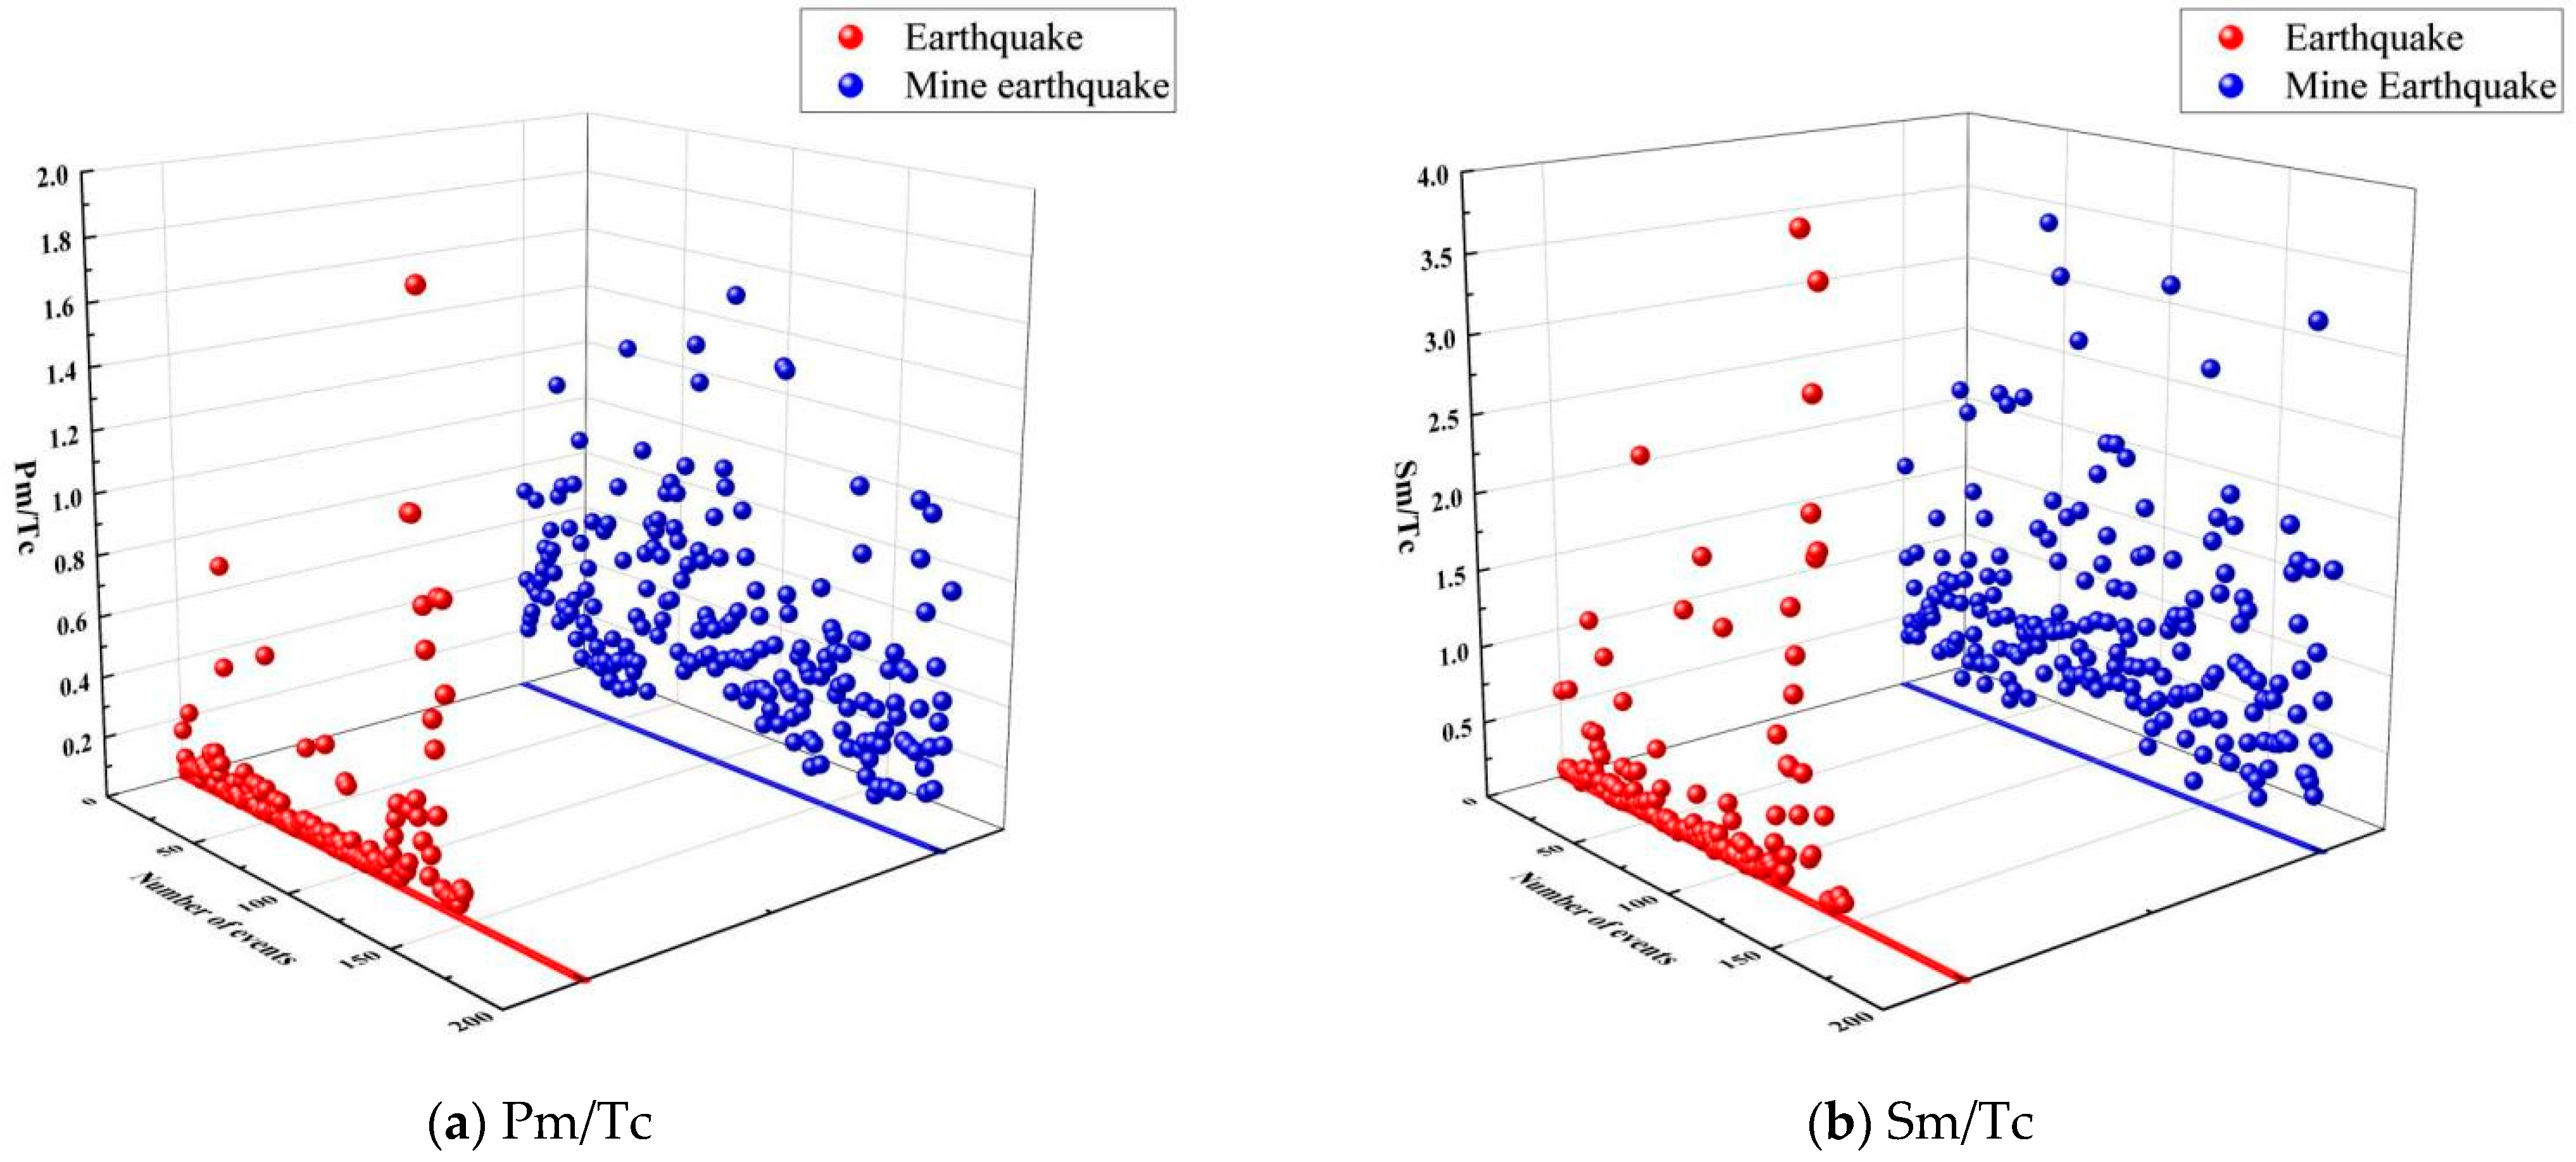
Generally, the duration of a seismic event is increased as the magnitude of the event is increased. Compared with natural earthquakes, mine earthquakes have shorter durations due to their closer locations to the surface, resulting in their faster attenuation. The ratios Sm/Tc and Pm/Tc of maximum amplitude of P- and S-waves and coda duration are calculated as indicators. In this study, coda duration is defined as the time required for the magnitude of the S-wave to attenuate from maximum to noise level. Statistics show that the average coda duration of natural earthquakes is 21.4 s and that of mine earthquakes is 11.5 s. The statistics of the ratio of amplitude and coda duration of natural and mine earthquakes are shown in Figure 17.
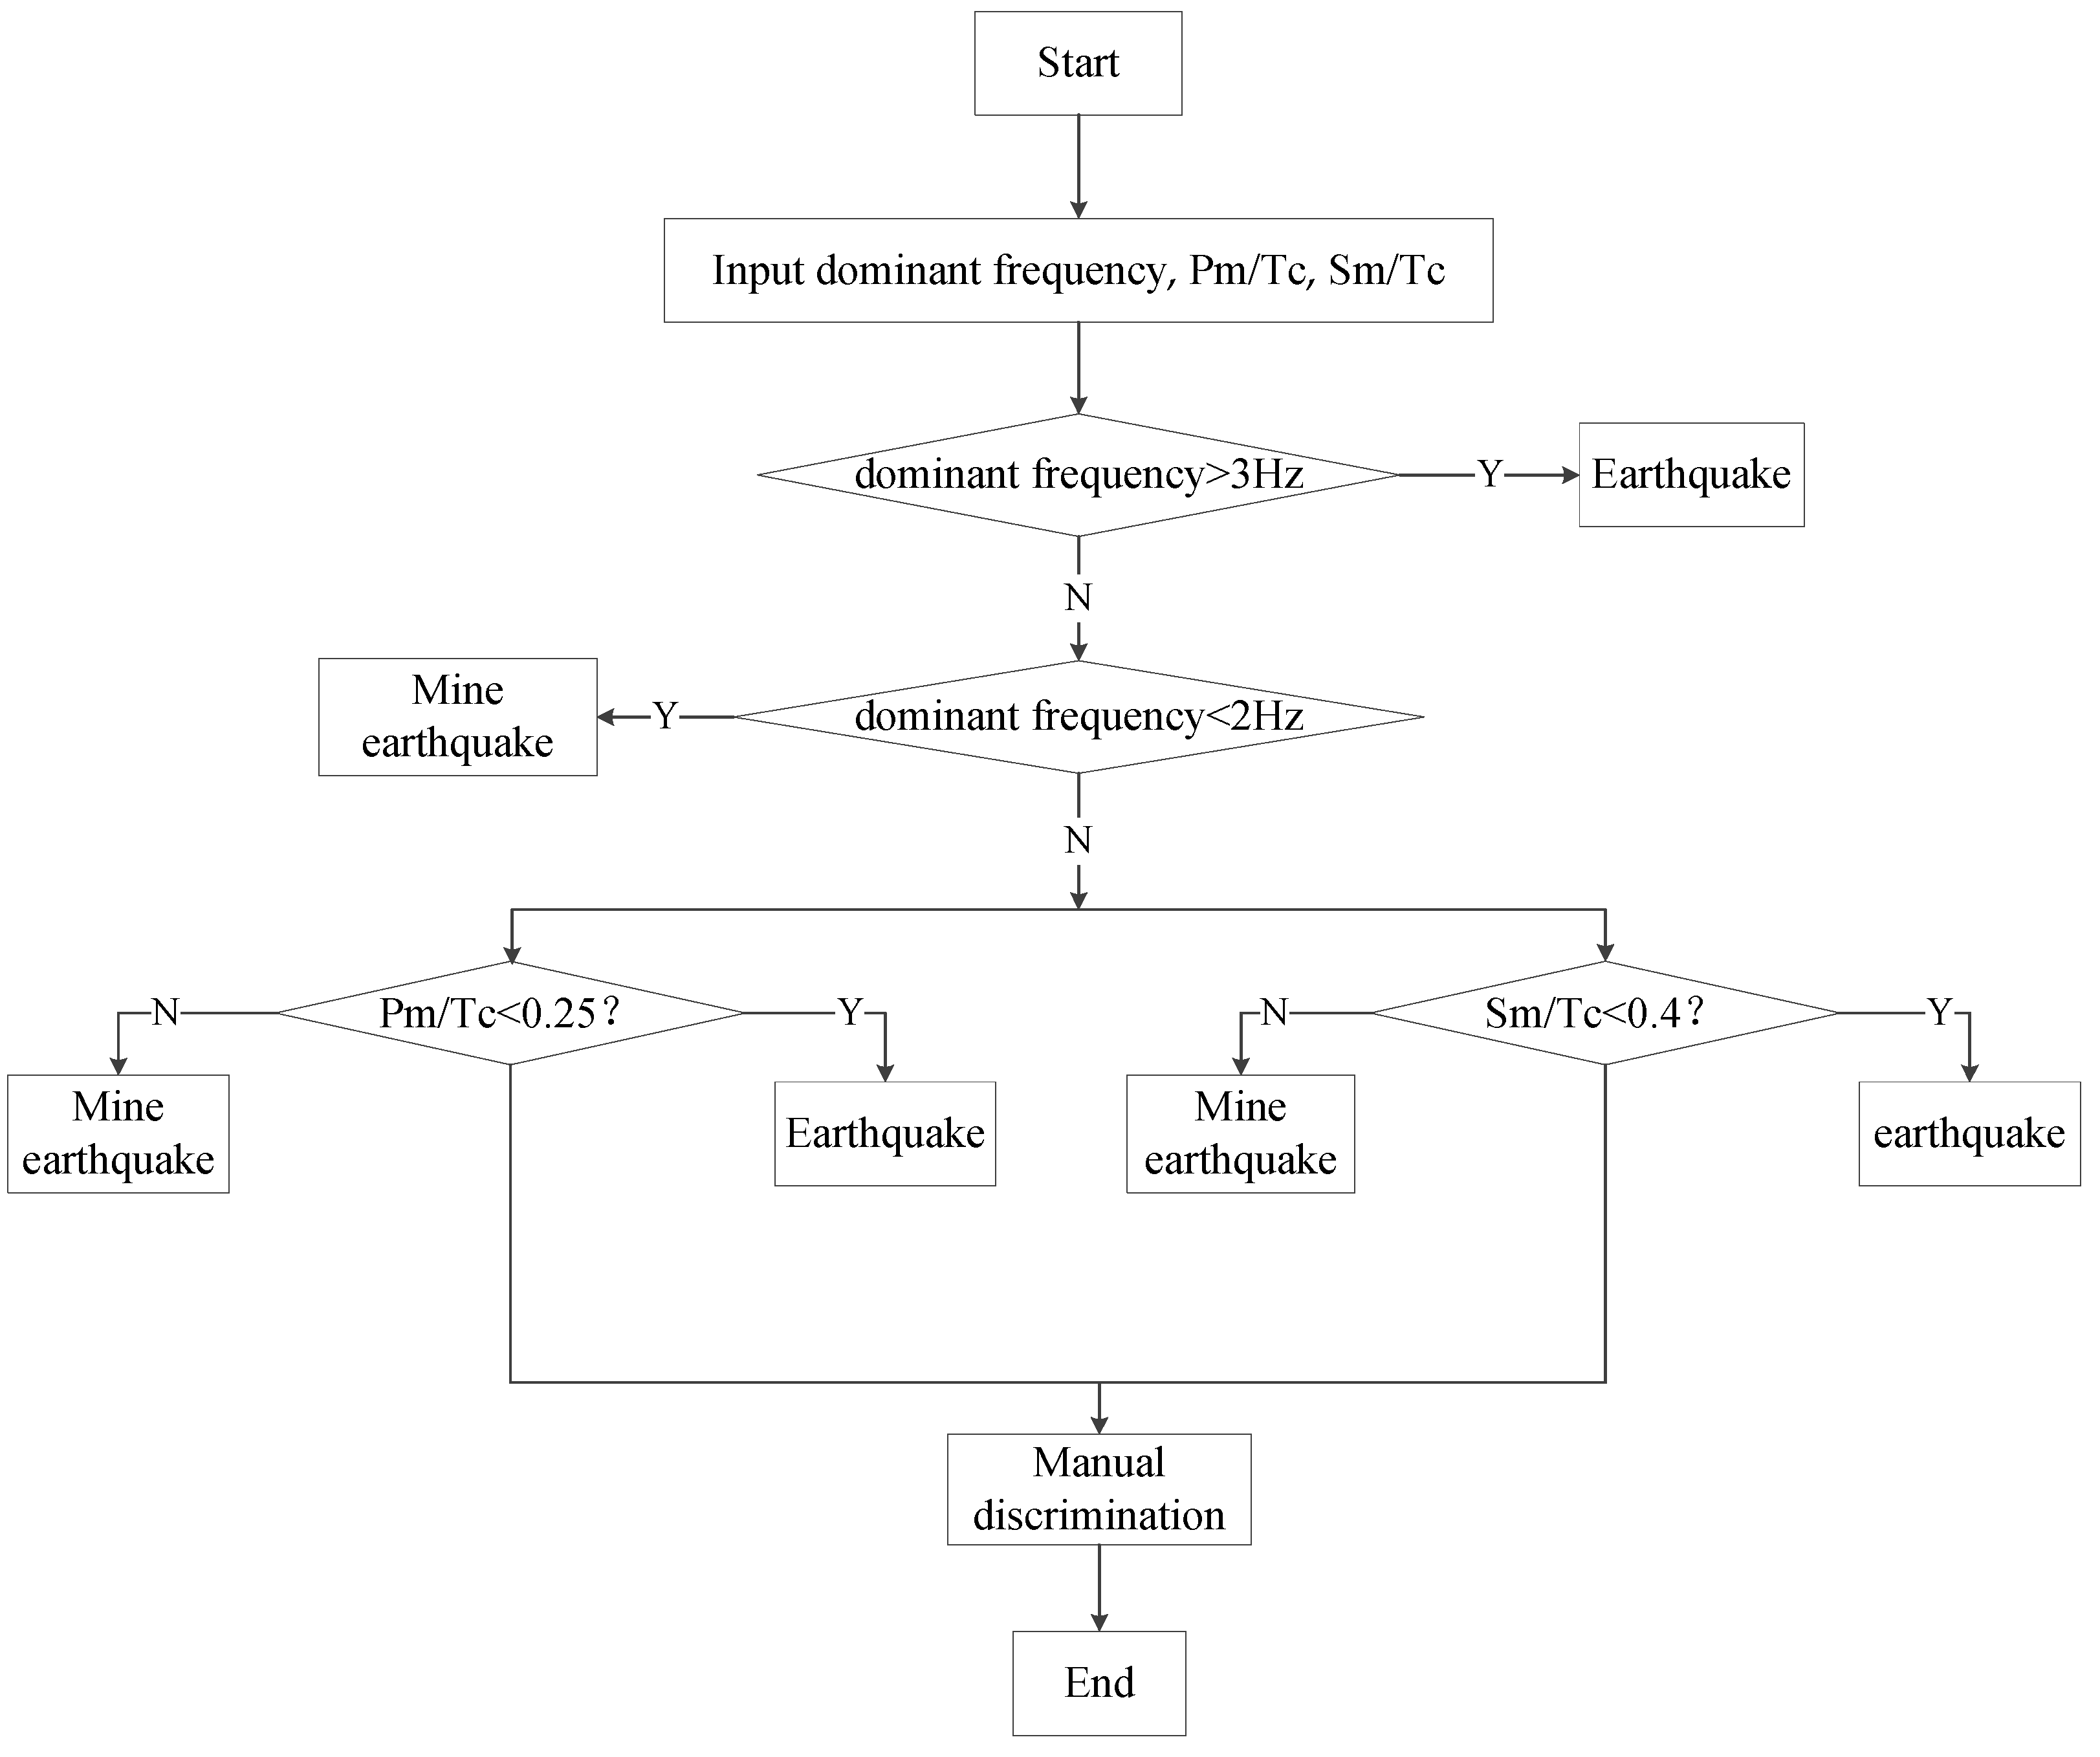
Figure 17 displays an overlap between natural and mine earthquakes in the value of the maximum amplitude of P and S-waves to code duration, but there are great differences between them. Statistics show that the number of earthquakes with the ratio of maximum amplitude to code duration of P-waves (Pm/Tc) of less than 0.25 accounted for 83.6% of total earthquakes, while that of mine earthquakes accounted for only 9% of total mine earthquakes. The number of earthquakes with the ratio of maximum amplitude to the coda duration of S-waves (Sm/Tc) of less than 0.4 accounted for 80% of total earthquakes, while that of mine earthquakes accounted for 8% of total mine earthquakes. Therefore, the ratios of the maximum amplitude to coda duration of 0.25 and 0.4 are taken as the threshold values of Sm/Tc and Pm/Tc independently to identify natural and mine earthquakes.

5. Tests of Key Identification Parameters

5.1. Selection of Test Method

Referring to the evaluation index [42] currently used to identify the accuracy of earthquake and explosion, dr is the Evaluation Index of Earthquake and Explosion Identification; its value is defined as:
d r = D F
where D is the explosion identification rate; F is the percentage of earthquakes recognized as explosions.
Similar to the identification and evaluation indicators applied to natural and mine earthquakes:
Dr is the Evaluation Index of Earthquake and Mine Earthquake Identification (actual threat rate). Its value is defined as:
D r = d f
where d is the mine earthquake identification rate (apparent threat rate), f is the percentage of earthquake recognition as mine earthquakes, that is, the earthquake error recognition rate.
d = Correct   identification   number   of   mine   earthquake Total   number   of   mine   earthquake   samples
Dr not only considers the identification rate of mine earthquakes but also the rate of misrecognizing earthquakes as mine earthquakes, so it can be used as an evaluation index to evaluate the identification effect of mine earthquakes.

5.2. Inspection of Key Identification Parameters

Based on the analysis of the key identification parameters of natural and mine earthquakes, the dominant frequency, Sm/Tc, and Pm/Tc with better identification effects are selected as the key identification parameters of natural and mine earthquakes. Based on the test sample in this paper, there are 140 records, including 60 earthquake records and 80 mine earthquake records. The correct recognition rate of each key identification parameter is calculated, and the results are shown in Table 6.
The test results show that the dominant frequency as an independent indicator has the best discrimination effect with the correct identification rates of 95.7% and the actual threat rates of up to 90.8%, followed by Pm/Tc and Sm/Tc correct identification rates of 91.4% and 93.6%, respectively, and the actual threat rates reaching 83.3% and 86.3%, respectively. The correct identification rates of the three key identification parameters are all over 90%.

6. Three-Parameter Comprehensive Gradient Identification Method

Based on the above key identification parameters identification results, although the identification effect is good, there are still some errors.
In order to further improve the identification accuracy, this study combined the three identification parameters for comprehensive identification of seismic events, and a “three-parameter comprehensive gradient identification method” is proposed. The correct recognition rate of the dominant frequency is the highest, so the dominant frequency is used as the first gradient identification, and Sm/Tc and Pm/Tc were used as the second gradient identification. The specific identification flow chart is shown in Figure 18. The comprehensive identification results based on the test sample are shown in Table 7. According to Table 7, it is shown that the proposed “three-parameter comprehensive gradient identification method” has a correct identification rate of 99.3% and the actual threat rate of 98.4% for natural and mine earthquakes, which can accurately identify natural and mine earthquakes.

7. Conclusions

Based on 490 records of natural and mine earthquakes at Hegang Station from 2006 to 2017, this paper compares and analyzes the parameter characteristics and identification effect of the three elements of vibration (amplitude, spectrum, duration), the first motion direction of P-wave, the dominant frequency, the amplitude ratio of the P wave and S wave (Sm/Pm), and the amplitude to coda duration ratio Sm/Tc and Pm/Tc of the study sample (150 earthquake records and 200 mine earthquake records). The key identification parameters with better identification effects are selected: dominant frequency, Sm/Tc, and Pm/Tc. Based on the test sample (60 seismic records and 80 mine earthquake records) and the test method, the identification accuracy of the key identification parameters for natural and mine earthquakes is tested. Finally, based on the selected three key identification parameters, a “three-parameter comprehensive gradient discrimination method” is proposed, and the identification effect of the identification method is tested. The main conclusions are as follows.
(1)
The peak acceleration PGA of natural and mine earthquakes are in the same order of magnitude, but when the magnitude is similar, the earthquakes’ PGA are larger than mine earthquakes. The amplitude decay rate of earthquake is slower, and the duration is longer. Natural and mine earthquakes are almost similar in PGV without a considerable difference. When the magnitude is equivalent, the peak displacement (PGD) of earthquakes is significantly smaller than mine earthquakes, which is consistent with the fact that small-magnitude mine earthquakes are more detrimental to the surface than natural earthquakes. The PGV/PGA of records by the listed natural and mine earthquakes are less than 0.2 s, so there is no significant pulse effect. However, the PGV/PGA ratio of mine earthquakes is generally greater than earthquakes, which may be caused by the combined action of magnitude, hypocentral distance, geological faults, site conditions, and so on.
(2)
The acceleration response spectrum curve of the earthquake is “thin and high” as a whole, and the predominant period is less than 0.1 s except for a few points, and its average value is 0.064 s. The acceleration response spectrum curve of mine earthquake is “fat and low” as a whole, and the predominant period of mine earthquake records are generally greater than that of earthquakes, with an average of 0.13 s. The peak value of the response spectrum of mine earthquakes is higher than that of earthquakes, which have the characteristics of high frequency and large amplitude.
(3)
The duration of the earthquakes is generally higher than that of the mine earthquakes. The average duration of earthquake records is 21.4 s, and the average duration of mine earthquake records is 11.5 s. The first motion direction of a P-wave of earthquake is up and down, while the first motion direction of a P-wave of mine earthquake is down. The amplitude ratio Sm/Pm of natural and mine earthquakes are greater than 1, but the amplitude ratio Sm/Pm of mine earthquake is less than 5, and the range of earthquake amplitude ratio is larger than that of mine earthquakes.
(4)
The peak value of the mine earthquakes spectrum is larger than the earthquakes, and the dominant frequency of the mine earthquakes is smaller than the earthquakes. The dominant frequency of the mine earthquake is about 1 Hz, while the dominant frequency of the earthquakes is about 4 Hz. The spectral amplitude of earthquakes first increases and then decreases with the increase in frequency, and the change rate is slow. The spectral amplitude of mine earthquakes decreases with the increase infrequency, begins to decay at a large rate, and remains basically unchanged after the frequency reaches about 20 Hz. When the frequency of natural and mine earthquakes reaches 45 Hz, the spectral amplitude basically does not change and maintains a fixed value.
(5)
The number of earthquakes with the ratio Pm/Tc of maximum amplitude to coda duration of P-waves of less than 0.25 accounted for 83.6% of total earthquakes, while that of mine earthquakes accounted for only 9% of total mine earthquakes. The number of earthquakes with the ratio Sm/Tc of maximum amplitude to the coda duration of S-waves of less than 0.4 accounted for 80% of total earthquakes, while that of mine earthquakes accounted for 8% of total mine earthquakes. Therefore, the ratios of the maximum amplitude to coda duration of 0.25 and 0.4 are taken as the threshold values of Sm/Tc and Pm/Tc independently to identify natural and mine earthquakes.
(6)
Based on the analysis of the key identification parameters of natural and mine earthquakes, the dominant frequency, Pm/Tc, and Sm/Tc with better identification effects are selected as the key identification parameters of natural and mine earthquakes. Based on the test sample and test method, it is found that the dominant frequency as a separate criterion has the best identification effect, with a correct identification rate of 95.7% and the actual threat rate of 90.8%. Followed by Pm/Tc and Sm/Tc, with a correct identification rate of 91.4% and 93.6, respectively, and the actual threat rate is 83.3% and 86.3%, respectively. The correct identification rate of the three key identification parameters is more than 90%.
(7)
In order to further improve the identification accuracy, this study combined the three identification parameters for comprehensive identification of seismic events, and a “three-parameter comprehensive gradient identification method” is proposed. It has been tested that the correct identification rate of natural and mine earthquakes is 99.3%, and the actual threat rate is 98.4%, which can basically accurately identify natural and mine earthquakes.

Author Contributions

Conceptualization, S.M., H.M. and M.W.; methodology, S.M., H.M. and M.W.; software, W.Y. and X.Y.; validation, Y.L. and Y.S.; formal analysis, S.M., H.M., M.W. and W.Y.; investigation, S.M., H.M. and M.W.; writing—original draft preparation, S.M., H.M., M.W. and W.Y. All authors have read and agreed to the published version of the manuscript.

Funding

This research was supported by the Natural Science Foundation of Heilongjiang Province (ZD2019E009); China Postdoctoral Fund Project (2021M690946); postdoctoral Fund Project of Heilongjiang Province (LBH-Z20094); Scientific Research Fund of Institute of Engineering Mechanics, China Earthquake Administration (2018D12).

Institutional Review Board Statement

Not applicable.

Informed Consent Statement

Not applicable.

Data Availability Statement

The data presented in this study are available on request from the corresponding author.

Conflicts of Interest

The authors declare no conflict of interest.

References

  1. Xie, K.C. Strategic Researchon Promoting Energy Revolutionof Productionand Consumption; Science Press: Beijing, China, 2017. [Google Scholar]
  2. Yuan, L. Research progress on risk identification, assessment, monitoring and early warning technologies of typical dynamic hazards in coal mines. J. China Coal Soc. 2020, 45, 1557–1566. [Google Scholar]
  3. Xie, H.P.; Ju, Y.; Gao, M.Z.; Gao, F.; Liu, J.Z.; Ren, H.W.; Ge, H.R. Theories and technologies for in-situ fluidized mine of deep underground coal resources. J. China Coal Soc. 2018, 43, 1210–1219. [Google Scholar]
  4. Xie, H.P.; Li, C.B.; Gao, M.Z.; Zhang, R.; Gao, F.; Zhu, J.B. Conceptualization and preliminary research on deep in situ rock mechanics. Chin. J. Rock Mech. Eng. 2021, 40, 217–232. [Google Scholar]
  5. Zhang, T.L.; Yang, W.D.; Zhang, Z.; Hu, B.H. Study on attenuation relation of mine earthquake intensity in Hegang Coalfield. J. Nat. Disasters 2012, 21, 139–144. [Google Scholar]
  6. Meng, S.J.; Yang, W.H.; Li, H.Y.; Wang, M.; Sun, Y.Q. Preliminary study on the early warning of coal mine gas disaster induced by shake. World Earthq. Eng. 2020, 36, 218–228. [Google Scholar]
  7. Lizurek, G. Full moment tensor inversion as a practical tool in case of discrimination of tectonic and anthropogenic seismicity in poland. Pure Appl. Geophys. 2016, 174, 197–212. [Google Scholar] [CrossRef] [Green Version]
  8. Sagan, G.; Dubiel, R.; Mitrega, P.; Zuberek, W.M. The mechanism of mine tremors related to damages observed in the stope area. Publications-Institute of Geophysics. Pol. Acad. Sci. 1995, 19, 33–45. [Google Scholar]
  9. Holub, K.; Slavik, J.; Kalenda, P. Monitoring and analysis of seismicity in the OstravaKarvina coal mine district. Geophys. Pol. 1995, 43, 11–31. [Google Scholar]
  10. Kalab, Z.; Knejzlik, J. Recording of mine tremors from Poland by the SPF local seismic network in the Czech Republic Publications-Institute of Geophysics. Pol. Acad. Sci. 1995, 19, 269–277. [Google Scholar]
  11. Holub, K. Space-time variations of the frequency-energy relation for mine-induced seismicity in the Ostrava-Karvina mine district Geophysics. Pure Appl. 1996, 146, 265–280. [Google Scholar]
  12. Stec, K. Characteristics of seismic activity of the Upper Silesian Coal Basin in Poland. Geophys. J. Int. 2010, 2, 757–768. [Google Scholar] [CrossRef] [Green Version]
  13. Bischoff, M.; Cete, A.; Fritschen, R.; Meier, T. Coal mine induced seismicity in the ruhr area, Germany. Pure Appl. Geophys. 2010, 167, 63–75. [Google Scholar] [CrossRef]
  14. George, M.T.; Eleftheria, E.P.; Limnios, N. Statistical Tools for Earthquake and mine Seismology. Acta Geophys. Vol. 2011, 59, 657–658. [Google Scholar]
  15. Koper, K.D.; Pechmann, J.C.; Burlacu, R.; Pankow, L. Magnitude-based discrimination of man-made seismic events from naturally occurring earthquakes in Utah, USA. Geophys. Res. Lett. 2016, 43, 10638–10645. [Google Scholar] [CrossRef]
  16. Rudziński, Ł.; Mirek, J.; Lizurek, G. Identifification of seismic doublets occurred on Rudna mine, Poland. Acta Geophys. 2017, 65, 287–298. [Google Scholar] [CrossRef] [Green Version]
  17. Zhao, Y.; Liu, W.H.; Gao, Y.L. Distinguishing earthquake, explosion and mine earthquake in Beijing area. Seismol. Geomagn. Obs. Res. 1995, 16, 48–54. [Google Scholar]
  18. Zhang, P.; Gao, Y.L.; Xiao, J.; Xiao, L.P. The distinguish of explosions mine-shocks and earthquake recording in Liaoning Seismic Network. Seismol. Geomagn. Obs. Res. 2001, 22, 29–34. [Google Scholar]
  19. Liu, X.Q.; Du, Y.H.; Xu, B.; Li, H.; Shen, P.; Zhang, P. The Mode Identification Method and Its Application to Regional Mine and Nature Earthquakes. Earthq. Res. China 2005, 21, 50–60. [Google Scholar]
  20. Sun, B.B.; Zhang, S.R.; Wang, C.; Cui, W. Ground motion duration effect on responses of hydraulic shallow-buried tunnel under SV-waves excitations. Earthq. Eng. Eng. Vib. 2020, 19, 887–902. [Google Scholar] [CrossRef]
  21. He, X.S.; Li, S.Y.; Shen, P. A wavelet packet approach to wave classification of earthquakes and mine Shocks. Earthq. Res. China 2006, 22, 425–4346. [Google Scholar]
  22. Wang, F.; Lv, Z.; Liu, B.; Chen, C.; Kong, X.B.; Li, M.S. Characteristic analysis of the mine earthquakes, explosions and natural earthquakes occured in Zoucheng region. Seismol. Geomagn. Obs. Res. 2013, 34, 82–86. [Google Scholar]
  23. Yang, L.; Zang, K.J.; Yang, T.; Zhang, Y.; Fu, W.Z. Idendification of earthquake and explosion and mine eqrthquake records in changchun network. Plateau Earthq. Res. 2015, 27, 1–5. [Google Scholar]
  24. Jin, Y.Z.; Lin, M.J.; Fan, X.Y.; Liu, X.P.; He, J.; Yang, S.Y.; Meng, C.J. Feature recognition of explosion, collapse (mine earthquake) to specific ground motion in Shanxi region. Seismol. Geomagn. Obs. Res. 2015, 36, 63–66. [Google Scholar]
  25. Xia, F. Identification of blasting, mine earthquake and natural earthquake in shuangyashan. Inn. Mong. Coal Econ. 2018, 13, 20–21. [Google Scholar]
  26. Chen, Y.; Wang, Q.L.; Qin, W.B.; Zhang, C. Analysis of engineering and time-frequency characteristics of near-fault Ground motion from the chi-chi earthquake in Taiwan. J. Geod. Geodyn. 2021, 41, 1069–1075. [Google Scholar]
  27. Chen, Y.X.; Chi, M.J.; Li, X.J. Determination of site do minant period based on strong motion records. Acta Seismol. Sin. 2016, 38, 138–145+158. [Google Scholar]
  28. Amin, N.; Mehdi, P. Effect of the spectral shape of ground motion records on the collapse fragility assessment of degrading SDOF systems. Earthq. Eng. Eng. Vib. 2021, 20, 925–941. [Google Scholar]
  29. Xie, L.L.; Zhang, X.Z. Accelerogram-based duration and engineering duration of ground motion. Earthq. Eng. Eng. Dyn. 1988, 8, 31–38. [Google Scholar]
  30. Pasyanos, M.E.; Walter, W.R.; Matzel, E.M. A simultaneous multiphase approach to determine P-Wave and S-Wave attenuation of the crust and upper nantle. Bull. Seismol. Soc. Am. 2009, 99, 3314–3325. [Google Scholar] [CrossRef]
  31. Yildinm, E.; Gulbag, A.; Horasan, G.; Dogan, E. Discrimination of quarry blast and earthquakes in the vicinity of Istanbul using soft computing techniques. Comput. Geosci. 2011, 37, 1209–1227. [Google Scholar]
  32. Ford, S.R.; Walter, W.R. Aftershock characteristics as a means of discriminating explosions from earthquakes. Bull. Seismol. Soc. Am. 2010, 100, 364–376. [Google Scholar] [CrossRef]
  33. Kuyuk, H.S.; Yildirim, E.; Dogan, E.; Horasan, G. Application of k-means and Gaussian mixture model for classification of seismic activities in Istanbul. Nonlinear Process. Geophys. 2012, 19, 411–419. [Google Scholar] [CrossRef] [Green Version]
  34. Shin, J.S.; Sheen, D.H.; Kim, G. Regional observations of the second North Korean nuclear test on 2009 May 25. Geophys. J. Int. 2010, 180, 243–250. [Google Scholar] [CrossRef] [Green Version]
  35. Zhang, H.; Yao, H.; Chen, X.; Huang, S.S.; Mou, J.Y. Progress in identification and formation mechanism of mine seismicity. Recent Dev. World Seismol. 2014, 3, 4–12. [Google Scholar]
  36. Yang, F.; Zhu, J.J.; Liu, Z.; Wu, B. Study on Identification Methods between Earthquake and Explosions occurred in Guangdong Region. Southchina J. Seismol. 2016, 36, 110–115. [Google Scholar]
  37. Wang, T.T.; Yian, B.J.; Zhang, B. The comprehensive identification methods between earthquakes and explosions. Prog. Geophys. 2013, 28, 2433–2443. [Google Scholar]
  38. Zhang, L.F.; Liao, W.L.; Zeng, X.S.; Zhon, Y.Y. Analysis if time-frequency characteristics of wave spectrum betweet tectonic natural and mine earthquake. Seismol. Geol. 2009, 31, 699–707. [Google Scholar]
  39. Wang, T.T. The Recognized Criteria and Methods Research on Earthquakes and Explosions Identification. Master’s Thesis, Institute of Geophysics, China Earthquake Administration, Beijing, China, 2012. [Google Scholar]
  40. Zhang, J.Y.; Wang, X.; Hwang, H.J.; Yi, W.J. Energy-based dynamic parameter identification for Pasternak foundation model. Earthq. Eng. Eng. Vib. 2021, 20, 631–643. [Google Scholar] [CrossRef]
  41. Huo, Z.Q.; Wang, J.; Zhang, J.C.; Yang, Y. Recognition Study on Earthquakes and Explosions in Jiangsu Area. China Earthq. Eng. J. 2015, 37, 232–234. [Google Scholar]
  42. Xu, S.X. Collection of Practical Research on Earthquake Prediction Methods-Seismological Special Edition; Academic Books and Periodicals Publishing House: Beijing, China, 1989; pp. 554–575. [Google Scholar]
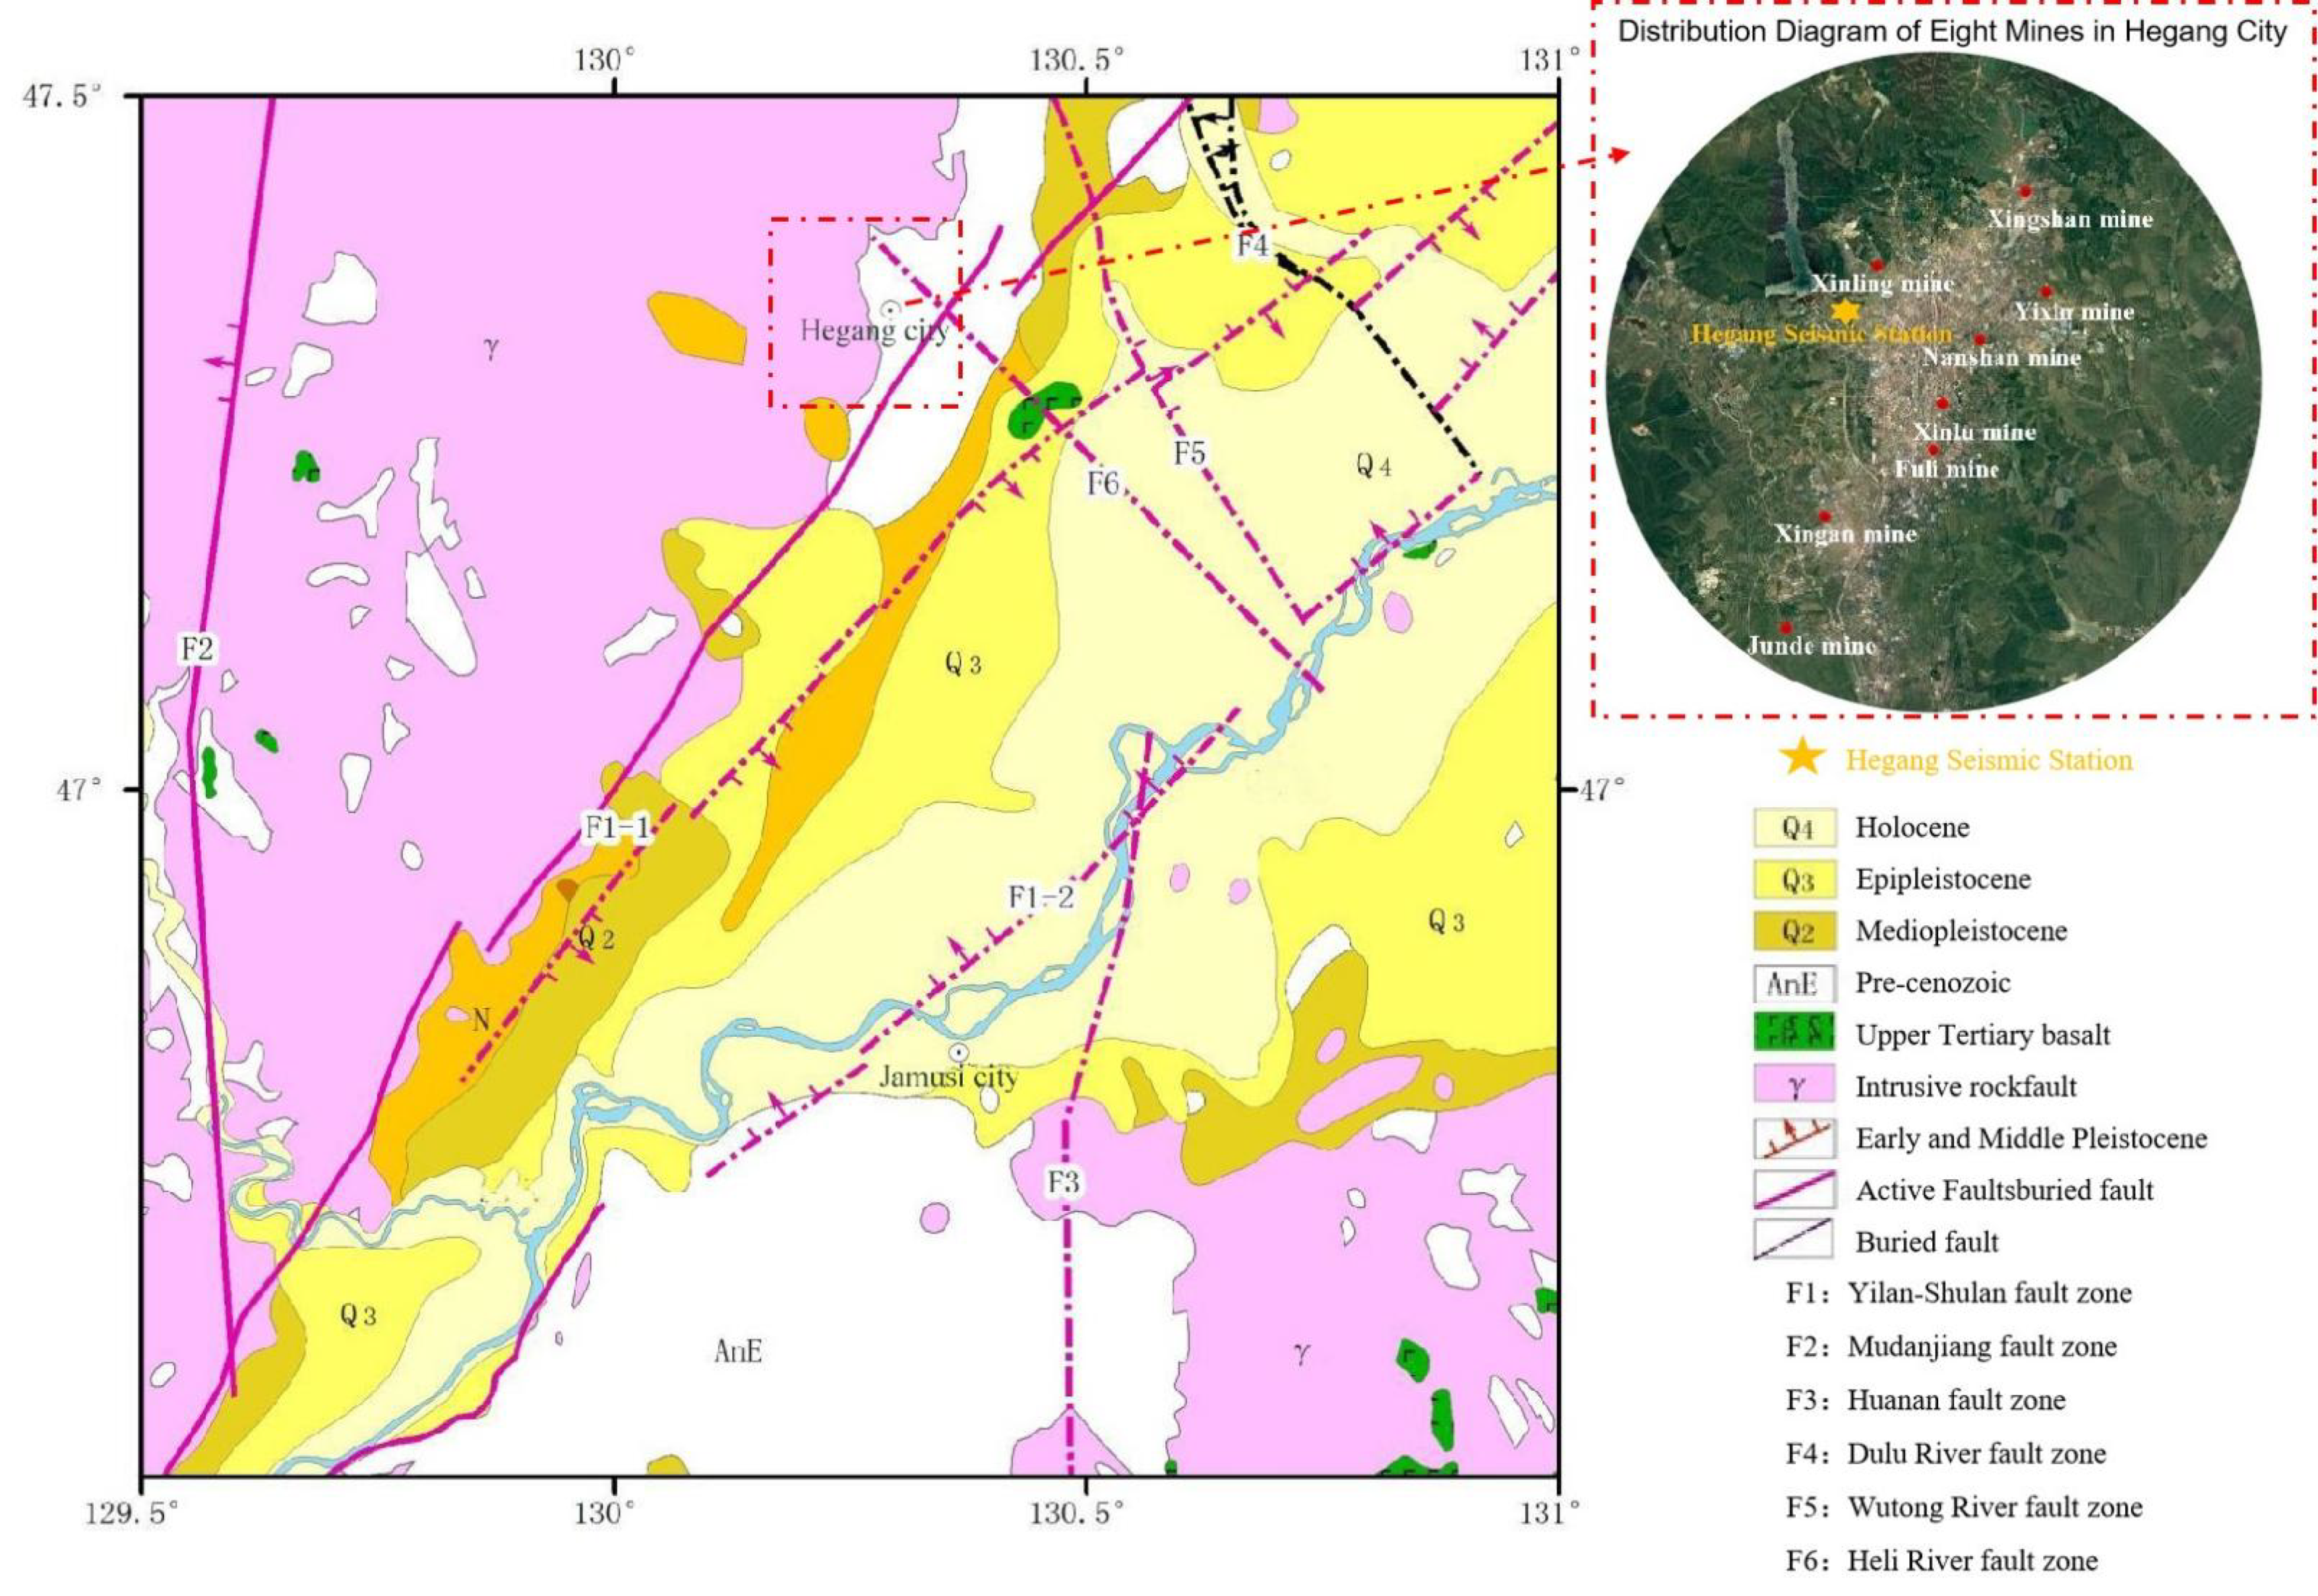
Figure 1. Seismic station layout schematic diagram.
Minerals 12 01256 g001
Figure 2. Accelerationtime history of earthquake events.
Minerals 12 01256 g002
Figure 3. Acceleration time history of mine earthquake events.
Minerals 12 01256 g003
Figure 4. Velocity time history of earthquake events.
Minerals 12 01256 g004
Figure 5. Velocity time history of mine earthquake events.
Minerals 12 01256 g005
Figure 6. Displacement time history of earthquake events.
Minerals 12 01256 g006
Figure 7. Displacement time history of mine earthquake events.
Minerals 12 01256 g007
Figure 8. Earthquake acceleration response spectrum.
Minerals 12 01256 g008
Figure 9. Mine earthquake acceleration response spectrum.
Minerals 12 01256 g009
Figure 10. Statistical chart of the predominant period of natural and mine earthquakes.
Minerals 12 01256 g010
Figure 11. Statistical chart of duration of natural and mine earthquakes.
Minerals 12 01256 g011
Figure 12. Schematic diagram of first motion direction of natural and mine earthquake P-wave. (a) Earthquake event 2009051801; (b) Earthquake event 20090520008; (c) mine earthquake event 2009103020.
Minerals 12 01256 g012
Figure 13. Fourier spectrum of natural and mine earthquakes. (a) Earthquake event 1 and mine earthquake event 7; (b) Earthquake event 2 and mine earthquake event 8; (c) Earthquake event 3 and mine earthquake event 9; (d) Earthquake event 4 and mine earthquake event 10; (e) Earthquake event 5 and mine earthquake event 11; (f) Earthquake event 6 and mine earthquake event 12.
Minerals 12 01256 g013aMinerals 12 01256 g013b
Figure 14. Contrast map of dominant frequency of natural and mine earthquakes. (a) Earthquake event 1 and mine earthquake event 7; (b) Earthquake event 2 and mine earthquake event 8; (c) Earthquake event 3 and mine earthquake event 9; (d) Earthquake event 4 and mine earthquake event 10; (e) Earthquake event 5 and mine earthquake event 11; (f) Earthquake event 6 and mine earthquake event 12.
Minerals 12 01256 g014
Figure 15. Statistical diagram of dominant frequency of natural and mine earthquakes.
Minerals 12 01256 g015
Figure 16. Sm/Pm Amplitude Comparison Map of Mine Earthquake and Earthquake.
Minerals 12 01256 g016
Figure 17. Ratio of P-wave maximum amplitude, S-wave maximum amplitude to duration. (a) Ratio of maximum amplitude and duration of P-wave (Pm/Tc); (b) Ratio of maximum amplitude and duration of S-wave(Sm/Tc).
Minerals 12 01256 g017
Figure 18. Discriminant Flow Chart of “Three-parameter Comprehensive Gradient Discrimination Method”.
Minerals 12 01256 g018
Table 1. Statistics of disasters in mining areas induced by earthquakes.
Occurrence Time of the Earthquake (GMT)Natural or Mine EarthquakeDisasters or Accidents in Coal MinesTime Interval
16 November 2000 to 2 December 2000Five earthquakes with magnitudes ML of no less than 3.0 (maximum magnitude ML = 4.1) occurred in two fault zones and surrounding areas where a coal mine was located.One gas explosionA few days
14 November 2001A strong earthquake with the magnitude of Ms 8.1 occurred in the west of Kunlun mountain pass.Five gas explosions in coal mines in Shanxi provinceA few hours
11:00 AM, 30 March 2003An earthquake with the magnitude of ML 4.1 occurred in Dongling, Shenyang, and 10 min later, an earthquake with the magnitude of ML 5.1 occurred in Bohai Bay.One gas explosion in the Mengjiagou coal mine in Fushun city30 min
06:49 AM, 14 February 2005A mine earthquake with the magnitude of ML 2.7 occurred.A huge gas explosion in the Sunjiawan coal mine14 min
12: 16 PM, 5 March 2010A mine earthquake with the magnitude of ML 1.2 occurred in Hegang.One gas explosion9 h and 44 min
08:59 PM, 9 January 2013A mine earthquake with the magnitude of ML 3.1 occurred in Hegang.Three gas overrun alarms14 min, 44 min and 1 h and 22 min
00:58 AM, 18 January 2013A mine earthquake with the magnitude of ML 3.0 occurred in Hegang.A gas overrun alarm in Shangyujiao of the Zongcai first team.About 4 h
17:31 PM, 26 November 2014A mine earthquake with the magnitude of ML 1.6 occurred between Wulong coal mine of Fuxin mine Co., Ltd. and Hengda Coal Industry Co. Ltd.One gas explosion and coal dust combustion accident in air return way in 5336 fully mechanized caving face of Hengda Coal Industry Co. Ltd.1 h and 4 min
11:33 AM, 15 December 2014An earthquake with the magnitude of ML 2.9 occurred in Junde mine.One gas explosion in Xiangyang mine27 h
6 May 2018An earthquake occurred in southern Poland with a focal depth of 11.9 km and a magnitude of ML 3.4 on the Richter scale.An accident in a coal mine near Jastrzebie-Zdroj, PolandA few hours
12:37 PM, 21 January 2016A mine earthquake with the magnitude of ML 3.8 occurred in Xingan mine in Hegang.Gas overrun alarms in Xinxing and Junde mine.33 min
01:33 PM, 16 January 2010A mine earthquake with the magnitude of ML 1.9 occurred.A water outburst at 676 hydraulic mining area, first area, floor 17, level 2 south, Hegang coal mine3 h and 47 min
Table 2. Instrument Model and Parameters of Hegang Seismic Station.
Station NameStation CodeStation BedrockSeismometerDigital
Mining
BandwidthSampling Rate/S Sensitivity
Frequency
Hegang StationHEGGraniteCTS-1EDAS-24L650 Hz—120 s1005 Hz
Table 3. Natural and mine earthquakes event information.
Serial NumberEvent TypeEarthquake
OccurrenceTime
Magnitude (ML)Hypocentraldepth/kmEpicenter Distance/kmP-TimeS-Time
1Earthquake16 March 2008 19:482.710.072.2119:48 17.98019:48 26.120
2Earthquake7 May 2008
01:23
2.210.061.1101:23 23.32001:23 31.70
3Earthquake22 September 2008 00:422.110.050.0000:42 28.77000:42 35.70
4Earthquake15 July 2014
22:44
2.410.061.1122:44 45.67022:44 53.160
5Earthquake23 October 2014 16:191.710.050.0016:10 44.89016:10 59.720
6Earthquake16 September 2014 03:142.210.061.1103:14 32.58003:14 39.660
7Mine earthquake6 March 2008 04:462.40.59.4404:46 17.66004:46 18.750
8Mine earthquake8 March 2008 16:132.00.58.3316:13 43.37016:13 44.420
9Mine earthquake3 November 2009 23:382.00.510.5523:38 08.3023:38 09.330
10Mine earthquake7 November 2009 22:502.10.513.8922:50 02.89022:50 04.610
11Mine earthquake17 March 2010 16:221.70.59.4416:22 11.530 16:22 12.610
12Mine earthquake8 October 2011 03:572.10.57.2203:57 10.51003:57 11.450
Table 4. Amplitude parameters of natural and mine earthquakes.
Serial
Number
Event TypeEarthquake Occurrence TimePGA (cm/s2)PGV (cm/s)PGD (um)PGV/PGA
1Earthquake16 March 2008 19:480.0430.00070.420.016
2Earthquake7 May 2008 01:230.0490.00060.420.012
3Earthquake22 September 2008 00:420.0540.00060.660.011
4Earthquake15 July 2014 22:440.0560.00080.390.014
5Earthquake23 October 2014 16:190.0080.000170.060.021
6Earthquake16 September 2014 03:140.0300.00050.160.017
7Mine earthquake6 March 2008 04:460.0200.00171.490.085
8Mine earthquake8 March 2008 16:130.0110.00080.870.073
9Mine earthquake3 November 2009 23:380.0130.00060.800.046
10Mine earthquake7 November 2009 22:500.0120.00090.770.075
11Mine earthquake17 March 2010 16:220.0250.00101.040.040
12Mine earthquake8 October 2011 03:570.0130.00050.600.039
Table 5. Statistical table of the predominant period of natural and mine earthquakes.
Event TypeNumber of Events (Piece)Mean ValueStandard DeviationCoefficient of Variation
Earthquake 1500.0640.0230.361
Mine earthquake 2000.1310.0690.526
Table 6. Identification results of key identification parameters.
Key Identification ParametersEvent CategoryTotalCorrect
Identification Number
Misidentification NumberCorrect
Identification Rate (%)
Actual Threat Rate (dr)/%Apparent Threat Rate (d)/%
Dominant
frequency
Earthquake6056495.790.897.5
Mine earthquake80782
Pm/TcEarthquake6056491.483.390.0
Mine earthquake80728
Sm/TcEarthquake6054693.686.396.3
Mine earthquake80773
Table 7. Evaluation Index of “Three-parameter Comprehensive Gradient Discrimination Method”.
Event CategoryTotalCorrect
Identification Number
Misidentification NumberCorrect Identification
Rate (%)
Actual Threat Rate (dr)/%Apparent Threat Rate (d)/%
Earthquake6059199.398.4100.0
Mine earthquake80800
Publisher’s Note: MDPI stays neutral with regard to jurisdictional claims in published maps and institutional affiliations.