Article

Colour Quality Evaluation of Bluish-Green Serpentinite Based on the CIECAM16 Model

School of Gemmology, China University of Geosciences (Beijing), Beijing 100083, China
*
Author to whom correspondence should be addressed.
Minerals 2022, 12(1), 38; https://doi.org/10.3390/min12010038
Submission received: 13 November 2021 / Revised: 21 December 2021 / Accepted: 22 December 2021 / Published: 28 December 2021
(This article belongs to the Special Issue Colours in Minerals and Rocks)

Abstract

:
The CIECAM16 colour appearance model is currently a model with high prediction accuracy. It can solve the problem of predicting the influence of different observation conditions on the colour of gemstones. In this study, a computer vision system (CVS) was used to measure the colour of 59 bluish-green serpentinite samples, and the tristimulus values were input into the CIECAM16 forward model to calculate the colour appearance parameters of serpentinite under different surrounds, illuminances, and light sources. It was found that the darkening of the surround causes the lightness and brightness to increase. Pearson’s r of brightness and colourfulness with illuminance is 0.885 and 0.332, respectively, which predicts the Stevens and Hunt effects. When the light source changes from D65 to A, the calculated hue angle shifts to the complementary area of the A light source, which is contrary to the CVS measurement result. The D65 light source is more suitable for the colour presentation and classification of bluish-green serpentinite.

1. Introduction

Serpentinites are mainly composed of the serpentine mineral group, which includes hydrous phyllosilicates with an ideal chemical formula A3Si2O5(OH)4, where A is Mg, Fe2+, and Ni [1]. Serpentine mainly consists of a magnesium oxide octahedral sheet and a silicon–oxygen tetrahedral sheet, forming a closely connected layered structure [2]. According to the different arrangements of these layers, serpentine can be divided into three main serpentine-type minerals: lizardite, antigorite, and chrysotile [3]. Many scholars have used infrared spectroscopy, Raman spectroscopy, X-ray powder diffractometry, and other analytical methods to study the mineralogical and petrological characteristics of serpentinites [4,5]. Their deposits are widely distributed around the world. Among the most important varieties, we have Williamsite in America, Bowenite in New Zealand, and Xiuyan jade in China. According to the different formation mechanisms of serpentinite, it can be divided into two deposit types. One is formed in the hydrothermal metasomatic deposit, where Si-rich fluids react with Mg-rich dolomitic marble rocks at a medium temperature, such as Xiuyan jade [6,7,8] and Luchuan jade [9]. The other is mainly formed by the metasomatism of ultramafic rocks (e.g., dunite, containing mainly olivine) at a low–medium temperature, such as Taishan jade. The first type often contains high contents of SiO2, medium contents of MgO, and low contents of Al2O3 and total Fe, while the second type is characterised by a higher amount of Fe, Cr, and Ni [6,10].
In ancient times, serpentinite was widely used in jewellery, decoration, and carving materials in the Mediterranean area, Asia, Oceania, and America [
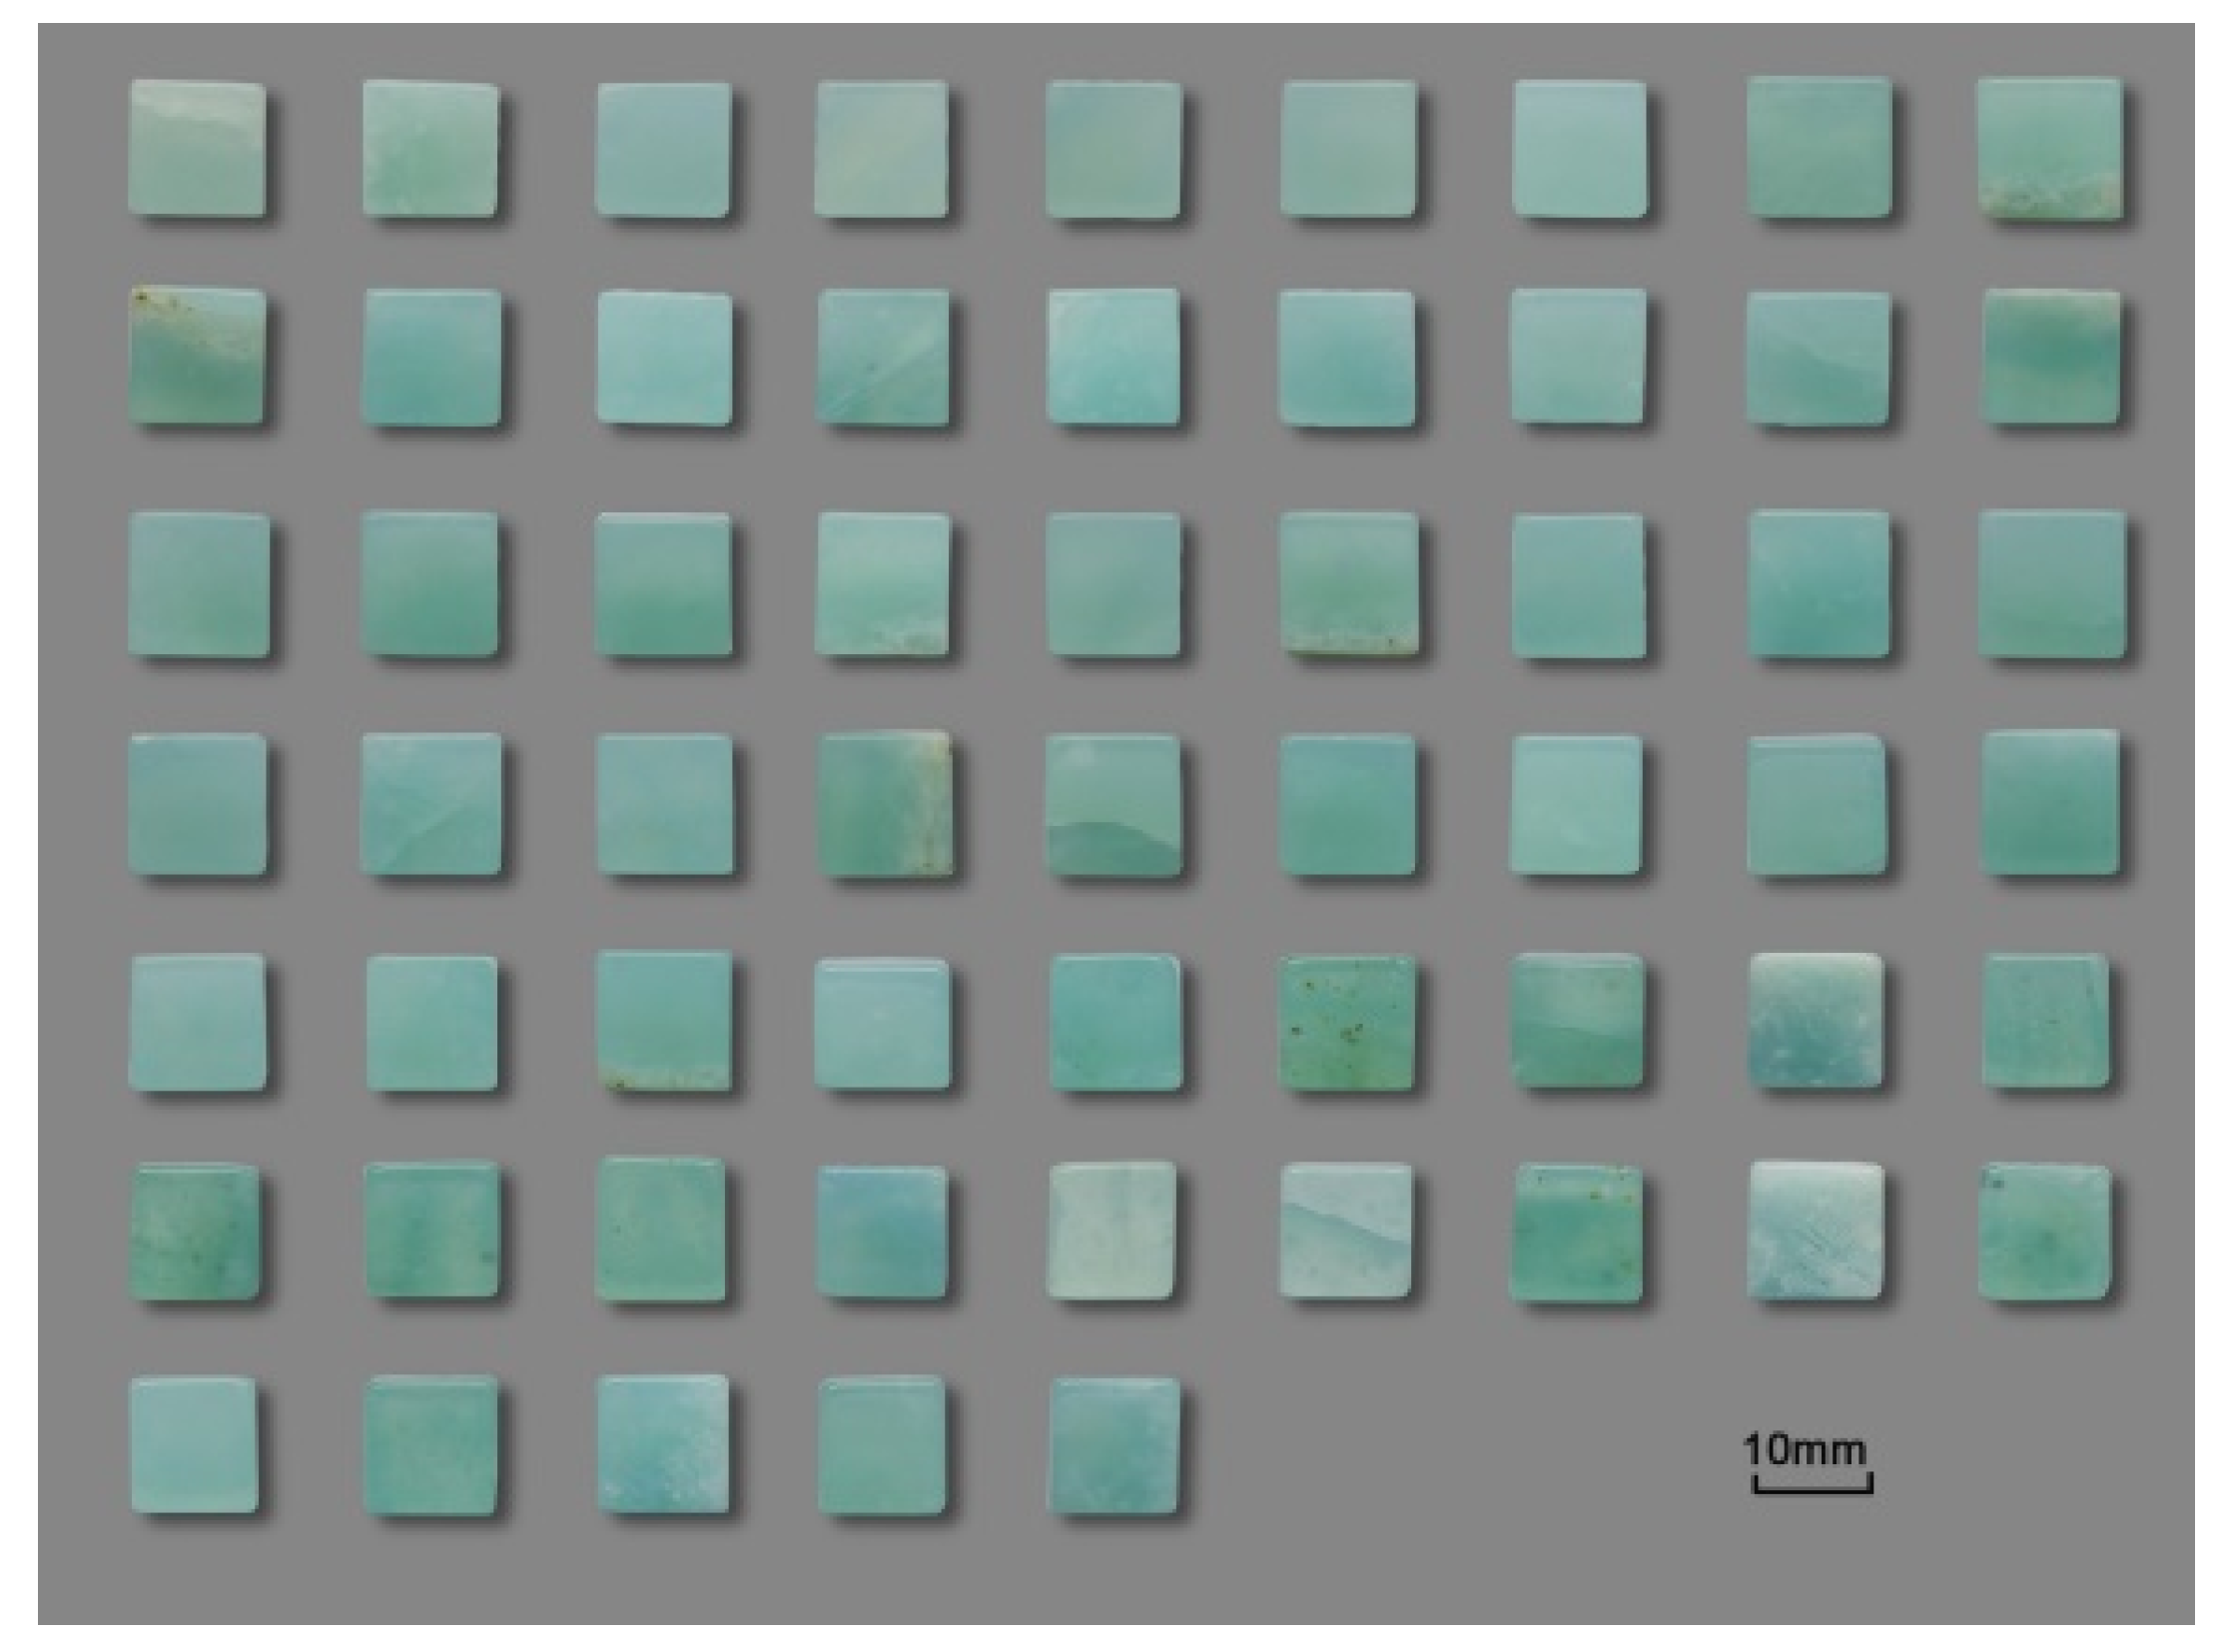
11]. It is valued for its typical yellowish-green and olive-green appearance, waxy lustre, and fine aphanitic structure. In recent years, a new type of gem-quality serpentinite called Tianqing Dong has appeared in the jade markets of China, and it was used to imitate jadeite when it first appeared. Unlike the other serpentinites that show a yellowish-green colour, it has a charming bluish-green hue, and there are few studies evaluating its quality.
At present, visual colourimetry, colour sequence systems, and CIE colourimetric systems are commonly used to evaluate the colour quality of gemstones. Visual colourimetric methods, such as Gem Dialogue and Gem Set, describe and grade colours by comparing them with standard colour samples [12,13]. This method is limited to two-dimensional space, and the plastic mould will age over time so that long-term use will lead to the deviation of observed colour. The colour sequence system arranges and names each colour according to specific rules. For example, GIA has used the Munsell system to form a set of independent and mature colour classification methods, such as yellow, pink, blue, and Cape series diamonds colour grading [14,15,16,17]. Many scholars studied the colour of gemstones based on the CIE1976 L*a*b* uniform colour space system, including jadeite [18], peridot [19,20], garnet [21,22,23], tourmaline [24,25], amethyst [26], and turquoise [27].
However, the traditional colourimetric theory cannot predict the complex colour appearance phenomena such as colour adaptation and colour contrast. Additionally, the subjective perception ability of human eyes is affected by the viewing conditions. Even though the two colours have the same tristimulus value, we will perceive them as different when the surround, background, lighting conditions, and other factors are different [28]. That is why the colour appearance model came into being. Since the early 1990s, researchers have conducted a series of psychophysical experiments and began to put forward various new colour appearance models, such as the Hunt model [29], the RLAB model [30], the LLAB [31] model, etc. [32]. In 1997, tc1-34 proposed a new CIECAM97s model after integrating the characteristics of the earlier models [33,34]. Then, this model was modified to obtain a new version, the CIECAM02 model [35]. Researchers have conducted a lot of research on its uniformity [36,37], computational defects [38], and prediction performance [39,
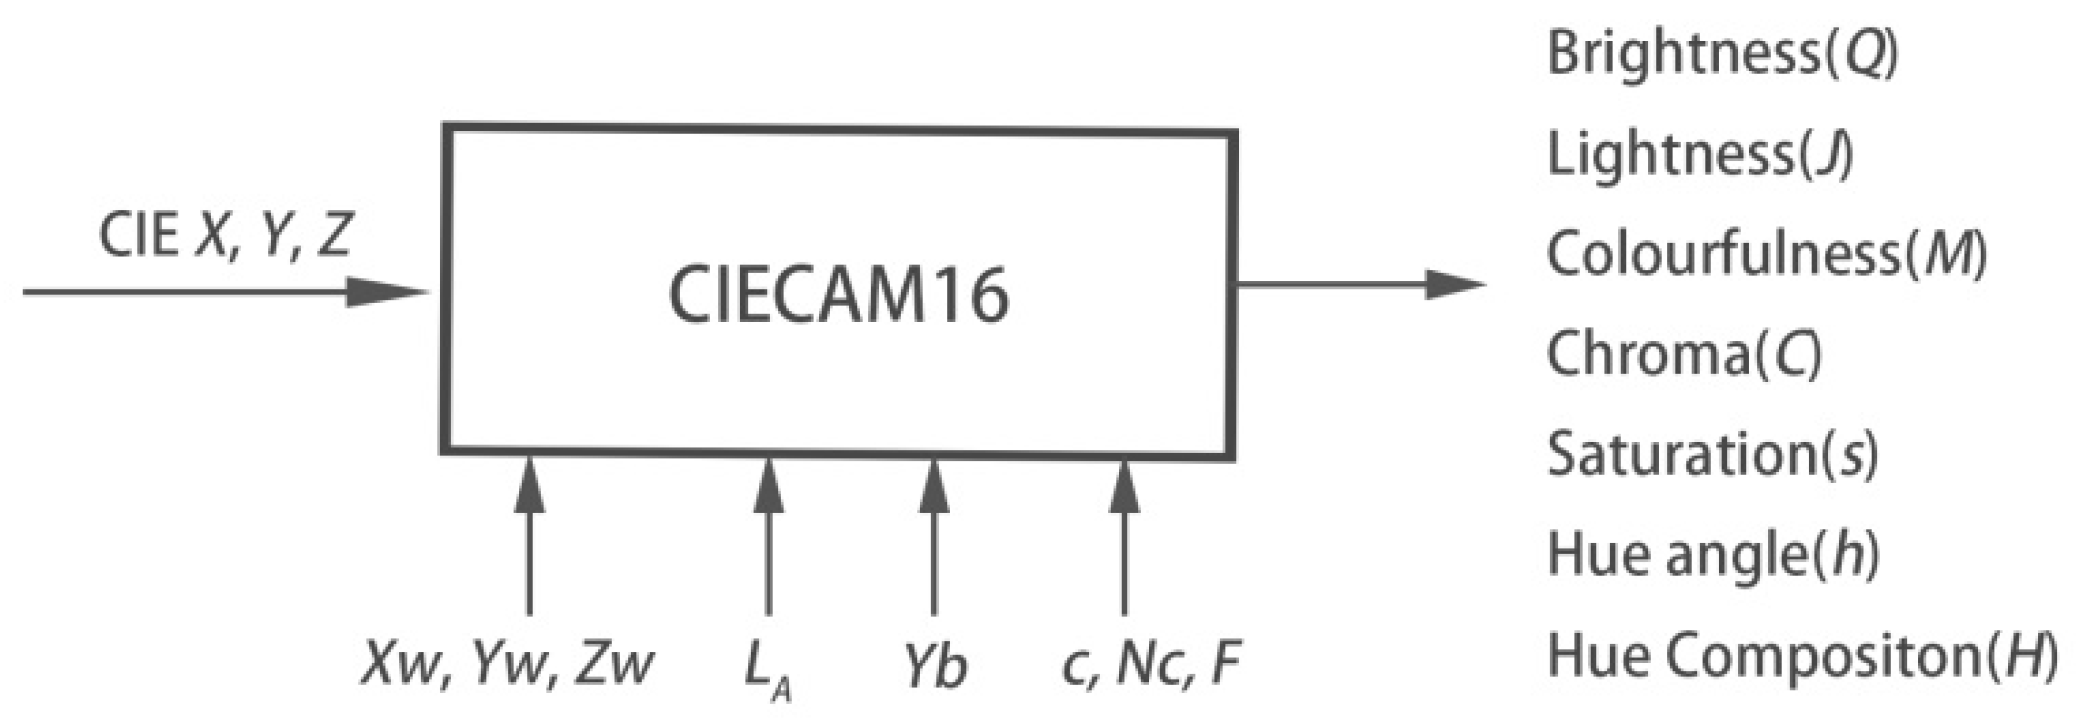
40], and the model has been widely used in the fields of medicine, textile, printing, etc. However, its calculation process is relatively complex, and its operational efficiency is rather low. Therefore, Li et al. improved it and proposed a new model, CIECAM16, with higher accuracy and simple calculation [41,42]. CIECAM16 modifies the transformation matrix in the CIECAM02 model and combines the chromatic adaptation and the cone response transformation to form a new space for easier computation [43]. The CIECAM16 model can accurately predict the corresponding colour datasets, especially regarding brightness, colour, and hue composition. Therefore, it is more suitable for the colour appearance attributes prediction of bluish-green serpentinite.
This paper discusses the colour appearance quality evaluation of the gem-quality bluish-green serpentinite based on the CIECAM16 model by calculating these parameters of samples under different surrounds, illuminances, and light sources.

2. Materials and Methods

2.1. Samples

For this study, a total of 59 natural bluish-green polished serpentinite samples were bought from the jewellery market in Xiuyan, Liaoning Province in China (Figure 1). The samples were cut into well-polished rectangular blocks with an average size of 11 mm × 11 mm × 8 mm to avoid the influence of size and thickness on its colour. The refractive index is 1.56–1.57, and the density is 2.570–2.596. The transition of charge from Fe2+ to Fe3+ generates the bluish-green colour, and the d-d electron transition of Fe3+ leads to the yellow colour, while Mn2+ has a certain impact on it [44,45]. The colour of bluish-green serpentinite is mainly caused by the charge transition from Fe2+ to Fe3+, resulting in a broad absorption band centred at 630 nm, generating a weak, bluish-green hue [46].
The optical microstructure shows that the samples are mainly composed of serpentine-type minerals. It is characterised by colourless, parallel, or near-parallel extinction, and the interference colour is first-grade greyish white to yellow. It has interpenetrating blades (Figure 2a) [47], and a few leaf-shaped serpentine-type minerals can be seen locally in directional arrangement (Figure 2b). The sample with finer particle size has a better texture and transparency than the others. The scanning electron microscope (SEM) images are shown in Figure 3. They have a curly and folded shape, and some of them have a lamellar crystallisation structure.
The main absorption peaks of the infrared spectra (FTIR) of the samples are 3674 cm−1, 1078 cm−1, 1050–960 cm−1, 632 cm−1, 563 cm−1, and 462 cm−1 (Figure 4), which is the typical spectral of antigorite. It splits into two weak absorption peaks in the range of 1050–960 cm−1. Lizardite has a flat crystal structure, making the Si-O tetrahedron have pseudohexagonal symmetry. So, the two in-plane vibrations are degenerate, and there is only a broad band in the region of 1050–960 cm−1. Chrysotile forms a coiled layer with octahedron sheets outside and tetrahedron sheets inside. It splits into two obvious absorption peaks in this region because its symmetry is the lowest. Antigorite is composed of octahedral and tetrahedral sheets alternately and reversely, forming a wavy curved structure. Therefore, it only has two weak absorption peaks in this region [48]. The bending vibration of Mg-O at 563 cm−1 shows a sharp peak in antigorite instead of a broad absorption band or a shoulder peak in chrysotile and lizardite [49].
The characteristic Raman peaks of antigorite occur at 230 cm−1, 373 cm−1, 461 cm−1, 685 cm−1, and 1045 cm−1 [50], and the Raman spectra of the samples are shown in Figure 5a. The peak at 230 cm−1 is the vibrations of O-H-O groups. O is the nonbridging oxygen atom of the tetrahedron SiO4, and H is the hydrogen atom of the OH group tilted toward an octahedral cation vacancy [51]. The peak at 373 cm−1 is the symmetric bending of tetrahedra SiO4. The peak at 685 cm−1 in antigorite is produced by the Si-Ob-Si stretching mode [52], while in chrysotile and lizardite, it shifts to about 690 cm−1. The antisymmetric Si-Ob-Si stretching modes cause a peak at 1045 cm−1, which can distinguish antigorite from chrysotile and lizardite [53]. Raman peaks of apatite at 964 cm−1 (Figure 5b) and talc at 195 cm−1, 362 cm−1, and 677 cm−1 (Figure 5c) are also found in some samples. In addition, other minerals such as dolomite and calcite are found in previous studies [46]. Therefore, according to the FTIR and Raman spectra, the bluish-green serpentinite samples are mainly composed of antigorite, including minor amounts of other minerals such as apatite, talc, dolomite, calcite, etc.

2.2. Methods

2.2.1. Background and Light Source

Munsell neutral grey colour chips contain 37 neutral grey colours with different lightnesses, ranging from N0.5 to N9.5. In this experiment, Munsell N9 was selected as the test background in a neutral environment.
A shadowless dome light source with a colour temperature of 6500 k was adopted in this experiment. Its interior was plated with a special diffuse reflective material so that the light could be evenly irradiated to the surface of samples. The light source was placed directly above the sample 9.5 cm away.

2.2.2. Colour Measurements

The computer vision system was adopted to measure the colour of gemstones (Figure 6) [54]. The lens of the industrial camera capturing images is Mako g-507c, with a resolution of 2464 (horizontal) by 2056 (vertical) and a frame rate of 23.7. It also has a sensor of CMOS-type Sony IMX264 and a global shutter. The camera was connected to IPC through the GigE interface, placed vertically above the sample, and then the distance between them was adjusted to 25 cm to obtain the most realistic colour.
We selected the areas of serpentinite with uniform colour and no inclusions for image capture, and the values of L*, a*, and b* were automatically converted and measured by using CKVisionBuilder V3.0 software (developed by Shenzhen CkVision Machine Vision Technology Co., Ltd., Shenzhen, China). Each sample was tested three times at different areas to obtain the average value and then converted into the colour tristimulus value X, Y, and Z using Colourtell software.

2.2.3. Colour Appearance Model

CIECAM16 forward model was used in this experiment (Figure 7) by inputting three tristimulus values X, Y, and Z and other variables, including the adaptive field white points Xw, Yw, and Zw, relative background brightness Yb, adaptive field luminance LA, and the surround parameters c (the impact of surround), Nc (a chromatic induction factor), and F (a factor determining the degree of chromatic adaptation). Then, after the steps of cone cell response transformation, colour adaptation transformation, and nonlinear compression processing, the colour appearance attribute parameters were calculated, including the brightness (Q), lightness (J), colourfulness (M), chroma (C), saturation (s), hue angle (h), and hue composition (H). The colour difference ΔE based on CAM16-UCS is given by the following equations [41]:
J = 1.7 J 1 + 0.007 J
M = ln ( 1 + 0.0228 M ) 0.022
a = M cos ( h )
b = M sin ( h )
h = h
The colour difference between the two samples can be computed as the Euclidean distance:
Δ E = ( Δ J ) 2 + ( Δ a ) 2 + ( Δ b ) 2
where Δ J , Δ a , and Δ b are the J′, a′, and b′ differences between two samples.
Δ E = 1.41 × ( Δ E ) 0.63
Figure 7. CIECAM16 model input and output parameters.
Minerals 12 00038 g007
The colour appearance properties of serpentinite samples were calculated under three different surrounds (average, dim, dark), five different illuminances (500 lx, 1000 lx, 1500 lx, 2000 lx, 2500 lx), and three different light sources (D65, D50, A). In the calculation, it was necessary to convert the illuminance E into the adaptive field luminance LA, and the formula is as follows:
L A = E 5 π
Thus, the LA values were 31.83 cd/m2, 63.66 cd/m2, 95.49 cd/m2, 127.32 cd/m2, and 159.16 cd/m2. The colour appearance parameters under different conditions are shown in Table 1 [41], and the parameters of the standard control group were D65 (Xw = 95.04, Yw = 100, Zw = 108.89), LA = 63.66 cd/m2, and Yb = 78.66, and the surround was average (c = 0.69, Nc = 1.0, F = 1.0). For example, when calculating the transformation of the surrounds, the values of the surround column are changed (c, Nc, and F), while the other parameters remain unchanged. The calculated data are shown in Tables S1–S3.

2.2.4. Statistical Analysis

The CIECAM16 model was written in Microsoft Office Excel. One-way ANOVA and Pearson’s correlation were used to analyse the influence of the transformation among different conditions on colour appearance attributes. All the data analysis was performed by using IBM SPSS statistics software (version 25, IBM, Armonk, NY, USA).

3. Results

3.1. Surround Changes

The colour appearance observed by the human visual system is not only related to the tristimulus itself but also to the field of view, which has four components: stimulus, proximal field, background, and surround. Surround refers to all areas outside the background, and the colour of gemstones we observe is also affected by its changes. According to the ratio of surround brightness to the average brightness of the field of view, there are three types of surrounds in the CIECAM16 model: average, dim, and dark. When the ratio is greater than 20%, the surround is average. When the ratio is zero, the surround is dark. For the same serpentinite sample, the colour observed in a bright and dark room will be slightly different.
One-way ANOVA was used to analyse the impact of surround change on colour appearance attributes, and the results are shown in Table 2. When the significance coefficient p is < 0.05, it is considered to have a significant impact. We observe that the surround change exerts a significant influence on lightness (J), brightness (Q), saturation (s), colourfulness (M), and chroma (C) but has no significant impact on hue composition (H) and hue angle (h). F represents the between-group variance, and the F of brightness is the largest (775.37), indicating that the surround change has the greatest impact on brightness Q. The increase rate of different colour appearance attributes is shown in Table 3, and the maximum brightness was 40.73%, while the lightness was 14.65%.

3.2. Illuminance Changes

Illuminance refers to the luminous flux of visible light received by an object per unit area. In this part, we calculated the colour appearance attributes under five illuminances: 500 lx, 1000 lx, 1500 lx, 2000 lx, and 2500 lx. One-way ANOVA was used to analyse the influence of illuminance change on the prediction of serpentinite colour appearance attributes, and the results are shown in Table 4. The change of illuminance had a significant impact on brightness (Q), colourfulness (M), and saturation (s). The between-group variance F value of brightness was the largest, indicating that illuminance change had the most significant impact on it. Pearson; correlation coefficients of Q and M were 0.885 and 0.332, while there was a negative correlation between illuminance and saturation, and its Pearson correlation coefficient was −0.670 (Table 5). Then, nonlinear fitting was performed for the relationship between illuminance and average saturation, and a function was obtained:
s ¯ = 46.61 2.54 ln ( L A 1.68 )   ( R 2 = 0.99 )

3.3. Light Source Changes

Li et al. formed a new uniform colour space CAM16-UCS based on the CIECAM16 model and proposed to use lightness (J), colourfulness (M), and hue angle (h) as the three-dimensional coordinates in this colour space [41]. When the light source was transformed from D65 to D50 and then to A, hue angle (h) and colourfulness (M) both increased significantly, while brightness (Q) decreased slightly. The colour difference ΔE of serpentinite samples under three light sources was calculated by using the CAM16-UCS colour difference formula (Equation (7)), and the results are shown in Table 6. The colour difference between D65 and A was 13.10. When the colour difference is greater than 6, the human eye can perceive it [55]. So, the colour of serpentinite samples changed apparently under different light sources.
The coefficient of variation (CV) can be used to measure the dispersion of the data distribution, and it was calculated according to Equation (10). The CV of hue angle and the colourfulness decreased gradually as the light source changed (Table 7), indicating that the colour distribution of serpentinite was more discrete under the D65 light source.
C V = σ μ
where σ is the standard deviation of samples, and μ represents the sample mean.
The chromaticity values of samples based on CIE1976 L*a*b* under two different light sources were measured by the computer vision system (CVS). It was found that the a* value decreased and the b* value increased under the A light source, and the chroma value decreased gradually. The hue angle also decreased, shifting to the yellow area, contrary to the result calculated by the CIECAM16 model. Meanwhile, the colour distribution area of the samples was also more concentrated under the A light source (Figure 8).

4. Discussion

4.1. Influence of Surround Change on Colour Appearance

When the surround changes from average to dim and then to dark, the lightness and brightness of serpentinite both increase gradually (Figure 9a), while the chroma, colourfulness, and saturation decrease with the gradual darkening of the environment, showing a negative correlation (Figure 9b). Compared with the darker light around, the sample will appear brighter to a certain extent. This is because human vision has the automatic colour balance function, which leads to lightness compensation. The growth rate of brightness is much higher than that of lightness. That may be due to the large field of view of the human eye, and it will be more affected by the surround, so the perception of brightness changes more clearly. Conversely, the chroma and colourfulness gradually decrease with the darkening of the environment. This is caused by the action of the cone cells and rod cells on the retina of the human eye. In the dark surround, rod cells play a major role and have only the perception of grey, causing the chroma and colourfulness of the sample in the dark surround to decrease accordingly. The sensitivity of rod cells tends to be saturated more easily in bright light. So, in the dark surround, they will be more sensitive to light changes, resulting in an obvious downward trend from dim to dark. However, bluish-green serpentinite belongs to low chroma (15.59–20.62). So, the overall trend of surround darkening on the decline of colourfulness and chroma is not obvious.
In average surround, the lightness perceived contrast among the 59 serpentinite samples is the largest. As the surround changes from average to dim to dark, the dark area will appear lighter while the change of light area is not obvious, resulting in a decrease in the lightness perceived contrast, which confirms the Bartleson–Breneman phenomenon. Bluish-green serpentinite belongs to medium and high lightness (42.29–71.94) and low chroma (15.59–20.62). So, it can present a charming bluish-green hue with higher saturation in average surround.

4.2. Influence of Illuminance Change on Colour Appearance

As illuminance increases, brightness increases and so does the difference between the highest and lowest brightness, resulting in a horn-like distribution of the shadowed portion. These results are consistent with the Stevens effect, i.e., that brightness increases with increasing illuminance. At the same time, under high illumination, the serpentinite colour contrast will be more pronounced because the dark colour will be darker, and the light colour will be brighter, increasing the perceived contrast. The colourfulness M also increases, which confirms the Hunt effect, whereby the colourfulness increases with increasing illuminance. However, when the illuminance rises to 2500 lx (LA = 159.16), the average colourfulness decreases slightly. The colour of samples measured by the CVS under three different illuminances of 500 lx, 1500 lx, and 2500 lx (LA = 31.83, 95.49, and 159.16) are consistent with the results predicted by the colour appearance model, indicating that the CIECAM16 model can predict the effect of illuminance change on the colour appearance of serpentinite (Figure 10).
Saturation is the colourfulness of a stimulus relative to its brightness, and it can be calculated in the CIECAM16 model with Equation (11). The increased range of colourfulness (Pearson’s r = 0.332) is much smaller than that of the brightness (Pearson’s r = 0.885), so the overall saturation of the sample shows a downward trend. For some gemstones with low lightness, such as dark blue sapphire, increasing illuminance can make them more attractive. However, bluish-green serpentinite has a high lightness and low chroma, and consequently, too high a illuminance level dilutes its colour. Therefore, it is not conducive to the presentation of bluish-green colour for serpentinite under high illuminance.
s = 100 × ( M Q ) 0.5

4.3. Influence of Light Source Change on Colour Appearance

The colour of the gemstone perceived by the naked eye depends not only on the tristimulus value of the sample itself but also on the colour of the light source [56]. The CIE standard defines three standard illuminants, D65, D50, and A [57]. D65 and D50 are used to simulate the sunlight, and D65 (colour temperature of 6500 K) is often used as a standard light source for international colour evaluation, while D50 (colour temperature of 5000 K) is recognised as the standard colour temperature in the world printing industry. Light Source A (colour temperature of 2856 K) is often used in family rooms and jewellery stores. The energy peaks of D65 and D50 are mainly concentrated in the bluish-green area, which is around 430–470 nm, and the peak value of D50 shifts more towards the red region than D65. In comparison, the spectral energy distribution of Light Source A is mainly concentrated in the red area, which is about 560–780 nm. Therefore, the colour of serpentinite is more bluish green under the D65 light source and more yellowish green under the A light source (Figure 11). The same results were obtained using the computer vision system (CVS) under different light sources (Figure 8).
However, the colour data calculated by the CIECAM16 model under different light sources are exactly opposite to the CVS measurement results (Figure 12). This is because human eyes can automatically correct the white balance of the colour. Our brain will perceive the colour of the surrounding light source and subtract it from the colour of the object. Therefore, when we observe the serpentinite samples under Light Source A, the calculated colour is more biased towards the complementary colour of this source, which is blue. However, serpentinite is an aggregate made up of tiny crystal particles that can reflect, refract, and scatter light, and it also exhibits a certain degree of transparency. Therefore, in real observation, the influence of the colour appearance phenomenon is very faint, and it is much less than the influence of the light source on the gem itself. That is why the hue of colour measured by the CVS is more inclined to the yellow area.
Consequently, the CIECAM16 model is not suitable for predicting the hue of serpentinite under different light sources. Under the light source D65, the colour of bluish-green serpentinite measured by CVS is closer to the sample, and the distribution is more dispersed, so it is more suitable for colour presentation and mineral quality classification.

5. Conclusions

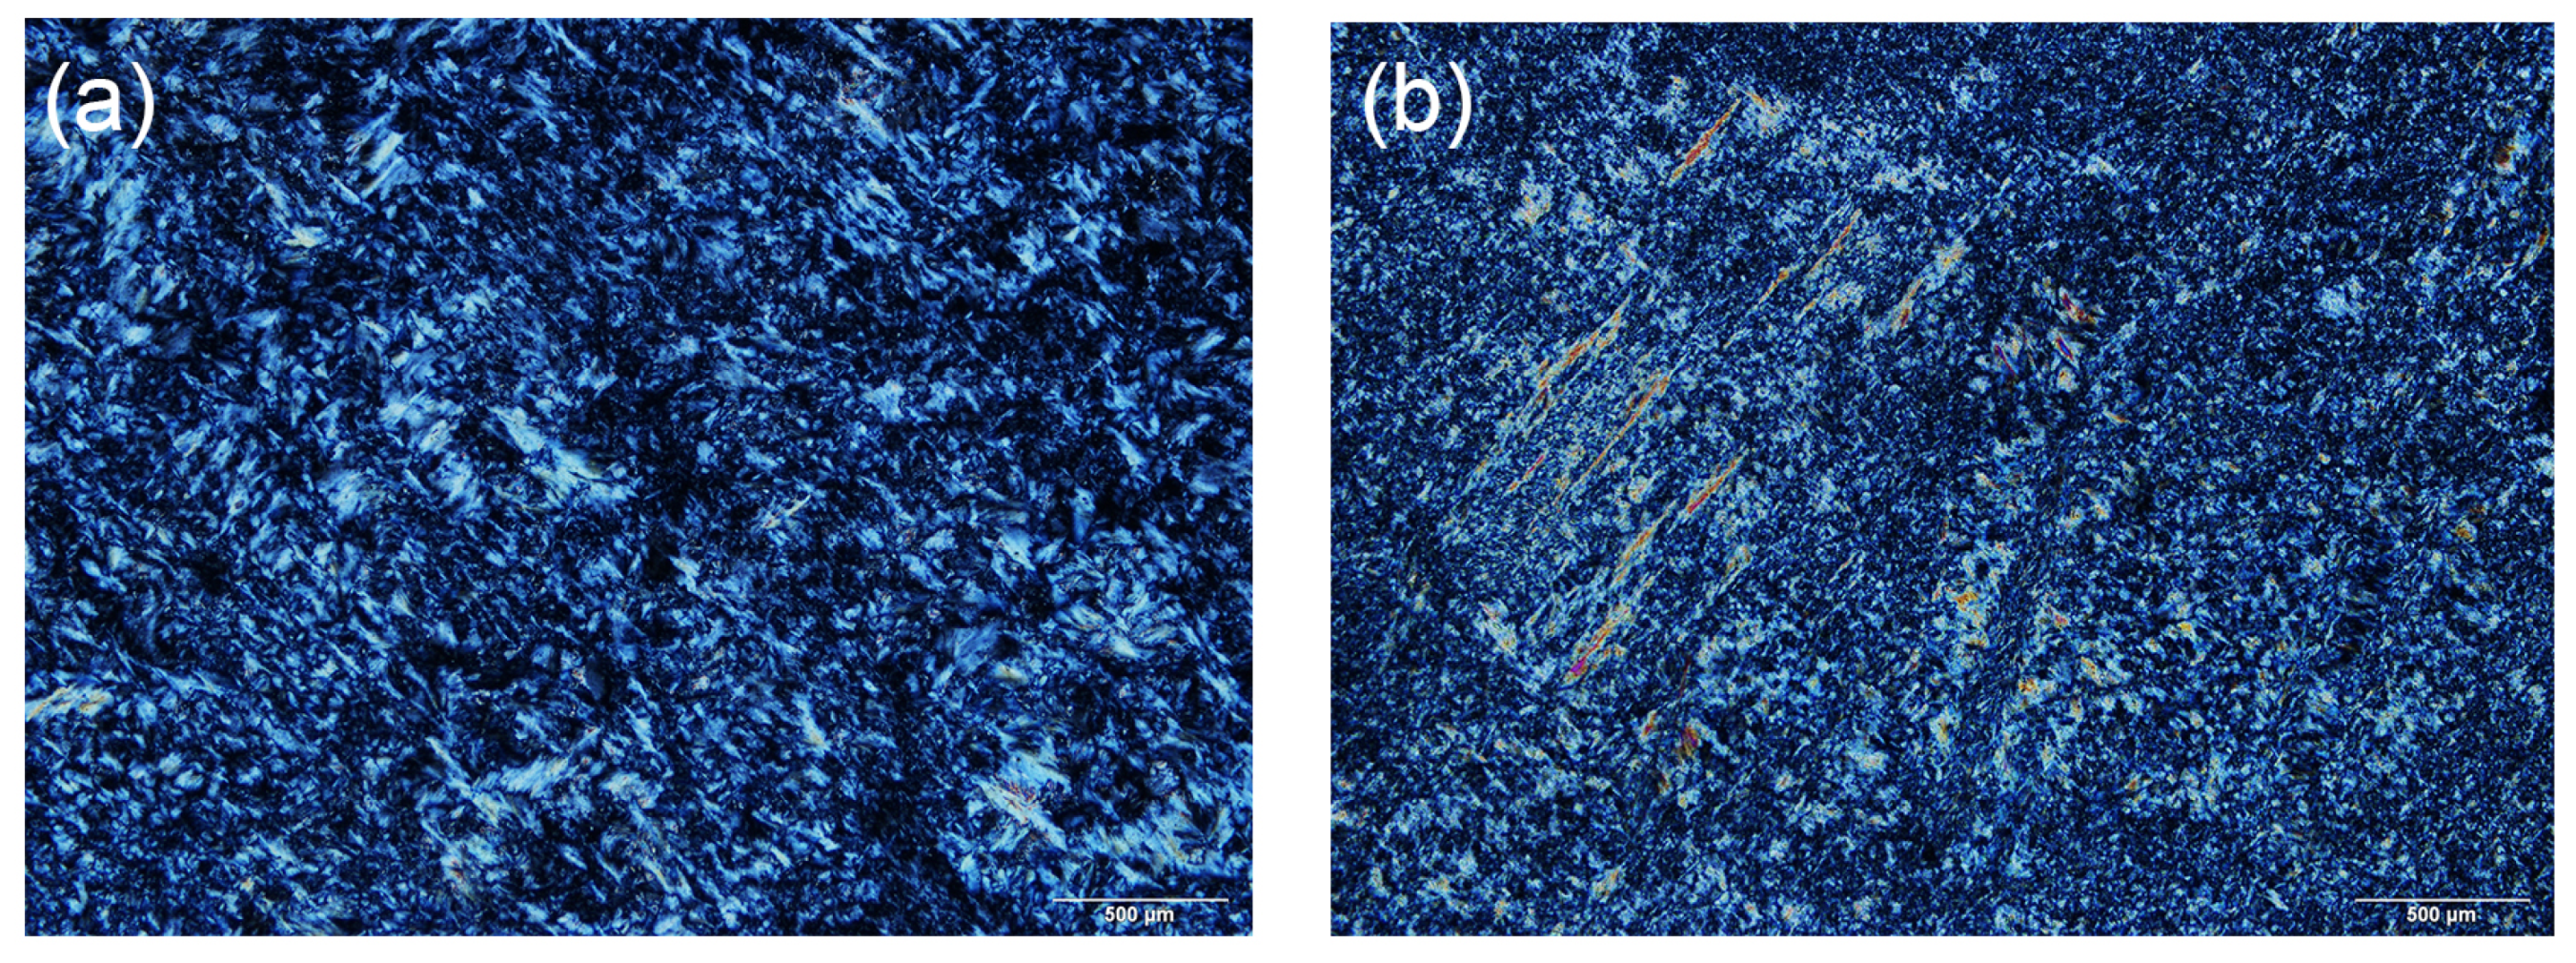
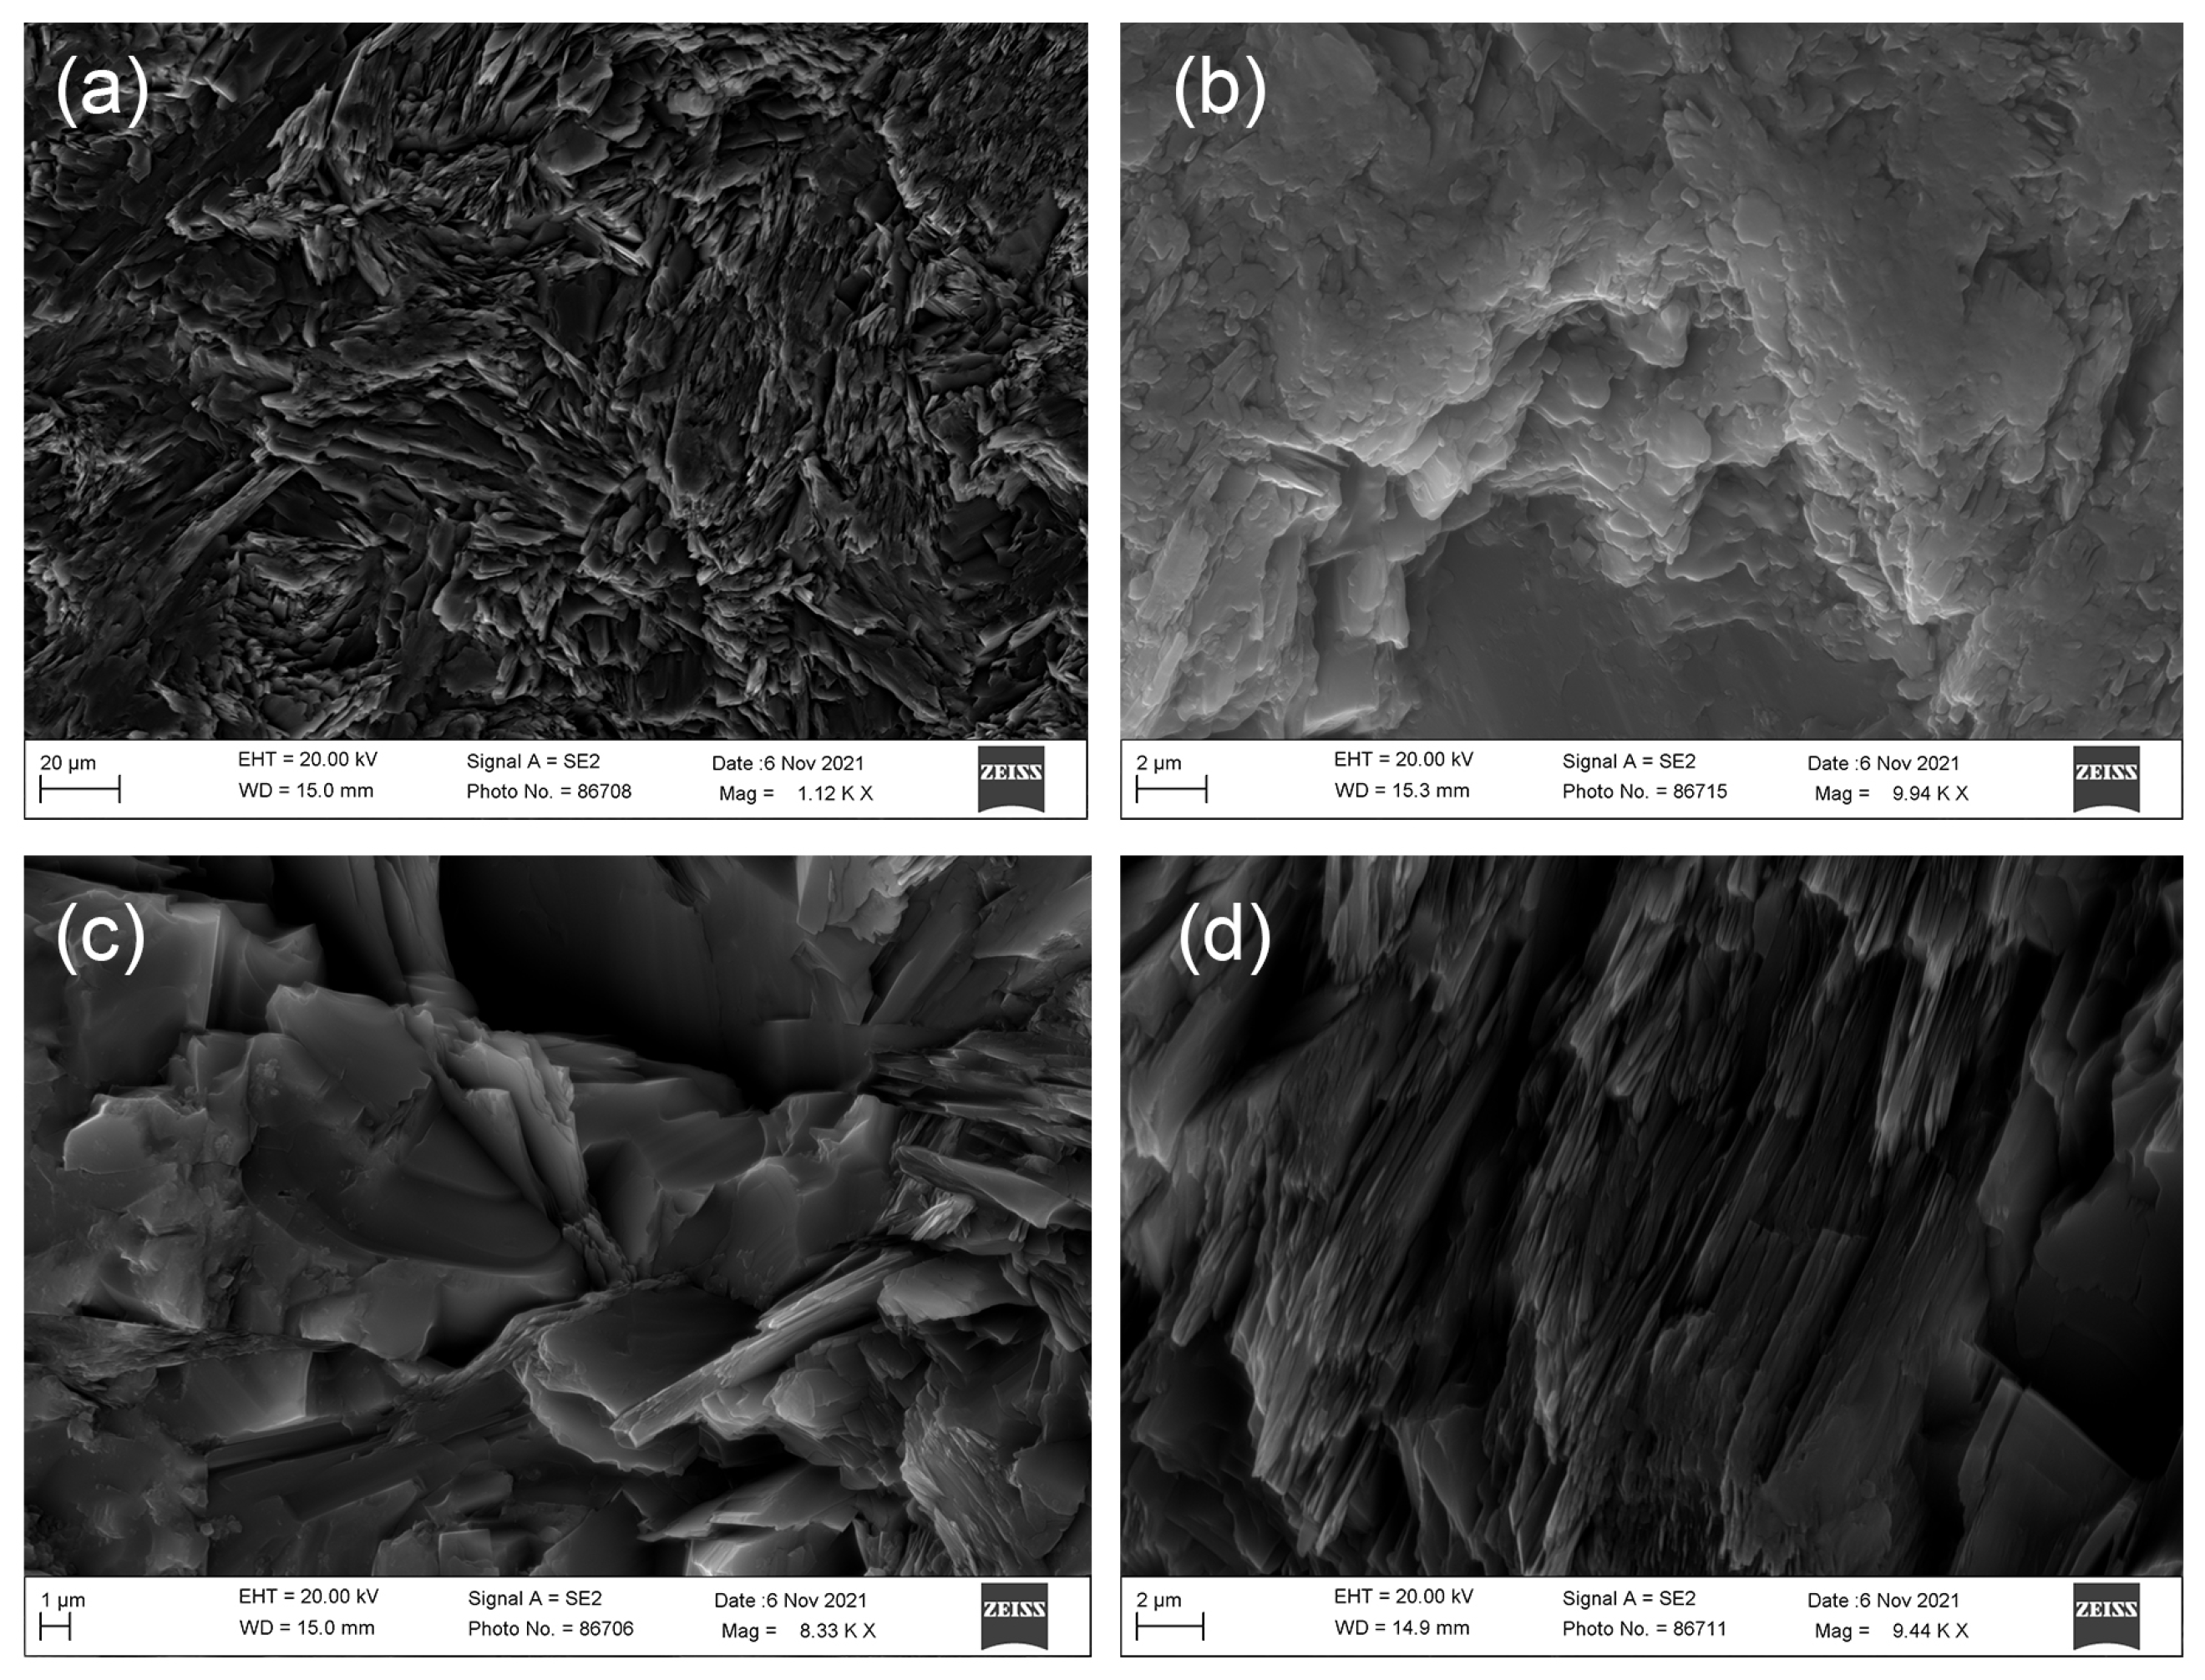
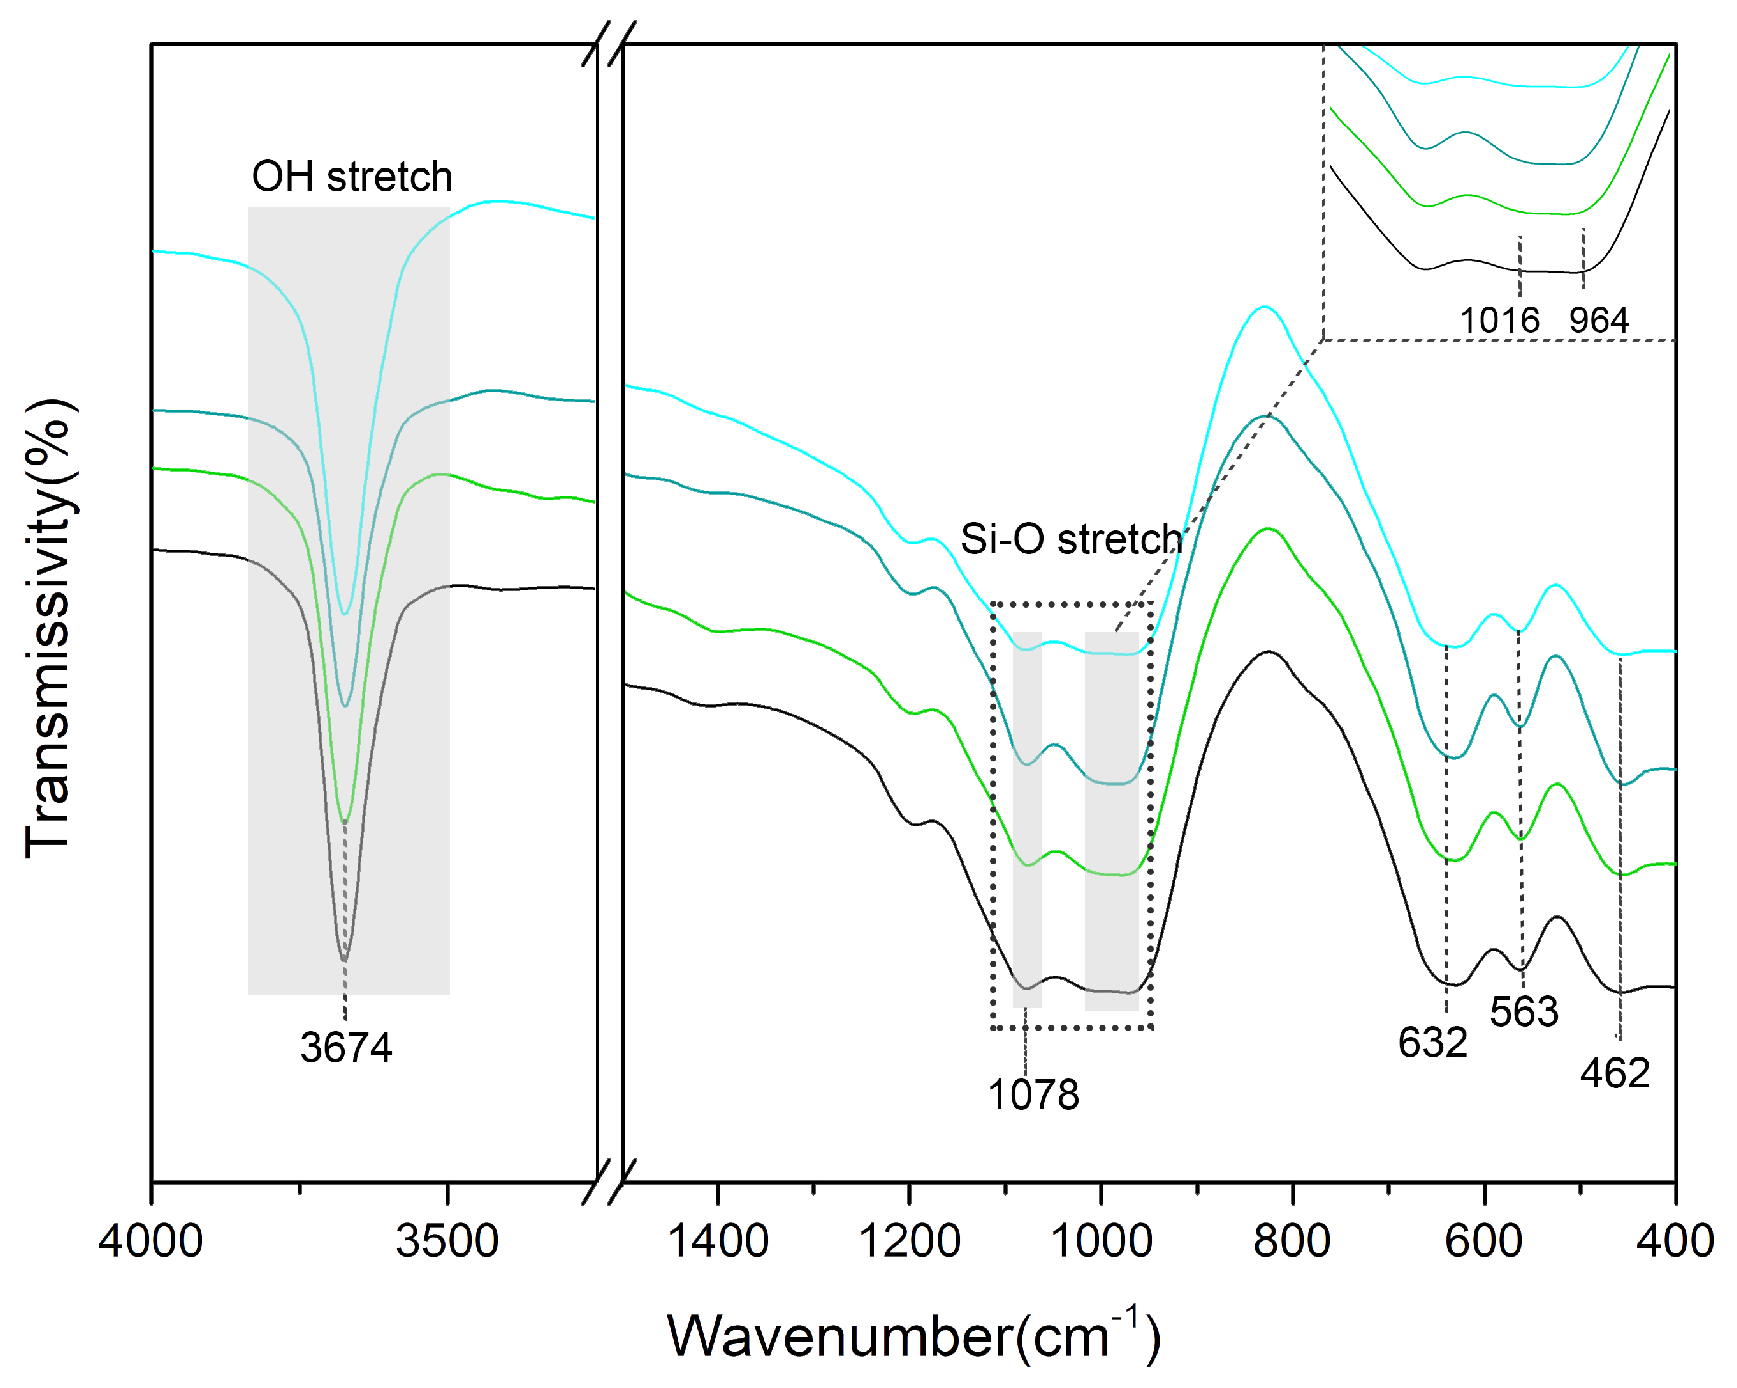
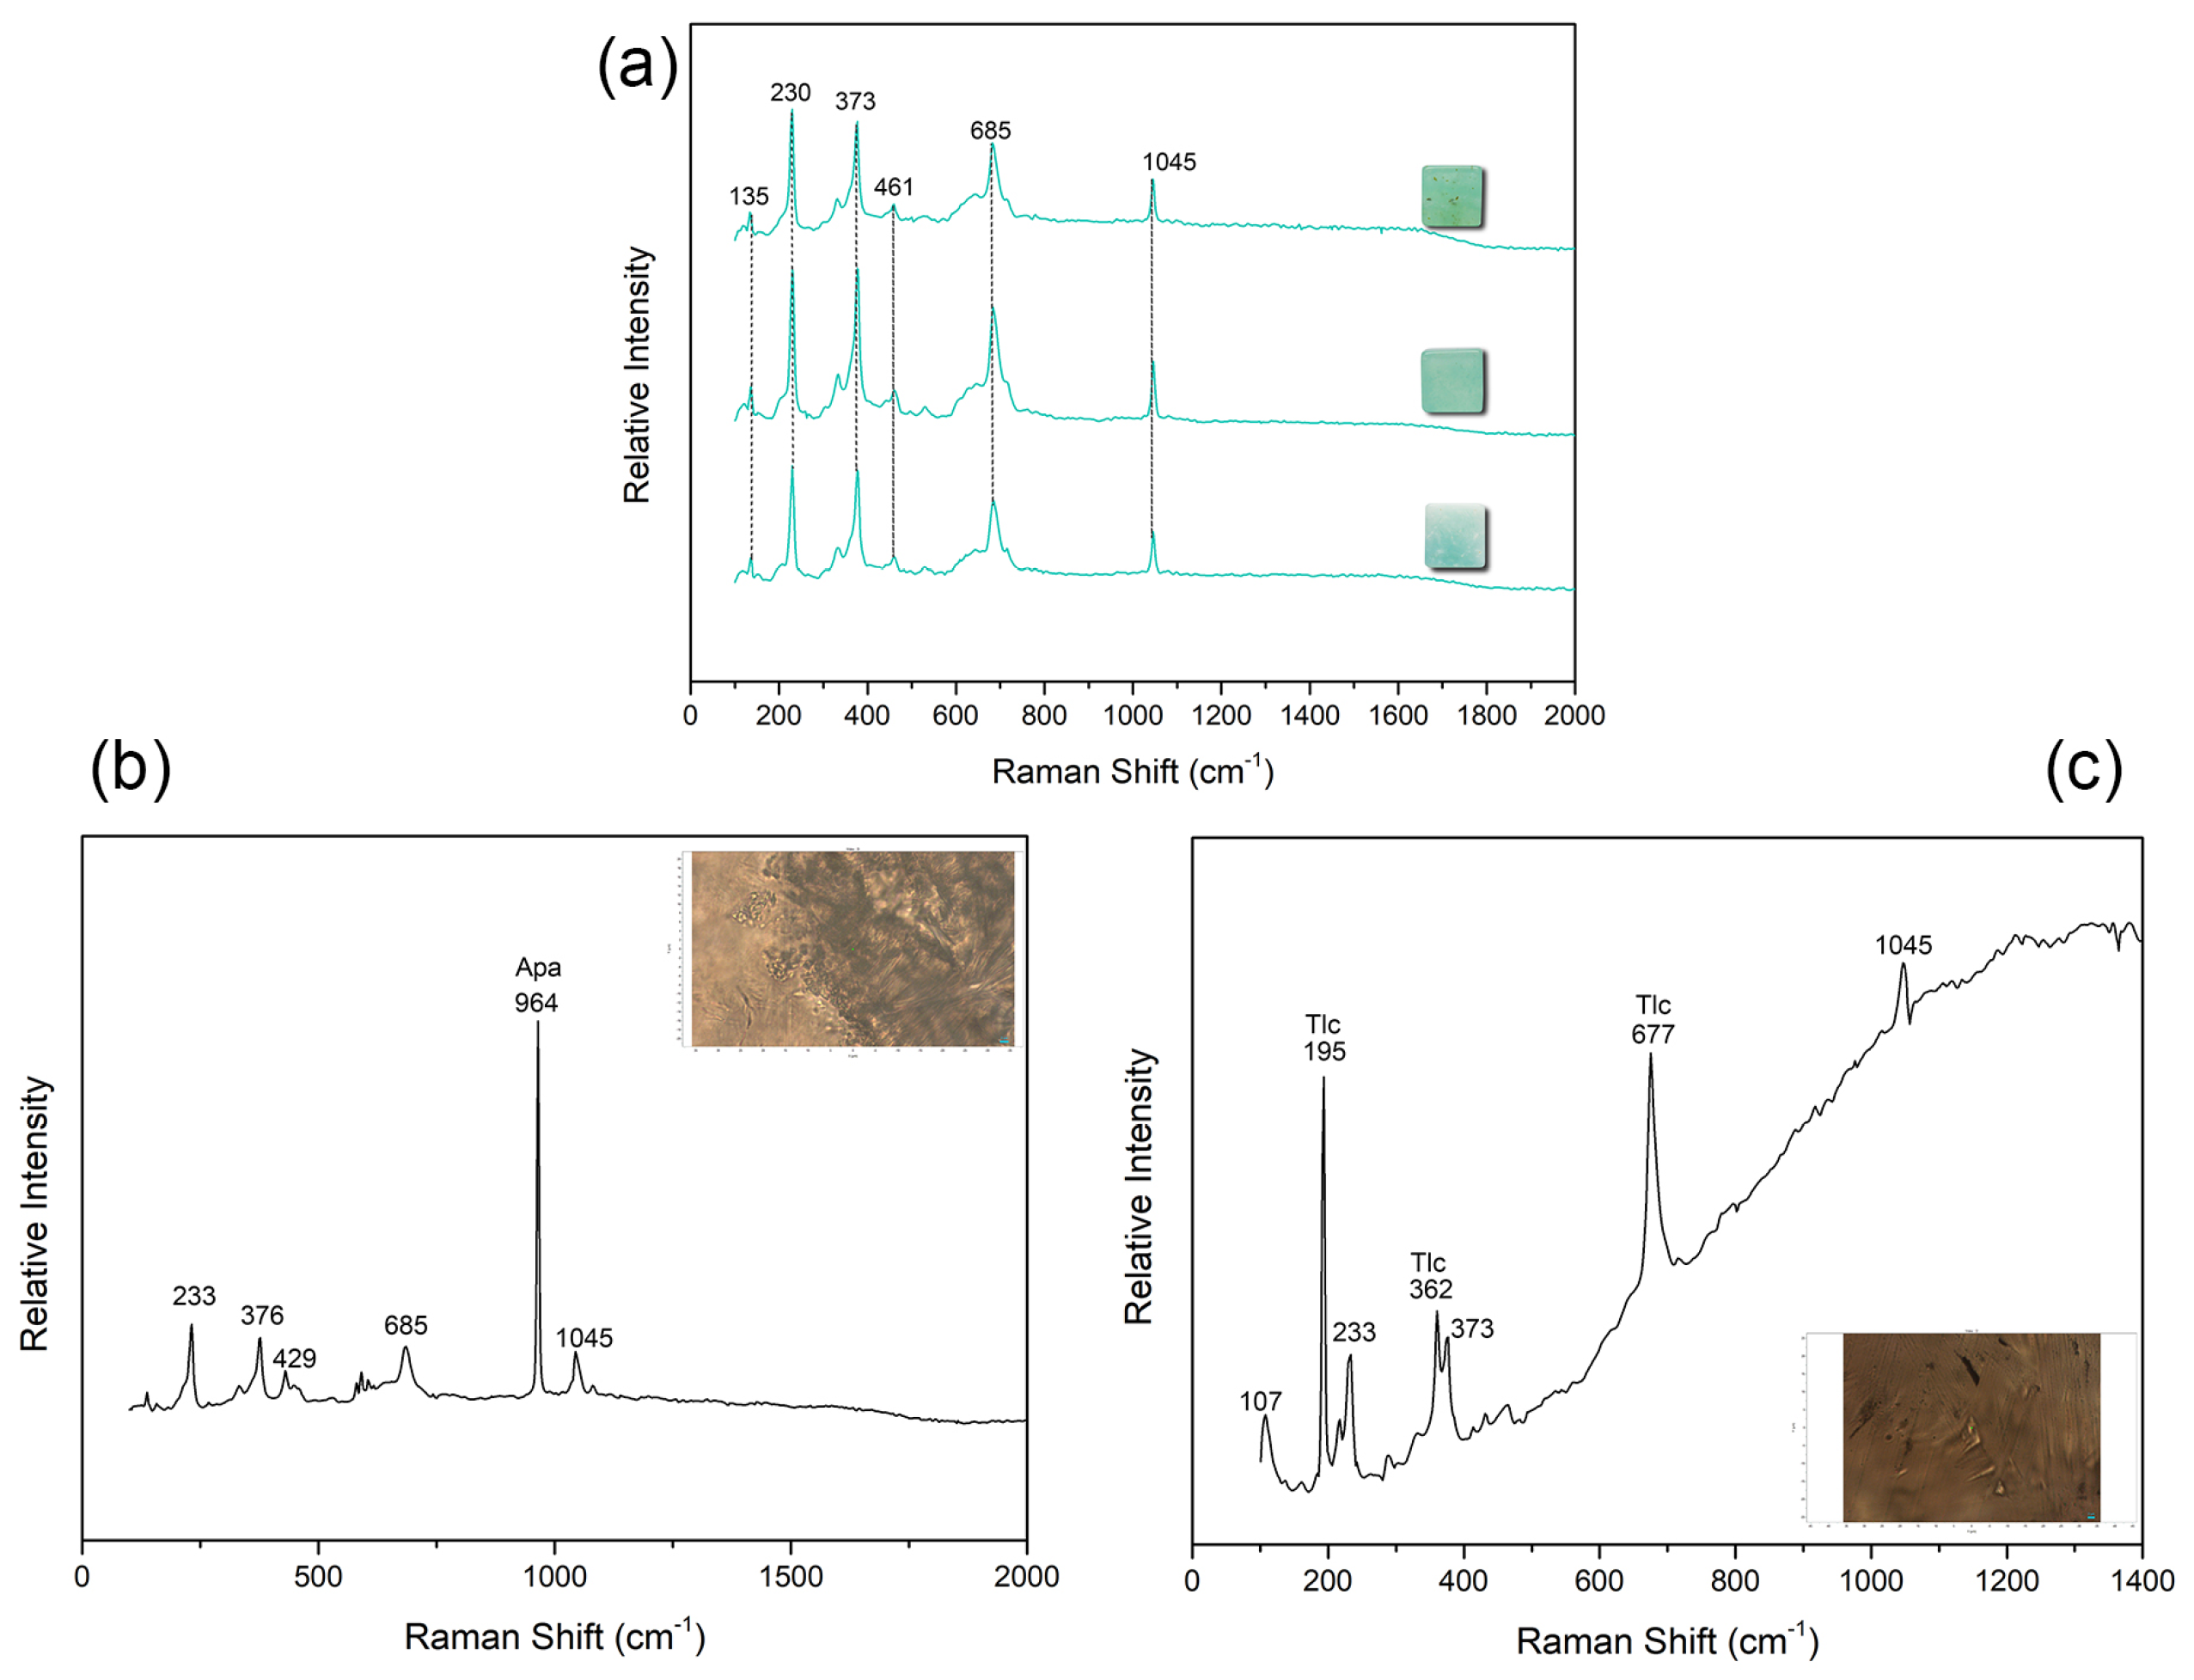
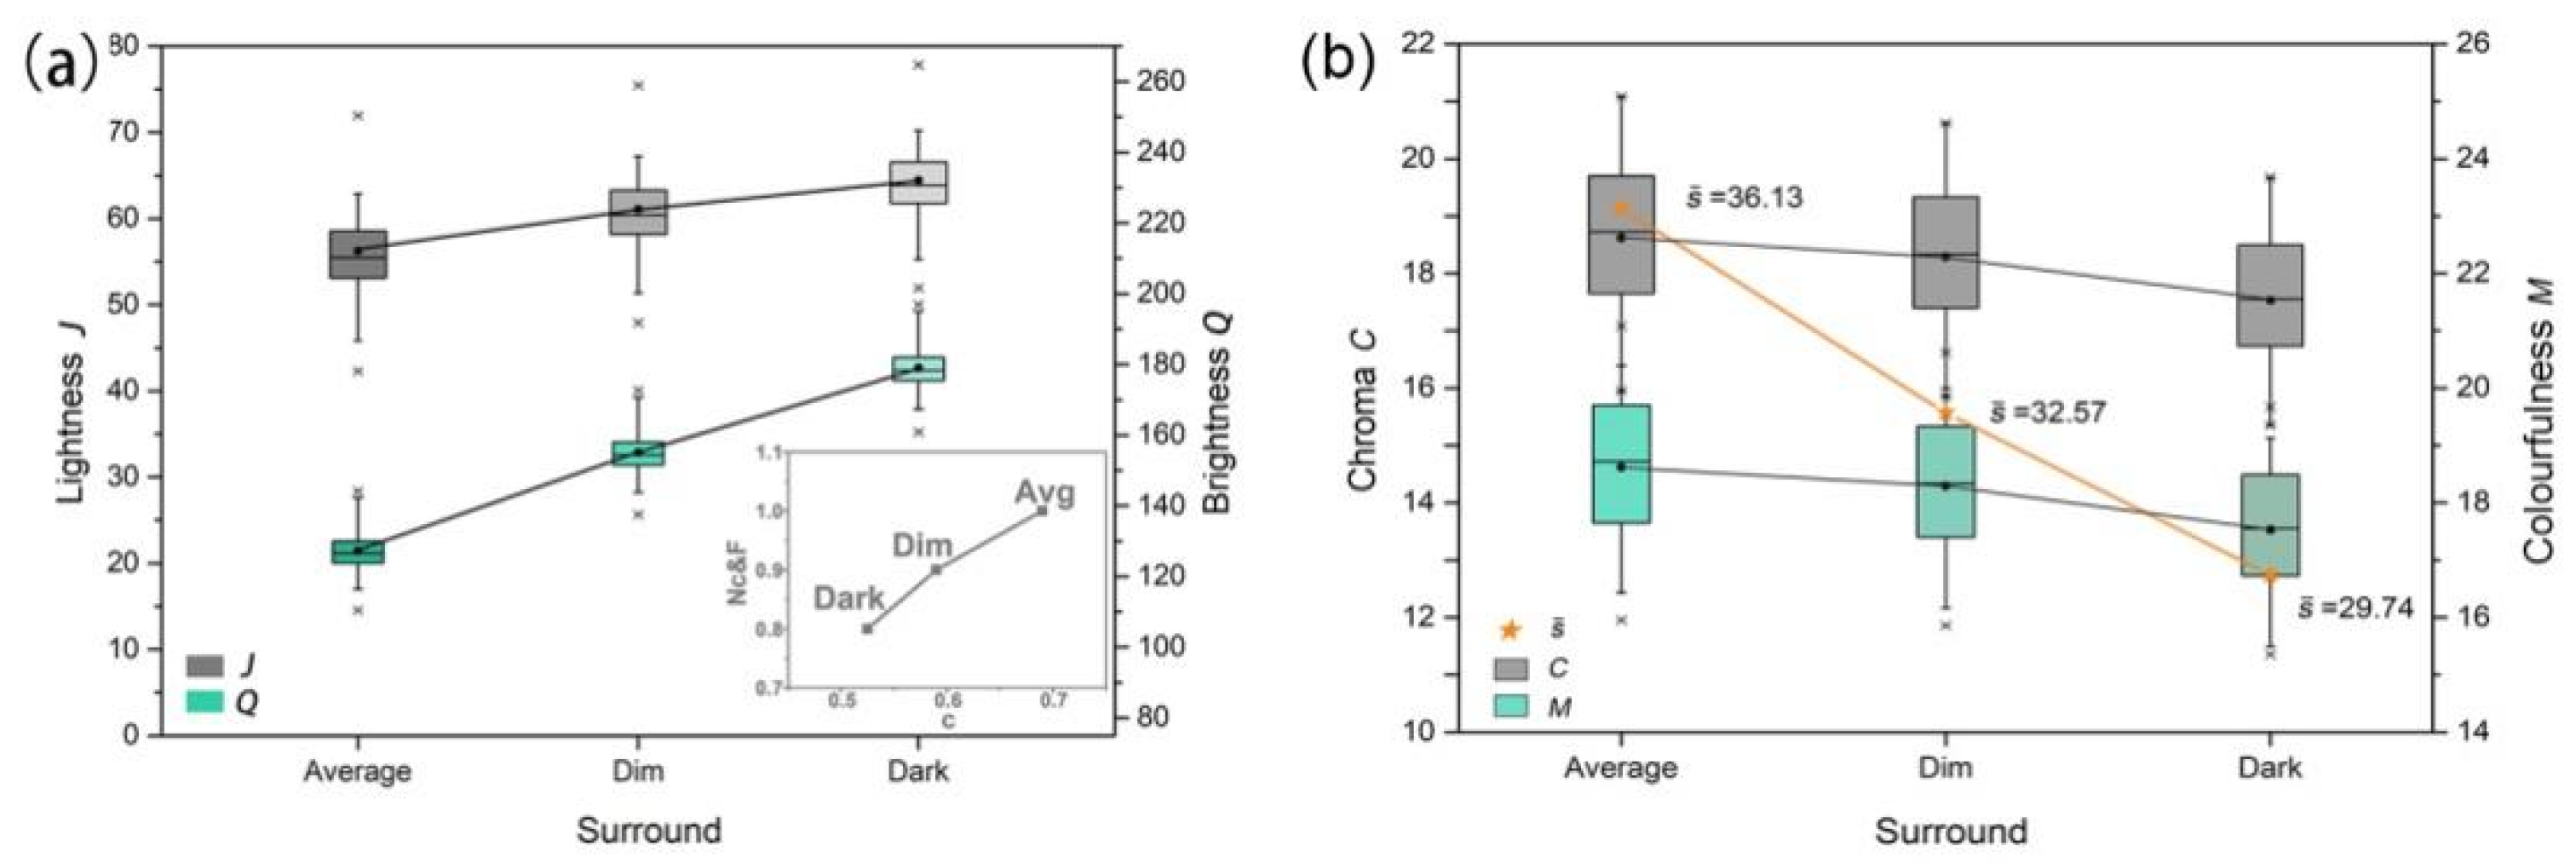
Gem-quality bluish-green serpentinite is mainly composed of antigorite, including minor amounts of other nonserpentine minerals such as apatite, talc, dolomite, calcite, etc. The CIECAM16 model can be used to predict its colour appearance properties. Changes in surrounds, illuminances, and light sources significantly affect the colour appearance of the samples. As the surround changes from average to dim and then to dark, the lightness (J) and brightness (Q) gradually increase, while the chroma (C) and colourfulness (M) decrease. The lightness contrast becomes more evident, which confirms the Bartleson–Breneman phenomenon. With average surrounds, serpentinite can present a charming bluish-green hue with higher saturation.
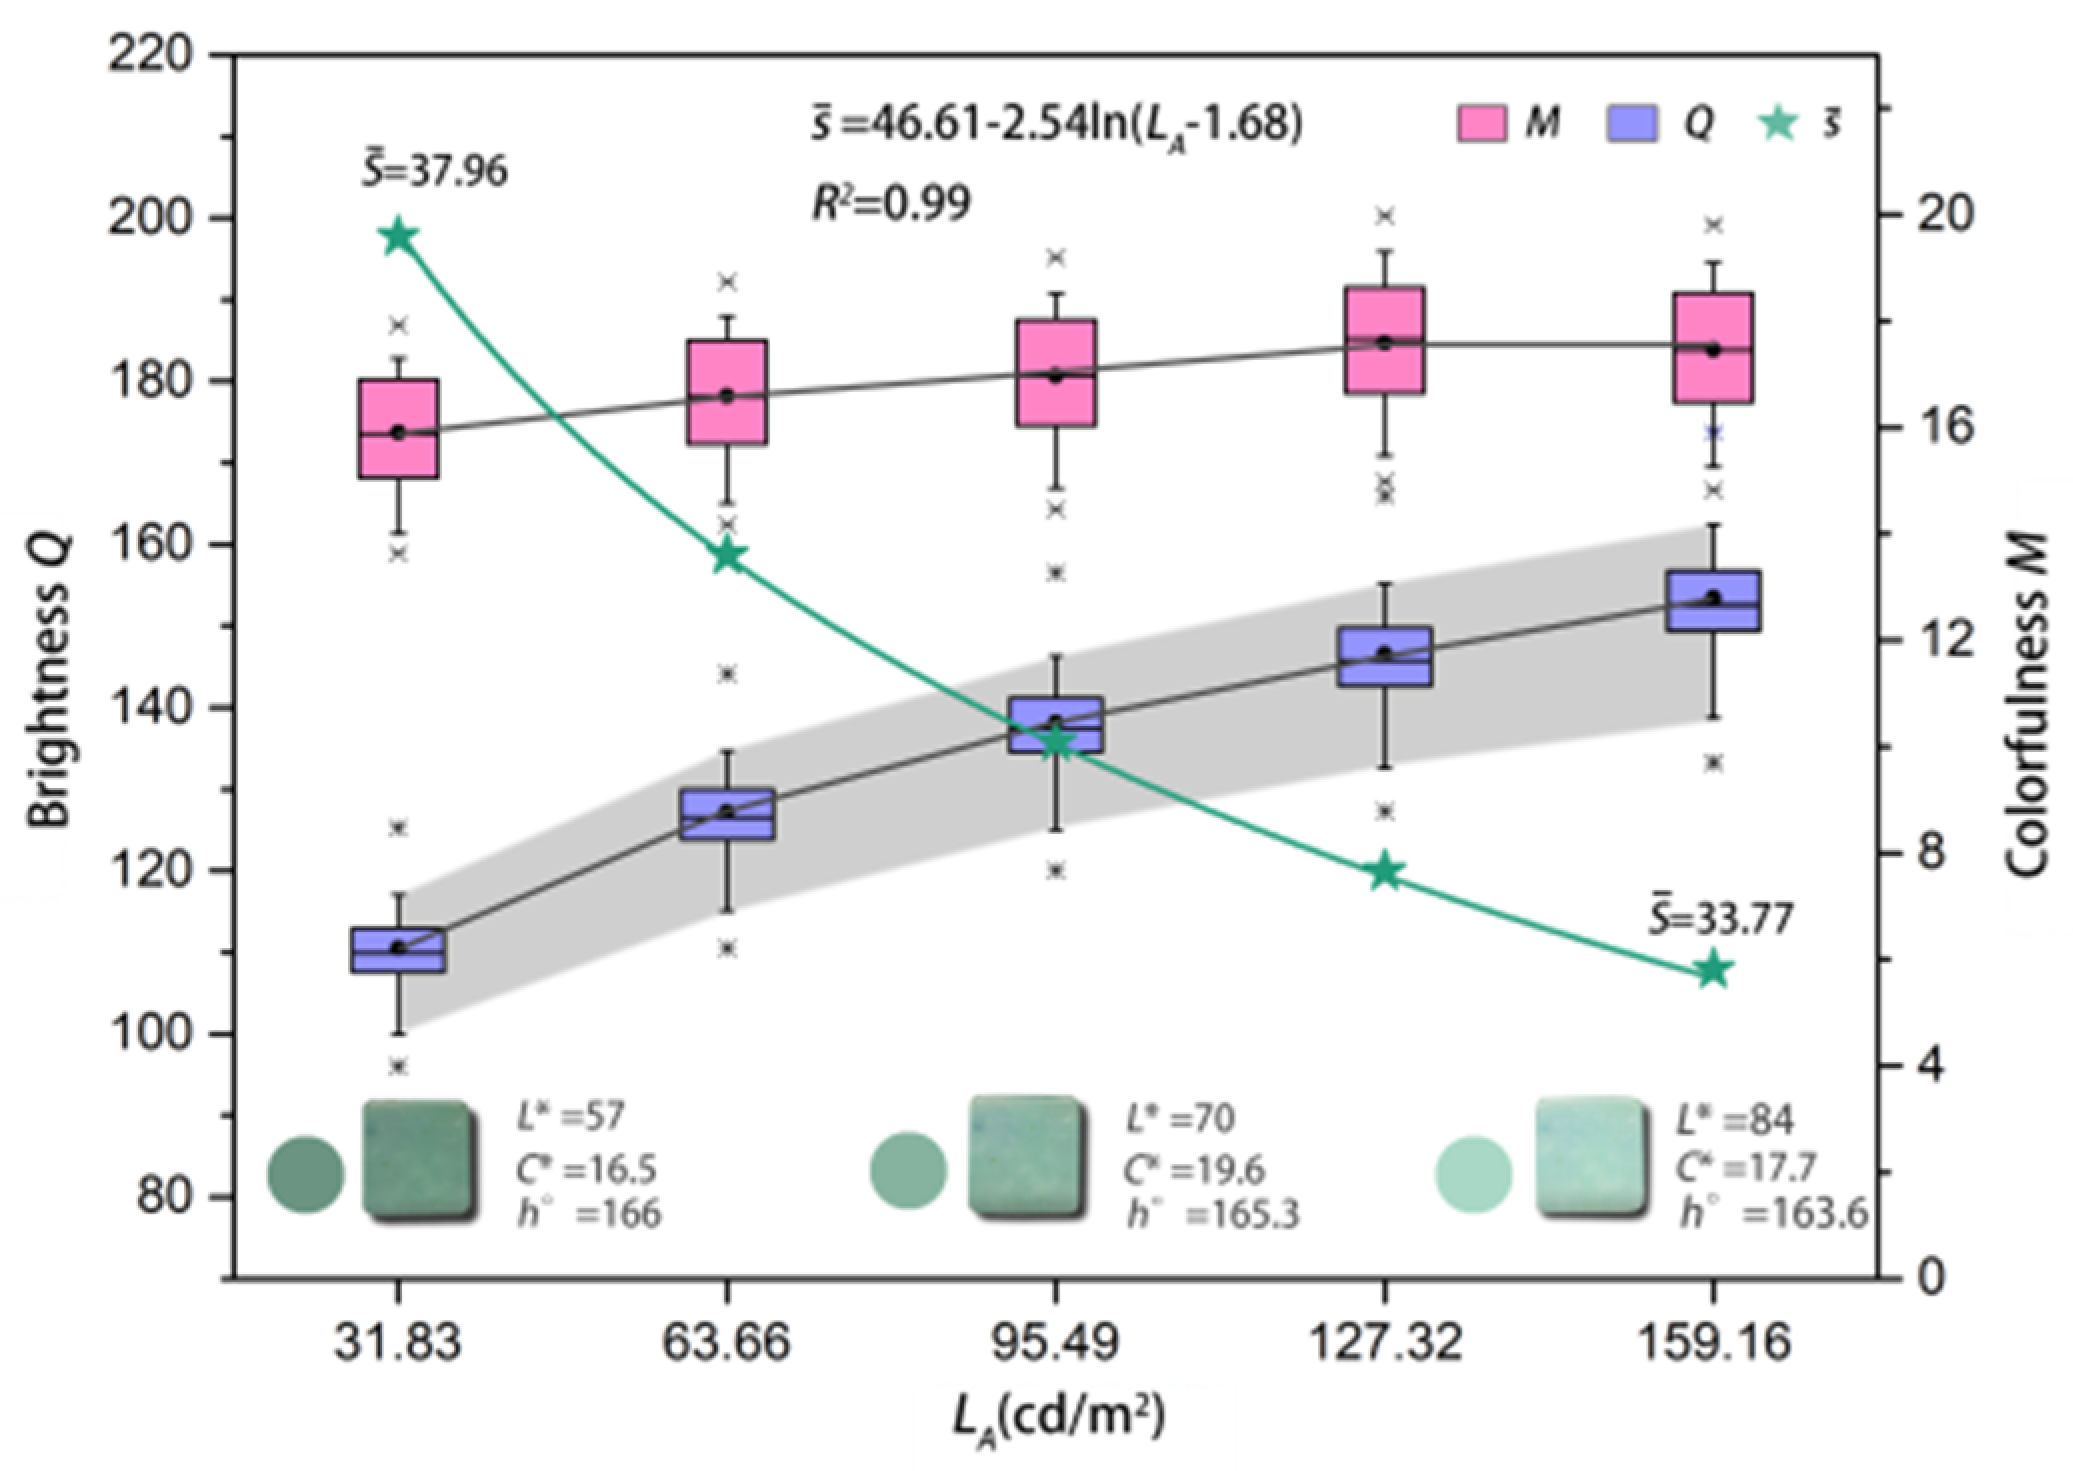
Brightness and colourfulness both increase with illuminance enhancement, indicating that the CIECAM16 model can predict the Stevens and Hunt effects. However, since the growth rate of colourfulness is much lower than that of brightness, a downward trend in saturation is observed. Consequently, too high a illuminance level does not favour the presentation of the colour of serpentinite.
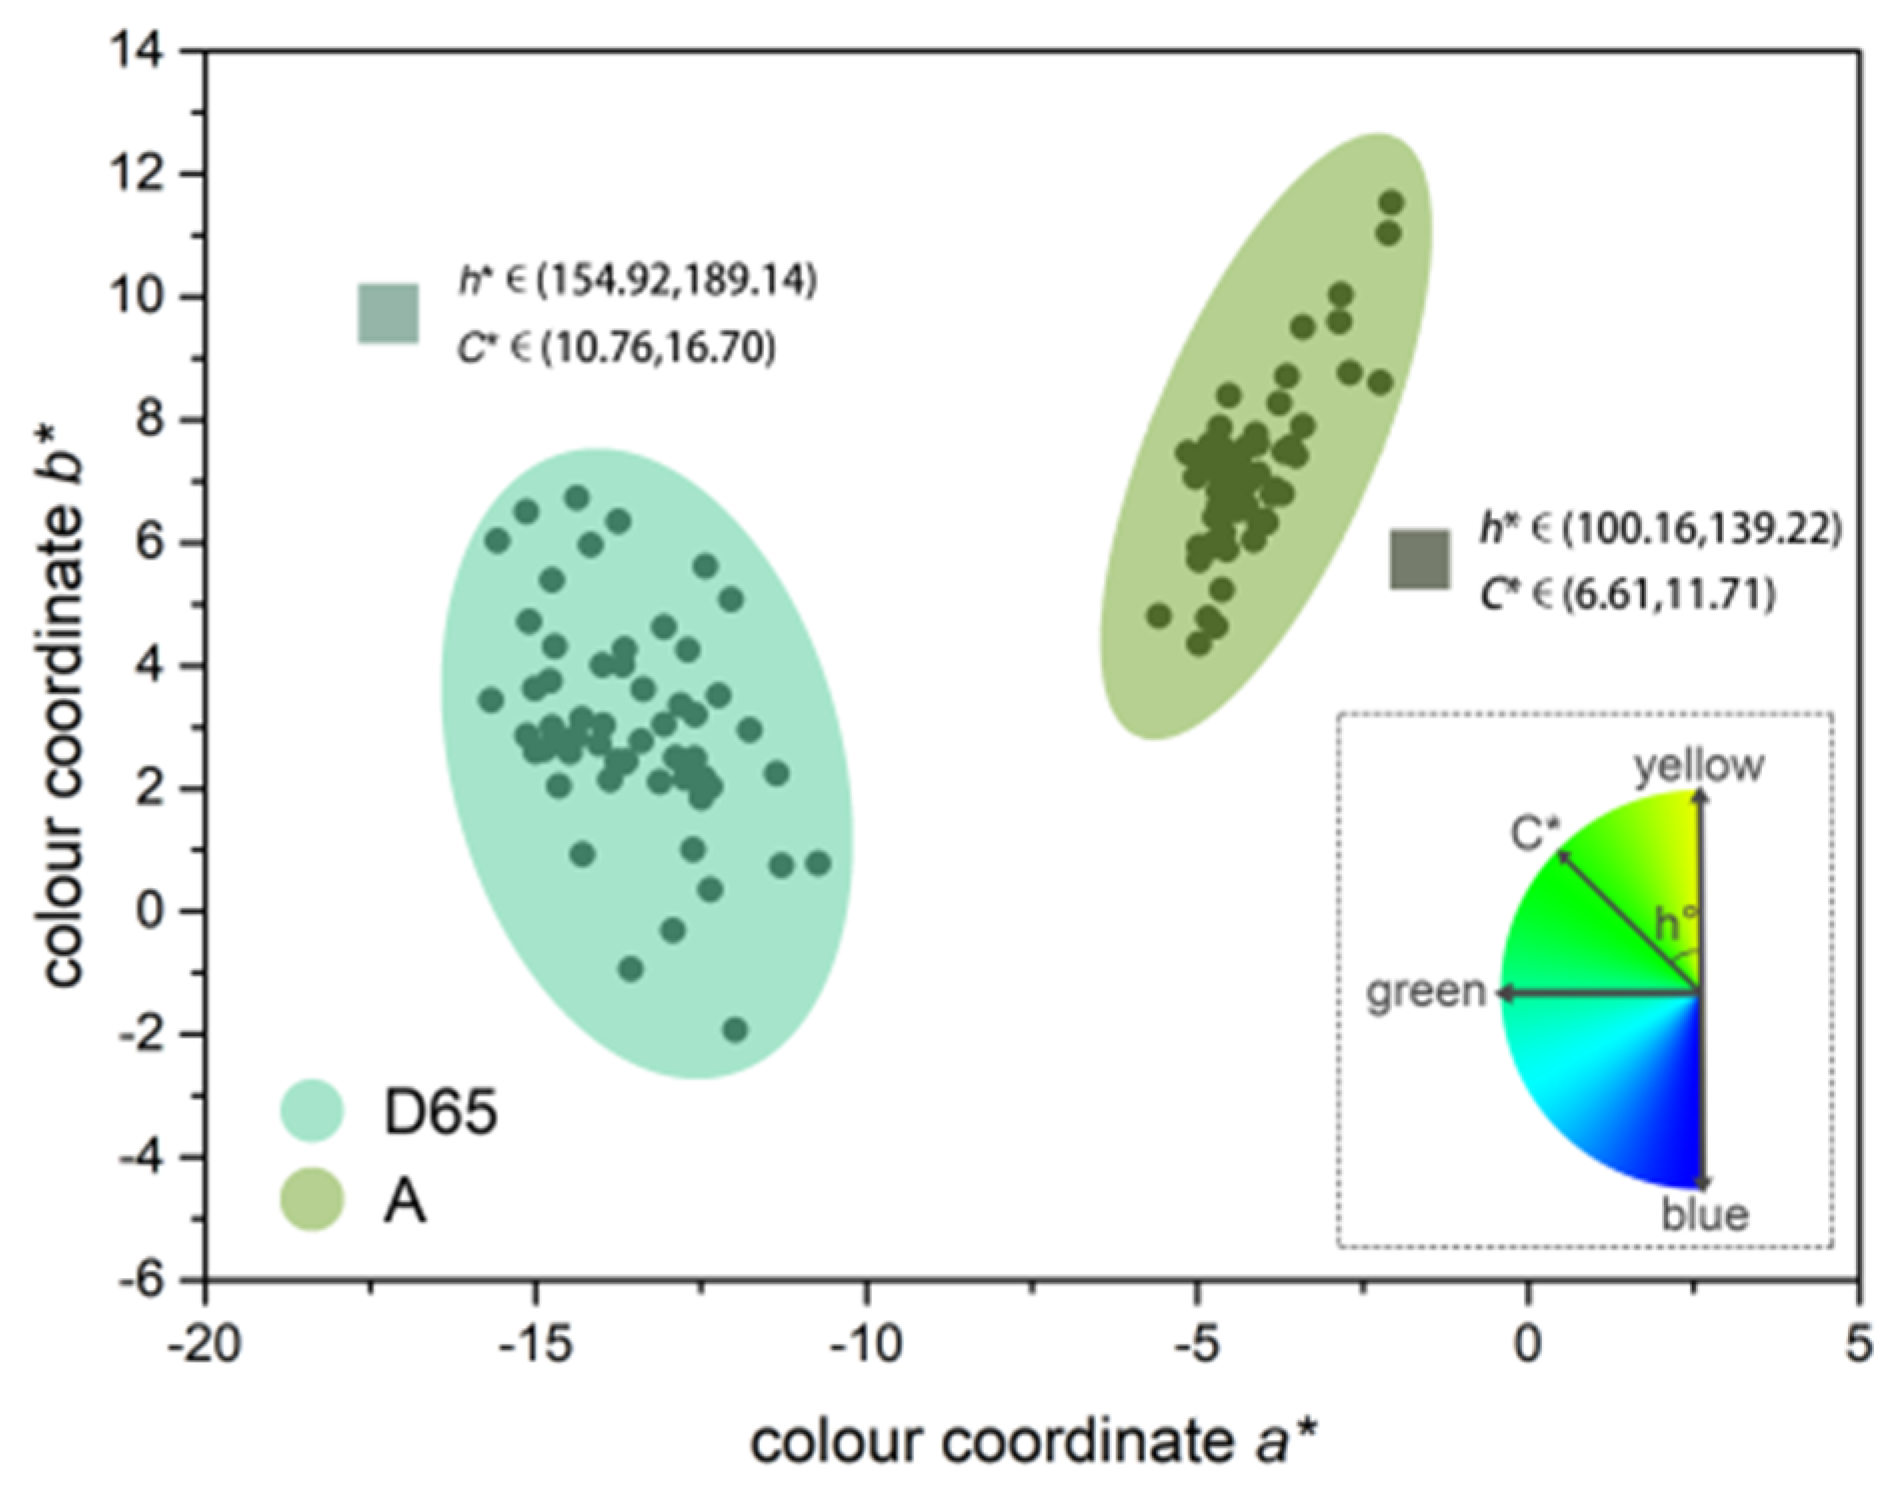
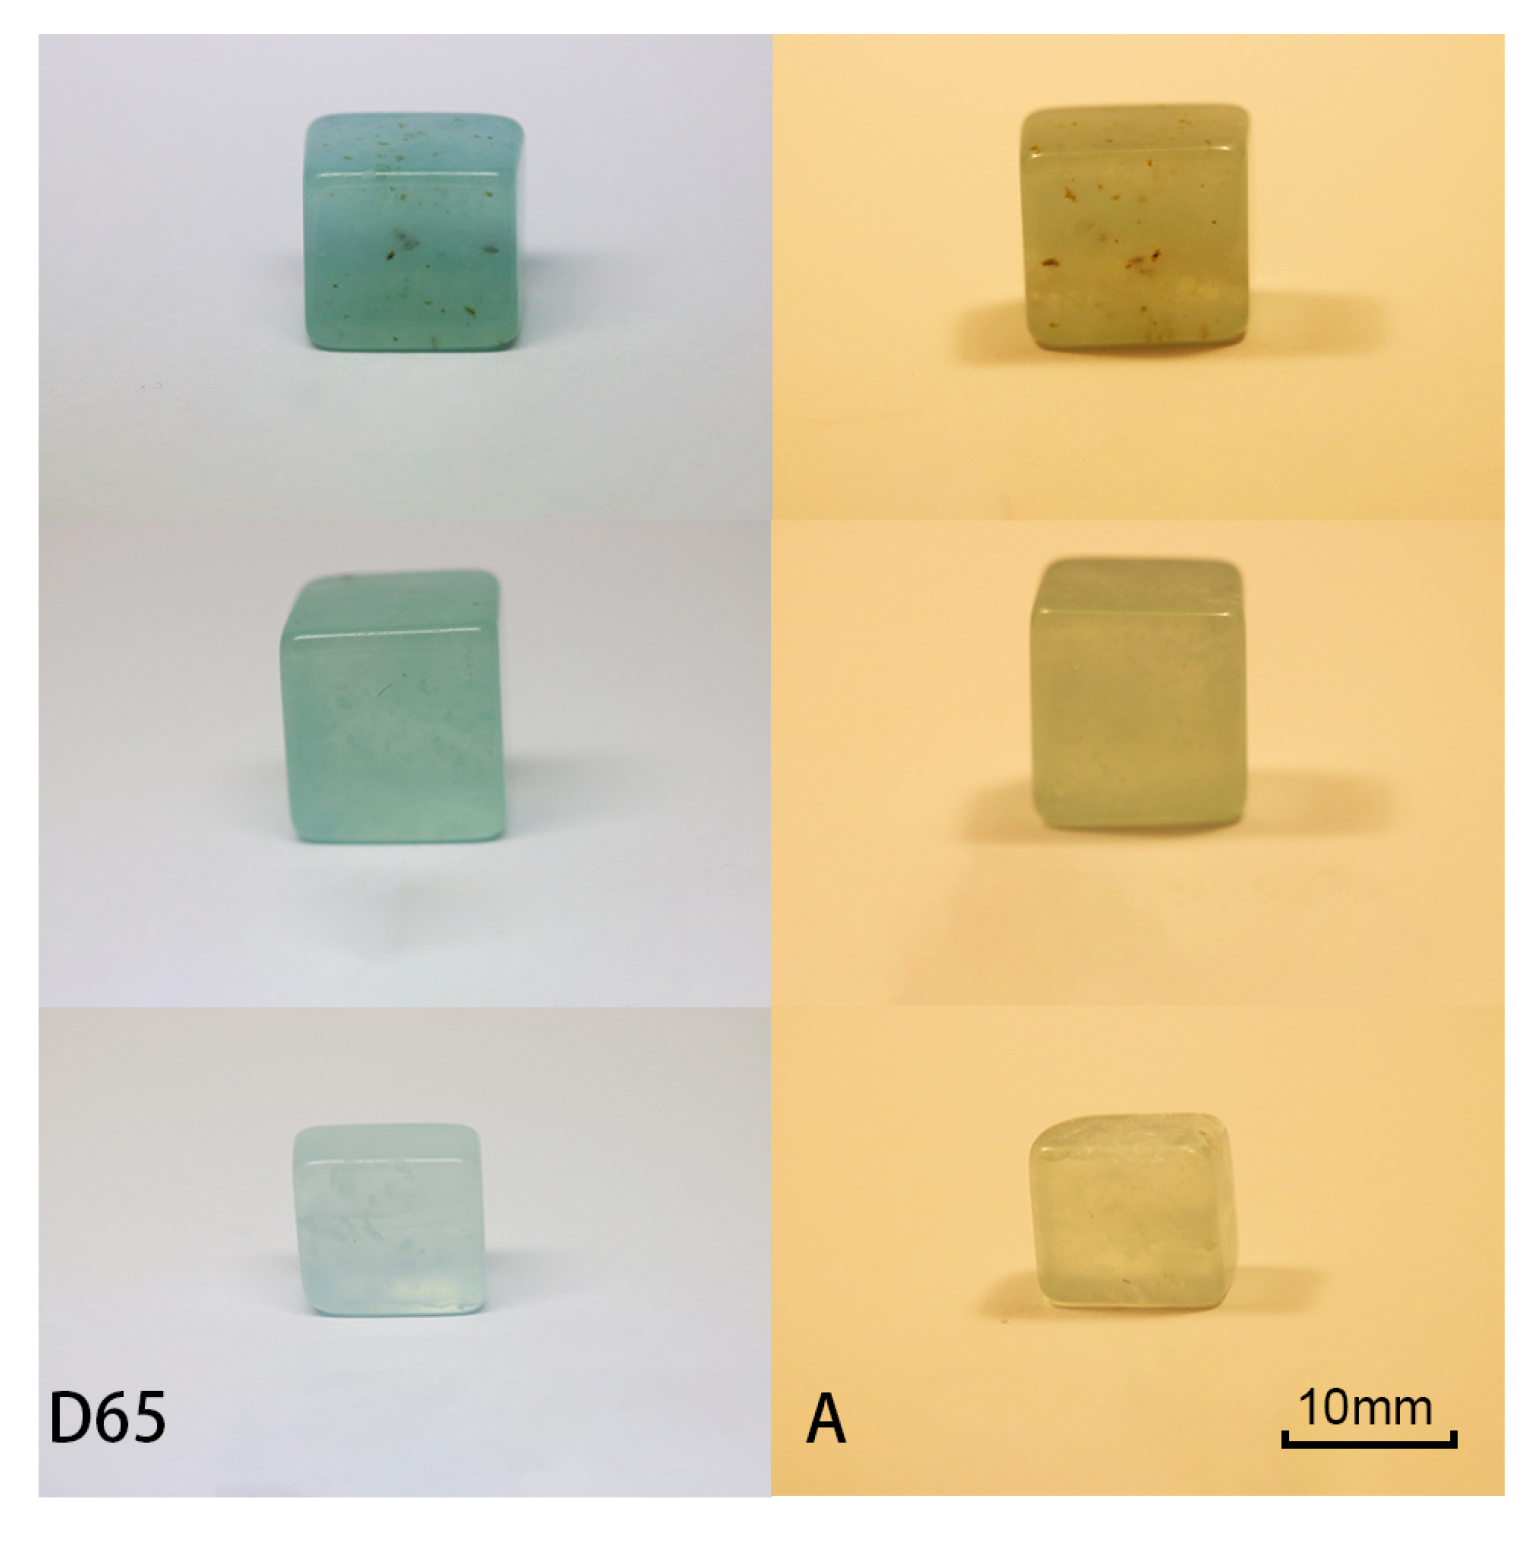
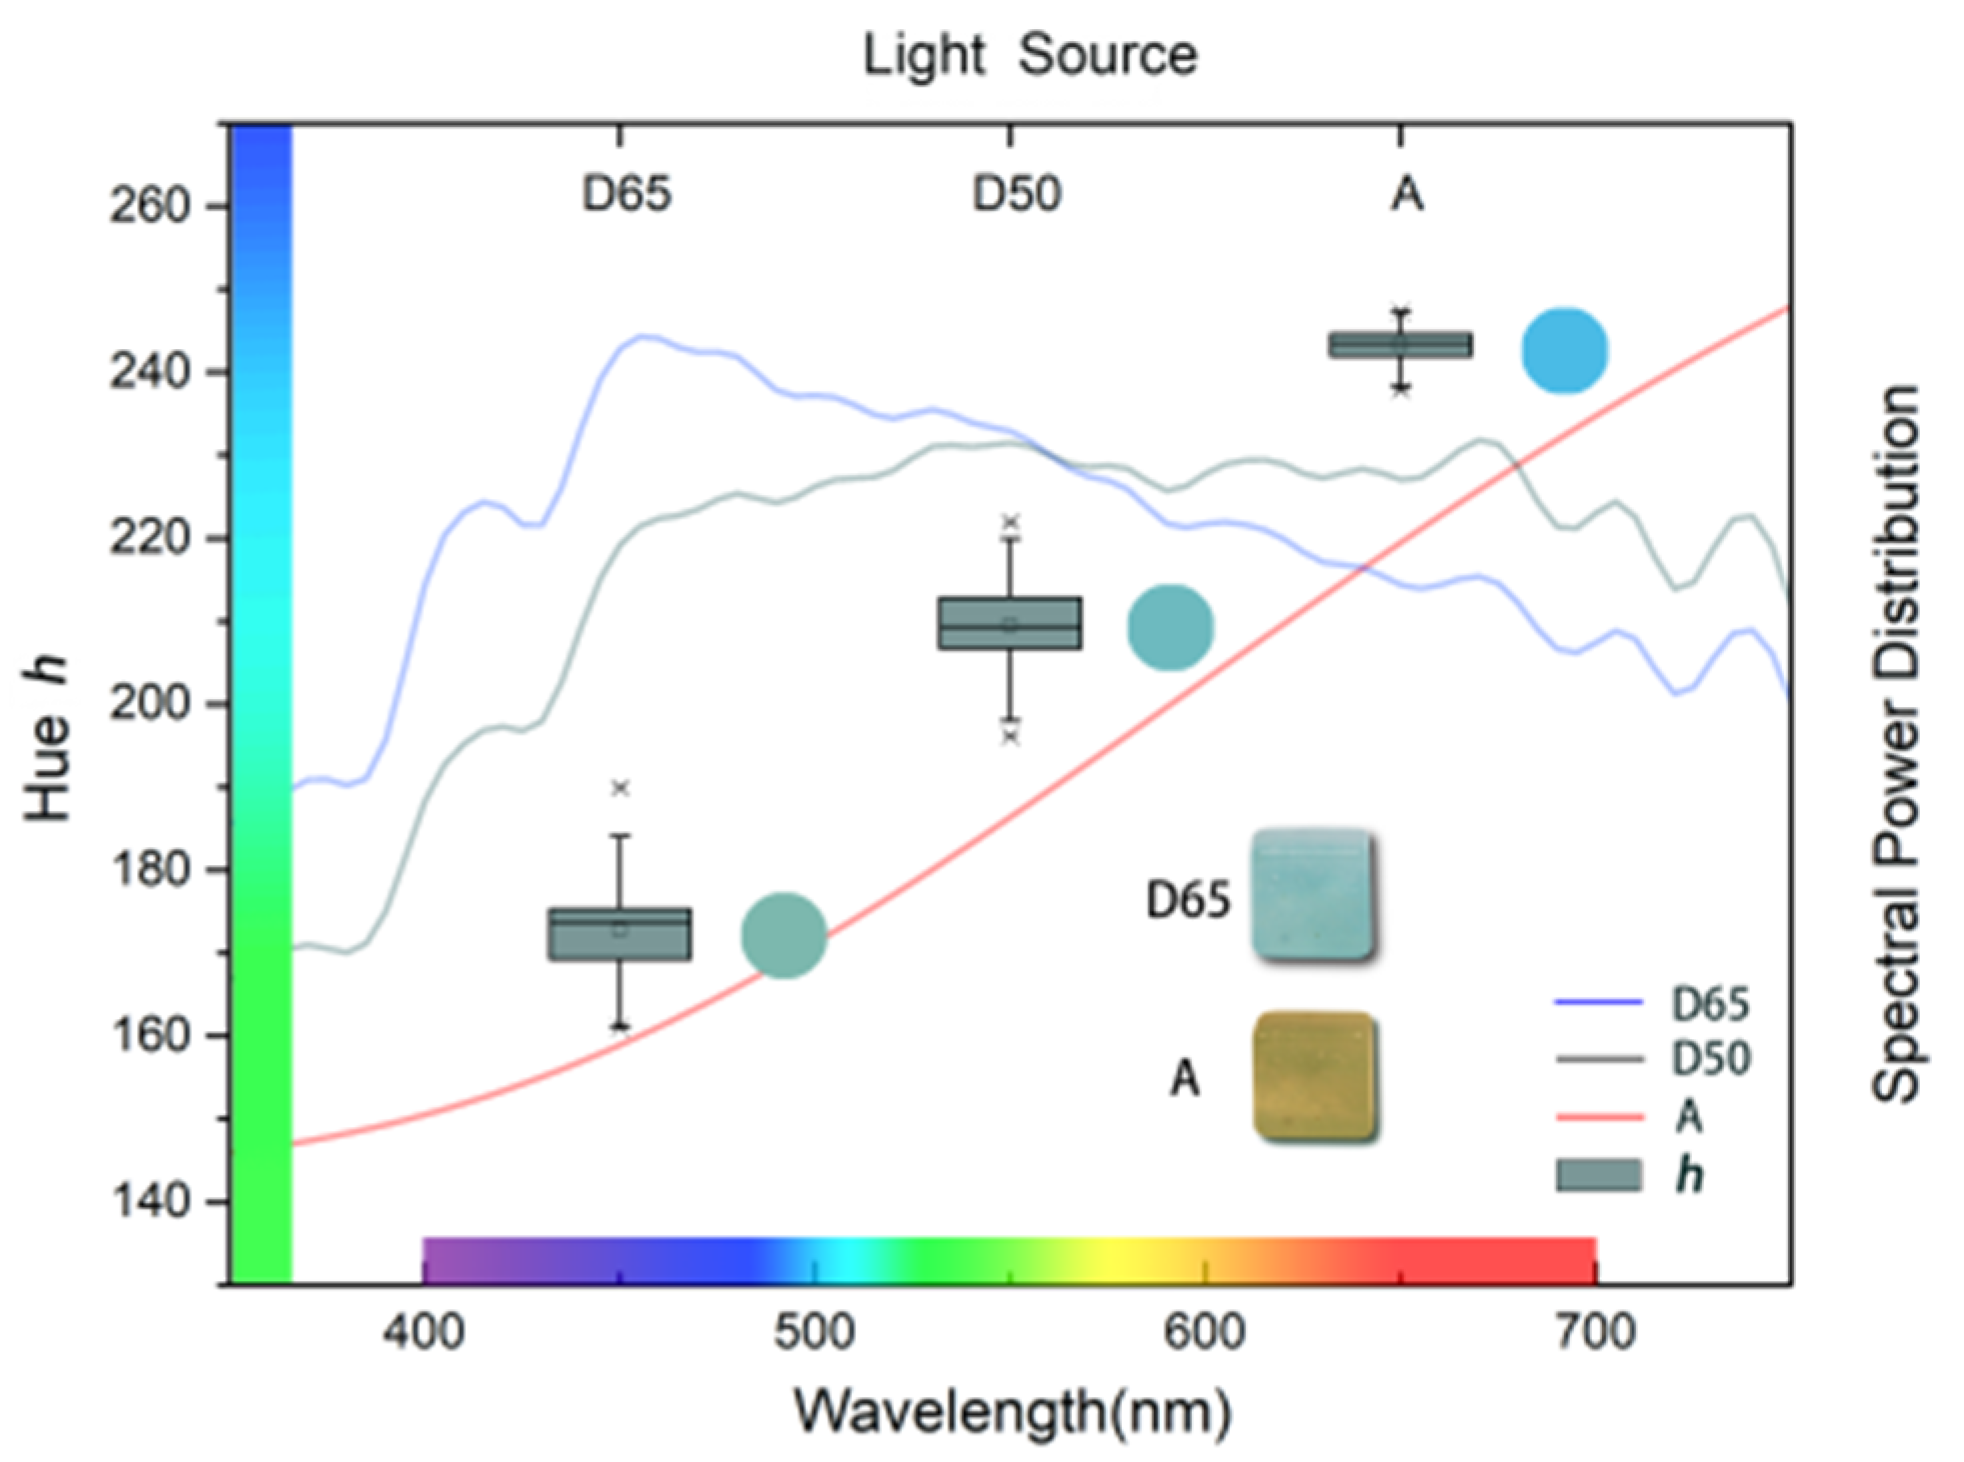
According to the CAM16-UCS colour space, the change of the light source affects the hue angle (h) and colourfulness (M) of serpentinite. As the colour temperature of the light source decreases, the hue angle and colourfulness both increase, and the colour shifts towards the blue rather than yellow area. The CIECAM16 model may not be suitable for predicting the hue of serpentinite under different light sources. The D65 light source is more suitable for the colour presentation and classification of bluish-green serpentinite than the other ones (D50 and A).

Supplementary Materials

The following are available online at https://www.mdpi.com/article/10.3390/min12010038/s1. Table S1: Color appearance attribute data of 59 serpentinite samples under different surrounds; Table S2: Color appearance attribute data of 59 serpentinite samples under different illuminances; Table S3: Color appearance attribute data of 59 serpentinite samples under different light sources.

Author Contributions

Conceptualisation, Z.Z. and Y.G.; Methodology, Z.Z. and Y.G.; Validation, Z.Z. and Y.G.; Formal analysis, Z.Z.; Investigation, Z.Z. and Y.G.; Resources, Z.Z. and Y.G.; Data curation, Z.Z.; Writing—original draft preparation, Z.Z.; Writing—review and editing, Y.G.; Visualisation, Z.Z.; Supervision, Y.G.; Project administration, Y.G. All authors have read and agreed to the published version of the manuscript.

Funding

This research received no external funding.

Data Availability Statement

Not applicable.

Acknowledgments

The authors thank the lab of Gemmology, China University of Geosciences, Beijing, for support.

Conflicts of Interest

The authors declare no conflict of interest.

References

  1. Zucali, M.; Marinoni, N.; Diella, V.; Croce, A.; Rinaudo, C.; Fontana, E. Deciphering the tectonic-geodynamic context of the gem-quality “noble serpentine” deposit formation combining microstructural, chemical and micro-Raman analyses in Palaeozoic olivine-bearing marbles and serpentine-hosting rocks (Pizzo Tremogge, Margna unit—Austroalpine, Val Malenco—Central Alps, Italy). Ore Geol. Rev. 2017, 92, 257–270. [Google Scholar]
  2. Adamo, I.; Diella, V.; Bocchio, R.; Rinaudo, C.; Marinoni, N. Gem-quality serpentine from Val Malenco, Central Alps, Italy. Gems Gemol. 2016, 52, 38–49. [Google Scholar] [CrossRef]
  3. Evans, B.W.; Hattori, K.; Baronnet, A. Serpentinites: What, why, where? Elements 2013, 9, 99–106. [Google Scholar] [CrossRef]
  4. Mellini, M.; Fuchs, Y.; Viti, C.; Lemaire, C.; Linares, J. Insights into the antigorite structure from Mossbauer and FTIR spectroscopies. Eur. J. Mineral. 2002, 14, 97–104. [Google Scholar] [CrossRef]
  5. Zhang, L.J. A study on the composition and properties of Xiuyan jade in Liaoning Province. Acta Mineral. Sin. 2002, 22, 137–142. [Google Scholar]
  6. Ji, S.C.; Li, A.; Wang, Q.; Long, C.X.; Wang, H.C.; Marcotte, D.; Salisbury, M. Seismic velocities, anisotropy, and shear-wave splitting of antigorite serpentinites and tectonic implications for subduction zones. J. Geophys. Res. Solid Earth 2013, 118, 1015–1037. [Google Scholar] [CrossRef]
  7. Wang, S.Q.; Dong, P.X. Classification, geologic characteristics and origin of the jade from Xiuyan, Liaoning Province, China. Geol. Resour. 2011, 5, 321–331. [Google Scholar]
  8. Li, D.Z.; Yu, S.X.; Wang, Z. Discussion on the jade-forming regularity of Xiuyan jade in Xiuyan area, Liaoning province. Contrib. Geol. Miner. Resour. Res. 2013, 2, 249–255. [Google Scholar]
  9. Wang, Y.Y.; Gan, F.X. Mineral Structure and Mineralization Mechanism of Serpentine Jade from Luchuan, Guangxi Province. Rock Miner. Anal. 2012, 31, 788–793. [Google Scholar]
  10. Zhang, B.S.; Wu, X.T.; Sun, Y.F.; Ritchey, M.; Fan, A.C.; Zhang, Y.Y.; Yu, G.; Song, Y.B. Complex raw materials and the supply system: Mineralogical and geochemical study of the jade artefacts of the Longshan Culture (2400–2000 BCE) from Sujiacun site in coastal Shandong, China. Archaeometry 2021, 63, 1–18. [Google Scholar] [CrossRef]
  11. Guillot, S.; Hattori, K. Serpentinites: Essential roles in geodynamics, arc volcanism, sustainable development, and the origin of life. Elements 2013, 9, 95–98. [Google Scholar] [CrossRef]
  12. Guo, Y.; Zong, X.; Qi, M. Feasibility study on quality evaluation of Jadeite-jade color green based on GemDialogue color chip. Multimed. Tools Appl. 2019, 78, 841–856. [Google Scholar] [CrossRef]
  13. Han, J.Y.; Guo, Y.; Liu, S.T. Environmental issues on color quality evaluation of blue sapphire based on Gemdialogue (TM) color comparison charts. Ekoloji 2018, 27, 1365–1376. [Google Scholar]
  14. King, J.M.; Shigley, J.E.; Gelb, T.H.; Guhin, S.S.; Hall, M.; Wang, W.Y. Characterization and grading of natural-color yellow diamonds. Gems Gemol. 2005, 41, 88–115. [Google Scholar] [CrossRef]
  15. King, J.M.; Shigley, J.E.; Guhin, S.S.; Gelb, T.H.; Hall, M. Characterization and grading of natural-color pink diamonds. Gems Gemol. 2002, 38, 128–147. [Google Scholar] [CrossRef] [Green Version]
  16. King, J.M.; Moses, T.M.; Shigley, J.E.; Welbourn, C.M.; Lawson, S.C.; Cooper, M. Characterizing natural-color type IIb blue diamonds. Gems Gemol. 1998, 34, 246–268. [Google Scholar] [CrossRef]
  17. King, J.M.; Geurts, R.H.; Gilbertson, A.M. Color grading “D-to-Z” diamonds at the GIA laboratory. Gems Gemol. 2008, 44, 296–321. [Google Scholar] [CrossRef]
  18. Guo, Y.; Wang, H.; Du, H.M. The foundation of a color-chip evaluation system of jadeite-jade green with color difference control of medical device. Multimed. Tools Appl. 2016, 75, 14491–14502. [Google Scholar] [CrossRef]
  19. Tang, J.; Guo, Y.; Xu, C. Metameric effects on peridot by changing background color. J. Opt. Soc. Am. A 2019, 36, 2030–2039. [Google Scholar] [CrossRef] [PubMed]
  20. Tang, J.; Guo, Y.; Xu, C. Light pollution effects of illuminance on yellowish green forsterite color under CIE standard light source D65. Ekoloji 2018, 27, 1181–1190. [Google Scholar]
  21. Sun, Z.Y.; Palke, A.C.; Renfro, N. Vanadium and chromium bearing pink pyrope garnet: Characterization and quantitative colorimetric analysis. Gems Gemol. 2015, 51, 348–369. [Google Scholar] [CrossRef] [Green Version]
  22. Schmetzer, K.; Bernhardt, H.-J.; Bosshart, G.; Hainschwang, T. Color-change garnets from Madagascar: Variation of chemical, spectroscopic and colorimetric properties. J. Gemmol. 2009, 31, 235–282. [Google Scholar] [CrossRef]
  23. Qiu, Y.; Guo, Y. Explaining colour change in pyrope-spessartine garnets. Minerals 2021, 11, 865. [Google Scholar] [CrossRef]
  24. Guo, Y. Quality evaluation of tourmaline red based on uniform color space. Clust. Comput. 2017, 20, 3393–3408. [Google Scholar] [CrossRef]
  25. Liu, Y.; Shigley, J.E.; Halvorsen, A. Colour hue change of a gem tourmaline from the Umba Valley, Tanzania. J. Gemmol. 1999, 26, 386–396. [Google Scholar] [CrossRef]
  26. Cheng, R.P.; Guo, Y. Study on the effect of heat treatment on amethyst color and the cause of coloration. Sci. Rep. 2020, 10, 14927. [Google Scholar] [CrossRef] [PubMed]
  27. Wang, X.D.; Guo, Y. The impact of trace metal cations and absorbed water on colour transition of turquoise. R. Soc. Open Sci. 2021, 8, 201110. [Google Scholar] [CrossRef]
  28. Fairchild, M.D. Color Appearance Models, 2nd ed.; John Wiley & Sons: Hoboken, NJ, USA, 2005. [Google Scholar]
  29. Hunt, R.G. Revised colour-appearance model for related and unrelated colours. Color Res. Appl. 1991, 18, 146–165. [Google Scholar] [CrossRef]
  30. Fairchild, M.D. Refinement of the RLAB color space. Color Res. Appl. 1996, 21, 338–346. [Google Scholar] [CrossRef]
  31. Luo, M.R.; Lo, M.C.; Kuo, W.-G. The LLAB (l:c) colour model. Color Res. Appl. 1996, 21, 412–429. [Google Scholar] [CrossRef]
  32. Nayatani, Y.; Mori, T.; Hashimoto, K.; Takahama, K.; Sobagaki, H. Comparison of color-appearance models. Color Res. Appl. 1990, 15, 272–284. [Google Scholar] [CrossRef]
  33. Luo, M.R.; Hunt, R.W.G. The structure of the CIE 1997 colour appearance model. Color Res. Appl. 1998, 23, 138–146. [Google Scholar] [CrossRef]
  34. Schettini, R. Approximating the CIECAM97s color appearance model by means of neural networks. Image Vis. Comput. 2001, 19, 691–697. [Google Scholar] [CrossRef]
  35. Moroney, N.; Fairchild, M.D.; Hunt, R.W.G.; Li, C.; Luo, M.R.; Newman, T. The CIECAM02 color appearance model. In Proceedings of the Color Imaging Conference, Scottsdale, AZ, USA, 12–15 November 2002. [Google Scholar]
  36. Luo, M.R.; Cui, G.H.; Li, C.J. Uniform colour spaces based on CIECAM02 colour appearance model. Color Res. Appl. 2006, 31, 320–330. [Google Scholar] [CrossRef]
  37. Liang, J.; Liao, N.F.; Lian, Y.S.; Meng, S.R. Research on the uniform colour appearance space based on the CIECAM02. In Proceedings of the 1st China Academic Conference on Printing and Packaging, Beijing, China, 26–29 November 2010. [Google Scholar]
  38. Li, C.J.; Luo, M.R.; Sun, P.L. A modification of CIECAM02 based on the Hunt-Pointer-Estevez matrix. J. Imaging Sci. Technol. 2013, 57, 1–8. [Google Scholar] [CrossRef]
  39. Dong, S.W.; Liao, N.F.; Song, L.; Liang, J.; Lin, K. Testing the performance of CIECAM02 model using two distinct glossinesses of color printing atlas. J. Opt. Soc. Am. A 2014, 31, A263–A267. [Google Scholar] [CrossRef] [PubMed]
  40. Bao, W.Y.; Wei, M.C. Testing the performance of CIECAM02from 100 to 3500 cd/m2. Color Res. Appl. 2020, 45, 992–1004. [Google Scholar] [CrossRef]
  41. Li, C.J.; Li, Z.Q.; Wang, Z.F. Comprehensive color solutions: CAM16, CAT16, and CAM16-UCS. Color Res. Appl. 2019, 42, 703–718. [Google Scholar] [CrossRef]
  42. Li, C.; Li, Z.; Wang, Z.; Xu, Y.; Luo, M.R.; Cui, G.; Melgosa, M.; Pointer, M. A revision of CIECAM02 and its CAT and UCS. In Proceedings of the Color Imaging Conference, San Diego, CA, USA, 7–11 November 2016. [Google Scholar]
  43. Hermans, S.; Smet, K.A.G.; Hanselaer, P. Color appearance model for self-luminous stimuli. J. Opt. Soc. Am. A 2018, 35, 2000–2009. [Google Scholar] [CrossRef] [PubMed]
  44. Wang, Y.Y.; Gan, F.X. Coloration mechanism and chromaticity of Xiuyan jade of China. Spectrosc. Spectr. Anal. 2012, 32, 2305–2310. [Google Scholar]
  45. Qiu, Z.M.; Rang, M.; Huang, J.J. The relationship between content, valence state of Fe and colour in Xiuyan jade. Nucl. Sci. Tech. 1992, 3, 126–130. [Google Scholar]
  46. Zheng, J.Y.; Liu, Y.G.; Chen, T.; Chen, Q.; Li, M.Y.; Xu, X. Spectroscopic characteristics of blue serpentine. Spectrosc. Spectr. Anal. 2021, 41, 643–647. [Google Scholar]
  47. Schwartz, S.; Guillot, S.; Reynard, B.; Lafay, R.; Debret, B.; Nicollet, C.; Lanari, P.; Auzende, A.L. Pressure-temperature estimates of the lizardite/antigorite transition in high pressure serpentinites. Lithos 2013, 178, 197–210. [Google Scholar] [CrossRef] [Green Version]
  48. Yariv, S.; Heller-Kallai, L. The relationship between the I.R. spectra of serpentines and their structures. Clays Clay Miner. 1975, 23, 145–152. [Google Scholar] [CrossRef]
  49. Li, Y.Q.; Jiang, S.Y.; Fan, W.W. Study on the infrared spectra of chrysotiles in China. Sci. Geol. Sin. 1981, 3, 247–253. [Google Scholar]
  50. RRUFF. Available online: https://rruff.info/antigorite/display=default (accessed on 6 December 2021).
  51. Rinaudo, C.; Gastaldi, D.; Belluso, E. Characterization of chrysotile, antigorite and lizardite by FT-Raman spectroscopy. Can. Mineral. 2003, 41, 883–890. [Google Scholar] [CrossRef]
  52. Trittschack, R.; Grobety, B.; Koch-Muller, M. In situ high-temperature Raman and FTIR spectroscopy of the phase transformation of lizardite. Am. Mineral. 2012, 97, 1965–1976. [Google Scholar] [CrossRef]
  53. Groppo, C.; Rinaudo, C.; Cairo, S.; Gastaldi, D. Micro-Raman spectroscopy for a quick and reliable identification of serpentine minerals from ultramarics. Eur. J. Mineral. 2006, 18, 319–329. [Google Scholar] [CrossRef]
  54. Zhang, S.F.; Guo, Y. Measurement of gem colour using a computer vision system: A case study with jadeite-jade. Minerals 2021, 11, 791. [Google Scholar] [CrossRef]
  55. Liao, N.F.; Shi, J.S.; Wu, W.M. An Introduction to Digital Color Management System; Beijing Institute of Technology Press: Beijing, China, 2009. [Google Scholar]
  56. Tang, J.; Guo, Y.; Xu, C. Color effect of light sources on peridot based on CIE1976 L*a*b* color system and round RGB diagram system. Color Res. Appl. 2019, 44, 932–940. [Google Scholar] [CrossRef]
  57. ISO/CIE DIS 11664-2:2020(E). Colorimetry—Part 2: CIE Standard Illuminants; ISO: Geneva, Switzerland; CIE: Vienna, Austria, 2020. [Google Scholar]
Figure 1. Photograph of 59 samples of bluish-green serpentinite.
Minerals 12 00038 g001
Figure 2. Microstructures of bluish-green serpentinite under crossed-polarised light. (a) Serpentinite with interpenetrating structure. (b) A few leaf-shaped serpentine-type minerals arranged directionally.
Minerals 12 00038 g002
Figure 3. Scanning electron microscope (SEM) images of bluish-green serpentinite samples. (a) Lepidoblastic texture. (b) Lamellar crystallisation structure. (c) Curly and folded shape. (d) Directional arrangement of serpentine minerals.
Minerals 12 00038 g003
Figure 4. FTIR spectra of bluish-green serpentinite samples.
Minerals 12 00038 g004
Figure 5. (a) Raman spectra of the bluish-green serpentinite samples. (b) Raman peaks of apatite at 964 cm−1. (c) Raman peaks of talc at 195 cm−1, 362 cm−1, and 677 cm−1.
Minerals 12 00038 g005
Figure 6. Schematic diagram of a computer vision system measuring device.
Minerals 12 00038 g006
Figure 8. Chromaticity values of serpentinite samples under different light sources based on CIE1976 L*a*b* measured by the computer vision system.
Minerals 12 00038 g008
Figure 9. Predicted J, Q, C, M, and s ¯ values under different surrounds. (a) J and Q increase with the darkening of the surround. (b) C, M, and s ¯ decrease with the darkening of the surround.
Minerals 12 00038 g009
Figure 10. Influence of illuminance change on colour appearance attributes M, Q, and s ¯ Both colourfulness and brightness rise with the increase of illuminance, but the growth rate of Q is much greater than that of M, causing a significant decrease in average saturation.
Minerals 12 00038 g010
Figure 11. Photograph of some serpentinite samples under different light sources.
Minerals 12 00038 g011
Figure 12. Predicted hue angle distribution under three light sources D65, D50, and A, based on the CAM16-UCS. The change of hue angle is opposite to the CVS measurement result, shifting to the blue rather than yellow area as the colour temperature of the light source decreases.
Minerals 12 00038 g012
Table 1. Input parameters of CIECAM16 model.
Surround Illuminance Light Source
cNcF LA (cd/m2) XwYwZw
Average0.691.01.0500 lx31.83D6595.04100108.89
Dim0.590.90.91000 lx63.66D5096.4210082.52
Dark0.5250.80.81500 lx95.49A109.8510035.58
2000 lx127.32
2500 lx159.16
Table 2. ANOVA results of the influence of surround changes on the colour appearance properties of serpentinite.
ParametersJchQMsH
Mean square1011.3811.65144.8939,667.819.60606.08333.83
F30.508.714.72775.378.69317.724.64
P0.0000.0000.0100.0000.0000.0000.011
Table 3. Average values and increase rates of J (lightness), Q (brightness), C (chroma), M (colourfulness), and s (saturation) under different surround.
SurroundAverageDimDarkRange of Increase
Average–DimDim–DarkAverage–Dark
Javerage56.2161.0664.448.63%5.54%14.65%
Qaverage127.20155.07179.0121.90%15.44%40.73%
Caverage18.2518.0717.41−1.00%−3.63%−4.62%
Maverage16.5916.4215.82−1.00%−3.66%−4.62%
saverage36.1332.5629.74−9.90%−9.90%−17.70%
Table 4. ANOVA results of the influence of illuminance change on the colour appearance properties of serpentinite.
ParametersJchQMsH
Mean square0.3345.09828.9716,822.8122.20162.2063.99
F0.0093.3730.886309.90716.92165.7510.855
P1.0000.0100.4730.0000.0000.0000.491
Table 5. Pearson correlation analysis between illuminance and serpentinite colour appearance attributes.
Parameters QMs
IlluminancePearson’s r0.8850.332−0.670
Sig0.0000.0000.000
Table 6. Colour appearance attributes J, M, and h and colour difference under three light sources.
Light SourceJaverageMaveragehaverageΔE
D6556.2116.59172.77--
D5056.1122.93209.466.40-
A55.6456.91243.2610.3013.10
Table 7. CV of hue angle and colourfulness under different light sources.
Light SourceD65A
Hue angle, h3.27%0.87%
Colourfulness, M6.72%6.18%
Publisher’s Note: MDPI stays neutral with regard to jurisdictional claims in published maps and institutional affiliations.

