Abstract
Sinking and horizontal movements are necessary parameters for assessing the potential impacts of surface subsidence in mining activities. Based on similarity criteria, the surface subsidence mechanism was studied using a physical model composed of similar materials such as sand, cement, and gypsum. With constant field geological parameters maintained in two angles of a coal seam, models of roof subsidence of composite rock were compared for different mining configurations. In accordance with observations from the physical model, it was concluded that subsidence and horizontal movement of strata near to and far from the coal seams were different and divided into five zones. The zone above a mined-out area underwent greater total subsidence compared to unexploited regions on both sides. Correlations between a subsidence curve and the height of a caving zone and the mining dip angle were obtained and verified from numerical model results. According to the roof’s position relative to the goaf, the area above the goaf of the composite rock layer was divided into three regions: a curving zone, a water-conducting fracture zone, and a falling zone, to which the subsidence and movement characteristics of each area could be proposed. Compared with the subsidence and movement characteristics observed from the physical and numerical model, the acquisition of subsidence characteristics and parameters in different areas can provide an idea for improvement, innovation or proposal of a theoretical formula for subsidence prediction of composite rock formations.
1. Introduction
After coal mining, the overlying strata sinks, and gradually extends to the surface of the mining area, causing of ecological environmental damage and water resource depletion, bringing great inconvenience production and local life [1,2]. Subsidence movement of overlying strata increases and causes surface subsidence of the ground basin in mining areas, causing structural and environmental damage [3]. Land subsidence is one of the most severe geological disasters, which threatens the stability of the slopes, causing uneven settlement of engineering structures, landslides, instability and deformation of systems, and even destroying the balance between natural lakes and groundwater sources, resulting in pollution of water resources [4,5,6]. Study of subsidence of composite strata during longwall mining is of great significance to surface vegetation protection, building stability, and water resource balance in the mining areas [7,8,9,10].
Numerous research results have shown that physical and numerical simulation methods are effective solutions for investigating mining-related issues, proving a clear and intuitive understanding of subsidence during coal mining [11,12,13]. Theoretical modeling of subsidence predicts stress in rock strata and can predict the final subsidence curve after mining [14]. Theoretical models of subsidence prediction have used a prediction function formula to evaluate stress in the rock formation, and the final subsidence curve position after mining was predicted, including empirical equations [15]. A subsidence influence function correction method based on ground observation results, was used to estimate maximum subsidence function under the discontinuous subsidence [16,17,18]. A. G. Corkum used a traditional surface subsidence model to predict the subsidence of a geological model established by the three-dimensional finite difference method [19] and found that the theory was inconsistent with finite element modeling. The traditional model was improved, and a new mining subsidence model was established when the transition between soft and hard rock layers in the underlying strata was converted [20,21]. Yang developed a prediction model of the surface subsidence curve based on an artificial neural network and cylindrical map of geological conditions [22]. However, the traditional subsidence prediction method does not take into account the comprehensive influence of geological structures, mechanical properties of the rock mass, or ground stress on subsidence. The empirical model of compensation depends on specific mining sites, which is suitable for subsidence simulation of similar sites [23,24]. An understanding of the overlying strata movement mechanism, which the physical model provided, played a significant role in developing prediction methods for mining-induced subsidence at a time when sophisticated numerical models and computer programs were not developed [25]. With the development of computer technology, a numerical model based on finite element and infinite element theory comprehensively utilized the physical and mechanical properties of rock to obtain the subsidence curve [26,27,28]. Due to the difficulty of obtaining mechanical parameters of rock mass in mining sites, and the variability of laboratory measurements, an improved prediction model of composite rock subsidence can be proposed by comprehensively analyzing subsidence parameters obtained by a numerical model and a physical model verified by field monitoring [29,30,31,32,33].
In the present work, dynamic ground subsidence was predicted using a physical model as well as a numerical model, and detailed analysis was carried out to predict subsidence caused by underground longwall mining of a coal seam in Zhang Ji mine. In this study, a similar material physical model was used to study the subsidence mechanism and characteristics of composite strata, and the key parameters describing the strata movement behavior in longwall mining progress were obtained. The model test results were verified by finite element modeling [13,34]. In order to study the law of movement and failure of overlying strata and the law of surface subsidence during mining, taking the geological and mining conditions of Zhangji coal mine as the research object, similar material coal models with horizontal and 10-degree dip angles were made in a gently inclined section of rock formation in the mining area, and a similar material simulation experiment was carried out. Based on the experimental results, a law for movement and failure of overlying strata after coal seam excavation was attained. Furthermore, comparing the results from numerical and physical similarity models, a reasonable subsidence prediction model was proposed [35].
Understanding the subsidence behavior of composite strata caused by underground mining operations is the most crucial aspect of environmental impact assessment and mining design. Similar physical models and numerical simulation methods are essential to observe subsidence behavior [10,36]. Based on the results of the two methods, current prediction methods of stratum subsidence and horizontal movement can be improved and innovated and provide theoretical and methodological references for similar composite rock formations.
2. Similarity Modeling of Mining Subsidence in Zhangji Mine
2.1. Subsection Engineering Background
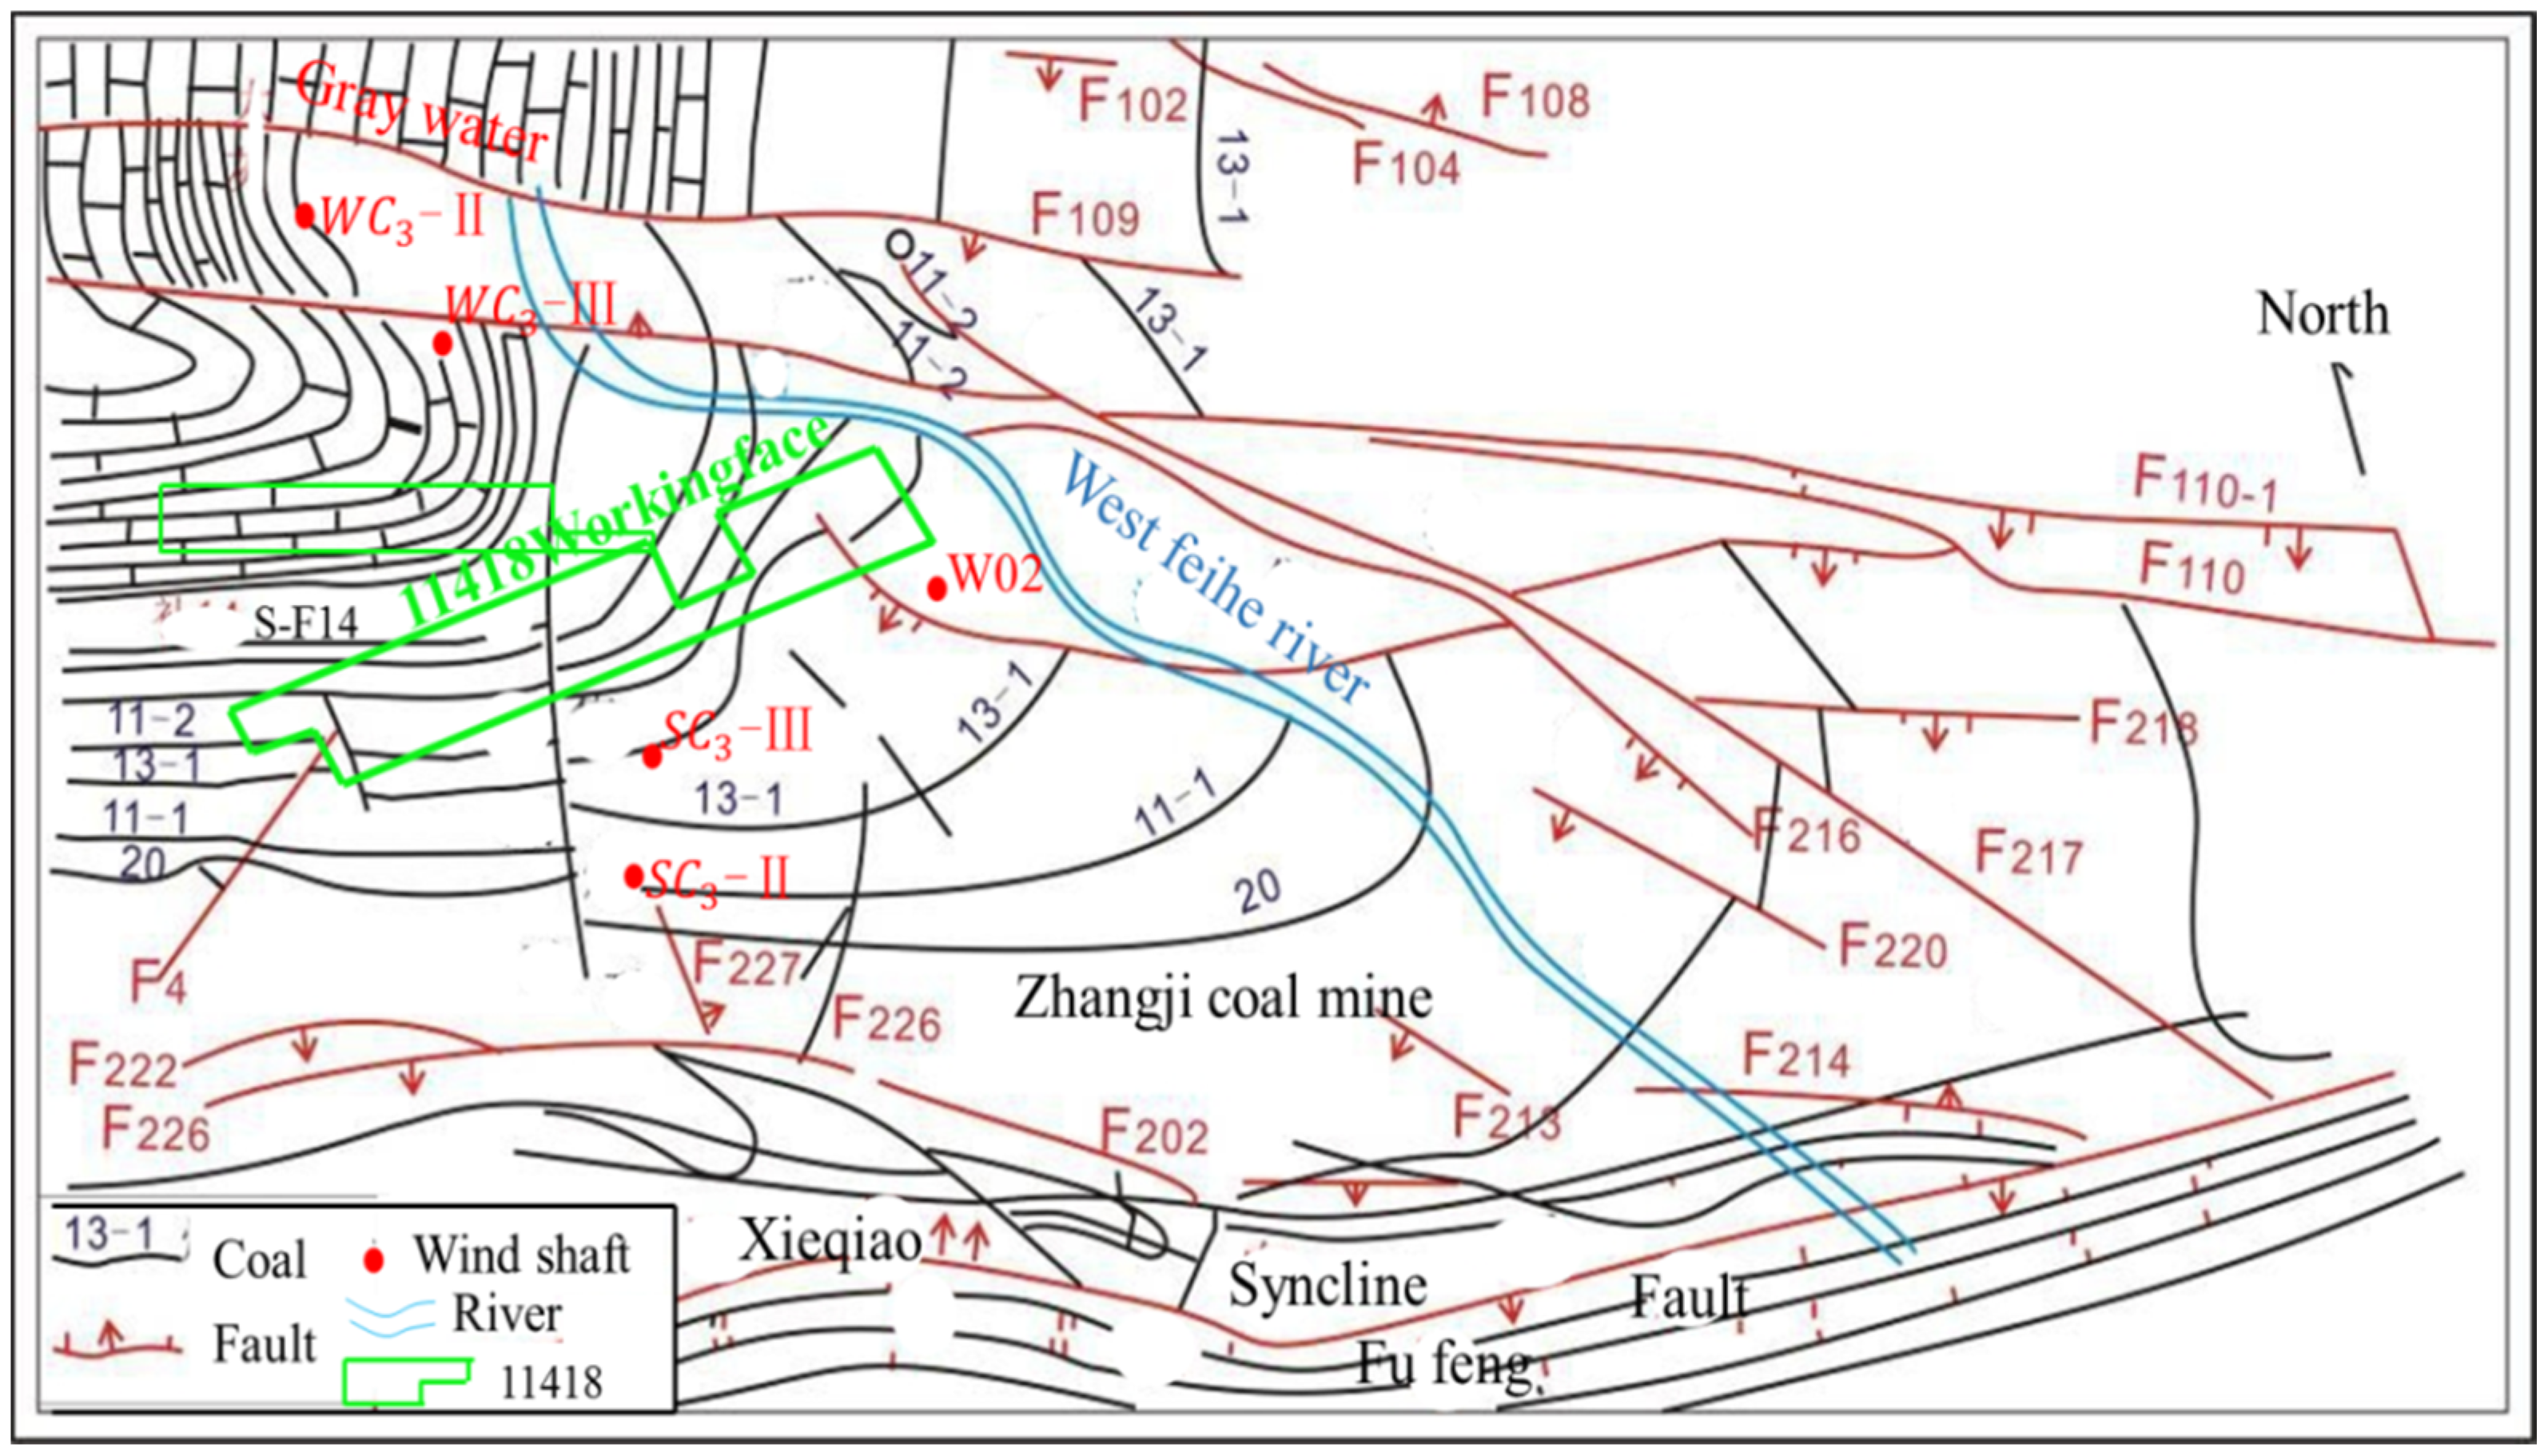
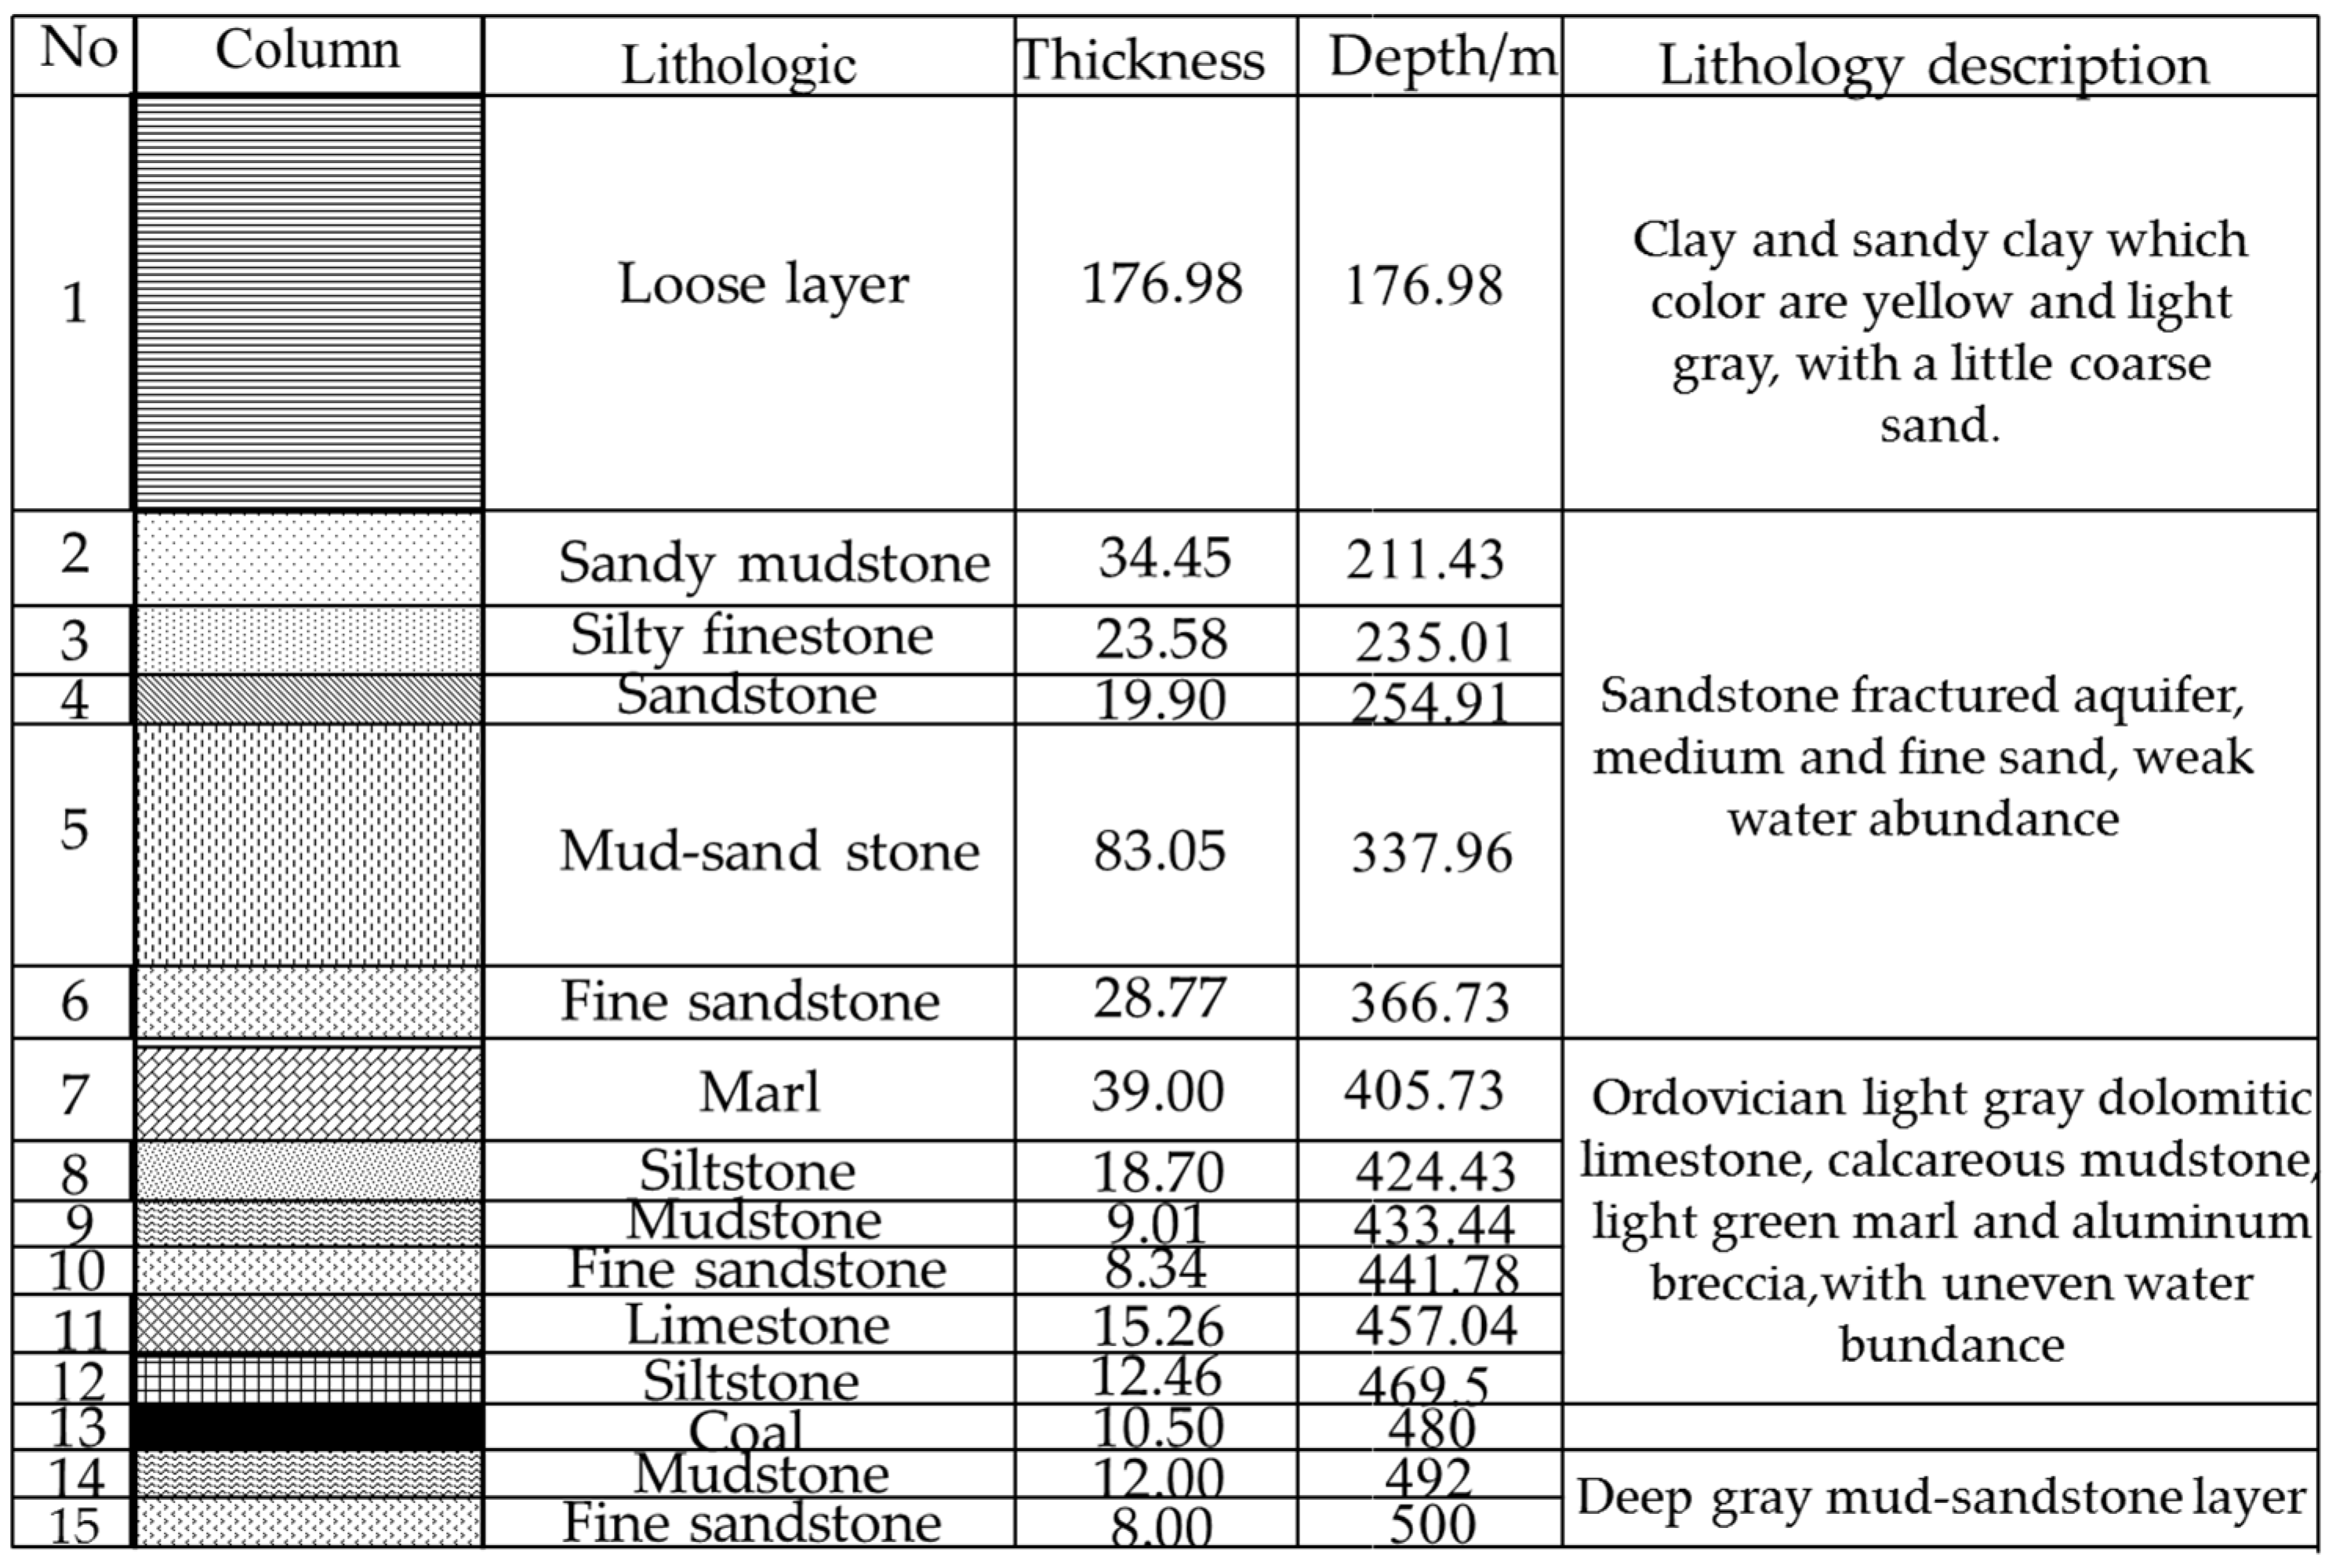
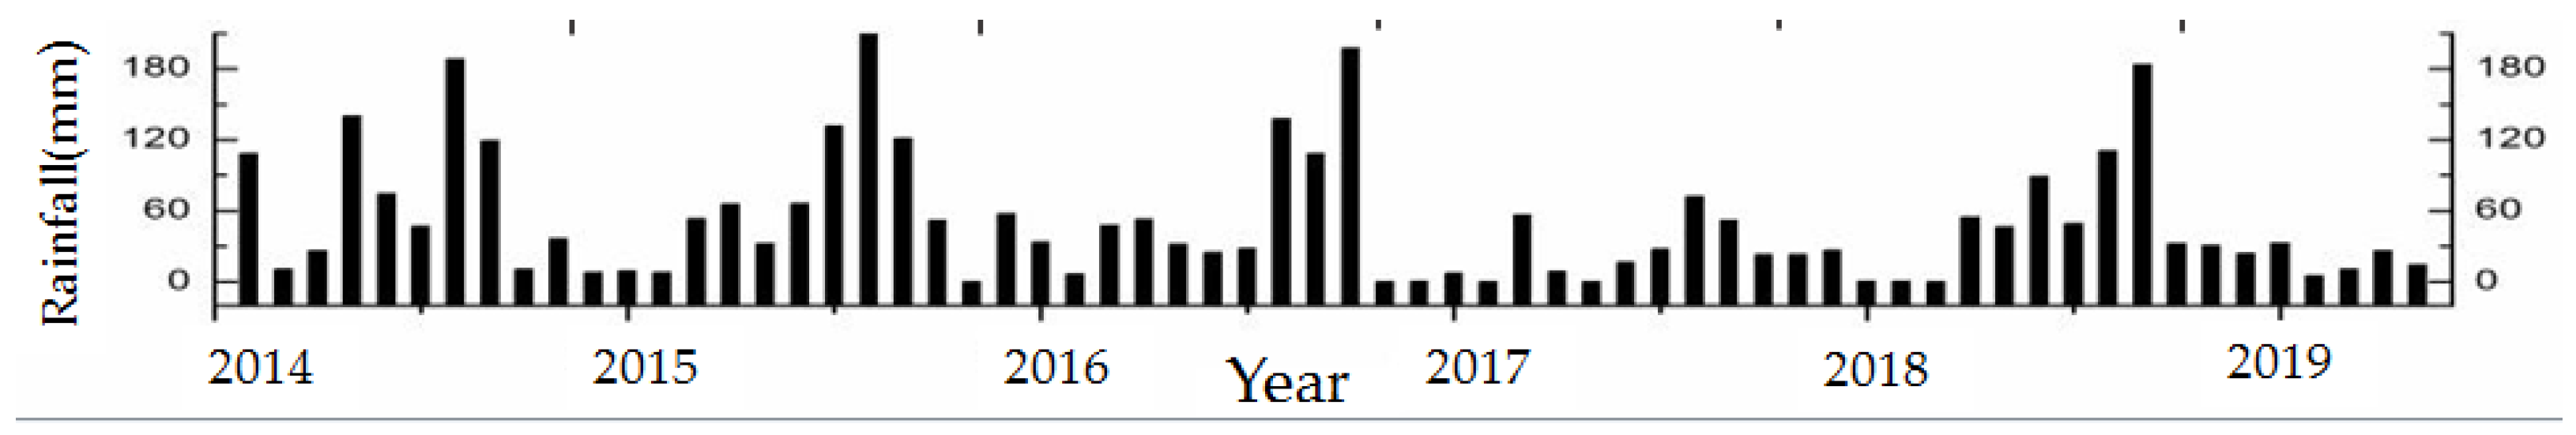
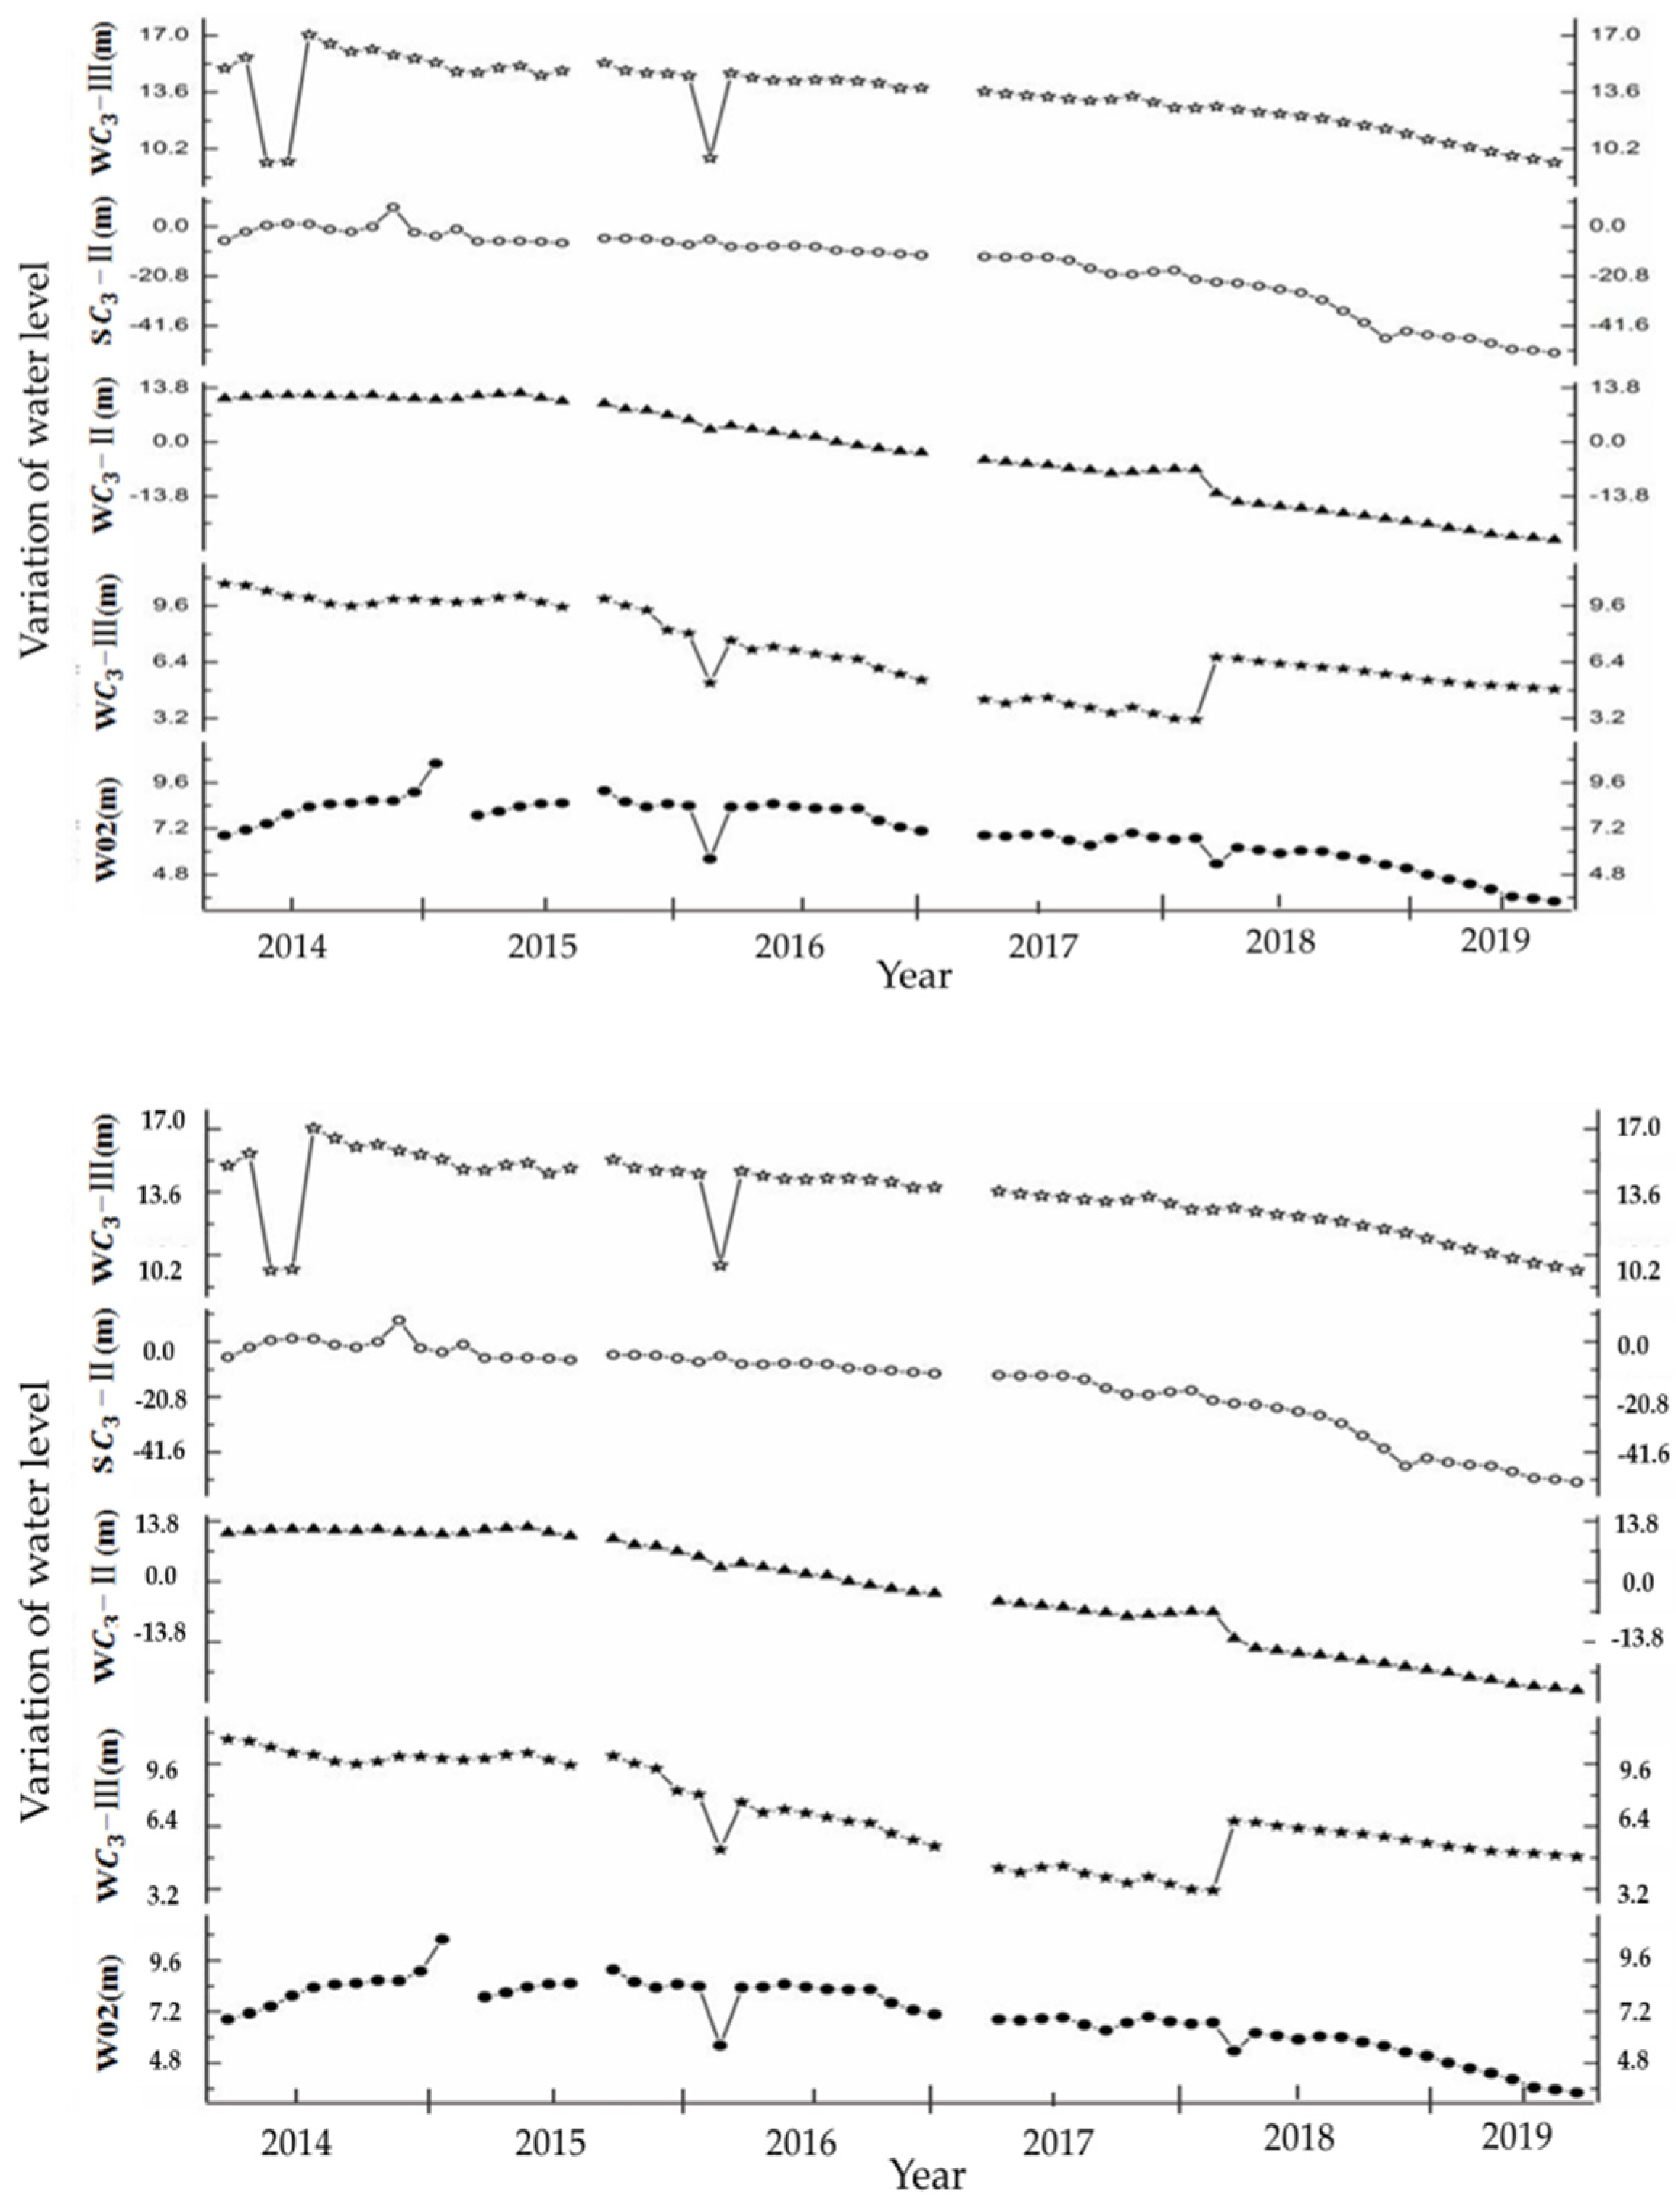
The Huainan mining field is located in the north-central part of Anhui Province, with a good geographical location and convenient transportation. The mining area is about 100 km long, 30 km wide, and covers an area of 3000 km2. Zhangji coal mine is located in Zhangji town, Huainan mining area (see Figure 1). The overlying stratum is a cenozoic loose layer with lower limestone and coal measure strata from the Cambrian, Ordovician, carboniferous, and Permian coal measures (see Figure 2). The 11418(W) working face has a strike length of 212 m and an inclined length of 1260 m, which is arranged along the slope and mined upside down. The average buried depth of the 8# coal seam is 500 m, with an average thickness of 3 m and a 4° average inclination. The geological data and corresponding rock mechanics parameters of the rock mass obtained by drilling are shown in Figure 3, and Table 1. The rainfall and water content of the rock formations are shown in Figure 4 and Figure 5.
Figure 1.
Coalfield structure map of the Zhangji mine.
Figure 2.
Quaternary geological structure map of the Huainan mining area: (a) I—Upper loose diving layer; II—pressurized water isolated layer; III—lower confined aquifer, impermeable layer; (b) rock samples obtained by drilling.
Figure 3.
Geological borehole histogram of 8# coal mine in Zhangji field.

Table 1.
Drilling information of borehole rocks in the mining field.
Figure 4.
Annual rainfall of Zhangji mine in the past six years.
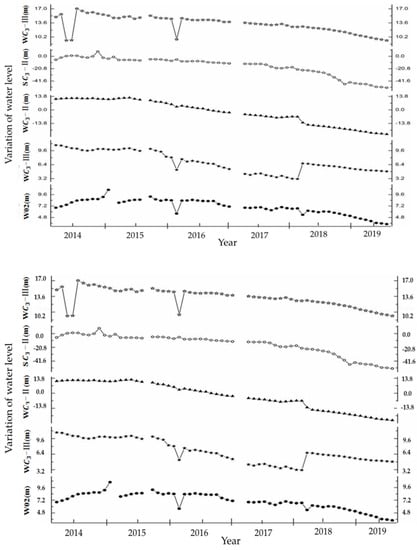
Figure 5.
Dynamic change curve of water level of five wind wells in the Zhangji mine field.
2.2. Similar Theory and Modeling Principles
2.2.1. Determination of Similar Material Ratio
In accordance with similarity theory and the field test, the modeling material properties were designed and satisfied, relying on model results, and the impact of mining activities was analyzed [37]. Considering the scale difference between the coalfield and laboratory experiment, choosing a reasonable similarity ratio can reduce the influence of size difference on the subsidence of rock formation during and after mining. Whittaker and Reddish stated that parameters that have a major influence on the mechanical behavior need to be considered and analyzed, including geometry, stress, bulk density, and time similarity, along with the similarity fundamental condition described below [38]:
where CL, is the geometry constant, Cσ, is the regular strength, Cρ, is the constant of density similarity between the model and the prototype case, L is length, σ is compressive strength, and ρ is density.
- Size similarity ratio
According to the mining depth of the coal seam and the actual model height, the similarity ratio of size is obtained as:
where parameters p, m stands for prototype and model, respectively.
- Stress strength similarity ratio.
Strength parameters of the natural rock mass can be estimated by a rock mass rating system based on laboratory uniaxial test results of rock samples obtained from field drilling. Based on the theory that the average uniaxial compressive strength of natural rock mass is 28% that of the indoor intact rock, the natural rock mass strength can be obtained. The similarity model of rock mass is expressed as:
where parameters p and m indicate prototype and model, respectively.
- Density similarity ratio.
The aggregates of the physical model are ordinary river sand, with a diameter less than 1.5 mm, lime, gypsum, and mica powder, which can simulate the rock bedding structure, as shown in Figure 6. The cylindrical specimens were prepared by mixing various materials with water uniformly. The contribution of various materials to the compressive strength of the specimens was obtained by a uniaxial compression test. According to the strength value of each rock layer in the physical model obtained by Equation (4), and the laboratory mechanical test parameters of rock samples in Table 2, the mixing proportion and content of materials in each rock layer can be reasonably determined, as shown in Table 3.
where is the actual rock density, and is the model rock density.
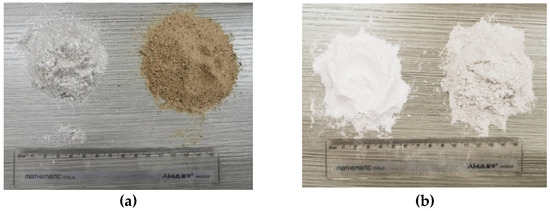
Figure 6.
Physical model materials: (a) mica powder and sand; (b) gypsum and hydrated lime.
Table 2.
Laboratory mechanical test parameters of rock samples.
Table 3.
Simulation material parameters of the physical model.
2.2.2. Verification of the Strength of the Rock Formation in the Physical Model
- Compression strength
According to the proportion of each material in the model, a cylindrical specimen is made, and the stress-strain curve of the sample is obtained on the triaxial compression testing machine, as shown in Figure 7. The actual value of the rock formation strength of the physical model is close to the theoretical calculation value, and the error is less than 1% (see Table 4). The strength requirements are combined, and the material strength of the physical model is verified.
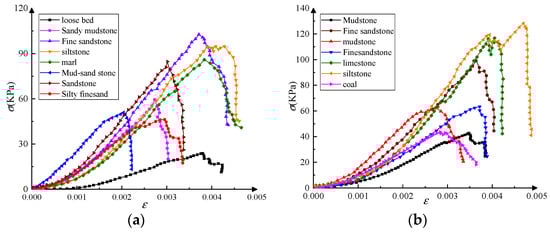
Figure 7.
The uniaxial compression stress curve of each rock formation in a physical model: (a) roof slab; (b) coal seam and floor.
Table 4.
Comparison of uniaxial compression strength of similar materials.
- Tensile strength
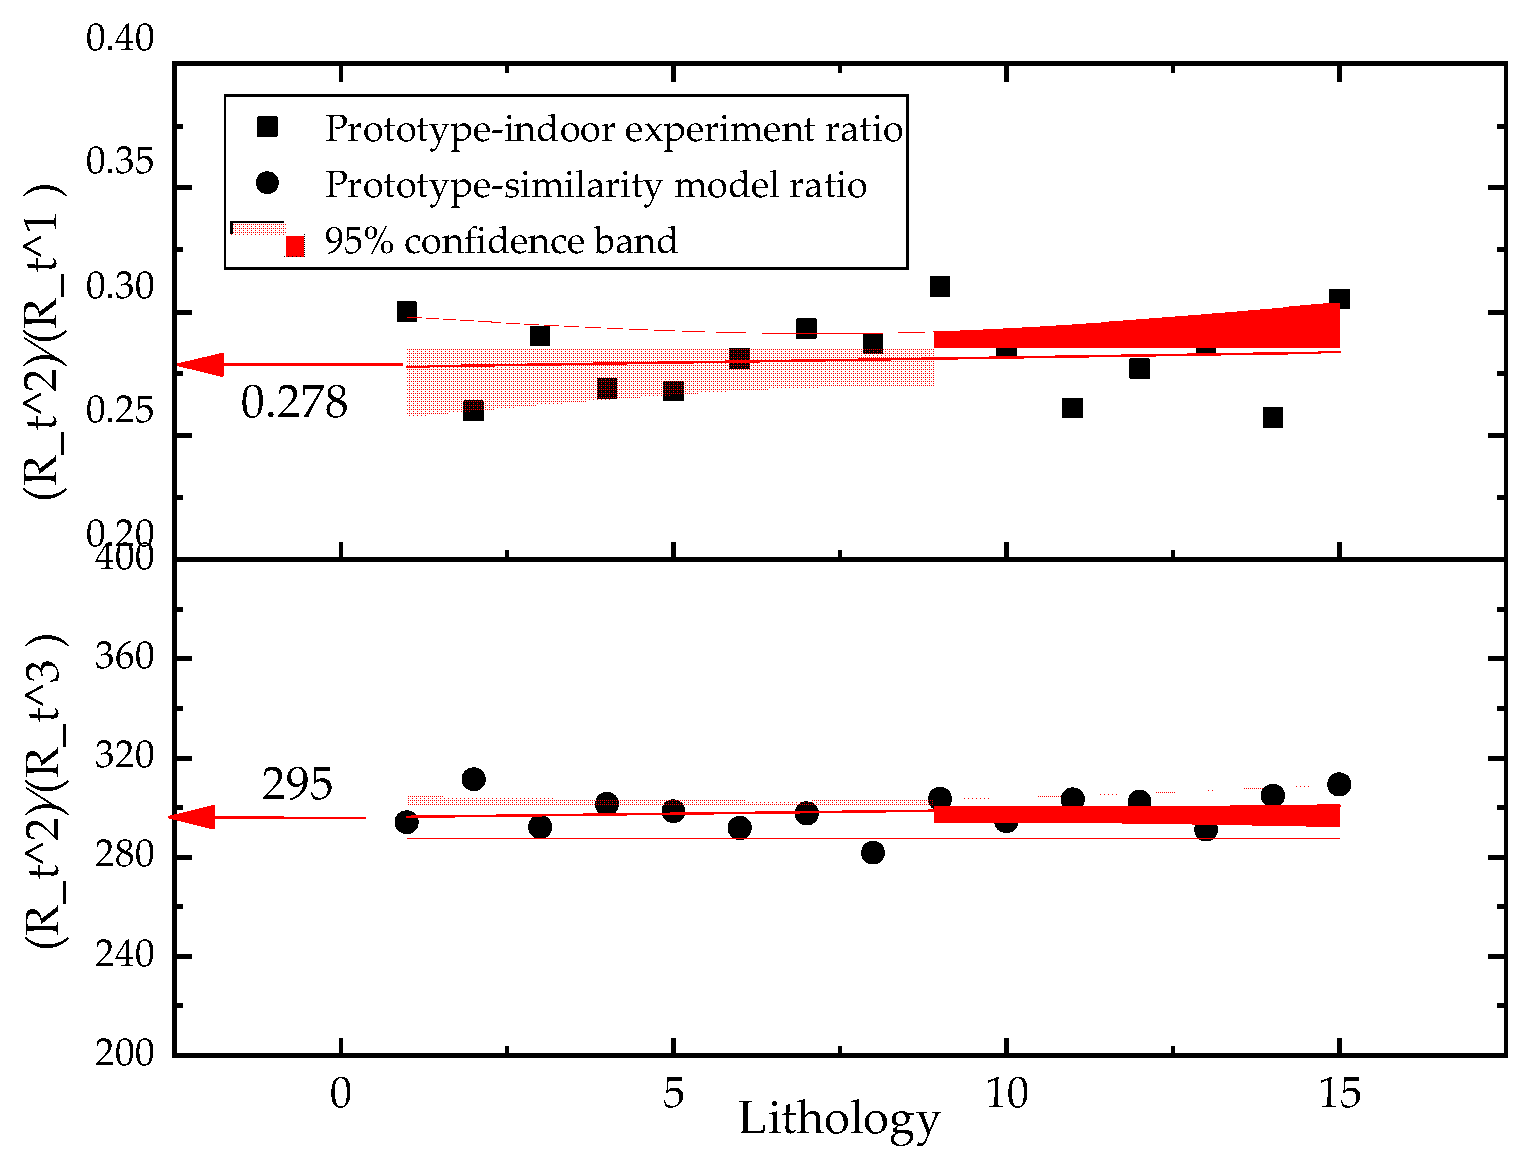
Based on the uniaxial compression strength of the indoor samples meeting the similarity ratio, the tensile strength of similar materials is verified. The results are shown in Figure 8 and Table 5. For tensile strength, the ratio of the strength results of the site rock mass to the indoor rock sample is close to 0.278, and all the ratios are within the 95% confidence interval. In addition, the similarity ratio value of the physical model is close to 295, and all the similarity ratios fall within the 95% confidence interval. It can be considered that the tensile strength of similar materials meets the requirement of strength similarity ratio.

Figure 8.
Comparison of tensile strength between on-site rock mass, indoor and model specimens.
Table 5.
Comparison of tensile strength in laboratory test and the physical model.
2.3. Experimental Device Set-Up and Process
2.3.1. Model Devices and Test Procedure
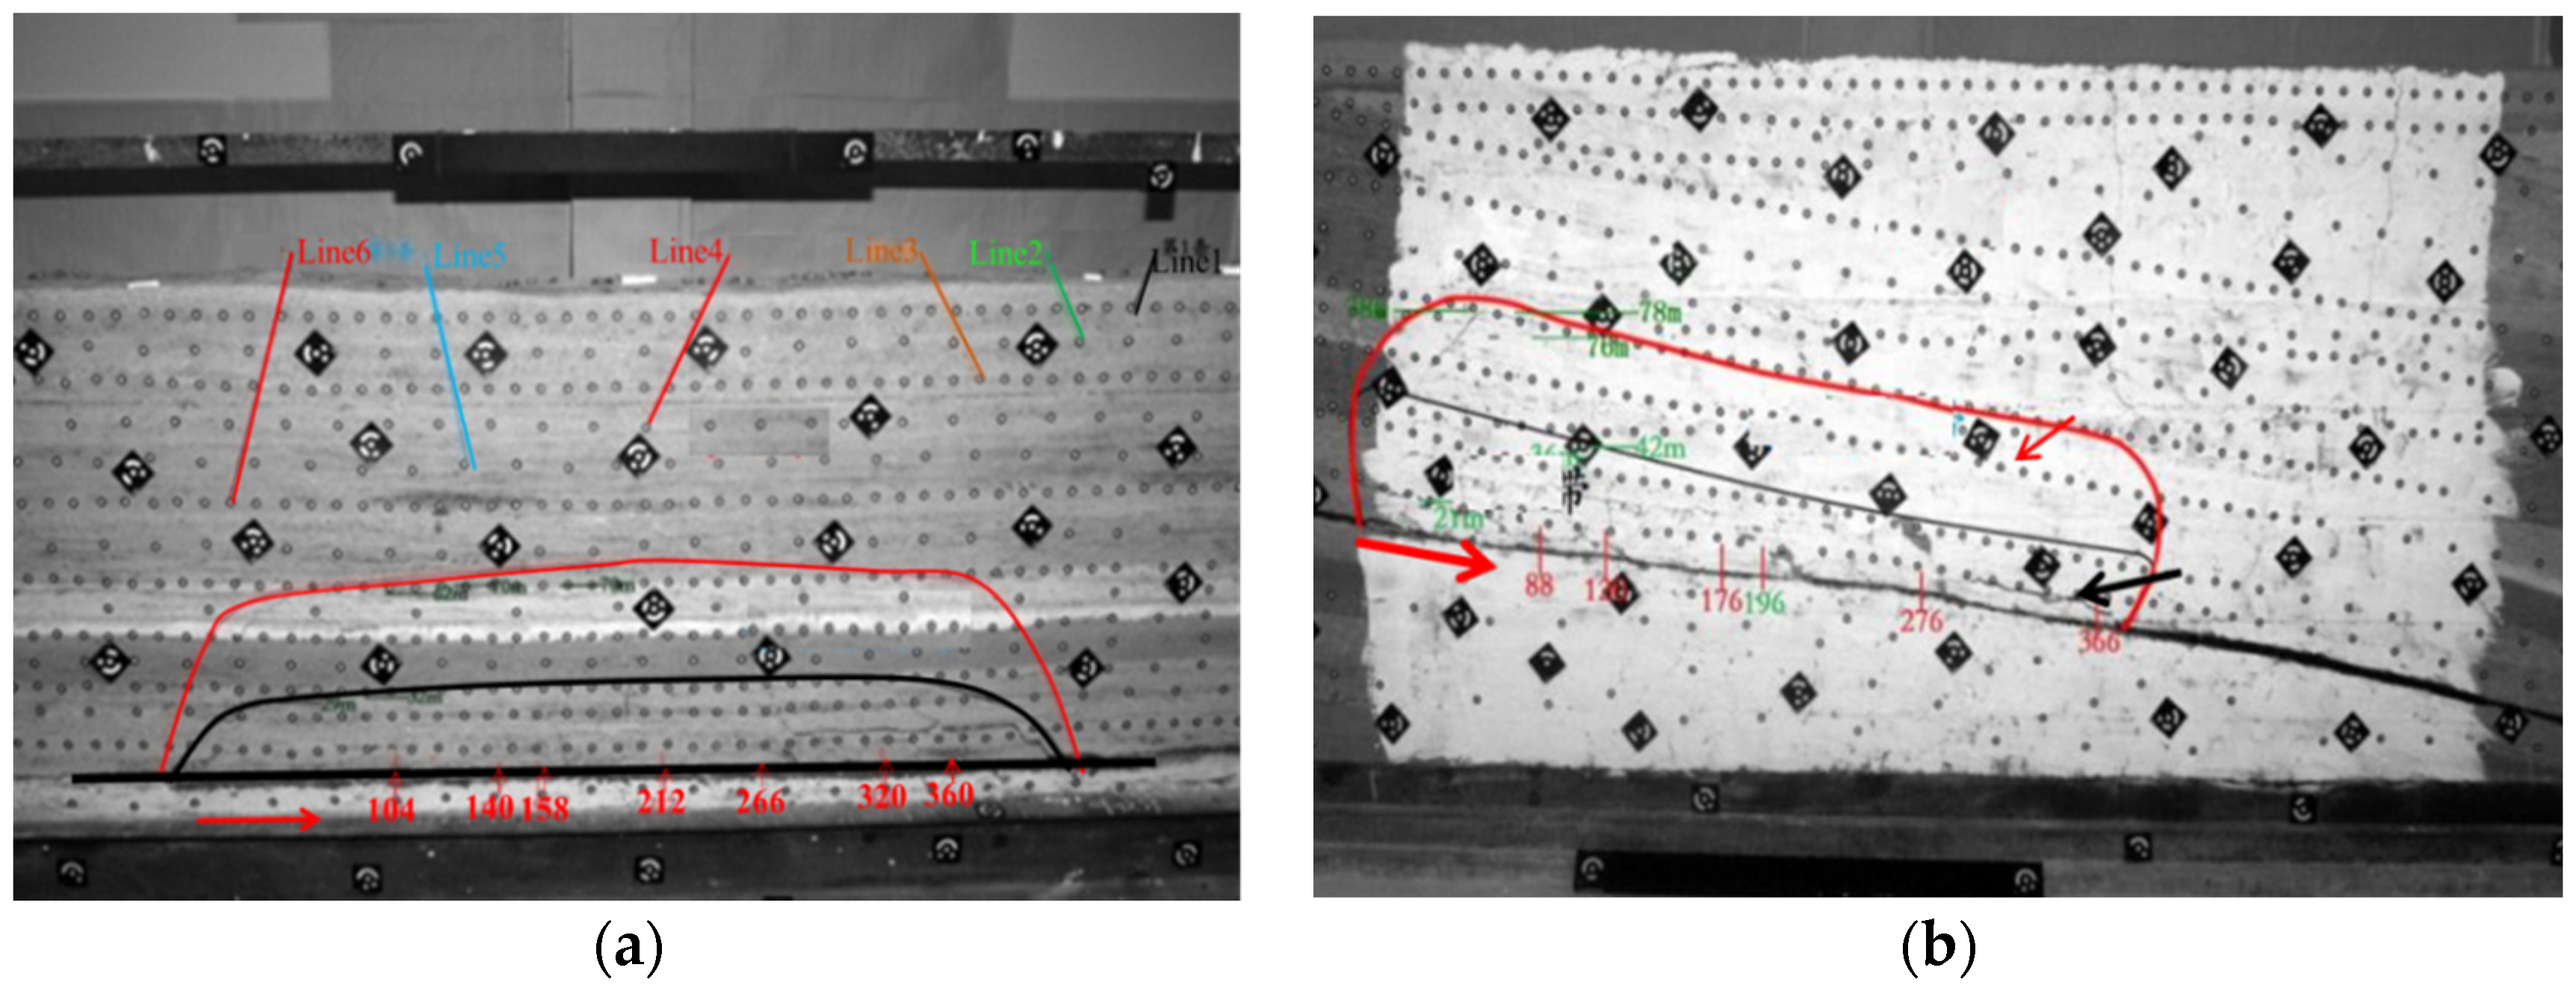
A physical experiment was carried out on a similar material model frame with length 4.0 m, width 0.5 m, and height 2.0 m. The thickness of each rock layer was obtained by synthesizing the field drilling data, and the similarity ratio of the model size, which was premarked on the steel frame on both sides of the model. The rock materials prepared according to the mixing ratio were installed in the model layer by layer according to the order from bottom to top, and mica powder was used as the bedding and joint line between strata, with strain and displacement gauges installed in the corresponding sizes according to the layout drawing of the applied displacement measuring point see Figure 9a, and the fiber optic measuring points which set at the top of the physical mode (see Figure 9b). In Figure 10, the test set-up and sample model after paving are shown.
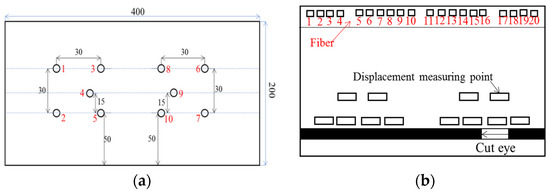
Figure 9.
Layout of stress measuring points: (a) stress measurement points; (b) fiber displacement measuring points.
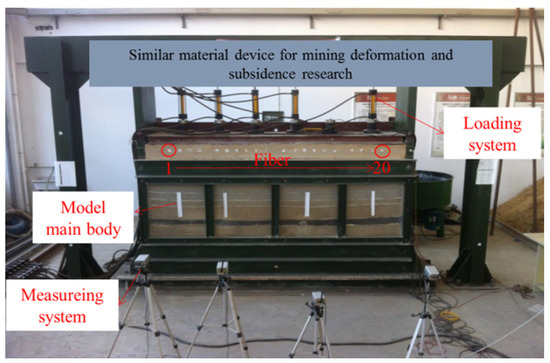
Figure 10.
Overall equipment diagram included in the physical model.
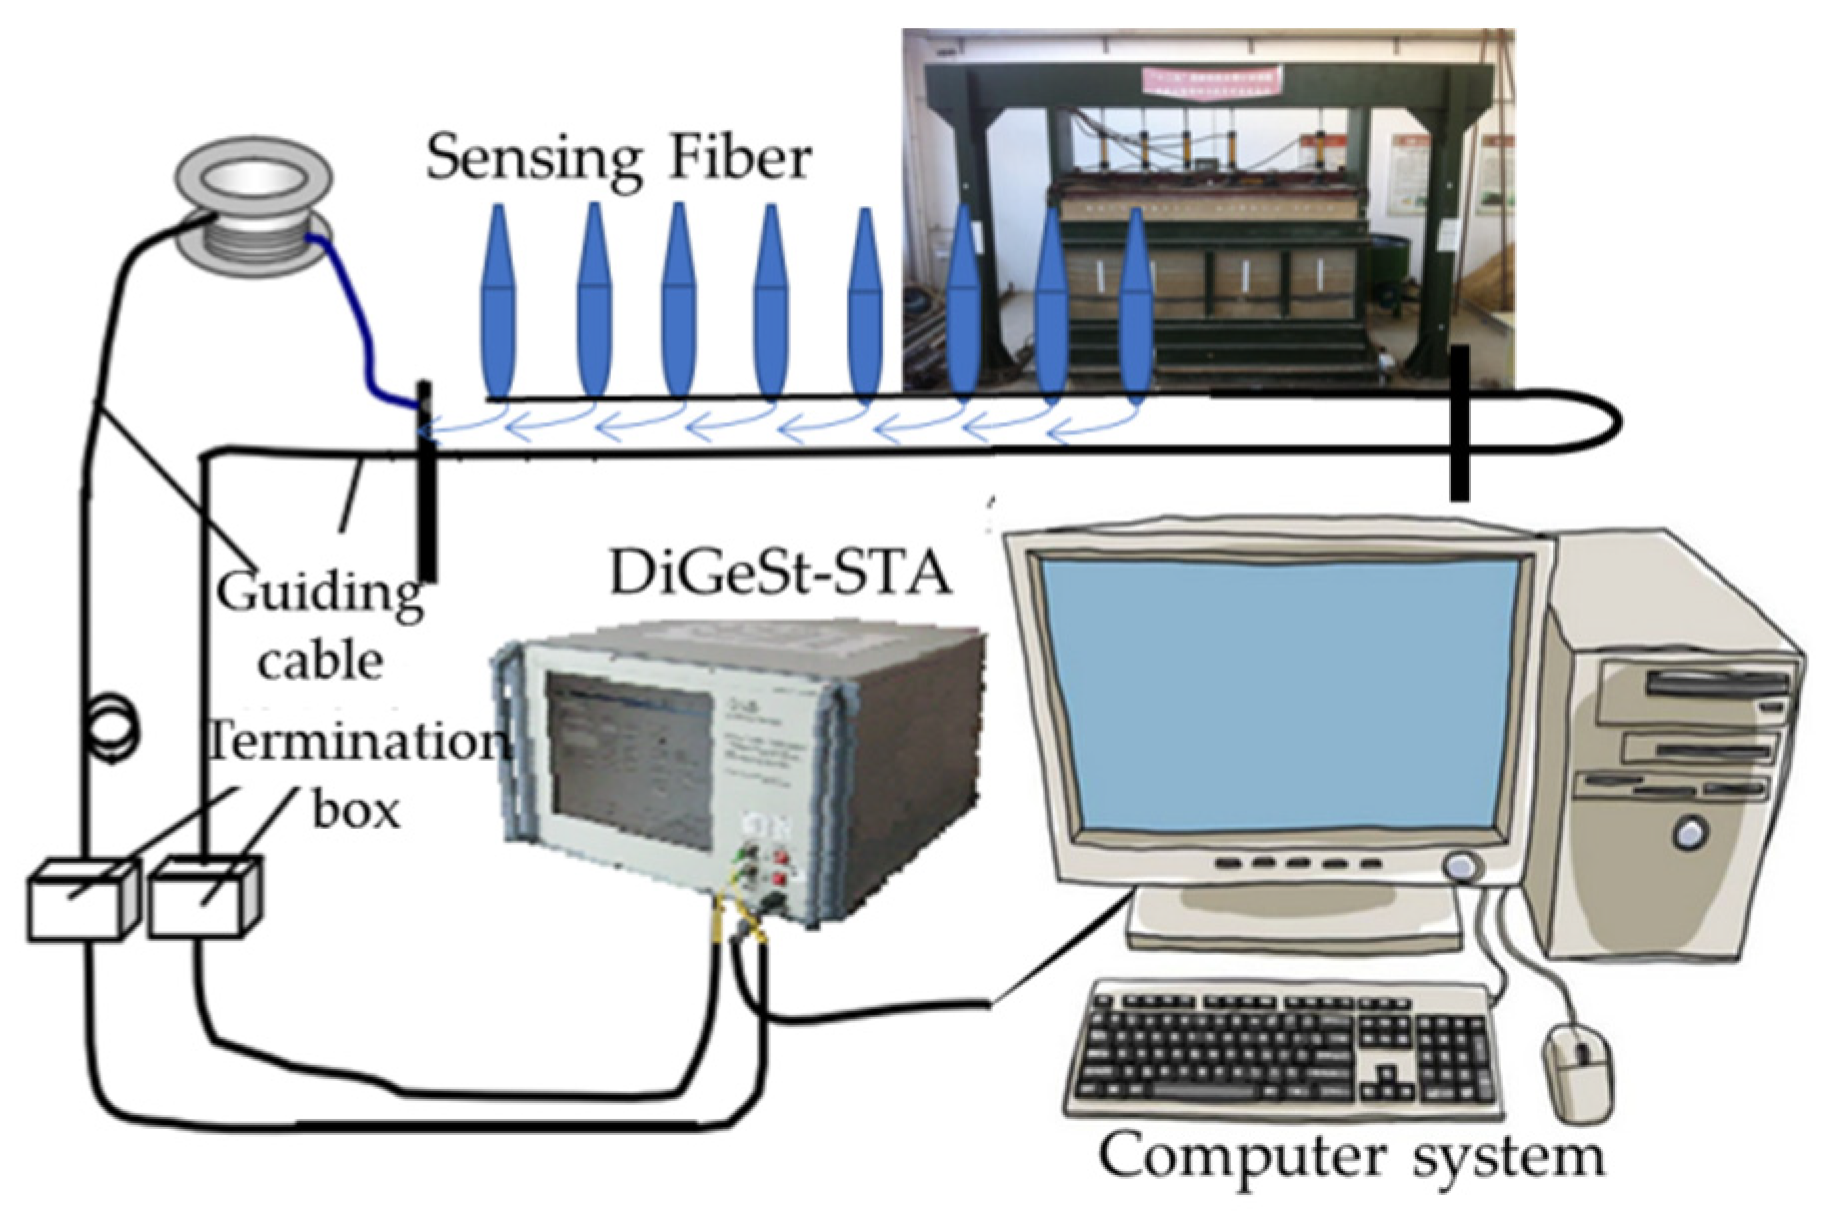
The whole system consists of three parts, the PST multichannel coordinated loading system, the model body, and the measurement system. For the measuring components, CSTM-1508 dynamic earth pressure boxes, and the computer storage system were used to record rock pressure. An optical fiber sensor system (DIGEST-STA analysis system, as shown in Figure 11) at the top of the model monitored surface displacement. In addition, displacement markers on the model surface matched with a high-definition digital camera were set to observe settlement of the rock formation. Different measurement results could be obtained and the extensive use of multiple scenarios achieved the most accurate measurement of cross-checking output and rock subsidence. A week after the model was installed, sequential extraction of the coal seam was mined by cutting the eye 40 cm from the model boundary, with each mining length of 20 cm, and two hours were given for the upper panels to fully development.
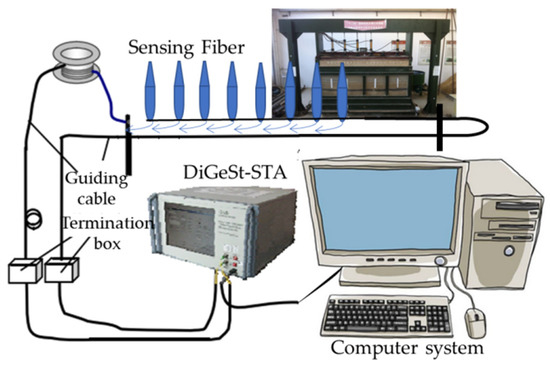
Figure 11.
DIGEST-STA analysis system.
2.3.2. Model Validation
- Stress and subsidence rate
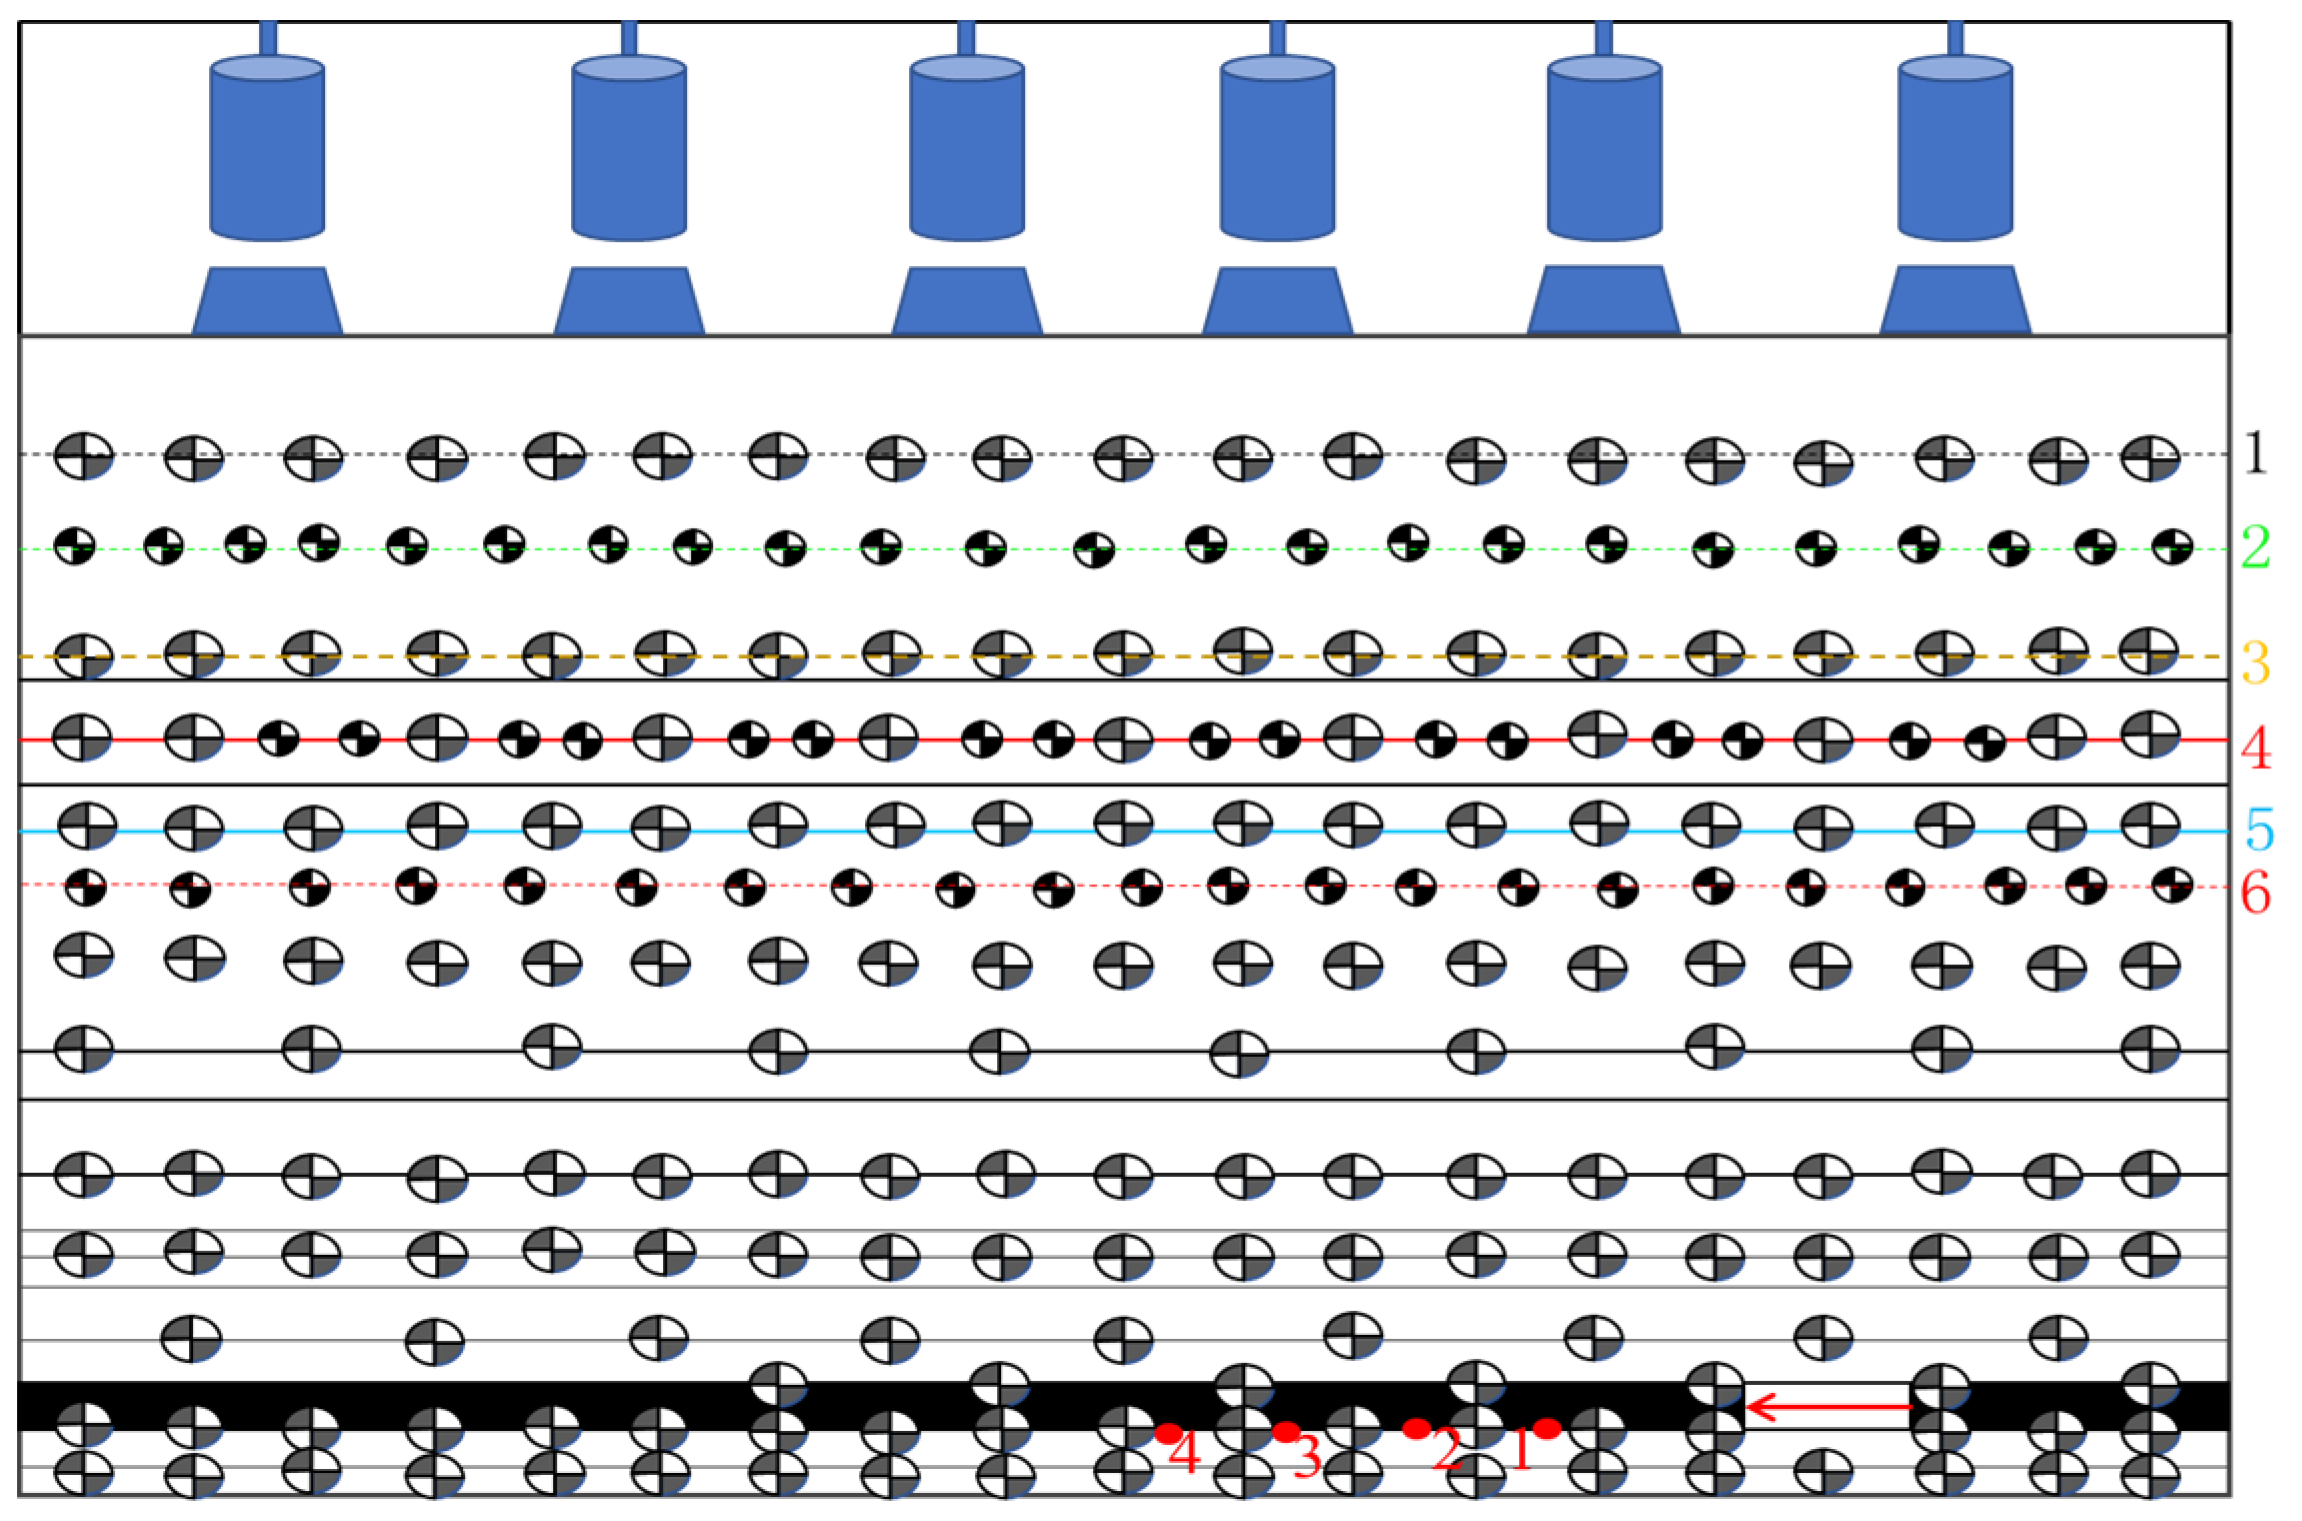
After model paving was completed, four measurement points of the coal seam floor, as shown in Figure 12, were selected, and the stress and subsidence values of the site after mining were recorded, along with the six parallel displacement lines (1–6) on the surface of the model to observe subsidence. Results are shown in Figure 13. The results show that the stress and subsidence of the physical model are slightly larger than the on-site monitoring results, which are close to each other. The results of four monitoring points at the coal seam floor proved the correctness and usability of the physical model.
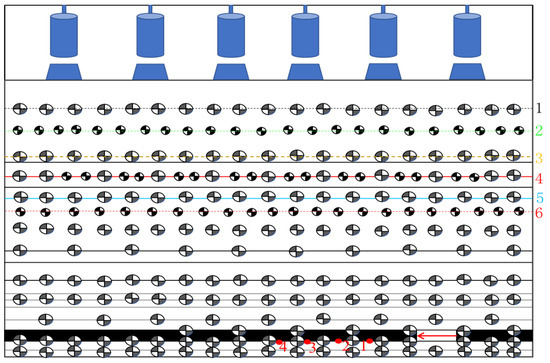
Figure 12.
Surface displacement point arrangement.
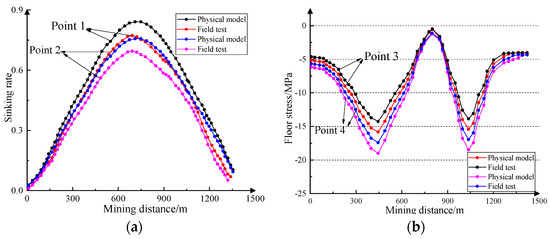
Figure 13.
Comparison of stress and subsidence rates of the coal roof in the physical model and the field. (a) Sink rate curves of points 1 and 2; (b) floor stress curves of points 3 and 4.
- Results of Fiber optic measuring points and D-InSAR measurement
The D-InSAR method extracts and separates two successive radar complex images acquired in the same area, which can eliminate the influence of interfering phase signals such as terrain, atmosphere, and noise, then obtains surface deformation information. The specific analysis process includes radar image registration and resampling, interferogram generation, deformation signal separation, phase unwrapping and projection transformation, and other key data processing steps. In the end, the surface deformation information is obtained. In this paper, the two-track differential interferometry technology was used to analyze the surface deformation of the SAR image data provided by EnViSat ASAR in the C-band of the coal mining subsidence area. Subsidence parameters of the coal mining subsidence area in different periods of the mining area were obtained. The settlement spatial distribution and qualitative strength analysis show that all settlements are within or near the boundary of the well field. As shown in Figure 14, comparing and analyzing the results of optical fiber measurement and ground monitoring of the physical model, the intensity curves of the two are in good agreement, which shows the accuracy of the numerical model meets the requirements [39].
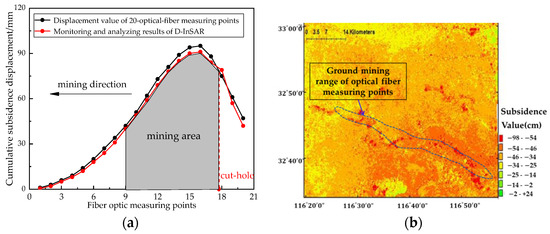
Figure 14.
Analysis of optical fiber measuring points and D-InSAR measurement results. (a) Comparison of settlement results; (b) cumulative settlement results of D-InSAR.
3. Physical Model Test Results
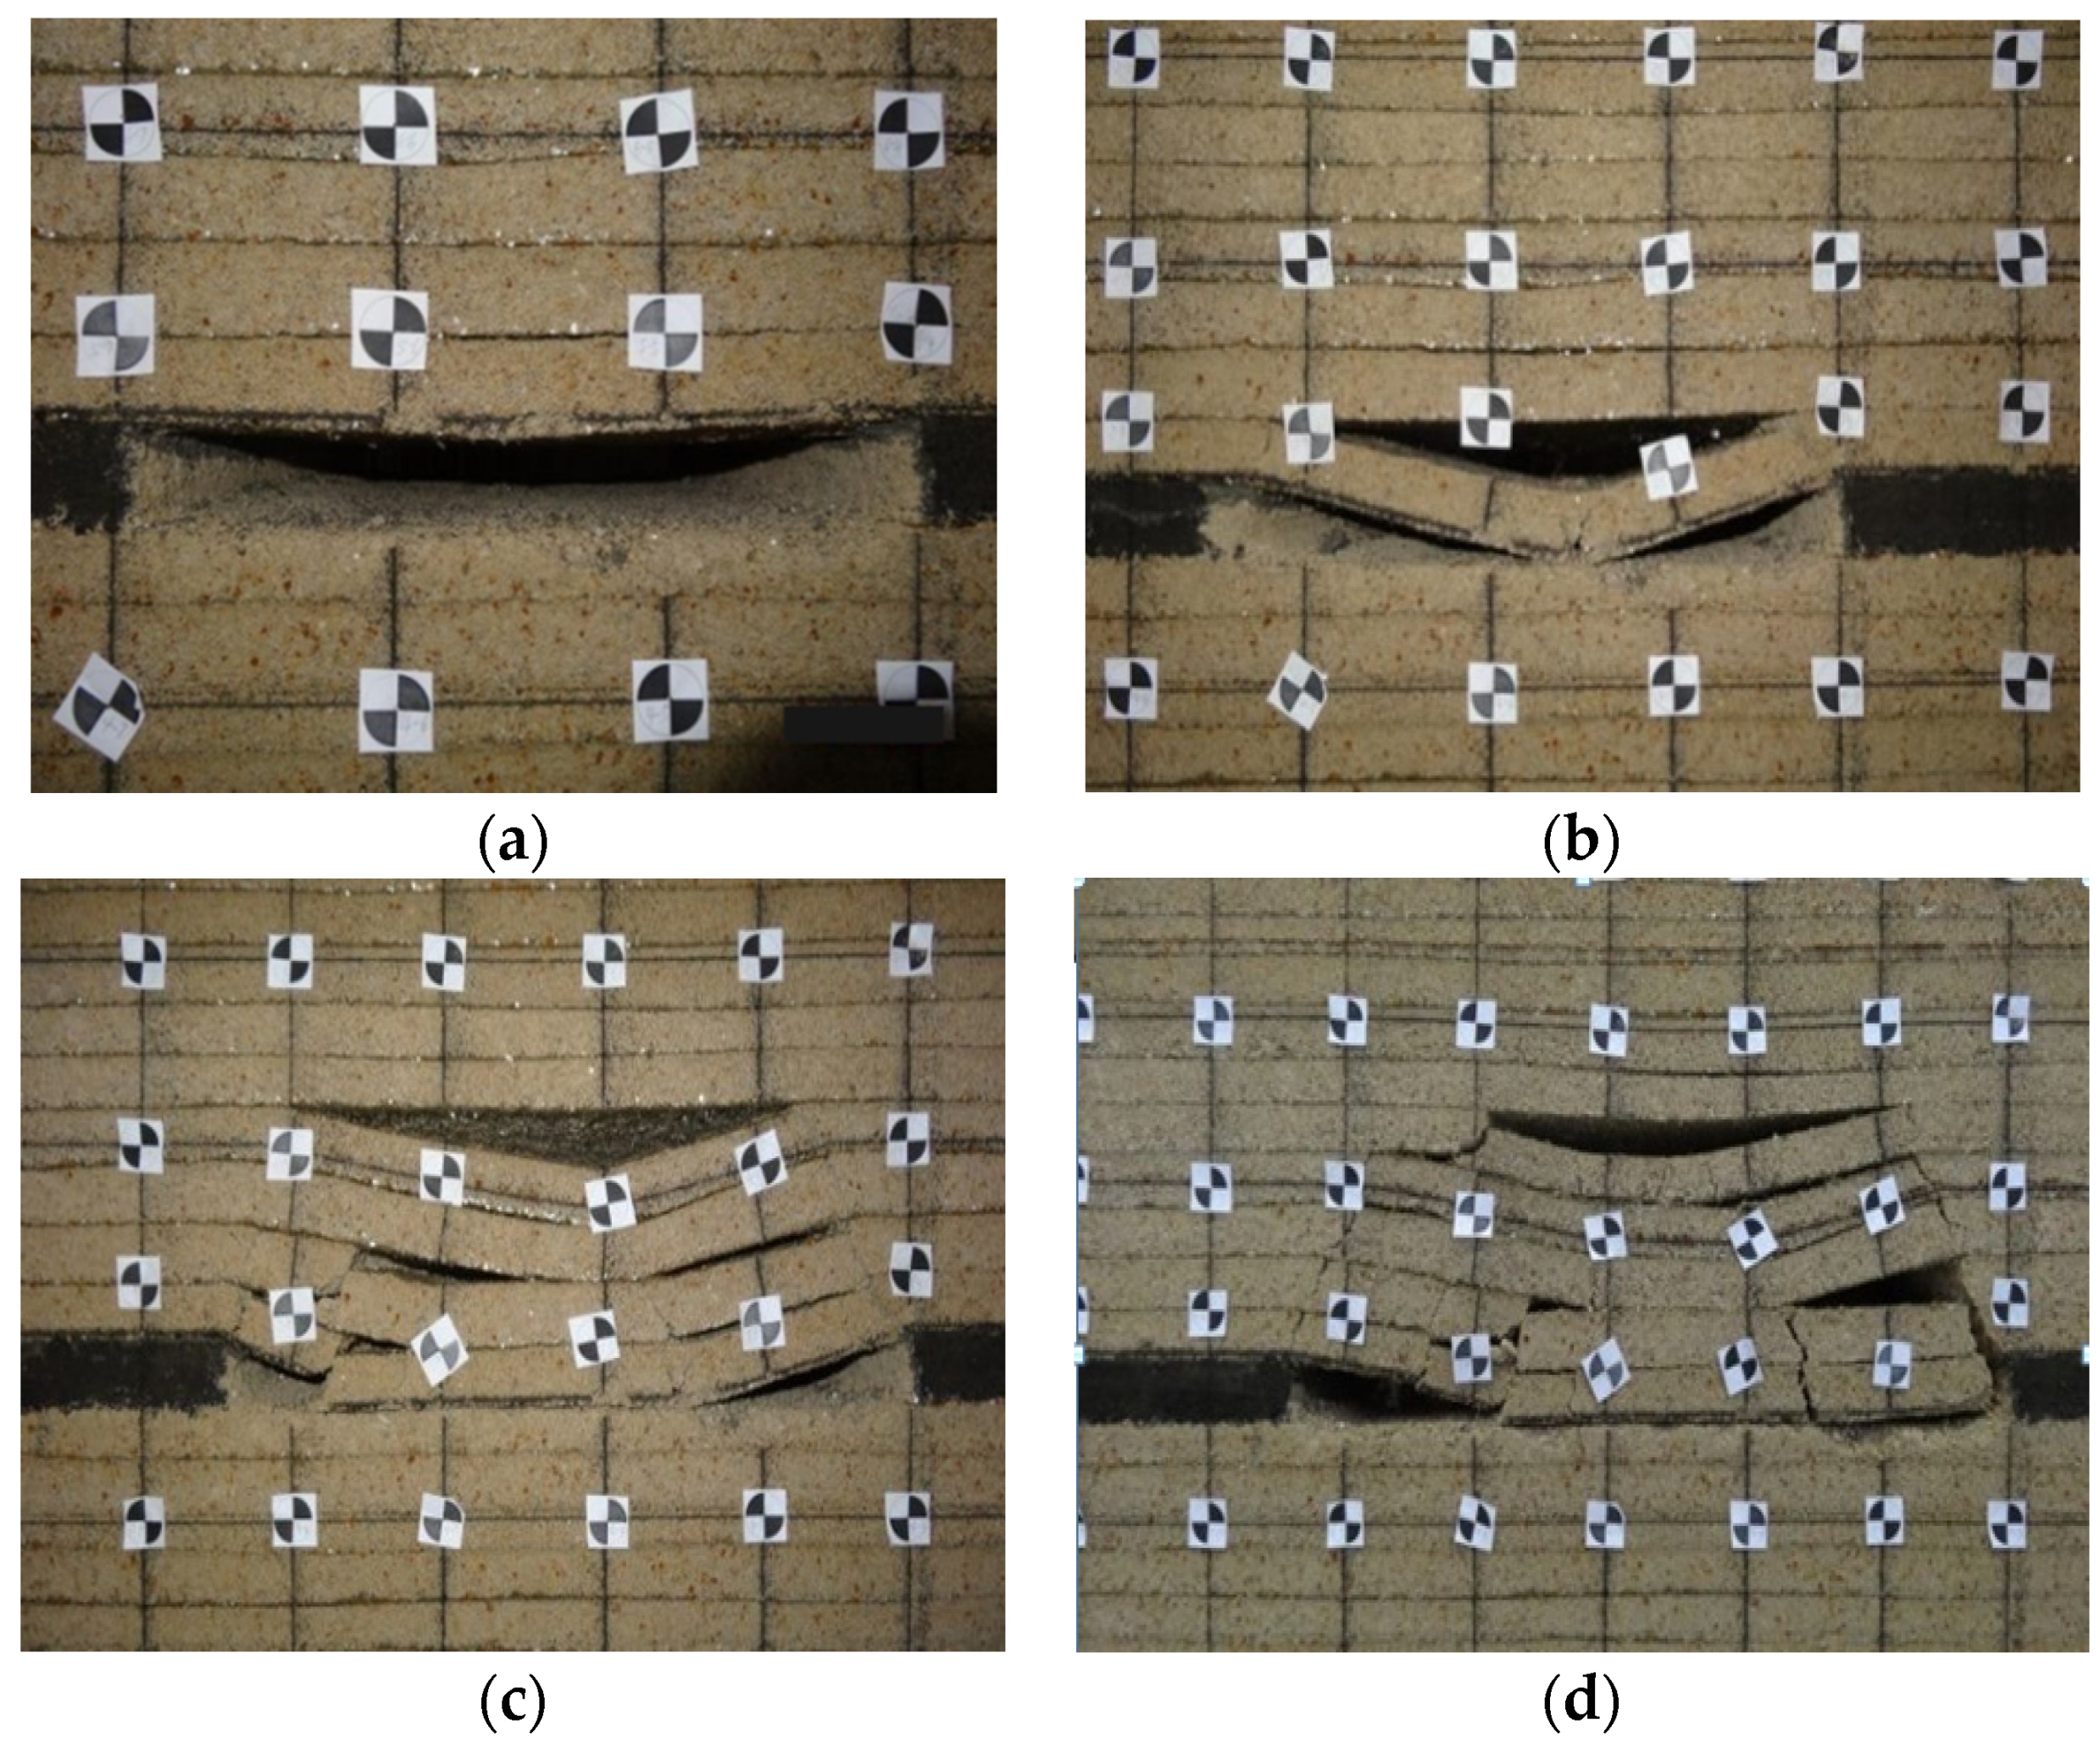
In this experiment, two-angle (horizontal and 10-degree) coal seam models were installed. The stabilized physical model is shown in Figure 15. After the coal seam was thoroughly mined, complicated horizontal and vertical movement and deformation occurred in the upper strata of the mined-out area. The final stable overlying rock layer s underwent different degrees of deformation and failure after mining, which can be divided into three areas: a caving zone, a broken zone and a bending zone. Both the caving zone and fracture zone can conduct water, which is called the water-driving fracture zone. According to the model observation data, the height variation curve of water flowing in the fractured zone during mining is shown in Figure 16. Rock crack development and the settlement formation process in different coal seam mining distances are shown in Figure 17.
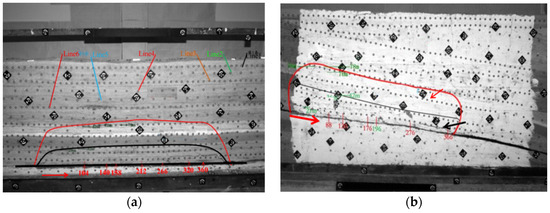
Figure 15.
Failure mode of overburden rock of the two-angle coal mining model. (a) Horizontal model; (b) 10-degree model.
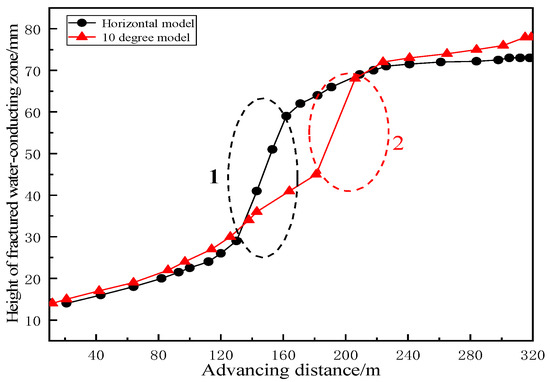
Figure 16.
Water conduction height of the two models.
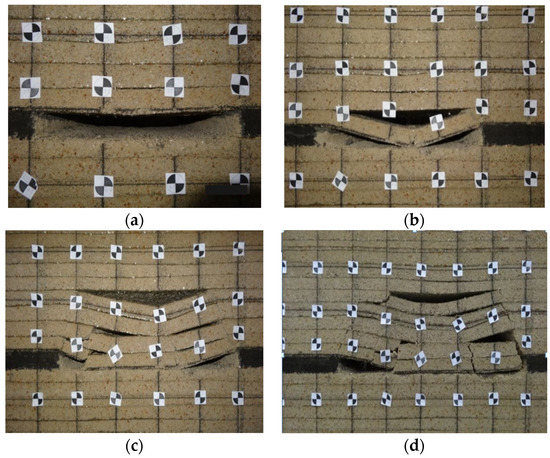
Figure 17.
Development of goaf and fracture in the mining process: (a) 75 m; (b) 100 m; (c) 125 m; (d) 150 m.
3.1. Sinking and Horizontal Movement Law of Overlying Strata
Stratum observation points were arranged at different heights above the coal seam on the model’s surface to explore the movement and transmission laws of the roof strata. According to the change of observation lines, the movement vector of observation points on the model’s surface was drawn. A total of 10 observation lines were installed on the model’s surface, with six observation lines (see Figure 12 and Figure 15) from top to bottom selected for analysing the coal roof movement law. As Figure 18 shows, the sinking and horizontal displacement of observation lines in the physical model were measured and are presented.
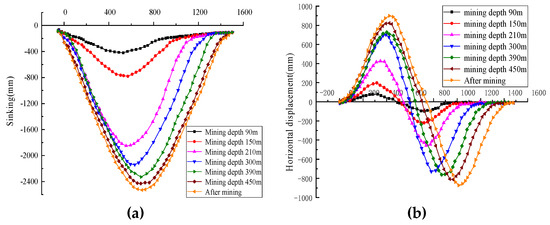
Figure 18.
Sinking curve and horizontal movement curves of 6 observation lines. (a) Sinking curve; (b) Horizontal migration.
- Sinking
Sinking characteristics of the roof rock formation after coal mining have been researched for various coalfields in the world [37]. The subsidence curve and the increment trend of overlying rock strata are shown in Figure 18a, showing an axisymmetric sinking displacement profile about the center of the coal goaf, with sinking curve value reaching near zero at the end of mining. Compared with the sinking lines in Figure 18a, a significantly reduced rate of sinking close to the surface area, and a smooth sinking rate near the coal seam after the coal mining were observed. In addition, the peak value of sinking (brown line) close to the coal seam is three times larger than that of the near-surface rock formation (black line), which results from the stress release difference and rock lithology of overlying strata during coal mining. After coal mining, the stress of the rock layer near the excavation surface is gradually released. When a crack develops and expands upward to the upper rock layer, the rock layer is separated due to bedding and lithology differences, and the lower rock layer collapses and settles completely. The re-stability of rock strata after crossing and stacking as a supporting layer prevents the subsidence of the upper rock strata, resulting in significant differences in the subsidence amplitude between the upper and lower strata and, finally, a stepped caving zone is formed above the goaf.
- Horizontal movement
Analyzing horizontal displacement of the coal roof indicates the exact mechanism for different depths of rock formations in longwall mining (Figure 18b). Coal seam mining leads to a symmetric horizontal displacement profile around the goaf center, in which the displacement curve value reaches zero at the end of mining and shows two maximum horizontal movement values in the opposite direction distributed near the central excavation area. Otherwise, the horizontal peak value appears near the coal seam, and the incremental value shows a trend of increasing first and then decreasing, and a stable self-weight tends in the end. In addition, close to the mining area, the maximum horizontal displacement value (brown line) is almost eight times bigger than the surface zone (black line). Furthermore, the horizontal displacement increment value, which first increases, then decreases, finally stabilizes, shows the difference in the law of upward transfer of mining stress between roof rock layers after coal mining extraction.
- Subsidence and horizontal movement coefficient.
Analyzing the maximum subsidence value of six observation lines, the maximum subsidence coefficient q and horizontal movement coefficient b of the six observation lines were obtained as shown in Table 6. The regression relationship between height from the coal seam and rock subsidence coefficient is shown in Figure 19. It could be argued that the horizontal movement coefficient and the subsidence coefficient develop in a negative correlation with the distance between the rock layer and the coal layer. The movement law of overlying strata in the mining field is transferred from bottom to top, with the peak subsidence and horizontal movement value decreasing gradually in the transfer process. In other words, the subsidence movement deformation increment of the overlying rock layer first increases, then falls, and the deformation of the roof surface reaches a stable level. This observation shows that the original stratum tends to move and deform towards the lower part of the mining area, causing decreased sinking and increased horizontal displacement.
Table 6.
Subsidence and horizontal movement coefficient of rock strata at different heights.
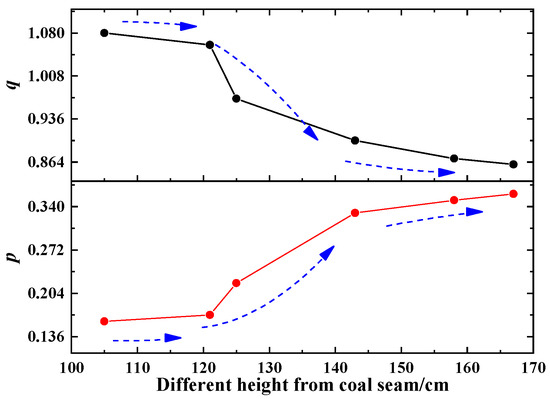
Figure 19.
Subsidence and horizontal coefficients at different rock layers.
3.2. The Moving Distribution Law of Observation Points
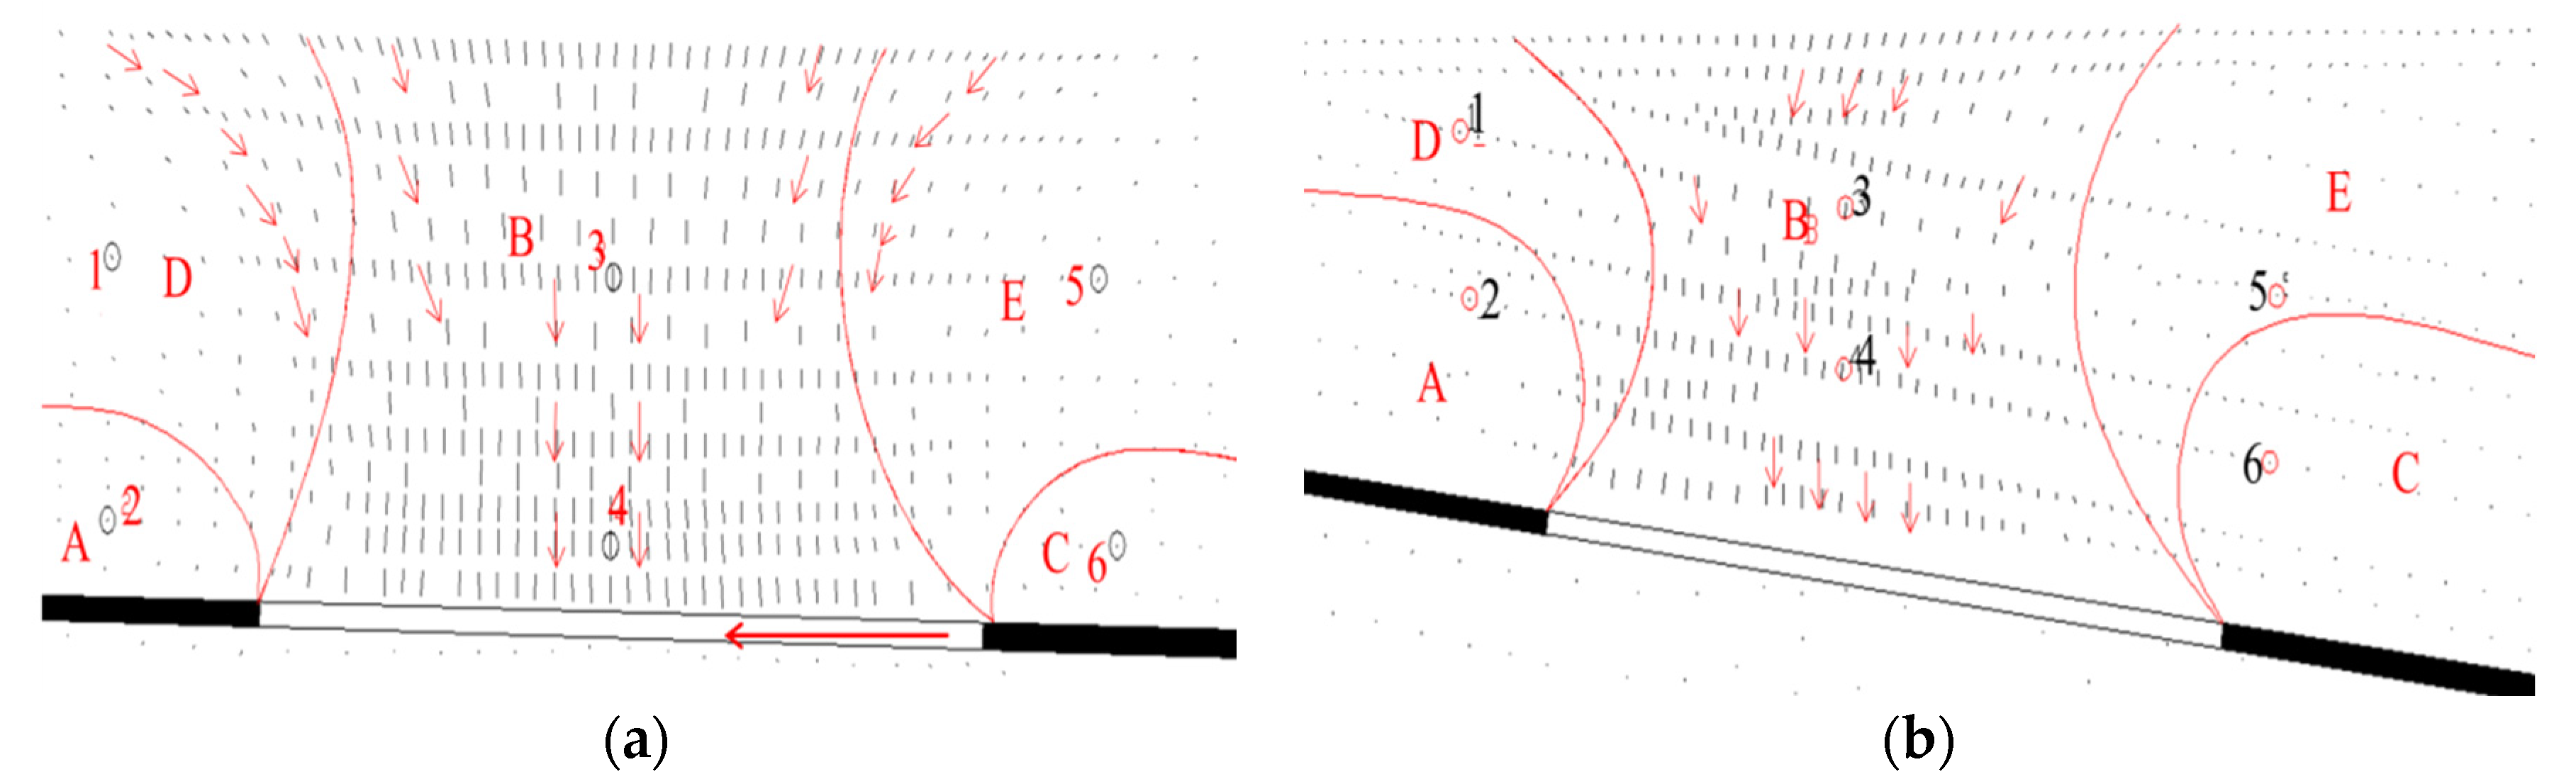
Based on the results of the existing physical model, the subsidence and movement deformation laws of the composite rock layer after mining depend on the mining mode, mining area conditions, and other aspects. It is not feasible to propose universal rock subsidence characteristics. From the results of this physical model test, the subsidence curve and specific subsidence characteristics of the overlying rock layer of the coal seam were obtained. Alternatively, according to the relative location of the roof slab, the overburdened roof was divided into five regions, which exhibit different sinking and horizontal movement characteristics and parameters (see Figure 20). Table 7 shows a summary of the moving distribution parameters for five areas as described below.
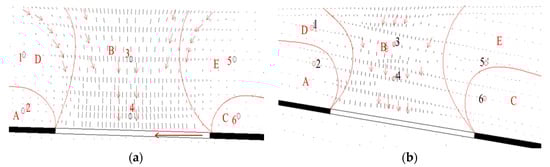
Figure 20.
Motion diagrams of the displacement points on the surface of the two models: (a) 0° coal mine; (b) 10° coal mine.
Table 7.
Subsidence and horizontal movement coefficient in five areas.
Zone (A), (C): Sub-collapse area. Two regions located above the coal pillar zone, due to pressurization, with the rock strata that are compressed. The trajectory of points in the region deviates from the goaf and points to the coal pillar. Due to the movement of rock strata, the roof strata are suspended, and part of the weight of rock strata is directly transferred to the surrounding rock stratum, with the original stress balance of the surrounding rock being destroyed. The stress is redistributed and increased. It should be noted that with the layer-by-layer caving of roof strata and superposition of a rock bridge effect increasing, the mining response effect of the upper layer decreases, resulting in the weakening of e interaction between strata. In addition, depending on the weakened or even closed cracks, the cracks in the rock layer may not be fully developed. As a result, an obvious sinking is not obtained.
Zone (B), sinking collapse area located directly above the mined-out area, with the most significant movement displacement of each point, and the direction pointing towards the mined-out area. Affected by coal mining, the collapse and subsidence of the lower strata cause cracks at the edges of the upper and lower strata to open and expand, and the degree of movement of the strata above the roof increases, resulting in a sharp drop in the subsidence curve of the strata [21,40].
Zone (D), (E): Falling affected area. Zone D and E are areas above the coal pillar, far from the coal seam, and belong to the decompression area. The movement trajectory of the point in the region points towards the direction of the goaf, which is mainly affected by the tensile effect under the coal mining process. New tensile cracks and larger tensile angles are generated at both ends of the collapsed and subsidence area above the goaf. The sinking movement in this area forms a new disturbance force creating favorable conditions for deformation to occur in the undamaged areas on both sides. As a result, the original strata on both sides tend to be weakening zones, and a certain degree of subsidence occurs, but these displacements are also relatively small.
3.3. The Moving Track of Rock Profile Points
The dynamic movement track of strata at 1–6 observation points when mining to 52, 104, 158, 212, 266, 320 and 368 m were measured and are presented in Figure 21. It can be seen that the moving direction of Point 1 points towards the mining face advancing direction, along with a sinking movement pointing to the collapse direction of rock stratum, for point 2, where the final horizontal movement value is close to zero (red dotted line in Figure 21a). The sinking moving trajectory points to the direction of the coal pillar. Furthermore, the trajectory of maximum sinking movement vectors of points 3 and 4 are similar to a straight line, pointing to the goaf in the mining process. The horizontal movement value increases then decreasing. In contrast, with an apparent horizontal movement law, the final trajectory tends towards the mining direction. The moving trajectory of points 5 and 6 are complex: the moving vector points to the direction of the coal pillar at first, and finally points to the goaf. Comparing (a), (b), (e), and (f) of Figure 21, clearly demonstrates the difference of the roof rock movement law between the start and end of mining, along with an opposite integral horizontal movement direction. Similar settlement values (a,e) are far less than those of the rock stratum above goaf (see Figure 21c,d).
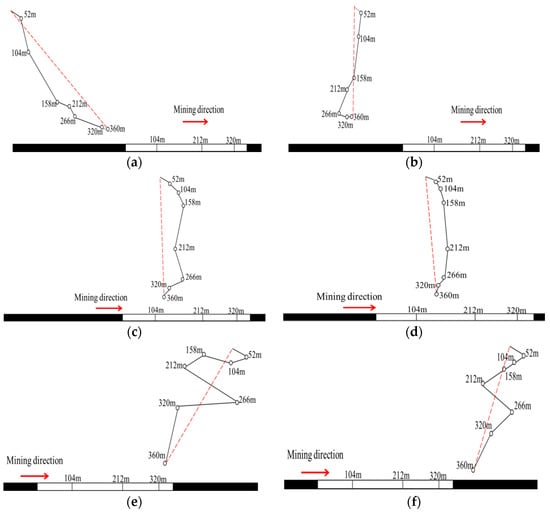
Figure 21.
Moving track of rock profile points. (a) Observation point 1; (b) observation point 2; (c) observation point 3; (d) observation point 4; (e) observation point 5; (f) observation point 6.
4. Numerical Modeling Test
Numerical model methods for simulating mining subsidence are mainly finite element (FEM) and infinite element methods. Due to the advantage of FEM in simulating complex geometries and nonlinear material behavior, it is the top choice for mining simulation. Integrating a powerful computer data processing system, and finite element simulation technology to establish a mining model under this geological condition, the subsidence movement and horizontal movement of the coal roof rock layer were observed and analyzed.
4.1. Simulation of Rock Material Properties
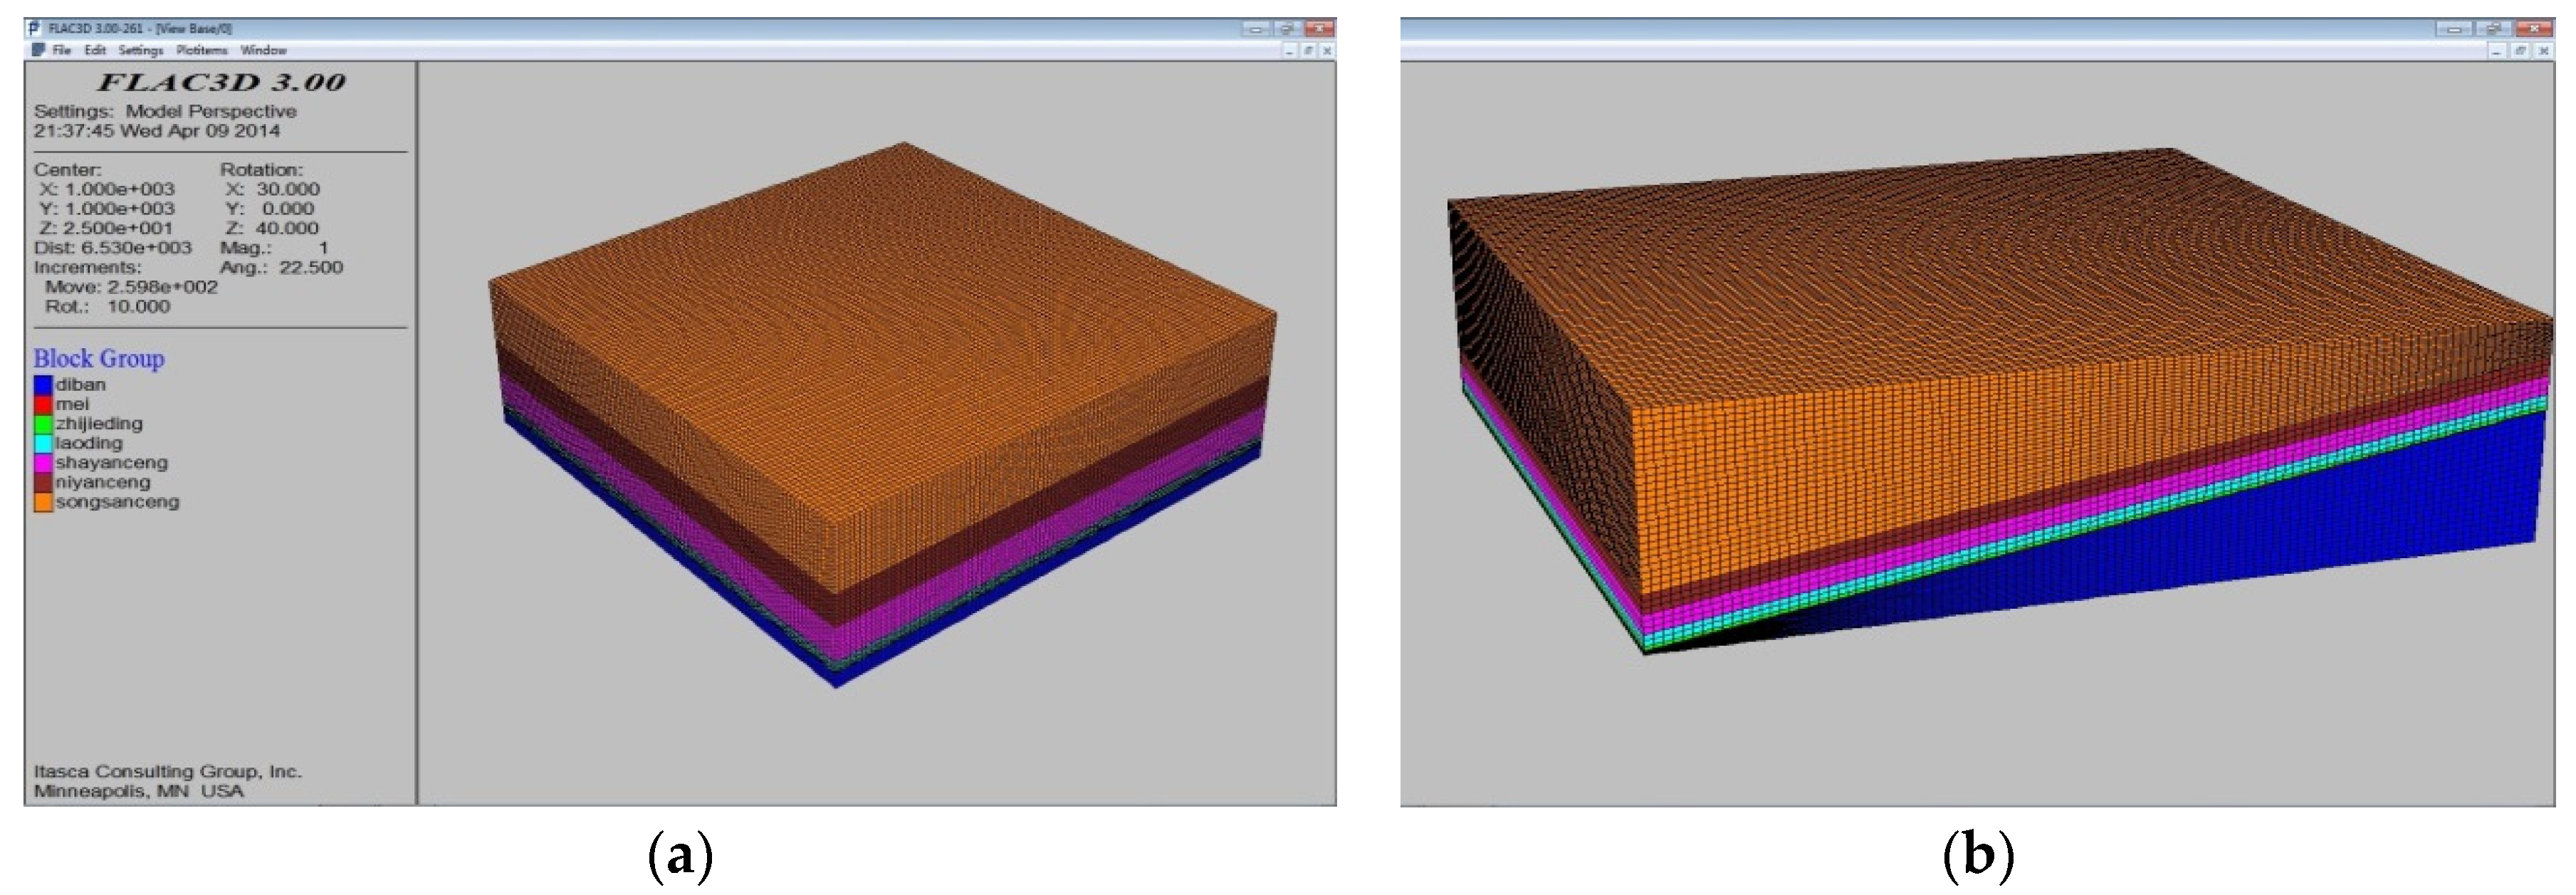
Compared with the coating material method, a predictive rock-stratum movement model established by assuming the rock formations as elastic materials of an exact nature, can be obtained, along with a more reasonable and close-to-actual subsidence value, and subsidence curve. In this paper, FLAC3D simulation software was used for simulation, the rock formation was established as hard contact, and stress and deformation were allowed to be transferred between the rock formations. The strength and other mechanical parameters shown in Table 8 were determined according to the rock strength determined by laboratory tests. The two-angle meshing simulation model established based on the above analysis is shown in Figure 22.
Table 8.
Physical parameters of numerical models.

Figure 22.
Two-angle meshing simulation model. (a) 0° model; (b) 14° model.
4.2. Numerical Solution
The continuum material with reduced stiffness used in the numerical model limits the deformation of sinking and horizontal movement, resulting in a smaller and broader subsidence line than that of the field test, which was obtained from the comparison between the numerical model and the field test results after mine extraction. After coal seam mining, the fracture angle of both ends of the lower strata is smaller than that of the upper strata, and the length of the fracture zone is longer than that of the upper rock plate. In other words, the fracture degree of the near coal seam strata is greater than that of the near-ground position, which agrees well with the physical modeling result, as observed in Figure 23, which shows the accuracy of the numerical model meets the requirements [41]. This is inferred assuming continuity of the rock bridging effect of the thick rock layer weakened after coal seam mining.
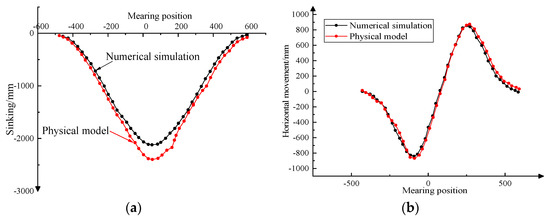
Figure 23.
Comparison of the numerical model and physical model results. (a) Sinking; (b) horizontal displacement.
4.2.1. Vertical and Horizontal Subsidence
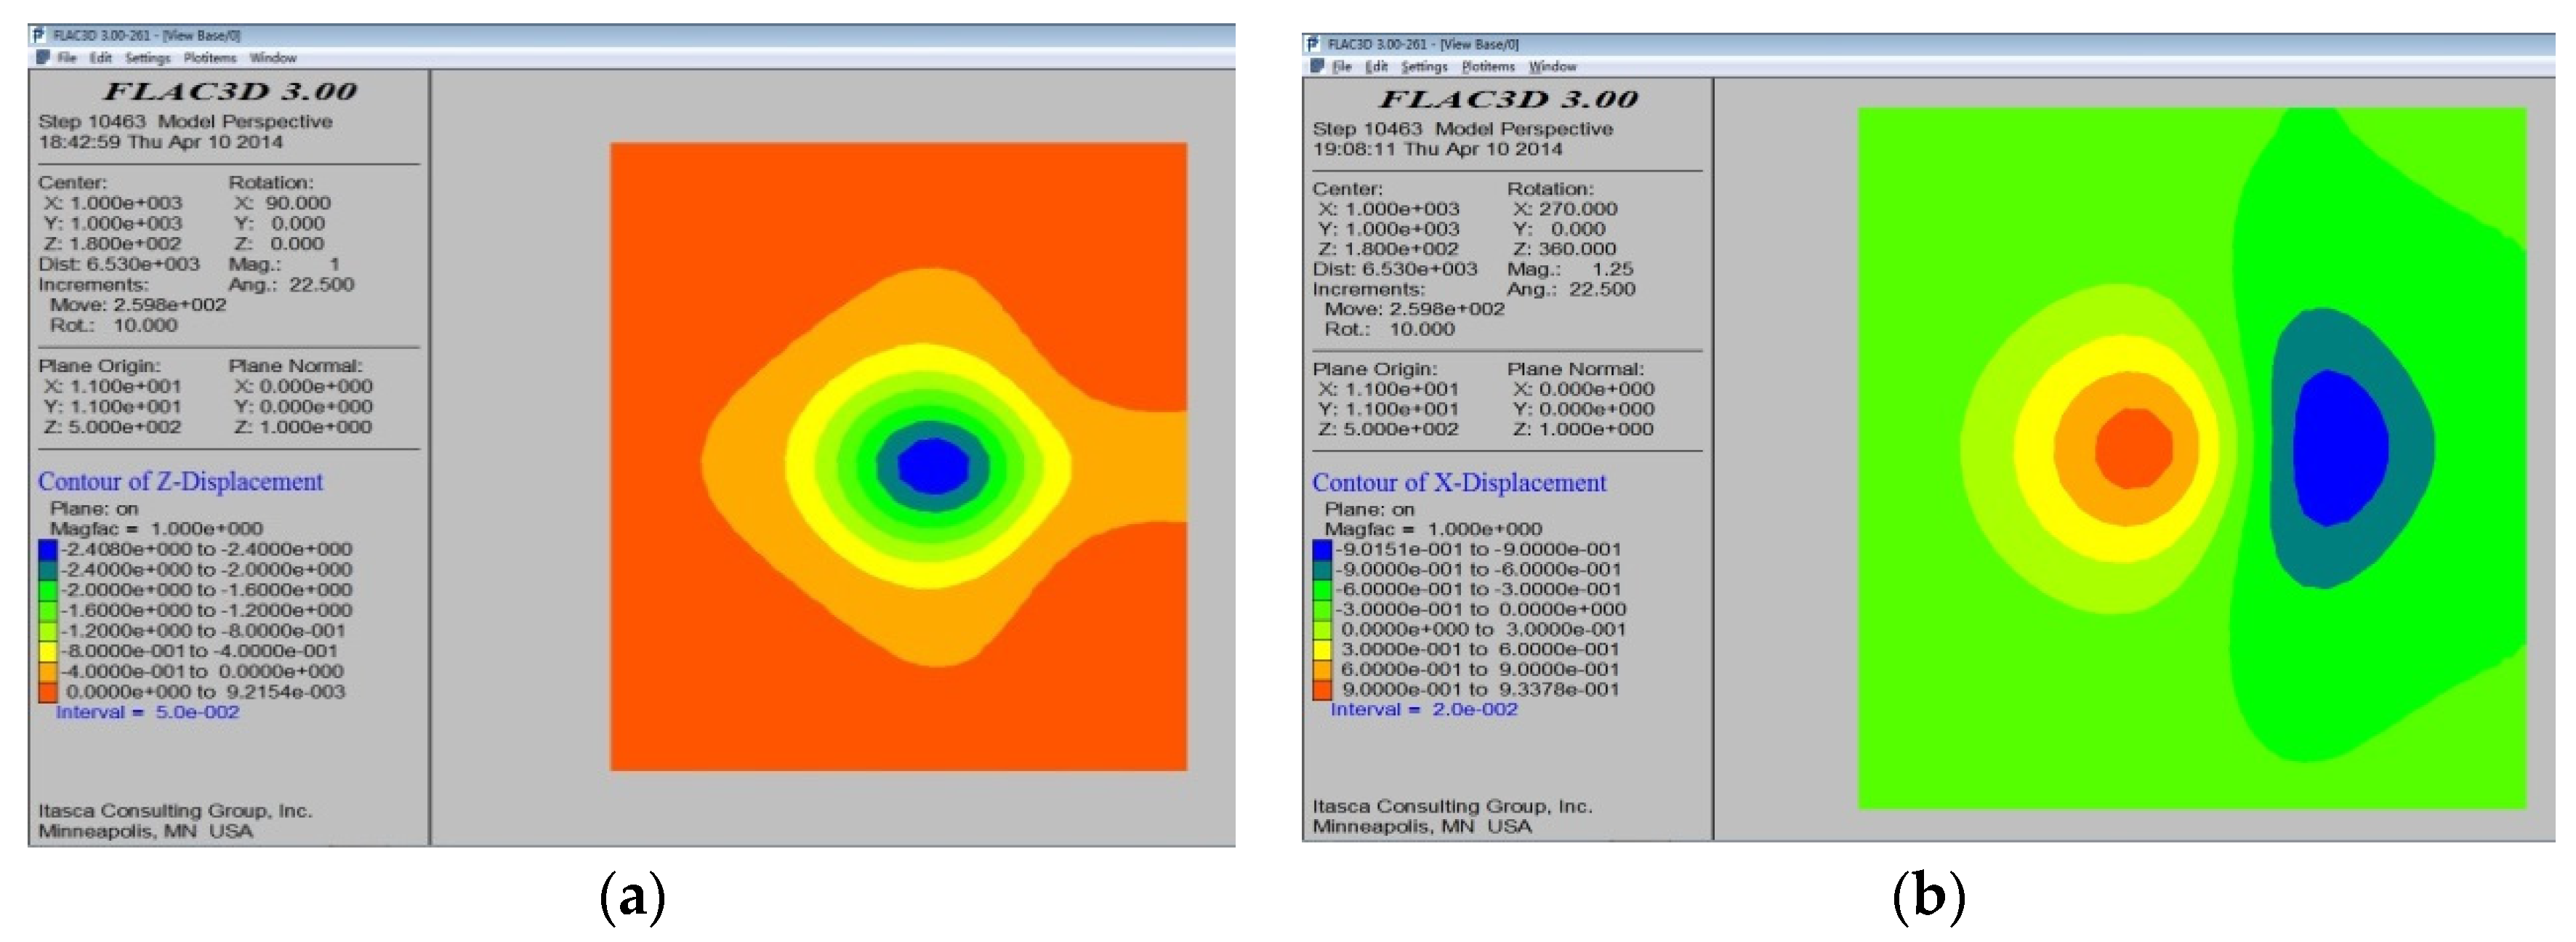
Cloud maps of subsidence and horizontal movement in the roof rock layer at the end of mining obtained from the numerical model are shown in Figure 24. Investigating the subsidence of the roof rock upward of the coaf, a symmetrical sinking curve and a center-symmetric horizontal movement curve with the center of the goaf were adopted. The numerical modeling result was smaller than that observed from the physical model. However, the angle was equal on both sides of the upper extraction, which indicates good agreement with the physical model results.

Figure 24.
Stress cloud of horizontal movement and the subsidence curve. (a) Sinking; (b) horizontal displacement.
4.2.2. Analysis of Influencing Factors: Mining Depth, Width, and Coal Seam Dip Angle
- Influence of mining width and depth
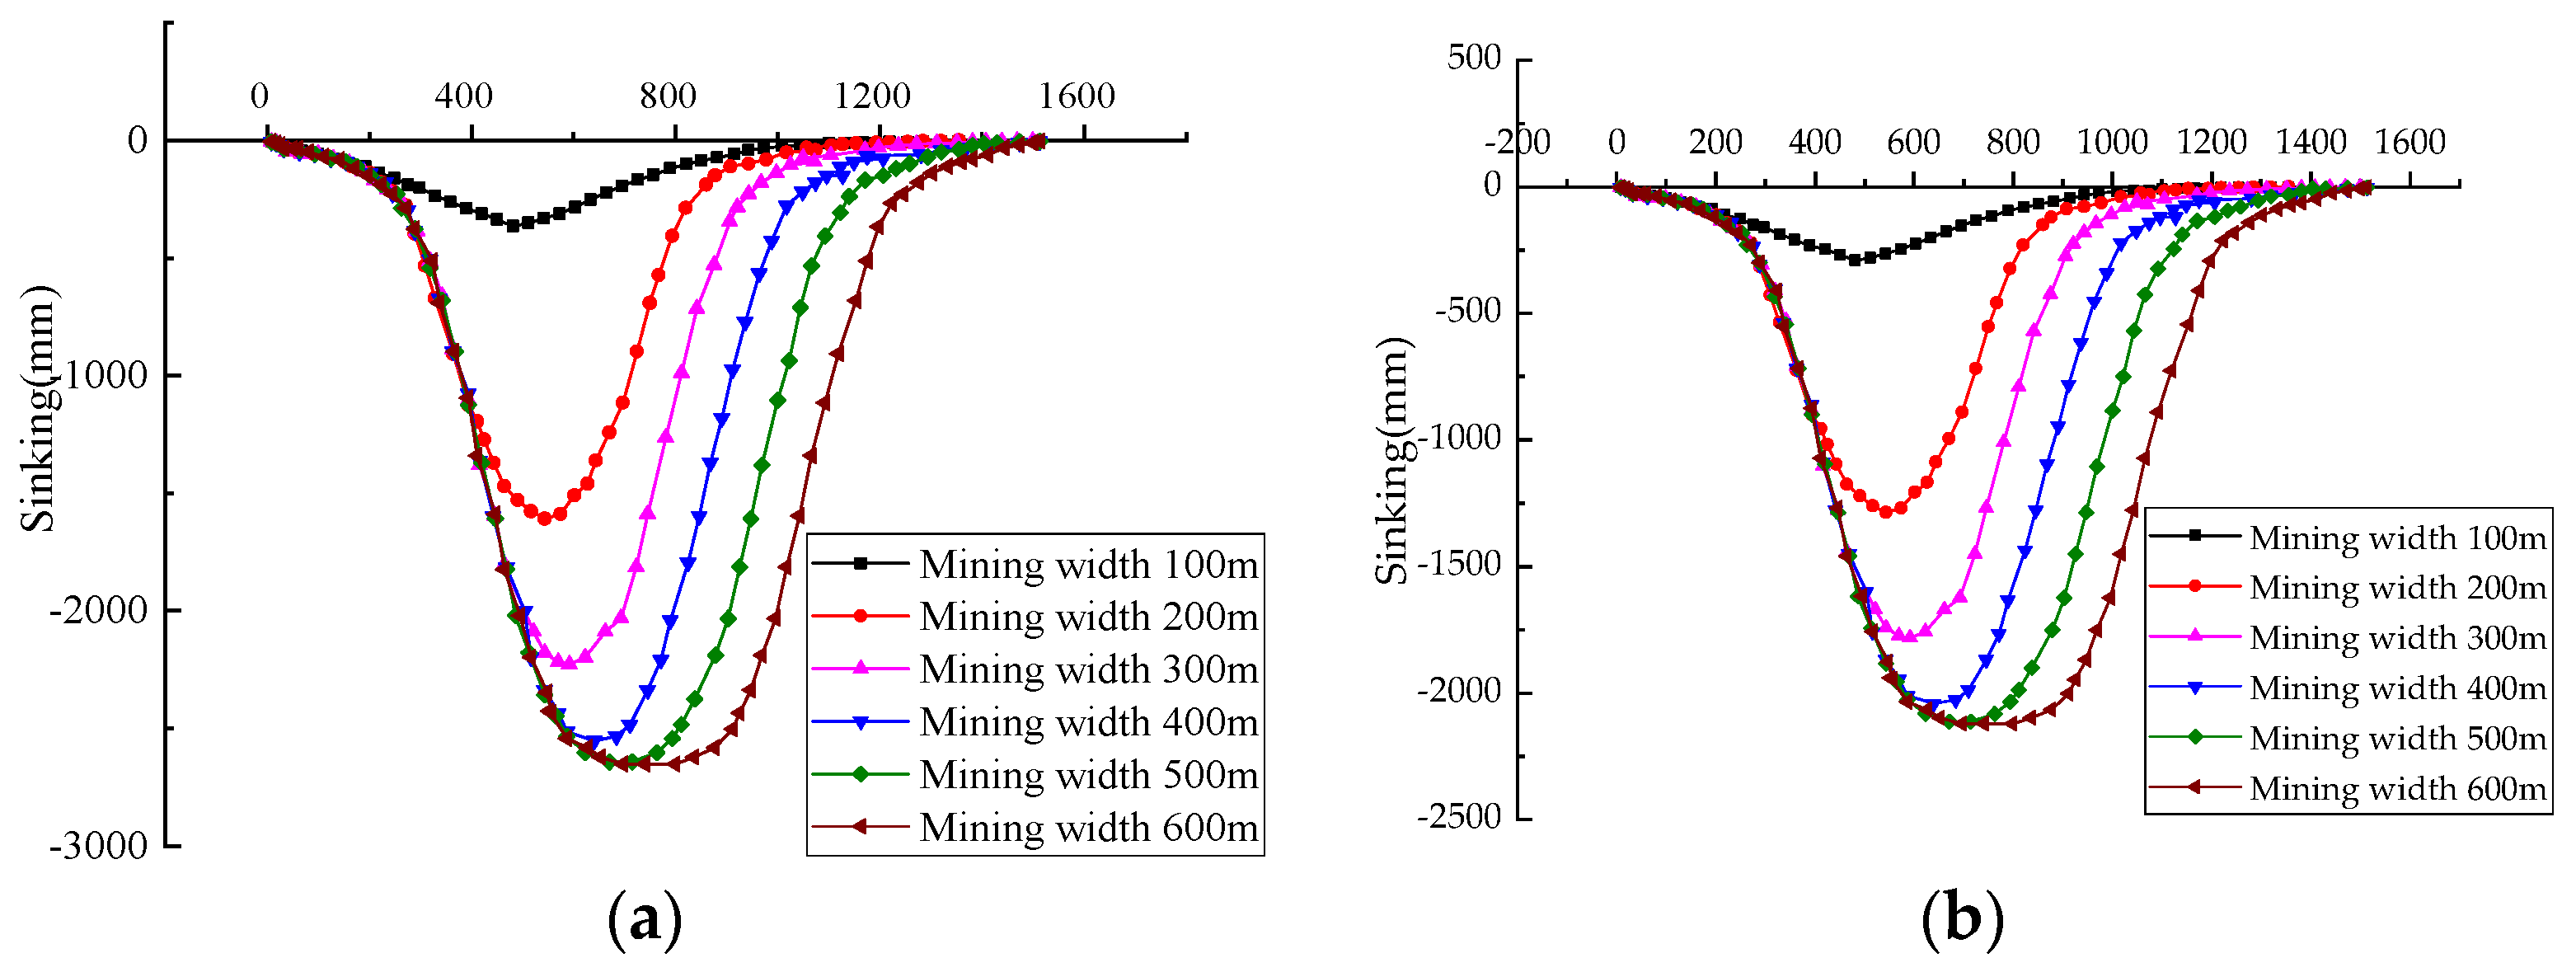
By investigating the normalized settlement and horizontal movement values of the coal seam roof slab, and comparing these with the physical model results, a similar subsidence curve and horizontal displacement were observed (compare Figure 18, Figure 25 and Figure 26). At the same mining depth, the subsidence value and horizontal movement value of the coal roof rock layer increase as the mining width increases, and the corresponding range of the maximum subsidence value increases; the position of the symmetry point of the subsidence curve gradually moves towards the mining direction. Furthermore, the increment value of sinking increases at first and then decreases with a smooth growth at the end, which is consistent with the result of the physical model (compare black line, red line, and blue line in Figure 25a). In contrast, the maximum subsidence value of the coal seam roof decreases with the increasing mining depth under the same mining width. When the mining width is 500 m, the subsidence value (2.92 m) at a mining depth of 200 m is 1.3 times larger than that (2.25 m) at a mining depth of 500 m. The horizontal movement curve presents an antisymmetric characteristic about the goaf’s center, and with the larger mining width (500 m) the horizontal movement reaches a greater value (1.2 m), which is three times bigger than that of 200 m width. In addition, the incremental value of the horizontal movement first increases then decreases at the end, and the final horizontal movement value stabilizes near zero.
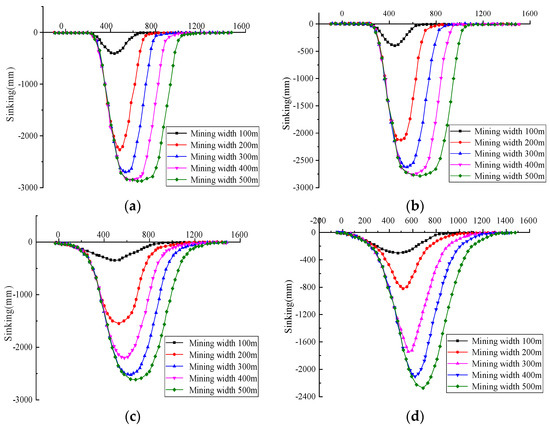
Figure 25.
Subsidence curve under different mining depths and widths. (a) Depth 200 m; (b) depth 300 m; (c) depth 400 m; (d) depth 500 m.
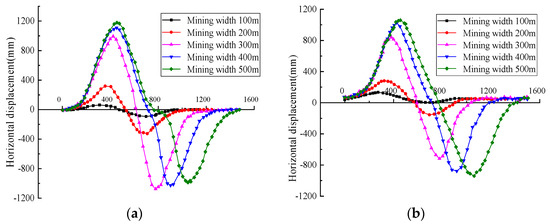
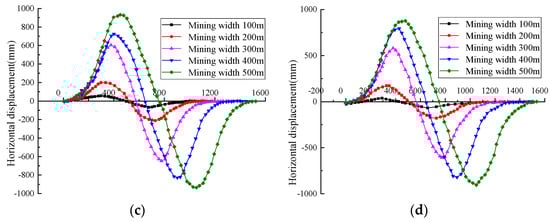
Figure 26.
Subsidence curve under different mining depths and widths: (a) Depth200 m; (b) depth 300 m; (c) depth 400 m; (d) depth 500 m.
- Influence of mining dip
To investigate the subsidence law of the composite rock layer observed from the numerical model under different coal mine inclination angles, the sinking and horizontal movement curves under two mining angles are shown in Figure 27. The subsidence value of the roof decreases with the increasing coal angle, and comparing the sinking subsidence curves, (see the red line, purple line, and blue line in Figure 27a,b, the subsidence increment decreases as the coal mining angle increases. In addition to the subsidence analysis obtained from the sinking curve, the growth of the horizontal movement trend resulting from the numerical model is discussed as follows. Different from the horizontal coal seam model, the horizontal motion trajectory of the inclined coal seam presents the opposite direction of motion (compare Figure 28). In contrast, the maximum horizontal amount of the inclined coal seam is smaller than that of the horizontal coal, whose value is approximately the same. This is because the subsidence between the roof rock layers in the inclined coal seam is weakened, and the expansion angle at both ends of the roof is reduced, which leads to an increase in the tensile force between the rock layer and the roof and restricts the overall horizontal movement of the roof rock.
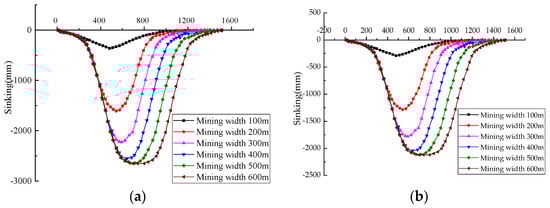
Figure 27.
Sinking curves of rock formations at two angles. (a) Dip angle 0°; (b) dip angle 4°.
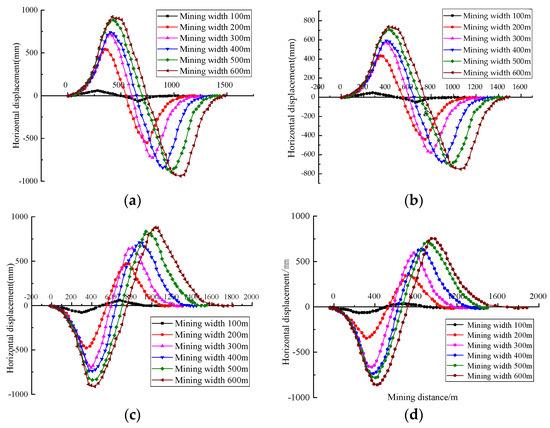
Figure 28.
Horizontal movement curve of the rock formation at four angles. (a) Dip angle 0°; (b) dip angle 4°; (c) dip angle 10°; (d) dip angle 20°.
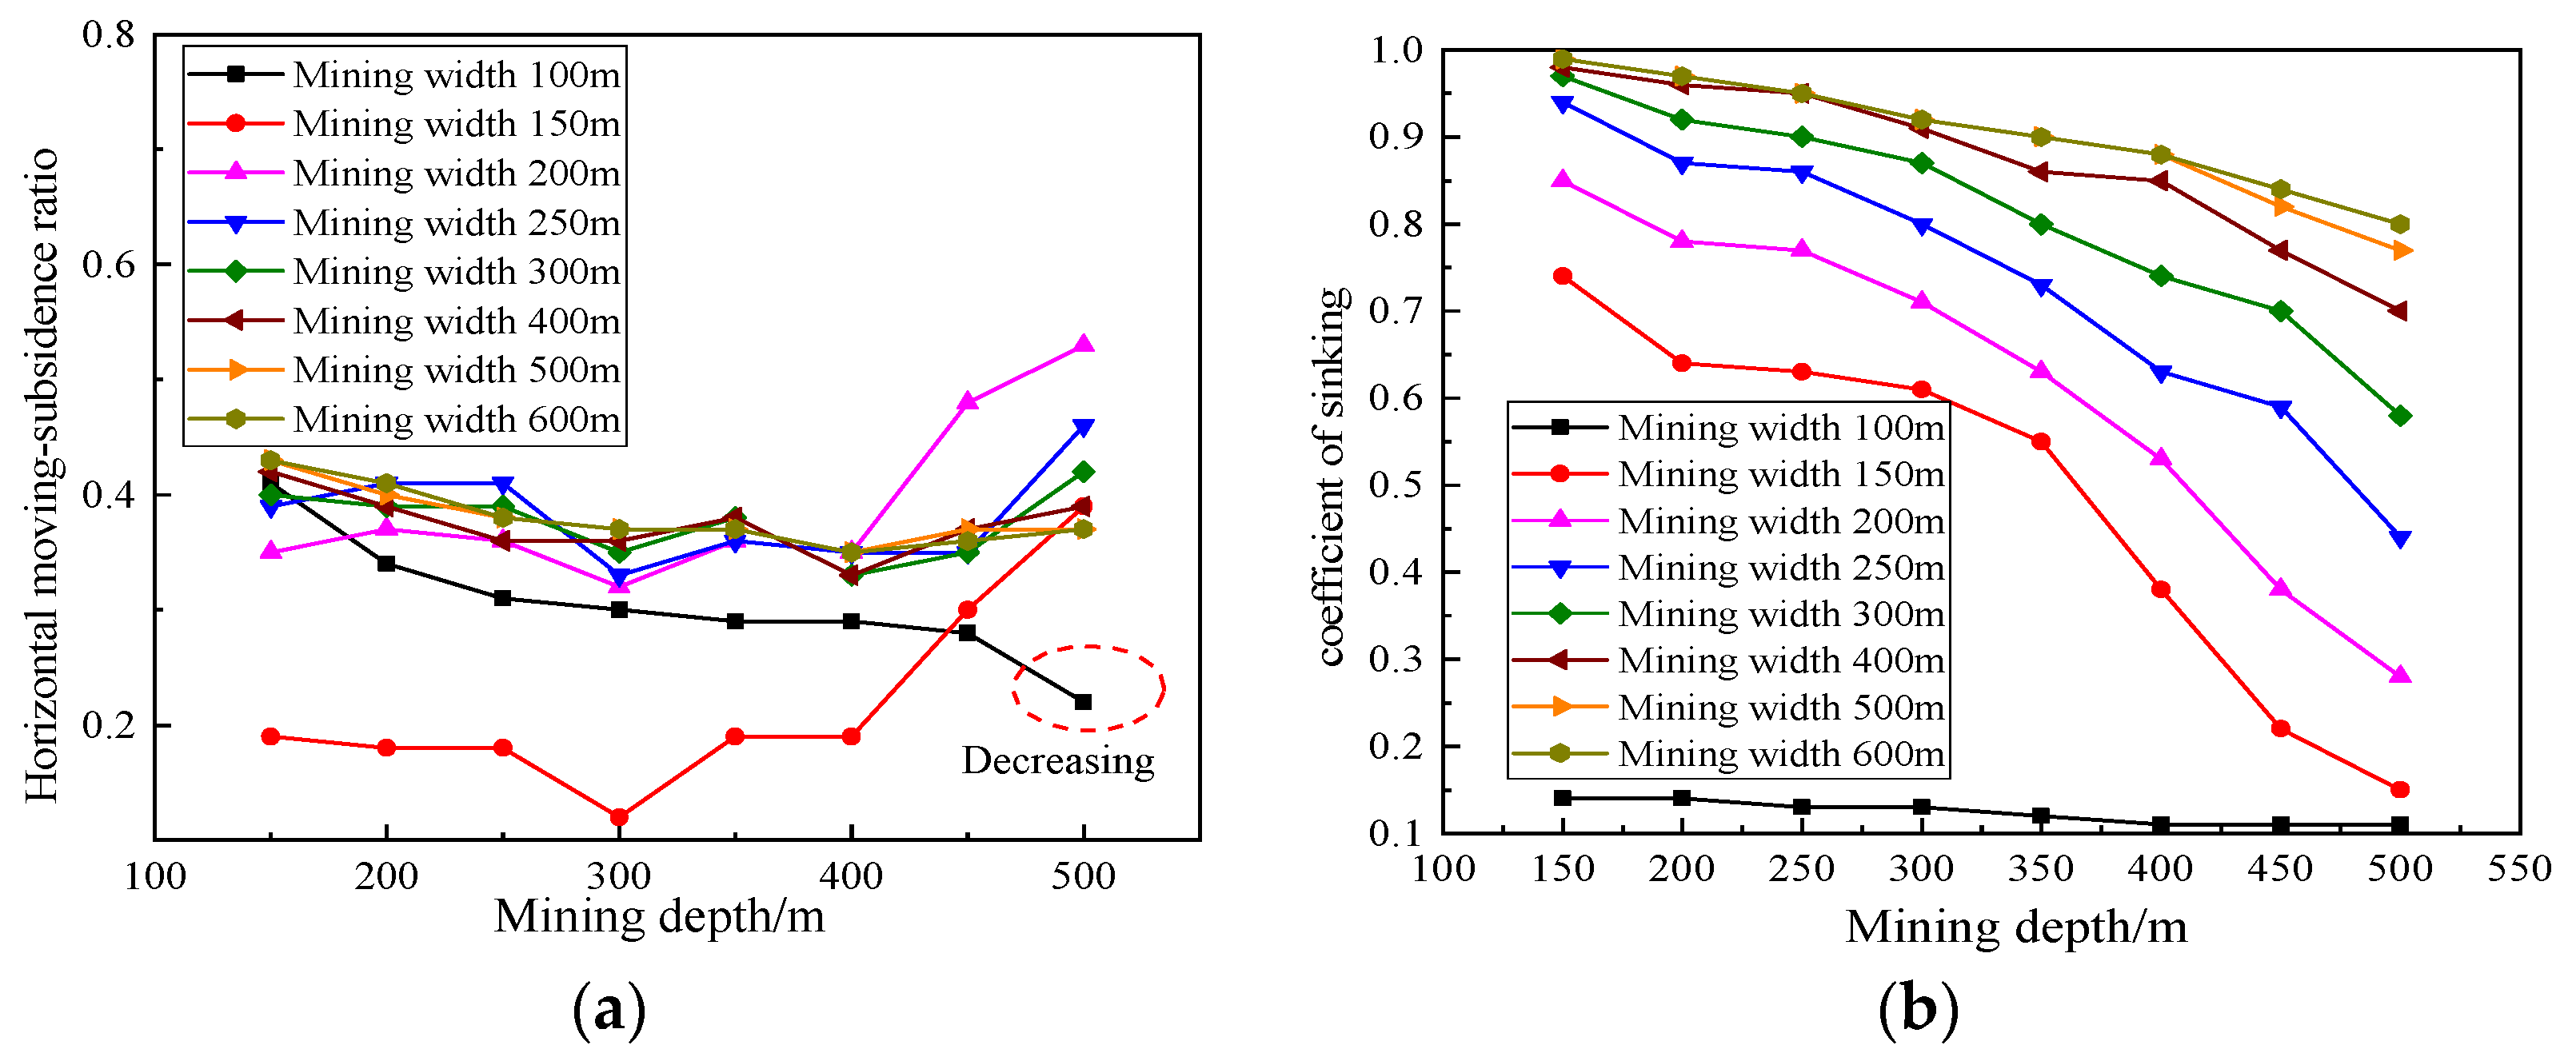
- Coefficient of sinking.
With a greater coal inclination, the peak subsidence value under the same mining width is smaller. The mining distance corresponding to the maximum subsidence value gradually deviates from the center of the goaf to the uphill direction. The symmetry of the subsidence curve is not obvious. When the peak of the horizontal movement of the ground surface under the same width is small, the downward curve slope of the downhill direction is greater than that of the uphill direction, resulting in a horizontal movement curve that is no longer symmetrical. The subsidence coefficient decreases with an increasing mine depth, but the horizontal movement factor does not change significantly. However, the horizontal subsidence coefficient increases under a wider mining width (more than 100 m), and a larger mining depth (more than 400 m) (see Figure 29a). In contrast, with a smaller mining width, the horizontal factor decreases along with the increasing depth (see the red dotted circle).
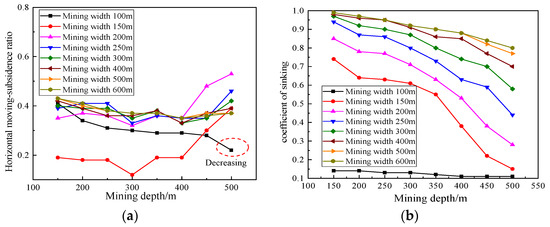
Figure 29.
Horizontal moving subsidence and sinking coefficient ratio. (a) Depth 200 m; (b) depth 300 m.
The relationship between the sinking and horizontal movement coefficient and the mining depth is shown in Figure 30. A greater mining depth was carried out, resulting in a smaller peak value of the subsidence coefficient (see Figure 30b). Compared with the sinking coefficient, as the aspect ratio increases, the horizontal movement coefficient shows an overall increasing trend, but decreases sharply near the initial mining location. On the contrary, at large mining depths (500 m), the horizontal movement coefficient shows a development trend of first increasing and then decreasing until the end of coal mining (see green line in Figure 30a). Furthermore, the boundary angle and horizontal distance of the movement influencing the range under different mining depths calculated in Table 9 agree well with the change law of sinking and horizontal movement of the physical model.
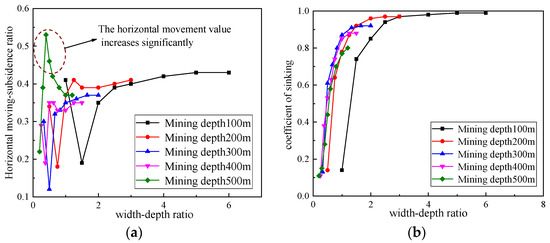
Figure 30.
Sinking and horizontal ratio of different width-depth ratio. (a) Depth 200 m; (b) depth300 m.
Table 9.
Boundary angle and horizontal distance of different mining depth.
5. Discussion: Mechanism and Prediction of Seam Subsidence
By comparing and analyzing physical and numerical simulation observation results of composite rock subsidence under coal seam mining, the mechanism and behavior of stratum subsidence were studied.
5.1. The Movement Law of Coal Roof
After coal mining, new cracks are produced in the overlying strata during the collapse of the lower strata (see Figure 17a,b). Under stress release and gravity after mining, the original cracks in the overlying strata propagate, and new damage occurs. After the cracks propagate and penetrate, the strata collapse, and the fracture angles at both ends of the collapse zone expand upward. Due to the difference in the strength and lithology of the rock formations, the degree of stress release between the rock formations is different, and the collapse characteristics of the rock formations are transmitted upwards. The collapsed rock formations sink to form a rock bridge. The sinking tensile stress and the stress release of the rock formation lead to two collapsed areas, and the inclination angle at the end increases.
5.2. Sinking Motion of Rock Formations
Observing and analyzing rock roof slab movement from the physical and numerical models, complex movement of the upper rock layers result in sinking and horizontal movement (see Figure 20). After the lower coal seam is mined, the stress of the roof rock layer is released, causing the original cracks in the formation to expand, and the rock layer begins to move, sinking and horizontally in the direction of the force. The moving belt can be divided into five parts (see Figure 20). The collapse area formed by the cracking of the lower rock layer triggers the original movement of the rock layer directly above, resulting in larger pull angles at both ends of the rock layer. The rock formations at both ends also gradually move to the previous weakened areas (zones D and E in Figure 20). Compared with the rock formations directly above the goaf, the movement of the rock formations at both ends produces smaller horizontal displacements and shallower surface cracks. On the other hand, in other mining-affected areas (A, C, see Figure 20), the lower coal seam has not yet been mined. The subsidence and movement of the disturbance zone in the upper part of the mined-out area have less impact on the rock formations, resulting in a relatively smaller tensile stress, and a larger final tensile crack angle of the affected area edge. This is because the upper rock layer tends to move toward the lower weakening and subsidence area, and the lower subsidence area cracks closed, forming a trapezoidal subsidence area in the upper part of the goaf center. Therefore, smaller sinking and horizontal strata movement of this area is observed compared with other areas.
The position of the displacement of the rock stratum surface after mine extraction of the lower coal seam clearly shows the difference in the movement mechanism of the rock layers in the five regions (zone A, B, C, D, and E). The specific movement mechanism is: at the upper part face above the coal seam, and the cracking position of the rock formation is located at the lower edge of the rock formation. The crack expands under the stress of its weight, the crack opens and depth is more extensive, the horizontal movement value is more significant, and the sinking curve is sharper. In contrast, under the support of the rock-bridge of the rock layer below, the tensile crack angle and crack depth of the rock layer far from the coal seam are smaller (the fracture angle at both ends of the rock layer is larger), and the sinking and horizontal displacement peaks are also reduced.
5.3. Prediction of Seam Subsidence
The existing subsidence prediction methods cannot fully consider the particularity of the subsidence effect of the coal seam under a composite type of rock layer. Therefore, to correctly describe the subsidence characteristics of the rock layer mentioned above, it is necessary to modify the existing subsidence prediction method or find an innovative alternative. On the other hand, selecting the relevant rock mass parameters in the prediction method depends on the analysis results of the specific geological conditions [42]. Therefore, the limitations of existing rock mass determination methods and the difficulty of determining the parameters of the practical mine geological condition model significantly limit the development and innovation of subsidence prediction methods. In summary, it necessary to study the subsidence characteristics of the area by using the prediction models of coal fields with similar geological conditions [43]. However, applying specific coal seam subsidence models to different coal-field types has caused great uncertainty in the research results.
Physical models established with similar materials can simulate the change process of rock subsidence movement under actual mining conditions, and further reveal the subsidence mechanism of the coal roof rock. At the same time, the numerical model can reduce the boundary effect of the physical model, improve the rock subsidence movement process in the physical model, and supplement the analysis of influencing factors such as mining conditions and site characteristics [42]. Therefore, the subsidence prediction method based on the subsidence mechanism revealed by the physical numerical model, and the subsidence parameter determination, provides an innovative solution to improve the original subsidence prediction method. In addition, based on the results of the similar material physical model, the results of subsidence movement in five different areas near the mining area were analyzed, and the subsidence prediction method of the corresponding area was proposed, which is helpful for establishing a universal and practical composite rock mining subsidence prediction model. The subsidence prediction system is innovative. In summary, the physical model and numerical simulation method described in this article are feasible in the study of mining subsidence characteristics, based on which a multiple-seam subsidence prediction method can be proposed.
6. Conclusions
After the coal seam is mined, there are obvious differences in the movement characteristics and subsidence mechanism of the composite rock roof type at different positions. However, this is difficult to simulate and analyze with traditional prediction methods accurately, and the reasons for this difference have not been well explained. The key to solving this problem lies in a clear understanding of the subsidence process in the roof rock formation, and accurate analysis of the subsidence mechanism, with the aid of physical and numerical models.
The subsidence and movement effects of the coal roof after mining in the composite strata are dependent on the position and strata characteristics, and a universal law suitable for describing the mechanism of subsidence mechanics is difficult to obtain accurately. By selecting similar geological and mechanical parameters, and using large-scale physical simulation technology, the phenomenon of the subsidence parameters of the composite rock under longwall mining was investigated under different mining configurations.
The physical model results showed that the subsidence and horizontal movement characteristics of the upper roof rock layer change significantly after the coal seam is mined. Finally, a trapezoidal subsidence zone symmetrical about the center of the goaf is formed. However, when mining inclined coal seams, the asymmetrical rock structure leads to an asymmetrical subsidence pattern in the roof. According to the different laws of subsidence in the roof rock layer, and the horizontal movement trajectory, five areas can be identified: the upper and lower main subsidence areas, the subsidence area on both sides, and the front and back subsidence influence areas. The area above the mining area has the greatest subsidence value and deep cracks; the rock layer in the outlying mining area has a reduced subsidence value but an increase in the horizontal displacement value. In the subsidence area on both sides, the subsidence of the main sinking area is disturbed, and the horizontal displacement is relatively large. Significantly, the displacement direction points downwards towards the goaf, and is symmetrically distributed on both sides. Compared with the above two areas, the subsidence-affected areas located at both ends of the unmined area are less affected by the mining disturbances, resulting in a smaller horizontal displacement and crack propagation angle, these observations being consistent with the simulation result of numerical simulation software.
Due to the size of the model, the limitation of the boundary conditions, the difference between the strength of the simulated model material and the field geological conditions, the results of the physical model were different from the actual settlement results, which is the limitation of the physical model. In addition, the numerical model can intuitively represent the settlement, and movement results of rock strata. However, due to the assumption of boundary conditions, the assumption of excavation mode, and the difference between the contact relationship of rock strata and the actual situation of stope, the numerical results are finally affected.
The combination of similar material physical modeling and finite element numerical modeling is an effective method to study the subsidence and movement behavior of composite rock formations. Based on this research method, an in-depth understanding of the typical mechanism of composite rock subsidence and horizontal movement was obtained, and further, the influence of the geological condition and mining characteristic parameters on the rock movement law was analyzed. The subsidence characteristics and parameters derived from the research results can be used to develop an improved subsidence method and model of composite rock formation.
Author Contributions
Conceptualization, Y.W. and X.W.; methodology, J.Z. and X.C.; software, W.Z. and Y.Z.; validation, Y.W. and X.W.; formal analysis, Y.W., W.Z. and Y.Z.; investigation, X.W.; resources, J.Z. and X.C.; data curation, Y.W., W.Z. and Y.Z.; writing—original draft preparation, Y.W.; writing—review and editing, Y.W. and Y.Z.; visualization, X.W.; supervision and project administration, J.Z. All authors have read and agreed to the published version of the manuscript.
Funding
This research was funded by the National Science Foundation of China under grant number CNNSF51608533. The laboratory tests were partially supported by the China Railway Corporation Science and the Technology Development Project under grant number 2017G008-A.
Acknowledgments
The laboratory tests were performed in the National Engineering Laboratory for High-speed Railway Construction with significant support from Zhang Jiasheng, and Xuan Wang of Central South University.
Conflicts of Interest
The authors declare no conflict of interest. The founders had no role in the design of the study, in the collection, analyses or interpretation of data, in the writing of the manuscript, or in the decision to publish the results.
References
- Adhikary, D.; Khanal, M.; Jayasundara, C.; Balusu, R. Deficiencies in 2D simulation: A comparative study of 2D versus 3D simulation of multi-seam longwall mining. Rock Mech. Rock Eng. 2016, 49, 2181–2185. [Google Scholar] [CrossRef]
- Ghabraie, B.; Ghabraie, K.; Ren, G.; Smith, J.V. Numerical modelling of multistage caving processes: Insights from multi-seam longwall mining-induced subsidence. Int. J. Numer. Anal. Methods Geomech. 2017, 41, 959–975. [Google Scholar] [CrossRef]
- Whittles, D.N.; Reddish, D.J.; Lowndes, I.S. The development of a coal measure classification (CMC) and its use for prediction of geomechanical parameters. Int. J. Rock Mech. Min. Sci. 2007, 44, 496–513. [Google Scholar] [CrossRef]
- Marschalko, M.; Yilmaz, I.; Lamich, D.; Drusa, M.; Kubečková, D.; Peňaz, T.; Burkotová, T.; Slivka, V.; Bednárik, M.; Krčmář, D.; et al. Unique documentation, analysis of origin and development of an undrained depression in a subsidence basin caused by underground coal mining (Kozinec, Czech Republic). Environ. Earth Sci. 2014, 72, 11–20. [Google Scholar] [CrossRef]
- Altun, A.A.; Yilmaz, I.; Yildirim, M. A short review on the surficial impacts of underground mining. Sci. Res. Essays 2010, 5, 3206–3212. [Google Scholar] [CrossRef] [Green Version]
- Barbato, J.; Hebblewhite, B.; Mitra, R.; Mills, K. Prediction of horizontal movement and strain at the surface due to longwall coal mining. Int. J. Rock Mech. Min. Sci. 2016, 84, 105–118. [Google Scholar] [CrossRef]
- Vivanco, F.; Melo, F. The effect of rock decompaction on the interaction of movement zones in underground mining. Int. J. Rock Mech. Min. Sci. 2013, 60, 381–388. [Google Scholar] [CrossRef]
- Soni, A.K.; Singh, K.K.K.; Prakash, A.; Singh, K.B.; Chakraboraty, A.K. Shallow cover over coal mining: A case study of subsidence at Kamptee Colliery, Nagpur, India. Bull. Eng. Geol. Environ. 2007, 66, 311–318. [Google Scholar] [CrossRef]
- Singh, R.; Mandal, P.K.; Singh, A.K.; Kumar, R.; Sinha, A. Optimal underground extraction of coal at shallow cover beneath surface//subsurface objects: Indian practices. Rock Mech. Rock Eng. 2008, 41, 421–444. [Google Scholar] [CrossRef]
- Sasaoka, T.; Takamoto, H.; Shimada, H.; Oya, J.; Hamanaka, A.; Matsui, K. Surface subsidence due to underground mining operation under weak geological condition in Indonesia. J. Rock Mech. Geotech. Eng. 2015, 7, 337–344. [Google Scholar] [CrossRef] [Green Version]
- Sivakugan, N.; Widisinghe, S.; Wang, V.Z. Vertical stress determination within backfilled mine stopes. Int. J. Geomech. 2014, 14, 06014011. [Google Scholar] [CrossRef]
- Wang, F.; Jiang, B.; Chen, S.; Ren, M. Surface collapse control under thick unconsolidated layers by backfilling strip mining in coal mines. Int. J. Rock Mech. Min. Sci. 2019, 113, 268–277. [Google Scholar] [CrossRef]
- Tian, C.; Wang, A.; Liu, Y.; Jia, T. Study on the migration law of overlying strata of gob-side entry retaining formed by roof Cutting and pressure releasing in the shallow seam. Shock. Vib. 2020, 2020, 8821160. [Google Scholar] [CrossRef]
- Xu, N.; Kulatilake, P.H.S.W.; Tian, H.; Wu, X.; Nan, Y.; Wei, T. Surface subsidence prediction for the WUTONG mine using a 3-D finite difference method. Comput. Geotech. 2013, 48, 134–145. [Google Scholar] [CrossRef]
- Whittaker, B.N.; Gaskell, P.; Reddish, D.J. Subsurface ground strain and fracture development associated with longwall mining. Min. Sci. Technol. 1990, 10, 71–80. [Google Scholar] [CrossRef]
- Zhu, X.; Zhang, W.; Wang, Z.; Wang, C.; Li, W.; Wang, C. Simulation analysis of influencing factors of subsidence based on mining under huge loose strata: A case study of Heze mining area, China. Geofluids 2020, 2020, 6357683. [Google Scholar] [CrossRef]
- Svartsjaern, M.; Saiang, D.; Nordlund, E.; Eitzenberger, A. Conceptual numerical modeling of large-scale footwall behavior at the Kiirunavaara mine, and implications for deformation monitoring. Rock Mech. Rock Eng. 2016, 49, 943–960. [Google Scholar] [CrossRef] [Green Version]
- Hou, D.; Li, D.; Xu, G.; Zhang, Y. Superposition model for analyzing the dynamic ground subsidence in mining area of thick loose layer. Int. J. Min. Sci. Technol. 2018, 28, 663–668. [Google Scholar] [CrossRef]
- Corkum, A.G.; Board, M.P. Numerical analysis of longwall mining layout for a Wyoming Trona mine. Int. J. Rock Mech. Min. Sci. 2016, 89, 94–108. [Google Scholar] [CrossRef]
- Suchowerska, A.M.; Merifield, R.S.; Carter, J.P. Vertical stress changes in multi-seam mining under supercritical longwall panels. Int. J. Rock Mech. Min. Sci. 2013, 61, 306–320. [Google Scholar] [CrossRef]
- Thongprapha, T.; Fuenkajorn, K.; Daemen, J.J.K. Study of surface subsidence above an underground opening using a trap door apparatus. Tunn. Undergr. Space Technol. 2015, 46, 94–103. [Google Scholar] [CrossRef]
- Li, Z.; Pang, Y.; Bao, Y.; Ma, Z. Research on surface failure law of working faces in large mining height and shallow buried coal seam. Adv. Civil. Eng. 2020, 2, 8844249. [Google Scholar] [CrossRef]
- Palchik, V. Localization of mining-induced horizontal fractures along rock layer interfaces in overburden: Field measurements and prediction. Environ. Geol. 2005, 48, 68–80. [Google Scholar] [CrossRef]
- Unlu, T.; Akcin, H.; Yilmaz, O. An integrated approach for the prediction of subsidence for coal mining basins. Eng. Geol. 2013, 166, 186–203. [Google Scholar] [CrossRef]
- Manekar, G.G.; Shome, D.; Chaudhari, M.P. Prediction of subsidence parameters & 3-D analysis at balaghat underground manganese mine of MOIL limited, India. Procedia Eng. 2017, 191, 1075–1086. [Google Scholar] [CrossRef]
- Woo, K.; Eberhardt, E.; Rabus, B.; Stead, D.; Vyazmensky, A. Integration of field characterisation, mine production and InSAR monitoring data to constrain and calibrate 3-D numerical modelling of block caving-induced subsidence. Int. J. Rock Mech. Min. Sci. 2012, 53, 166–178. [Google Scholar] [CrossRef]
- Suchowerska, A.M.; Carter, J.P.; Merifield, R.S. Horizontal stress under supercritical longwall panels. Int. J. Rock Mech. Min. Sci. 2014, 70, 240–251. [Google Scholar] [CrossRef]
- Mutlu, B.; Nefeslioglu, H.A.; Sezer, E.A.; Akcayol, M.A.; Gokceoglu, C. An experimental research on the use of recurrent neural networks in landslide susceptibility mapping. ISPRS Int. J. Geo-Inf. 2019, 8, 578. [Google Scholar] [CrossRef] [Green Version]
- Kumar, A.; Waclawik, P.; Singh, R.; Ram, S.; Korbel, J. Performance of a coal pillar at deeper cover: Field and simulation studies. Int. J. Rock Mech. Min. Sci. 2019, 113, 322–332. [Google Scholar] [CrossRef]
- Wang, F.; Ma, Q.; Zhang, C.; Fen, G. Overlying strata movement and stress evolution laws triggered by fault structures in backfilling longwall face with deep depth. Geomat. Nat. Hazards Risk 2020, 11, 949–966. [Google Scholar] [CrossRef]
- Suchowerska Iwanec, A.M.; Carter, J.P.; Hambleton, J.P. Geomechanics of subsidence above single and multi-seam coal mining. J. Rock Mech. Geotech. Eng. 2016, 8, 304–313. [Google Scholar] [CrossRef] [Green Version]
- Kashfuddoja, M.; Prasath, R.G.R.; Ramji, M. Study on experimental characterization of carbon fiber reinforced polymer panel using digital image correlation: A sensitivity analysis. Opt. Lasers Eng. 2014, 62, 17–30. [Google Scholar] [CrossRef]
- Ghasemi, E.; Ataei, M.; Shahriar, K. An intelligent approach to predict pillar sizing in designing room and pillar coal mines. Int. J. Rock Mech. Min. Sci. 2014, 65, 86–95. [Google Scholar] [CrossRef]
- Fathi Salmi, E.; Nazem, M.; Karakus, M. Numerical analysis of a large landslide induced by coal mining subsidence. Eng. Geol. 2017, 217, 141–152. [Google Scholar] [CrossRef]
- Gong, B.; Jiang, Y.; Chen, L. Feasibility investigation of the mechanical behavior of methane hydrate-bearing specimens using the multiple failure method. J. Nat. Gas. Sci. Eng. 2019, 69, 102915. [Google Scholar] [CrossRef]
- Salmi, E.F.; Nazem, M.; Karakus, M. The effect of rock mass gradual deterioration on the mechanism of post- mining subsidence over shallow abandoned coal mines. Int. J. Rock Mech. Geotech. Eng. 2017, 91, 59–71. [Google Scholar] [CrossRef]
- Ghabraie, B.; Ren, G.; Zhang, X.; Smith, J. Physical modelling of subsidence from sequential extraction of partially overlapping longwall panels and study of substrata movement characteristics. Int. J. Coal Geol. 2015, 140, 71–83. [Google Scholar] [CrossRef]
- Ghabraie, B.; Ren, G.; Smith, J.V. Characterising the multi-seam subsidence due to varying mining configuration, insights from physical modelling. Int. J. Rock Mech. Min. Sci. 2017, 93, 269–279. [Google Scholar] [CrossRef]
- Litwiniszyn, J. A model for the initiation of coal-gas outbursts. Int. J. Rock Mech. Min. Sci. Geomech. Abstr. 1985, 22, 39–46. [Google Scholar] [CrossRef]
- Sun, Y.; Zuo, J.; Karakus, M.; Wang, J. Investigation of movement and damage of integral overburden during shallow coal seam mining. Int. J. Rock Mech. Min. Sci. 2019, 117, 63–75. [Google Scholar] [CrossRef]
- Wesolowski, M.; Suchacz, B.; Halkiewicz, J. The analysis of seasonal air pollution pattern with application of neural networks. Anal. Bioanal. Chem. 2006, 384, 458–467. [Google Scholar] [CrossRef] [PubMed]
- Sheorey, P.R.; Loui, J.P.; Singh, K.B.; Singh, S.K. Ground subsidence observations and a modified influence function method for complete subsidence prediction. Int. J. Rock Mech. Min. Sci. 2000, 37, 801–818. [Google Scholar] [CrossRef]
- Whittaker, B.N.; Reddish, D.J.; Fitzpatrick, D.J. Calculation by computer program of mining subsidence ground strain patterns due to multiple longwall extractions. Min. Sci. Technol. 1985, 3, 21–33. [Google Scholar] [CrossRef]


Publisher’s Note: MDPI stays neutral with regard to jurisdictional claims in published maps and institutional affiliations. |
© 2021 by the authors. Licensee MDPI, Basel, Switzerland. This article is an open access article distributed under the terms and conditions of the Creative Commons Attribution (CC BY) license (https://creativecommons.org/licenses/by/4.0/).