Article

Insight into the Crystal Structures and Physical Properties of the Uranium Borides UB1.78±0.02, UB3.61±0.041 and UB11.19±0.13

1
European Commission, Joint Research Centre (JRC), 76125 Karlsruhe, Germany
2
CEA, CNRS, NIMBE, Université Paris-Saclay, CEDEX, 91191 Gif-sur-Yvette, France
3
LPAIS, University of Sidi Mohamed Ben Abdellah, Fez 30000, Morocco
*
Author to whom correspondence should be addressed.
Minerals 2022, 12(1), 29; https://doi.org/10.3390/min12010029
Submission received: 30 November 2021 / Revised: 17 December 2021 / Accepted: 20 December 2021 / Published: 24 December 2021
(This article belongs to the Special Issue NMR Spectroscopy in Mineralogy and Crystal Structures)

Abstract

:
In this study we reported the synthesis of three polycrystalline uranium borides UB1.78±0.02, UB3.61±0.041, and UB11.19±0.13 and their analyses using chemical analysis, X-ray diffraction, SQUID magnetometry, solid-state NMR, and Fourier transformed infrared spectroscopy. We discuss the effects of stoichiometry deviations on the lattice parameters and magnetic properties. We also provide their static and MAS-NMR spectra showing the effects of the 5f-electrons on the 11B shifts. Finally, the FTIR measurements showed the presence of a local disorder.

1. Introduction

Borides have been studied for their properties such as hardness, stability to radiolytic decay, chemical inertness, and magnetism. Three main applications made them of particular interest: (i) their consideration as an alternative intermediate storage form for actinide elements due to their high refractory properties [1], (ii) their potential formation in sodium cooled fast reactors because of a core melt during reaction of the B4C control rods with the UO2 fuel [2], and (iii) their possibility as candidate constituents for multi-phase accident tolerant fuel [3]. In the uranium-boron phase diagram, three compounds have been reported to exist: UB2, UB4, and UB12 [4,5].
They are mostly synthesized by arc-melting elemental uranium and boron in stoichiometric amounts. Nevertheless, due to boron evaporation, non-stoichiometric UBX (X = 2 ± x, 4 ± x, or 12 ± x) phases and additional UBX or UO2 phases are often detected. Brewer et al. [6] reported the detection of UB2 in samples containing 25 to 75 atomic %B and UB4 in samples containing 75 to 85 atomic %B. The magnetic properties of the UBX (X = 2, 4, 12) are intensively studied in the literature. Indeed, UB2−x is a Pauli paramagnet and a compensated metal with closed Fermi surfaces [7]. UB4−x is a magnetic compensated metal, but also a moderate heavy fermion where a cross-over is observed between itinerant 5f electrons at low temperatures and localized 5f electrons at high temperature with a Curie–Weiss behavior [8,9]. Finally, UB12−x is a Pauli paramagnet and compensated metal, with speculations of superconductivity below 0.4 K [10,11]. Nevertheless, the slight composition/impurities effects on the magnetism has been reported [12] but not thoroughly discussed.
Here, we present the synthesis of UB1.78±0.02, UB3.61±0.041, and UB11.19±0.13 by arc melting, their room temperature crystal structure by XRD and low temperature single crystal XRD (100 K to 300 K), and their magnetic susceptibility and their local structure determined by 11B nuclear magnetic resonance (NMR) and Fourier transformed infrared (FTIR) spectroscopy. We discuss our results in comparison with the literature and clarify the differences observed based mostly on composition effects.

2. Materials and Methods

The samples were prepared by arc melting of the constituent elements, uranium metal and boron, under a high purity argon atmosphere (6N), on a water-cooled copper hearth. Metallic zirconium in the chamber acts as a getter for oxygen. The UBX ingots were melted and turned several times to achieve homogenous samples. To minimise oxidation, the samples were stored under high vacuum (~10−6 mbar). Chemical analyses to determine the B/U ratio were done using Inductively coupled plasma mass spectrometry (ICPMS). The oxygen content was measured via a direct combustion using the infrared absorption detection technique with an ELTRA ONH-2000 instrument. The detection limit for oxygen was determined by measuring a blank 10 times, and the standard deviation of these measurements multiplied by 2.33 was considered as the detection limit. Powder X-ray diffraction analyses were performed on a Bruker Bragg-Brentano D8 advanced diffractometer (Cu Kα1 radiation at a wavelength of 1.5406 Å) equipped with a Ge (111) monochromator and a Lynxeye linear position sensitive detector. The powder patterns were recorded at room temperature using a step size of 0.01973° with an exposure of 4 s across the angular range 15° ≤ 2θ ≤ 120°. Operating conditions were 40 kV and 40 mA. The Rietveld refinement was implemented using the program Topas version 4.1. Single crystals of UBx selected from the as-cast samples were measured between 100 and 300 K on a Bruker APEX II Quazar diffractometer (Mo-Kα radiation, graphite monochromator, λ = 0.71073 Å) to follow the lattice parameters versus the temperature. Infrared spectra were recorded on a Bruker Alpha-P FT-IR spectrometer equipped with a “platinum” attenuated total reflection sample module. Using the Origin 2021 software, each main peak was selected. All the samples were analyzed on a 9.4T Bruker NMR spectrometer (11B frequency at 128.38 MHz) adapted for the study of nuclear materials. To avoid skin-depth effects and for better RF penetration, powders were used by crushing the bulk samples. A 1.3 mm probe was used and the samples were spun at 40 kHz. A one pulse experiment was performed with a 90° pulse of 1μs with optimised recycling delays of 0.5 s to 2 s. For UB11.19 and UB3.61, the full static spectra were obtained using the variable offset cumulative spectrum (VOCS) technique [13,14]. The samples were referenced to 1 M H3BO3 (liq.) as an external reference at 19.6 ppm. All the spectra were fitted using the dmfit software [15] and home-built software [16].

3. Results and Discussion

3.1. Chemical Analyses and X-ray Diffraction

After preparation by arc melting, each sample was analyzed by chemical analyses to define the U/B ratio and eventual oxygen content. Table 1 summarizes the results. Analyzes of O content in the sample were successfully done and the quantity was below 200 ppm (detection limit of the instrument). This enabled us to demonstrate the quality of the samples prepared by arc-melting. In the following section, to underline the non-stoichiometry, we call the samples UB1.78, UB3.61, and UB11.19, implying that the composition uncertainty is included. The atomic percentage loss in boron goes from 11, 10 to 7 at% for the samples with formal composition UB2, UB4, and UB12, respectively. The atomic% of boron falls within the composition range of UB2 and UB4 described by Brewer et al. [6]. Usually, excess of 5 to 10 wt% in boron is added to reach a pure stoichiometry but, as the different phase structure exists within a range of composition of U/B ratio [6], we did not compensate for the boron loss. We also wanted to avoid the formation of additional phases in the samples.
The XRD patterns reported in Figure 1 and Figure S1 prove well crystallized samples—narrow peaks with high intensities. One crystalline phase was detected for UB1.78 and UB11.19, unlike UB3.68 where an admixture of 5 wt% of UB2−x was detected. The corresponding lattice parameters, crystal structures, and phase compositions are reported in Table 2. In the U–B phase diagram, UB2 crystallizes in the hexagonal crystal structure, UB12 in the cubic crystal structure, and UB4 in the tetragonal crystal structure (insets Figure 1).
Despite the numerous studies of UB2±x, UB4−x, and UB12−x, and the known range of non-stoichiometry, only few studies in the open literature link the effects of lattice parameters with composition. According to the previously stated Brewer definition, each UBX exists over a range of stoichiometry. Nevertheless, it is clear from the literature that this lower boron content can directly be seen on the lattice parameters. The lattice parameters of the present study and those found in the open literature are given in Table 3. With its lower boron content, UB1.78, possesses a lower a lattice parameter compared to UB1.79 (a = 3.1309 (5) Å, c = 3.9837 (5) Å) [17] and UB2.02 (a = 3.133 (1) Å, c = 3.9860 (1) Å). Despite the close stoichiometry between our sample and UB1.79, the lattice parameters are slightly different, probably due to the impurities indicated by the previous authors (U and UB4), which might modify the overall UB2−x stoichiometry. For UB11.78, the only reported UB12−x stoichiometry in the open literature was UB16 [18] (a = 7.475 Å), which indeed differs from ours. Finally, the UB3.98 (a = 7.0764 Å, c = 3.9811 Å) sample synthesized by Menovsky et al. [19] is the closest to UB4 stoichiometry that we could find in the open literature. Compared to our present UB4−x sample, the lattice parameters a decrease whereas c slightly increase.
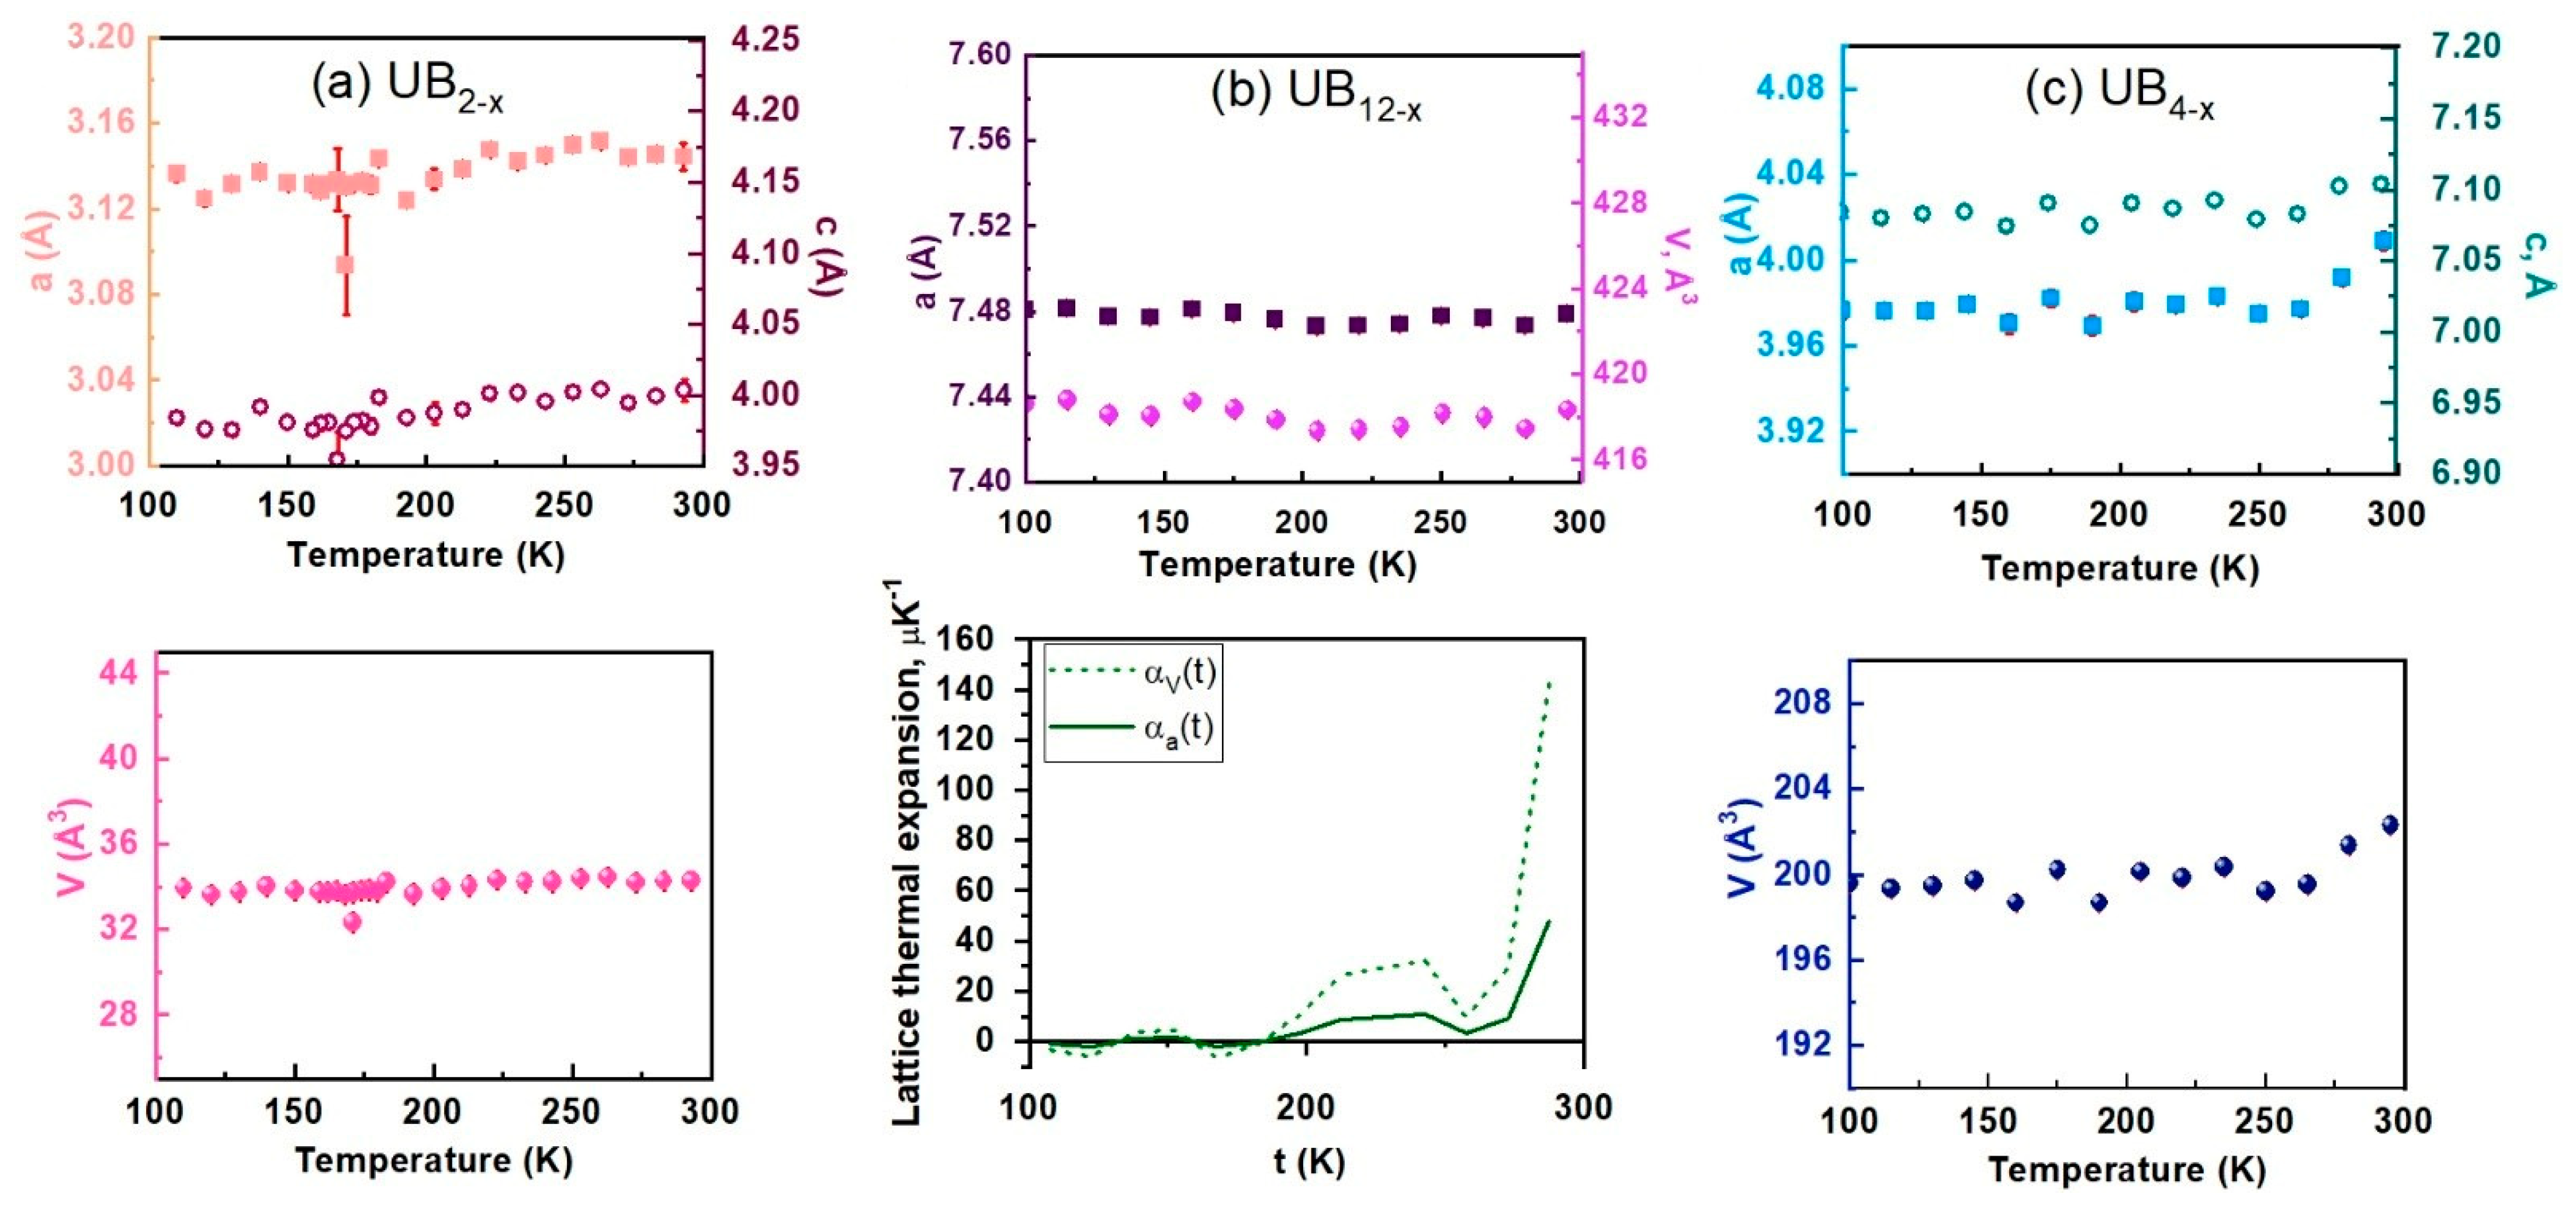
In addition to the room temperature XRD, we also performed single crystal measurements at low temperatures. Figure 2 shows the variation of lattice parameters and volume with temperature. For a direct and relative comparison, we used 0.2 Å length scale for all the lattice parameters. At room temperature, we observed a difference between the values recorded on the powders and the four circle. For UB2−x a = 3.1444 (62) c = 4.0035 (79); for UB12−x a = 7.4789 (15); and for UB4−x a = 7.1036 (40), c = 4.009 (42). This difference can be explained by a higher experimental uncertainty of the four-circle at room temperature and to the different sampling used between both measurements. Indeed, the stoichiometry in the powder sample average out all the lattice parameters values. We could fit both lattice parameters and volumes using linear equations given in Table 4. For UB2−x (Figure 2a) and UB4−x (Figure 2c), the lattice parameters are decreasing with decreasing temperatures. For UB12−x (Figure 2b), the lattice parameters are slightly increasing with decreasing temperatures. We calculated the lattice thermal expansion using the formula in ref. [28] (Figure 2b, bottom) but did not observe a negative minimum such as in LuB12 or YB12 [29]. This steep negative thermal expansion might exist at lower temperatures, but such analysis was not possible with our four-circle equipment.

3.2. Magnetic Susceptibility

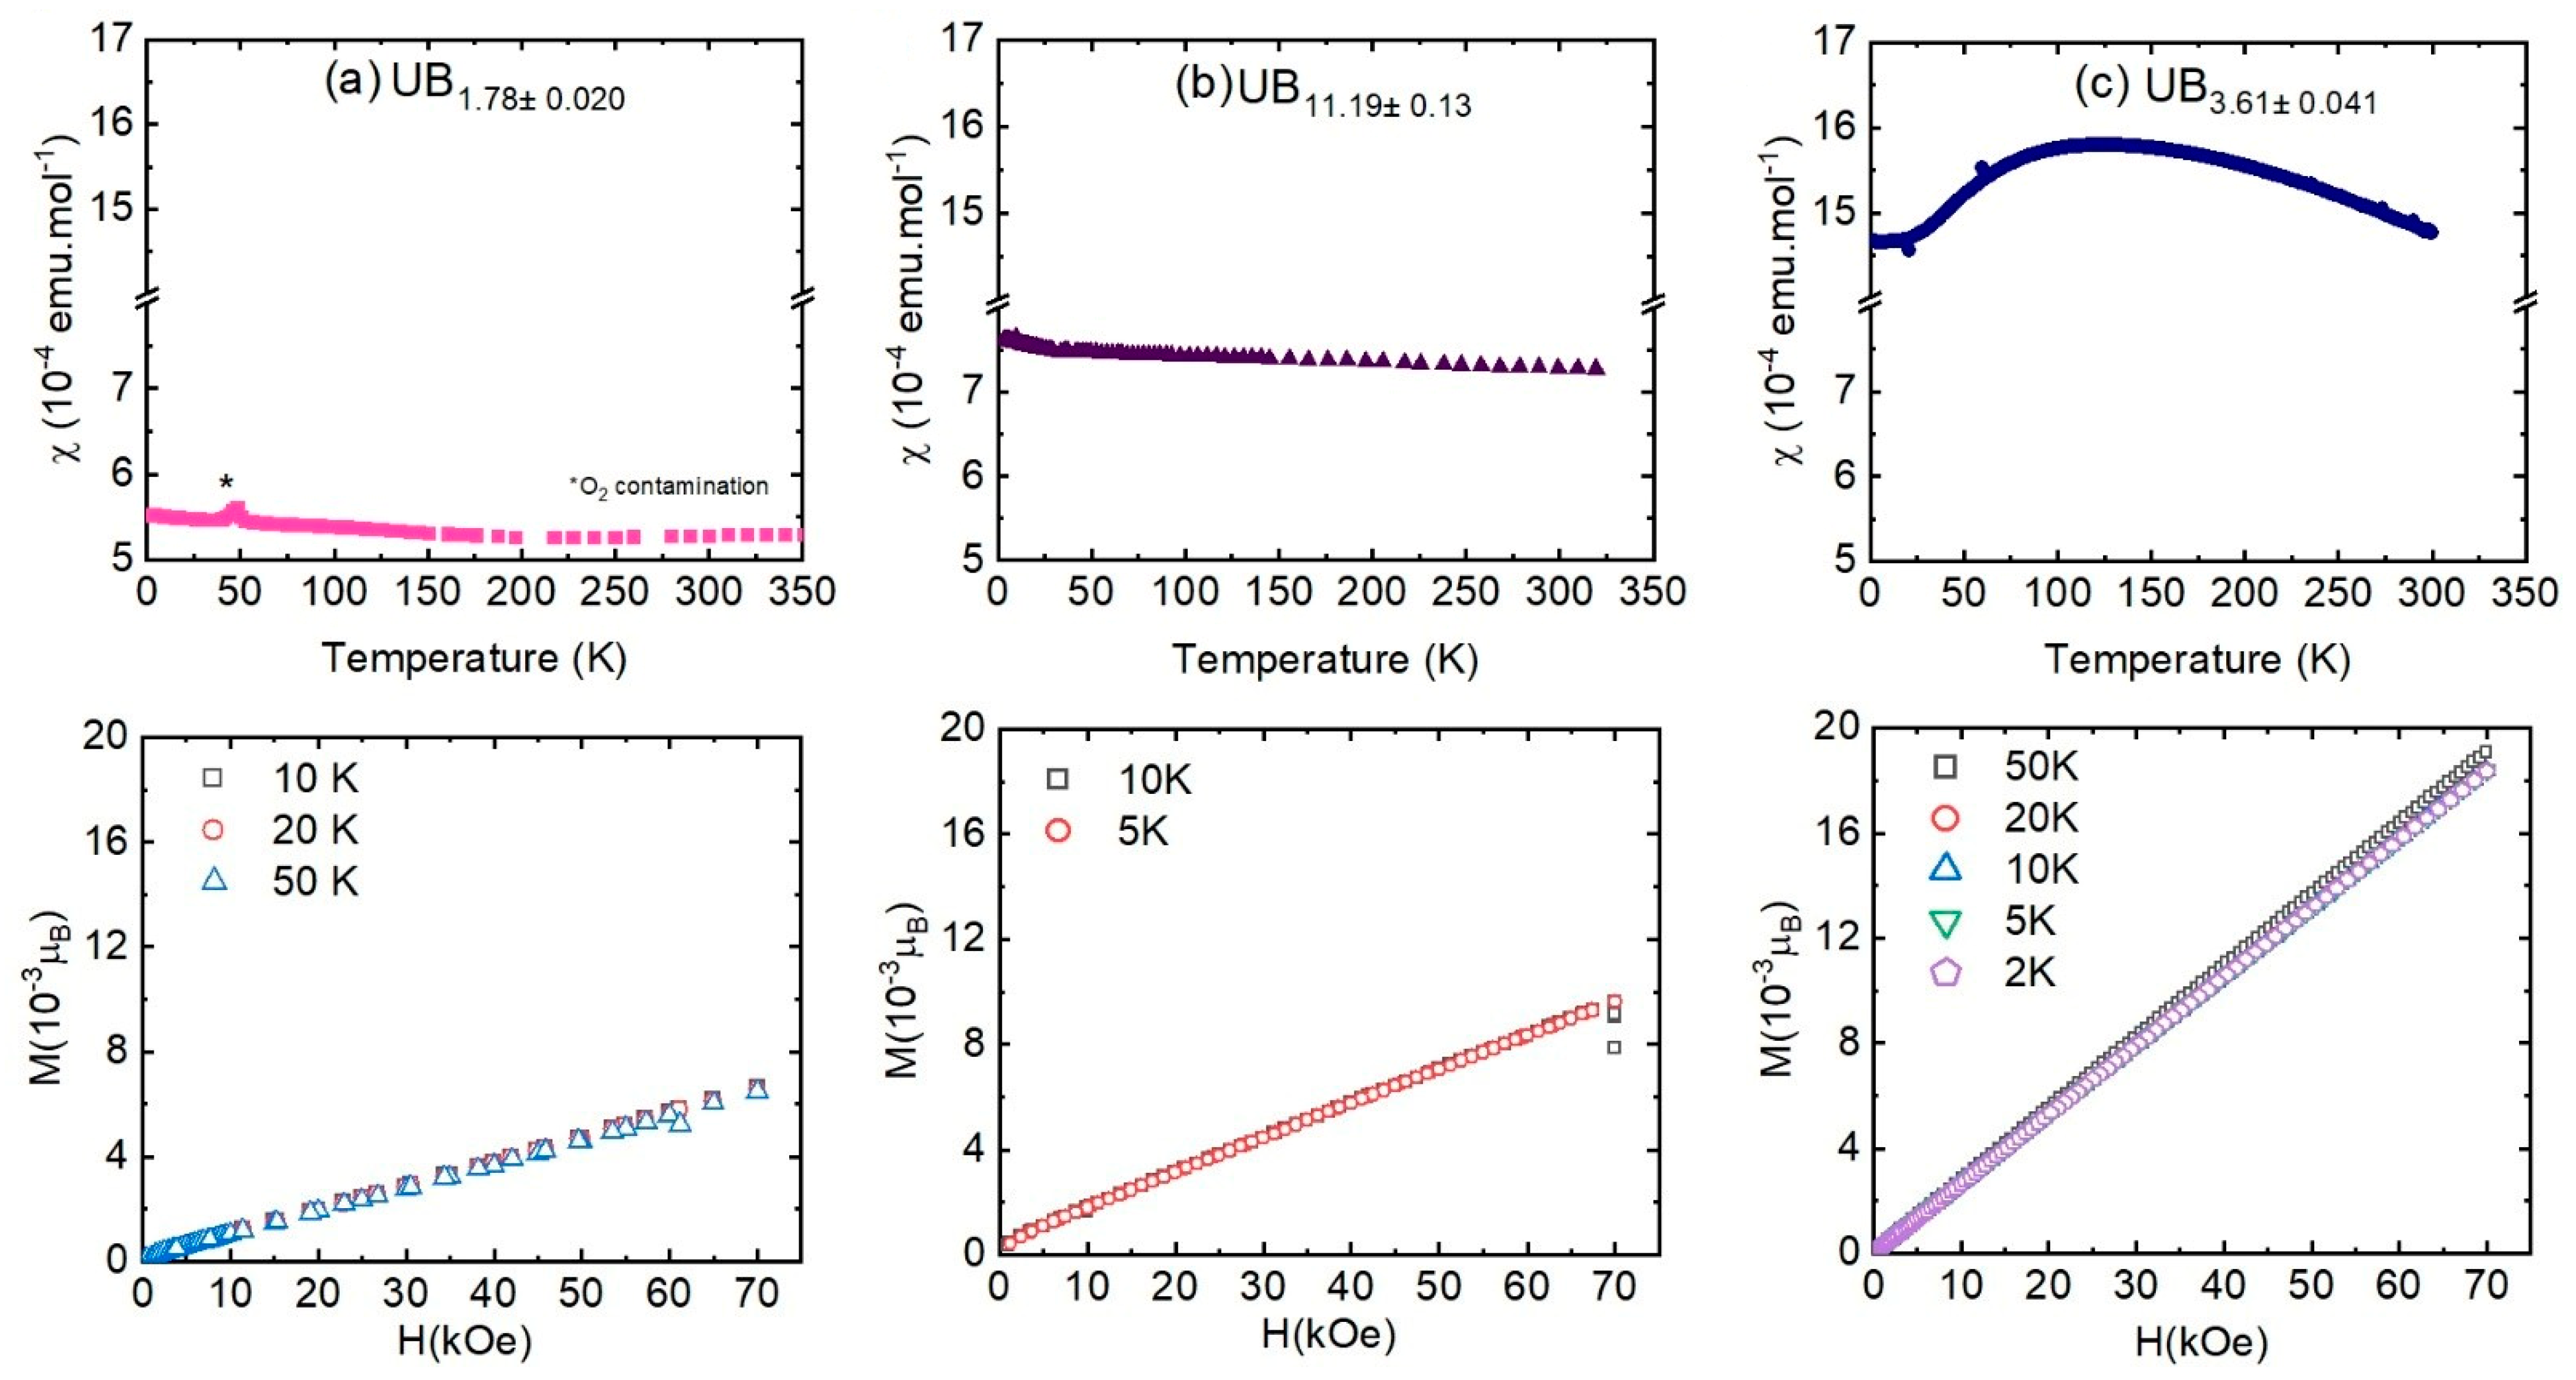
The temperature dependencies of the magnetic susceptibilities (χ) for the three uranium borides are presented in Figure 3. For UB1.78, the sample presents a temperature independent magnetic susceptibility—Pauli paramagnetism—with χUB1.78 ≈ 0.55 m emu/mol. A small anomaly is observed at approximately 50 K and is attributed to oxygen present in the SQUID magnetometer capsule. The field-dependence of the magnetization (inset of Figure 3a) is linear, and the curves measured at different temperatures have the same slope, as expected from a Pauli paramagnet. In previous work, Chachkhiani et al. [30] (χUB2−x = 0.56 m emu/mol) and Yamamoto et al. [7,8] (χUB2−x = 0.55 m emu/mol, Table 3 number 3) both described similar intrinsic Pauli magnetism on UB2 powders and single crystals, respectively. The second authors additionally described an increase in the susceptibility below 80 K ascribed to unknown magnetic impurities. This, together with other experimental results (e.g., De Haas–Van Alphen) and band calculations indicate that 5f electrons in UB2 have a very itinerant character. The close agreement of our data with UB2 single crystals shows that the physical properties are still retained in our bulk sample, despite the slightly lower boron content compared to UB2 (UB1.78). In addition, and contrary to Yamamoto et al., our sample does not present any visible magnetic impurity besides the slight oxygen signal (coming from the equipment). Our results therefore confirm the temperature-independent character of the magnetic susceptibility of UB2 below 80 K and down to 2 K.
We find the magnetic susceptibility of UB11.19 to be nearly temperature independent, indicative of Pauli paramagnetism with χUB11.19 = 0.76 memu/mol. The magnetization varies linearly versus applied magnetic field (inset of Figure 3b) and the curves at different temperatures superpose, as expected for a Pauli paramagnet. In the literature, Kasaya [31] and Tróc [32] reported χUB12−x = 0.75 memu/mol, similar to the present study. A second and more recent study performed jointly by Tróc et al. [10] and Samsel-Czekała et al. [11] reported a slightly smaller value with χUB12−x ≈ 0.65 m emu/mol attributed to the presence of UB4 and paramagnetic impurities leading to a sharp increase at low temperature. Consistently, their magnetization vs. applied magnetic field curves are non-linear at 2 and 6 K and their slopes changes up to 14 K. We did not notice such behaviours (Figure 3b). Blum and Bertaut [21] published the smallest UB12−x lattice parameter and reported a diamagnetic behaviour; this can be safely ruled out.
The magnetic susceptibility at room and low temperatures amounts to χUB3.61min ~ 1.46 memu/mol and displays a broad maximum (χUB3.61max ~ 1.58 memu/mol) in the temperature region 110–140 K. The magnetization varies linearly versus applied magnetic field (Figure 3c, lower), with a much larger slope than in UB1.78 and UB11.19, consistent with the behaviour of their magnetic susceptibilities. The curves superpose from 2 to 20 K and the slope slightly changes at 50 K. From the magnetic susceptibilities published on UB4−x, most authors have different results due to the range of non-stoichiometry (or impurities). Our results compare well with the magnetic susceptibility of Galatanu et al. [9] measured along the [100] direction of a single crystal, suggesting the possible occurrence of preferential orientation along the a-axis in our bulk sample. Their lattice parameters are similar to ours (Table 3, number 7). Additionally, our magnetization vs. magnetic field curve complements their data, as they recorded the curves for 2 K, 100 K, and higher temperatures. We can confirm the increase in linear slope at 50 K, which also occurs at 100 K. Our data also agree relatively well with those of Menovski et al. [19] on UB3.98 single crystals. They nonetheless reported a sharper maximum at 114 K with no magnetic ordering. The agreement between these previous studies and the present findings confirms the occurrence of the cross-over maximum and the robustness of this feature despite 5 wt% UB2−x as a second phase. Overall, UB4−x has delocalized electrons at low temperatures with a cross-over at approximately 110 K to localized 5f electrons at high temperatures [9] (Curie–Weiss law with an effective moment μeff ≈ 3.3μB/U). In contrast, the polycrystalline sample measured by Wallash et al. [33] does not exhibit preferential orientation and no maximum, and Chachkhiani et al. [30] attributed the peak in the susceptibility in terms of antiferromagnetic ordering.
To sum up, we showed the influence of the boron content and additional boride phases on the magnetic susceptibilities.

3.3. Nuclear Magnetic Resonance

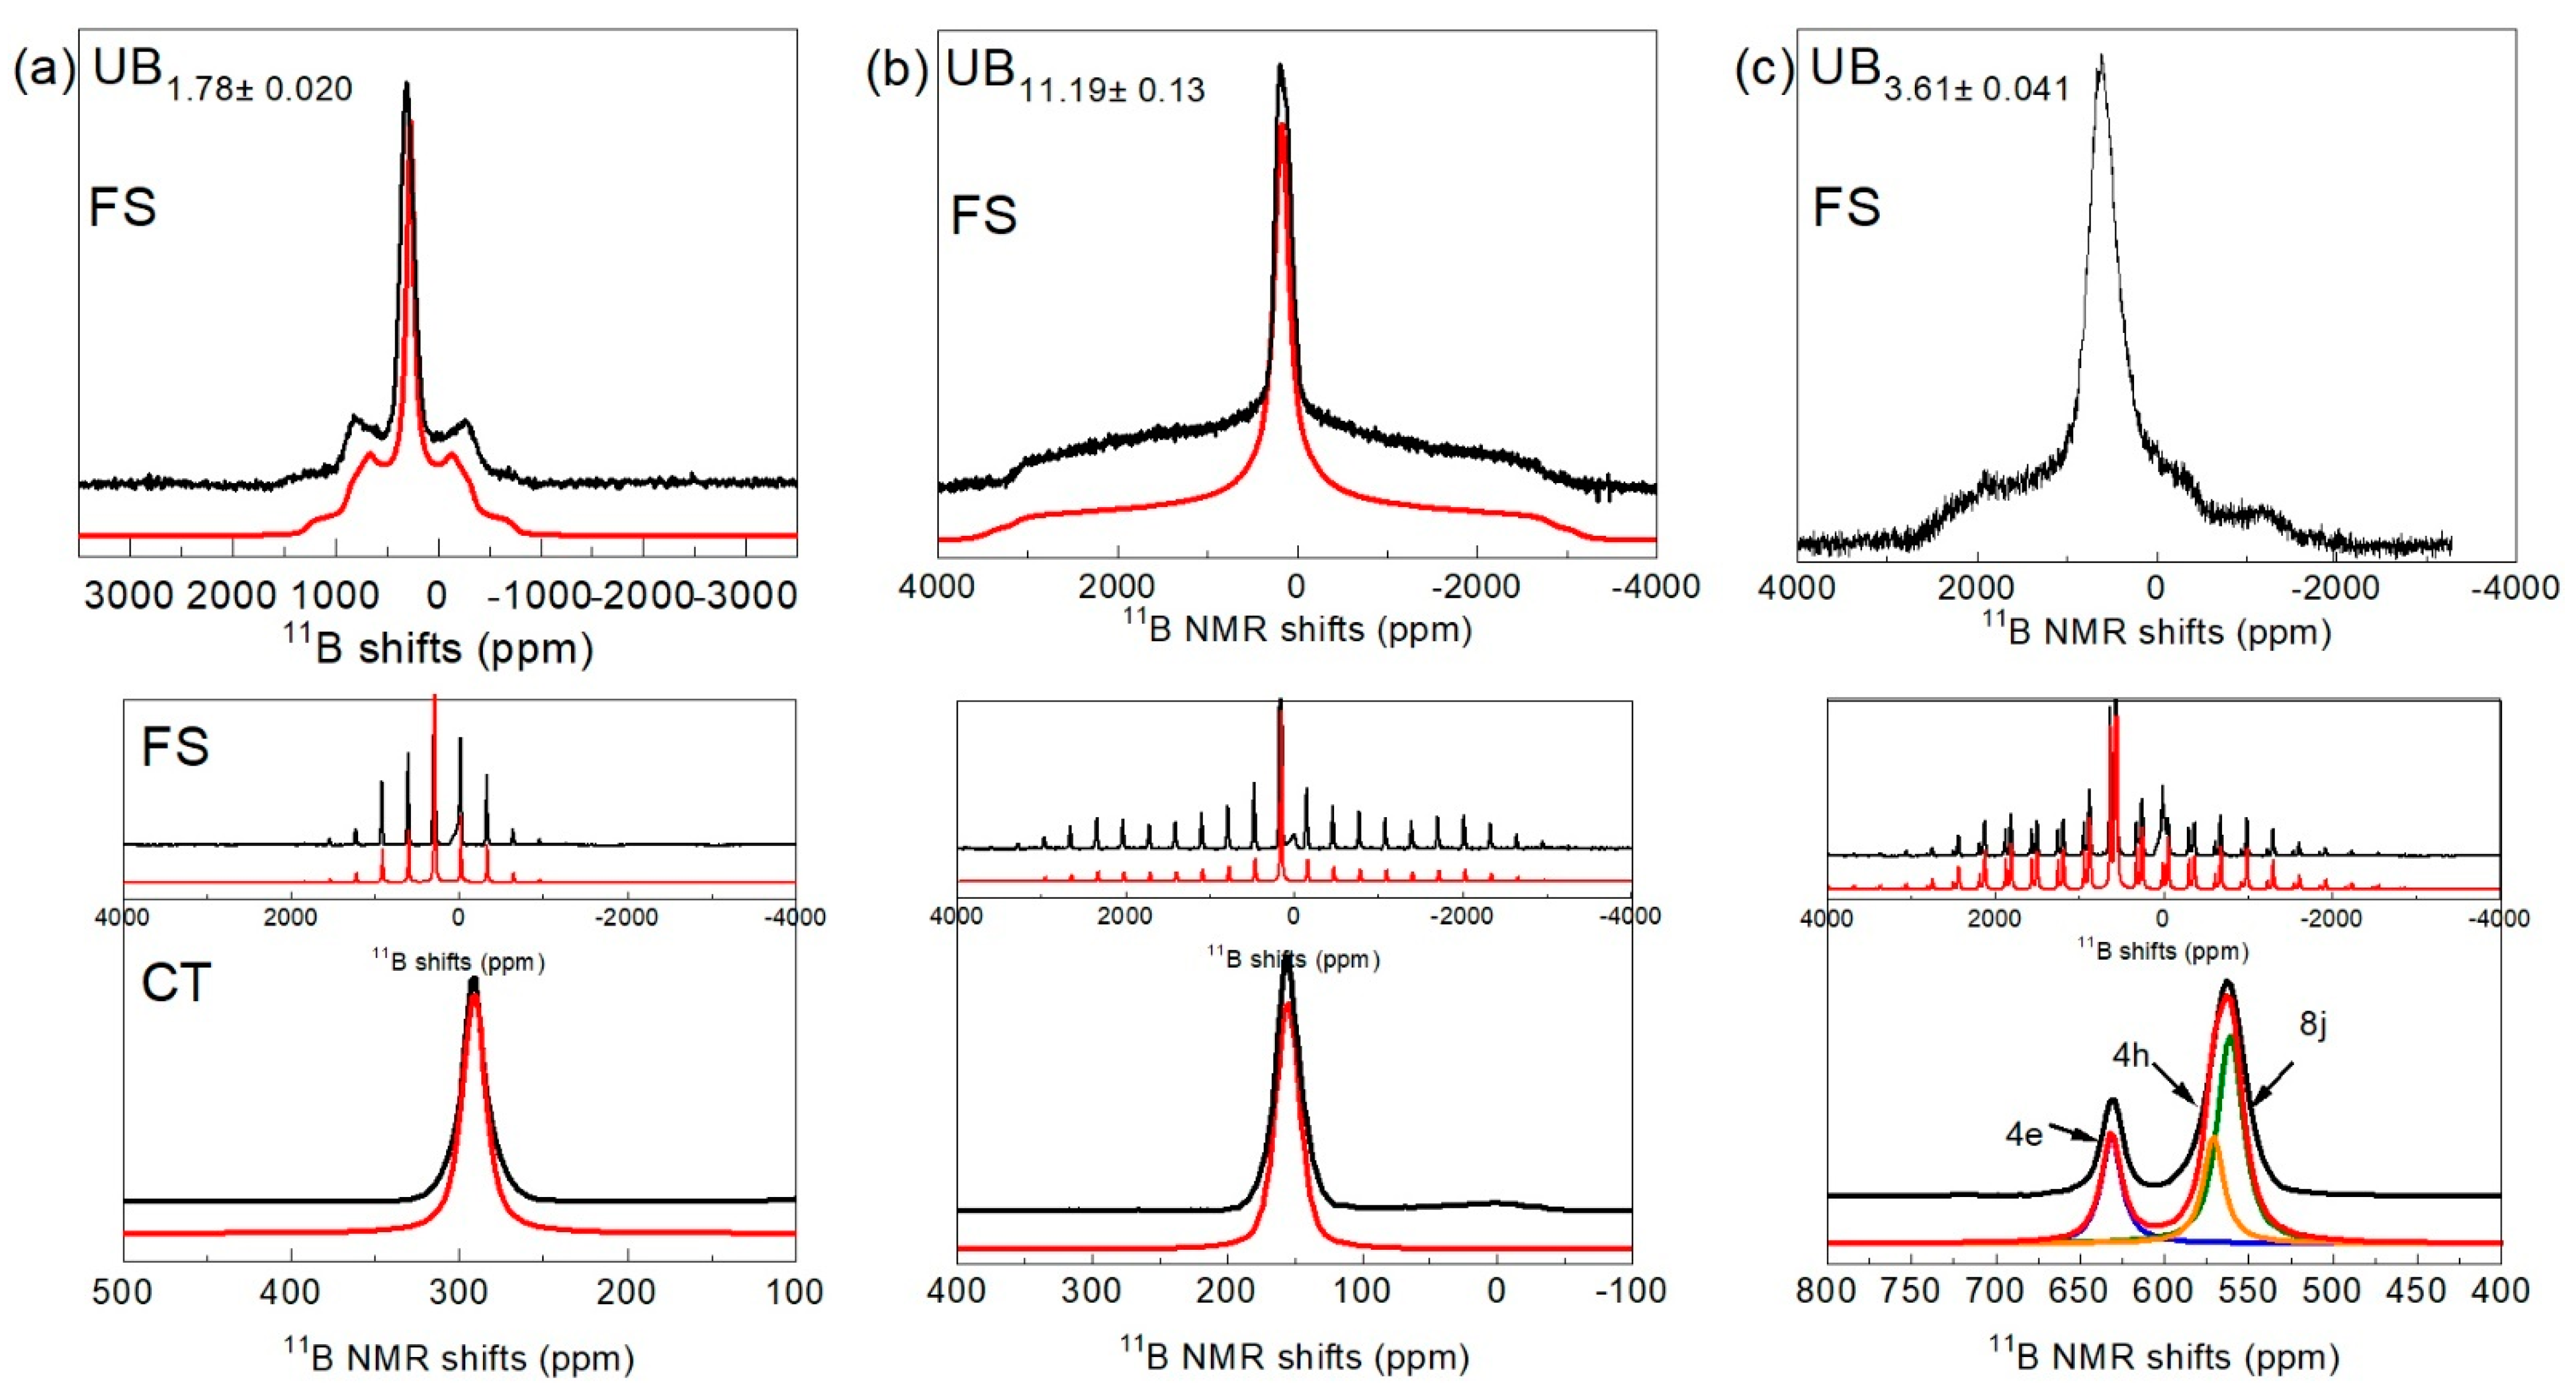
The NMR spectra recorded in static and magic angle spinning (MAS) (40 kHz) conditions, and their corresponding fits are presented in Figure 4.
We compared in Table 5 the NMR parameters of the UBX with their isostructural MBX: UB1.78 with the Pauli paramagnets AlB2 and ZrB2 [18] and the superconductor (Tc = 39 K [46]) MgB2 [48]; UB3.61 with the diamagnetic YB4 [44,46], the diamagnetic at room temperature [49] LaB4 [37,47], and the antiferromagnetic (at 7 K) [49] NdB4 [37,46]; finally, UB11.19 with the metallic ZrB12 [18] and YB12 [18,50]. All the UBX possess higher shifts than their MBX counterpart, most probably linked to the hybridization between the U5f and B2p orbitals. All the CQ values in the UBX are smaller compared to their MBX counterparts, but they have similar asymmetry parameters.
The static 11B NMR spectra are defined by a typical powder pattern for a nuclear spin I = 3/2 in the presence of first order quadrupolar interaction. The 11B MAS-NMR spectra are characterized by central peaks and their associated spinning sidebands due to the satellite transitions (±3/2 ↔ ± 1/2). All the NMR parameters are given in Table 5. The shifts have, as expected, values largely above the common range expected for diamagnetic boron (~−3 to ~20 ppm) [34,35]. As expected from their crystal structure, UB1.78 and UB11.19 present one NMR peak in both static and MAS conditions. For UB3.78, in addition to the peaks corresponding to the central transition, we could detect the signal of UB2−x (3%), as shown by XRD. The crystal structure of UB4 possesses three different crystal B sites. The static NMR spectrum presents only one unresolved peak similar to the work published by Fukushima et al. [36]. By spinning the sample, the spectral resolution increases and we can identify two main peaks at 631.5 and ~563 ppm. Nevertheless, the deconvolution of the peak at 563 ppm was not possible using only one contribution due to a strong asymmetry. This peak was therefore fitted with two contributions at 571 and 561 ppm. Although the 11B peak at 561 ppm is clearly attributed to B3 (8j) due to its intensity being twice the one of the two other peaks, it is less straightforward for the B1 (4e) and B2 (4h) sites. To differentiate them, we proceeded as suggested by Creyghton et al. [37] and used the quadrupolar parameters. In fact, these authors stated that due to their similar crystal structures and the small c/a ratio [38,39] differences between NdB4 (0.568 [40]) and LaB4 (0.571 [41]), the quadrupolar parameters must follow the same sequence. In our case, the c/a ratio of UB4 (0.5624 [42]) is close enough to that of YB4 (0.5654 [43]) to apply the same principle. Therefore, as the peak at 631 ppm has the smallest CQ it can be attributed to the B1 (4e) site similarly to YB4 [44], and the one at 571 ppm to B2 (4h). We want to further underline that for NdB4, there is an inversion between B2 and B3 in the crystal structures reported in the literature. In fact, the P4/mbm structures B2 has the Wyckoff Symbol 4g and B3 8i.
To conclude the NMR observations, we found that despite the sample’s lower boron content, only the expected number of 11B NMR peaks were detected. Due to the quadrupolar nucleus, the disorder might not be excluded as it can be expressed in the linewidth (Table 5). This result contrasts with the uranium carbides where additional 13C (spin 1/2) signals were detected as a fingerprint of the non-stoichiometry [51].

3.4. Infrared Spectroscopy

The FTIR spectra of the uranium borides are presented in Figure 5 and the main peaks positions are given in Table 6. According to the factor group analysis, the expected IR active modes for the idealized crystal structures at the Brillouin zone centre are (A2u + E1u) for UB2, (3A2u + 9Eu) for UB4, and (3T1u) for UB12 [52]. All these optical phonons represent vibrations of the boron sublattice only.
To further analyze the data, we considered the calculated phonon spectra of UB2 and extracted the frequency of the optical modes (Table 6) [23]. Jossou et al. [23] calculated the doubly degenerate E1u mode (B and U planes sliding along x, y) and the A2u (B and U planes moving against each other) modes at 393 and 481 cm−1, respectively. These results are similar to the values obtained for the modes at 388 cm−1 and 465 cm−1. The difference might be due to different lattice parameters (Table 3 number 4) and characteristics of the different stoichiometries. The additional peaks can be attributed to a loss of the local symmetry and the Raman forbidden modes can be relaxed, which indicates a reduction of symmetry [58]. The high frequency modes manifested as broad intense bands centred at 1002 cm−1, 1162 cm−1, and 1360 cm−1 might be a combination of multiple modes located near the 463 cm−1 mode [58,59]. It is worth comparing UB1.78 with MgB2 as, due to its supraconductivity [48], its optical properties have been extensively studied. The values of the IR active phonon modes in UB2 are relatively similar to the one reported experimentally [58,59] and theoretically [55,56,57] for MgB2 (Table 6).
We compared UB12 with the modes previously calculated for ZrB12 [54] (Table 6), as they should qualitatively give similar FTIR spectra. We believe that the correct IR active modes are the 3T1u. The first T1u mode at 206.6 cm−1 is not visible in our IR spectrum, but the two other T1u modes, at 729.1 cm−1 and 854.2 cm−1, might correspond to the modes at 778 cm−1 and 795cm−1 (Table 6). Similar to the FTIR from the MB12 series [54], silent modes appear on our spectrum as the local distortions can break the local symmetry, and the selection rules are then lifted. This peculiar behaviour seems typical for metal borides. Thus, the modes at 1073 cm−1 and 1162 cm−1 can be attributed to the Raman forbidden modes Eg/A1g and T2g, respectively. It must be noted that based on the present data, an unambiguous attribution is not possible.
To our knowledge, Lopez-Bezanilla [53] calculated the only phonon spectra on UB4. The author reported 12 out of the 31 optical modes and did not discuss their nature. A recent work by Surucu et al. [60] on LaB4 reported all the optical modes and determined a phonon range of 264–1072 cm−1, which therefore implies that a larger range will be expected for UB4. For this compound, we therefore cannot go much further in the spectral analysis but noted that the observed optical modes in the IR spectrum represent the whole frequency range of the calculated phonon spectrum (315–796 cm−1) (Table 6). The mode at 1007 cm−1 has a similar value as the forbidden Raman mode B1g predicted for V = 199 Å at ~1000 cm−1 (see ref. [61]). Finally, it is worth noting that the characteristic bands observed for UB2−x (388 cm−1 and 465 cm−1) are also detected on the UB4−x spectrum, in agreement with the XRD and NMR results.
From this FTIR study and the detection of additional modes, we can observe the expected structural defects that are lifting the selection rules stated from the idealized structure.

4. Conclusions

In the present study, we revisited the binary system U-B via its three samples with nominal composition UB2, UB4, and UB12. Within the uncertainty of the chemical and oxygen content analyses, purity of the samples and their U/B ratio were well characterised. The data supported the view proposed by Brewer et al. about their range of non-stoichiometry described in the literature. The composition definition of each sample is essential to link the properties and likely to explain the difference observed in literature with the lattice parameters. The X-ray diffraction patterns show the purity of the samples for UB12−x and UB2−x, whereas a minor content of UB2−x could be found for UB4−x. Furthermore, their high intensity peaks show long range order on the arc melted as cast samples. In the low range of temperature 100 K–300 K, XRD did not indicate a clear negative thermal expansion in UB12−x as its counterpart LuB12. Although influenced by the boron content, the magnetic properties agree to a certain extent with the literature data. The NMR analyses show the influence of the hybridisation between U5f and B2p. The FTIR spectra confirm the local composition effects and the disorder. We believe that our study will trigger the curiosity of theoreticians to draw models with clear references.

Supplementary Materials

The following supporting information can be downloaded at: https://www.mdpi.com/article/10.3390/min12010029/s1, Figure S1: Full X-ray diffraction patterns and corresponding fits for the uranium borides.

Author Contributions

R.E. and P.A.C. synthesized the samples. R.E. and L.M. characterized and analyzed the XRD. J.-C.G., E.C. and L.M. performed and analyzed the magnetic analyses. R.E., L.M. and M.N. performed and analyzed the FTIR data. T.C., C.S. and L.M. performed and analyzed the NMR experiments. All authors contributed equally to writing the paper. All authors have read and agreed to the published version of the manuscript.

Funding

JRC-ITU (06-09/2013).

Acknowledgments

The authors thank Sven Pfirmann for his support with the NMR, Olaf Walter for his advice concerning the single crystal XRD, and Joseph Somers for fruitful discussions.

Conflicts of Interest

The authors declare no conflict of interest.

References

  1. Lupinetti, A.J.; Fife, J.L.; Garcia, E.; Dorhout, P.K.; Abney, K.D. Low-temperature synthesis of uranium tetraboride by solid-state metathesis reactions. Inorg. Chem. 2002, 41, 2316–2318. [Google Scholar] [CrossRef]
  2. Gossé, S.; Alpettaz, T.; Géneau, C.; Allegri, P. High temperature thermochemistry of (U-Pu)O2 MOX fuel with B4C absorber—Application to severe accidents in SFR. In Proceedings of the International Conference on Fast Reactors and Related Fuel Cycles: Safe Technologies and Sustainable Scenarios, Paris, France, 4–7 March 2013. [Google Scholar]
  3. Kardoulaki, E.; White, J.T.; Byler, D.D.; Frazer, D.M.; Shivprasad, A.P.; Saleh, T.A.; Gong, B.; Yao, T.; Lian, J.; McClellan, K.J. Thermophysical and mechanical property assessment of UB2 and UB4 sintered via spark plasma sintering. J. Alloys Compd. 2020, 818, 153216. [Google Scholar] [CrossRef]
  4. Howlett, B.W. A Note on the Uranium-Boron Alloy System. J. Inst. Met. 1959, 88, 91–92. [Google Scholar]
  5. Chevalier, P.Y.; Fischer, E. Thermodynamic modelling of the C-U and B-U binary systems. J. Nucl. Mater. 2001, 288, 100–129. [Google Scholar] [CrossRef]
  6. Brewer, L.; Sawyer, D.L.; Templeton, D.H.; Dauben, C.H. A study of the refractory borides. J. Am. Ceram. Soc. 1951, 34, 173–179. [Google Scholar] [CrossRef]
  7. Yamamoto, E.; Honma, T.; Haga, Y.; Inada, Y.; Aoki, D.; Suzuki, N.; Settai, R.; Sugawara, H.; Sato, H.; Yoshichika, Ō. Electrical and thermal properties of UB2. J. Phys. Soc. Jpn. 1999, 68, 972. [Google Scholar] [CrossRef]
  8. Yamamoto, E.; Honma, T.; Haga, Y.; Inada, Y.; Aoki, D.; Tokiwa, Y.; Suzuki, N.; Miyake, K.; Yoshichika, Ō. Magnetoresistance and de Haas Van Alphen effect in UB2. J. Phys. Soc. Jpn. 1999, 68, 3347–3351. [Google Scholar] [CrossRef]
  9. Galatanu, A.; Yamamoto, E.; Hagab, Y.; Onuki, Y. Magnetic behaviour of UB4 at high temperatures. Phys. B Condens. Matter. 2006, 378, 999–1000. [Google Scholar] [CrossRef]
  10. Troć, R.; Wawryk, R.; Pikul, A.; Shitsevalova, N. Physical properties of cage-like compound UB12. Philos. Mag. 2015, 95, 2343–2363. [Google Scholar] [CrossRef]
  11. Samsel-Czekała, M.; Talik, E.; Tróc, R.; Shitsevalova, N. Electronic structure of cage-like compound UB12—Theory and XPS experiment. J. Alloys Compd. 2014, 615, 446–450. [Google Scholar] [CrossRef]
  12. Chipaux, R. Contribution a l’étude de la cristallochimie et des propriétés electroniques des borures dactinides. Ph.D. Thesis, Université d’Aix-Marseille II, Marseille, France, 1988. [Google Scholar]
  13. Massiot, D.; Farnan, I.; Gautier, N.; Trumeau, D.; Trokiner, A.; Coutures, J.P. 71Ga and 69Ga nuclear magnetic resonance study of β-Ga2O3: Resolution of four—and six-fold coordinated Ga sites in static conditions. Solid State Nucl. Magn. Reson. 1995, 4, 241–248. [Google Scholar] [CrossRef]
  14. Martel, L.; Griveau, J.-C.; Eloirdi, R.; Selfslag, C.; Colineau, E.; Caciuffo, R. Ferromagnetic ordering in NpAl2: Magnetic susceptibility and 27Al nuclear magnetic resonance. J. Magn. Magn. Mater. 2015, 387, 72–76. [Google Scholar] [CrossRef]
  15. Massiot, D.; Fayon, F.; Capron, M.; King, I.; Le Calvé, S.; Alonso, B.; Durand, J.O.; Bujoli, B.; Gan, Z.; Hoatson, G. Modelling one—and two-dimensional solid-state NMR spectra. Magn. Reson. Chem. 2002, 40, 70–76. [Google Scholar] [CrossRef]
  16. Angeli, F.; Charpentier, T.; De Ligny, D.; Cailleteau, C. Boron speciation in soda-lime borosilicate glasses containing zirconium. J. Am. Ceram. Soc. 2010, 93, 2693–2704. [Google Scholar] [CrossRef]
  17. Flotow, H.E.; Osborne, D.W.; O’Hare, P.A.G.; Settle, J.L.; Mrazek, F.C.; Hubbard, W.N. Uranium Diboride: Preparation, Enthalpy of Formation at 298.15°K, Heat Capacity from 1° to 350°K, and Some Derived Thermodynamic Properties. J. Chem. Phys. 1969, 51, 583–592. [Google Scholar] [CrossRef]
  18. Akopov, G.; Mak, W.H.; Koumoulis, D.; Yin, H.; Owens-Baird, B.; Yeung, M.T.; Muni, M.H.; Lee, S.; Roh, I.; Sobell, Z.C.; et al. Synthesis and characterization of single-phase metal dodecaboride solid solutions: Zr1−xYxB12 and Zr1−xUxB12. J. Am. Chem. Soc. 2019, 141, 9047–9062. [Google Scholar] [CrossRef]
  19. Menovsky, A.; Franse, J.J.M.; Klaasse, J.C.P. The crystal growth of uranium tetraboride UB4 from the melt. J. Cryst. Growth 1984, 70, 519–522. [Google Scholar] [CrossRef]
  20. Dancausse, J.-P.; Gering, E.; Heathman, S.; Benedict, U.; Gerward, L.; Staun Olsen, S.; Hulliger, F. Compression study of uranium borides UB2, UB4 and UB12 by synchrotron X-ray diffraction. J. Alloys Compd. 1992, 189, 205–208. [Google Scholar] [CrossRef]
  21. Blum, P.; Bertaux, F. Contribution à l’etude des borures à teneur elevée en bore. Acta Cryst. 1954, 7, 81–86. [Google Scholar] [CrossRef]
  22. Matkovich, V.I.; Economy, J.; Giese jr., R.F. Barrett, R. The structure of metallic dodecaborides. Acta Cryst. 1965, 19, 1056–1058. [Google Scholar] [CrossRef]
  23. Jossou, E.; Oladimeji, D.; Malakkal, L.; Middleburgh, S.; Szpunar, B.; Szpunar, J. First-principles study of defects and fission product behavior in uranium diboride. J. Nucl. Mater. 2017, 494, 147–156. [Google Scholar] [CrossRef]
  24. Chipaux, R.; Cecilia, G.; Beauvy, M.; Tróc, R. Capacité thermique a haute temperature de UBe13, ThBe13 et UB4. J. Less Common Met. 1986, 121, 347–351. [Google Scholar] [CrossRef]
  25. Turner, J.; Martini, F.; Buckley, J.; Phillips, G.; Middleburgh, S.C.; Abram, T.J. Synthesis of candidate advanced technology fuel: Uranium diboride (UB2) via carbo/borothermic reduction of UO2. J. Nucl. Mater. 2020, 540, 152388. [Google Scholar] [CrossRef]
  26. Guo, H.; Wang, J.; Chen, D.; Tian, W.; Cao, S.; Chen, D.; Tan, C.; Deng, Q.; Qin, Z. Boro/carbothermal reduction synthesis of uranium tetraboride and its oxidation behavior in dry air. J. Am. Ceram. Soc. 2019, 102, 1049–1056. [Google Scholar] [CrossRef]
  27. Evitts, L.J.; Middleburgh, S.C.; Kardoulaki, E.; Ipatova, I.; Rushton, M.J.D.; Lee, W.E. Influence of boron isotope ratio on the thermal conductivity of uranium diboride (UB2) and zirconium diboride (ZrB2). J. Nucl. Mater. 2020, 528, 151892. [Google Scholar] [CrossRef]
  28. Okada, Y.; Tokumaru, Y. Precise determination of lattice parameter and thermal expansion coefficient of silicon between 300 and 1500 K. J. Appl. Phys. 1984, 56, 314–320. [Google Scholar] [CrossRef]
  29. Czopnik, A.; Shitsevalova, N.; Pluzhnikov, V.; Krivchikov, A.; Paderno, Y.; Onuki, Y. Low-temperature thermal properties of yttrium and lutetium dodecaborides. J. Phys. Condens. Matter. 2005, 17, 5971–5985. [Google Scholar] [CrossRef]
  30. Chachkhiani, Z.B.; Chachkhiani, L.G.; Chechernikov, V.I.; Slovyanskikh, V.K. Magnetic properties of thorium and uranium borides and U1−xThxB4 solid solutions. Sov. Phys. J. 1982, 25, 621–623. [Google Scholar] [CrossRef]
  31. Kasaya, M.; Iga, F.; Katoh, K.; Takegahara, K.; Kasuya, T. Magnetic and transport properties of uranium borides, UB12, Ulr3B2 and UOs3B2. J. Magn. Magn. Mater. 1990, 90, 521–522. [Google Scholar] [CrossRef]
  32. Troć, R.; Trzebiatowski, W.; Piprek, K. Magnetic properties of uranium borides and of uranium beryllide UBe13 Bull. Acad. Polon. Sci. Ser. Sci. Chim. 1971, 19, 427. [Google Scholar]
  33. Wallash, A.; Crow, J.; Fisk, Z. Susceptibility, magnetization, and specific heat in the paramagnetic and ferromagnetic regions of (Y1−xUx)B4. J. Appl. Phys. 1985, 57, 3143–3145. [Google Scholar] [CrossRef] [Green Version]
  34. Mackenzie, K.J.D.; Smith, M.E. Multinuclear Solid-State NMR of Inorganic Materials; Cahn, R., Ed.; Elsevier: Amsterdam, The Netherlands, 2002. [Google Scholar]
  35. Angel Wong, Y.-T.; Bryce, D.L. Recent Advances in 11B Solid-State Nuclear Magnetic Resonance Spectroscopy of Crystalline Solids. Annu. Rep. NMR Spectrosc. 2018, 93, 213–279. [Google Scholar]
  36. Fukushima, E.; Strubeing, V.O.; Hill, H.H. Induced Paramagnetism in Uranium Alloys: A Boron NMR Study of Alloys Formed between UB4 and YB4. J. Phys. Soc. Jpn. 1975, 39, 921–926. [Google Scholar] [CrossRef]
  37. Creyghton, J.H.N.; Locher, P.R.; Buschow, K.H.J. Nuclear magnetic resonance of 11B at the three boron sites in rare-earth tetraborides. Phys. Rev. B 1973, 7, 4829–4843. [Google Scholar] [CrossRef]
  38. Crystal Structures, 2nd ed.; Interscience: New York, NY, USA, 1964; Volume 2.
  39. Fisk, Z.; Cooper, A.S.; Schmidt, P.H.; Castellano, R.N. Preparation and lattice parameters of the rare earth tetraborides. Mater. Res. Bull. 1972, 7, 285–288. [Google Scholar] [CrossRef]
  40. Roger, J.; Babizhetskyy, V.; Jardin, R.; Halet, J.-F.; Guérin, R. Solid state phase equilibria in the ternary Nd–Si–B system at 1270 K. J. Alloys Compd. 2006, 415, 73–84. [Google Scholar] [CrossRef]
  41. Kato, K.; Kawada, I.; Oshima, C.; Kawai, S. Lanthanum tetraboride. Acta Cryst. B 1974, B30, 2933–2934. [Google Scholar] [CrossRef]
  42. Zalkin, A.; Templeton, D.H. The crystal structures of CeB4 ThB4 and UB4. Acta Cryst. 1953, 6, 269–272. [Google Scholar] [CrossRef]
  43. Giese, R.F., Jr.; Matkovich, V.I.; Economy, J. The crystal structure of YB4. Z. Krist. 1965, 122, 423–432. [Google Scholar] [CrossRef]
  44. Jäger, B.; Paluch, S.; Wolf, W.; Herzig, P.; Zogał, O.J.; Shitsevalova, N.; Paderno, Y. Characterization of the electronic properties of YB4 and YB6 using 11B NMR and first-principles calculations. J. Alloys Compd. 2004, 383, 232–238. [Google Scholar] [CrossRef] [Green Version]
  45. Baek, S.H.; Suh, B.J.; Pavarini, E.; Borsa, F.; Barnes, R.G.; Bud’ko, S.L.; Canfield, P.C. NMR spectroscopy of the normal and superconducting states of MgB2 and comparison to AlB2. Phys. Rev. B 2002, 66, 104510. [Google Scholar] [CrossRef]
  46. Żogał, O.J.; Florian, P.; Massiot, D.; Paluch, S.; Shitsevalova, N.; Borshchevsky, D.F. 11B and 89Y MAS NMR and magnetic characterization of YB4. Solid State Commun. 2009, 149, 693–696. [Google Scholar] [CrossRef]
  47. Schmitt, R.; Blaschkowski, B.; Eichele, K.; Meyer, H.-J. Calcium TetraborideDoes It Exist? Synthesis and Properties of a Carbon-Doped Calcium Tetraboride That Is Isotypic with the Known Rare Earth Tetraborides. Inorg. Chem. 2006, 45, 3067–3073. [Google Scholar]
  48. Nagamatsu, J.; Nakagawa, N.; Muranaka, T.; Zenitani, Y.; Akimitsu, J. Superconductivity at 39 K in magnesium diboride. Nature 2001, 410, 63–64. [Google Scholar] [CrossRef]
  49. Buschow, K.H.J.; Creyghton, J.H.N. Magnetic Properties of Rare Earth Tetraborides. J. Chem. Phys. 1972, 57, 3910–3914. [Google Scholar] [CrossRef]
  50. Fojud, Z.; Herzig, P.; Żogał, O.J.; Pietraszko, A.; Dukhnenko, A.; Jurga, S.; Shitsevalova, N. Electric-field-gradient tensor and boron site-resolved 11B NMR in single-crystalline YB12. Phys. Rev. B 2007, 75, 184102. [Google Scholar] [CrossRef]
  51. Carvajal Nuñez, U.; Martel, L.; Prieur, D.; Lopez Honorato, E.; Eloirdi, R.; Farnan, I.; Vitova, T.; Somers, J. Coupling XRD, EXAFS, and 13C NMR to study the effect of the carbon stoichiometry on the local structure of UC1±x. Inorg. Chem. 2013, 19, 11669–11676. [Google Scholar] [CrossRef]
  52. Kroumova, E.; Aroyo, M.I.; Perez Mato, J.M.; Kirov, A.; Capillas, C.; Ivantchev, S.; Wondratschek, H. Bilbao Crystallographic Server: Useful databases and tools for phase transitions studies. In Phase Transitions 76; Nos. 1-2; 2003; pp. 155–170. [Google Scholar] [CrossRef]
  53. Lopez-Bezanilla, A. f-Orbital based Dirac states in a two-dimensional uranium compound. J. Phys. Mater. 2020, 3, 024002. [Google Scholar] [CrossRef]
  54. Werheit, H.; Filipov, V.; Shirai, K.; Dekura, H.; Shitsevalova, N.; Schwarz, U.; Armbrüster, M. Raman scattering and isotopic phonon effects in dodecaborides. J. Phys. Condens. Matter 2011, 23, 065403. [Google Scholar] [CrossRef]
  55. Bohnen, K.-P.; Heid, R.; Renker, B. Phonon Dispersion and Electron-Phonon Coupling in MgB2 and AlB2. Phys. Rev. Lett. 2001, 86, 5771–5774. [Google Scholar] [CrossRef] [Green Version]
  56. Kong, Y.; Dolgov, O.V.; Jepsen, O.; Andersen, O.K. Electron-phonon interaction in the normal and superconducting states of MgB2. Phys. Rev. B 2001, 64, 020501. [Google Scholar] [CrossRef] [Green Version]
  57. Kortus, J.; Mazin, I.I.; Belashchenko, K.D.; Antropov, V.P.; Boyer, L.L. Superconductivity of metallic boron in MgB2. Phys. Rev. Lett. 2001, 86, 4656–4659. [Google Scholar] [CrossRef] [PubMed] [Green Version]
  58. Alarco, J.A.; Chou, A.; Talbot, P.C.; Mackinnon, I.D.R. Phonon Modes of MgB2: Super-lattice Structures and Spectral Response. Phys. Chem. Chem. Phys. 2014, 16, 24443–24456. [Google Scholar] [CrossRef] [PubMed] [Green Version]
  59. Sundar, C.S.; Bharathi, A.; Premila, M.; Kalavathi, S.; Reddy, G.L.N.; Sastry, V.S.; Hariharan, Y.; Radhakrishnan, T.S. Infrared absorption in superconducting MgB2. arXiv 2001, arXiv:0104354. [Google Scholar]
  60. Surucu, G.; Ozısık, H.; Deligoz, E.; Shein, I.R.; Matovnikov, A.V.; Mitroshenkov, N.V.; Morozov, A.V.; Novikov, V.V. Electronic and thermodynamic properties of lanthanum tetraboride on low-temperature experimental and ab-initio calculation data. J. Alloys Compd. 2020, 862, 158020. [Google Scholar] [CrossRef]
  61. Werheit, H.; Filipov, V.; Shitsevalova, N.; Armbrüster, M.; Schwarz, U.; Ievdokimova, A.; Muratov, V.; Gurin, V.N.; Korsukova, M.M. Raman scattering in rare earths tetraborides. Solid State Sci. 2014, 31, 24–32. [Google Scholar] [CrossRef]
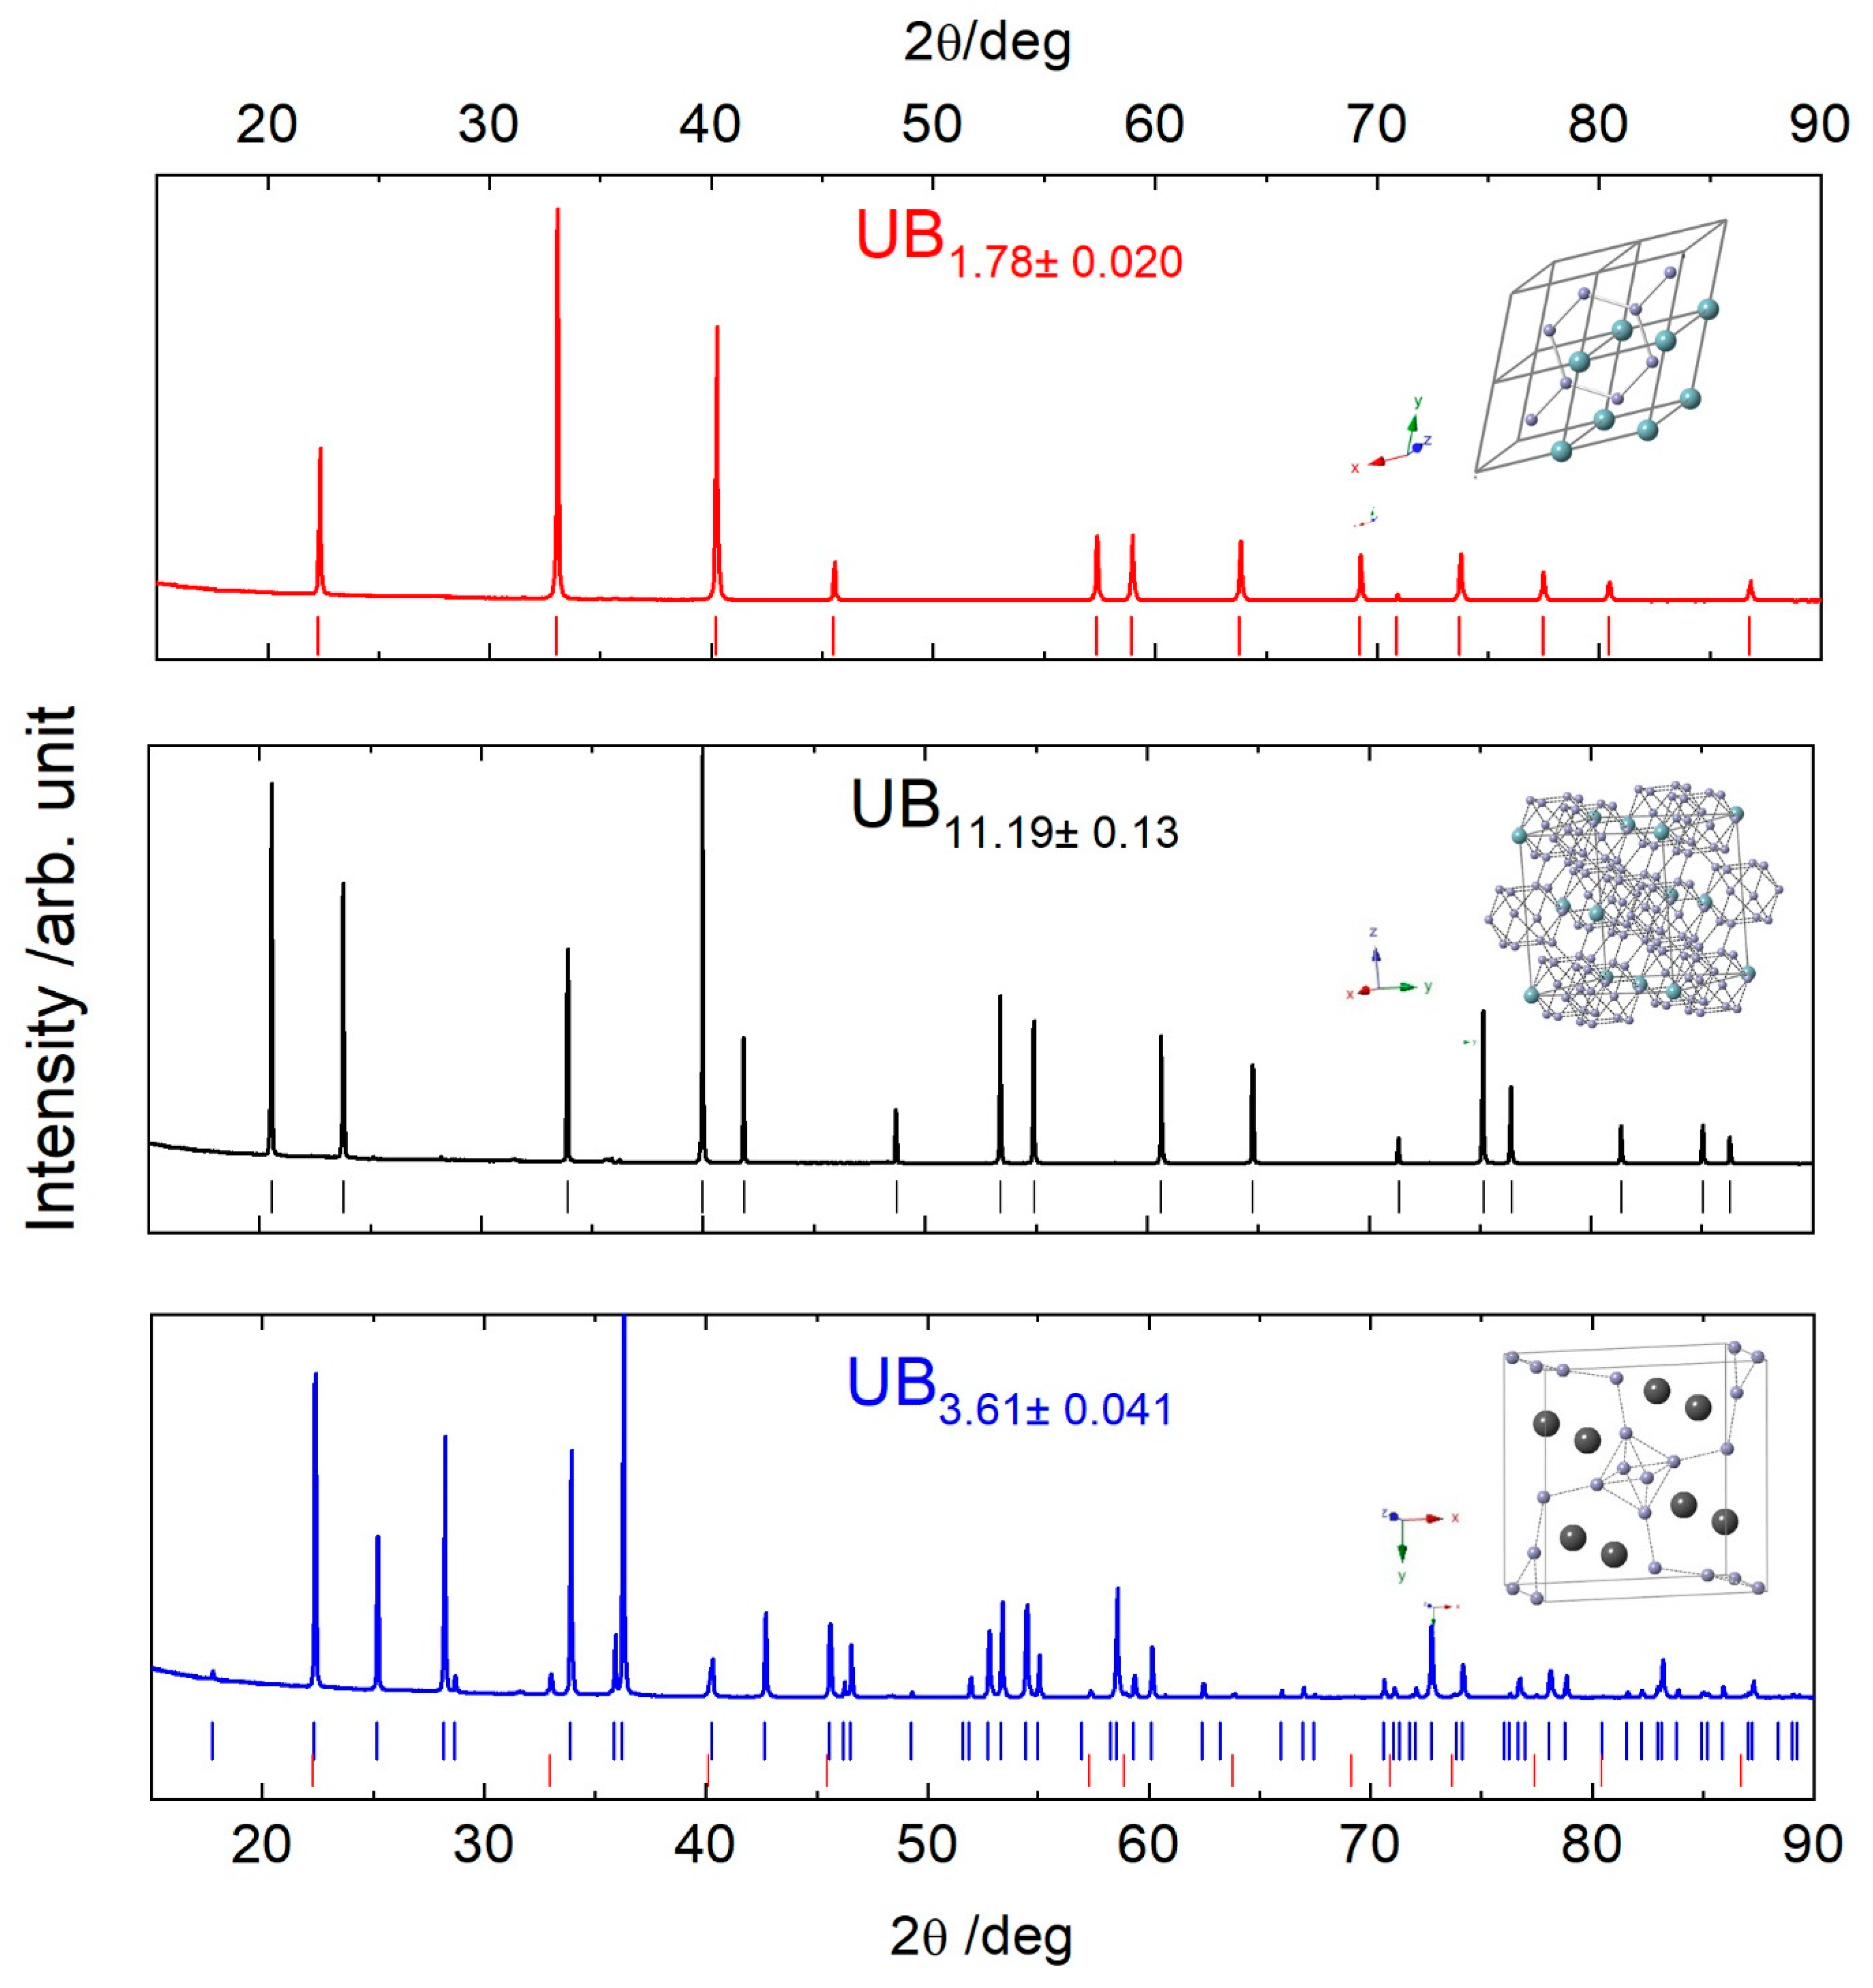
Figure 1. X-ray diffraction patterns and structures of the uranium borides. The uranium atoms are bigger than the B atoms.
Minerals 12 00029 g001
Figure 2. Lattice parameters and volume expansion of (a) UB2−x, (b) UB4−x, and (c) UB12−x in the temperature range (100–300) K. For UB12−x, the lattice thermal expansion is also presented.
Minerals 12 00029 g002
Figure 3. Magnetic susceptibility curves against temperature (top) and magnetization against field (bottom) for (a) UB1.78, (b) UB11.19, and (c) UB3.61.
Minerals 12 00029 g003
Figure 4. 11B static (upper) and MAS-NMR spectra (lower) for (a) UB1.78, (b) UB11.19, and (c) UB3.61 showing the central transition (CT) and the Full spectra (FS). The fits are the red lines.
Minerals 12 00029 g004
Figure 5. Infrared spectra of (a) UB1.78, (b) UB11.19, and (c) UB3.61. The blue spots correspond to the main bands.
Minerals 12 00029 g005
Table 1. U/B ratio obtained by ICPMS and oxygen content determined by direct combustion—infrared absorption.
SamplesUB2−xUB4−xUB12−x
U/B (at/at)1.780 ± 0.0203.613 ± 0.04111.19 ± 0.13
Oxygen content (mg/g) <200 *
* Detection limit of the method.
Table 2. Structural parameters.
NameUB1.78UB11.19UB3.61
Structurehexagonalcubictetragonal
Space group n°P6/mmmFm-3mP4/mbm
a = b/Å3.1225 (1)7.4715 (1)7.0777 (4)
c/Å3.9858 (2)-3.9783 (2)
α/deg909090
β/deg---
γ/deg120--
Rwp8.3810.249.01
Gof2.813.163.05
Composition/%10010095.1 (+UB2)
Shortest U-U spacing Å3.125.283.65
Table 3. Lattice parameters of UB2±x, UB4−x, and UB12−x reported in the present study (P.S.) and from the literature.
UB2UBXUB4UBXUB12UBX
a (Å)c (Å)Ref.Xa (Å)c (Å)Ref.Xa (Å)Ref.X
13.12253.9858P.S.1.78 (2)7.05733.9008[20] 7.468[21] 1
23.1302 (3)3.9878 (3)[20] 7.07773.9783P.S.3.613 (41)7.4715P.S.11.19 (13)
33.1323.986[7] 2 7.0803.978[21] 7.473[22]
43.1393.994[23] 7.079 (1)3.983 (1)[24] 7.474[10] 3, [11]
53.1333.986[25]2.027.07953.9794[26] 4 7.475[18,20]16
63.0844.020[27] 7.07643.9811[19]3.98
73.136 (6)3.988 (8) 7.083.98[9]
83.1309 (5)3.9837 (5)[17]1.79 (6)
1 +UB12 diamagnetic; 2 +impurities; 3 +UB4; 4 +amorphous carbon.
Table 4. Linear fit of the lattice parameters and volumes with the temperature.
CompoundsUB2−xUB4−xUB12−x
ParameteracVacVaV
slope(1.0648 ± 1.8127) 10−5(1.3111 ± 0.2538) 10−40.0043 ± 0.0016(7.3755 ± 2.9109) 10−5(7.1264 ± 3.0399) 10−5(8.83 ± 3.64) 10−3(−2.3 ± 1) 10−5−4.82 ± 1.53) 10−3
intercept3.1172 ± 0.00403.9641 ± 0.005733.0589 ± 0.29817.072 ± 0.0063.9662 ± 0.0061198.087 ± 0.74237.4814 ± 0.0021419.0161 ± 0.2836
Adj-R20.57270.50670.20540.29420.25700.27250.22060.4076
Table 5. 11B NMR parameters Knight shifts (11BK), quadrupolar coupling constant (CQ), and asymmetry parameter (ηQ) of the uranium borides compounds.
Compound Name 11BK (ppm)FWHM (ppm)CQ (kHz)hQ
UB1.78B1303.6 a--298.4 a0.2 a
291.6 b16.8
UB3.61B1 (4e)631.514.2390 b1 b
B2 (4h)57114560 b0.9 b
B3 (8j)561.218560 b0.8 b
UB11.19B1164.3 a--774.7 a0.8 a
155.4 b21.2
AlB2 [18] −10 ± 5 1.080
ZrB2 [18] −29 ----
MgB2 [45] 40 ± 10 1.670
YB4 [44,46]4e34.7 1.14
4h12.6 1.46
8j5.4 1.04
LaB4 [37,47]4e42 0.690
4h47 1.10
8j18 0.80.5
NdB4 [37,46]4e3300 (±10–15%)) 0.840
4h2300 (±10–15%) 0.890.5
8j2600 (±10–15%) 1.2440
ZrB12 [18] 10 1.0830.98
YB12 [18] 25 1.080.93
The parameters were obtained a static and b 40 kHz.
Table 6. Values of the main FTIR bands (cm1). For UB4 extracted from the literature, dd corresponds to doubly degenerate mode. For ZrB12, the numbers in bold are the active IR bands defined by the authors, with a star are the active IR bands defined by the Bilbao crystallographic database, and in italic are the active Raman bands. The frequencies presented for UB12 from ref. [52] correspond to Raman modes.
Present StudyLiterature
UB1.78UB3.61UB11.19UB4 [53]ZrB12 [54]UB12 [54]UB2 [23]MgB2
1388395394dd315T1u0 E1u393E1u [55]322/327 #
2--438 350T2u198.3 A2u481A2u394/405 #
3463456453dd358T1u206.6 E2g598
4500--513 399T1g478.1 B1g794E1u [56]335 #
5680--693dd608Eu498.2 A2u401 #
6778778778dd722A2g518.8
7796796795dd796Eg639.9621 E1u [57]320 #
8907---- T2u661.6 A2u390 #
91002---- T1g693.6
10108310771073 T1u729.1
11116211621162 T2g801.7748
1213601354-- T1u854.2
A2u982.4
Eg1010.1971
A1g1078.31039
T2g1084.41088
# calculated values for MgB2.
Publisher’s Note: MDPI stays neutral with regard to jurisdictional claims in published maps and institutional affiliations.