Article

Experimental Investigation on the Energy Properties and Failure Process of Thermal Shock Treated Sandstone Subjected to Coupled Dynamic and Static Loads

1
School of Civil Engineering, Sun Yat-sen University, Zhuhai 519082, China
2
School of Resources and Safety Engineering, Central South University, Changsha 410083, China
*
Authors to whom correspondence should be addressed.
Minerals 2022, 12(1), 25; https://doi.org/10.3390/min12010025
Submission received: 22 November 2021 / Revised: 19 December 2021 / Accepted: 20 December 2021 / Published: 23 December 2021
(This article belongs to the Special Issue Fracturing of Coal and Rock Mass)

Abstract

:
Thermal shock (TS) is known as the process where fractures are generated when rocks go through sudden temperature changes. In the field of deep rock engineering, the rock mass can be subjected to the TS process in various circumstances. To study the influence of TS on the mechanical behaviors of rock, sandstone specimens are heated at different high temperatures and three cooling methods (stove cooling, air cooling, and freezer cooling) are adopted to provide different cooling rates. The coupled dynamic and static loading tests are performed on the heated sandstone through a modified split Hopkinson pressure bar (SHPB) system. The influence of heating level and cooling rate on the dynamic compressive strength, energy dissipations, and fracturing characteristics is investigated based on the experimental data. The development of the microcracks of the sandstone specimens after the experiment is analyzed utilizing a scanning electron microscope (SEM). The extent of the development of the microcracks serves to explain the variation pattern of the mechanical responses and energy dissipations of the specimens obtained from the loading test. The findings of this study are valuable for practices in rock engineering involving high temperature and fast cooling.

1. Introduction

With the rapid development of human society, the world’s demand for energy sources is continuously growing, and the gradual depletion of shallow mineral resources leads to the inevitable trend of exploitation into the deep strata [1,2]. The deep rock mass is commonly subjected to undesirable conditions including high temperature, high in-situ stress, and dynamic disturbance, which is different from the circumstances encountered in shallow strata [3,4,5,6]. In deep rock engineering applications such as oil exploitation and geothermal development, the rock mass at a high temperature can experience rapid temperature drops induced by cryogenic liquid [7]. In certain accident scenarios, for example in the case of fire and the consequent extinguishment of the fire [8,9], the deep rock mass can also go through rapid temperature rise or drop. The rapid temperature change can induce thermal stress and lead to cracks in the rock, which is referred to as thermal shock (TS) [10]. So far, the thermal shock has become a research focus in the field of rock mechanics. Some results have been reported with respect to the variation patterns of the physical and mechanical properties of rocks under the influence of different TS treatments [11,12,13].
The deformation and failure process of rock is essentially the process of continuous exchange of material and energy with the outside environment [14]. Therefore, it is of great practical significance to study the mechanical behavior of rocks from the perspective of energy. In recent years, several studies have contributed to the understanding of the energy dissipation characteristics of heated rock under static or dynamic compression. Wang et al. [15] carried out the static and dynamic compression tests on granite specimens after heating at different temperatures. They found that the energy utilization ratio is affected by the heating temperature, and for both the dynamic and static compression tests, the energy utilization ratios are generally less than 35%. Li et al. [16] conducted the dynamic loading tests on sandstone after heat treatment using the split Hopkinson pressure bar (SHPB) test system. Their results illustrated that the dynamic fracture and energy consumption characteristics of sandstone are mainly related to the changes of internal moisture and cementing materials. To study the energy evolution characteristics of heat-treated sandstone, Zhang et al. [17] carried out dynamic loading experiments on heat-treated specimens by an SHPB system. Their results showed that the total input strain energy decreases with the temperature increasing when the impact pressure is the same. Wang et al. [18] conducted dynamic impact compression tests on heat-treated granite by a modified SHPB system. The test results showed that under the same round of repeated impacts, the cumulative breakage energy dissipation density of the specimen heated at 600 °C is the largest and its damage evolves at the quickest rate. To study the thermal effect on the energy dissipation of rocks during the dynamic cyclic loading, Shu et al. [19] carried out cyclic impact loading experiments on heat-treated specimens using SHPB experimental system. Their results showed that when the temperature increases, the reflected energy increases accordingly and finally exceeds the absorbed energy at 200 °C.
According to the literature review, previous studies primarily focused on the effect of high temperature on the energy dissipation of rock under either static or dynamic loading. However, deep rock mass subjected to high static stress is also inevitably affected by the dynamic disturbance caused by mechanical excavation and blasting impact, which is a typical coupled dynamic and static loading mode. Therefore, considering the actual states of the deep rock mass, it is important to investigate the effect of TS on the energy dissipation characteristics of rocks under coupled dynamic and static loads, which were rarely reported. In this study, TS treatments are applied to heated sandstone specimens, where three cooling methods (stove cooling, air cooling, and freezer cooling) are adopted to provide different cooling rates. An improved SHPB system is adopted to conduct the coupled dynamic and static loading experiments on sandstone specimens after different TS treatments. The research results are fundamental for the safety and efficiency of the exploitation of deep resources and are instructive for the damage analysis of rock engineering works involving high temperatures.

2. Materials and Methodology

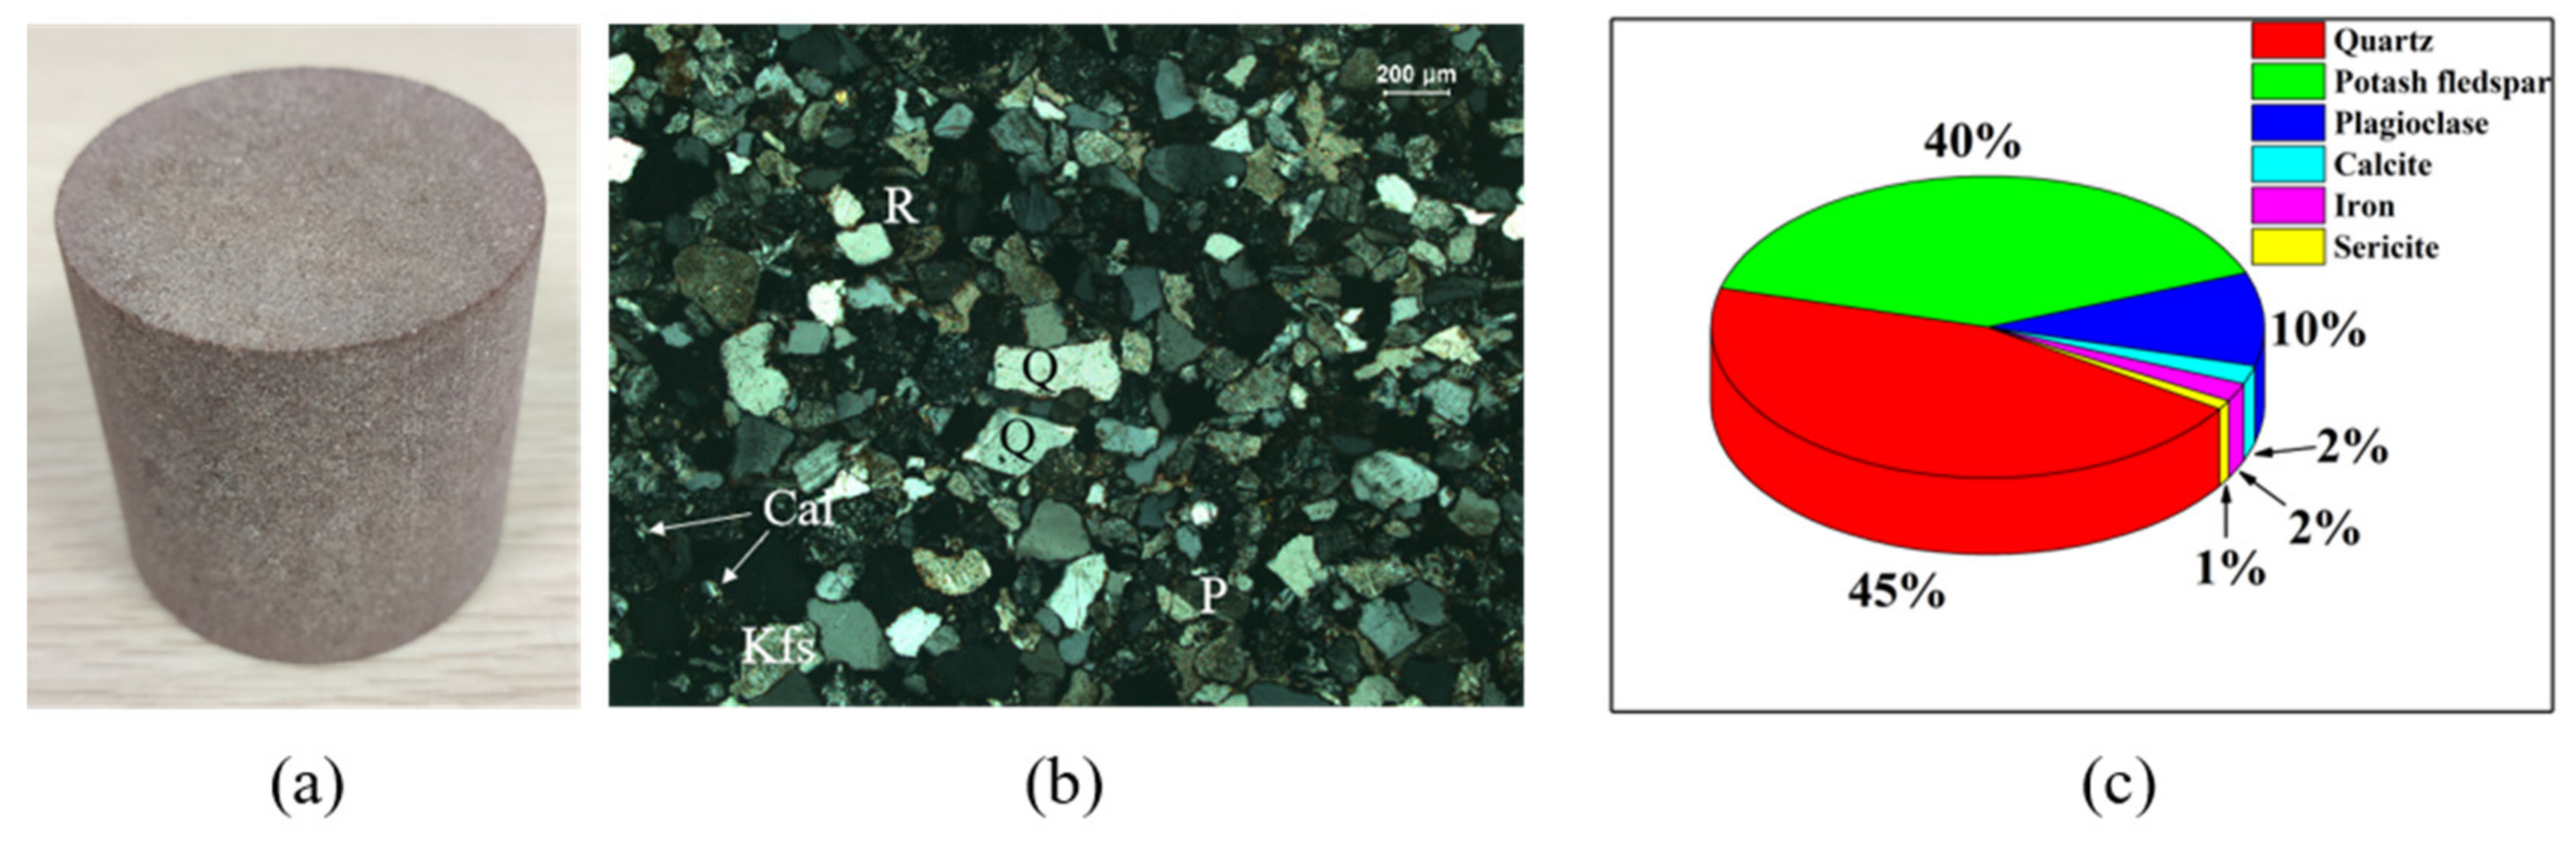
2.1. Specimen Preparation

The sandstone used in the experiments is quarried from Shandong Province, China. The specimens are cored from the same integral and uniform rock block. The grain size of the sandstone is approximately 0.2–2 mm. All sandstone specimens are manufactured in accordance with the standards of the International Society for Rock Mechanics (ISRM) [20]: the diameter of the specimens is 50 mm with the height-to-diameter ratio of 1:1 (Figure 1a), and the non-parallelism and non-perpendicularity are both less than 0.02 mm after carefully polishing and cutting on each end and side. Specimens with similar P-wave velocity values are selected for the experiments to ensure the uniformity of the specimens’ physical properties. According to the thin-section analysis, the sandstone is composed of quartz (45%), potash feldspar (40%), plagioclase (10%), calcite (2%), iron (2%), and sericite (1%) as shown in Figure 1b,c.

2.2. Thermal Shock Treatment

The thermal treatment process of sandstone specimens is divided into three stages: heating stage, heat preservation stage, and cooling stage. In the heating stage, the sandstone specimens are heated slowly up to 250 °C, 450 °C, 650 °C, and 850 °C in a box-type electrical stove, with the heating rate of 5 °C/min. Another group of unheated sandstone specimens (ambient temperature) are also prepared as the control group. In the heat preservation stage, once the designated temperature level is reached, the high temperature is kept constant inside the stove for two hours to make the temperature field uniformly distributed inside the specimen. In the cooling stage, three different methods are adopted to provide different cooling rates: slow cooling inside the unplugged stove to avoid TS (stove cooling); fast cooling in the open air at ambient temperature (air cooling), and fast cooling inside the freezer at −60 °C (freezer cooling). For each target temperature level and cooling method, four sandstone specimens are used in the test. In the heating stage and heat preservation stage, the temperature is read from the monitor of the stove, and in the fast cooling stage, the temperature of the specimen is recorded by a thermocouple thermometer (HT-9815, Dongguan Xintai Instrument, Dongguan, China). According to the recorded data, the temperature profile of the thermal treatments is obtained as shown in Figure 2.
Based on the temperature profile, the average cooling rate for each cooling method can be calculated by a weighted average method (Figure 3):
V ¯ T = k = 1 n K k t K dT t dt = 0 t 0 T t T t dt 0 t 0 T t dt
where V ¯ T represents the average cooling rate; T(t) is the temperature as a function of time; T denotes the derivative of T(t), and t0 denotes the time required for the specimen to cool to ambient temperature.
According to the weighted average, the air-cooling rates corresponding to the four target temperature levels (250 °C, 450 °C, 650 °C, and 850 °C) are 8.96 °C/min, 17.62 °C/min, 26.84 °C/min, and 41.37 °C/min, and the freezer-cooling rates are 13.73 °C/min, 26.61 °C/min, 30.61 °C/min and 45.72 °C/min, respectively. The average stove-cooling rate is 0.48 °C/min. It is widely accepted that the effect of TS cannot be ignored if the temperature changing rate is greater than 2 °C/min [10]. Therefore, the air-cooling and freezer-cooling conditions can well be categorized into TS conditions. The stove-cooled specimens have avoided the TS effect and are used as a reference, similar to our previous researches [4,11,21].

2.3. Coupled Dynamic and Static Loading Process

The SHPB system [22] is adopted to carry out the coupled dynamic and static loading experiments on the thermal-treated sandstone specimens. The components of the testing system are depicted in Figure 4, and the main parameters of the bar are shown in Table 1. As can be seen in Figure 4, the sandstone specimen is fixed between the incident bar and transmitted bar. Before dynamic loading, the static load (15 MPa) is applied to the specimen through the axial static pressure component at the end of the transmitted bar. The dynamic load is applied by the striker impacting the incident bar, where the striker is driven by the high-pressure air released from the gas tank. The same air pressure (0.55 MPa) is used for every strike to ensure the same incident energy in each test. When the incident bar is struck, an incident wave is formed and advances in the incident bar. Due to the difference between the sandstone specimen and the mechanical impedance of the elastic bar, part of the incident wave is reflected at the interface between the specimen and the bar to form a reflected wave back into the incident bar. The remainder of the energy is transmitted through the sandstone specimen to form a transmitted wave in the transmitted bar. The incident wave, reflected wave, and transmitted wave are captured by the strain gauges fixed on the incident bar and transmitted bar.
The stress and strain of the sandstone specimen can be obtained by monitoring the strain in the incident bar and transmitted bar, and then these strain data are transferred into the computer through the oscilloscope. According to one-dimensional stress wave theory, values of stress σ(t), strain ε(t), and strain rate ε ˙ (t) of the specimen can be calculated using the following formulae:
σ t = A e 2 A s σ I t σ R t + σ T t
ε t = 1 ρ e C e L s 0 t [ σ I t + σ R t σ T t ] dt
ε ˙ t = 1 ρ e C e L s σ I t + σ R t σ T t
where σ I t , σ R t , and σ T t represent the incident stress, reflected stress, and transmitted stress, respectively; As and Ae represent the cross-sectional areas of the specimen and the bar, respectively; Ls, t, and ρeCe represent the length of the specimen, the duration, and the bar’s wave impedance, respectively. Figure 5 shows an example of the stress balance diagram of one typical test. The transmitted wave (blue curve) is basically coincident with the superimposed wave (green curve) of the incident wave and the reflected wave, which indicates that the specimen reaches the stress equilibrium condition during the loading process [11].

3. Experimental Results

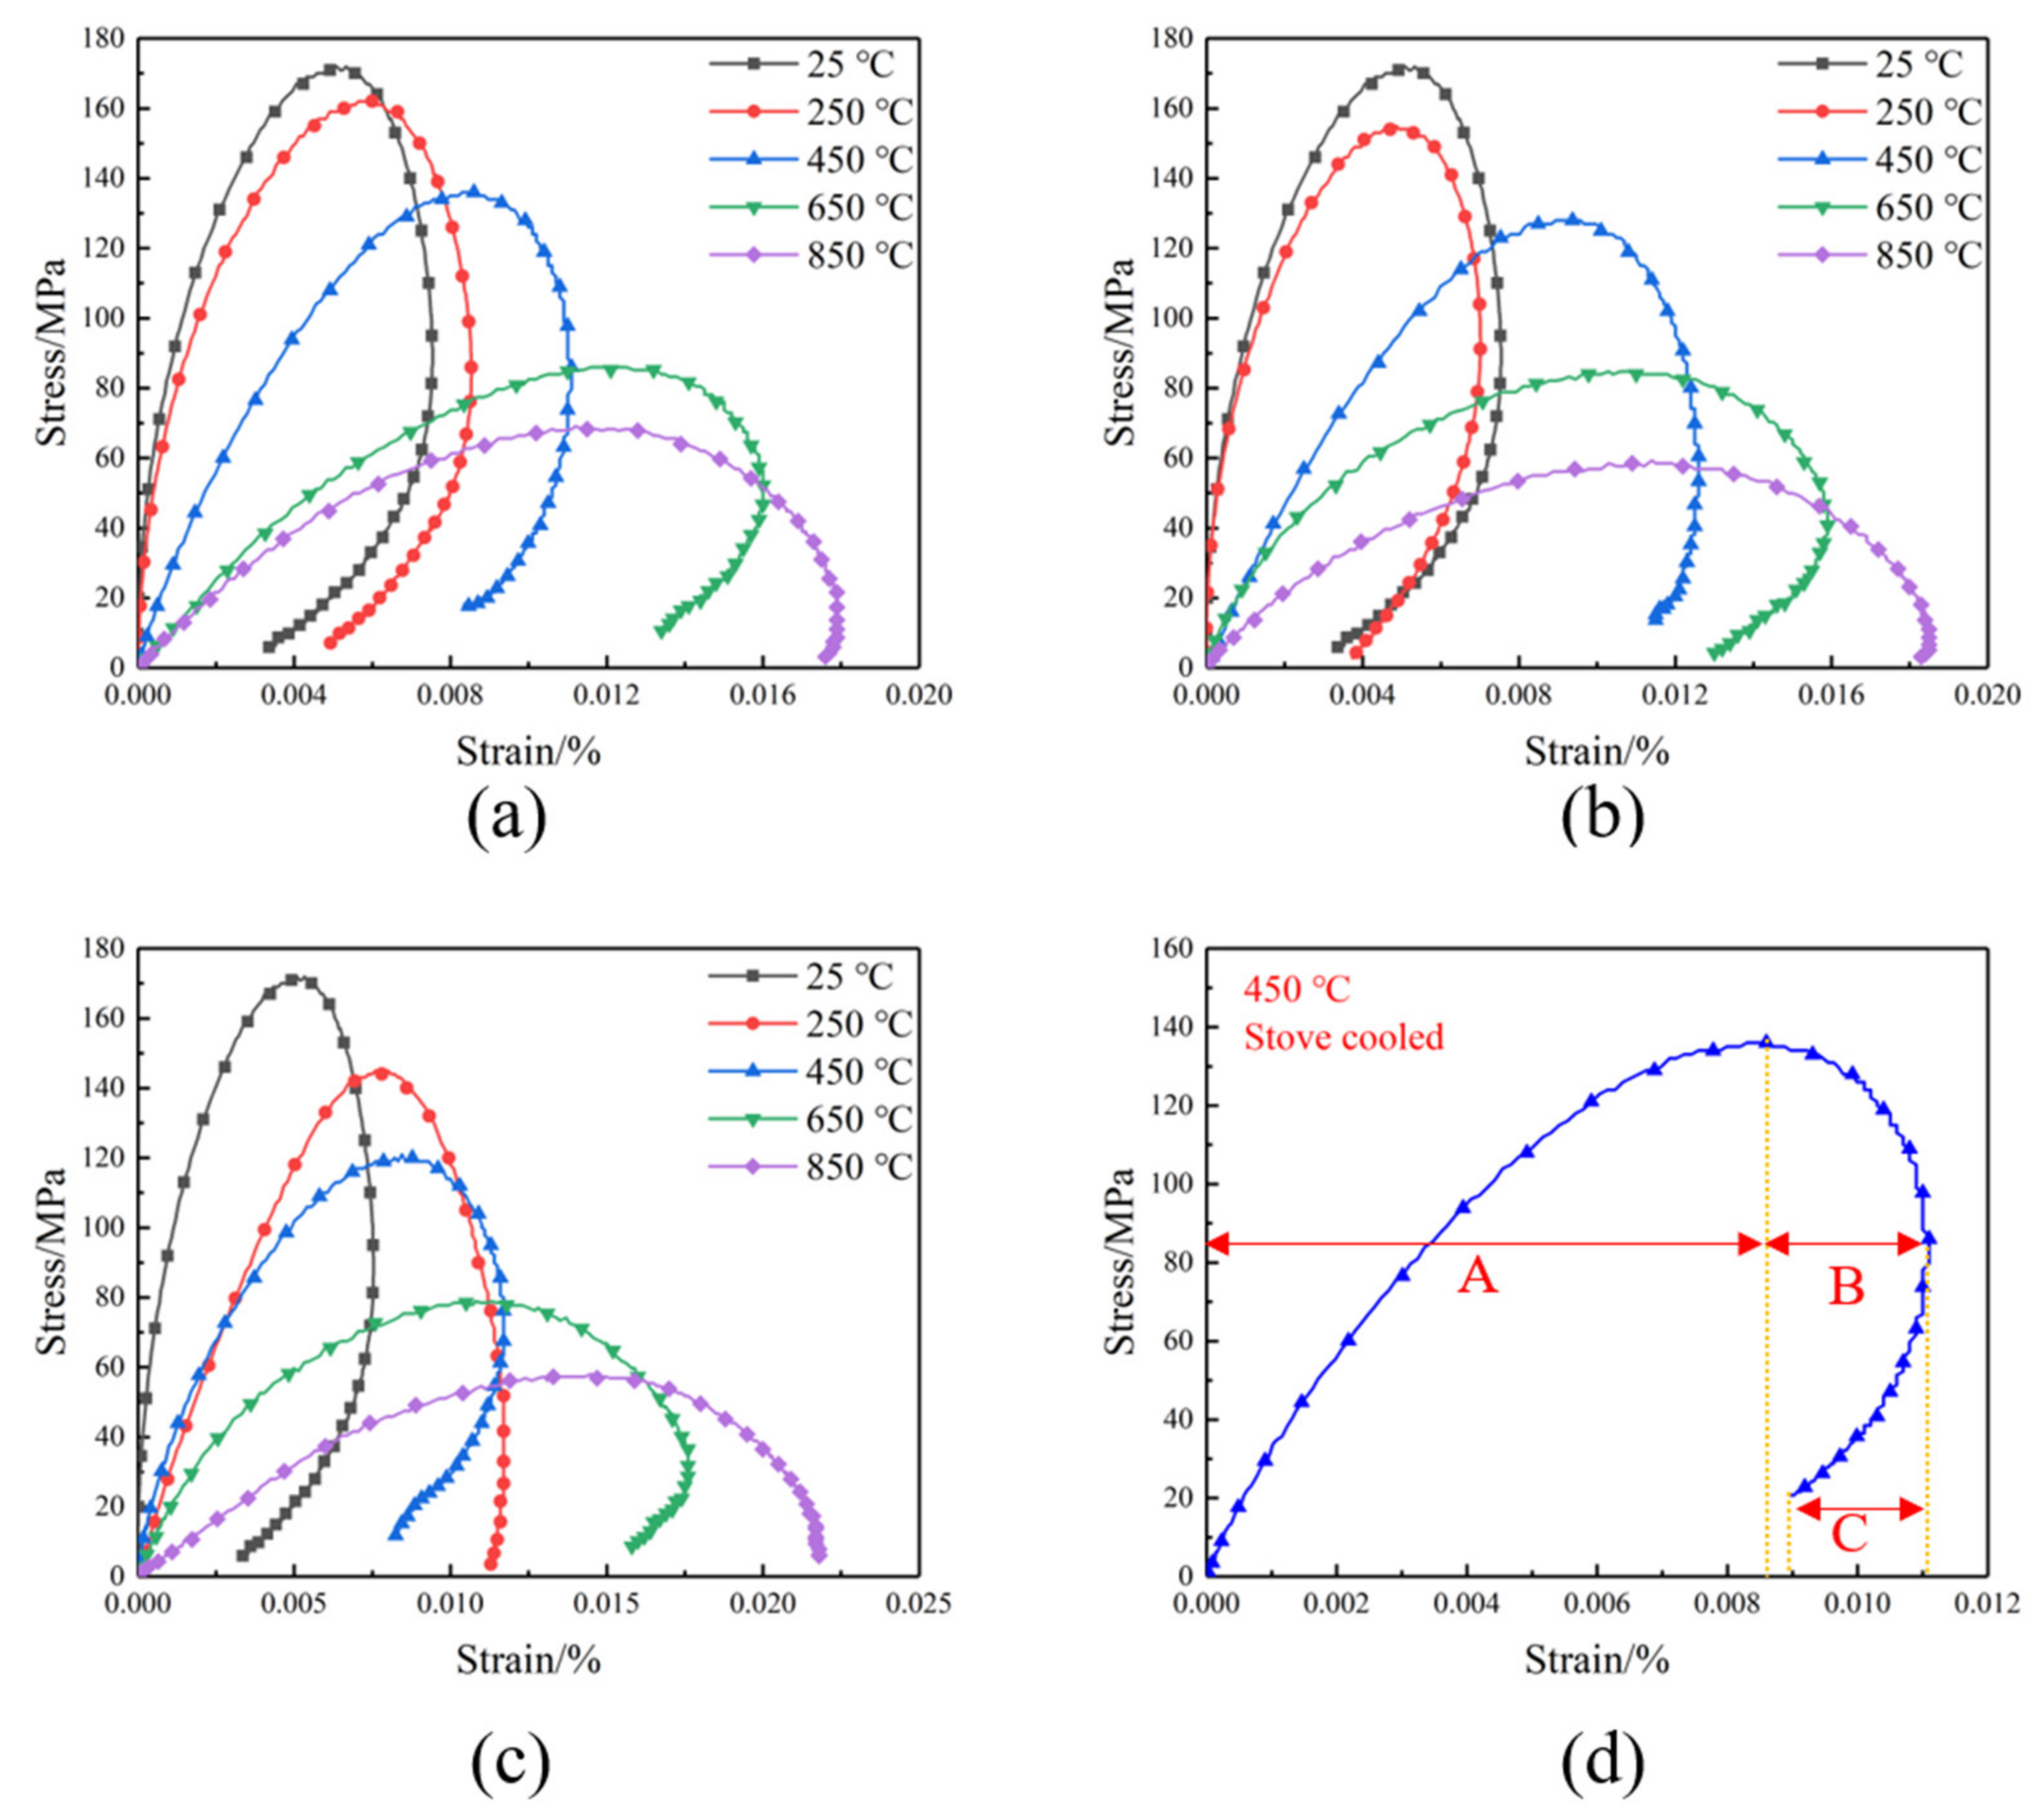
3.1. Dynamic Mechanical Response of the Specimens
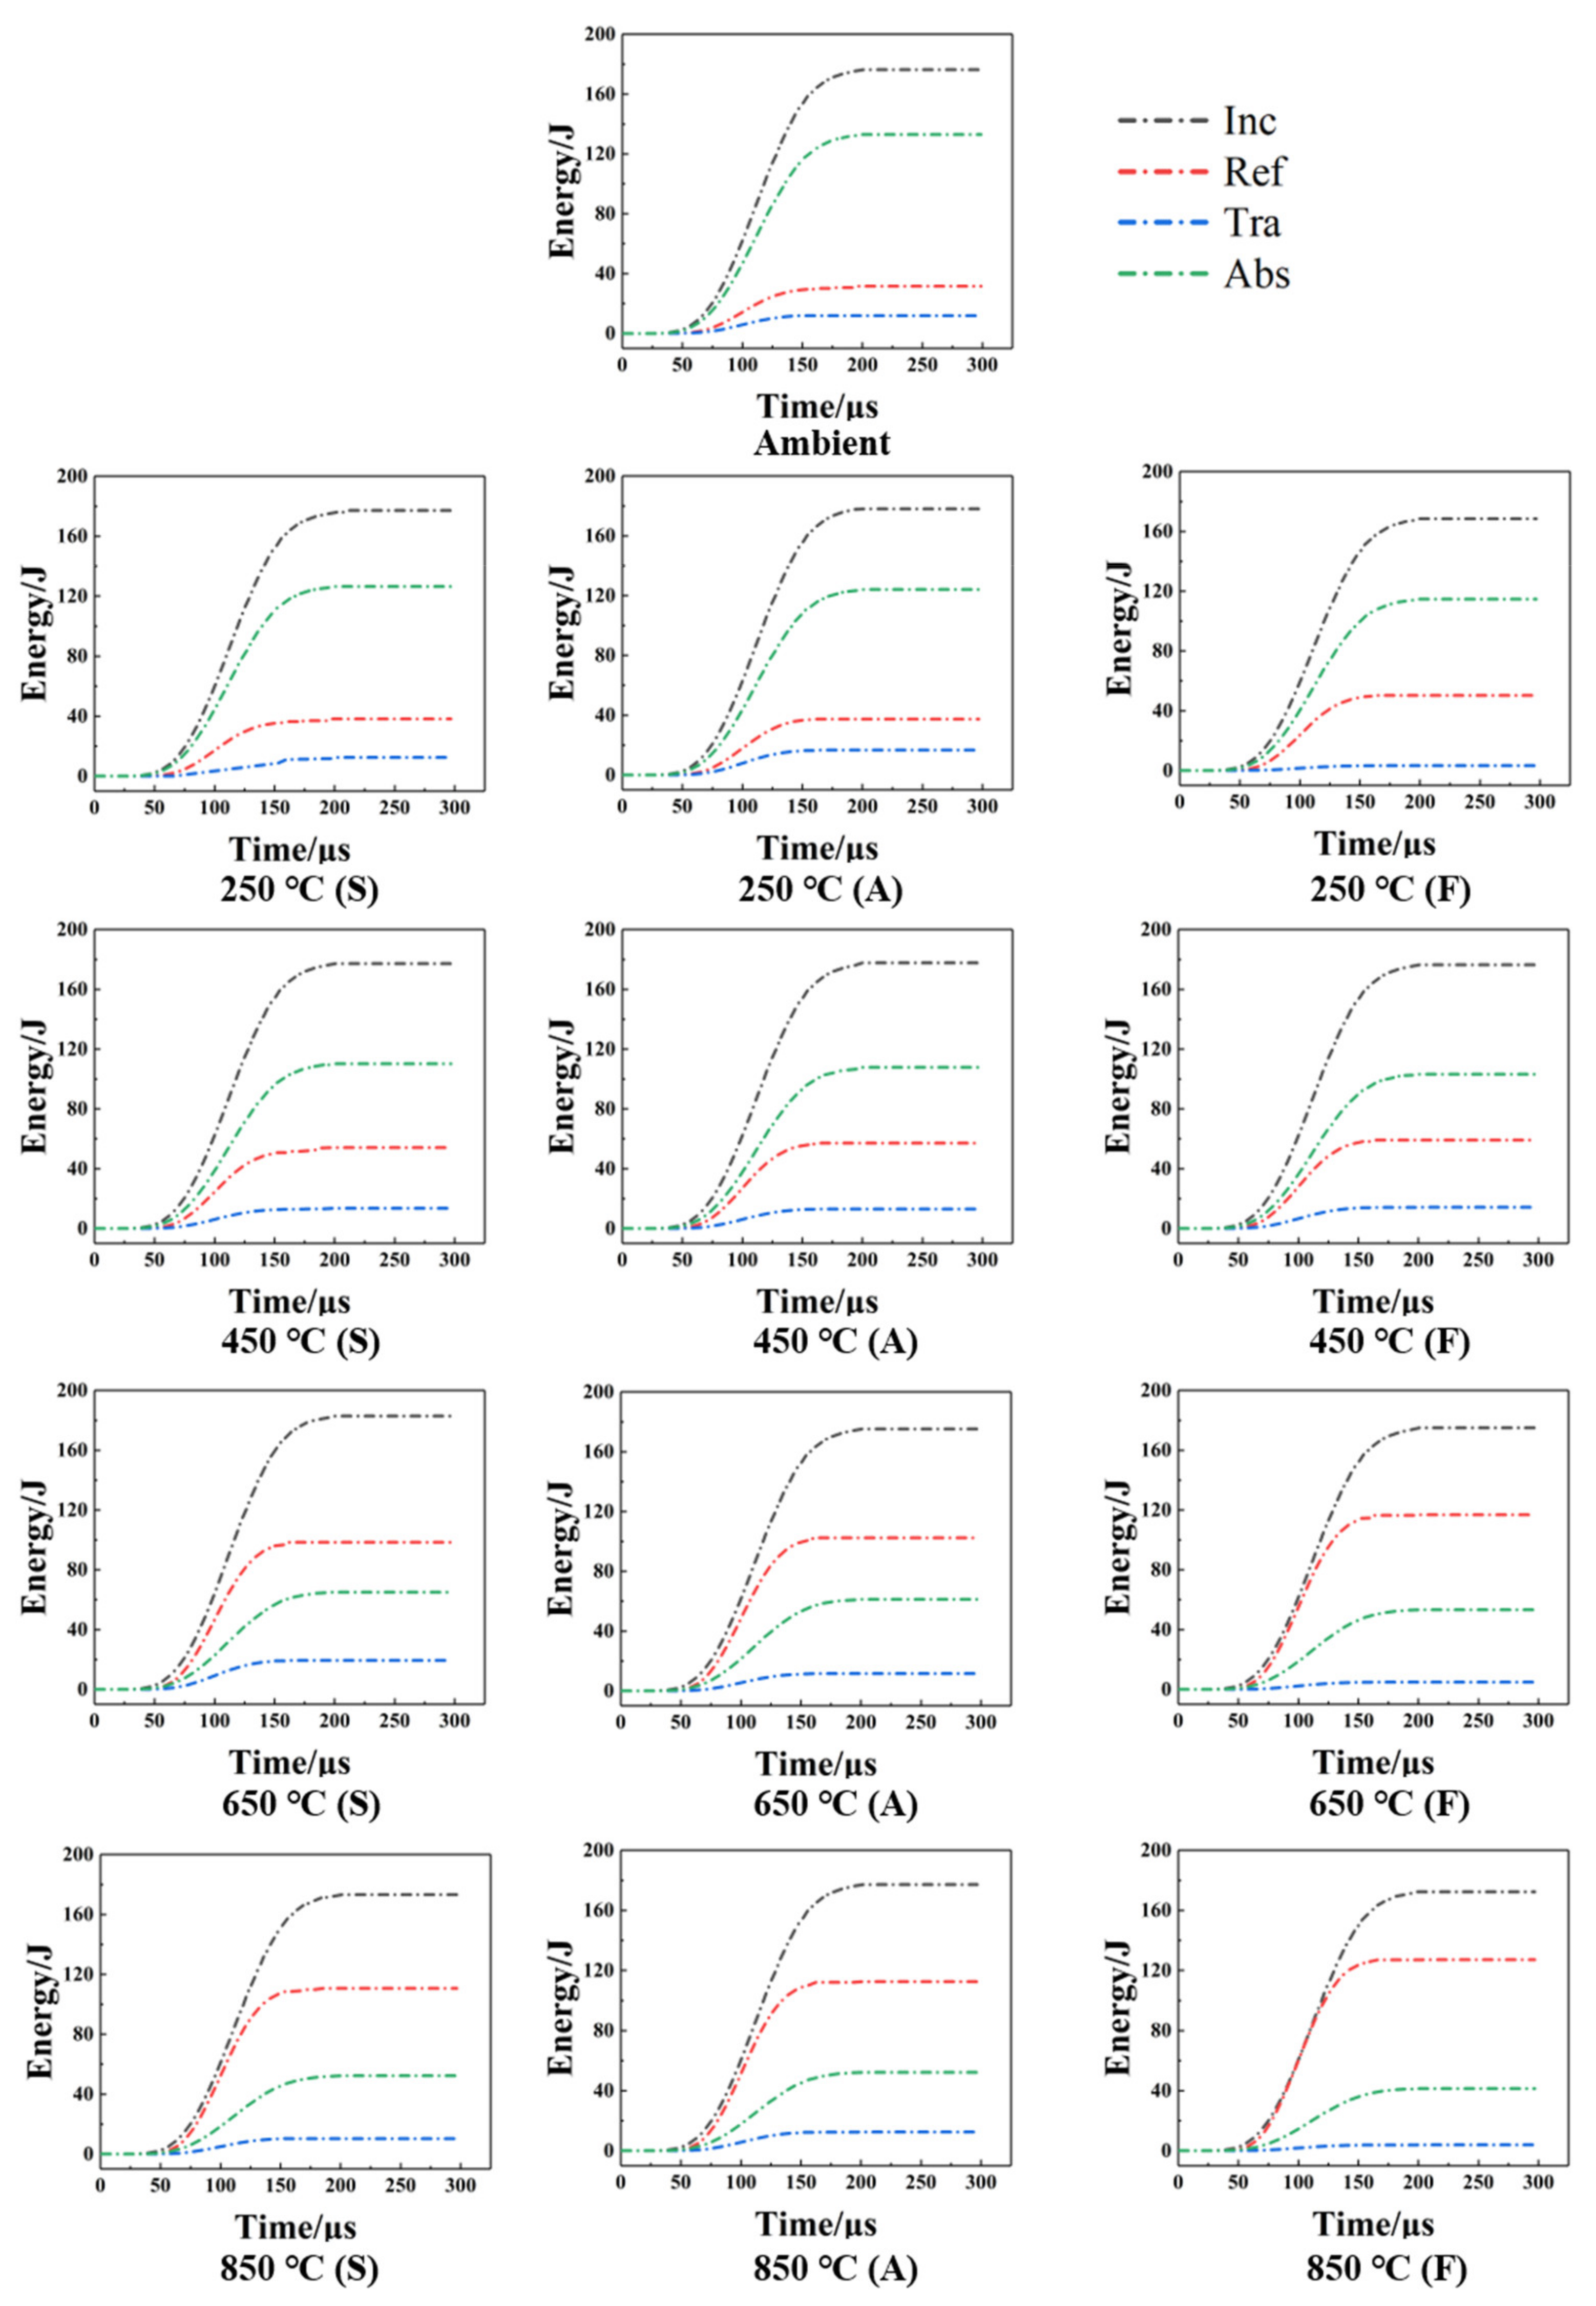
The typical dynamic stress-strain curves of heated sandstone specimens are obtained from the test (Figure 6). The test data indicate that with the elevation of the heating level, both the tangent modulus of the curves and the peak stress of the sandstone specimen gradually decrease. As can be seen from Figure 6a, the specimens treated with higher heating levels have a lower tangent modulus. It is worth noting that a springback phenomenon [23] can be observed in the post-peak stage of most curves. The post-peak stage of the stress-strain curve with the springback phenomenon can be divided into two regions (Figure 6d). In region B, with the decreasing stress, the strain continues to increase, indicating that the specimen is absorbing external energy. However, in region C, the strain becomes smaller as the stress decreases. This phenomenon indicates the fact that in this stage, the strain energy stored in the specimen is released for further failure, rather than absorbing the external energy.
As seen in Figure 7, the dynamic strength of the specimen presents a descending trend with the increasing heating level. Compared with the specimen treated at ambient temperature, when the temperature of TS treatment is less than 450 °C, the maximum reduction of dynamic strength of air-cooled specimen and freezer-cooled specimen are 25.58% and 29.65%, respectively. However, there is a sharp drop in strength (51.16% by air cooling and 54.13% by freezer cooling) at the heating level of 650 °C. When the heating level reaches 850 °C, the dynamic strength decreases by 65.52% for air-cooled specimens and 66.69% for freezer-cooled specimens. According to the experimental data, the dynamic strength of the air-cooled specimen is higher than that of the freezer-cooled specimen at the same heating level, which indicates that higher cooling rates can cause more damage to the specimen, resulting in an additional reduction of the dynamic strength.

3.2. Energy Curves

Based on the one-dimensional stress wave theory, the incident energy EI, reflected energy ER, and transmitted energy ET of the sandstone specimens can be calculated from the obtained stresses ( σ I t , σ R t , and σ T t by the following equations:
E I = A e ρ e C e 0 τ σ I 2 t d t
E R = A e ρ e C e 0 τ σ R 2 t d t
E T = A e ρ e C e 0 τ σ T 2 t d t
where τ denotes the duration of the stress wave. According to the law of conservation of energy, the total input energy EO is equal to the incident energy and is transformed into the following parts of energy:
EO = EI = ER + ET + EA + EC + EM
where EA, EC, and EM respectively denote the absorbed energy, the kinetic energy of the specimen, and the other dissipated energy, such as the energy loss between the specimen and the contact surface of the bar. Considering that EC and EM account for only less than 5% of the total input energy [24], Equation (8) can therefore be simplified to:
EO = EI = ER + ET + EA
Thus, the absorbed energy of the specimen can be calculated by the following equation:
EA = EI − (ER + ET)
According to the above equations, the variation of energy with loading time can be drawn based on the test results (Figure 8). For the convenience of comparison, care has been taken that approximately constant incident energy (average value of 175.97 J) is used in the test. Therefore, the incident energy curve is almost in the same position in Figure 8. It is also noticed that the transmitted energy curve is always kept at a constant low level in each case. Therefore, the influence of thermal treatments is mainly reflected by the variation of the absorbed energy curve and the reflected energy curve. The incident energy is provided by the impact bar driven by the high-pressure air released from the gas tank, and part of the incident energy is reflected back from the interface during the transmission process, which is the reflected energy. The remaining incident energy propagates through the specimen, and the energy absorbed by the specimen is called the absorbed energy, which is used to break the specimen. The energy that passes through the transmitted bar and is absorbed by the absorbing bar is called transmitted energy. Figure 8 indicates that as the heating level ascends, the absorbed energy of the sandstone specimen gradually reduces, while the peak value of the reflected energy gradually increases. At an ambient temperature of 25 °C and comparative low heating levels such as 250 °C and 450 °C, the absorbed energy of the specimen is higher than its the reflected energy curve, while at comparative high heating levels such as 650 °C and 850 °C, the absorbed energy becomes lower than the reflected energy curve. It is worth noting that as the heating temperature elevates from 450 °C to 650 °C, the absorbed energy of the specimen has a significant decrease, while the reflected energy has a significant increase.

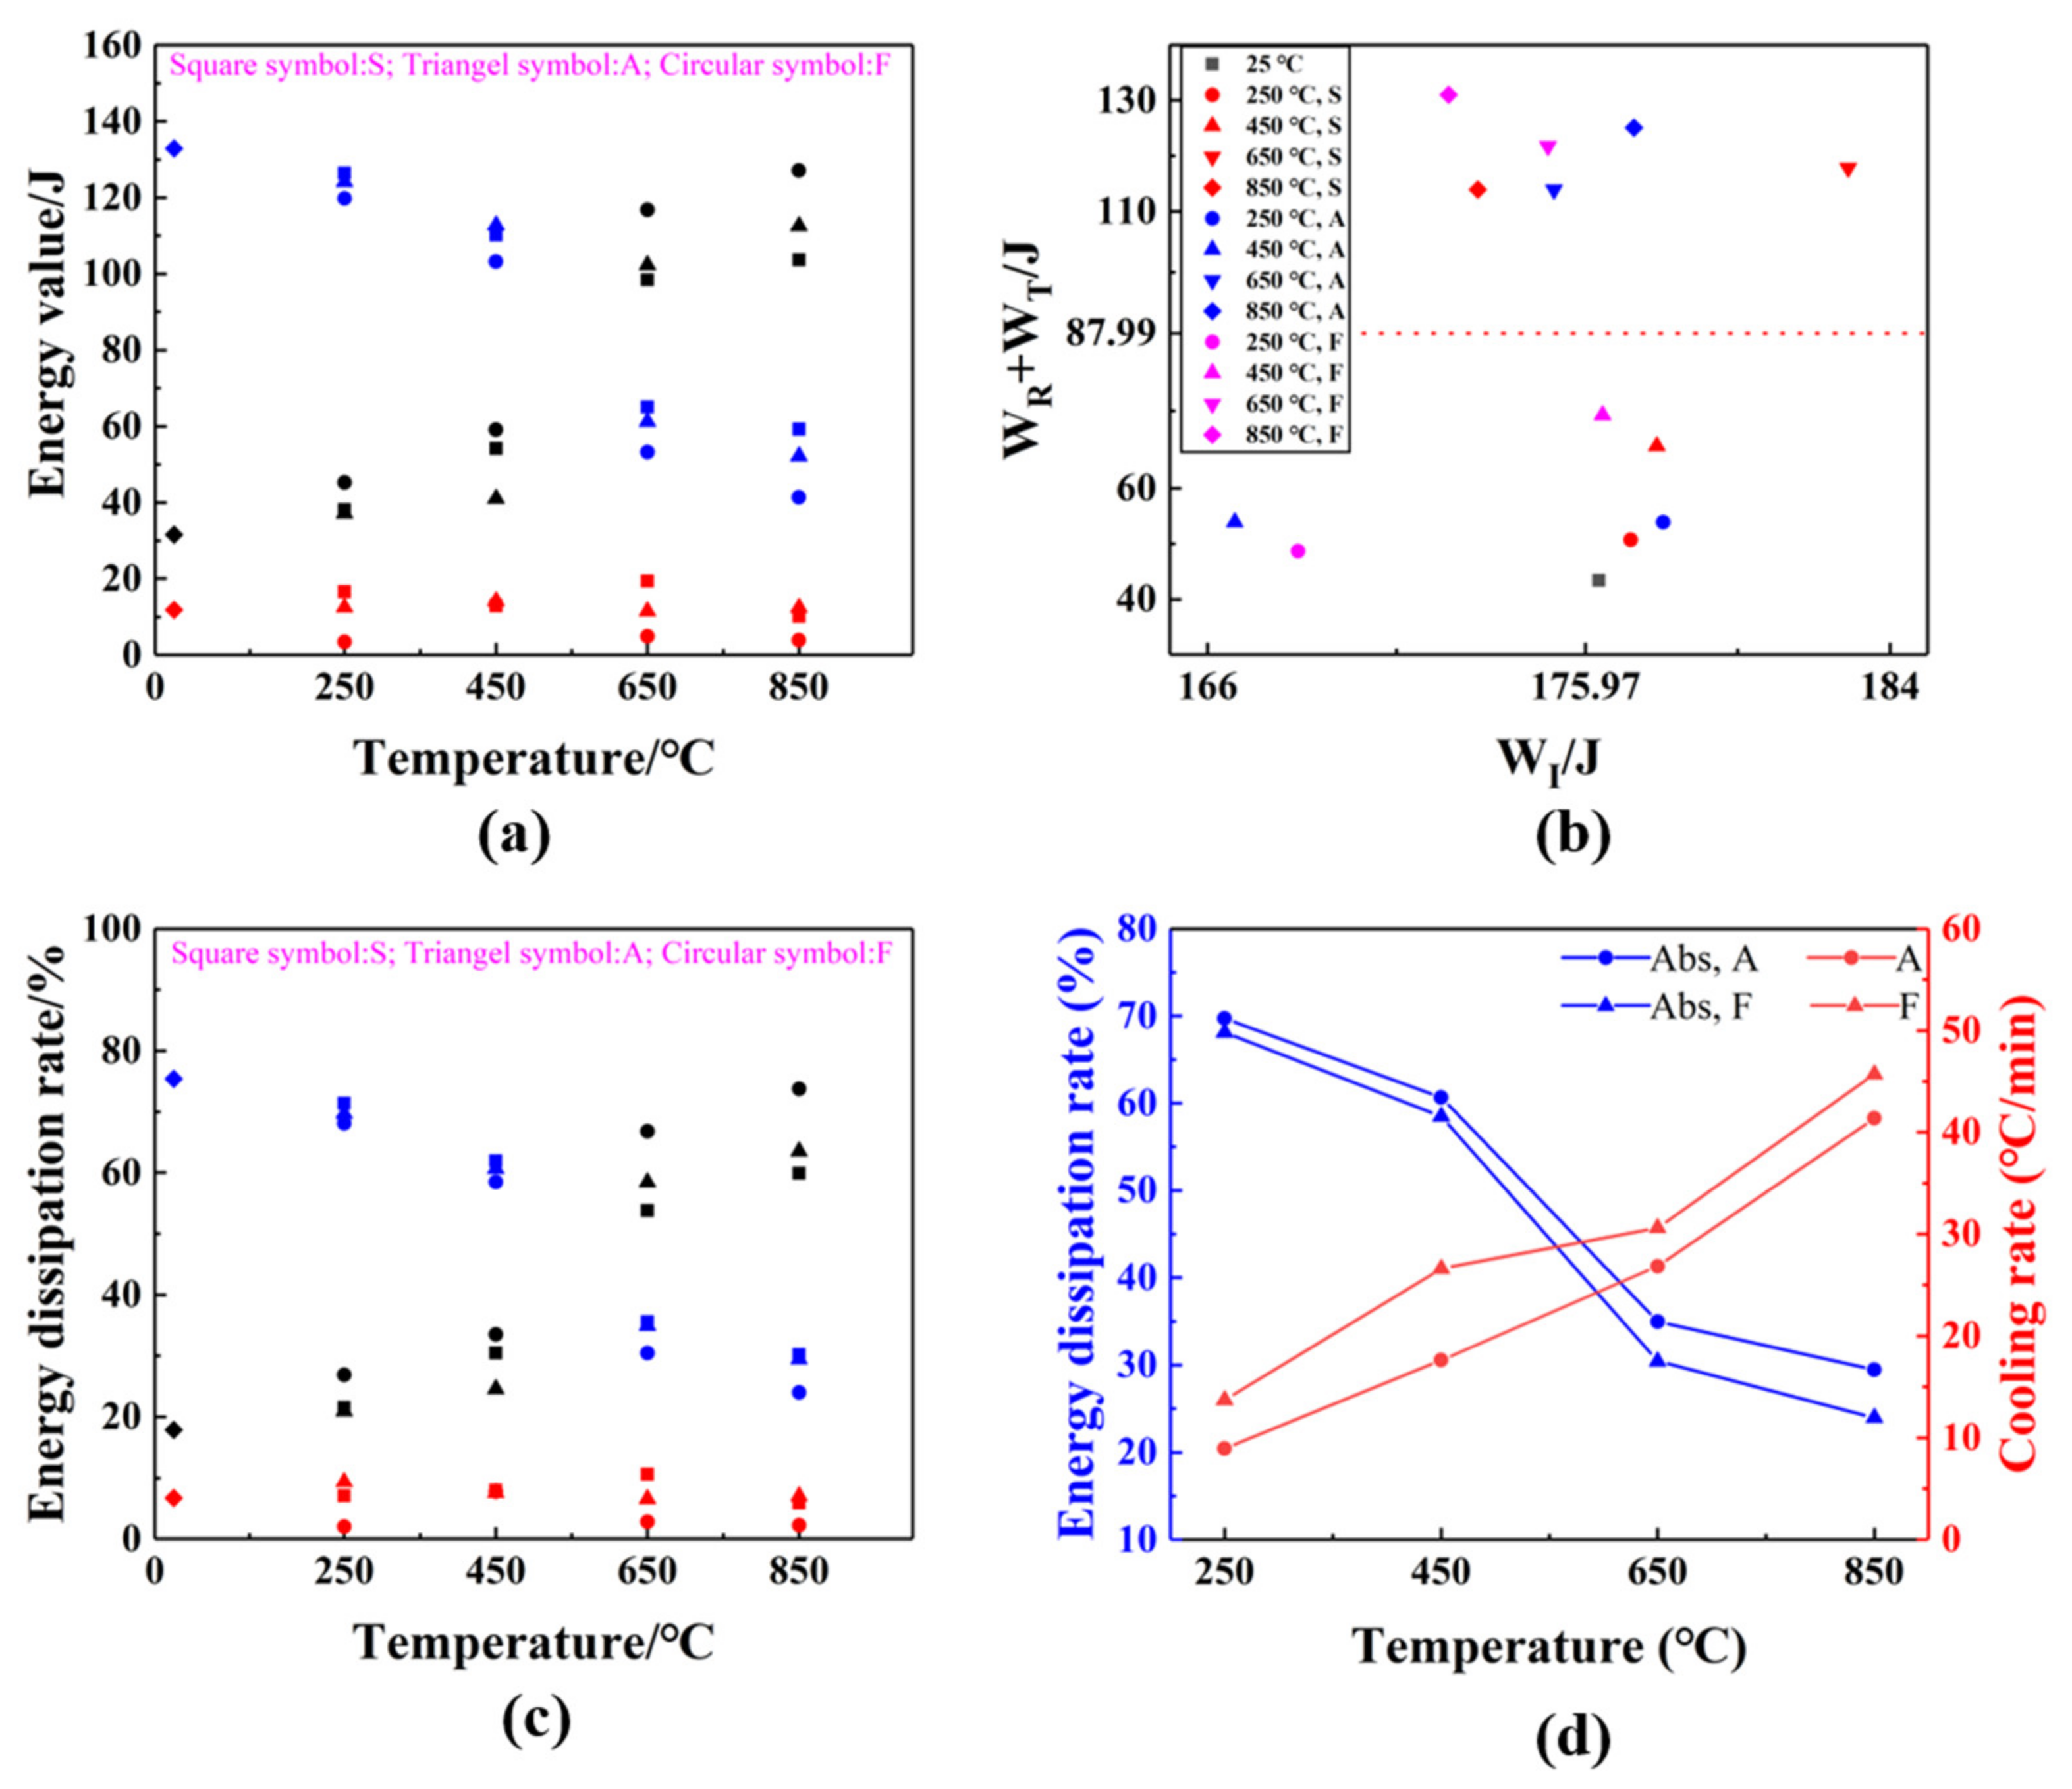
3.3. Energy Dissipation Analysis

The peak values of different types of energy are obtained in reflection of the energy dissipation during the test (Table 2 and Figure 9a). Accordingly, the absorbed energy of the specimen shows a downward trend with the increase of heating level, while the reflected energy of the specimen shows an upward trend. This means less absorbed energy is required for breaking the specimen as the heating level elevates. It is worth noting that there is a sharp drop in the absorbed energy of the specimen between the heating levels of 450 °C and 650 °C. Such a trend is in accordance with the sharp drop of the dynamic strength (Figure 7) and absorbed energy (Figure 8) of the specimen from 450 °C to 650 °C. The main reason for this phenomenon may be that the crystal structure of quartz goes through an α–β transition at the temperature of 573 °C [25,26], which encourages the development of pores between the mineral particles and thus induces a decrease in the strength of the specimen. This is consistent with the fact that the unused energy (the reflected energy and transmitted energy) for the heating level of 650 °C and above is greater than half of the incident energy (Figure 9b). This means the extent of the thermal damage is already prominent at these higher heating levels, that the majority of the incident energy is transferred to the reflected energy and transmitted energy which do not contribute to the breaking of the specimen during the dynamic loading process. The influence of the cooling rate on the variation of energy is also reflected in the data: higher cooling rate results in lower absorbed energy and higher reflected energy. This means less absorbed energy is required for breaking the specimen as the cooling rate increases. Particularly, at the heating level of 450 °C, the absorbed energy drops from 110.20 J for the stove-cooled specimen, to 107.80 J for the air-cooled specimen and 103.17 J for the freezer-cooled specimen, while the reflected energy rises from 54.17 J to 57.01 J and 59.11 J, respectively (Table 2).
As the incident energy cannot be kept exactly the same for each test, the rates of energy dispassion are calculated for the convenience of describing the extent of energy dissipation:
η R = E R E I × 100 %
η T = E T E I × 100 %
η A = E A E I × 100 %
where η R , η T , and η A are the rates of reflected, transmitted, and absorbed energy, respectively. Figure 9 shows the variation of the above three energy dissipation rates with the increase of heating levels. Similar to Figure 9a, the energy absorption rate decreases while the energy reflection rate increases with the elevation of the heating level. As shown in Figure 9d, at any heating level, the energy absorption rate of the freezer-cooled specimen is lower than the air-cooled specimen. The observations of this section lead to the assumption that higher heating levels and faster cooling rates can cause aggravated damage inside the specimen, which further explains why in these cases less energy is needed from the incident energy to break the specimen in the dynamic loading process.

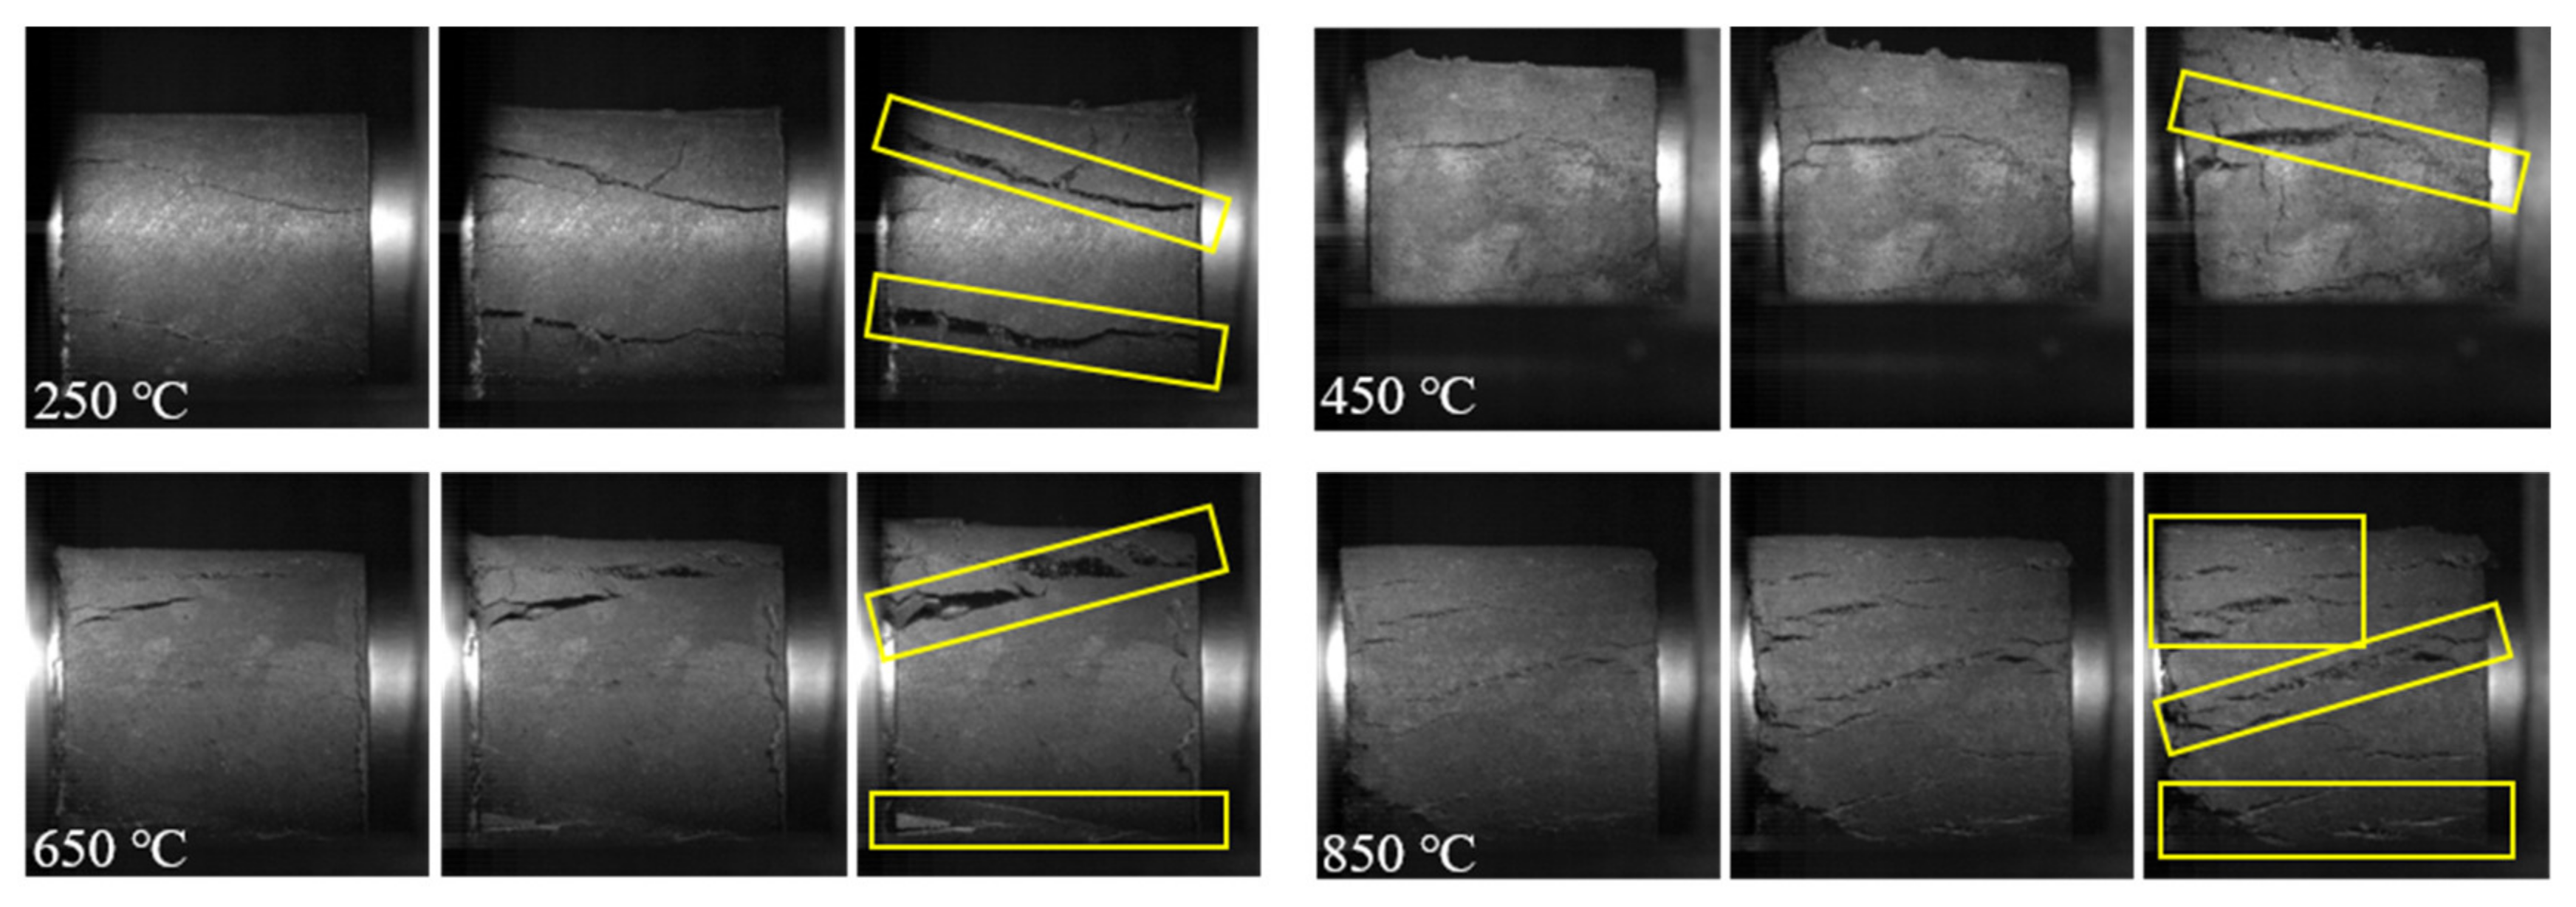
3.4. Fracture Patterns of the Sandstone Specimens

The failure process of the specimens during dynamic loading is captured by a high-speed camera (FASTCAM SA 1.1, Photron USA Inc, San Diego, CA, USA) to illustrate the influence of thermal treatment on rock fractures [27]. The photographs depicting the fracture evolution of stove-cooled specimens, air-cooled specimens, and freezer-cooled specimens are shown in Figure 10, Figure 11, Figure 12, respectively. A general pattern can be deduced that the quantity of fractures increases with the elevation of the heating level. Taking the stove-cooled specimens for example (Figure 10): after heating at 250 °C a singular fracture has been formed propagating along the loading direction and finally penetrates the specimen, which indicates a failure mode of axial splitting; at 450 °C, fractures have been formed deviating from the original fracture at the latter stages of the loading, and at the final stage, at least two long fractures have penetrated the specimen; at 650 °C, more scattered fractures have already been formed at the beginning of the loading, and propagate simultaneously as the loading continues; at 850 °C, many small fractures extending away from the loading direction can be observed and this fracture pattern can shatter the specimen into smaller pieces. The above fracturing pattern also applies to the air-cooled specimens and freezer-cooled specimens as shown in Figure 11 and Figure 12, and with a greater degree. For instance, at 850 °C for the freezer-cooled specimen (Figure 12), the fractures extending perpendicular to the loading direction and the fractures along the loading direction are well developed and interconnected in various locations where no clear main failure path can be formed.

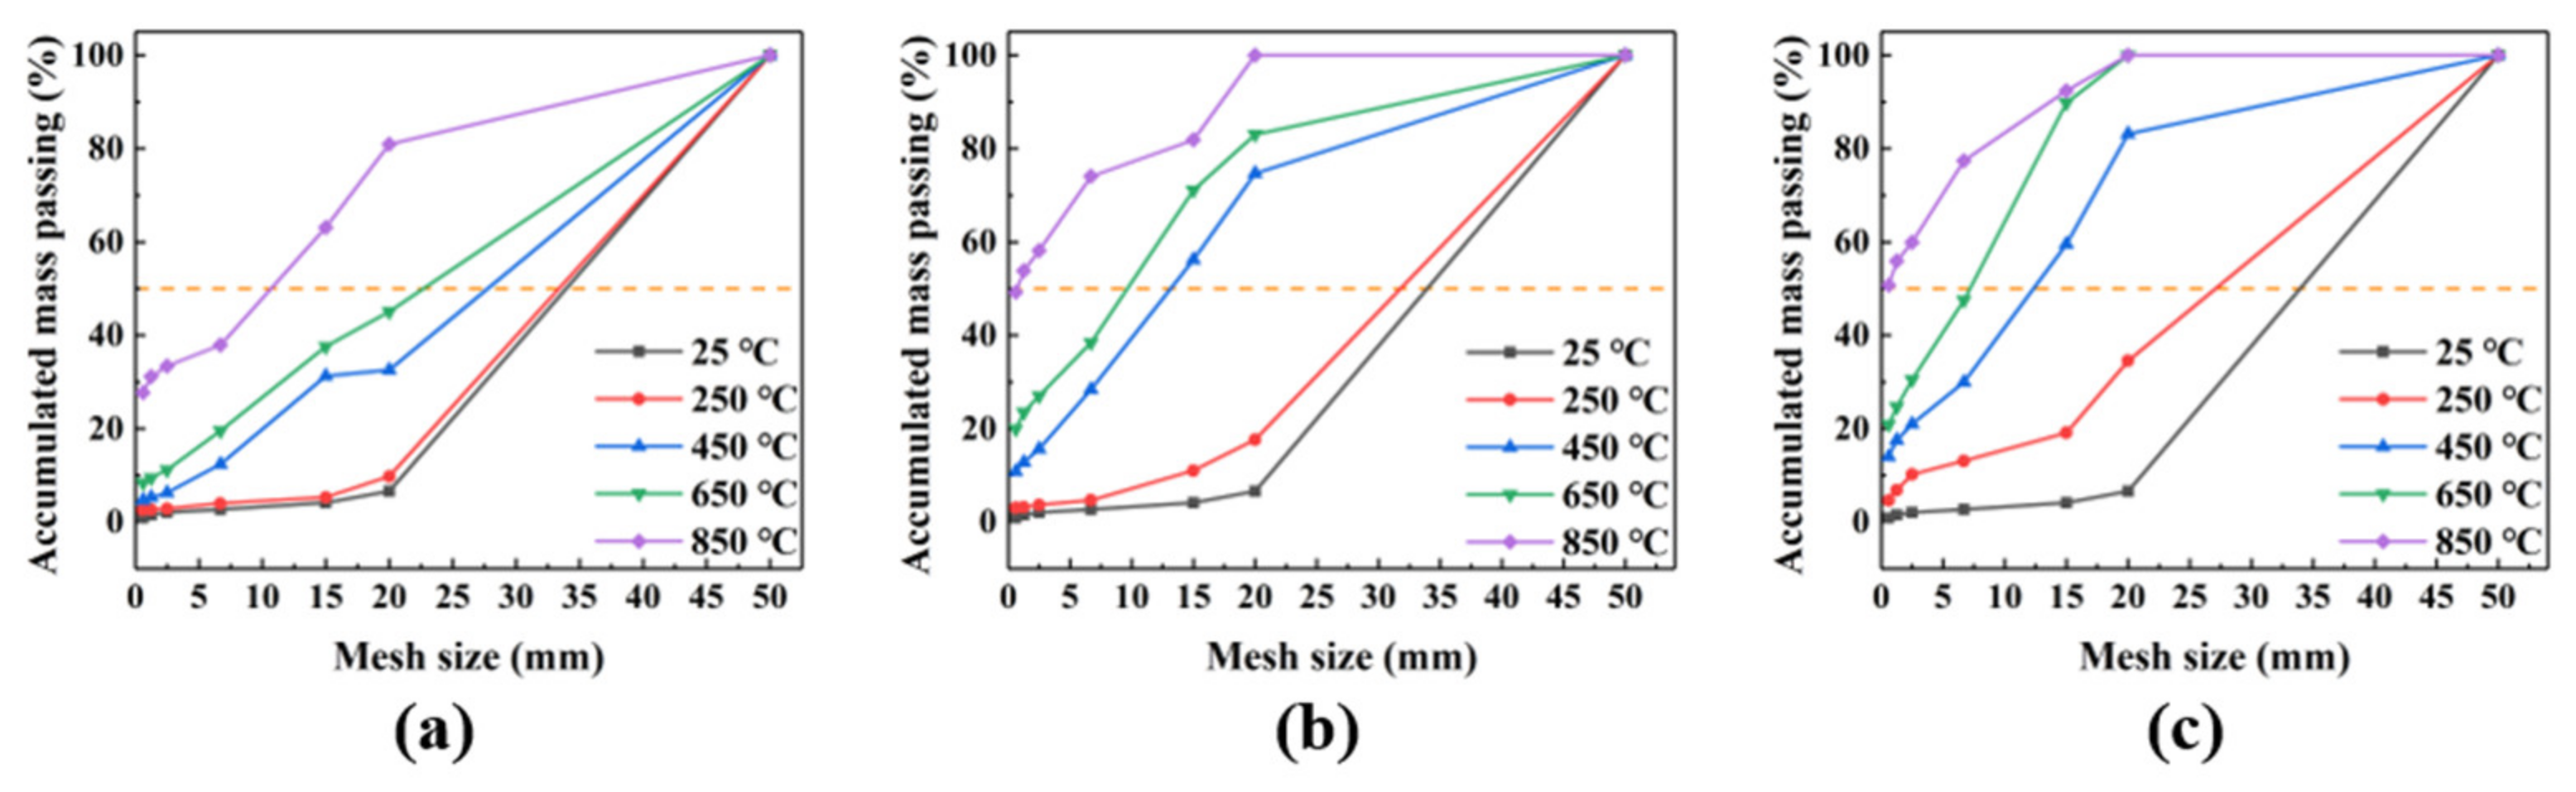
3.5. Debris Size Analysis

The influence of different thermal treatments on the debris size is analyzed in this section. Six mesh sizes (0.6 mm, 1.25 mm, 2.5 mm, 6.7 mm, 15 mm, 20 mm, and 50 mm) are selected to screen the damaged debris of each specimen after the loading test. The debris is laid out according to the sizes as shown in Figure 13. As can be seen in the figure, at ambient temperature, the specimen is breached into four large pieces with only a negligible amount of small pieces and powdery debris. As the heating level elevates, the specimen starts to break into more pieces with smaller sizes and an increasing amount of powdery debris. To quantitatively characterize the variation of the debris sizes, the debris passing each size of the mesh are weighed and plotted in Figure 14. According to the data, for the specimen at ambient temperature, the mass of the debris smaller than the dimension of 20 mm only accounts for less than 10% of the whole mass, which indicates that the debris are mainly larger pieces (also refer to Figure 13). Similarly, for the stove-cooled specimen heated at 250 °C, the mass distribution of the debris smaller than the dimension of 20 mm is also less than 10%. However, for the air-cooled specimen and freezer-cooled specimen (250 °C), this value increases to 17.65% and 34.54%, respectively. Such a trend of increase in the amount of smaller pieces as cooling rate rises also applies to higher heating levels from 450 °C to 850 °C (Figure 14b,c), which implies that under a higher cooling rate, the specimen is more prone to be breached into smaller pieces. The influence of the heating level on the debris size distribution can also be deduced from Figure 14. Take the air-cooling case for example (Figure 14b), the accumulated mass of the debris small than the dimension of 20 mm accounts for 17.65% of the whole mass, while at the heating level of 450 °C and 650 °C, it rises to 74.67% and 83.01%, respectively. Particularly, when the heating level reaches 850 °C, the mass proportion of debris size smaller than 20 mm becomes 100%, which indicates that all specimen fragments are less than 20 mm. The same trend is also found for the stove-cooling case (Figure 14a) and the freezer-cooling case (Figure 14c). It is worth noting that at the highest cooling rate in this study (i.e., the freezer-cooling case in Figure 14c), the debris smaller than 20 mm already accounts for 100% of the whole mass even at 650 °C. Comparatively, the temperature needs to be elevated to as high as 850 °C when this condition is achieved if the specimen is cooled at a less fast rate (i.e., the air-cooling case in Figure 14b). This further indicates the capability of a higher cooling rate in weakening the internal structure of the specimen, and finally resulting in a more fragmented state of the debris.

4. Discussion

The development of the microcracks in rock can reflect the variation in the physical and mechanical properties of rock [28,29]. Therefore in this section, a scanning electron microscope (SEM) is adopted to observe the morphology of microcracks at the fracture surfaces of sandstone specimens after dynamic loading tests (Figure 15). It can be seen that similar to the unheated specimen (Figure 15a), the fracture surface is comparatively flat and smooth at lower heating levels such as 250 °C and 450 °C (Figure 15b–g). More microcracks can be observed as the heating level elevates (Figure 15h–m). To quantify the effect of TS on the microstructure of sandstone specimens, statistics of microcrack lengths of the specimens are obtained by measuring the microcrack size on the SEM images according to the magnification. And the length of microcracks of specimens after respective thermal treatments are illustrated in Figure 16. The result indicates an increasing trend of the length of microcracks of sandstone with the elevation of heating level: the length of microcracks is 1.57 μm for the unheated specimen, and increases to 3.51 μm, 12.71 μm, 26.71 μm, and 47.54 μm for the stove-cooled specimen after heating at 250 °C, 450 °C, 650 °C, and 850 °C, respectively (Figure 16a,b,e,h,k). This general trend is also applicable to the air-cooled specimens (Figure 16c,f,i,l) and freezer-cooled specimens (Figure 16d,g,j,m). It is worth noting that a higher cooling rate can cause larger microcrack lengths. For example, for the heating level of 450 °C, the length of the microcrack is 12.71 μm for the slowly-cooled specimen (stove cooling as in Figure 16e), and increases to 14.19 μm for the specimen fast cooled in the open air (Figure 16f). While for the freezer-cooled case where the cooling rate is even higher, the length of the microcrack becomes 16.50 μm (Figure 16g). This pattern also applies to all the heating levels (250 °C, 450 °C, 650 °C, and 850 °C). The above observations serve to explain the experimental data, that as the heating level elevates or cooling rate accelerates, the microcracks in the sandstone specimen increase both in dimension and quantity, which results in an aggravated damage state for the internal structure of the specimen, thus deteriorating the mechanical properties (Figure 15) and correspondingly altering the pattern of energy dissipation during dynamic loading (Figure 8 and Figure 9). The highly-developed thermal microcracks also facilitate fragmenting the specimen into smaller pieces under similar loading conditions (the incident energy is kept almost the same), which are in agreement with the observation that the dimension of the debris becomes smaller as heating level or cooling rate increases (Figure 13 and Figure 14).

5. Conclusions

In this study, a modified SHPB system is adopted to conduct the coupled dynamic and static loading experiments on sandstone after TS treatments with different heating levels and cooling rates. Within the scope of this study, the following conclusions can be drawn:
  • The dynamic compressive strength and dynamic elastic modulus of sandstone specimens decrease with the increase of heating level and cooling rate.
  • As the heating level increases (same cooling rate) or cooling rate increases (same heating level), the absorbed energy decrease, while the reflected energy increases.
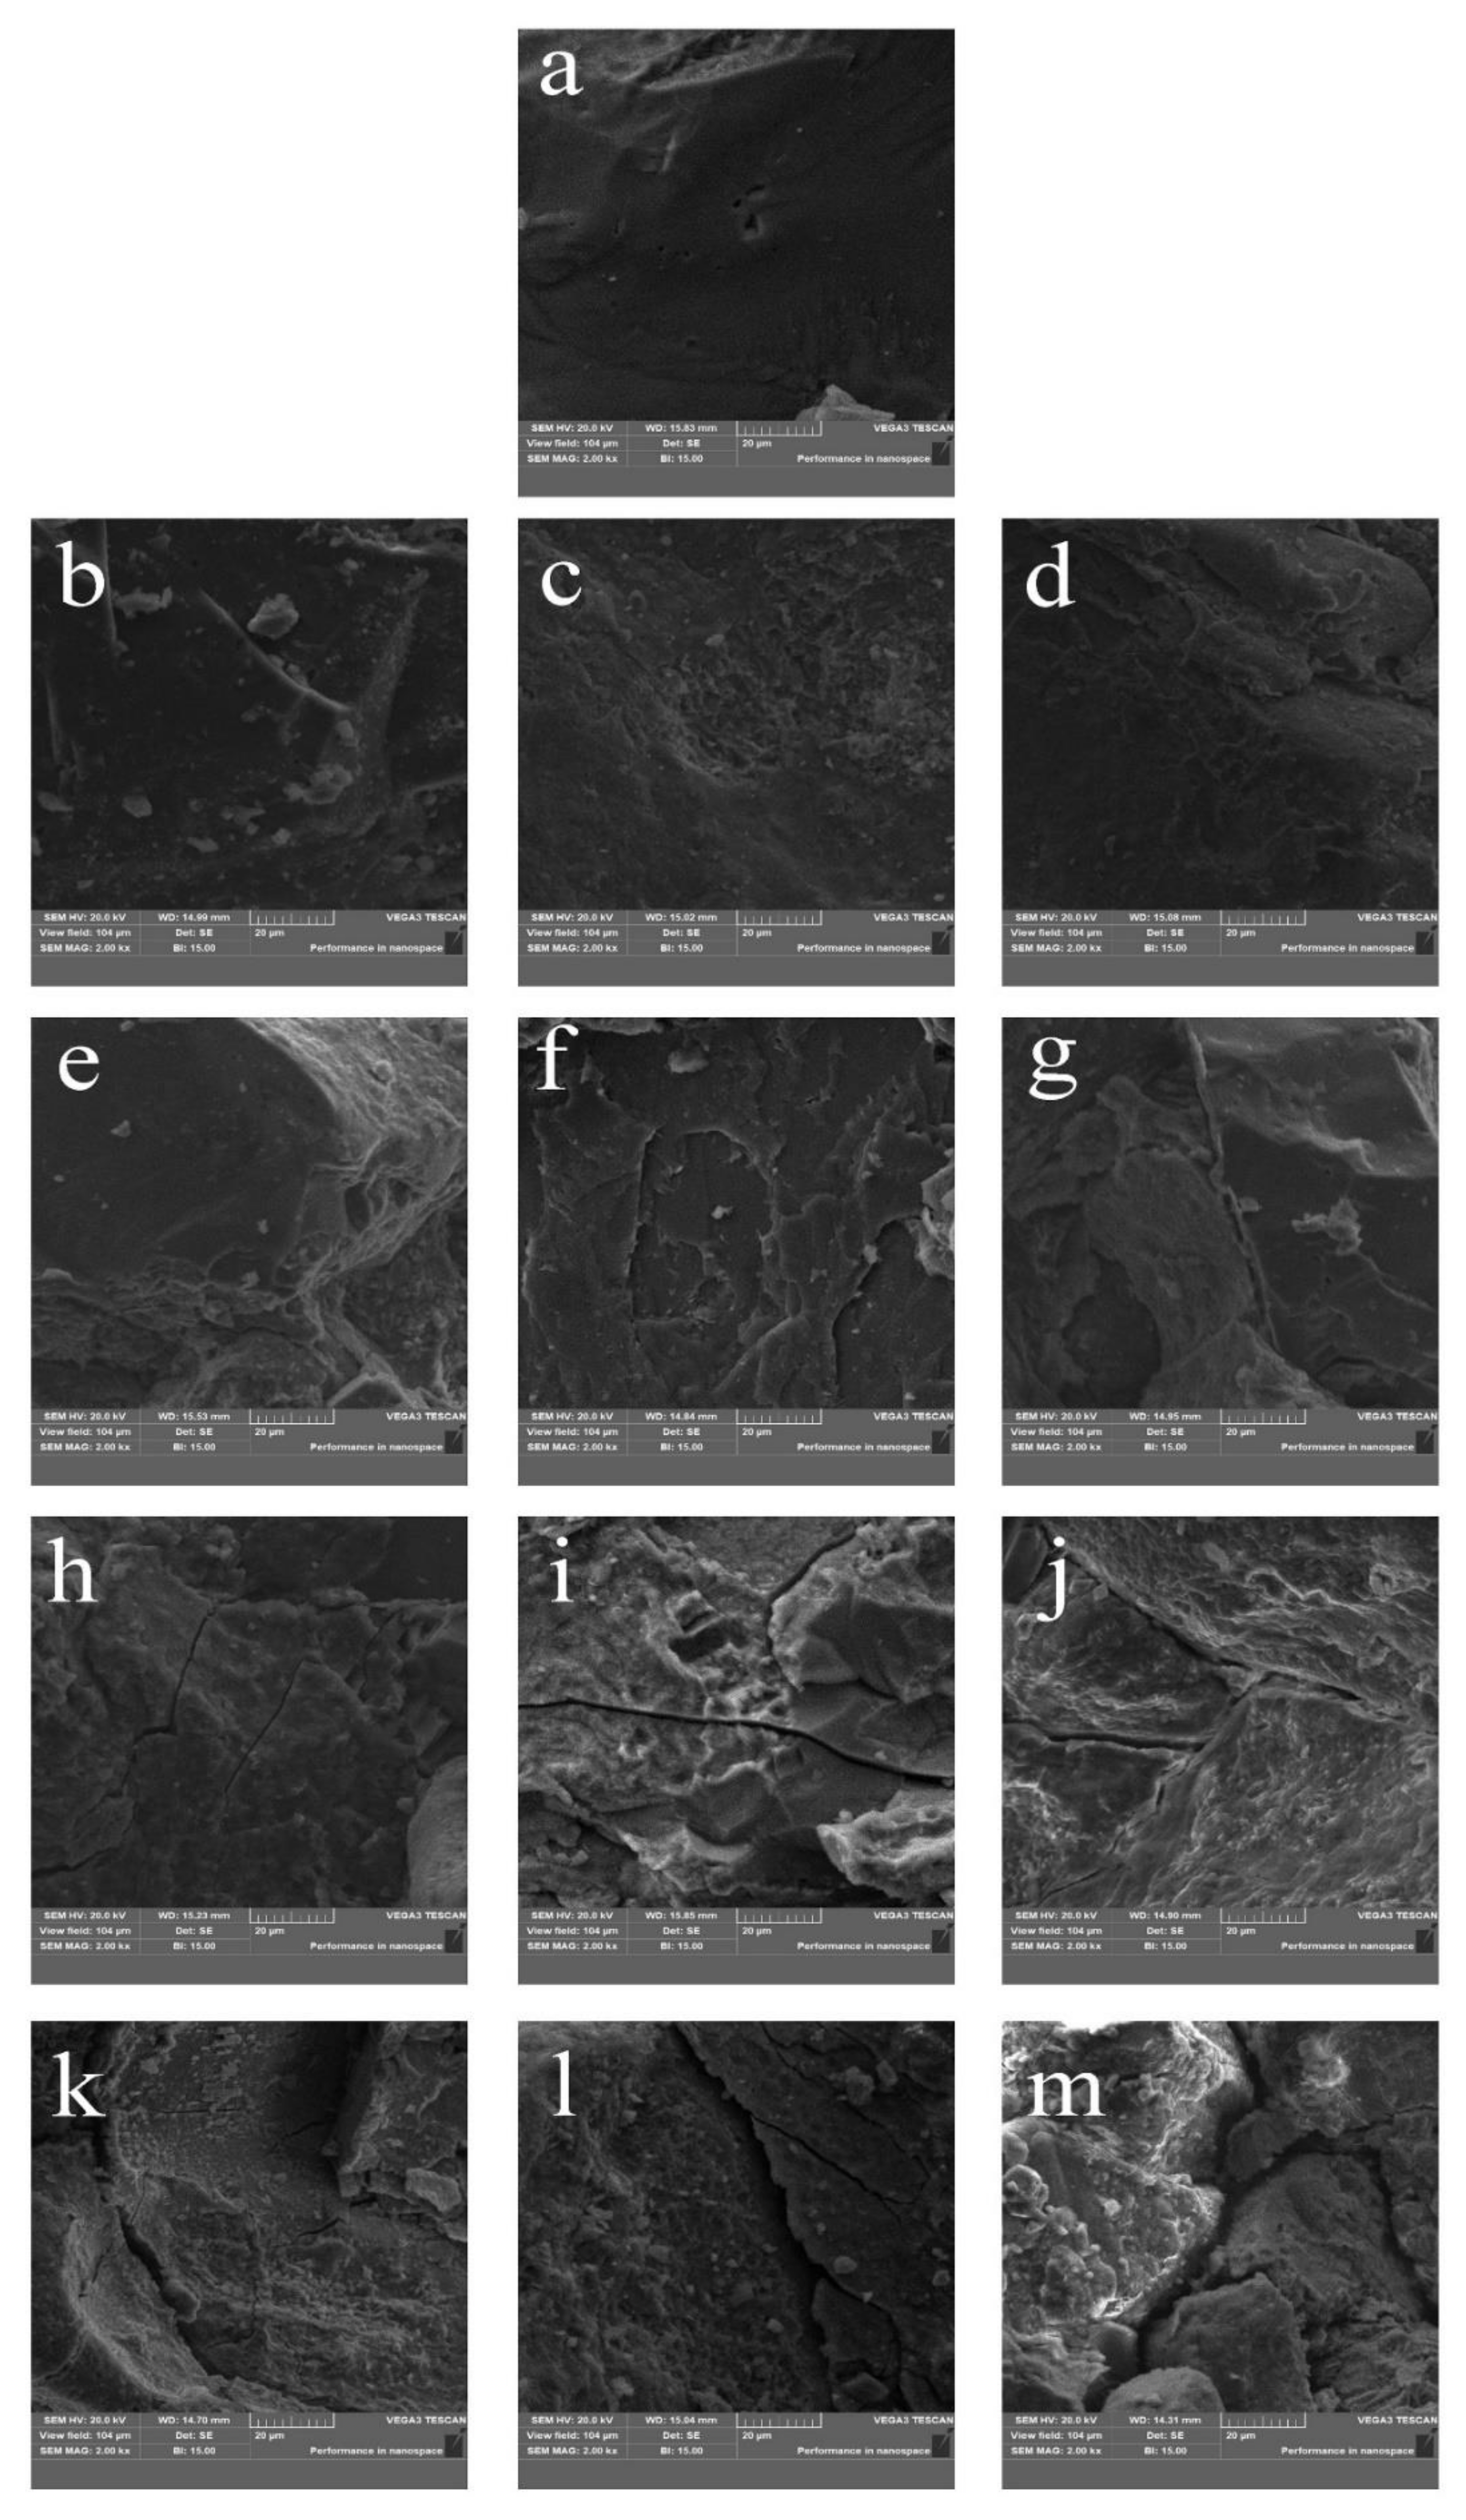
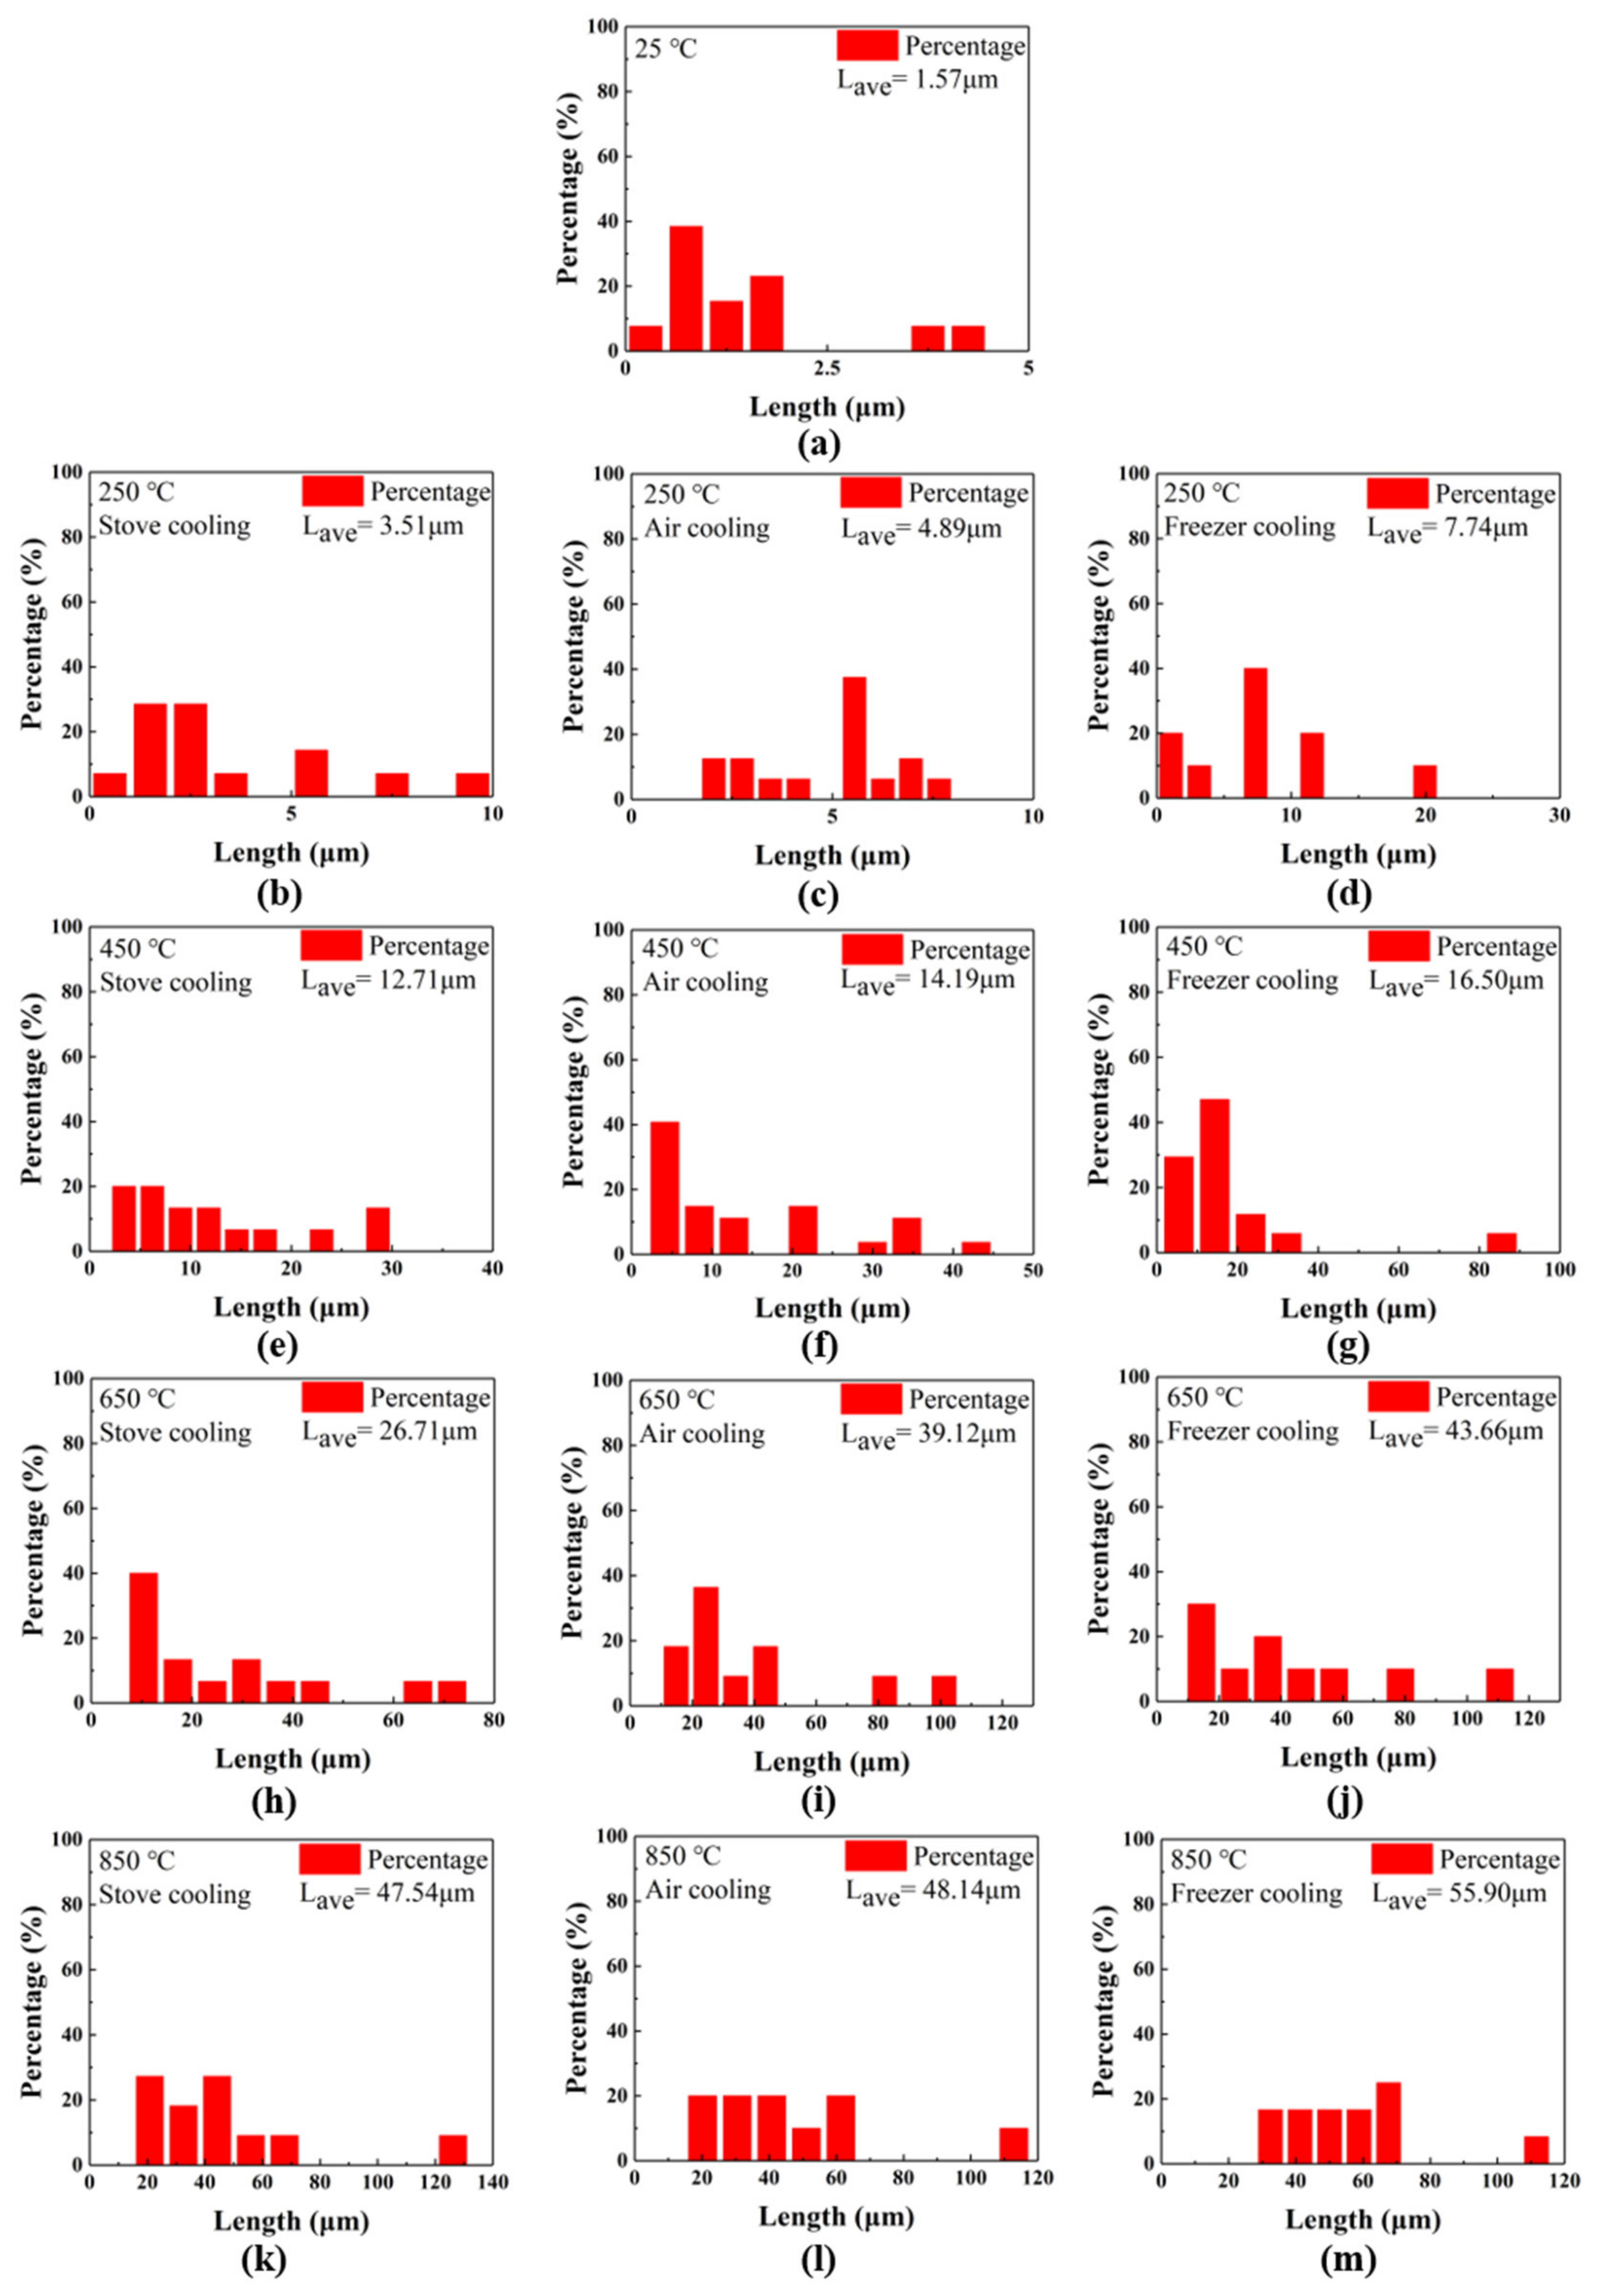
  • According to the SEM observation, as the heating level elevates or the cooling rate accelerates, the aggravated damage caused by the microcracks increases both in dimension and quantity.
  • The development of thermal microcracks facilitates fragmenting the specimen into smaller pieces under the same loading condition. This pattern is more evidently reflected as the heating level goes higher or the cooling rate becomes faster.
It is understood that the influence of thermal shock is exerted on rocks through the non-uniformity of the temperature gradient in the process of temperature change and the heterogeneity of the compositions of rock materials. Therefore, further investigations should include numerical simulations capable of reflecting the above characteristics of the thermal shock process in rock material. The content of this study is not only important for the damage analysis of rock engineering works involving high temperatures but also can provide valuable hints for the efficient exploitation of deep resources utilizing thermal shock.

Author Contributions

Conceptualization: X.L. (Xiang Li); Methodology: X.L. (Xiang Li); Formal analysis: X.L. (Xiang Li) and S.H.; Investigation: S.H.; Data curation: S.H.; Writing—original draft preparation: X.L. (Xiang Li) and S.H.; Writing—review and editing: X.L. (Xiang Li) and S.H.; Visualization: K.P.; Supervision: K.P. and X.F.; Project administration: X.L. (Xibing Li); Funding acquisition: X.L. (Xibing Li) and T.Y. All authors have read and agreed to the published version of the manuscript.

Funding

This work was supported by the National Nature Science Foundation of China (grant numbers 41972283 and 51974043) and the Industry-University-Research Collaboration Project of Zhuhai (ZH22017001200149PWC).

Data Availability Statement

The source data can be obtained in the article.

Conflicts of Interest

We declare that we do not have any commercial or associative interest that represents a conflict of interest in connection with the work submitted.

References

  1. Peng, K.; Zhou, J.; Zou, Q.; Zhang, J.; Wu, F. Effects of stress lower limit during cyclic loading and unloading on deformation characteristics of sandstones. Constr. Build. Mater. 2019, 217, 202–215. [Google Scholar] [CrossRef]
  2. Ni, A.; Xie, H.; Li, S.; Sun, Q.; Huang, D.; Cheng, Y.; Wang, N. The effect of anionic surfactant (SDS) on pore-fracture evolution of acidified coal and its significance for coalbed methane extraction. Adv. Powder Technol. 2019, 30, 940–951. [Google Scholar]
  3. Guo, Y.; Huang, L.; Li, X.; Chen, J.; Sun, J. Experimental investigation on the effects of thermal treatment on the physical and mechanical properties of shale. J. Nat. Gas Sci. Eng. 2020, 82, 103496. [Google Scholar] [CrossRef]
  4. Li, X.; Huang, S.; Yin, T.; Li, X.; Peng, K.; Fan, X.; Dang, W.; Huang, L. Dynamic Properties of Thermal Shock Treated Sandstone Subjected to Coupled Dynamic and Static Loads. Minerals 2021, 11, 889. [Google Scholar] [CrossRef]
  5. Langman, J.B.; Moore, M.L.; Ptacek, C.J.; Smith, L.; Sego, D.; Blowes, D.W. Diavik Waste Rock Project: Evolution of Mineral Weathering, Element Release, and Acid Generation and Neutralization during a Five-Year Humidity Cell Experiment. Minerals 2014, 4, 257–278. [Google Scholar] [CrossRef] [Green Version]
  6. Chen, J.; Yin, L.M.; Song, R.; Li, L. The Thermal Damage Properties of Mudstone, Gypsum and Rock Salt from Yingcheng, Hubei, China. Minerals 2015, 5, 104–116. [Google Scholar] [CrossRef] [Green Version]
  7. Cha, M.; Yin, X.; Kneafsey, T.; Johanson, B.; Wu, Y. Cryogenic fracturing for reservoir stimulation—Laboratory studies. J. Pet. Sci. Eng. 2014, 124, 436–450. [Google Scholar] [CrossRef] [Green Version]
  8. Brotóns, V.; Tomás, R.; Ivorra, S.; Alarcón, J. Temperature influence on the physical and mechanical properties of a porous rock: San julian’s calcarenite. Eng. Geol. 2013, 167, 117–127. [Google Scholar] [CrossRef]
  9. Sirdesai, N.; Mahanta, B.; Ranjith, P.; Singh, T. Effects of thermal treatment on physico-morphological properties of Indian fine-grained sandstone. Bull. Eng. Geol. Environ. 2019, 78, 883–897. [Google Scholar] [CrossRef]
  10. Hall, K.; Thorn, C.E. Thermal fatigue and thermal shock in bedrock: An attempt to unravel the geomorphic processes and products. Geomorphology 2014, 206, 1–13. [Google Scholar] [CrossRef]
  11. Li, X.; Li, B.; Li, X.; Yin, T.; Dang, W. Thermal shock effects on the mechanical behavior of granite exposed to dynamic loading. Arch. Civ. Mech. Eng. 2020, 20, 1–11. [Google Scholar] [CrossRef]
  12. Paolo, B.; Alessandro, P.; Andrea, B.; Matteo, G.; Michele, M. Thermal stability of woolly erionite-k and considerations about the heat-induced behaviour of the erionite group. Minerals 2018, 8, 28. [Google Scholar]
  13. Edoardo, R.; Kant, M.; Claudio, M.; Saar, M.; Philipp, R. The effects of high heating rate and high temperature on the rock strength: Feasibility study of a thermally assisted drilling method. Rock Mech. Rock Eng. 2018, 51, 2957–2964. [Google Scholar]
  14. Zheng, F.; Zhuang, X.; Zheng, H.; Jiao, Y.; Rabczuk, T. Discontinuous deformation analysis with distributed bond for the modelling of rock deformation and failure. Comput. Geotech. 2021, 139, 104413. [Google Scholar] [CrossRef]
  15. Wang, Z.; Hao, S.; Zheng, J.; Tian, N.; Zha, F.; Shi, H. Study on energy properties and failure behaviors of heat-treated granite under static and dynamic compression. Mech. Adv. Mater. Struct. 2020, 27, 462–472. [Google Scholar] [CrossRef]
  16. Li, M.; Gang, L.; Mao, X. Dynamic fracture and energy consumption characteristics of coal-series sandstone after heat treatment. Therm. Sci. 2019, 23, 248. [Google Scholar] [CrossRef]
  17. Zhang, R.; Jing, L.; Ma, Q. Experimental Study on Thermal Damage and Energy Evolution of Sandstone after High Temperature Treatment. Shock. Vib. 2018, 2018, 1–9. [Google Scholar] [CrossRef]
  18. Wang, Z.; Tian, N.; Wang, J.; Yang, S.; Liu, G. Mechanical response and energy dissipation analysis of heat-treated granite under repeated impact loading. Comput. Mater. Contin. 2019, 59, 275–296. [Google Scholar] [CrossRef] [Green Version]
  19. Shu, H.; Yin, T.; Li, X.; Yin, Z.; Tang, L. Effect of thermal treatment on energy dissipation of granite under cyclic impact loading. Trans. Nonferrous Met. Soc. China 2019, 29, 385–396. [Google Scholar] [CrossRef]
  20. ISRM. Suggested methods for determining water content, porosity density, absorption and related properties and swelling and slake-durability index properties. Int. J. Rock Mech. Min. Sci. Geomech. Abstr. 1979, 2, 141–156. [Google Scholar]
  21. Li, X.; Zhang, Z.; Chen, W.; Yin, T. Mode I and Mode II Granite Fractures after Distinct Thermal Shock Treatments. J. Mater. Civ. Eng. 2019, 31, 06019001. [Google Scholar] [CrossRef]
  22. Li, X.; Zhou, Z.; Lok, T.-S.; Hong, L.; Yin, T. Innovative testing technique of rock subjected to coupled static and dynamic loads. Int. J. Rock Mech. Min. Sci. 2008, 45, 739–748. [Google Scholar] [CrossRef]
  23. Gong, F.; Jia, H.; Zhang, Z.; Hu, J.; Luo, S. Energy Dissipation and Particle Size Distribution of Granite under Different Incident Energies in SHPB Compression Tests. Shock. Vib. 2020, 2020, 1–14. [Google Scholar] [CrossRef]
  24. Zhang, Z.; Kou, S.; Jiang, L.; Lindqvist, P. Effects of loading rate on rock fracture: Fracture characteristics and energy partitioning. Int. J. Rock Mech. Min. Sci. 2000, 37, 745–762. [Google Scholar] [CrossRef]
  25. Van der Molen, I. The shift of the α-β transition temperature of quartz associated with the thermal expansion of granite at high pressure. Tectonophysics 1981, 73, 323–342. [Google Scholar] [CrossRef]
  26. Antao, S.M. Quartz: Structural and thermodynamic analyses across the α-β transition with origin of negative thermal expansion (NTE) in β quartz and calcite. Acta Crystallogr. Sect. B 2016, 72, 249–262. [Google Scholar] [CrossRef] [PubMed]
  27. Wang, X.; Wu, B.; Wang, Q. Online SEM investigation of microcrack characteristics of concretes at various temperatures. Cem. Concr. Res. 2005, 35, 1385–1390. [Google Scholar] [CrossRef]
  28. Sjh, A.; Yk, B.; Tsy, B. Development of microcracks in granitic rock by liquid co2 fracturing. Int. J. Rock Mech. Min. Sci. 2021, 146, 104876. [Google Scholar]
  29. Long, K.; Zhang, Z.; Ring, U.; Faulkner, D.; Gamage, R. Microcracks development and porosity evolution in sandstone, sichuan basin, china: An experimental approach. Bull. Eng. Geol. Environ. 2021, 10, 7717–7729. [Google Scholar] [CrossRef]
Figure 1. Sandstone specimen used in the test: (a) geometry of the specimen; (b) photomicrograph of the sandstone under cross-polarized light (Q = quartz, Kfs = Potash feldspar, P = Plagioclase, R = Rock debris, Cal = Calcite); (c) mineral composition.
Minerals 12 00025 g001
Figure 2. Temperature profiles of TS treatments.
Minerals 12 00025 g002
Figure 3. Differential sketch map of the temperature profile.
Minerals 12 00025 g003
Figure 4. Coupled dynamic and static loading system based on the SHPB device.
Minerals 12 00025 g004
Figure 5. Stress balance diagram of a specimen in the dynamic loading process.
Minerals 12 00025 g005
Figure 6. Dynamic stress-strain curve of the sandstone specimens: (a) stove cooling; (b) air cooling; (c) freezer cooling; (d) regional categories of stress–strain curves.
Minerals 12 00025 g006
Figure 7. Dynamic strength of the specimens versus TS temperature.
Minerals 12 00025 g007
Figure 8. Energy curves of sandstone specimens in the impacting process (S: stove cooled; A: air-cooled; F: freezer cooled; Inc: incident energy; Ref: reflected energy; Tra: transmitted energy; Abs: absorbed energy).
Minerals 12 00025 g008
Figure 9. (a) correlation between energy dissipation and temperature (the blue symbol represents the absorbed energy, the black symbol represents the reflected energy, the red symbol represents the transmitted energy), (b) correlation between WR + WT and WI, (c) correlation between energy dissipation rate and temperature, (d) correlation between energy dissipation rate and temperature and cooling rate.
Minerals 12 00025 g009
Figure 10. Failure processes of stove-cooled sandstone specimens under coupled dynamic and static loading.
Minerals 12 00025 g010
Figure 11. Failure processes of air-cooled sandstone specimens under coupled dynamic and static loading.
Minerals 12 00025 g011
Figure 12. Failure processes of freezer-cooled sandstone specimens under coupled dynamic and static loading.
Minerals 12 00025 g012
Figure 13. The morphological characteristics of the debris of the specimen after the coupled dynamic and static loading tests (S: stove cooled; A: air-cooled; F: freezer cooled).
Minerals 12 00025 g013
Figure 14. The distributions of debris sizes of sandstone specimens after coupled dynamic and static loading tests: (a) stove cooling; (b) air cooling; (c) freezer cooling.
Minerals 12 00025 g014
Figure 15. SEM images of fracture surfaces of the specimens after coupled dynamic and static loading tests: (a) Ambient; (b) T = 250 °C, stove-cooled; (c) T = 250 °C, air-cooled; (d) T = 250 °C, freezer-cooled; (e) T = 450 °C, stove-cooled; (f) T = 450 °C, air-cooled; (g) T = 450 °C, freezer-cooled; (h) T = 650 °C, stove-cooled; (i) T = 650 °C, air-cooled; (j) T = 650 °C, freezer-cooled; (k) T = 850 °C, stove-cooled; (l) T = 850 °C, air-cooled; (m) T = 850 °C, freezer-cooled.
Minerals 12 00025 g015
Figure 16. Statistics of microcrack size of sandstone specimens after coupled dynamic and static loading tests: (a) Ambient; (b) T = 250 °C, stove-cooled; (c) T = 250 °C, air-cooled; (d) T = 250 °C, freezer-cooled; (e) T = 450 °C, stove-cooled; (f) T = 450 °C, air-cooled; (g) T = 450 °C, freezer-cooled; (h) T = 650 °C, stove-cooled; (i) T = 650 °C, air-cooled; (j) T = 650 °C, freezer-cooled; (k) T = 850 °C, stove-cooled; (l) T = 850 °C, air-cooled; (m) T = 850 °C, freezer-cooled.
Minerals 12 00025 g016
Table 1. The main parameters of the bars in the SHPB system.
Diameter of the Bar (mm)50
Incident bar length (mm)2000
Absorbing bar length (mm)500
Transmission bar length (mm)1500
Elastic modulus (GPa)240
Poisson’s ratio0.28
P-wave velocity (m/s)5400
Density (kg/m3)7800
Table 2. Energy dissipation of sandstone specimens after TS.
Temperature (°C)EI (J)ER (J)ET (J)EA (J)
25176.3231.5711.82132.93
Stove-cooled
250177.1638.1812.54126.44
450177.8554.1713.48110.20
650182.9098.4119.4265.07
850173.13110.6710.1852.28
Air-cooled
250178.0237.2716.63124.12
450177.7257.0112.91107.80
650175.14102.3811.5261.24
850177.25112.5912.4552.21
Freezer-cooled
250168.3950.323.38114.69
450176.4259.1114.14103.17
650174.98116.814.9153.26
850172.36127.133.8941.34
Publisher’s Note: MDPI stays neutral with regard to jurisdictional claims in published maps and institutional affiliations.

