
Rh, Ir, and Ru Partitioning in the Cu-Poor IPGE Massive Ores, Talnakh Intrusion, Skalisty Mine, Russia


Abstract
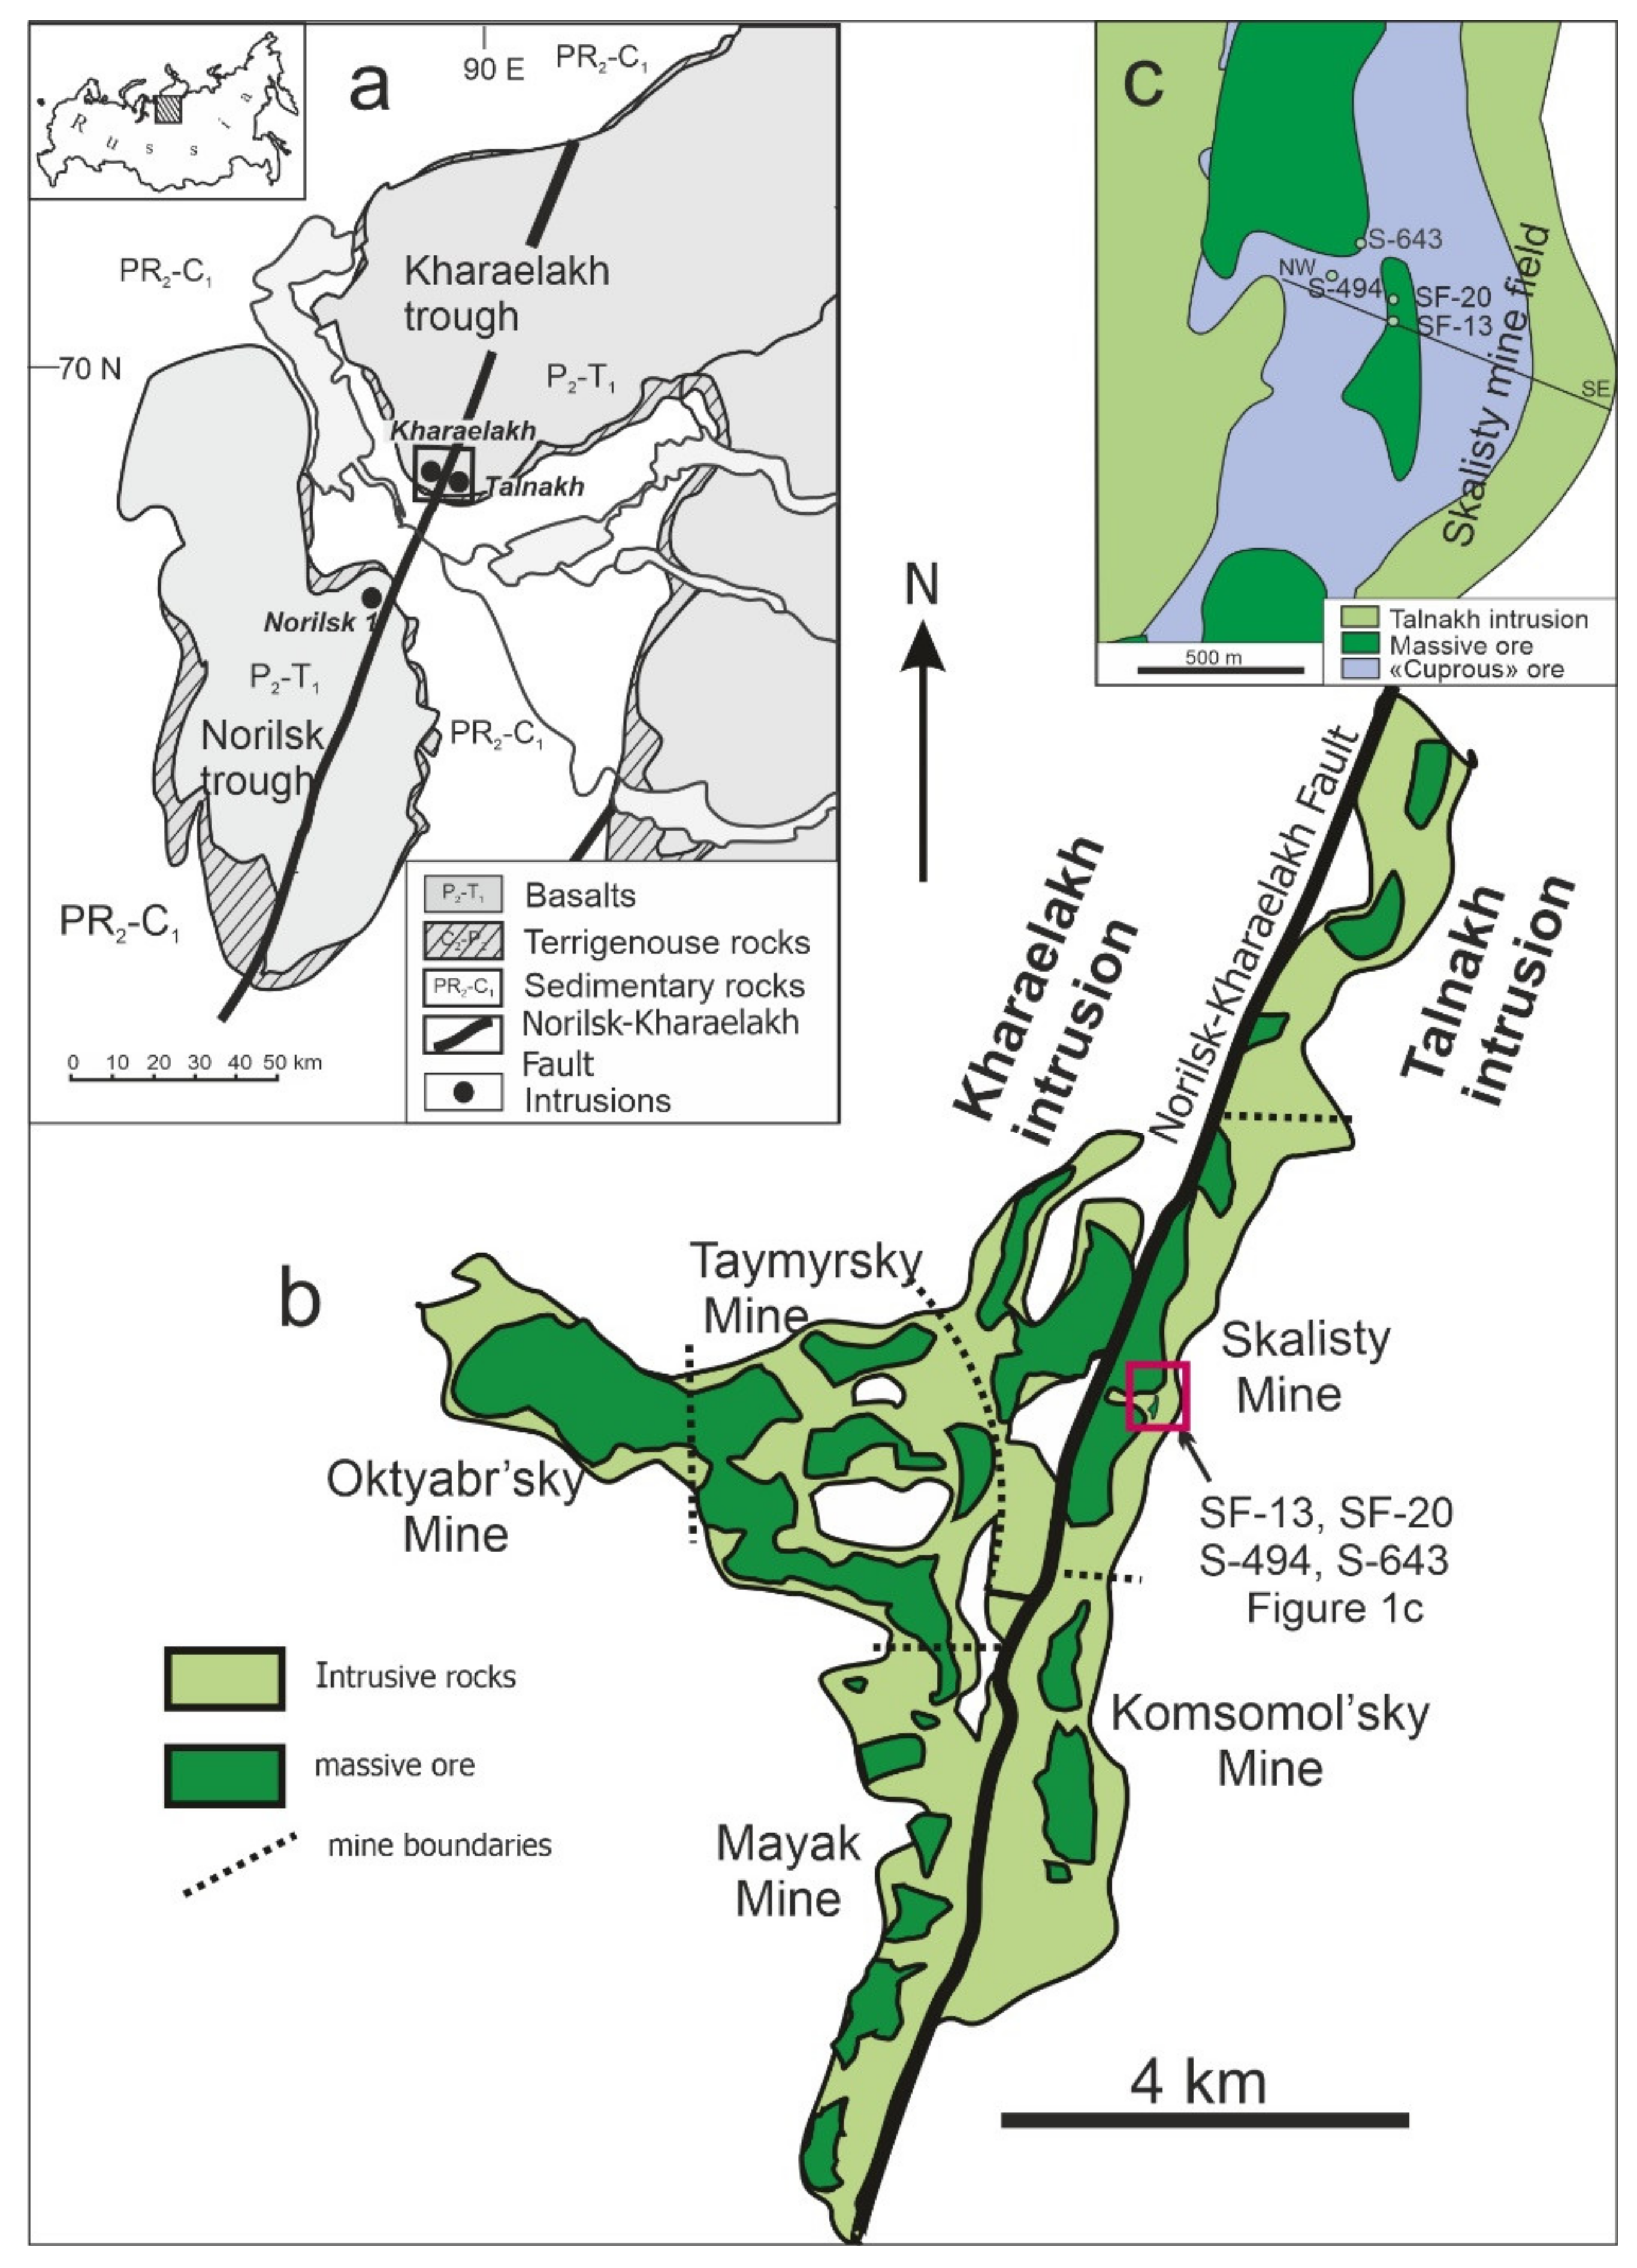
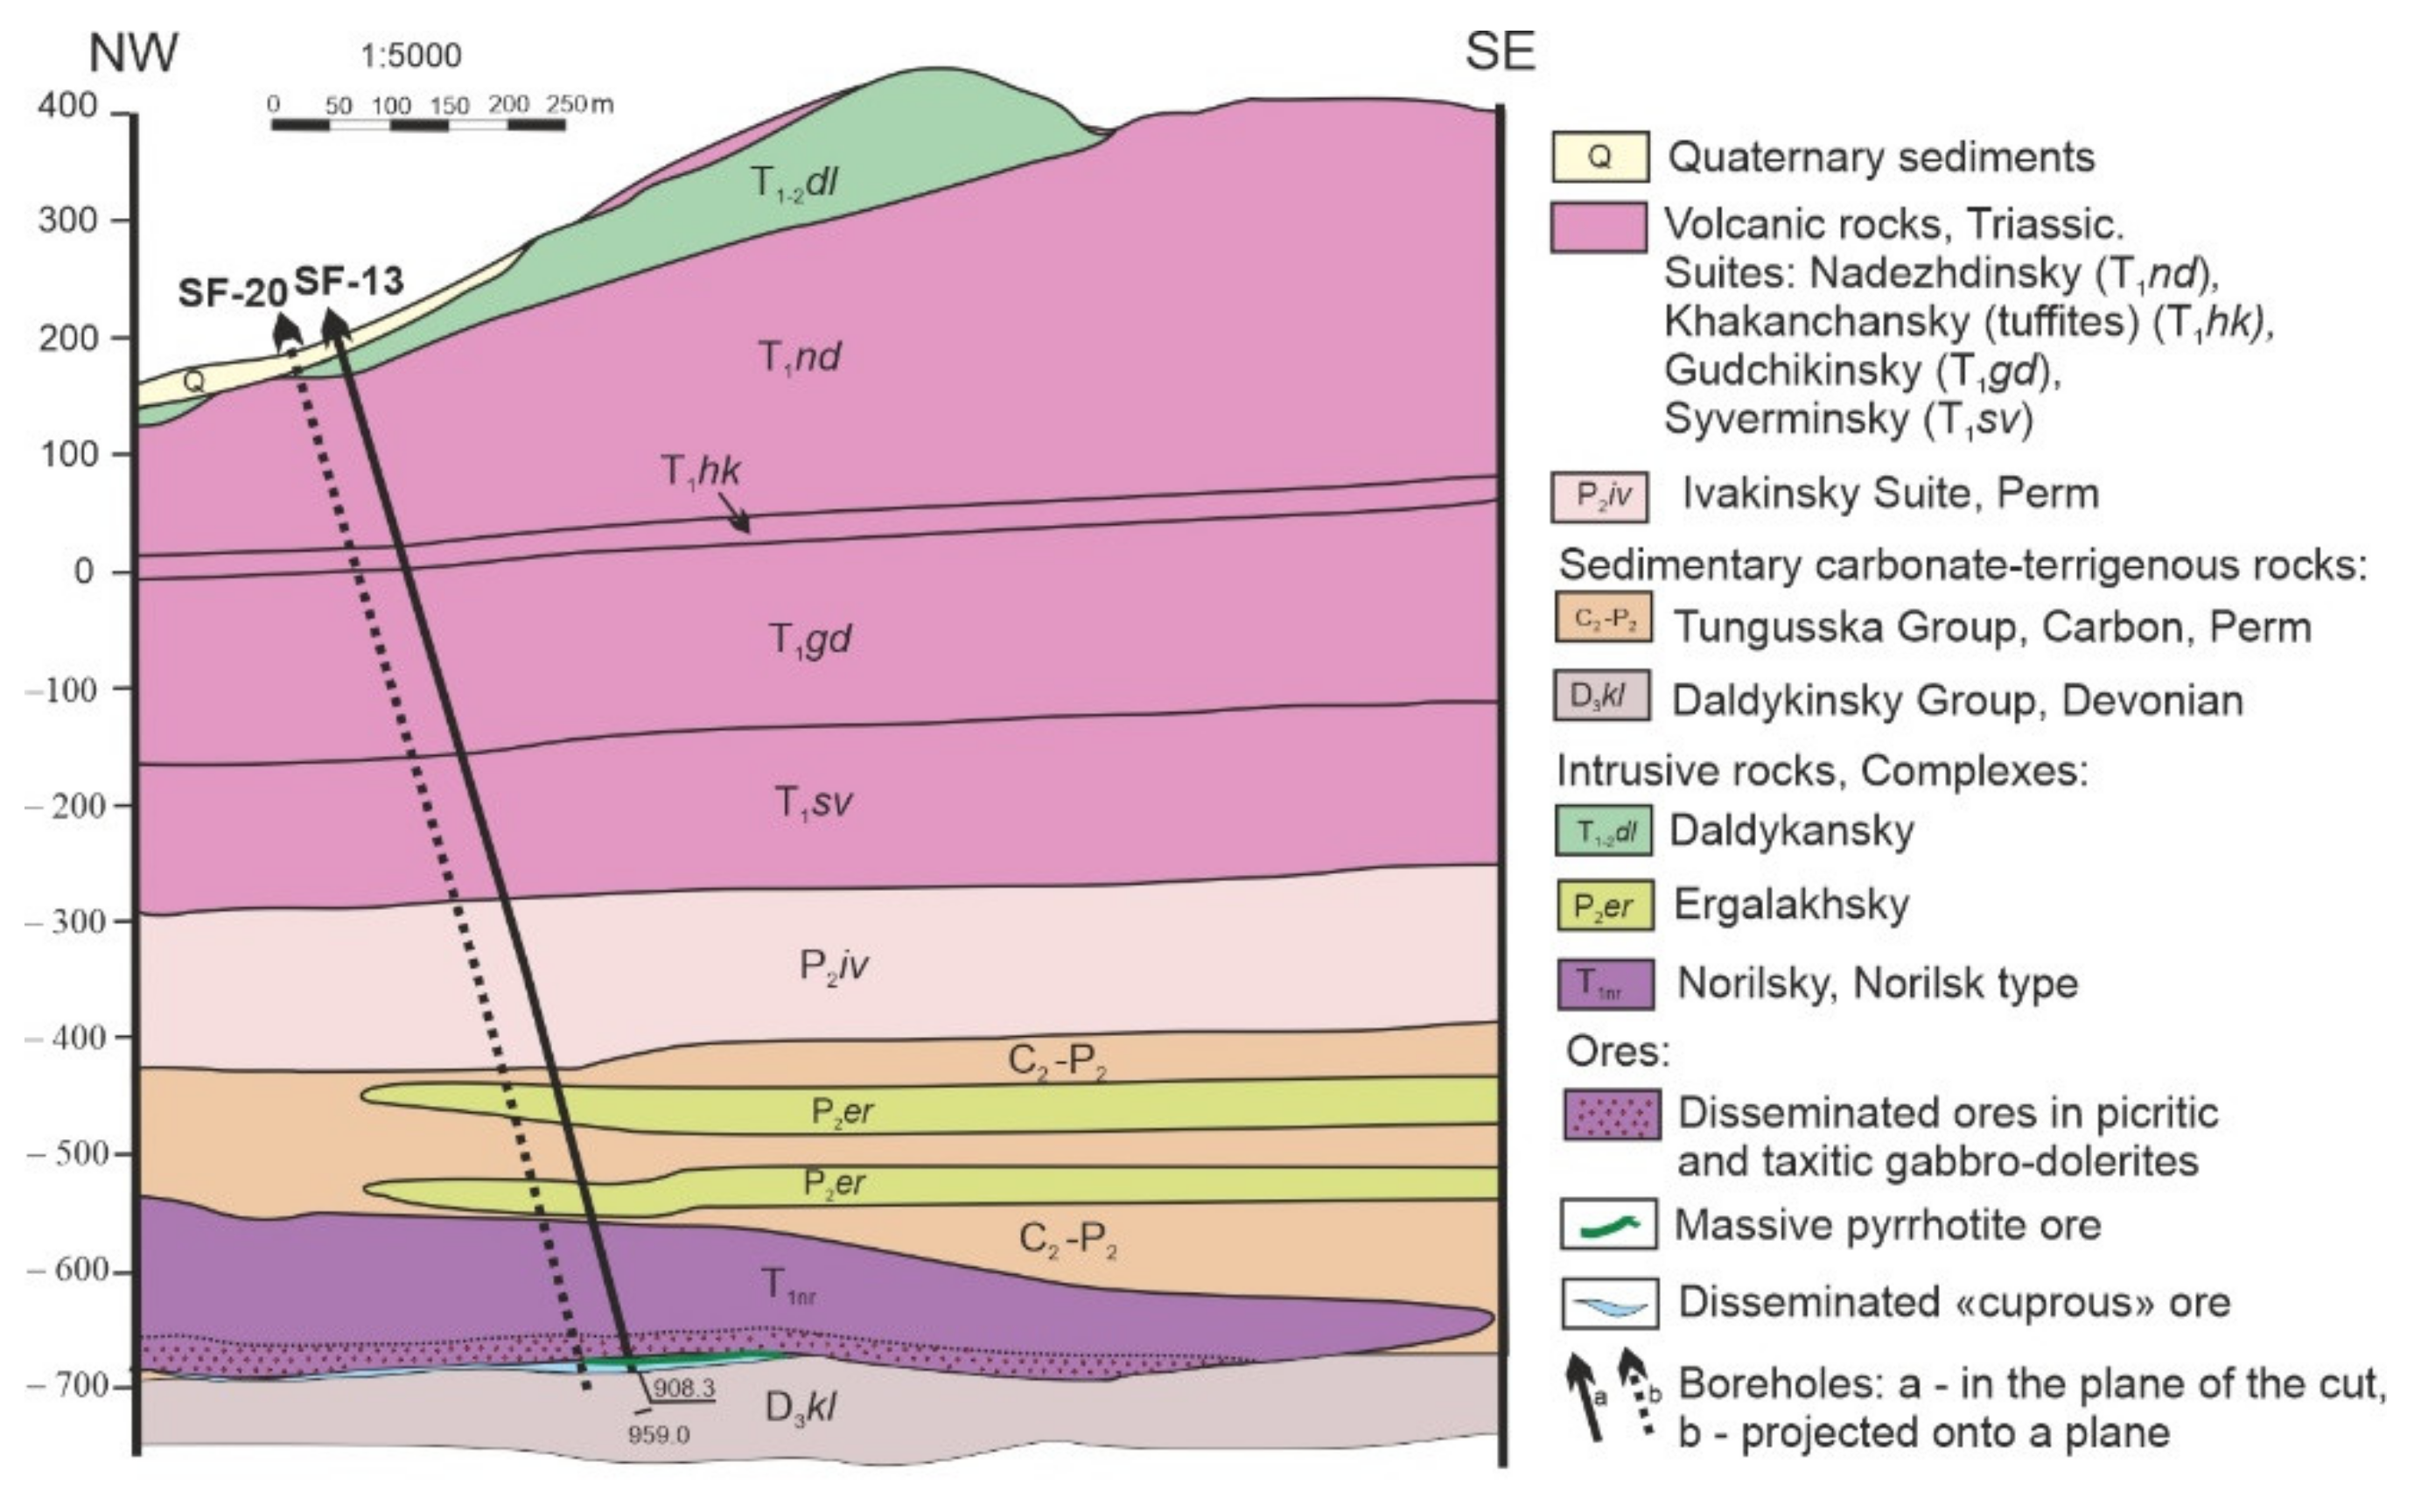
:1. Introduction
2. Materials and Methods
3. Results
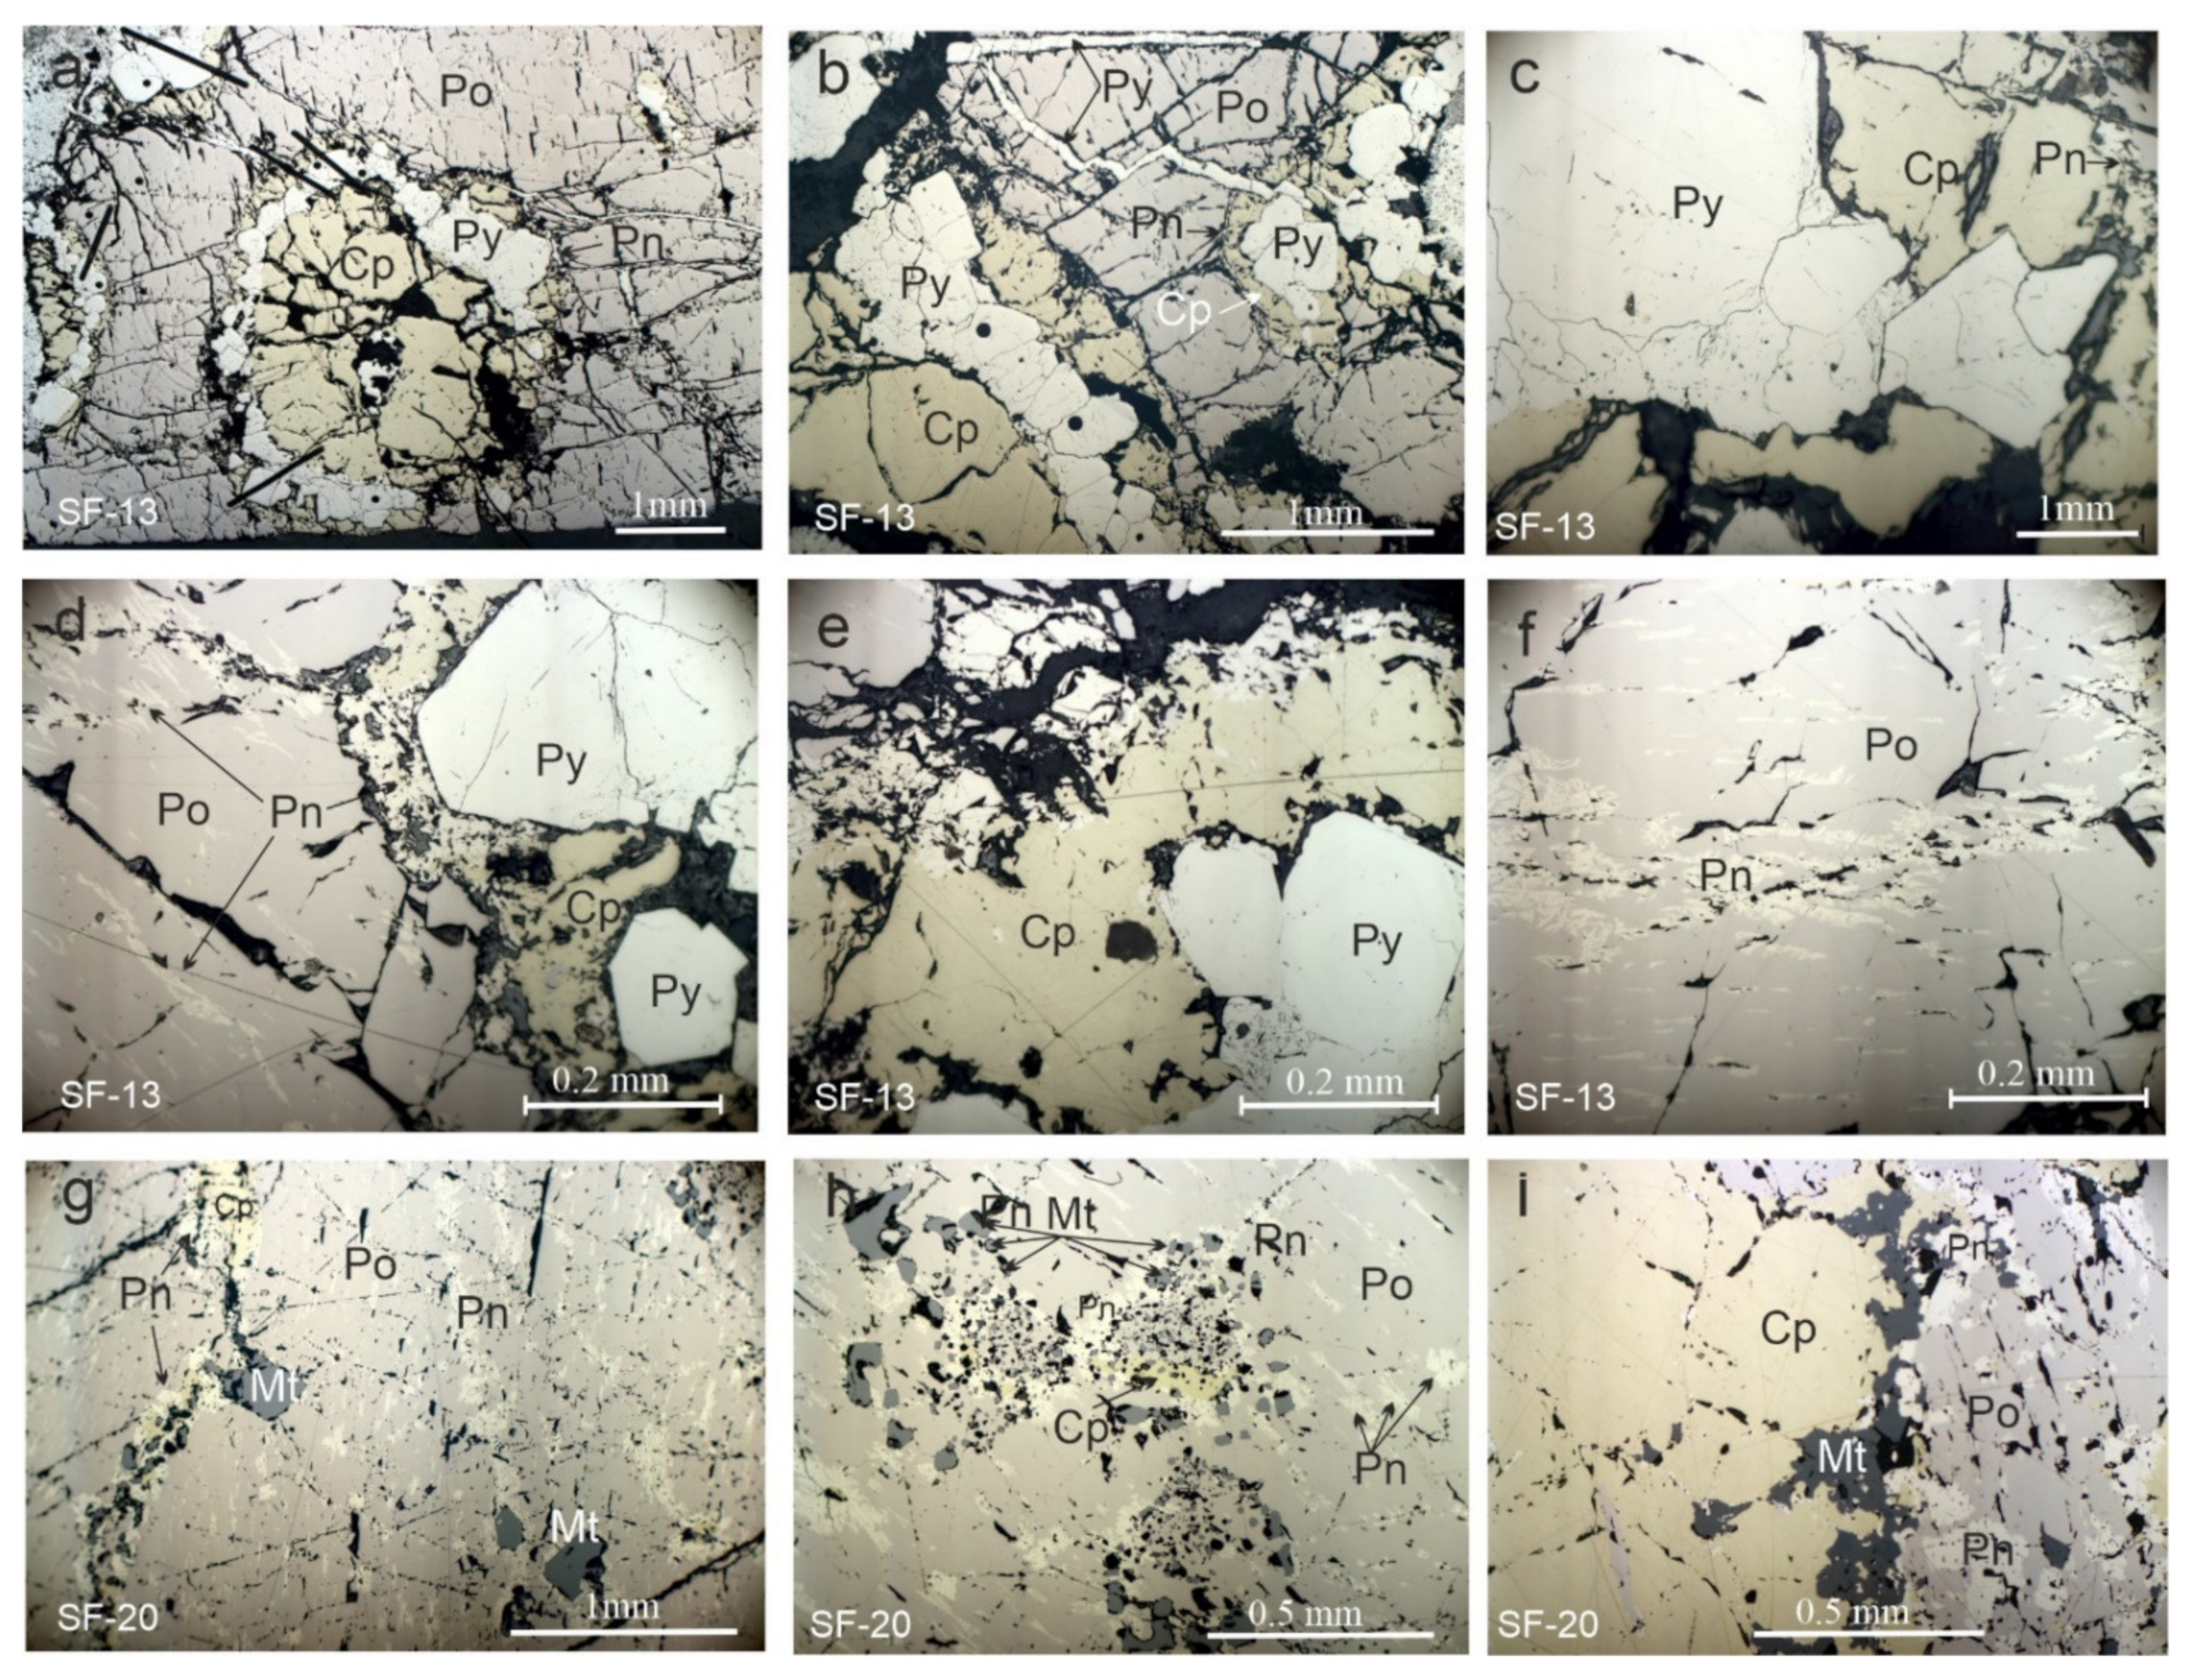
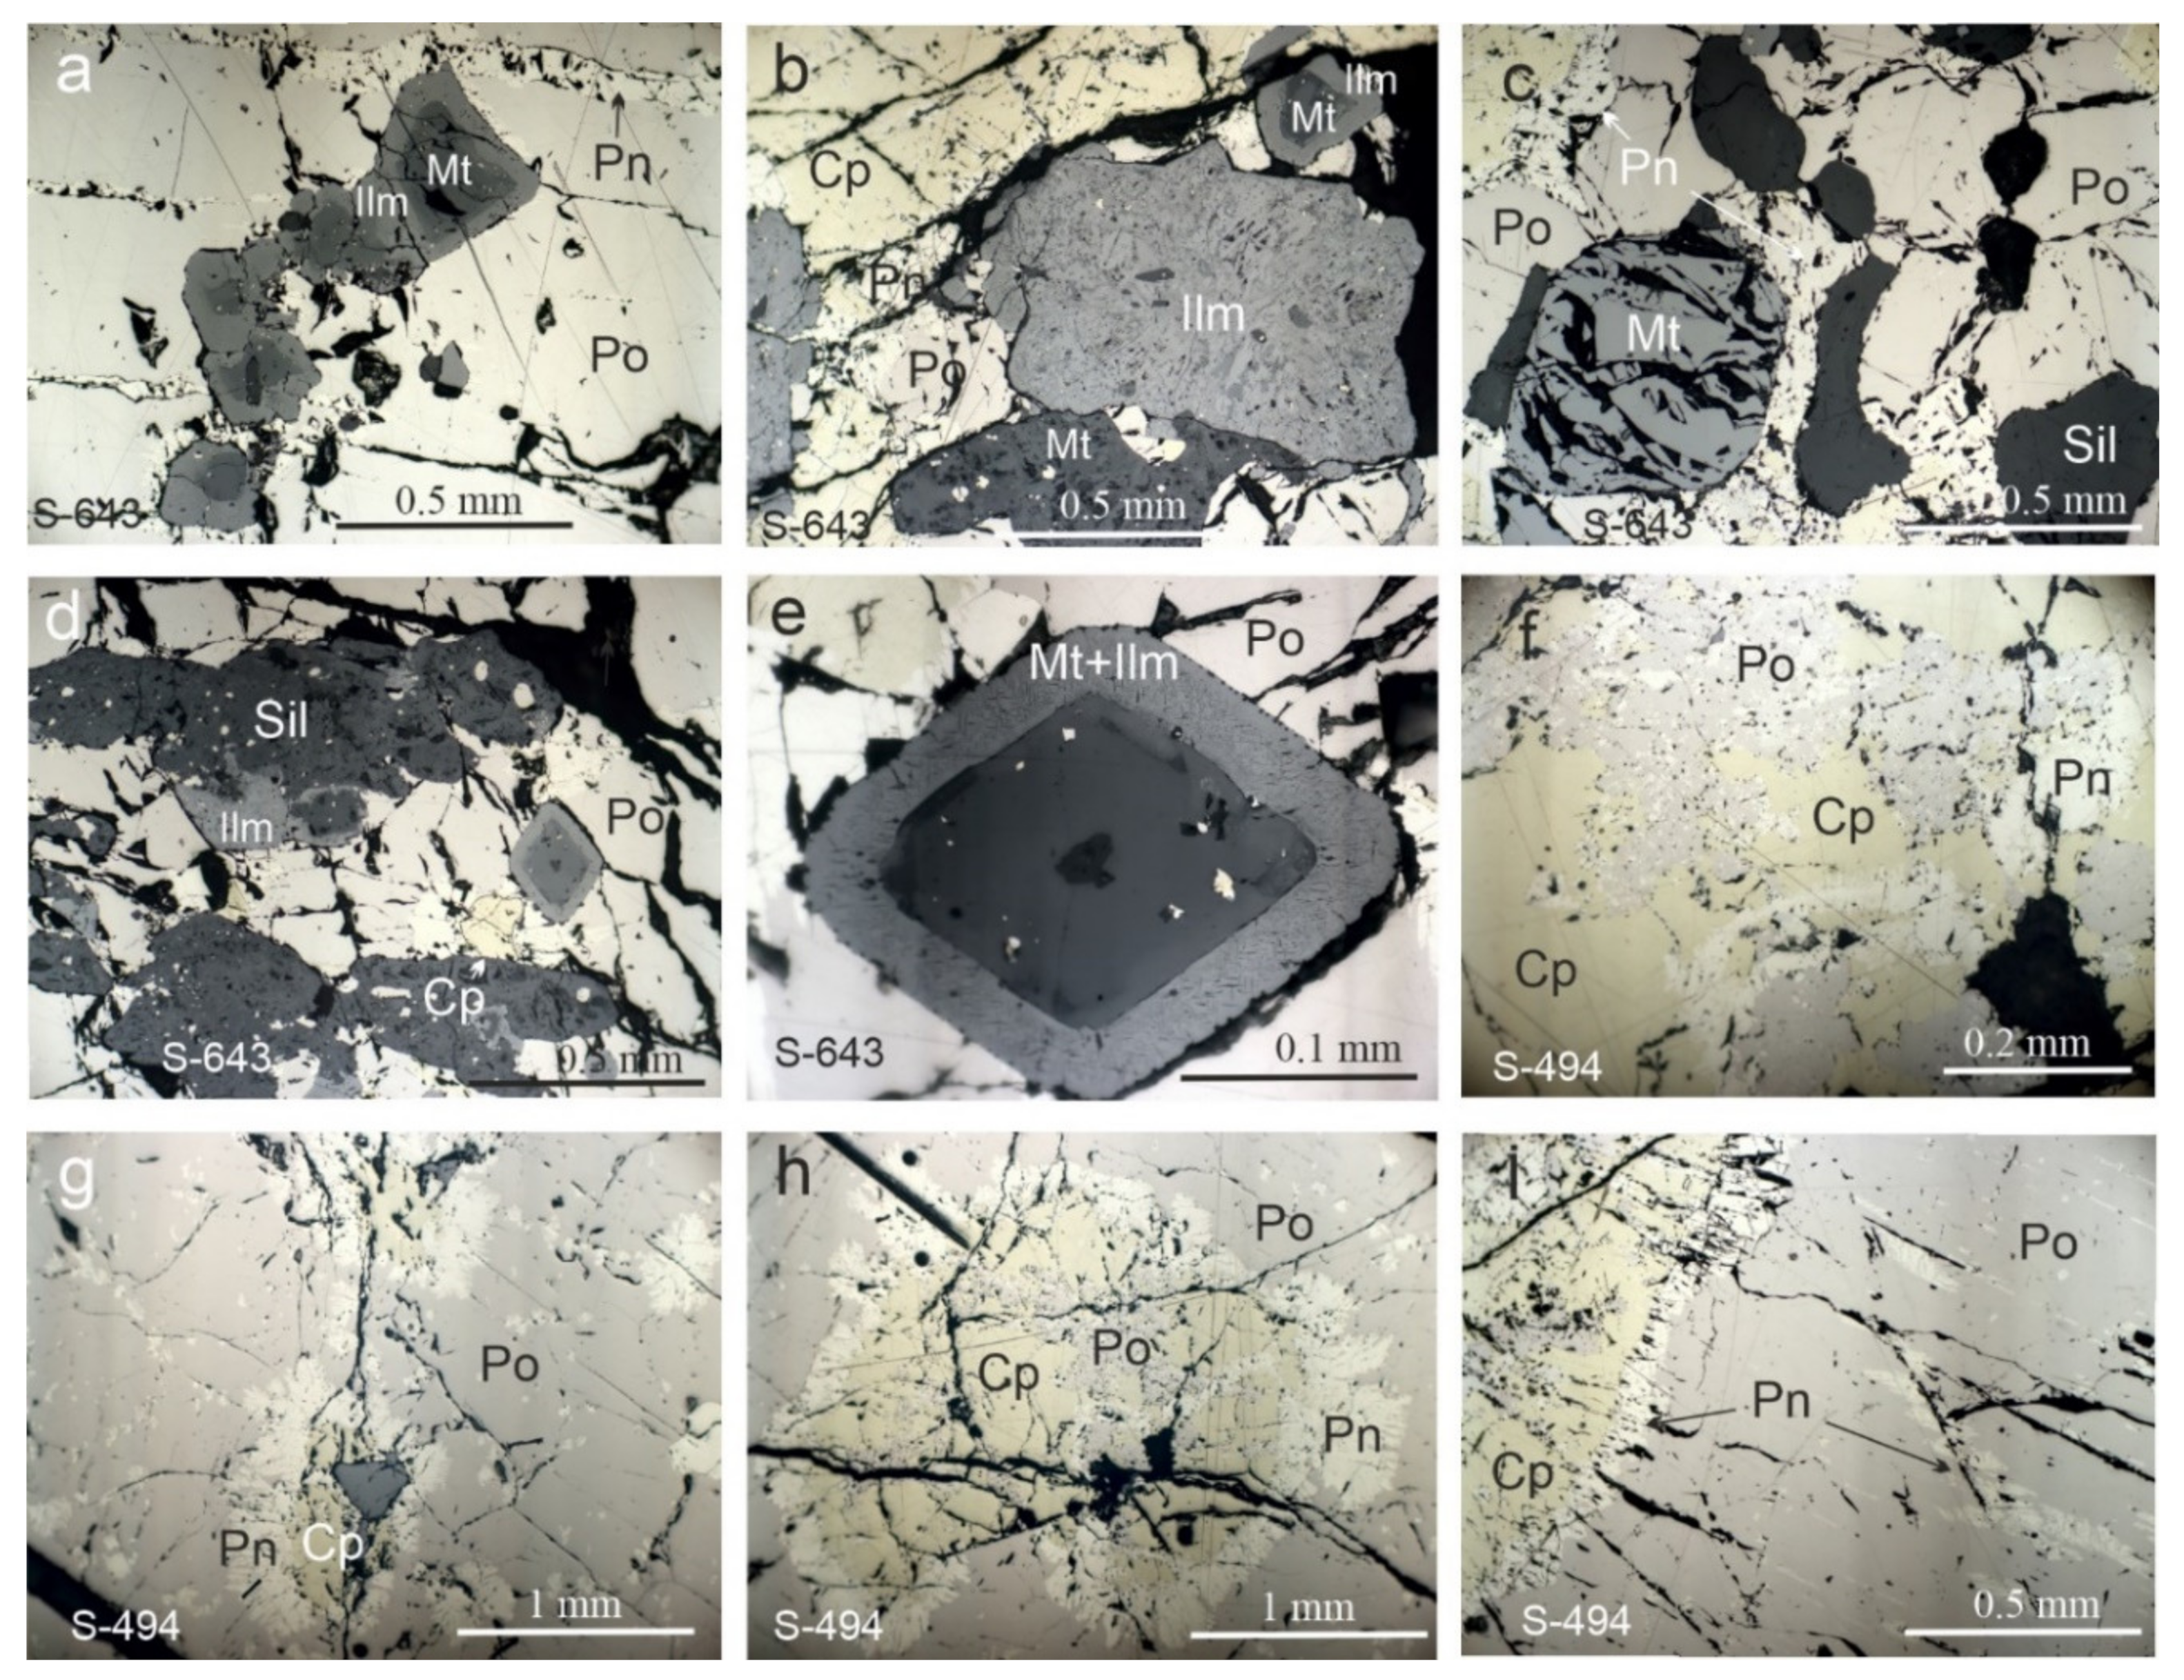
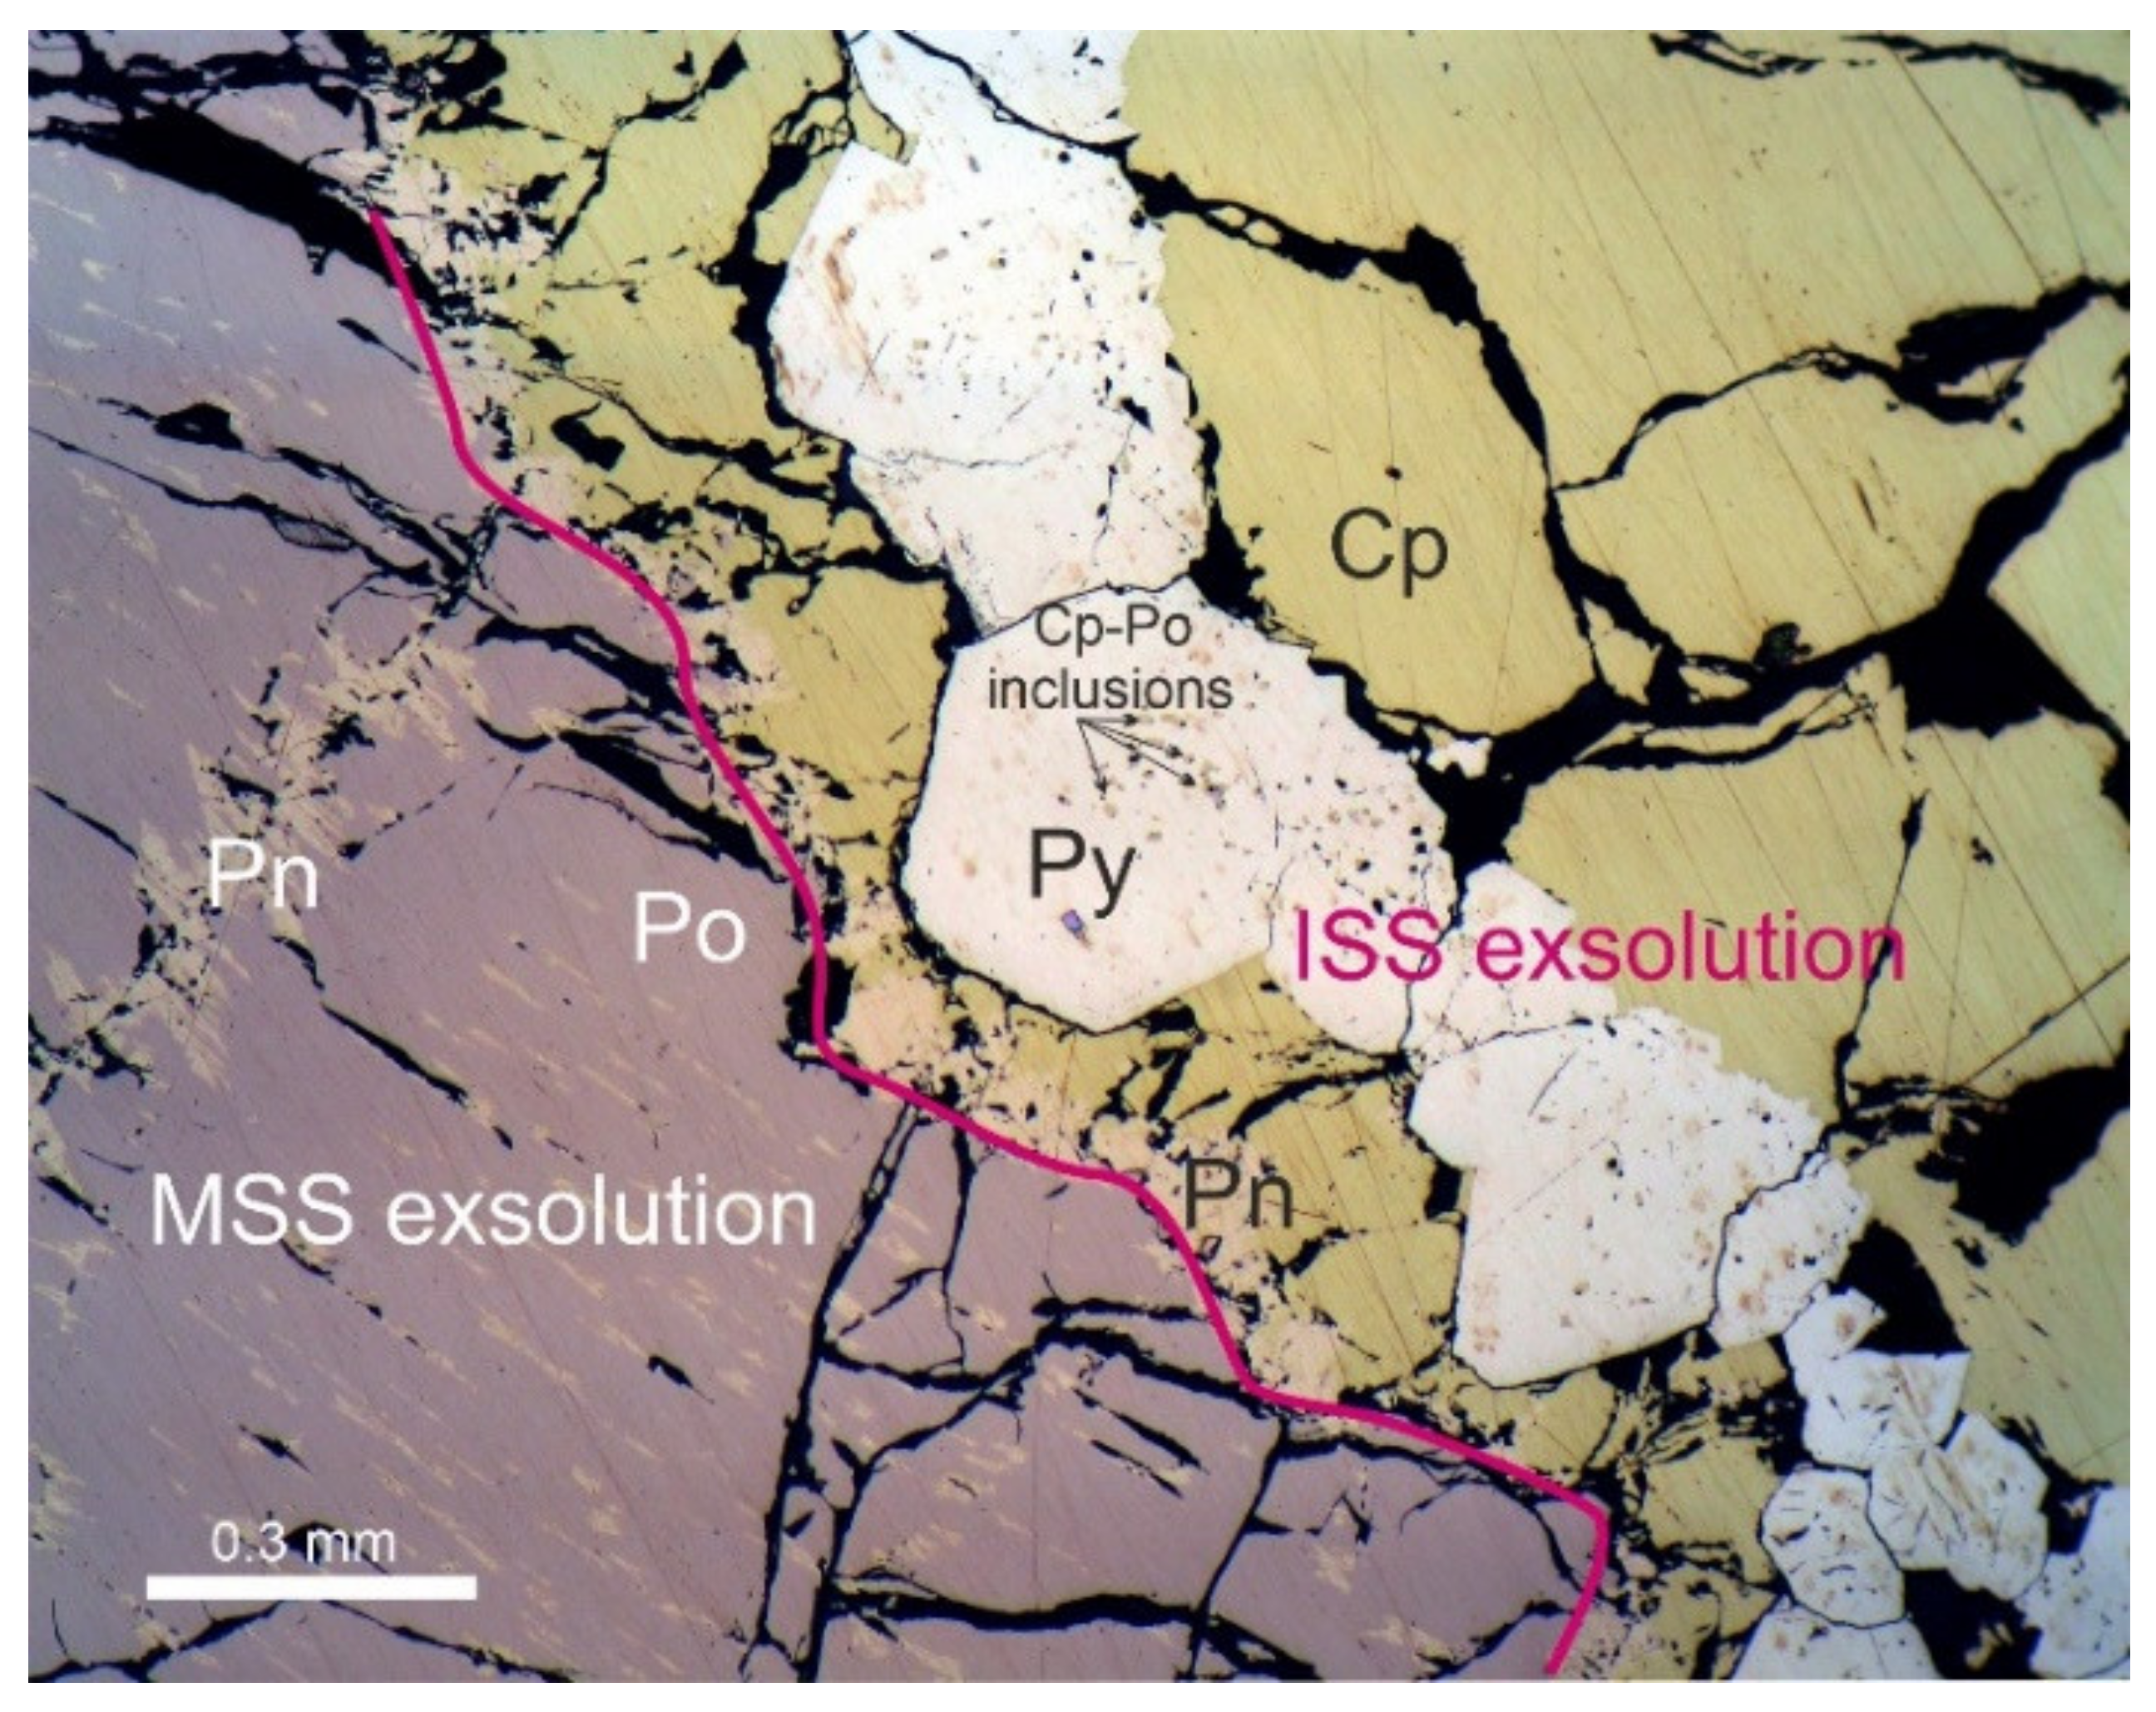
3.1. Mineralogical Features and Textures of the Massive Ores
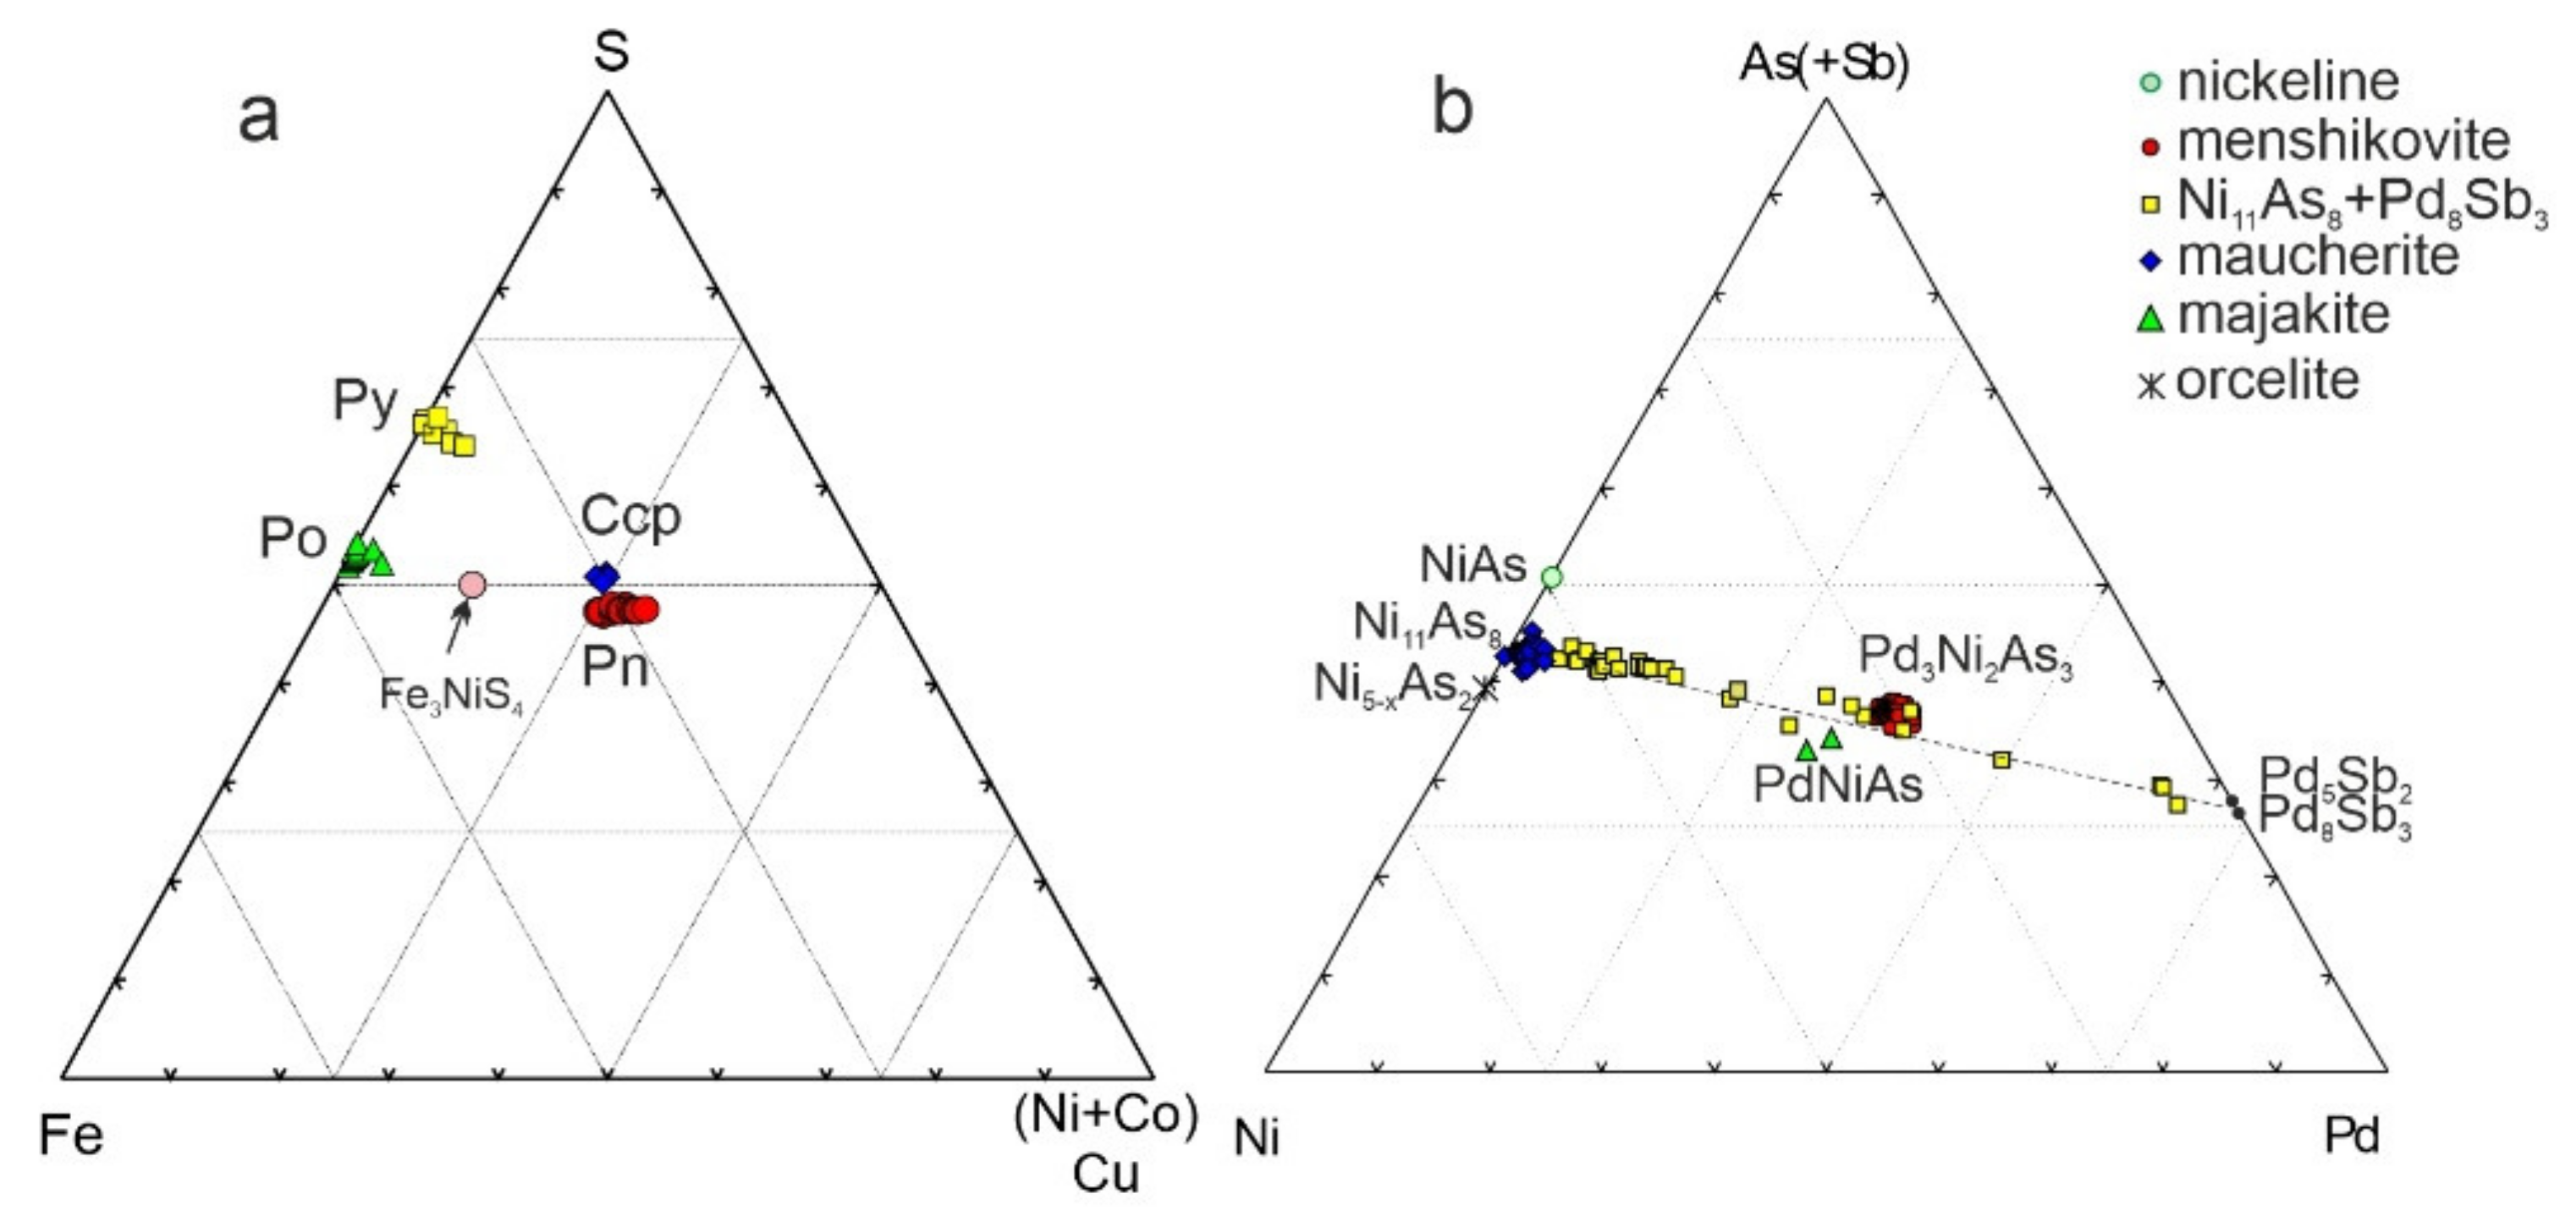
3.2. Composition of the Ore Minerals from the Massive Ores
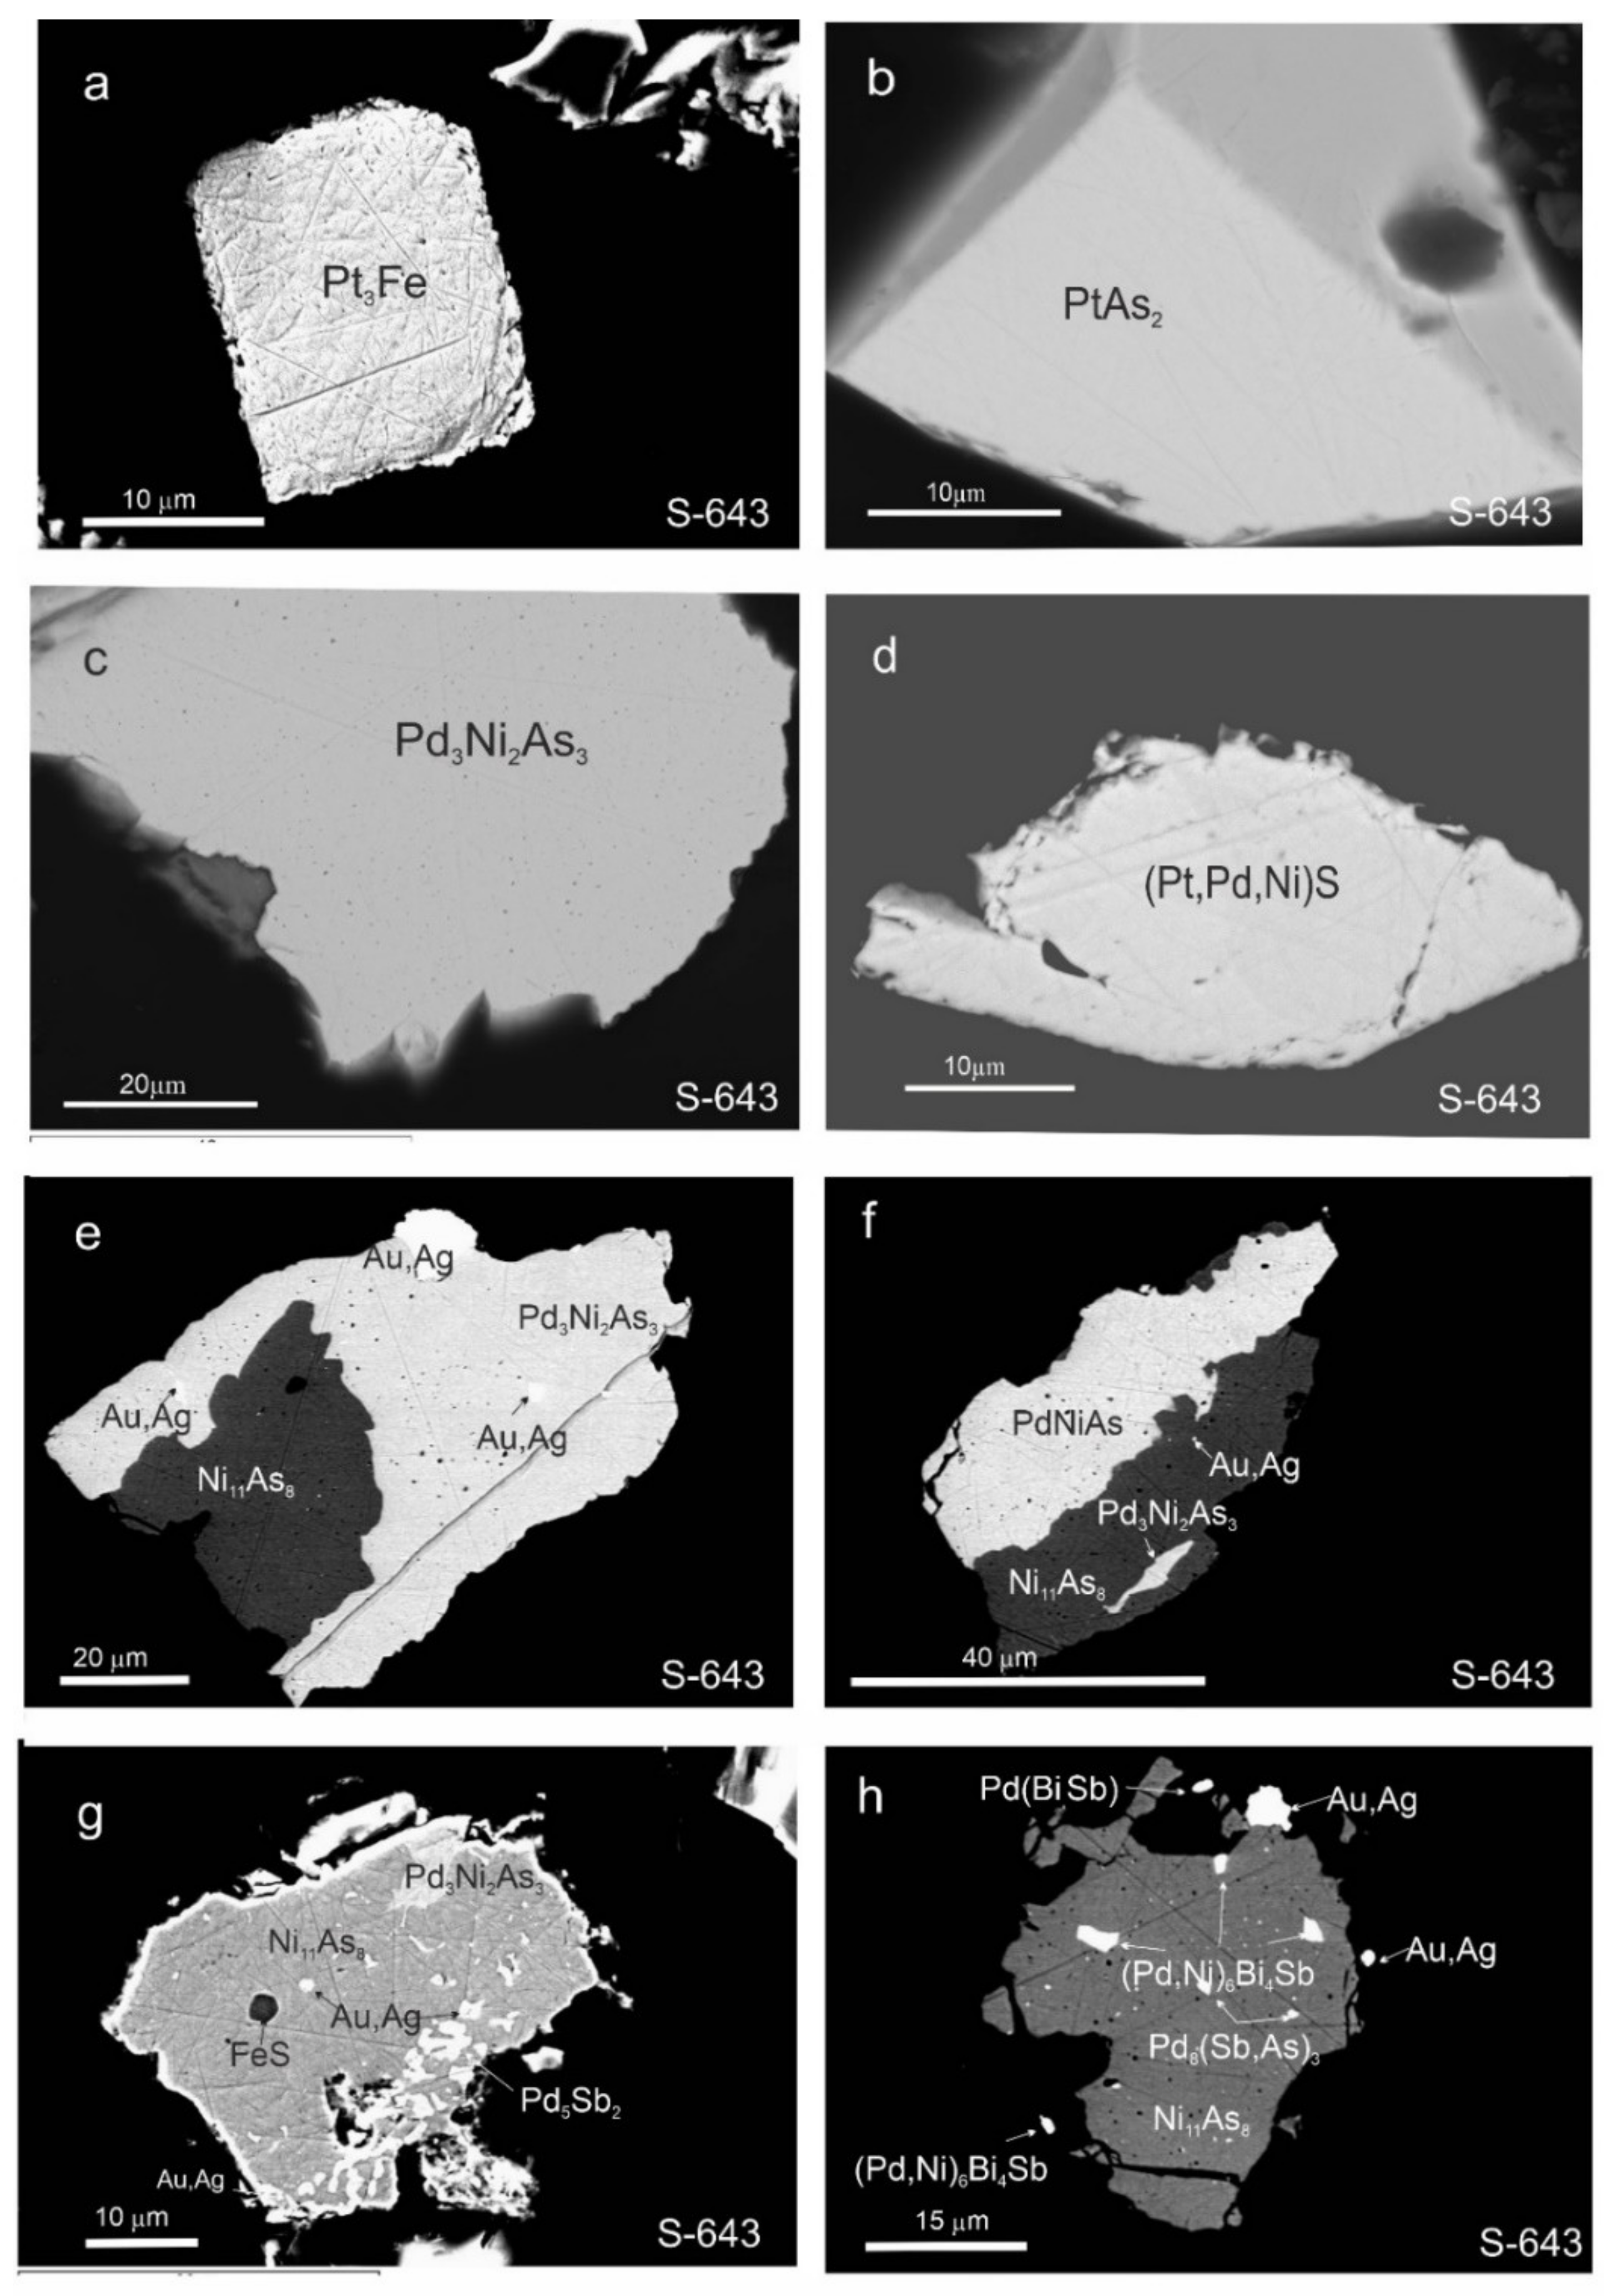
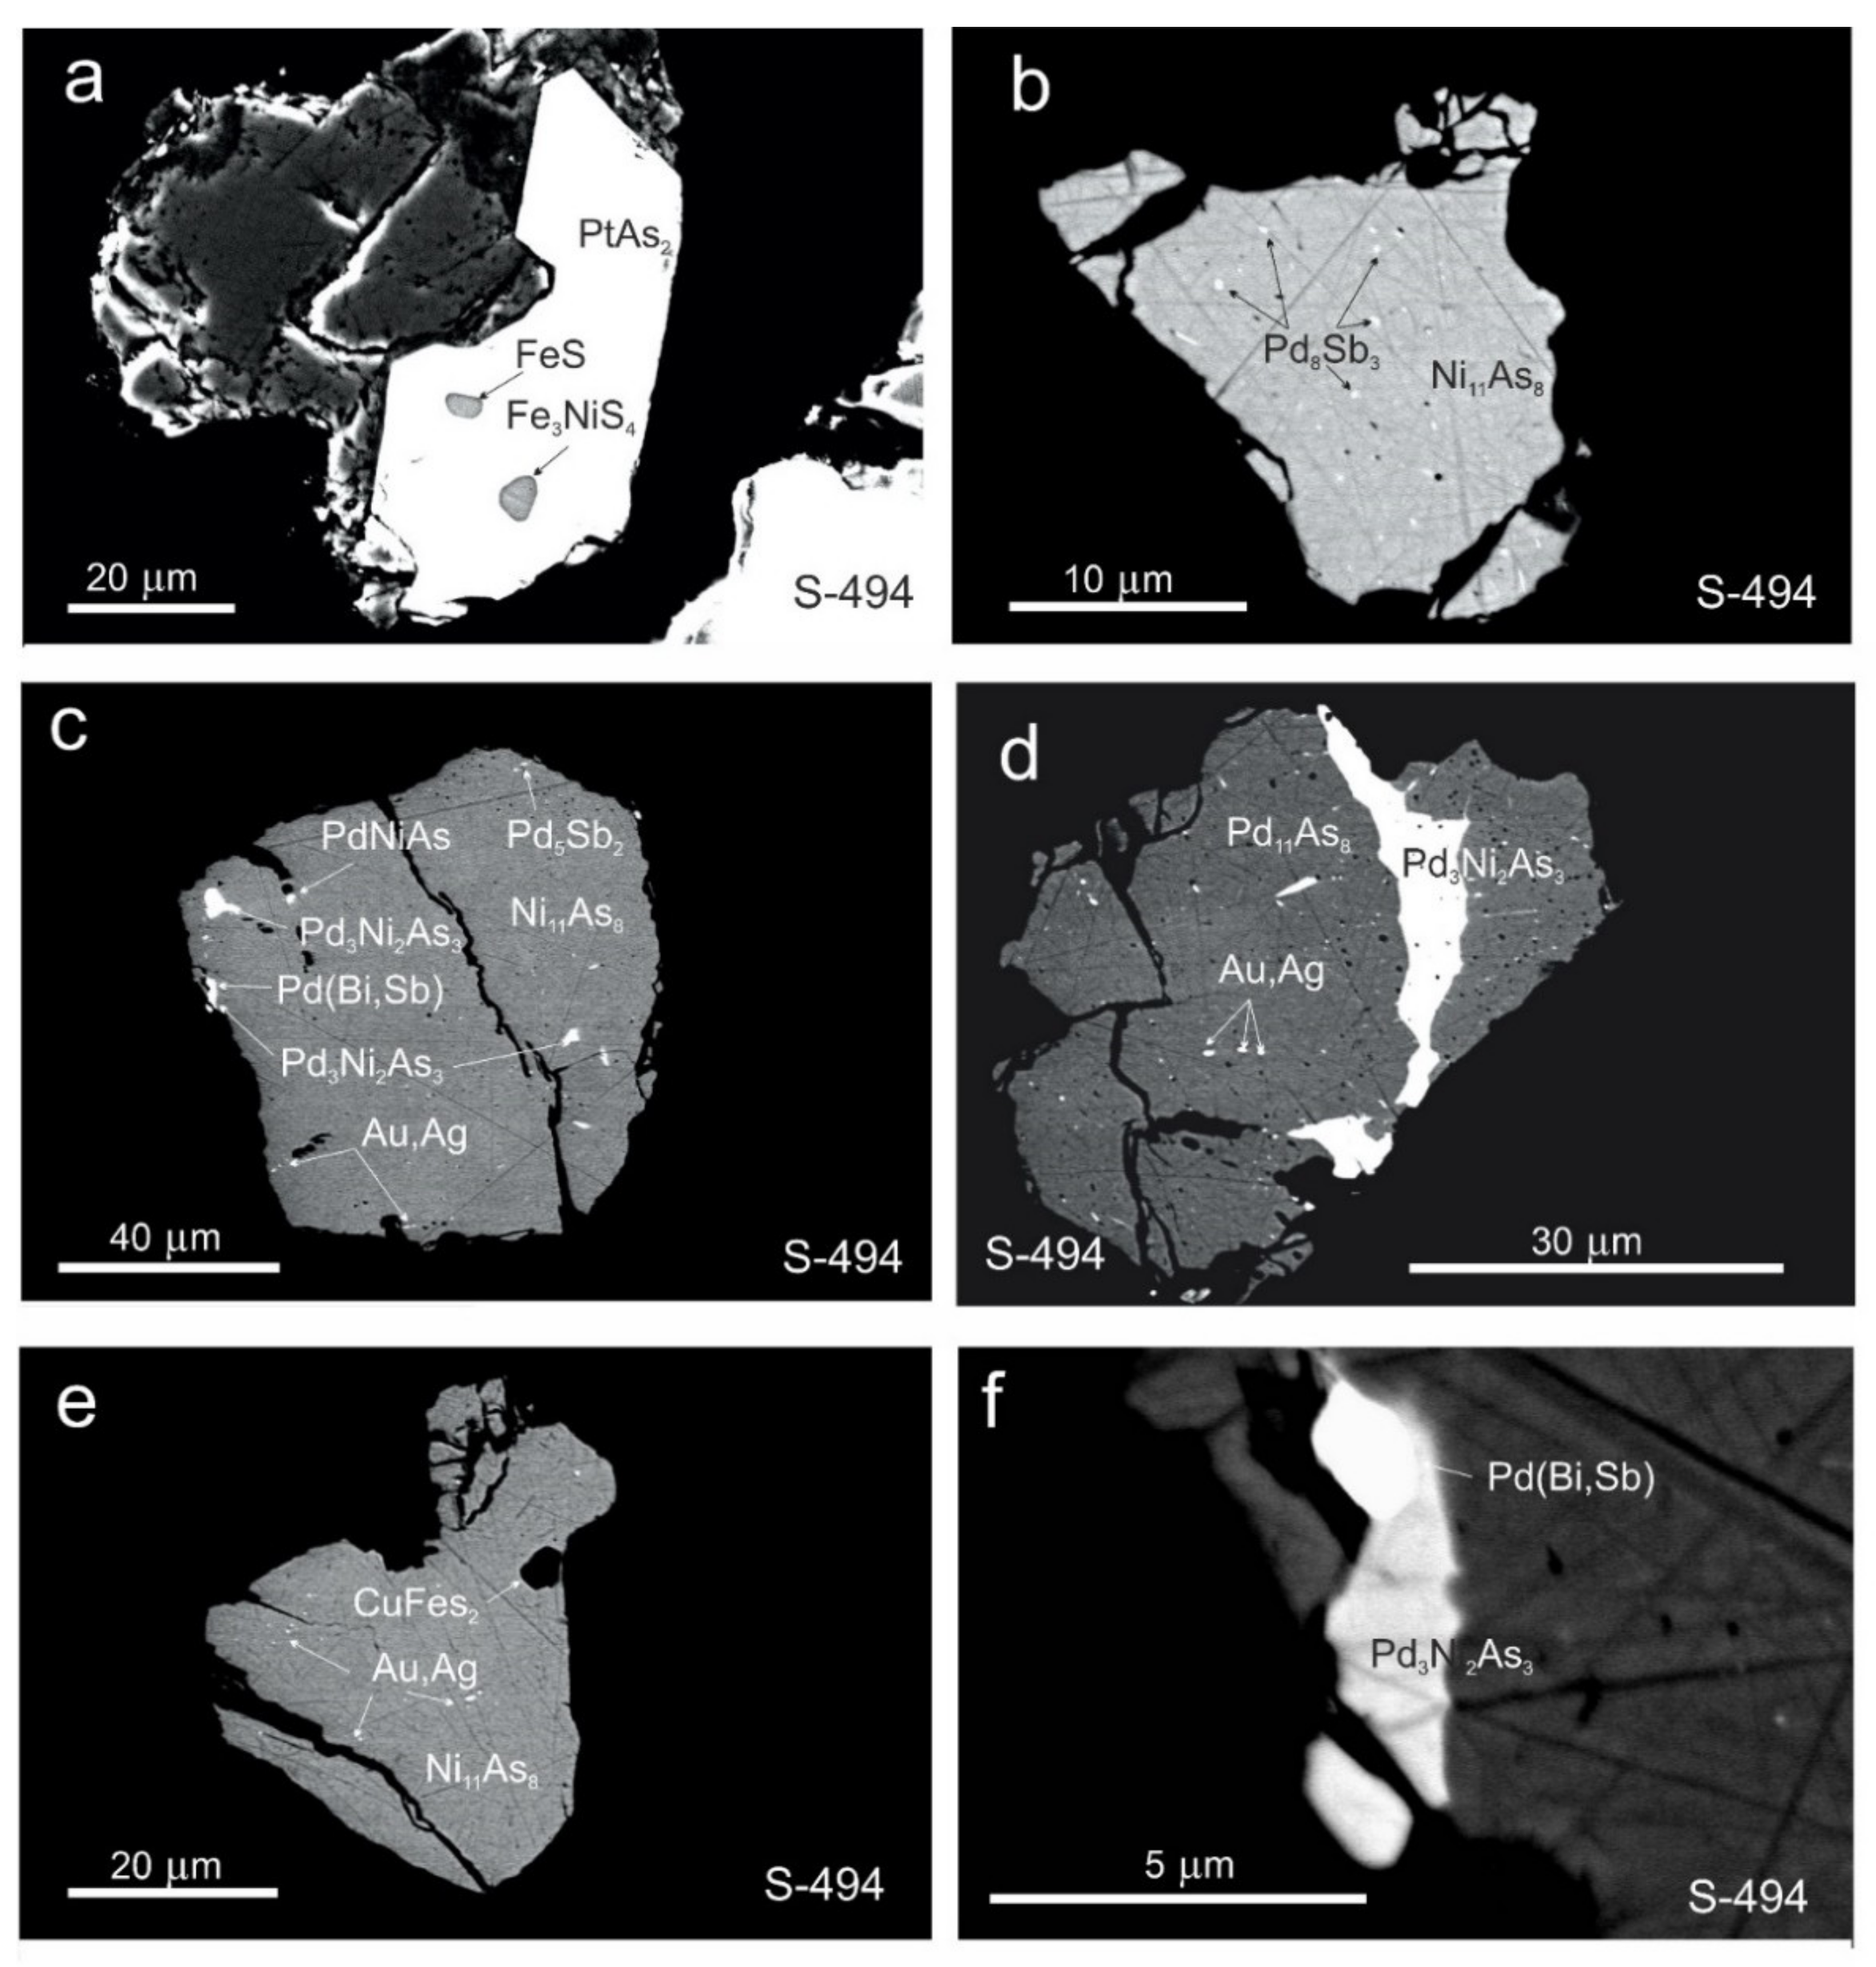
3.3. Morphology and Compositions of PGM
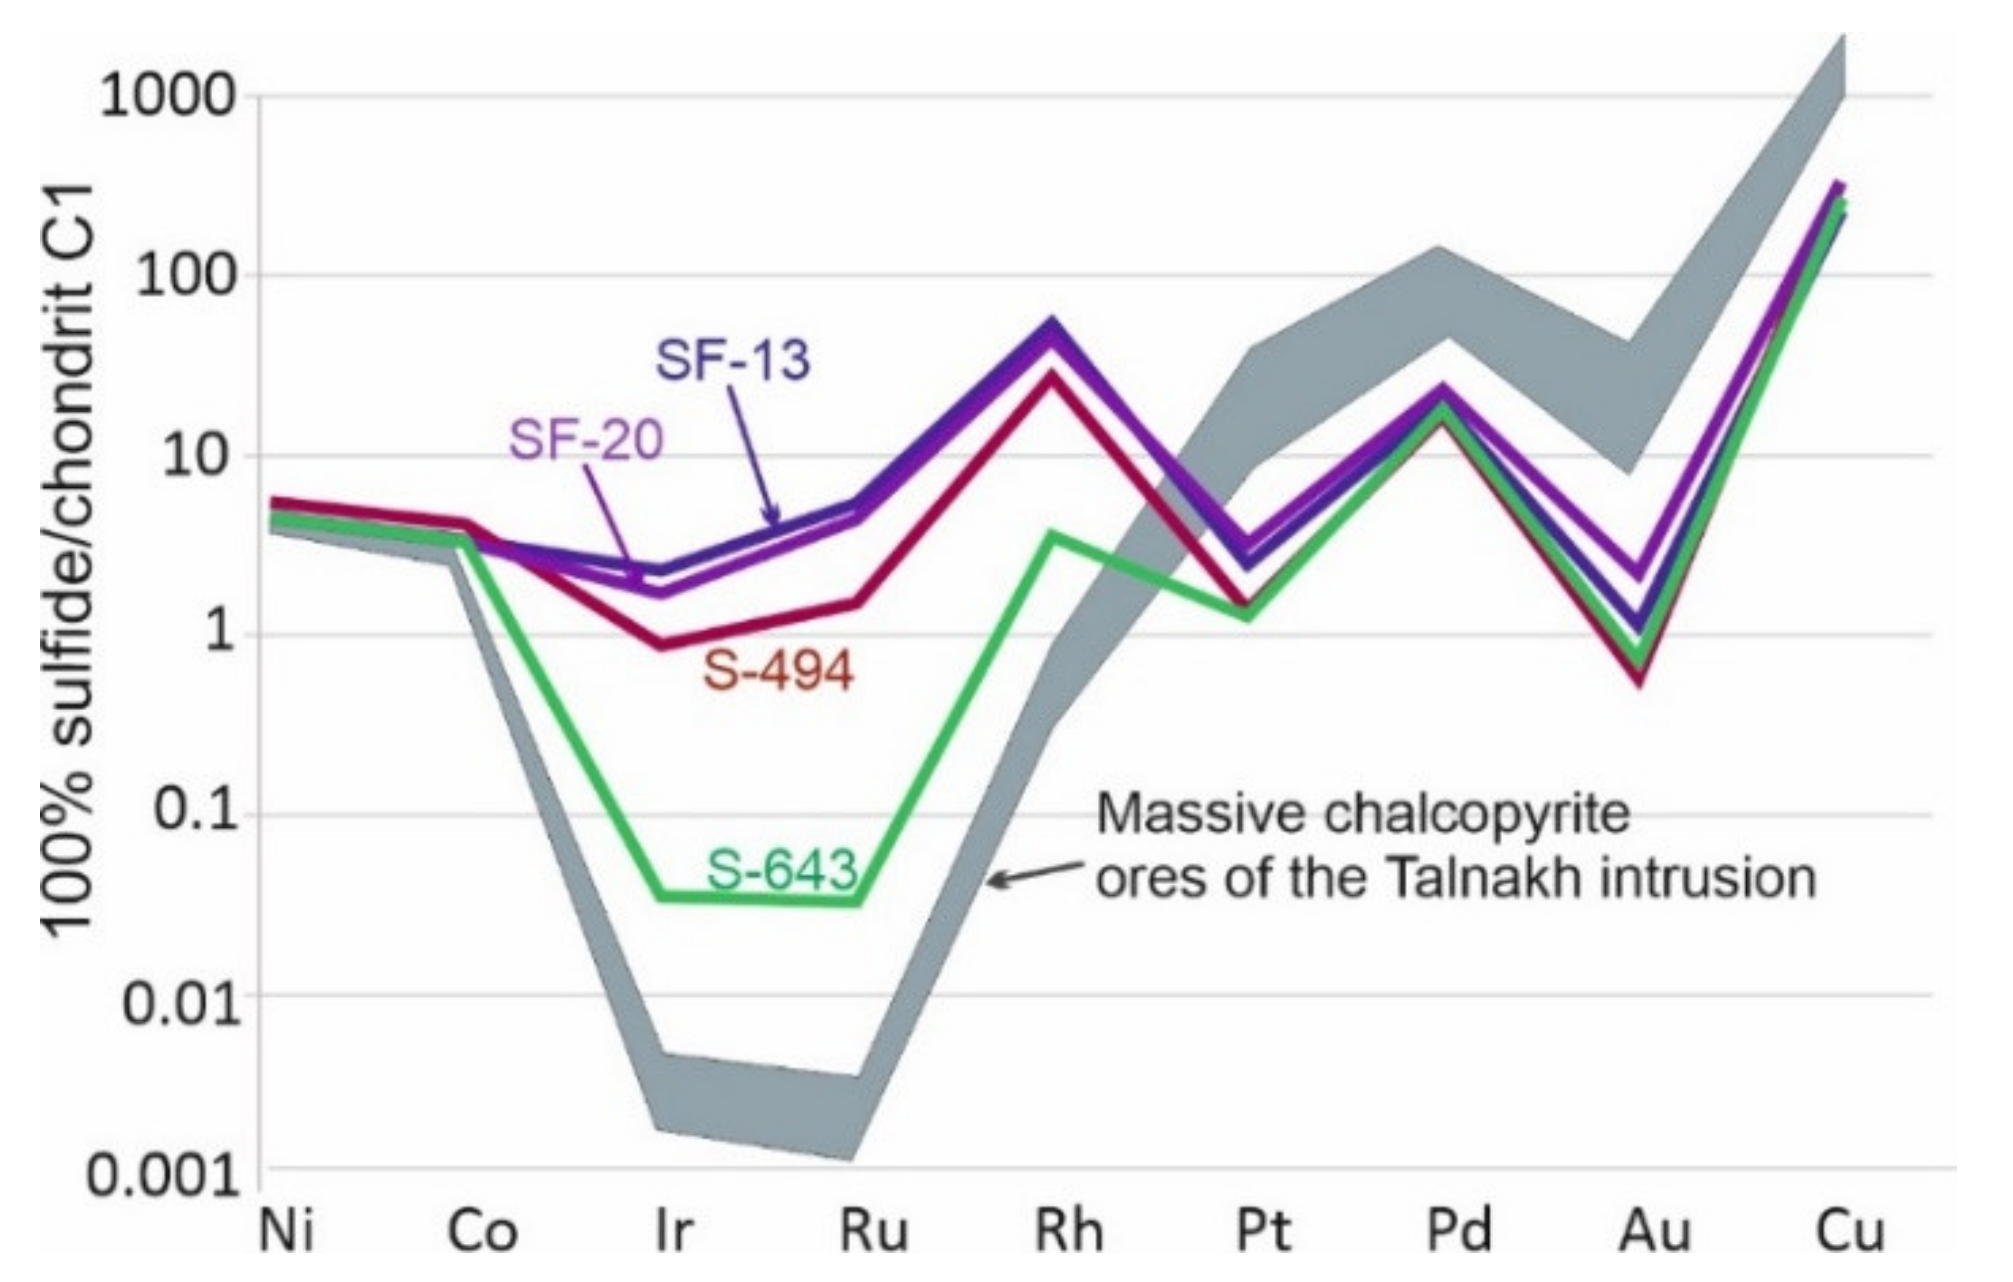
3.4. Geochemical Features of the Massive Ores from the Skalisty Mine
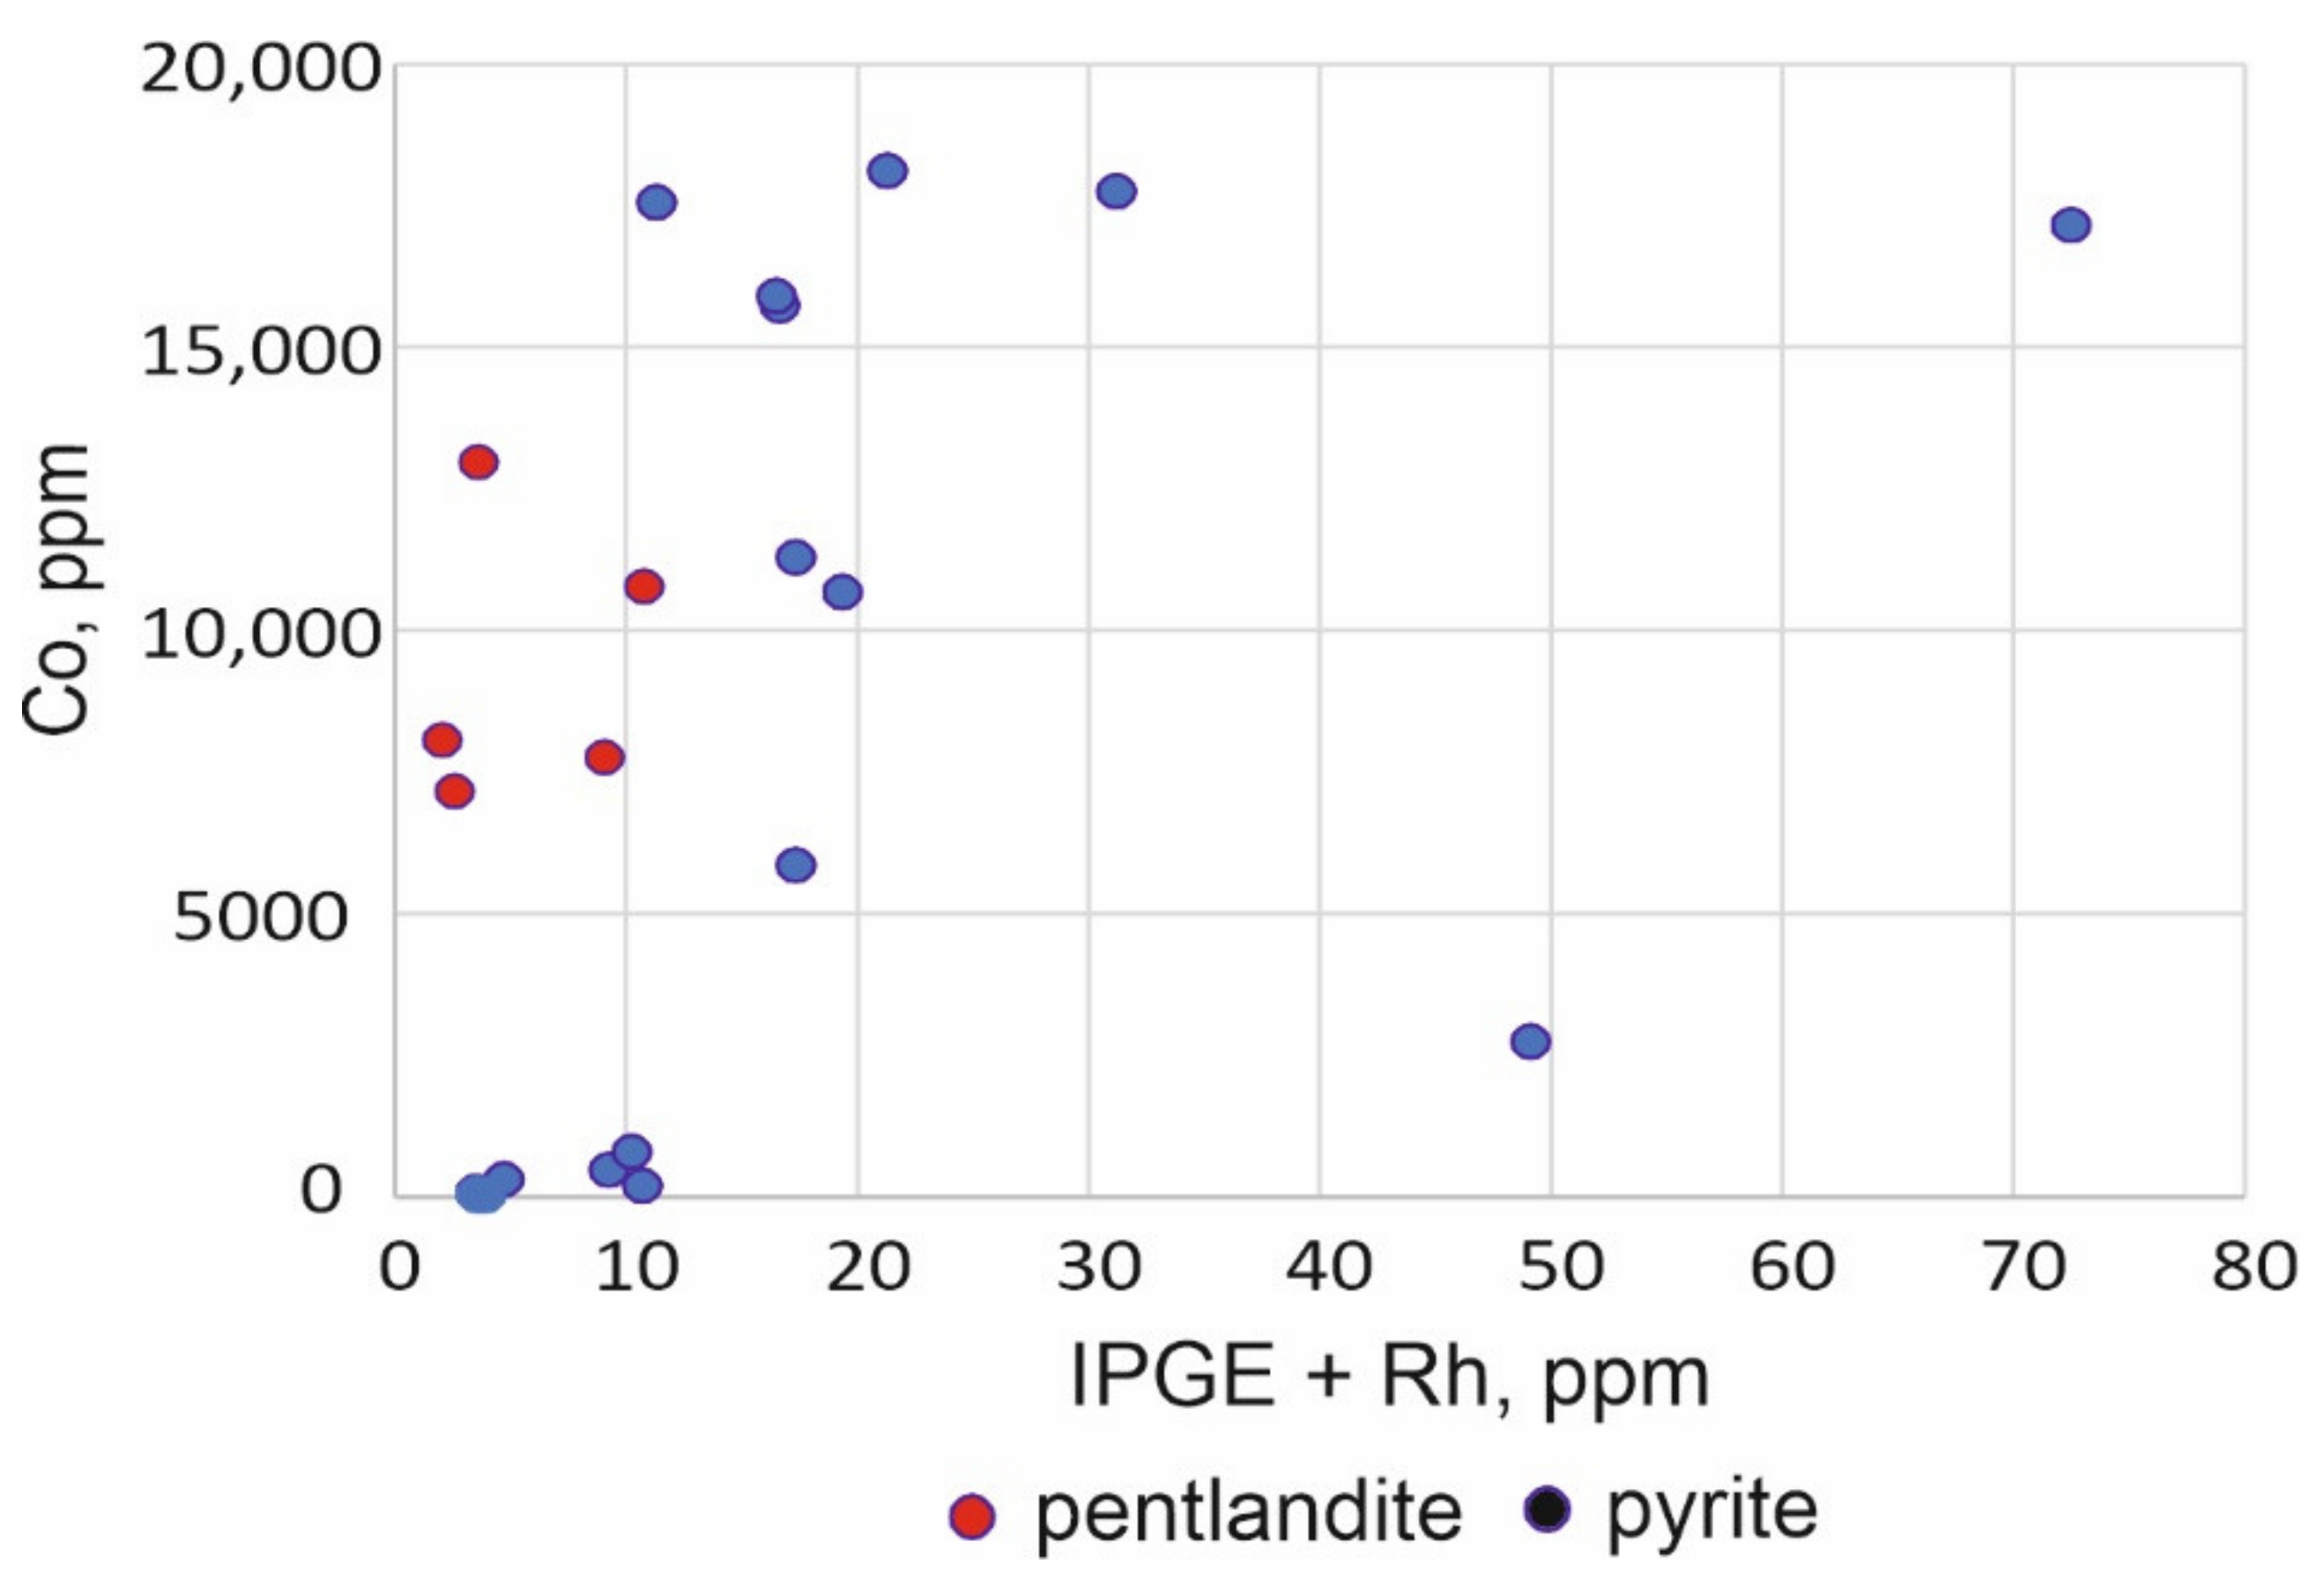
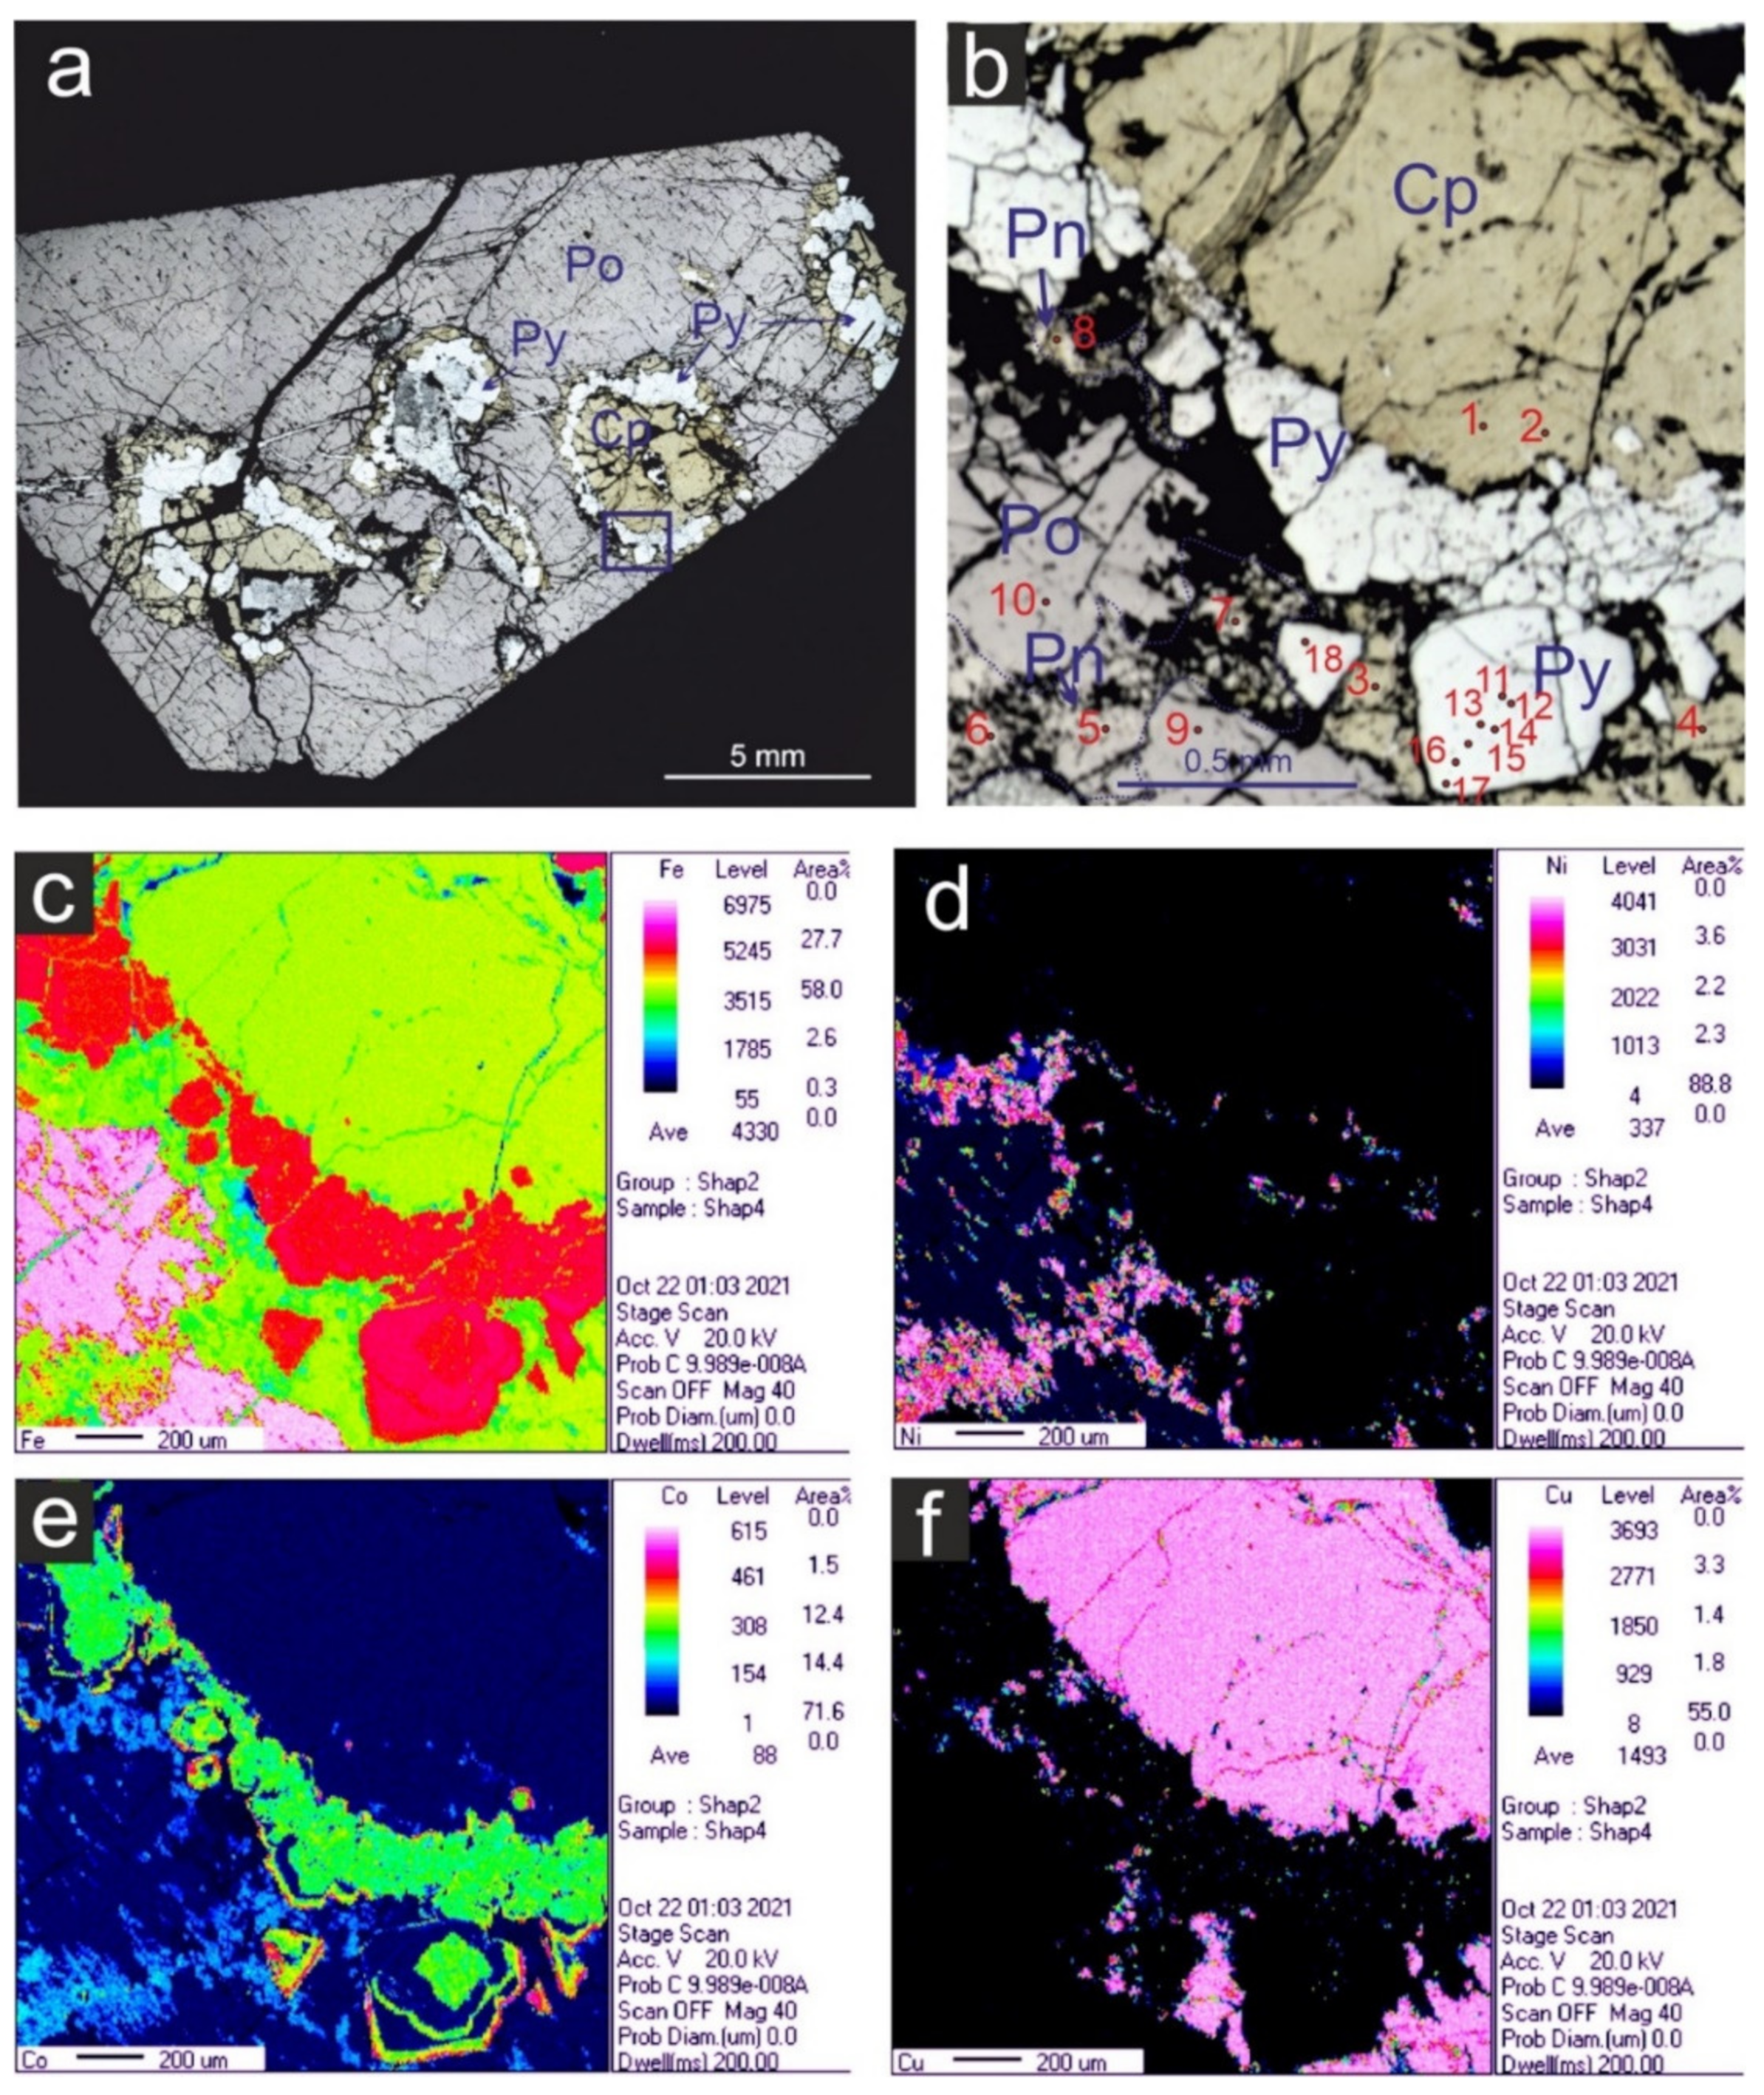
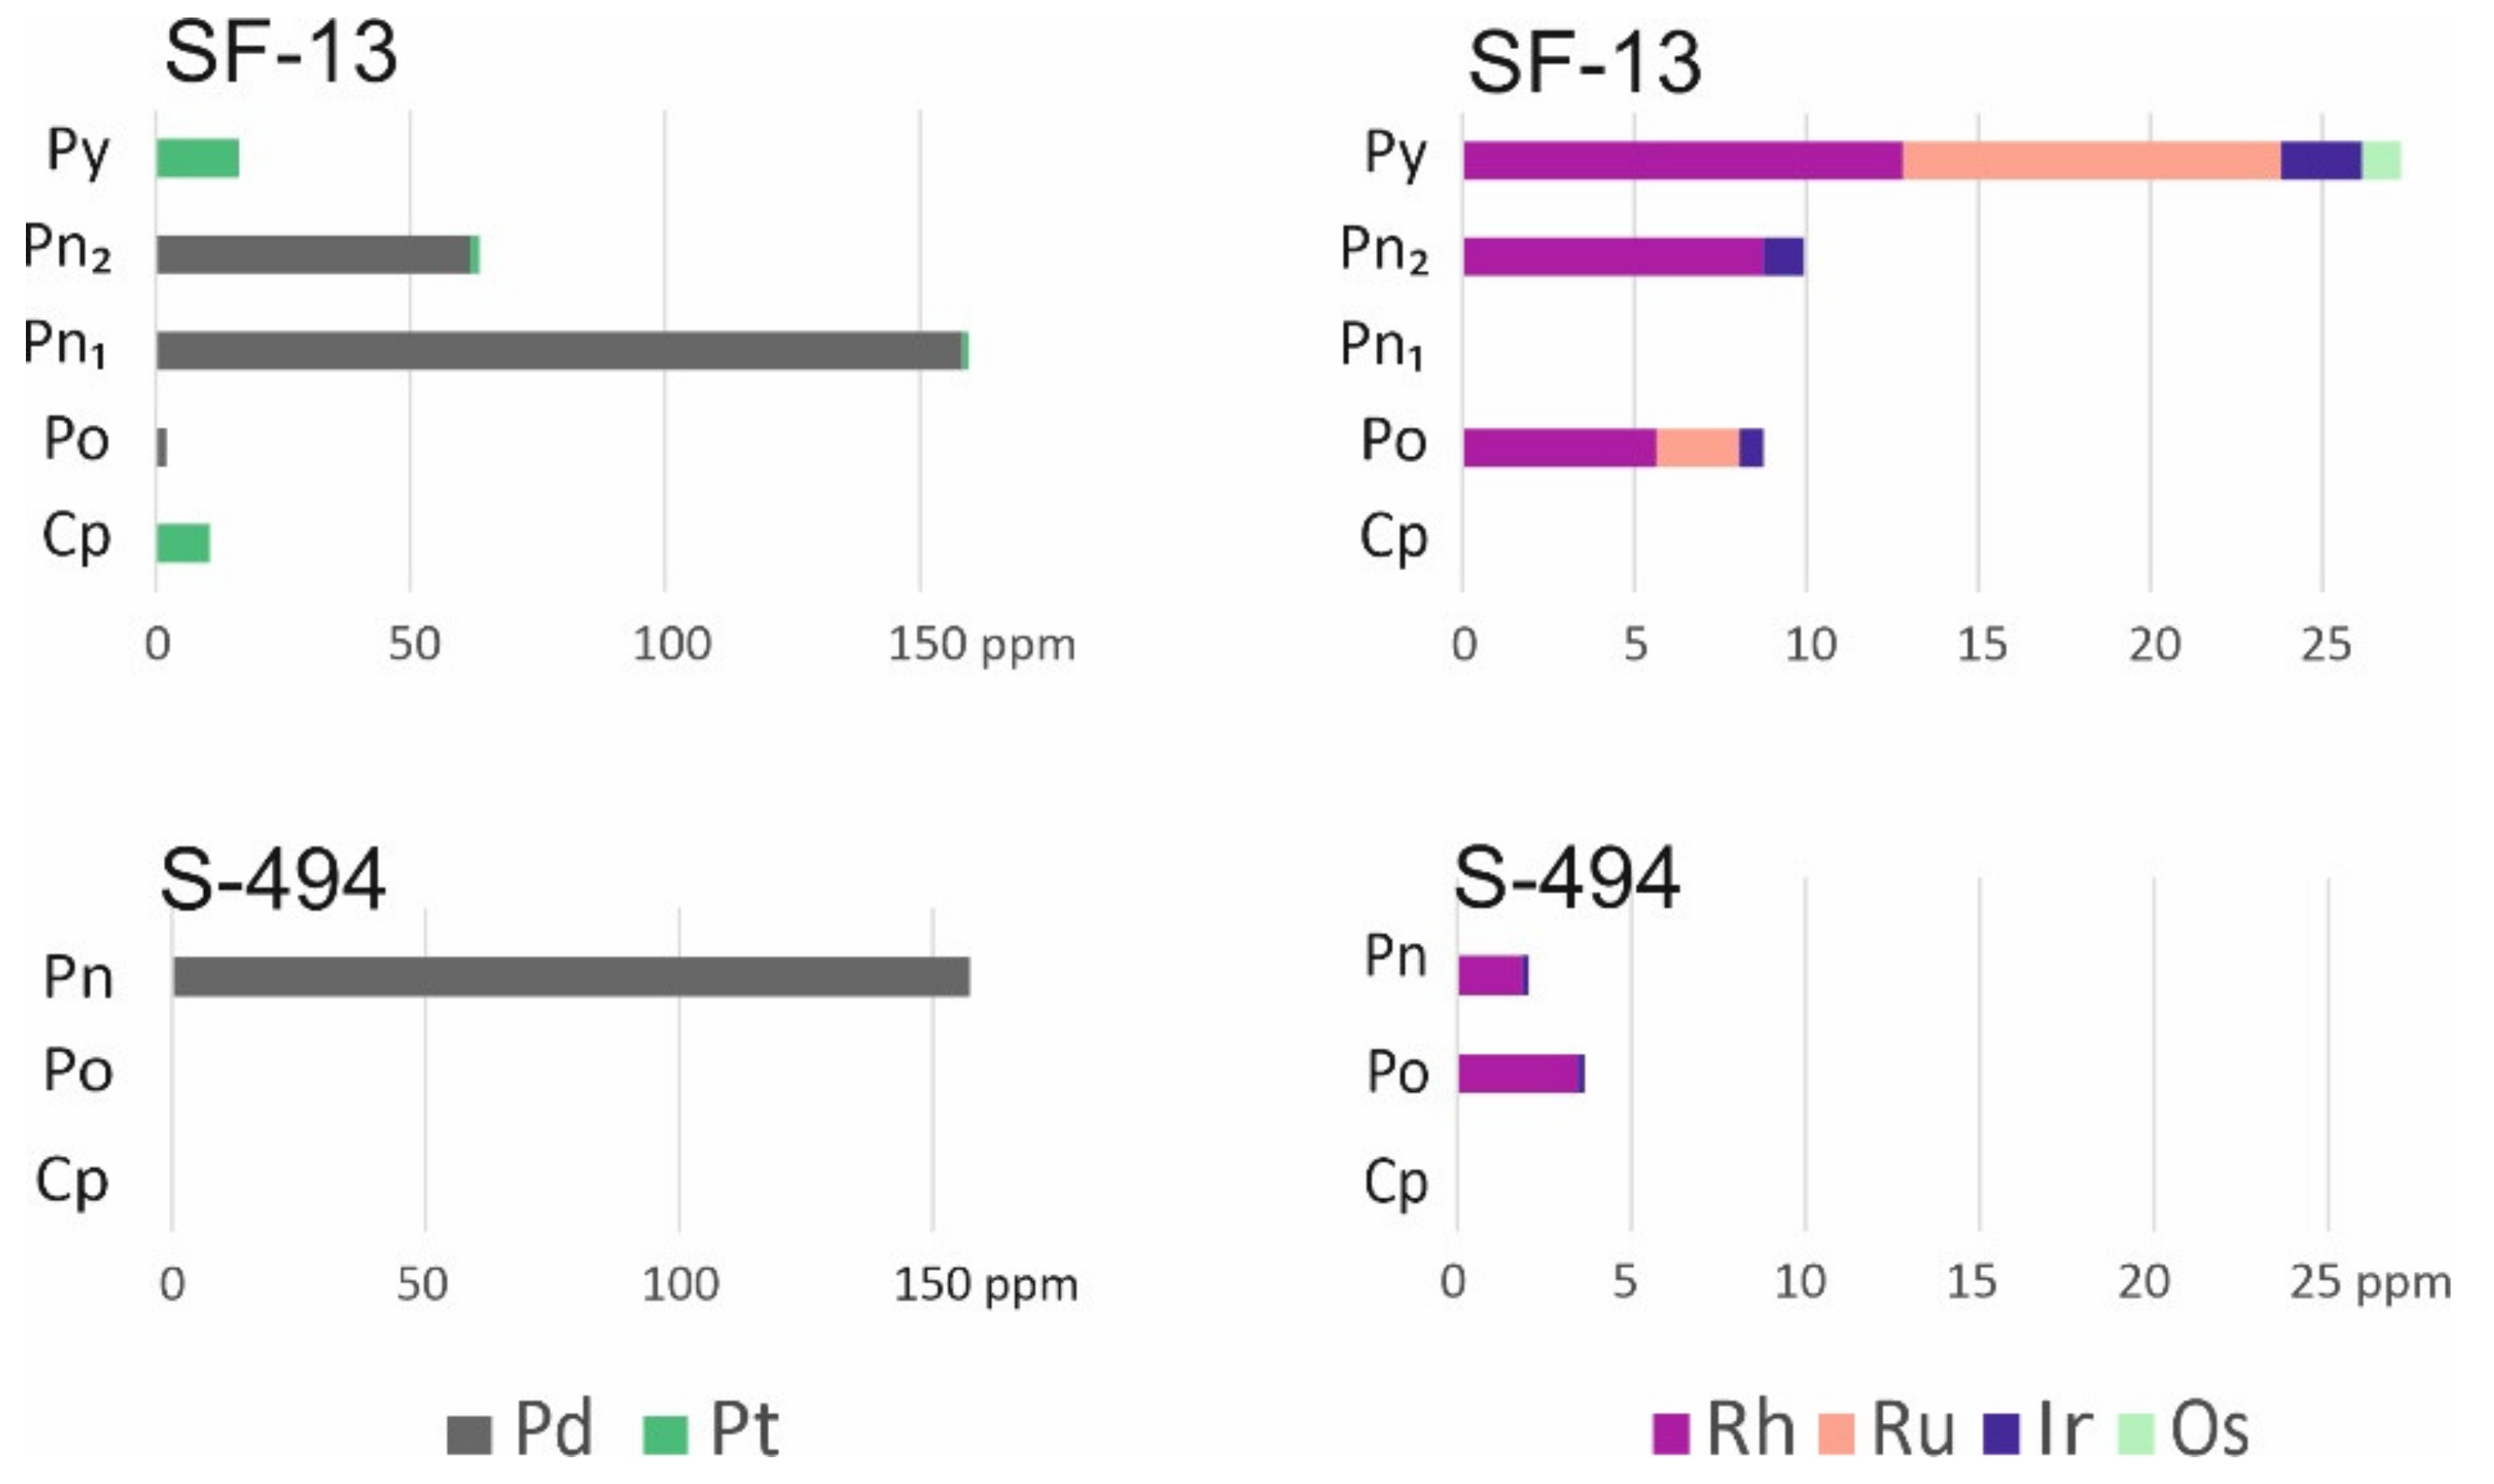
3.5. Distribution of Chalcophile Elements among the Base Metal Sulfides
4. Discussion
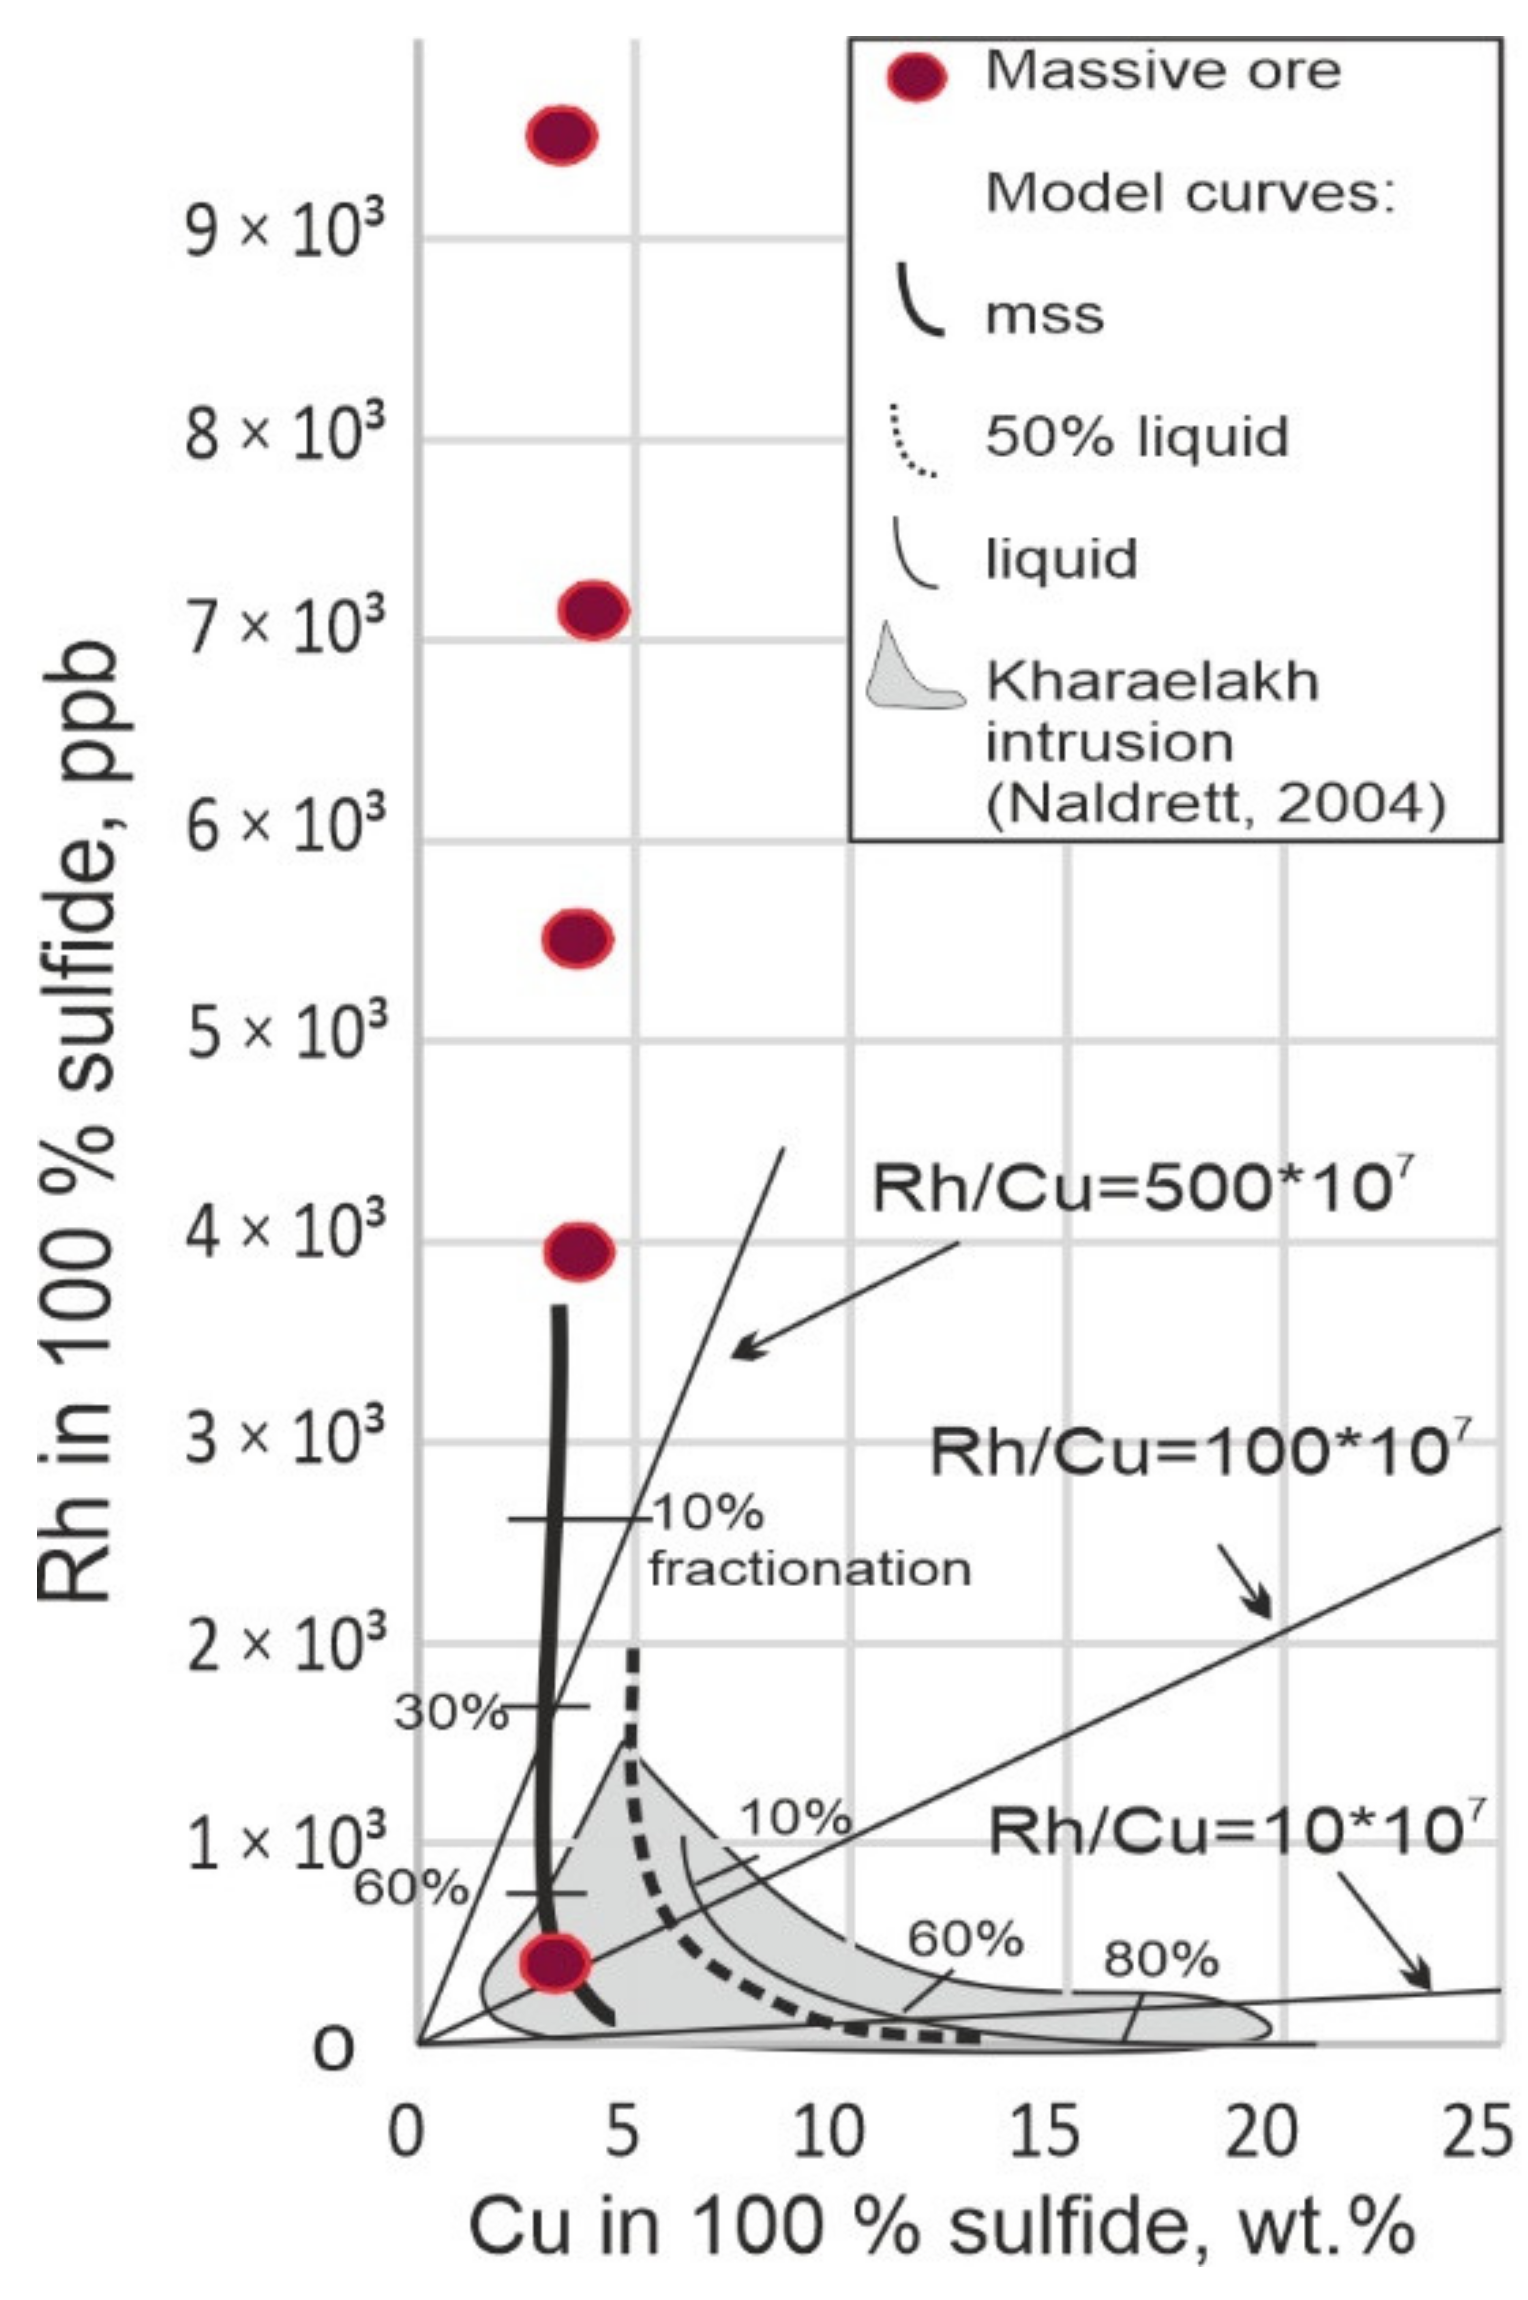
4.1. Degree of Fractionation of the Rh-IPGE Bearing Massive Sulfide Ores
4.2. Composition of Pyrrhotite in the Massive Sulfide Ores
4.3. Evolution of the Sulfide Melt and Mechanism of Pyrite Formation in Weakly Fractionated Ores
4.4. PGE Enrichment of Sulfide Minerals
4.5. Partitioning of PGE among the Different Massive Sulfide Ores
4.6. Conditions Controlling the Formation of PGM
4.7. The Problem of Forming IPGE-Rich Ores
5. Conclusions
- Pyrrhotite (or Cu-poor) massive ores of the eastern flank of the Skalisty mine are unique in terms of their mineralogical and geochemical features. They are significantly enriched in IPGE (with totals of Ir + Rh + Ru up to 12.25 ppm), unlike other ores of the Norilsk ore cluster. Samples from these ores show a variable degree of fractionation: from non-fractionated (SF-13) to weakly fractionated (SF-20), and further to increasingly fractionated S-494 and S-643. The last two are characterized by Ni speciation and high As and Sb potential in the ore-forming system: maucherite, menshikovite, majakite, and mertieite II—the most common PGM.
- By increasing the degree of fractionation of the sulfide melt, the IPGE Content decreases, while the Pd Content increases. In the non-fractionated ores (SF-13 and SF-20), discrete PGM grains are absent, and all PGE (significant ore grades) are concentrated (dissolved) only in sulfides, while in more fractionated ores PGE may be in the form of discrete PGMs and (or) as solid solutions in sulfides.
- The most important IPGE concentrator in the massive pyrrhotite ores of the Skalisty mine is pyrite, which appears only in the unfractionated SF-13 ores, and it contains up to 4.77 ppm Os, 6.89 ppm Ir, 38.26 ppm Ru, 36 ppm Rh, and 62.56 ppm Pt. This pyrite does not show any signs of hydrothermal reworking and is thought to have a magmatic origin.
- High IPGE Contents in the sulfide melt can be due to several reasons: (1) a high degree of partial melting of the mantle, (2) enrichment in IPGE due to impulses of low-grade magma, or (3) in situ fractionation of the sulfide melt, i.e., in the magma chamber, and subsequent removal of a more fractionated residual melt to the periphery, favoring IPGE enrichment in MSS.
Author Contributions
Funding
Acknowledgments
Conflicts of Interest
Appendix A

| Isotope | 59Co | 60Ni | 65Cu | 66Zn | 75As | 77Se | 107Ag | 191Ir | 195Pt | 206Pb | 209Bi |
|---|---|---|---|---|---|---|---|---|---|---|---|
| ppm | ppm | ppm | ppm | ppm | ppm | ppm | ppm | ppm | ppm | ppm | |
| Value 1 | 636 | 25,000 | 23,000 | 275 | 1050 | 310 | 155 | 60 | 50 | 90 | 120 |
| Value 2 | 60 | 97 | 134,000 | 210,000 | 65 | 51 | 50 | 63 | 52 | 68 | 60 |
| Average value n = 9 | 65.9 | 112.7 | 154,089 | 187,489 | 59.28 | 68.3 | 50.71 | 62.87 | 55.22 | 79.36 | 72.53 |
| SD | 5.8 | 11.91 | 14,171 | 24,429 | 9.4 | 8.58 | 2.57 | 5.43 | 7.13 | 4.16 | 3.24 |
| RSD.% | 8.79 | 10.56 | 9.2 | 13.03 | 13.76 | 16.92 | 4.03 | 8.64 | 12.92 | 5.24 | 4.47 |
| E.% | 8.95 | 13.96 | 13.04 | 12.01 | 4.83 | 0.57 | 21.58 | 0.21 | 5.84 | 14.31 | 17.28 |
References
- Naldrett, A.J. Magmatic Sulphide Deposits: Geology, Geochemistry and Exploration; Springer: Berlin/Heidelberg, Germany, 2004; p. 730. [Google Scholar]
- Rad’ko, V.A. Facies of Intrusive and Effusive Magmatism in the Norilsk Area; VSEGEI: St. Petersburg, Russia, 2016; p. 225. (In Russian) [Google Scholar]
- Godlevsky, M.N. Traps and Ore-Bearing Intrusions of the Noril’sk District; Gosgeoltekhizdat: Moscow, Russia, 1959. (In Russian) [Google Scholar]
- Genkin, A.D. The Minerals of Platinum Group Metals and Their Associations in the Copper-Nickel Ores of Norilsk Deposits; Nauka: Moscow, Russia, 1968. (In Russian) [Google Scholar]
- Genkin, A.D.; Distler, V.V.; Gladyshev, G.D.; Filimonova, A.A.; Evstigneeva, T.L.; Kovalenker, V.A.; Smirnov, A.V.; Grokhovskaya, T.L. Sulfide Copper-Nickel Ores of the Noril’sk Deposits; Nauka: Moscow, Russia, 1981. (In Russian) [Google Scholar]
- Genkin, A.D.; Evstigneeva, T.L. Associations of platinum-group minerals of the Noril’sk Copper-Nickel sulfide ores. Econ. Geol. 1986, 81, 1203–1212. [Google Scholar] [CrossRef]
- Distler, V.V.; Genkin, A.D.; Filimonova, A.A.; Hitrov, V.G.; Laputina, I.P. The zoning of copper-nickel ores of Talnakh and Oktyabrsky deposits. Geol. Ore Depos. 1975, 2, 16–27. (In Russian) [Google Scholar]
- Distler, V.V.; Grokhovskaya, T.L.; Evstigneeva, T.L.; Sluzhenikin, S.F.; Filimonova, A.A.; Dyuzhikov, O.A. Petrology of Magmatic Sulfide Ore Formation; Nauka: Moscow, Russia, 1988. (In Russian) [Google Scholar]
- Distler, V.V.; Sluzhenikin, S.F.; Cabri, L.J.; Krivolutskaya, N.A.; Turovtsev, D.M.; Golovanova, T.I.; Mokhov, A.V.; Knauf, V.V.; Oleshkevich, O.I. The platinum ore of the Norilsk layered intrusions: The ratio of magmatic and fluid Content of noble metals. Geol. Ore Depos. 1999, 41, 241–265. (In Russian) [Google Scholar]
- Likhachev, A.P. Platinum-Copper-Nickel and Platinum Deposits; Eslan: Moscow, Russia, 2006; p. 496. (In Russian) [Google Scholar]
- Sluzhenikin, S.F. Sulfide-Low Platinum Mineralization in Differentiated Basite-Hyperbasite Intrusions of the Noril’sk Region. Ph.D. Thesis, Moscow Institute of Geology of Ore Deposits, Petrography, Mineralogy and Geochemistry, Russian Academy of Sciences, Moscow, Russia, 2000. (In Russian). [Google Scholar]
- Sluzhenikin, S.F.; Krivolutskaya, N.A.; Rad’ko, V.A.; Malitch, K.N.; Distler, V.V.; Fedorenko, V.A. Ultramafic-Mafic Intrusions, Volcanic Rocks and PGE-Cu-Ni Sulfide Deposits of the Noril’sk Province, Polar Sibiria. Field Trip Guidebook; Institute of Geology of Ore Deposits, Petrography, Mineralogy and Geochemistry UB RAS: Ykaterinburg, Russia, 2014. [Google Scholar]
- Ryabov, V.V.; Shevko, A.Y.; Gora, M.P. Magmatic Formations in Noril’sk Region; Trapp Petrology, Nonparel Rublisher: Novosibirsk, Russia, 2000; Volume 1. (In Russian) [Google Scholar]
- Li, C.S.; Ripley, E.M.; Naldrett, A.J. A new genetic model for the giant Ni-Cu-PGE sulfide deposits associated with the Siberian flood basalts. Econ. Geol. 2009, 104, 291–301. [Google Scholar] [CrossRef]
- Dodin, D.A.; Sluzhenikin, S.F.; Bogomolov, M.A. Ores and Minerals of the Noril’sk Region; The Studio “Polar Star”: Moscow, Russia, 2009; p. 230. (In Russian) [Google Scholar]
- Krivolutskaya, N.A. Evolution of Trap Magmatism and Pt-Cu-Ni Mineralization in the Noril’sk Area; KMK: Moscow, Russia, 2014. (In Russian) [Google Scholar]
- Krivolutskaya, N.A.; Tolstykh, N.D.; Kedrovskaya, T.B.; Naumov, K.S.; Kubrakova, I.V.; Tutunnik, O.A.; Gongalsky, B.I.; Kovalchuk, E.V.; Magazina, L.O.; Bychkova, Y.V. World-Class PGE-Cu-Ni Talnakh Deposit: Nw Data on the Structure and Unique mineralization of the South-Western Branch. Minerals 2018, 8, 124. [Google Scholar] [CrossRef] [Green Version]
- Duran, C.J.; Barnes, S.-J.; Pleše, P.; Prašek, M.K.; Zientek, M.L.; Pagé, P. Fractional crystallization-induced variations in sulfides from the Noril’sk-Talnakh mining district (polar Siberia, Russia). Ore Geol. Rev. 2017, 90, 326–351. [Google Scholar] [CrossRef]
- Tolstykh, N.D.; Zhitova, L.M.; Shapovalova, M.O.; Chayka, I.F. The evolution of the ore-forming system in the low sulphide horizon of the Noril’sk 1 intrusion, Russia. Miner. Mag. 2019, 83, 673–694. [Google Scholar] [CrossRef]
- Tolstykh, N.; Shvedov, G.; Polonyankin, A.; Korolyuk, V. Geochemical features and mineral associations of differentiated rocks of the Norilsk 1 intrusion. Minerals 2020, 10, 688. [Google Scholar] [CrossRef]
- Tolstykh, N.; Krivolutskaya, N.; Safonova, I.; Shapovalova, M.; Zhitova, L.; Abersteinerd, A. Unique Cu-rich sulphide ores of the Southern-2 orebody in the Talnakh Intrusion, Noril’sk area (Russia): Geochemistry, mineralogy and conditions of crystallization. Ore Geol. Rev. 2020, 122, 103525. [Google Scholar] [CrossRef]
- Barnes, S.J.; Malitch, K.N.; Yudovskaya, M.A. Introduction to a Special Issue on the Norilsk-Talnakh Ni-Cu-Platinum Group Element Deposits. Econ. Geol. 2020, 115, 1157–1172. [Google Scholar] [CrossRef]
- Distler, V.; Kunilov, V. Geology and ore deposits of the Norol’sk Region. In Proceedings of the Seventh International Platinum Symposium; Moskovsky Contact Press: Moscow, Russia, 1994. (In Russian) [Google Scholar]
- Naldrett, A.J.; Fedorenko, V.A.; Asif, M.; Lin, S.; Kunilov, V.E.; Stekhin, A.I.; Lightfoot, P.C.; Gorbachev, N.S. Controls on the composition of Ni-Cu sulfide deposits as illustrated by those at Norilsk, Siberia. Econ. Geol. 1996, 91, 751–773. [Google Scholar] [CrossRef]
- Kalugin, V.; Gusev, V.; Tolstykh, N.; Lavrenchuk, A.; Nigmatulina, E. Origin of the Pd-Rich Pentlandite in the Massive Sulfide Ores of the Talnakh Deposit, Norilsk Region, Russia. Minerals 2021, 11, 1258. [Google Scholar] [CrossRef]
- Stekhin, A.I. Mineralogical and geochemical characteristics of the Cu-Ni ores of the Oktyabr’skoe and Talnakh deposits. In Proceeding of the Norilsk-Sudbury Sumposium; Ontario Geological Survey: Sudbury, ON, Canada, 1994; pp. 231–242. [Google Scholar]
- Dyuzhikov, O.A.; Distler, V.V.; Strunin, B.M. Geplogy and Ore Potential of the Norilsk Ore District; Nauka: Moscow, Russia, 1988; p. 248. (In Russian) [Google Scholar]
- Chen, L.M.; Song, X.Y.; Keays, R.R.; Tian, Y.L.; Wang, Y.S.; Deng, Y.F.; Xiao, J.F. Segregation and Fractionation of Magmatic Ni-Cu-PGE Sulfides in the Western Jinchuan Intrusion. Northwestern China: Insights from Platinum Group Element Geochemistry. Econ. Geol. 2013, 108, 1793–1811. [Google Scholar] [CrossRef]
- Mansur, E.T.; Barnes, S.-J.; Duran, C.J.; Sluzhenikin, S.F. Distribution of chalcophile and platinum-group elements among pyrrhotite, pentlandite, chalcopyrite and cubanite from the Noril’sk-Talnakh ores: Implications for the formation of platinum-group minerals. Miner. Deposit. 2020, 55, 1215–1232. [Google Scholar] [CrossRef]
- Miroshnikova, L.K. Geological and Geochemical Prerequisites and Signs of Localization of Copper-Nickel with Platinoids Mineralization of the Ore-Magmatic System of the Talnakh Ore Sluster. Ph.D. Thesis, Russian State Geological University, Moscow, Russia, 2017; p. 313. (In Russian). [Google Scholar]
- Tolstykh, N.D.; Rad’ko, V.A.; Kamenetsky, V.; Zhitova, L.M. Mineralogical and Geochemical Features of PGE-Cu-Ni mineralization of Talnakh intrusion (Skalisty Mine). In Proceedings of the V International Conference Ultramafic-Mafite Complexes: Geology, Structure, Ore Potential, Ulan-Ude, Russia, 2–6 September 2017; Buryat State University Publishing Department: Gremyachinsk, Russia, 2017; pp. 295–298. (In Russian). [Google Scholar]
- Sluzhenikin, S.F. Platinum-Copper Nickel and Platinum Ores of Norilsk Region and Their Ore Mineralization. Russ. J. Cen. Chem. 2011, 81, 1288–1301. [Google Scholar] [CrossRef]
- Strunin, B.M.; Dyuzhikov, O.A.; Barmina, O.A.; Komarov, V.V. Geological Map of the Norilsk Ore Region at a Scale of 1: 200,000. Explanatory Letter; Publishing House Geoinformmark: Moscow, Russia, 1994; 118 p. (In Russian) [Google Scholar]
- Mansur, E.T.; Barnes, S.-J.; Charley, S.; Duran, J. An overview of chalcophile element contents of pyrrhotite, pentlandite, chalcopyrite, and pyrite from magmatic Ni-Cu-PGE sulfide deposits. Miner. Depos. 2021, 56, 179–204. [Google Scholar] [CrossRef]
- Lavrent’ev, Y.G.; Usova, L.V. New version of the CARAT program for quantitative x-ray spectral microanalysis. J. Anal. Chem. 1994, 49, 417–422. [Google Scholar]
- Korolyuk, V.N.; Usova, L.V.; Nigmatulina, E.N. On the Accuracy of Determing Composition of Principal Rock-Forming Silicates and Oxides with a Jeol JXA-8100 Electron Microprobe. J. Anal. Chem. 2009, 64, 1070–1074. [Google Scholar] [CrossRef]
- Lavrent’ev, Y.G.; Karmanov, N.S.; Usova, L.V. Electron-probe determination of the composition of minerals: Microanalyzer or scanning electron microscope. Russ. Geol. Geophys. 2015, 56, 1154–1161. [Google Scholar] [CrossRef]
- Wilson, S.A.; Ridley, W.I.; Koenig, A.E. Development of sulfide calibration standards for the laser ablation inductively-coupled plasma mass spectrometry technique. J. Anal. Atom. Spectrom. 2002, 17, 406–409. [Google Scholar] [CrossRef]
- Paton, C.; Hellstrom, J.; Paul, B.; Woodhead, J.; Hergt, J. Iolite: Freeware for the visualization and processing of mass spectrometric data. J. Anal. Atom. Spectrom. 2011, 26, 2508–2518. [Google Scholar] [CrossRef]
- Tagle, R.; Berlin, J. A Database of Chondrite Analyses Including Platinum-Group Elements, Ni, Co, Au and Cr: Implications for the Identification of Chrondritic Pro-Jectiles. Meteorit. Planet. Sci. 2008, 43, 541–559. [Google Scholar] [CrossRef]
- Naldrett, A.J.; Duke, J.M. Platinum metals magmatic sulfide ores. Science 1980, 208, 1417–1424. [Google Scholar] [CrossRef]
- Eckstrand, O.R.; Hulbert, L.J. Magmatic nickel-copper-platinum group element deposits. In Mineral Deposits of Canada—A Synthesis of Major Deposit-Types, District Metallogeny, the Evolution of Geological Provinces, and Exploration Methods; Goodfellow, W.D., Ed.; Mineral Deposits Division, Special Publication, Geological Association of Canada: St. John’s, NL, Canada, 2007; Volume 5, pp. 205–222. [Google Scholar]
- Schulz, K.J.; Chandler, V.W.; Nicholson, S.W.; Piatak, N.; Seall, R.R., II; Woodruff, L.G.; Zientek, M.L. Mamatic Sulfide-Rich Nickel-Copper Deposits Related to Picrite and (or) Tholeiitic Basalt Dike-Sill Complexes—A Preliminary Deposit Model; Open-File Report 2010–1179; U.S. Geological Survey: Reston, VA, USA, 2010. [Google Scholar]
- Palyanova, G.A.; Tolstykh, N.D.; Zinina, V.Y.; Koh, K.A.; Seretkin, Y.V.; Bortnikov, N.S. Synthetic gold chalcogenides in the Au-Te-Se-S system and their narural analogs. Dokl. Earth Sci. 2019, 487, 929–934. [Google Scholar] [CrossRef]
- Sluzhenikin, S.F.; Yudovskaya, M.A.; Barnes, S.J.; Abramova, V.D.; Le Vaillant, M.; Petrenko, D.B.; Grigor’eva, A.; Brovchenko, V.D. Low-sulfide platinum group element ores of the Norilsk-Talnakh camp. Econ. Geol. 2020, 115, 1267–1303. [Google Scholar] [CrossRef]
- Dare, S.A.S.; Barnes, S.-J.; Prichard, H.M. The distribution of platinum group elements (PGE) and other chalcophile elements among sulfides from the Creighton Ni-Cu-PGE sulfide deposit, Sudbury, Canada, and the origin of palladium in pentlandite. Miner. Depos. 2010, 45, 765–793. [Google Scholar] [CrossRef]
- Barnes, S.-J.; Staude, S.; Le Vaillant, M.; Piña, R.; Lightfoot, P.C. Sulfidesilicate textures in magmatic Ni-Cu-PGE sulfide ore deposits: Massive, semi-massive and sulfide-matrix breccia ores. Ore Geol. Rev. 2018, 101, 629–651. [Google Scholar] [CrossRef]
- Helmy, H.M.; Botcharnikov, R.; Ballhaus, C.; Deutsch-Zemlitskaya, A.; Wirth, R.; Schreiber, A.; Buhre, S.; Häger, T. Evolution of magmatic sulfide liquids: How and when base metal sulfides crystallize? Contrib. Mineral. Petrol. 2021, 176, 107. [Google Scholar] [CrossRef]
- Naldrett, A.J.; Craig, J.R.; Kullerud, G. The central portion of the Fe-Ni-S system and its bearing on pentlandite exsolution in iron-nickel sulfide ores. Econ. Geol. 1967, 62, 826–847. [Google Scholar] [CrossRef]
- Kullerud, G.; Yund, R.A.; Moh, G.H. Phase relations in the Cu-Fe-S, Cu-Ni-S, and Fe-Ni-S systems. In Magmatic Ore Deposits; Wilson, H.D.B., Ed.; Economic Geology Monograph 4; GeoScienceWorld: Kingston, ON, Canada, 1969; pp. 323–343. [Google Scholar]
- Craig, J.R. Pyrite-pentlandite assemblages and other low temperature relations in the Fe-Ni-S system. Am. J. Sci. 1973, 273, 496–510. [Google Scholar]
- Kullerud, G.; Yoder, H.S. Pyrite stability relations in the Fe-S system. Econ. Geol. 1959, 54, 533–572. [Google Scholar] [CrossRef]
- Djon, M.L.N.; Barnes, S.-J. Changes in sulfides and platinum-group minerals with the degree of alteration in the Roby, Twilight, and High Grade Zones of the Lac des Iles Complex, Ontario, Canada. Miner. Depos. 2012, 47, 875–896. [Google Scholar] [CrossRef]
- Piña, R.; Gervilla, F.; Barnes, S.-J.; Ortega, L.; Lunar, R. Platinum-group elements-bearing pyrite from the Aguablanca Ni-Cu sulphide deposit (SW Spain): A LA-ICP-MS study. Eur. J. Miner. 2013, 25, 241–252. [Google Scholar] [CrossRef] [Green Version]
- Smith, J.W.; Holwell, D.; McDonald, I. Precious and base metal geochemistry and mineralogy of the Grasvally Norite-Pyroxenite-Anorthosite (GNPA) member, northern Bushveld Complex, South Africa: Implications for a multistage emplacement. Miner. Depos. 2014, 49, 667–692. [Google Scholar] [CrossRef] [Green Version]
- Cafagna, F.; Jugo, P.J. An experimental study on the geochemical behavior of highly siderophile elements (HSE) and metalloids (As, Se, Sb, Te, Bi) in a mss-iss-pyrite system at 650 °C: A possible magmatic origin for Co-HSE-bearing pyrite and the role of metalloid-rich phases in the fractionation of HSE. Geochim. Cosmochim. Acta 2016, 178, 233–258. [Google Scholar]
- Barnes, S.J.; Cox, R.A.; Zeintec, M.L. Platinum-Group Element, Gold, Silver and Base Metal Distribution in Compositionally Zoned Sulphide Droplets-Like Inclusions from Medvezhy Creek Mine, Noril’sk, Russia. Contrib. Miner. Pet. 2006, 152, 187–200. [Google Scholar] [CrossRef]
- Piña, R.; Gervilla, F.; Barnes, S.-J.; Oberthür, T.; Lunar, R. Platinum-group element Contents in pyrite from the Main Sulfide Zone of the Great Dyke of Zimbabwe. Miner. Deposit. 2016, 51, 853–872. [Google Scholar] [CrossRef]
- Barkov, A.Y.; Fleet, M.E. An unusual association of hydrothermal platinum-group minerals from the Imandra layered complex, Kola peninsula, Northwestern Russia. Can. Miner. 2004, 42, 455–467. [Google Scholar] [CrossRef]
- Duran, C.J.; Barnes, S.-J.; Corkery, J.T. Chalcophile and platinum-group element distribution in pyrites from the sulfide-rich pods of the Lac des Iles Pd deposits, Western Ontario, Canada: Implications for post-cumulus re-equilibration of the ore and the use of pyrite compositions in exploration. J. Geochem. Explor. 2015, 158, 223–242. [Google Scholar] [CrossRef]
- Cabri, L.J.; Sylvester, P.J.; Tubrett, M.N.; Peregoedova, A.; Laflamme, J.H.G. Comparison of LAM-ICP-MS and micro-PIXE results for palladium and rhodium in selected samples of Noril’sk and Talnakh sulfides. Can. Miner. 2003, 41, 321–329. [Google Scholar] [CrossRef] [Green Version]
- Holwell, D.A.; McDonald, I. Distribution of platinum-group elements in the Platreef at OVerysel. Northern Bushveld Complex: A combined PGM and LA-ICP-MS study. Contrib. Miner. Pet. 2007, 154, 171–190. [Google Scholar] [CrossRef]
- Li, C.; Ripley, E.M. Formation of Pt-Fe alloy by desulfurization of Pt-Pd sulfide in the J-M reef of the Stillwater Complex, Montana. Can. Miner. 2006, 44, 895–903. [Google Scholar] [CrossRef]
- Brovchenko, V.D.; Sluzhenikin, S.F.; Kovalchuk, E.V.; Kovrigina, S.V.; Abramova, V.D.; Yudovskaya, M.A. Platinum Group Element Enrichment of Natural Quenched Sulfide Solid Solutions, the Norilsk 1 Deposit, Russia. Econ. Geol. 2020, 6, 1343–1361. [Google Scholar] [CrossRef]
- Barnes, S.-J.; Lightfoot, P. Formation of Magmatic Nickel-Sulfide Deposits and Processes Affecting Their Copper and Platinum-Group Element Contents. In Economic Geology; Hedenquist, J., Thompson, J., Goldfarb, R., Richards, J., Eds.; Society of Economic Geology: Littleton, CO, USA, 2005; pp. 179–213. [Google Scholar]
- Piña, R.; Gervilla, F.; Barnes, S.-J.; Ortega, L.; Martínez-Frías, J.; Lunar, R. Platinum-Group Element Contents in pyrrhotite, pentlandite, chalcopyrite and pyrite from the Aguablanca Ni-Cu Ore Deposit (Southwest Spain). In Proceedings of the 11th International Platinum Symposium, Sudbury, ON, Canada, 21–24 June 2010; Ontario Geological Survey: Sudbery, ON, Canada, 2010; pp. 2–5. [Google Scholar]
- Godel, B.; Barnes, S.-J.; Maier, W.D. Platinum-Group Elements in Sulphide Minerals, Platinum-Group Minerals, and Whole-Rocks of the Merensky Reef (Bushveld Complex, South Africa): Implications for the Formation of the Reef. J. Pet. 2007, 48, 1569–1604. [Google Scholar] [CrossRef] [Green Version]
- Anenburg, M.; Mavrogenes, J.A. Noble metal nanonugget insolubility in geological sulfide liquids. Geology 2020, 48, 939–943. [Google Scholar] [CrossRef]
- Junge, M.; Wirth, R.; Oberthür, T.; Melcher, F.; Schreiber, A. Mineralogical siting of platinum-group elements in pentlandite from the Bushveld Complex, South Africa. Miner. Depos. 2015, 50, 41–54. [Google Scholar] [CrossRef] [Green Version]
- González-Jiménez, J.M.; Deditius, A.; Gervilla, F.; Reich, M.; Suvorova, A.; Roberts, M.P.; Roqué, J.; Proenza, J.A. Nanoscale partitioning of Ru, Ir, and Pt in base-metal sulfides from the Caridad chromite deposit, Cuba. Am. Miner. 2018, 103, 1208–1220. [Google Scholar] [CrossRef]
- Kamenetsky, V.S.; Zelenski, M. Origin of noble-metal nuggets in sulfide-saturated arc magmas: A case study of olivine-hosted sulfide melt inclusions from the Tolbachik volcano (Kamchatka, Russia). Geology 2020, 48, 620–624. [Google Scholar] [CrossRef]
- Makovicky, M.; Makovisky, E.; Rose-Hansen, J. Experimental studies on the solubility and distribution of platinum group elements in base metal sulphides in platinum deposits. In Metallurgy of Basic and Ultrabasic Rocks; Gallagher, M.J., Ixer, R.A., Neary, C.R., Prichard, H.M., Eds.; Institute of Mining and Metallurgy: London, UK, 1986; pp. 415–425. [Google Scholar]
- Gervilla, F.; Makovisky, E.; Rose-Hansen, J. The system Pd-Ni-As at 790 °C and 450 °C. Econ. Geol. 1994, 89, 1630–1639. [Google Scholar] [CrossRef]
- Gervilla, F.; Kojonen, K. The platinum-group minerals in the upper section of the Keivitsansarvi Ni-Cu-PGE deposit, northern Finland. Can. Miner. 2002, 40, 377–394. [Google Scholar] [CrossRef] [Green Version]
- Helmy, H.M.; Ballhaus, C.; Fonseca, R.O.C.; Nagel, T.J. Fractionation of platinum, palladium, nickel, and copper in sulfide-arsenide systems at magmatic temperature. Contrib. Miner. Pet. 2013, 166, 1725–1737. [Google Scholar] [CrossRef]
- Helmy, H.; Ballhaus, C.; Fonseca, R.; Wirth, R.; Nagel, T.; Tredoux, M. Noble metal nanoclusters and nanoparticles precede mineral formation in magmatic sulphide melts. Nat. Commun. 2013, 4, 2405. [Google Scholar] [CrossRef] [Green Version]
- Helmy, H.M.; Ballhaus, C.; Fonseca, R.O.C.; Padilha, F.F.; Leitzke, L.F.P. Contents of Pt, Pd, S, As, Se and Te in silicate melts at sulfide, arsenide, selenide and telluride saturation: Evidence of PGE complexing in silicate melts? Contrib. Miner. Pet. 2020, 175, 65. [Google Scholar] [CrossRef]
- Piña, R.; Gervilla, F.; Helmy, H.; Fonseca, R.O.C.; Ballhaus, C. Partition behavior of platinum-group elements during the segregation of arsenide melts from sulfide magma. Am. Miner. 2020, 105, 1889–1897. [Google Scholar] [CrossRef]
- Sinyakova, E.F.; Kosyakov, V.I.; Nenashev, B.G. Coefficients of rhodium partition between melt and monosulfide solid solution during directional crystallization of melt in the Fe-FeS-NiS-Ni system. Dokl. Earth Sci. 2004, 397, 649–653. [Google Scholar]
- Kosyakov, V.I.; Sinyakova, E.F. Peculiarities of behavior of trace elements during fractional crystallization of sulfide magmas. Dokl. Earth Sci. 2015, 460, 179–182. [Google Scholar] [CrossRef]


| No. | Sample | Fe | Co | Ni | Cu | S | Pb | Total | Formula | Mineral |
|---|---|---|---|---|---|---|---|---|---|---|
| 1 | SF-13 | 58.95 | 39.39 | 0.27 | 98.62 | Fe0.86S1.00 | Pyrrhotite Fe1-xS | |||
| 2 | SF-13 | 58.98 | 39.44 | 0.24 | 98.69 | Fe0.86S1.00 | Pyrrhotite Fe1-xS | |||
| 3 | SF-13 | 58.76 | 0.58 | 39.39 | 0.29 | 99.02 | (Fe0.86Ni0.01)0.87S1.00 | Pyrrhotite Fe1-xS | ||
| 4 | SF-13 | 58.23 | 0.59 | 39.43 | 0.28 | 98.53 | (Fe0.85Ni0.01)0.86S1.00 | Pyrrhotite Fe1-xS | ||
| 5 | SF-20 | 59.76 | 0.52 | 39.79 | 100.07 | (Fe0.86Ni0.01)0.87S1.00 | Pyrrhotite Fe1-xS | |||
| 6 | SF-20 | 59.47 | 39.19 | 98.66 | Fe0.87S1.00 | Pyrrhotite Fe1-xS | ||||
| 7 | S-494 | 60.43 | 0.54 | 38.60 | 99.57 | (Fe0.90Ni0.01)0.91S1.00 | Pyrrhotite Fe1-xS | |||
| 8 | S-494 | 60.37 | 0.64 | 38.83 | 99.84 | (Fe0.89Ni0.01)0.90S1.00 | Pyrrhotite Fe1-xS | |||
| 9 | S-494 | 59.96 | 0.64 | 38.78 | 99.38 | (Fe0.89Ni0.01)0.90S1.00 | Pyrrhotite Fe1-xS | |||
| 10 | S-494 | 60.18 | 0.67 | 38.58 | 99.42 | (Fe0.90Ni0.01)0.91S1.00 | Pyrrhotite Fe1-xS | |||
| 11 | S-643 | 59.33 | 0.59 | 38.65 | 98.57 | (Fe0.88Ni0.01)0.89S1.00 | Pyrrhotite Fe1-xS | |||
| 12 | S-643 | 60.02 | 0.45 | 38.53 | 99.00 | (Fe0.89Ni0.01)0.90S1.00 | Pyrrhotite Fe1-xS | |||
| 13 | SF-13 | 28.88 | 0.75 | 37.66 | 32.61 | 99.89 | (Ni4.98Fe4.02Co0.10)9.10S7.90 | Pentlandite (Fe,Ni)9S8 | ||
| 14 | SF-13 | 30.62 | 1.04 | 34.49 | 33.36 | 99.51 | (Ni4.55Fe4.25Co0.14)8.94S8.06 | Pentlandite (Fe,Ni)9S8 | ||
| 15 | SF-13 | 29.41 | 1.07 | 35.81 | 33.38 | 99.67 | (Ni4.72Fe4.08Co0.14)8.94S8.06 | Pentlandite (Fe,Ni)9S8 | ||
| 16 | SF-20 | 30.49 | 1.36 | 34.68 | 33.85 | 100.38 | (Ni4.53Fe4.19Co0.18)8.90S8.10 | Pentlandite (Fe,Ni)9S8 | ||
| 17 | SF-20 | 30.65 | 1.48 | 34.75 | 33.48 | 100.36 | (Ni4.55Fe4.22Co0.19)8.96S8.03 | Pentlandite (Fe,Ni)9S8 | ||
| 18 | SF-20 | 30.23 | 1.49 | 35.36 | 33.73 | 100.81 | (Ni4.61Fe4.14Co0.19)8.94S8.05 | Pentlandite (Fe,Ni)9S8 | ||
| 19 | SF-20 | 30.65 | 1.32 | 34.01 | 33.39 | 99.37 | (Ni4.49Fe4.26Co0.17)8.92S8.08 | Pentlandite (Fe,Ni)9S8 | ||
| 20 | S-494 | 30.17 | 1.24 | 35.17 | 32.84 | 99.42 | (Ni4.66Fe4.20Co0.16)9.02S7.97 | Pentlandite (Fe,Ni)9S8 | ||
| 21 | S-494 | 30.28 | 1.29 | 35.28 | 32.92 | 99.77 | (Ni4.66Fe4.20Co0.17)9.03S7.96 | Pentlandite (Fe,Ni)9S8 | ||
| 22 | S-494 | 30.19 | 1.33 | 35.42 | 32.94 | 99.88 | (Ni4.67Fe4.19Co0.18)9.04S7.96 | Pentlandite (Fe,Ni)9S8 | ||
| 23 | S-494 | 30.10 | 1.38 | 35.32 | 32.97 | 99.77 | (Ni4.66Fe4.18Co0.18)9.02S7.97 | Pentlandite (Fe,Ni)9S8 | ||
| 24 | S-643 | 31.30 | 1.47 | 33.41 | 32.77 | 98.95 | (Ni4.45Fe4.38Co0.19)9.02S7.98 | Pentlandite (Fe,Ni)9S8 | ||
| 25 | S-643 | 31.57 | 1.35 | 32.35 | 32.73 | 98.00 | (Fe4.45Ni4.34Co0.18)8.97S8.03 | Pentlandite (Fe,Ni)9S8 | ||
| 26 | S-643 | 31.01 | 1.78 | 32.72 | 32.90 | 98.41 | (Ni4.37Fe4.35Co0.24)8.96S8.04 | Pentlandite (Fe,Ni)9S8 | ||
| 27 | S-643 | 31.03 | 2.11 | 32.49 | 32.76 | 98.39 | (Fe4.36Ni4.34Co0.28)8.98S8.02 | Pentlandite (Fe,Ni)9S8 | ||
| 28 | S-643 | 31.30 | 1.47 | 33.41 | 32.77 | 98.95 | (Ni4.45Fe4.38Co0.19)9.02S7.98 | Pentlandite (Fe,Ni)9S8 | ||
| 29 | SF-13 | 30.32 | 34.80 | 35.01 | 100.13 | Cu1.00Fe0.99S2.00 | Chalcopyrite CuFeS2 | |||
| 30 | SF-13 | 29.62 | 34.77 | 34.00 | 98.39 | Cu1.02Fe0.99S1.98 | Chalcopyrite CuFeS2 | |||
| 31 | SF-13 | 29.36 | 34.81 | 34.34 | 98.51 | Cu1.02Fe0.98S2.00 | Chalcopyrite CuFeS2 | |||
| 32 | SF-20 | 30.18 | 33.54 | 35.14 | 98.86 | Cu0.98Fe1.00S2.03 | Chalcopyrite CuFeS2 | |||
| 33 | S-494 | 30.47 | 34.12 | 34.82 | 99.41 | Cu0.99Fe1.01S2.00 | Chalcopyrite CuFeS2 | |||
| 34 | S-494 | 30.74 | 33.80 | 34.48 | 99.02 | Cu0.99Fe1.02S1.99 | Chalcopyrite CuFeS2 | |||
| 35 | S-494 | 30.87 | 33.68 | 34.83 | 99.38 | Cu0.98Fe1.02S2.00 | Chalcopyrite CuFeS2 | |||
| 36 | S-494 | 30.73 | 33.95 | 34.53 | 99.20 | Cu0.99Fe1.02S1.99 | Chalcopyrite CuFeS2 | |||
| 37 | S-643 | 29.57 | 33.08 | 35.12 | 98.43 | Cu0.97Fe0.98S2.01 | Chalcopyrite CuFeS2 | |||
| 38 | SF-13 | 46.38 | 53.44 | 99.82 | Fe1.00S2.00 | Pyrite FeS2 | ||||
| 39 | SF-13 | 43.96 | 0.50 | 0.17 | 53.45 | 98.08 | (Fe0.97Co0.01)0.98S2.02 | Pyrite FeS2 | ||
| 40 | SF-13 | 44.48 | 1.91 | 0.06 | 53.48 | 99.93 | (Fe0.96Co0.04)1.00S2.00 | Pyrite FeS2 | ||
| 41 | SF-13 | 44.22 | 2.09 | 0.07 | 53.30 | 99.68 | (Fe0.95Co0.04)0.99S2.00 | Pyrite FeS2 | ||
| 42 | SF-13 | 43.73 | 2.48 | 0.07 | 52.61 | 98.89 | (Fe0.95Co0.05)1.00S1.99 | Pyrite FeS2 | ||
| 43 | S-494 | 45.95 | 0.81 | 17.56 | 35.64 | 99.96 | (Fe2.93Co0.05)2.98 Ni1.07S3.96 | Unnamed Fe3NiS4 |
| No. | Fe | Co | Ni | Cu | S | Total | Formula |
|---|---|---|---|---|---|---|---|
| 1 | 30.39 | 33.64 | 34.55 | 98.58 | Fe1.01Cu0.98S2.00 | ||
| 2 | 31.02 | 33.81 | 34.61 | 99.44 | Fe1.03Cu0.98S1.99 | ||
| 3 | 30.82 | 33.37 | 34.87 | 99.06 | Fe1.02Cu0.97S2.01 | ||
| 4 | 30.70 | 33.33 | 34.50 | 98.53 | Fe1.02Cu0.98S2.00 | ||
| 5 | 29.36 | 1.12 | 36.37 | 33.58 | 100.43 | (Ni4.76Fe4.04Co0.15)8.95S8.05 | |
| 6 | 29.38 | 1.16 | 36.07 | 33.20 | 99.81 | (Ni4.76Fe4.07Co0.15)8.98S8.02 | |
| 7 | 28.99 | 0.96 | 36.31 | 0.44 | 33.22 | 99.92 | (Ni4.79Fe4.02Co0.13Cu0.05)8.99S8.02 |
| 8 | 29.09 | 1.31 | 36.39 | 33.14 | 99.93 | (Ni4.80Fe4.03Co0.17)9.00S8.00 | |
| 9 | 59.57 | 0.51 | 39.24 | 99.75 | (Fe0.87Ni0.01)0.88S1.00 | ||
| 10 | 59.52 | 0.68 | 39.37 | 98.81 | (Fe0.87Ni0.01)0.88S1.00 | ||
| 11 | 44.15 | 2.35 | 52.68 | 99.18 | (Fe0.96Co0.05)1.01S1.99 | ||
| 12 | 44.31 | 2.58 | 53.01 | 99.90 | (Fe0.96Co0.05)1.01S1.99 | ||
| 13 | 46.47 | 0.14 | 52.96 | 99.57 | (Fe1.00Co0.01)1.01S1.99 | ||
| 14 | 46.27 | 0.65 | 52.98 | 99.9 | (Fe1.00Co0.01)S1.99 | ||
| 15 | 44.77 | 2.01 | 53.08 | 99.86 | (Fe0.97Co0.04)1.01S1.99 | ||
| 16 | 45.4 | 1.17 | 53.10 | 99.67 | (Fe0.98Co0.02)1.00S2.00 | ||
| 17 | 44.10 | 2.91 | 53.36 | 100.37 | (Fe0.95Co0.06)1.01S1.99 | ||
| 18 | 42.77 | 3.98 | 52.79 | 99.54 | (Fe0.93Co0.08)1.01S1.99 |
| No. | Sample | Co | Ni | As | Pd | Total | Formula | Mineral |
|---|---|---|---|---|---|---|---|---|
| 1 | S-643 | 0.56 | 43.57 | 56.56 | 0.00 | 100.69 | (Ni0.99Co0.01)1.00As1.00 | Nickeline NiAs |
| 2 | S-643 | 0.50 | 43.24 | 56.04 | 0.38 | 100.16 | (Ni0.98Co0.01)0.99As1.00 | Nickeline NiAs |
| 3 | S-643 | 0.77 | 49.65 | 47.62 | 1.61 | 99.65 | (Ni10.65Pd0.19Co0.16)11.00As8.00 | Maucherite Ni11As8 |
| 4 | S-643 | 0.83 | 49.51 | 47.71 | 1.66 | 99.71 | (Ni10.61Pd0.20Co0.18)10.99As8.01 | Maucherite Ni11As8 |
| 5 | S-643 | 0.56 | 48.67 | 47.19 | 2.58 | 99.00 | (Ni10.55Pd0.31Co0.12)10.98As8.02 | Maucherite Ni11As8 |
| 6 | S-643 | 50.27 | 47.68 | 1.82 | 99.77 | (Ni10.78Pd0.22)10.98As8.01 | Maucherite Ni11As8 | |
| 7 | S-643 | 0.21 | 48.29 | 46.97 | 4.31 | 99.78 | (Ni10.47Pd0.52Co0.05)11.04As7.97 | Maucherite Ni11As8 |
| 8 | S-643 | 0.89 | 49.08 | 47.61 | 2.67 | 100.25 | (Ni10.51Pd0.32Co0.19)11.02As7.99 | Maucherite Ni11As8 |
| 9 | S-643 | 0.28 | 49.80 | 48.13 | 2.49 | 100.70 | (Ni10.61Pd0.29Co0.06)10.96As8.03 | Maucherite Ni11As8 |
| 10 | S-643 | 0.34 | 49.35 | 47.34 | 2.21 | 99.24 | (Ni10.66Pd0.26Co0.07)10.99As8.01 | Maucherite Ni11As8 |
| 11 | S-643 | 0.46 | 49.66 | 47.88 | 2.52 | 100.52 | (Ni10.60Pd0.30Co0.10)11.00As8.01 | Maucherite Ni11As8 |
| 12 | S-643 | 0.45 | 49.12 | 47.37 | 2.72 | 99.66 | (Ni10.58Pd0.32Co0.10)11.00As8.00 | Maucherite Ni11As8 |
| 13 | S-643 | 0.29 | 48.24 | 46.08 | 2.49 | 97.10 | (Ni10.66Pd0.30Co0.06)11.02As7.98 | Maucherite Ni11As8 |
| 14 | S-643 | 0.58 | 48.71 | 47.19 | 2.96 | 99.44 | (Ni10.53Pd0.35Co0.12)11.00As7.99 | Maucherite Ni11As8 |
| 15 | S-643 | 0.42 | 49.48 | 47.35 | 2.82 | 100.07 | (Ni10.62Pd0.33Co0.09)11.04As7.96 | Maucherite Ni11As8 |
| 16 | S-643 | 18.01 | 32.78 | 48.51 | 99.30 | Pd3.04Ni2.05As2.92 | Menshikovite Pd3Ni2As3 | |
| 17 | S-643 | 18.11 | 33.11 | 48.44 | 99.66 | Pd3.02Ni2.05As2.93 | Menshikovite Pd3Ni2As3 | |
| 18 | S-643 | 17.93 | 32.85 | 48.28 | 99.06 | Pd3.03Ni2.04As2.93 | Menshikovite Pd3Ni2As3 | |
| 19 | S-643 | 18.13 | 33.09 | 48.80 | 100.02 | Pd3.03Ni2.04As2.92 | Menshikovite Pd3Ni2As3 | |
| 20 | S-643 | 18.27 | 33.12 | 48.67 | 100.06 | Pd3.02Ni2.06As2.92 | Menshikovite Pd3Ni2As3 | |
| 21 | S-643 | 18.15 | 33.09 | 48.56 | 99.80 | Pd3.02Ni2.05As2.93 | Menshikovite Pd3Ni2As3 | |
| 22 | S-643 | 18.76 | 32.93 | 48.07 | 99.76 | Pd2.98Ni2.11As2.90 | Menshikovite Pd3Ni2As3 | |
| 23 | S-643 | 24.63 | 31.83 | 44.95 | 101.41 | Pd1.00Ni0.99As1.01 | Majakite PdNiAs | |
| 24 | S-643 | 24.26 | 31.89 | 44.31 | 100.46 | Pd1.00Ni0.99As1.02 | Majakite PdNiAs |
| No. | Sample | Fe | Ni | Pt | Pd | Bi | Sb | As | S | Te | Total | Formula | Mineral |
|---|---|---|---|---|---|---|---|---|---|---|---|---|---|
| 1 | S-494 | 0.55 | 85.17 | 0.60 | 14.33 | 100.65 | (Pt0.97Ni0.02Pd0.01)1.00S0.99 | Cooperite PtS | |||||
| 2 | S-494 | 0.96 | 83.87 | 1.00 | 14.62 | 100.45 | (Pt0.94Ni0.04Pd0.02)1.00S1.00 | Cooperite PtS | |||||
| 3 | S-494 | 1.62 | 82.51 | 1.44 | 14.46 | 100.03 | (Pt0.92Ni0.06Pd0.03)1.01S0.99 | Cooperite PtS | |||||
| 4 | S494 | 34.64 | 62.88 | 1.27 | 98.79 | Pd1.02(Bi0.94Sb0.03)0.97 | Sobolevskite Pd(Bi,Sb) | ||||||
| 5 | S647 | 36.28 | 55.85 | 7.61 | 99.74 | Pd1.02(Bi0.80Sb0.19)0.99 | Sobolevskite Pd(Bi,Sb) | ||||||
| 6 | S648 | 36.18 | 54.46 | 7.26 | 1.41 | 99.31 | Pd1.01(Bi0.78Sb0.18Te0.03)0.99 | Sobolevskite Pd(Bi,Sb) | |||||
| 7 | S649 | 36.46 | 54.15 | 7.85 | 1.57 | 100.03 | Pd1.01(Bi0.76Sb0.19Te0.04)0.99 | Sobolevskite Pd(Bi,Sb) | |||||
| 8 | S643 | 55.31 | 42.85 | 98.16 | Pt0.99As2.01 | Sperrylite PtAs2 | |||||||
| 9 | S494 | 56.16 | 42.32 | 0.27 | 99.13* | (Pt1.00Rh0.01)1.01(As1.96S0.03)1.99 | sperrylite PtAs2 | ||||||
| 10 | S494 | 56.44 | 42.13 | 0.21 | 98.78 | Pt1.01(As1.97S0.02)1.99 | Sperrylite PtAs2 | ||||||
| 11 | S494 | 56.34 | 42.09 | 0.23 | 98.66 | Pt1.01(As1.96S0.03)1.99 | Sperrylite PtAs2 | ||||||
| 12 | S643 | 71.54 | 25.40 | 3.01 | 99.95 | Pd8.03(Sb2.49As0.48)2.97 | Mertieite II Pd8(Sb,As)3 | ||||||
| 13 | S643 | 71.12 | 25.74 | 3.24 | 100.10 | Pd7.97(Sb2.52As0.52)3.04 | Mertieite II Pd8(Sb,As)3 | ||||||
| 14 | S643 | 71.29 | 25.59 | 3.07 | 99.95 | Pd8.00(Sb2.51As0.49)3.00 | Mertieite II Pd8(Sb,As)3 | ||||||
| 15 | S643 | 9.54 | 88.91 | 98.45 | Pt2.91Fe1.09 | Isoferroplatinum Pt3Fe | |||||||
| 16 | S643 | 2.90 | 36.28 | 54.05 | 7.61 | 100.84 | (Pd5.27Ni0.76)6.03Bi4.00Sb0.97 | Unnamed (Pd,Ni)6Bi4Sb |
| No. | Sample | Depth, m | Pt | Pd | Au | Ir | Rh | Ru | Co | Ni | Cu | S |
|---|---|---|---|---|---|---|---|---|---|---|---|---|
| ppm | wt.% | |||||||||||
| 1 | SF-13 | 908.8 | 2.37 | 10.77 | 0.16 | 1.10 | 7.31 | 3.84 | 0.18 | 4.96 | 2.57 | 36.05 |
| 2 | SF-20 | 919.7 | 3.23 | 13.26 | 0.30 | 0.70 | 5.22 | 2.68 | 0.17 | 4.81 | 3.49 | 36.00 |
| 3 | SF-20 | 921.0 | 2.90 | 13.00 | 0.31 | 0.95 | 6.79 | 3.61 | 0.18 | 4.96 | 3.87 | 36.00 |
| 4 | S-494 | 0.0 | 1.32 | 9.40 | 0.08 | 0.42 | 3.70 | 1.07 | 0.22 | 5.95 | 3.48 | 36.90 |
| 5 | S-643 | 2.7 | 1.36 | 11.30 | 0.05 | 0.01 | 0.36 | 0.03 | 0.19 | 4.94 | 2.60 | 35.30 |
| In 100% sulfide | ||||||||||||
| No | Sample | m | Pt | Pd | Au | Ir | Rh | Ru | Co | Ni | Cu | S |
| 1 | SF-13 | 908.8 | 3.01 | 13.66 | 0.20 | 1.40 | 9.27 | 4.87 | 0.22 | 6.29 | 3.26 | 45.73 |
| 2 | SF-20 | 919.7 | 3.39 | 13.91 | 0.31 | 0.73 | 5.48 | 2.81 | 0.17 | 5.04 | 3.66 | 37.74 |
| 3 | SF-20 | 921.0 | 3.03 | 13.61 | 0.33 | 0.99 | 7.11 | 3.77 | 0.18 | 5.19 | 4.05 | 37.68 |
| 4 | S-494 | 0.0 | 1.35 | 9.58 | 0.08 | 0.43 | 3.77 | 1.09 | 0.22 | 6.06 | 3.55 | 37.61 |
| 5 | S-643 | 2.7 | 1.46 | 12.09 | 0.05 | 0.01 | 0.39 | 0.04 | 0.20 | 5.29 | 2.78 | 37.78 |
| No. | Sample | Depth, m | Ni/Cu | Pd/Pt | PGE | PGE/S | Ir + Ru + Rh | PPGE/IPGE | Cu/Pd | Rh/Cu | Pd/Au |
|---|---|---|---|---|---|---|---|---|---|---|---|
| 1 | SF-13 | 908.8 | 1.93 | 4.54 | 32.22 | 705 × 10−7 | 15.55 | 1.1 | 2386 | 2844 × 10−7 | 68.2 |
| 2 | SF-20 | 919.7 | 1.38 | 4.11 | 26.31 | 697 × 10−7 | 9.02 | 1.9 | 2631 | 1497 × 10−7 | 44.7 |
| 3 | SF-20 | 921.0 | 1.28 | 4.48 | 28.52 | 757 × 10−7 | 11.87 | 1.4 | 2976 | 1755 × 10−7 | 41.7 |
| 4 | S-494 | 0.0 | 1.71 | 7.12 | 16.21 | 431 × 10−7 | 5.29 | 2.1 | 3702 | 1063 × 10−7 | 117.5 |
| 5 | S-643 | 2.7 | 1.90 | 8.31 | 13.98 | 370 × 10−7 | 0.43 | 31.2 | 2301 | 138 × 10−7 | 226.0 |
| Sample | Mineral | D, μm | 59Co | 60Ni | 65Cu | 66Zn | 75As | 77Se | 101Ru | 103Rh | 105Pd | 107Ag | 185Re | 189Os | 191Ir | 195Pt | 206Pb | 209Bi | |
|---|---|---|---|---|---|---|---|---|---|---|---|---|---|---|---|---|---|---|---|
| # | ppm | ppm | ppm | ppm | ppm | ppm | ppm | ppm | ppm | ppm | ppm | ppm | ppm | ppm | ppm | ppm | |||
| S-494 | ccp | line | 40 | - | - | n.a. | 195.9 | 186.2 | - | - | - | - | - | - | - | - | - | - | - |
| SD | 28.64 | 17.67 | |||||||||||||||||
| S-494 | po | spot | 60 | 37.32 | 5074 | - | - | 71.9 | 67.14 | - | 3.36 | - | - | - | - | 0.27 | - | 3.09 | - |
| SD | 2.38 | 279.3 | 7.13 | 17.23 | 0.35 | 0.08 | 0.43 | ||||||||||||
| S-494 | po | spot | 60 | 85.11 | 6664 | - | - | 75.45 | 61.57 | - | 3.1 | - | - | - | - | 0.42 | - | 1.99 | - |
| SD | 15.09 | 585.5 | 7.24 | 13.28 | 0.39 | 0.11 | 0.3 | ||||||||||||
| S-494 | po | line | 40 | 27.31 | 5541 | - | - | 39.28 | - | - | 3.93 | - | - | - | - | - | - | 2.31 | - |
| SD | 3.81 | 574.1 | 10.27 | 0.85 | 0.57 | ||||||||||||||
| S-494 | pn | spot | 60 | 12.25 | n.a. | 73.75 | - | 191.1 | - | - | - | 162.8 | - | - | - | - | - | 9.39 | - |
| SD | 421.4 | 11.44 | 13.55 | 9.63 | 1.35 | ||||||||||||||
| S-494 | pn | spot | 60 | 7164 | n.a. | - | - | 105 | 42.44 | - | 2.31 | 101.7 | 2.38 | - | - | 0.29 | - | 2.18 | - |
| SD | 662.2 | 9.33 | 12.34 | 0.28 | 9.03 | 0.45 | 0.09 | 0.28 | |||||||||||
| S-494 | pn | line | 40 | 12.97 | n.a. | 38.15 | - | 190.8 | 40.29 | - | 3.17 | 240.5 | 1.25 | - | - | 0.44 | - | 2.41 | - |
| SD | 457.8 | 12.51 | 10.38 | 11.6 | 0.34 | 11.6 | 0.31 | 0.13 | 0.31 | ||||||||||
| S-494 | pn | line | 40 | 8067 | n.a. | - | - | 95.72 | 69.23 | - | 2.08 | 124.6 | 4.24 | - | - | - | - | 2.08 | - |
| SD | 1084 | 18.96 | 33.11 | 0.66 | 21.67 | 1.17 | 0.54 | ||||||||||||
| SF-13 | ccp | line | 40 | - | 45.46 | n.a. | 478.9 | 177 | - | - | - | - | 9.91 | - | - | - | 21.22 | 52.74 | - |
| SD | 6.97 | 96.99 | 19.09 | 1.91 | 3.33 | 6.36 | |||||||||||||
| SF-13 | po with pn2 | spot | 60 | 789.1 | 25.15 | - | - | 98.13 | 67.57 | 2.82 | 6.64 | 3.47 | 2.18 | - | - | 0.79 | - | 1.44 | - |
| SD | 54.06 | 1645 | 8.23 | 15.28 | 0.82 | 0.71 | 0.94 | 0.46 | 0.15 | 0.29 | |||||||||
| SF-13 | po | spot | 60 | 311.8 | 9185 | - | - | 43.93 | 21.2 | 1.23 | 3.16 | 1.47 | - | 0.22 | - | 0.35 | - | 0.31 | - |
| SD | 23.04 | 675.8 | 3.69 | 6.76 | 0.34 | 0.31 | 0.46 | 0.07 | 0.07 | 0.07 | |||||||||
| SF-13 | po | spot | 60 | 205.1 | 9234 | - | - | 88.24 | 57.27 | 3.62 | 6.25 | - | - | - | - | 0.82 | - | 0.74 | - |
| SD | 28.05 | 993.5 | 8.18 | 15.19 | 0.88 | 0.58 | 0.18 | 0.18 | |||||||||||
| SF-13 | pn | line | 40 | 9199 | n.a. | 61.53 | - | 99.09 | - | - | - | 167.4 | - | - | - | - | - | 28.69 | - |
| SD | 976.1 | 21.59 | 19.52 | 21.89 | 7.1 | ||||||||||||||
| SF-13 | pn | line | 40 | 5739 | n.a. | 6005 | 52.06 | 24.26 | - | - | - | 149.4 | 1.57 | - | - | - | 2.4 | 11.8 | - |
| SD | 1035 | 1745 | 13.31 | 6.51 | 23.66 | 0.89 | 0.5 | 2.69 | |||||||||||
| SF-13 | pn2 | spot | 60 | 10.76 | n.a. | - | - | 188.7 | 95.55 | - | 9.5 | 81.39 | 20.05 | - | - | 1.31 | 1.69 | 21.35 | - |
| SD | 489.5 | 15.33 | 28.9 | 0.88 | 8.26 | 2.42 | 0.29 | 0.5 | 1.83 | ||||||||||
| SF-13 | py core | spot | 60 | 17.55 | 356.5 | 66.16 | - | 92.72 | 75.62 | 4.77 | 4.74 | - | - | 0.75 | 0.62 | 1.21 | 7.29 | 1.16 | 0.32 |
| SD | 810.2 | 14.4 | 10.8 | 5.85 | 9 | 0.59 | 0.32 | 0.1 | 0.13 | 0.1 | 0.63 | 0.13 | 0.05 | ||||||
| SF-13 | py rim | spot | 60 | 156.8 | 11.69 | - | - | 94.15 | 78.38 | - | - | - | - | - | - | - | - | - | - |
| SD | 9.28 | 1.44 | 5.57 | 9.74 | |||||||||||||||
| SF-13 | py core | line | 40 | 17.15 | 470.8 | - | - | 121.5 | - | 38.26 | 22.59 | - | - | 2.97 | 4.77 | 6.89 | 19.85 | 7.29 | 4.46 |
| SD | 1395 | 35.56 | 11.7 | 9.45 | 2.93 | 0.77 | 1.31 | 0.9 | 2.75 | 1.53 | 0.81 | ||||||||
| SF-13 | py core | line | 40 | 2746 | 136.8 | - | - | 117.5 | 123.3 | 10.8 | 36 | - | - | - | - | 2.34 | 62.56 | 4.59 | - |
| SD | 495.1 | 32.86 | 17.55 | 39.61 | 3.92 | 10.35 | 0.81 | 13.95 | 1.67 | ||||||||||
| SF-13 | py rim | line | 40 | 241.2 | 83.02 | - | - | 131.3 | 80.24 | - | - | - | - | - | - | - | - | - | - |
| SD | 60.29 | 12.99 | 10.2 | 19.94 | - | - | |||||||||||||
| SF-13 | py | spot | 60 | 15726 | 548.2 | 480.2 | - | 48.46 | 78.25 | 6.14 | 8.58 | - | - | 0.85 | 0.63 | 1.3 | 6.34 | 3.51 | 0.47 |
| SD | 320.1 | 17.34 | 84.47 | 3.42 | 9.78 | 0.76 | 0.71 | 0.11 | 0.12 | 0.12 | 0.36 | 0.26 | 0.05 | ||||||
| SF-13 | py | line | 40 | 17740 | 646.4 | 2179 | - | 44.06 | 70.69 | 13.43 | 13.5 | - | 0.72 | 1.47 | 1.21 | 3.09 | 12.58 | 8.31 | 2.65 |
| SD | 489.1 | 32.46 | 489.1 | 3.11 | 12.45 | 2.62 | 2 | 0.2 | 0.25 | 0.28 | 0.36 | 0.98 | 0.84 | 0.24 | |||||
| Detection limit | 0.75 | 1.58 | 3.15 | 1.53 | 2.29 | 2.67 | 0.01 | 0.02 | 0.05 | 0.1 | 0.038 | 0.004 | 0.003 | 0.003 | 0.074 | 0.053 | |||
Publisher’s Note: MDPI stays neutral with regard to jurisdictional claims in published maps and institutional affiliations. |
© 2021 by the authors. Licensee MDPI, Basel, Switzerland. This article is an open access article distributed under the terms and conditions of the Creative Commons Attribution (CC BY) license (https://creativecommons.org/licenses/by/4.0/).
Share and Cite
Tolstykh, N.; Brovchenko, V.; Rad’ko, V.; Shapovalova, M.; Abramova, V.; Garcia, J. Rh, Ir, and Ru Partitioning in the Cu-Poor IPGE Massive Ores, Talnakh Intrusion, Skalisty Mine, Russia. Minerals 2022, 12, 18. https://doi.org/10.3390/min12010018
Tolstykh N, Brovchenko V, Rad’ko V, Shapovalova M, Abramova V, Garcia J. Rh, Ir, and Ru Partitioning in the Cu-Poor IPGE Massive Ores, Talnakh Intrusion, Skalisty Mine, Russia. Minerals. 2022; 12(1):18. https://doi.org/10.3390/min12010018
Chicago/Turabian StyleTolstykh, Nadezhda, Valeriya Brovchenko, Viktor Rad’ko, Maria Shapovalova, Vera Abramova, and Jonathan Garcia. 2022. "Rh, Ir, and Ru Partitioning in the Cu-Poor IPGE Massive Ores, Talnakh Intrusion, Skalisty Mine, Russia" Minerals 12, no. 1: 18. https://doi.org/10.3390/min12010018
APA StyleTolstykh, N., Brovchenko, V., Rad’ko, V., Shapovalova, M., Abramova, V., & Garcia, J. (2022). Rh, Ir, and Ru Partitioning in the Cu-Poor IPGE Massive Ores, Talnakh Intrusion, Skalisty Mine, Russia. Minerals, 12(1), 18. https://doi.org/10.3390/min12010018