Article

Valorisation of Partially Oxidized Tailings in a Cover System to Reclaim an Old Acid Generating Mine Site

1
Norwegian Geotechnical Institute, 0806 Oslo, Norway
2
Department of Civil, Geological and Mining Engineering, Polytechnique Montreal, Montreal, QC H3T 1J4, Canada
3
Faculty of Environmental Sciences and Natural Resource Management, Norwegian University of Life Sciences, 1433 Ås, Norway
4
Department of Geosciences, University of Oslo, 0316 Oslo, Norway
*
Author to whom correspondence should be addressed.
Minerals 2021, 11(9), 987; https://doi.org/10.3390/min11090987
Submission received: 1 July 2021 / Revised: 23 August 2021 / Accepted: 6 September 2021 / Published: 9 September 2021
(This article belongs to the Special Issue Environmental Geochemistry in the Mining Environment)

Abstract

:
The reclamation of acid-generating mine tailings typically involves building cover systems to limit interactions with water or oxygen. The choice of cover materials is critical to ensure long-term performance, and partly determines the environmental footprint of the reclamation strategy. The objective of this research was to evaluate if tailings pre-oxidized on-site could be used in cover systems. Column experiments were performed to assess the effectiveness of a cover with capillary barrier effects (CCBE), where the moisture retention layer (MRL) was made of pre-oxidized tailings with little to no remaining sulfides (LS tailings). The columns were submitted to regular wetting and drying cycles, and their hydrological and geochemical behaviour was monitored for 510 days. The LS tailings showed satisfying hydrological properties as an MRL and remained saturated throughout the test. The concentrations of Cu in the drainage decreased by more than two orders of magnitude compared to non-covered tailings. In addition, the pH increased by nearly one unit compared to the control column, and Fe and S concentrations decreased by around 50%. Despite these improvements, the leachate water remained acidic and contaminated, indicating that acid drainage continued to be generated despite a hydrologically efficient CCBE.

1. Introduction

Mining operations generate large quantities of solid wastes, which are usually disposed of in surface storage facilities [1,2]. These mine wastes and, in particular, mine tailings often contain residual sulfides (such as pyrite, pyrrhotite, or chalcopyrite), which can oxidize upon interaction with oxygen and water and generate acid mine drainage (AMD), following the general reaction:
FeS2(s) + 15/4 O2(aq) + 7/2 H2O(l) -> Fe(OH)3(s) + 2 H2SO4(aq)
AMD is characterized by a low pH and elevated concentrations of metal elements [3,4]. AMD can be treated using either active or passive water treatment systems [5,6,7]. However, because of the large volumes of waste, AMD could continue to be generated for several tenths or hundreds of years [8]. It is therefore more efficient and sustainable to prevent AMD generation at the source by controlling access of either water or oxygen to the reactive tailings by using engineered cover systems [9,10]. These covers can act as a water barrier, or, in humid climates, as an oxygen barrier. Water covers [11,12], covers with capillary barrier effects (CCBE; [13,14,15]), and monolayer covers coupled with an elevated water table [16,17,18,19] are efficient reclamation techniques, which all rely on water to control oxygen diffusion. Indeed, oxygen concentration in water is around 30 times lower than in air, and the diffusion coefficient of oxygen in water is approximately 10,000 times smaller than in air [20,21], which makes water (or water-saturated granular materials) an efficient barrier to oxygen diffusion.
The CCBE technique aims to maintain a moisture retention layer (MRL; typically made of fine-grained materials) close to saturation to decrease oxygen diffusion to the underlying reactive tailings. A CCBE can be made of several layers, depending on site conditions, climate and post-reclamation land use, but usually relies on three layers [15]. To maintain the MRL close to saturation, coarse-grained layers are placed directly below and above the MRL to create capillary barriers that prevent desaturation of the MRL [22]. CCBEs have been successfully implemented at several mining sites such as Les Terrains Aurifères—LTA [23,24] and Lorraine [25,26], both located in Quebec, Canada. CCBE perform particularly well when the water table is located deep below the tailings surface. The usual target is to maintain the MRL at a saturation degree higher than 85% [13,27].
CCBEs were proven efficient for limiting AMD generation from recently-produced mine tailings, however, their efficiency may be lower in the case of old and/or pre-oxidized sulfidic tailings, in which weathering processes have led to the formation of Fe(III)-secondary minerals [18,28]. In this case, indirect oxidation of sulfides can continue even with very low oxygen fluxes [29]. Indirect oxidation occurs when ferric iron (Fe(III)) remains in solution (at low pH and high pH) and acts as the main electron acceptor [30,31]. Fe(III)-promoted oxidation of sulfide minerals under anoxic conditions has been shown under laboratory conditions, for example in the case of pyrite [32,33,34] and pyrrhotite [35]. The Fe(III)-promoted oxidation of pyrite can be described by the following reaction [33]:
FeS2(s) + 14 Fe3+(aq) + 8 H2O(l) = 15 Fe2+(aq) + 2 SO42−(aq) + 16 H+(aq)
Another challenge when designing a CCBE is the availability of materials to build the cover. The construction of a CCBE typically involves large volumes of materials, which contribute to increased reclamation costs. The choice of the material used for building the CCBE is critical in terms of performance, but can also have a significant impact on the surrounding environment (where the material is taken) and on the greenhouse gas emissions if the material must be transported over long distances. Previous studies showed that mine tailings can naturally have suitable hydrological properties to CCBE construction, with low hydraulic conductivity and high water retention capacity. For example, efficient MRLs were constructed using non-reactive tailings [36,37] or desulfurized tailings [38,39,40]. The upper part of the tailings on abandoned mine sites have often been extensively oxidized and their sulfides may have been significantly depleted over several tens of centimetres. This material could, therefore, have the required hydrogeological and geochemical characteristics to build an MRL. However, their oxidation and contamination history, as well as the presence of secondary precipitates and contaminated pore water, could be a potential source of additional contamination. The exposure of pre-oxidized tailings to different weathering conditions (especially the degree of saturation and redox conditions) in a CCBE setting may also lead to the dissolution and mobilization of contaminants.
The main objective of the present study was to determine if pre-oxidized tailings could be suitable to build a MRL. Column tests were carried out over 510 days and the cover performance was assessed by evaluating the degree of water saturation, oxygen concentrations in the pore space, and water quality of the leachate (in particular Cu concentrations).

2. Materials and Methods

2.1. Materials Used for the Column Tests

2.1.1. Mine Site Description

The Folldal mine, located in Folldal municipality in Norway, has produced copper, sulfur, and zinc for over two hundred years. The mineral ores that were extracted at Folldal were formed around 490–470 million years ago as part of the great Greenstone belt, connected to the upper cover series of the Caledonian Mountain chain [41,42,43]. The Folldal mineral ores are made of massive sulfide deposits. Pyrite (FeS2) is the dominating sulfide mineral, but chalcopyrite (CuFeS2), sphalerite ((Zn,Fe)S), and elemental sulfur (S0) also occur. The mineral ores host rock is made up of metamorphosed volcanic rock (metabasalts and metarhyodacites) and volcanoclastic rocks.
Ore extraction processes and waste management evolved during the lifetime of the mine, leading to piles of mine waste that are highly heterogeneous in depth, nature, grain size, and geochemical composition. Fine-grained tailings, but also a mixture of different tailings, smelter slag, washery goods, fine materials in sludge pools, and waste rock piles were left on the surface after the mining process was finished [41,42,43]. Some of the piles of waste and tailings were displaced on the site during the lifetime of the mine. As a result, the mine tailings are highly heterogeneous in both horizontal and vertical direction. In particular, the acid-leaching potential of tailing wastes is highly variable.
The mine was closed in 1993, but waste rocks and tailings disposal areas were left unreclaimed and exposed to weathering. Oxidation of sulfide minerals has generated AMD for over 28 years, which has severely impacted the water quality and the associated ecosystems of the river Folla [44], located a few hundred meters downstream of the mine. Indeed, the pH of the river is 7.4 about 500 m upstream of the mine, and decreases to 6.6 downstream [45,46]. Copper, which has an average concentration of 6 µg/L upstream and 28 µg/L downstream of the mine in the river Folla [45,46], was identified as the major contaminant affecting the fish population in the local freshwaters. In 2003, the Norwegian Environmental Agency defined the objective for remediation, which should decrease the Cu concentration in the Folla river to 10–15 µg/L [47]. Different remediation methods were considered, including engineered cover systems.

2.1.2. Location and Sampling Procedure

Tailings from two locations at the Folldal mine (Figure 1) were sampled in February 2016 using an excavator. The two locations were chosen based on previous investigations for their contrasted content in sulfide minerals. A total of 140 kg of greyish tailings with yellow ochre patches were sampled in the northern part of the site, a few dozens of centimetres below the surface, and are referred to as “high-sulfide tailings” (HS tailings). Sixty-three kilograms of yellow ochre tailings were sampled from the surface to 1 m depth on the central part of the site and are referred to as “low-sulfide tailings” (LS tailings) (Figure 1). LS tailings were typical of extensively oxidized tailings with clear signs of secondary precipitation. Both HS and LS tailings samples were sent to the laboratory in sealed buckets and then kept in a controlled temperature room before setting up the column tests. The tailings were homogenized, and representative subsamples were taken using a riffle splitter before characterization and column tests.
Coarse sand and fine-grained moraine were sampled at a gravel pit, located approximately 5 km southeast of the mine. These materials are referred to as “coarse sand” and “fine sand”.

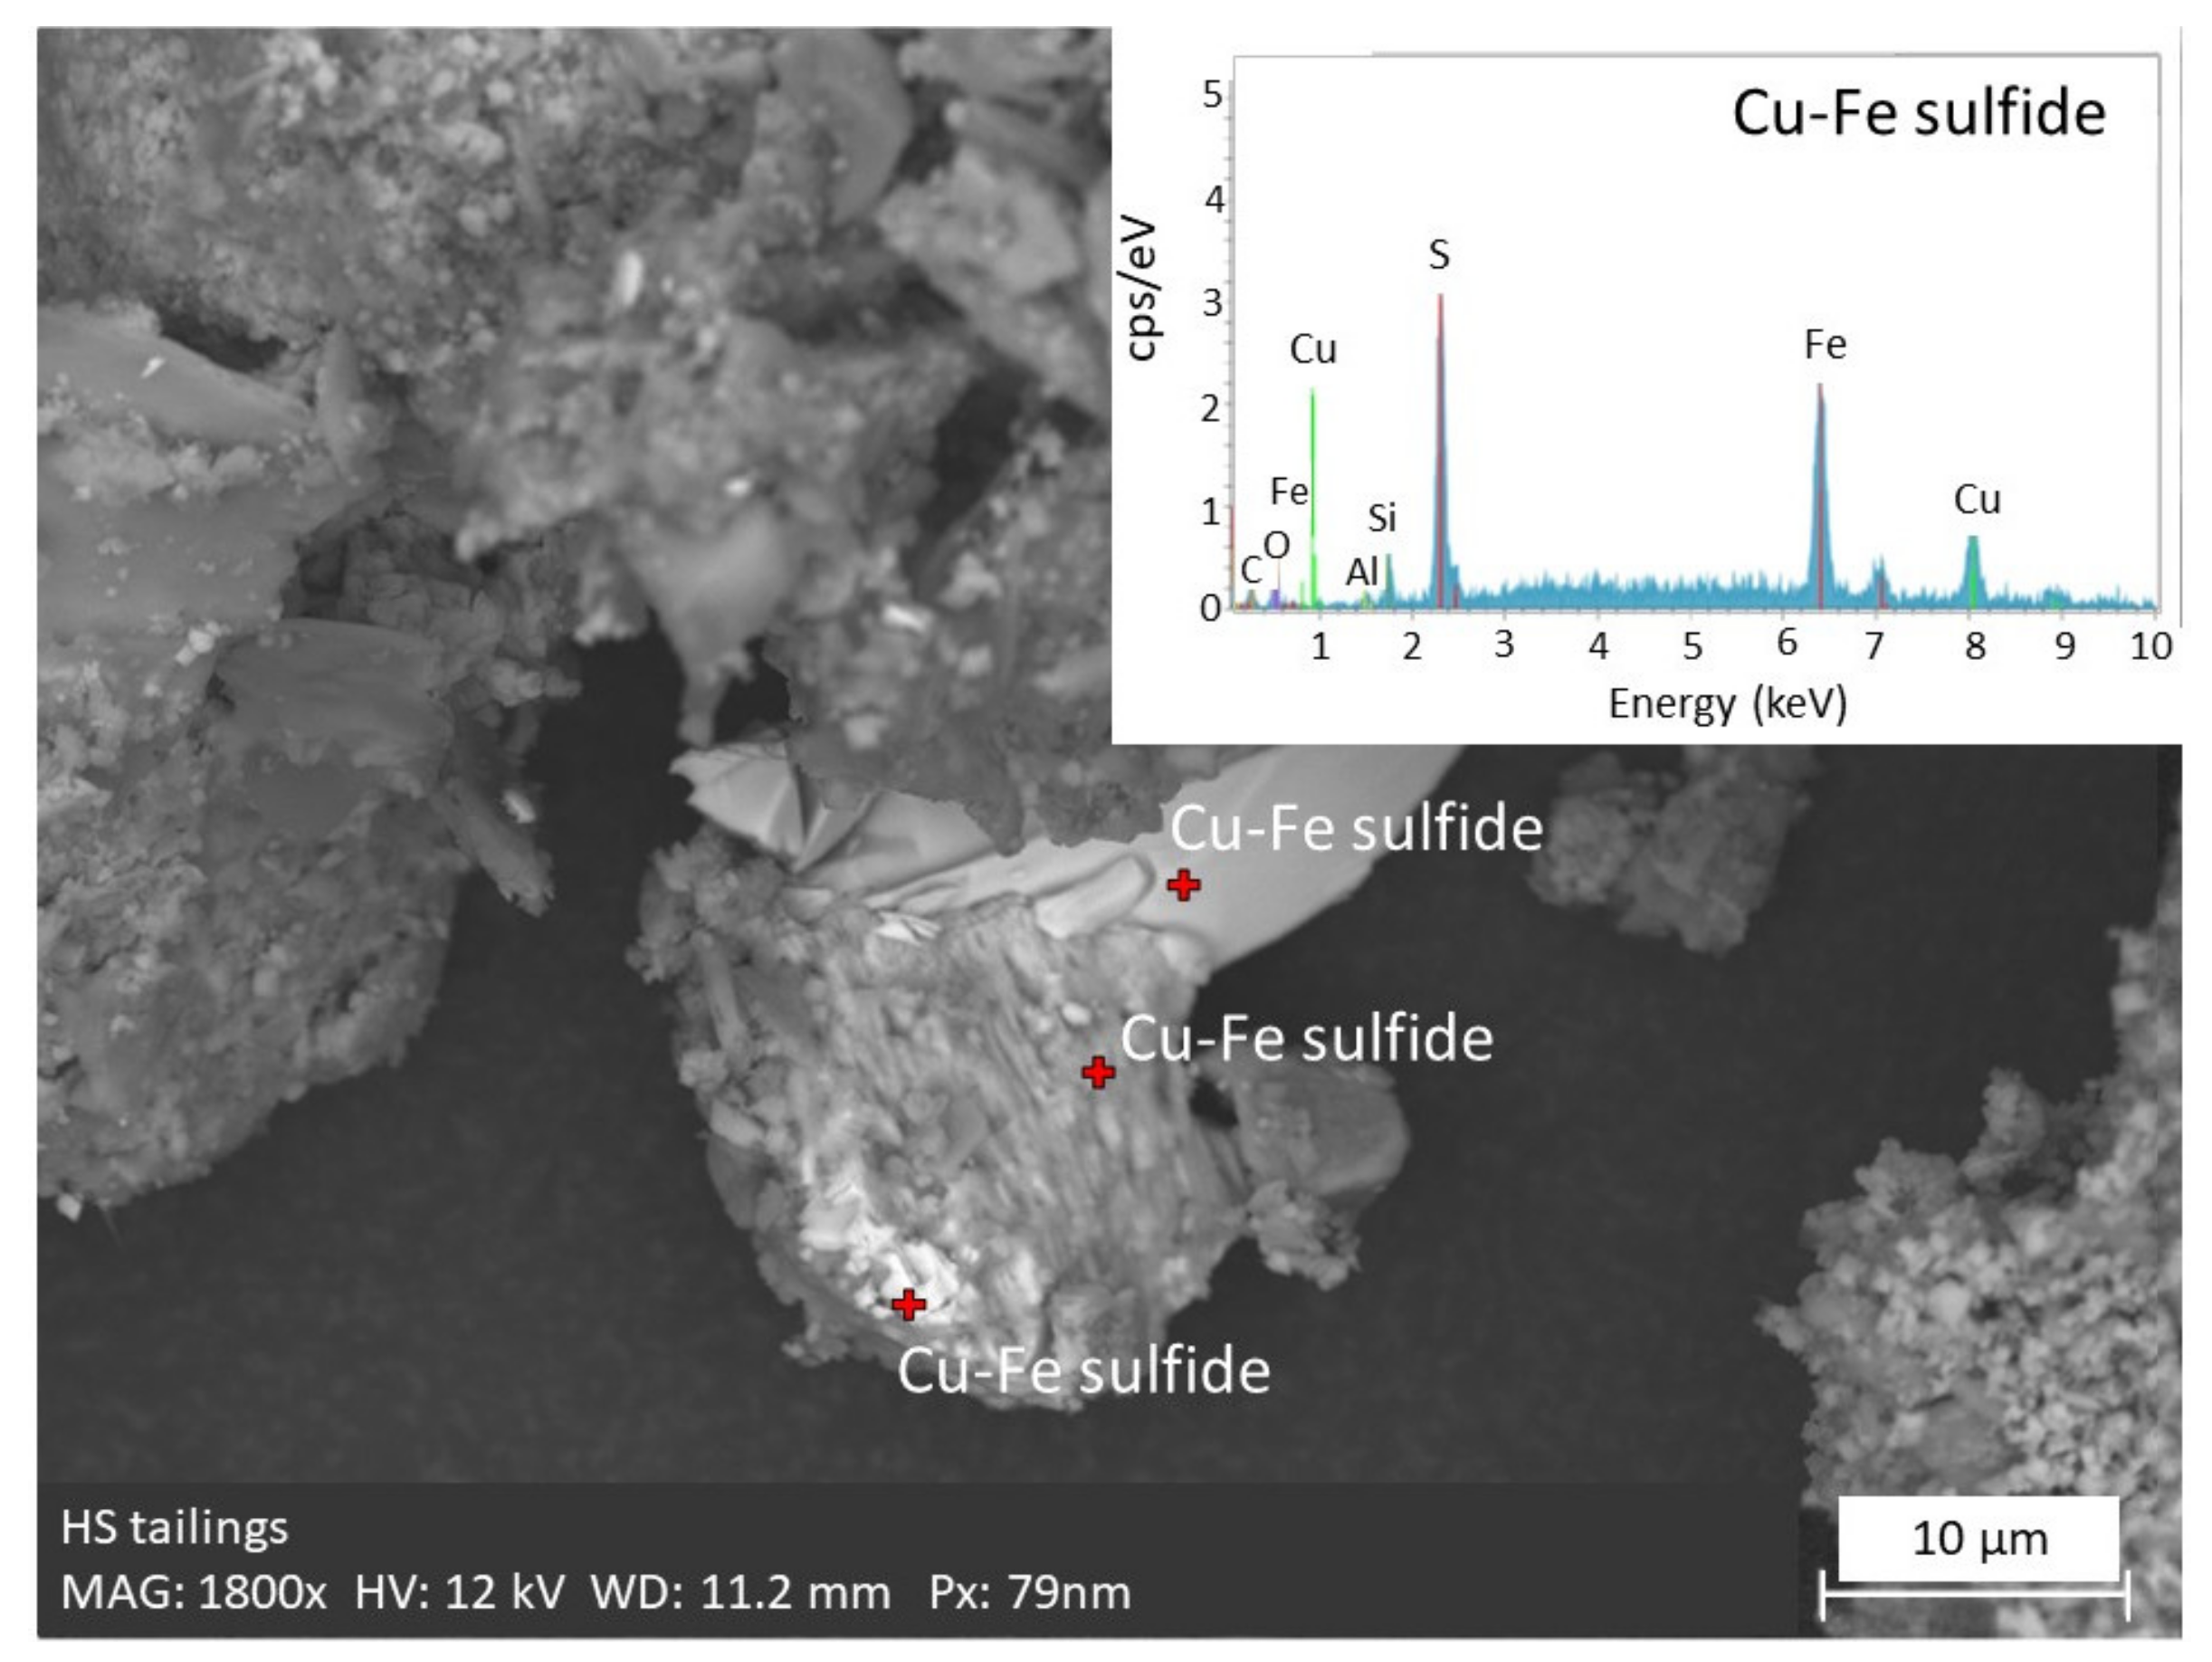
2.1.3. Chemical and Mineralogical Composition

The concentrations of major and trace elements in the HS tailings, LS tailings, fine sand, and coarse sand were analysed by inductively coupled plasma mass spectrometry (ICP-MS) or atomic emission spectroscopy (ICP-AES) after acid-digestion (Table 1). CO32−, SO42−, and total inorganic carbon (TIC) were determined, respectively, by titration (ISO 9963-1), ion chromatography (ISO 10304-1), and dry combustion (ISO 10694). The mineralogy of the materials was analysed by X-ray diffraction (XRD) using a PANalytical X’Pert PRO diffractometer (Malvern Panalytical, UK) with a Cu K-alpha radiation at 40 kV and 40 mA. The diffractometer was equipped with automatic divergence slits (10 mm irradiated area), a sample spinner, and a PIXcel 1-D detector. Data were recorded in continuous scanning mode between 4.5 and 75° (2θ), with a step size of 0.013° and nominal time per step of 0.2 s. Phase identification was carried out, using HighScore Plus (v.4) by PANalytical, and associated with the ICDD PD4-4 Minerals database. The relative proportion of the mineral phases was determined by Rietveld refinement analysis, using the software AutoCan (Table 2). As the amorphous content was not quantified by this method, the weight proportions indicated are likely overestimated. Samples fixed to a C tape were also analysed by scanning electron microscopy and energy dispersive X-ray analysis (SEM-EDX), using a Hitachi SU5000 FE-SEM (Schottky FEG) with energy-dispersive X-ray spectroscopy (EDS; Dual Bruker Quantax SFlash 30 EDS system, Bruker). Images were taken both in SE mode (secondary electrons) and BSE mode (back scatter electrons).
The HS tailings contained significant amounts of Fe and S (14.7 wt% Fe and 5.1 wt% S) (Table 1). A significant, but minor, proportion of the total sulfur (STotal) was under oxidized form(s); indeed, the 4.2 wt% SO4 determined by ion chromatography corresponded to 1.4 wt% S, which was 27% of the STotal as determined by ICP-MS (Table 1). XRD analysis indicated the presence of 9 wt% pyrite (FeS2) and 2 wt% jarosite (KFe3(SO4)2(OH)6) in HS tailings (Table 2), which accounted for about 30 wt% of the total Fe and 88 wt% of the total S measured by ICP. Silicate minerals can contain some Fe, however, the large discrepancy between chemical results and mineralogical results indicate that some Fe-phases were most likely not detected by XRD. Based on the observation of yellow-ochre patches, and considering that the tailings were weathered for over 28 years, secondary minerals were expected to be present. Consistently, some Fe(III)-oxyhydroxides were observed by SEM-EDX (data not shown). Fe(III)-oxyhydroxides could not be detected by XRD, probably because they are amorphous or have poorly crystalline structure. The HS tailings contained the highest amount of metal elements overall, with, for example, 3340 mg/kg Cu (Table 1). Cu-bearing sulfides were also observed by SEM-EDX (Figure 2).
LS tailings contained 4.0 wt% Fe and 0.4 wt% S, which was respectively 3-fold lower and 13-fold lower than Fe and S concentrations in the HS tailings (Table 1). LS tailings contained 1.3 wt% SO42−, which corresponds to 0.4 wt% S, and accounts for all the sulfur present in the LS material (Table 1). Only traces of pyrite were detected with XRD in the LS tailings, and jarosite accounted for only 3 wt% of the total Fe. No other Fe(III)-bearing secondary minerals were detected by XRD. However, considering that tailings were weathered for over 28 years and, based on the dominant ochre yellow colour, other Fe(III)-bearing secondary minerals were expected to be present, but they probably had amorphous structures or were present below the XRD detection limit. Fe(III)-oxyhydroxides were indeed observed by SEM-EDX. LS tailings contained lower amounts of metal elements (Fe, As, Co, Cu, Mo, Pb, and Zn) than HS tailings, with, for example, 119 mg/kg of Cu (compared to 3340 mg/kg in the HS tailings). Nickel and manganese concentrations were higher in LS tailings (16 mg/kg Ni and 126 mg/kg Mn) than in HS tailings (<5 mg/kg Ni and 26 mg/kg Mn), but remained in the same order of magnitude as the natural geochemical background [48].
The coarse and fine sands were mostly composed of quartz and feldspars. The S content was below the detection limit, and the Fe content was one to two orders of magnitude lower than in the tailings. The concentrations of metal elements were generally one or several order(s) of magnitude lower than in the HS tailings; however, the manganese content in the fine sand (95 mg/kg Mn) and coarse sand (62 mg/kg Mn) was higher than that in HS tailings.
The acid-leaching potential of the tailing materials was assessed following Sobeck’s method [49], modified by Lawrence and Wang (1997) [50]. The acidification potential (AP) and the neutralization potential (NP) of each sample was expressed as a calcite equivalent (CaCO3(eq)) in kg per ton. The AP was calculated based on total sulfur, including both S from acid-generating sulfides and sulfates, and it is, therefore, overestimated. The net neutralisation potential (NNP) was then defined as the difference between AP and NP. The NNP of the HS tailings was −159 kg CaCO3(eq)/t, indicating an acid-generating potential. The NNP of LS tailings was −1.6 kg CaCO3(eq)/t, indicating an uncertain acid-generating potential [50].

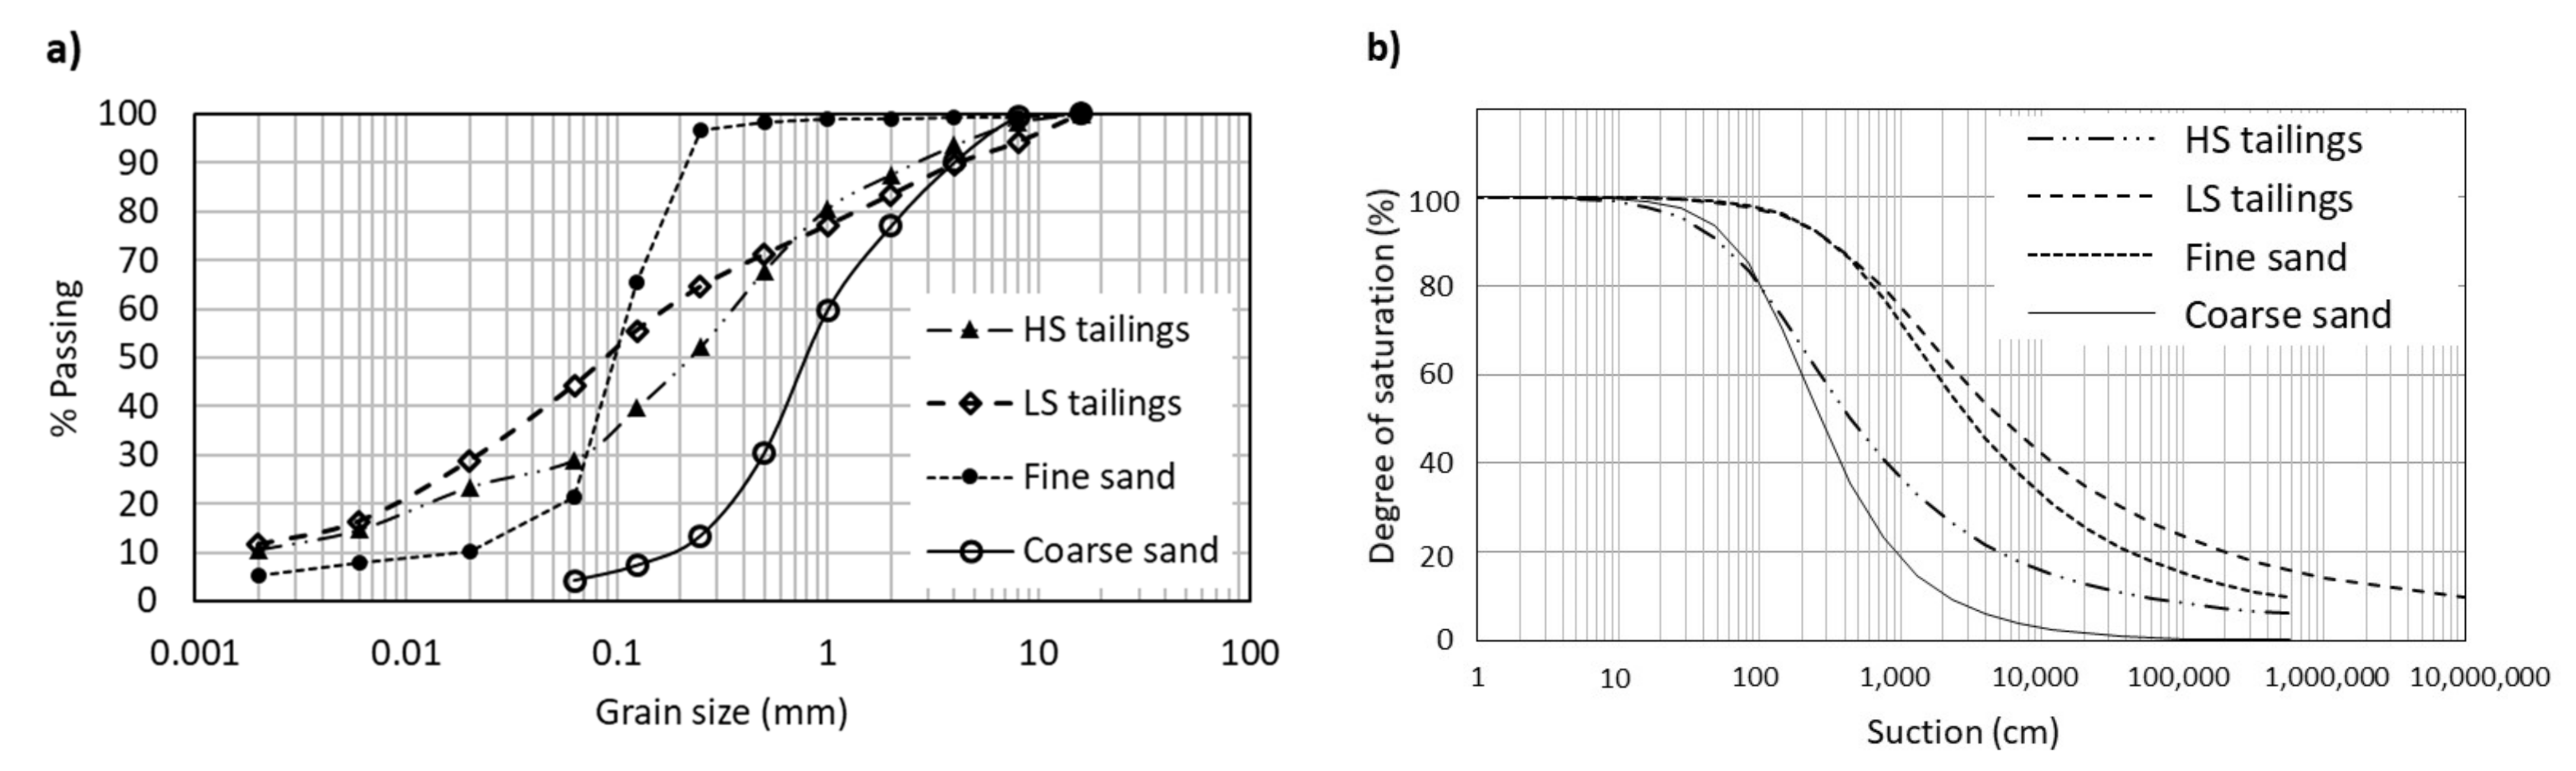
2.1.4. Physical and Hydraulic Properties

Grain size distribution was analysed by sieving following the NS 8005 standard (Table 3 and Figure 3). The specific gravity was measured following the NS-EN ISO 17892-3_2015 standard (Table 3). Water retention curves (WRC) were determined using a pressure plate apparatus (soil moisture) (ASTM D6836, 2016) and described using the van Genuchten (1980) model [51] (Figure 3). The air entry values (AEV) were determined graphically with the tangent method on water retention curves [52] (Table 3). Saturated hydraulic conductivities (ksat) were measured using falling head tests in rigid wall permeameters (ASTM D5856, 2015), and predicted using a Kozeny-Carman model (ksat-KC).
The hydraulic properties of the LS tailings were typical for hard rock mine tailings [53], with a saturated hydraulic conductivity around 7 × 10⁻⁸ m/s (Table 3) and an AEV of approximately 1.4 m (Figure 3). Materials with similar properties were proven efficient in CCBEs [54]. HS tailings were slightly coarser than LS tailings (Figure 3), with a lower AEV around 35 cm. The coarse sand used for the upper and lower capillary break layers showed a strong contrast with LS tailings, with a saturated hydraulic conductivity two orders of magnitude greater (ksat = 2 × 10⁻⁴ m/s) and an AEV of only a few centimetres. The fine sand used for the CCBE in the second column (see below) was finer than the coarse sand. However, the contrast of hydraulic conductivity and AEV was lower between fine sand and coarse sand compared to the contrast between LS tailings and coarse sand.

2.2. Column Tests

2.2.1. Setup and Instrumentation

Two 2 m high and 15 cm internal diameter Plexiglas columns were built to evaluate the performance of a CCBE with an MRL made of either LS tailings (column 1) or fine sand (column 2). Both materials were chosen because they were available close to the mine site and in sufficient amounts to be potentially included in the reclamation. In both columns, coarse sand was used for the capillary break layers above and below the MRL. Column tests are often used to evaluate the performance of cover systems [55,56,57]. Each column was filled with 1 meter of HS tailings (AMD generating tailings, representing the tailings to be reclaimed in situ), and covered with 40 cm of LS tailings (column 1) or fine sand (column 2), placed between two 20 cm thick layers of coarse sand.
Tailings and cover materials were installed directly in the columns in successive layers of approximately 10–15 cm. Each layer was initially saturated with water and compacted using a piston loaded with increasing weights, yielding increasing pressures of 2.2 kPa, 4.4 kPa, 8.9 kPa, and 17.8 kPa. Compaction lasted approximately 15 min for the first three weight steps (4, 8, and 16 kg), and 50–60 min for the last step (32 kg), after which the compaction rate tended to slow down towards zero. The bulk density, porosity, degree of saturation, void ratio, volumetric water content, and thickness of each layer of the large columns were measured.
Volumetric water content was continuously measured in columns 1 and 2 in the protection layer (top coarse sand), the MRL (top and bottom), the capillary break layer (bottom coarse sand), and the HS tailings (Figure 4), using 5TM sensors (METER Group Inc., Pullman, WA, USA). Suction was measured at the same locations using MPS-2 sensors (METER Group Inc., Pullman, WA, USA). The oxygen concentration was measured in the MRL and HS tailing layers, using optical oxygen dipping probes DP-PSt3 (PreSens Precision Sensing GmbH, Regensburg, Germany) (Figure 4).
In addition, two 50 cm high and 15 cm internal diameter control columns were built with HS tailing only (column 3) and LS tailings only (column 4). Tailings were put in place using the same approach as for the large columns. The small columns were instrumented with one pair of volumetric water content and suction sensors placed in the centre of the tailings (Figure 4).

2.2.2. Wetting and Drying Cycles

At the beginning of each wetting cycle, 1.5 L of deionized water (MilliQ water) was added at the top of the columns, corresponding to an equivalent precipitation of 85 mm. The top of the columns was left open to simulate the effect of evaporation. Potential evaporation was evaluated using an evaporation pan placed next to the columns, and temperature and relative humidity in the laboratory were measured hourly. A water-filled tube was connected to a 5-bar ceramic plate at the bottom of the columns and placed 1.5 m below the base of the columns to simulate a fixed water table. Water content, pore water pressure, and oxygen concentration in the columns were continuously monitored and recorded every 6 h using EM50 data loggers (Meter).
A total of 14 wetting-drying cycles were carried out over a period of 510 days, and each cycle lasted between 20 and 60 days. The 20 to 30 days of drought were considered representative of the relatively dry summer in this part of Norway, but longer cycles were also carried out and accounted for the climate change effect and possible longer droughts [58]. The same wetting-drying cycles were applied to the control columns (columns 3 and 4).

2.2.3. Chemical Analysis of the Column Leachates

After each watering event, the leachate, passed through ceramic filters (pore size <1.7 µm), was collected from the base of the columns. The leachate samples were not further filtered to include colloidal iron in the analysis, and represent the water quality in the field. The leachate was analysed for pH, electrical conductivity, and metal concentrations. The concentrations of major (Na, Mg, Al, S, Ca, and Fe) and trace elements (Mn, Cu, and Zn) were analysed by ICP-MS, using the Agilent 8800 triple quad ICP-MS instrument (Agilent Technologies, Santa Clara, CA, USA). The samples were preserved in 1 v/v% high purity HNO3 prior to analysis.

3. Column Test Results

3.1. Effectiveness of the Tested CCBEs as Oxygen Barriers

3.1.1. Degree of Saturation

The saturation behaviour in the columns was similar from one wetting-drying cycle to the other (Figure 5). The degree of saturation increased rapidly during the first few hours following the addition of water on top of the columns. After a few hours to a few days, the degree of saturation started to decrease again, first relatively rapidly (drainage), and then slightly more slowly (evaporation).
The degree of saturation in the coarse sand decreased rapidly and significantly after the wetting front passed by the water content sensors. For columns 1 and 2, the degree of saturation in both the top (evaporation barrier) and bottom (capillary break) coarse sand layers was between 10 and 25% around 8 days after the beginning of the wetting-drying cycle. This indicated that the coarse sand layers rapidly desaturated and, therefore, formed a capillary barrier effect with the fine-grained MRL.
In column 1, the MRL made of LS tailings remained at a degree of saturation greater than 85% both in the top and the bottom of the layer (Figure 5, column 1). The increase in water content was relatively limited when water was added on top of the column. The decrease of water content was also slow, which confirmed the good performance of the capillary barrier. In a few instances, the measured degree of saturation tended to increase slightly after a few days, which could be an artefact related to an increase of the electrical conductivity of the pore water [59], possibly because of some oxidation and/or dissolution of precipitates. The column 1 design therefore seemed efficient to maintain the MRL saturated in the tested conditions.
In column 2, the desaturation of the MRL made of fine sand was more pronounced (Figure 5, column 2). The degree of saturation in the bottom of the layer increased to 85% after the addition of water to the column, but then rapidly decreased to around 65% to 75% by the end of the wetting-drying cycles, i.e., below the usual target of 85% [13,53]. This low degree of saturation of the MRL suggests that the cover may not fulfil its function as an oxygen barrier. The decrease of water content over time was due to both drainage and evaporation, and indicated that the contrast between the fine and coarse sands was probably not sufficient to create a strong capillary barrier effect. The desaturation in the top of the moisture-retaining layer was more pronounced and could reach values as low as 55% (for example for cycle 7, which lasted 2 months).

3.1.2. Oxygen Concentrations

In column 1, the dissolved oxygen concentration in the MRL made of LS tailings varied between 0.2 and 2.9 mg/L O2, with values generally lower at the beginning of a wetting-drying cycle and higher at the end (Figure 6). This amplitude of variation in oxygen concentration was relatively small, which is consistent with the small variations of degree of saturation measured in the same layer (Figure 5). The fact that the oxygen concentration did not decrease significantly (and rather increased slightly during a wetting-drying cycle), indicates that the LS tailings used for the MRL did not consume oxygen and, therefore, were not significantly reactive. The performance of the CCBE made of LS tailings (column 1) as a barrier to oxygen diffusion to the reactive tailings seemed satisfying, and similar to other studies on cover systems [60].
In the MRL made of fine sand in column 2, the concentration of oxygen varied between 1 and 5 mg/L, and had a negative correlation with the degree of saturation. When the degree of saturation increased, the oxygen concentration decreased. When the degree of saturation decreased under the combined effect of drainage and evaporation, the oxygen concentration tended to increase. The effectiveness of the CCBE to limit oxygen diffusion to the reactive tailings was, therefore, strongly correlated with the degree of saturation in the fine-grained layer.
In the HS tailings, the oxygen concentration remained very low in both columns 1 and 2 (<0.2 mg/L in column 1, and <0.7 mg/L in column 2) after the first 15 days of the experiment, indicating that oxygen was almost completely consumed at the surface of the reactive tailings. This confirms their reactivity, as suggested by the significant concentration of pyrite detected in the initial material (9 wt%, Table 2).

3.2. Leachate Quality
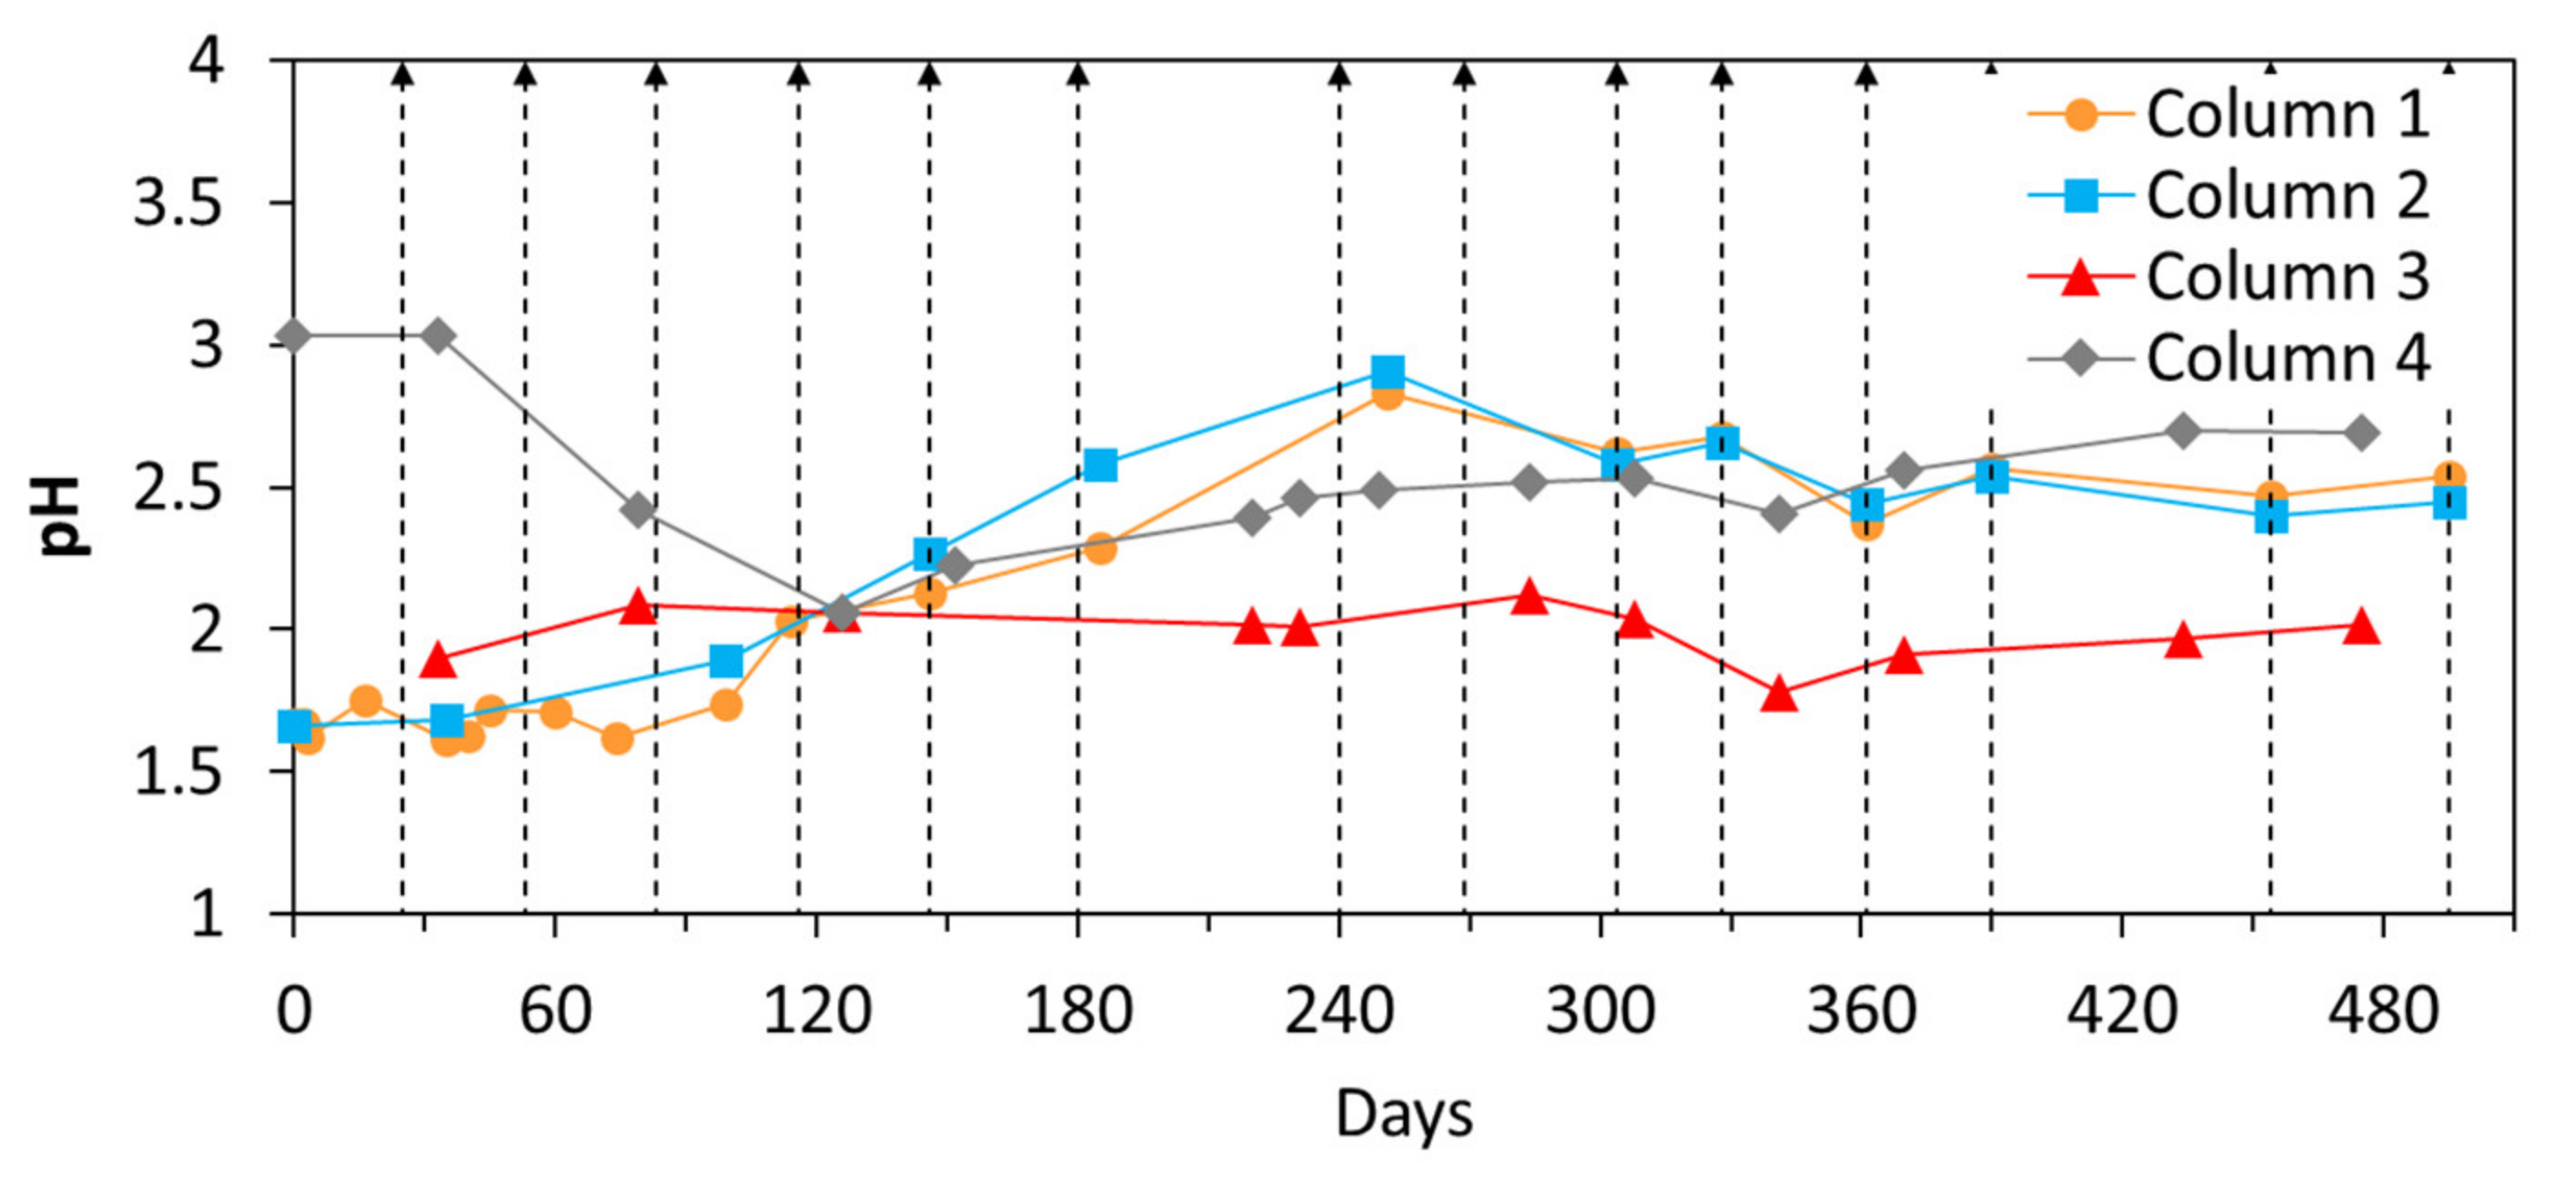
3.2.1. pH

In the control column with only HS tailings (column 3), pH values remained relatively constant around 2 ± 0.2 during the experiment (Figure 7).
In the case of HS tailings covered with a CCBE (columns 1 and 2), the initial pH was around 1.7, but increased after two wetting-drying cycles and reached approximately 2.5 after about 180 days (Figure 7). It then remained relatively constant for the rest of the experiment.
In the control column with only LS tailings (column 4), the pH first decreased from 3 to 2 during the first 120 days. It then increased slightly and stabilized around 2.5, i.e., a pH similar to the case of the covered HS tailings in columns 1 and 2.

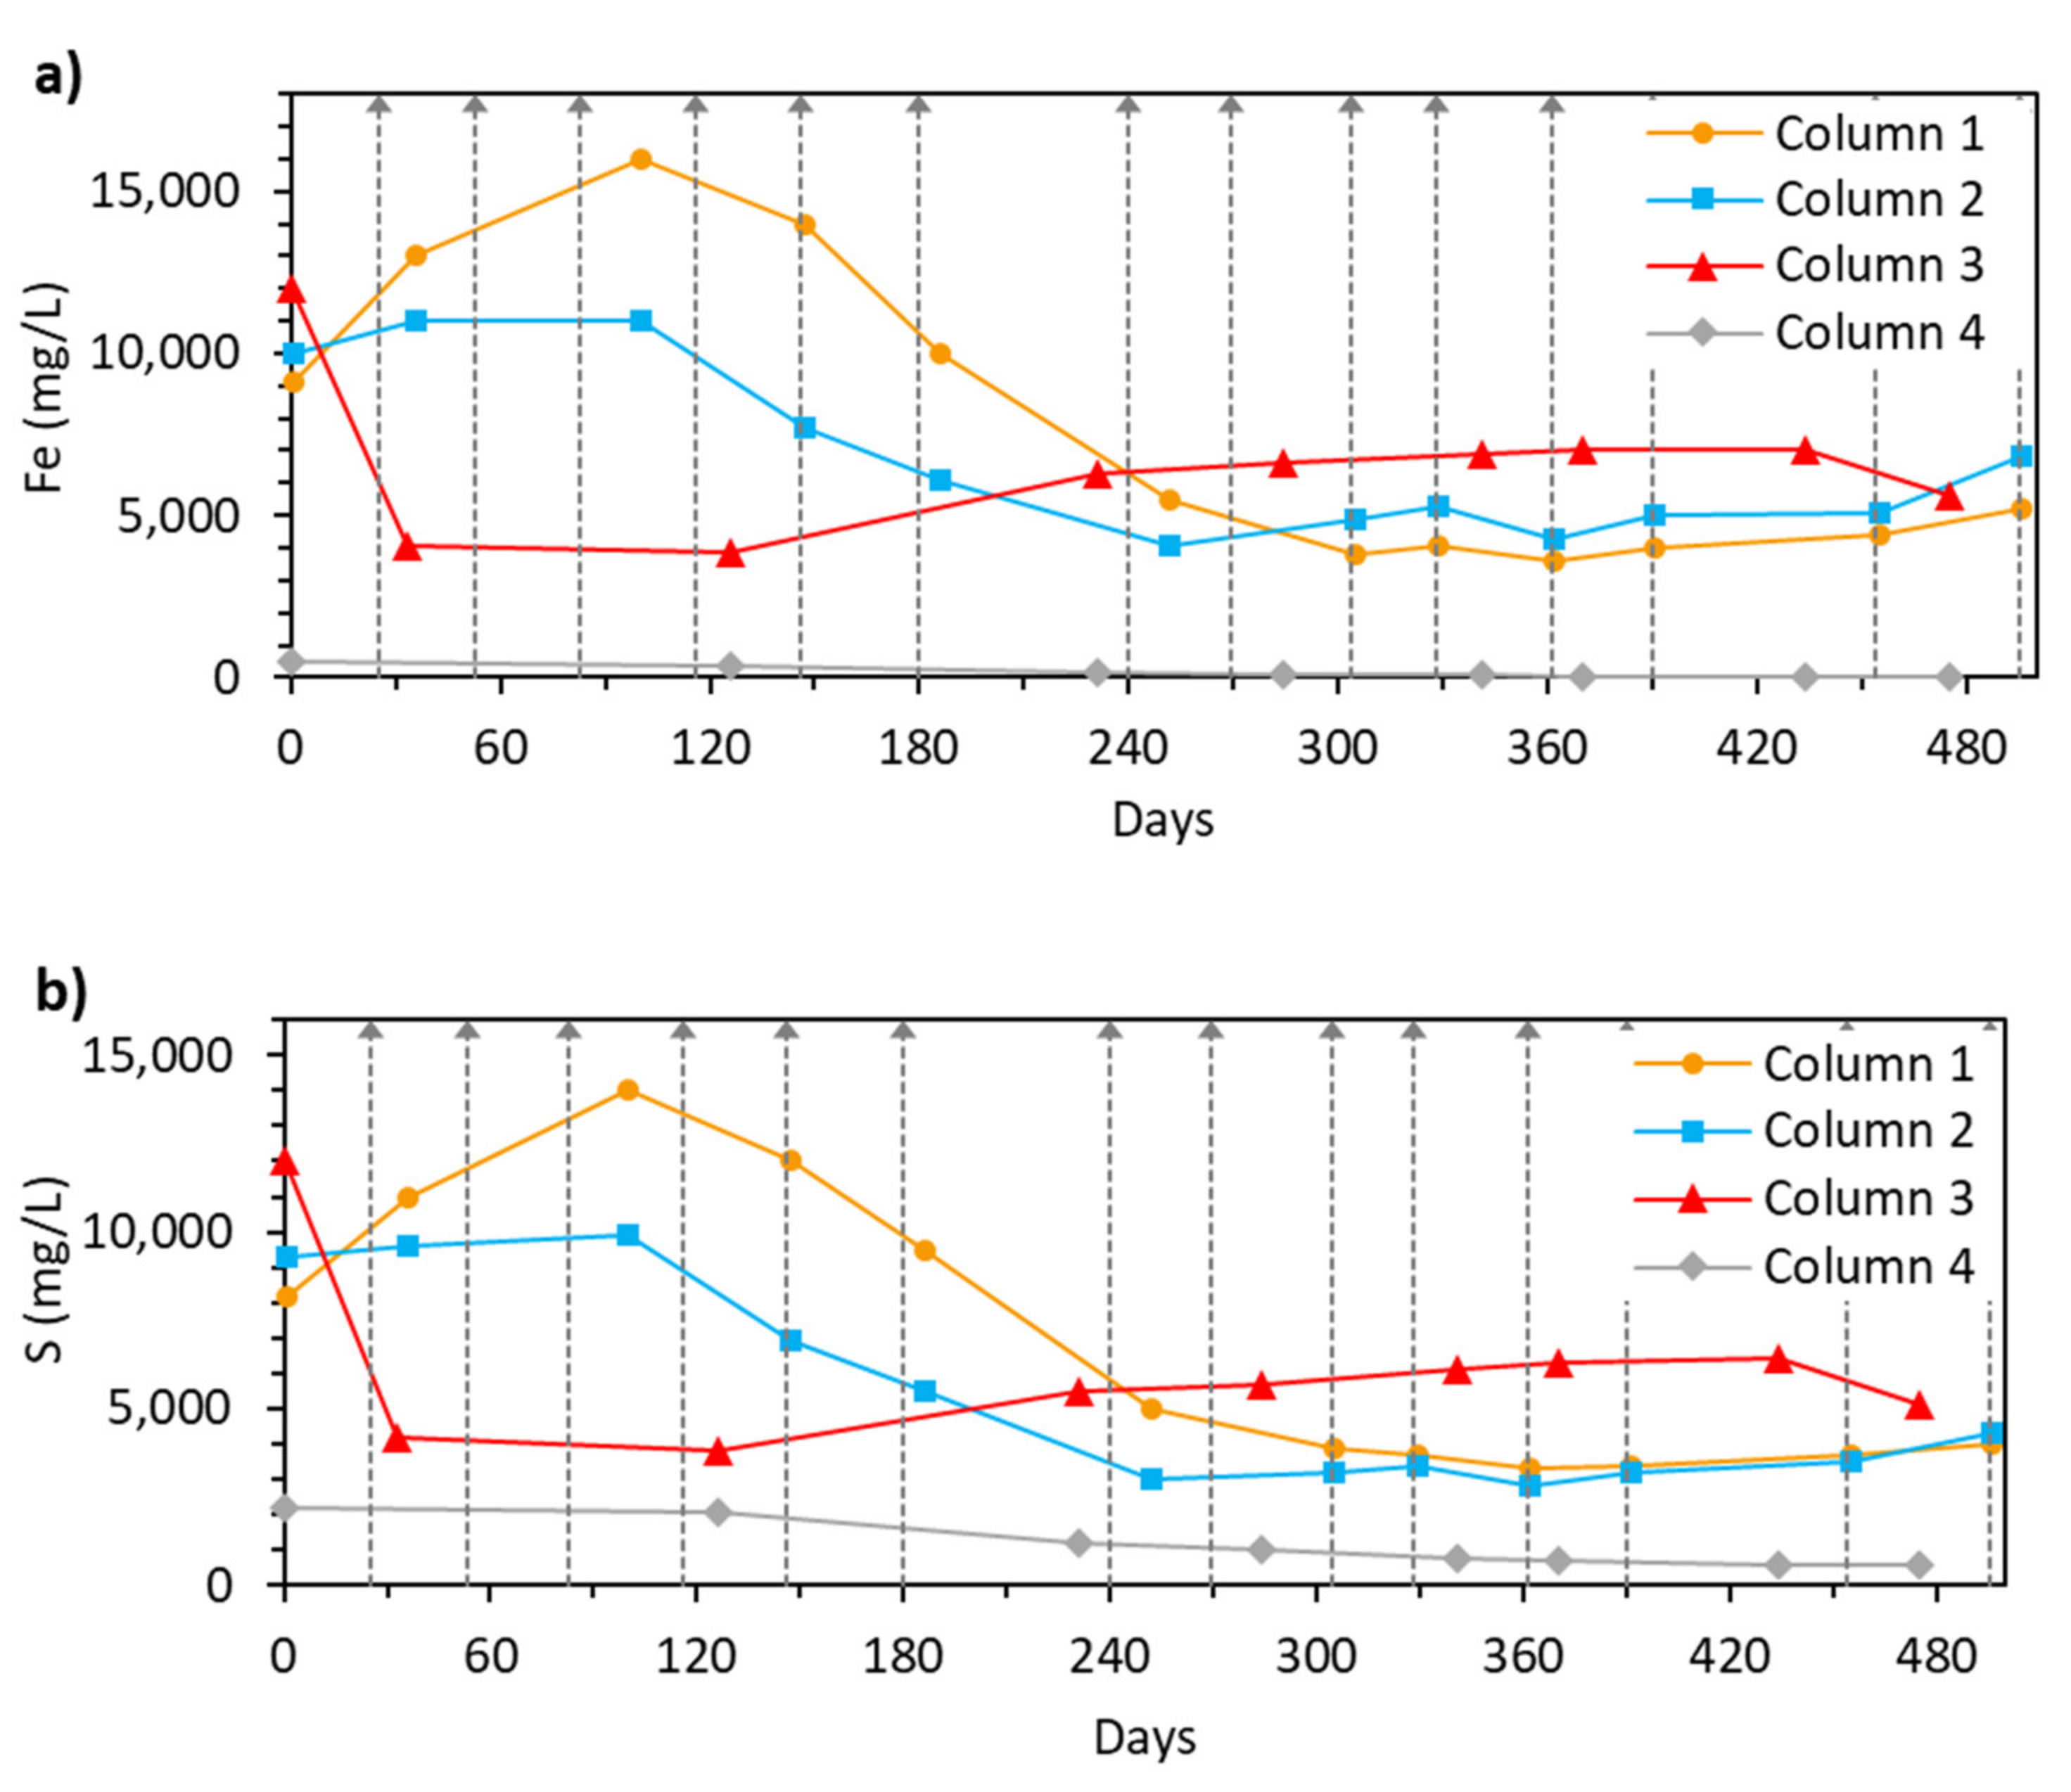
3.2.2. Fe and S Concentration
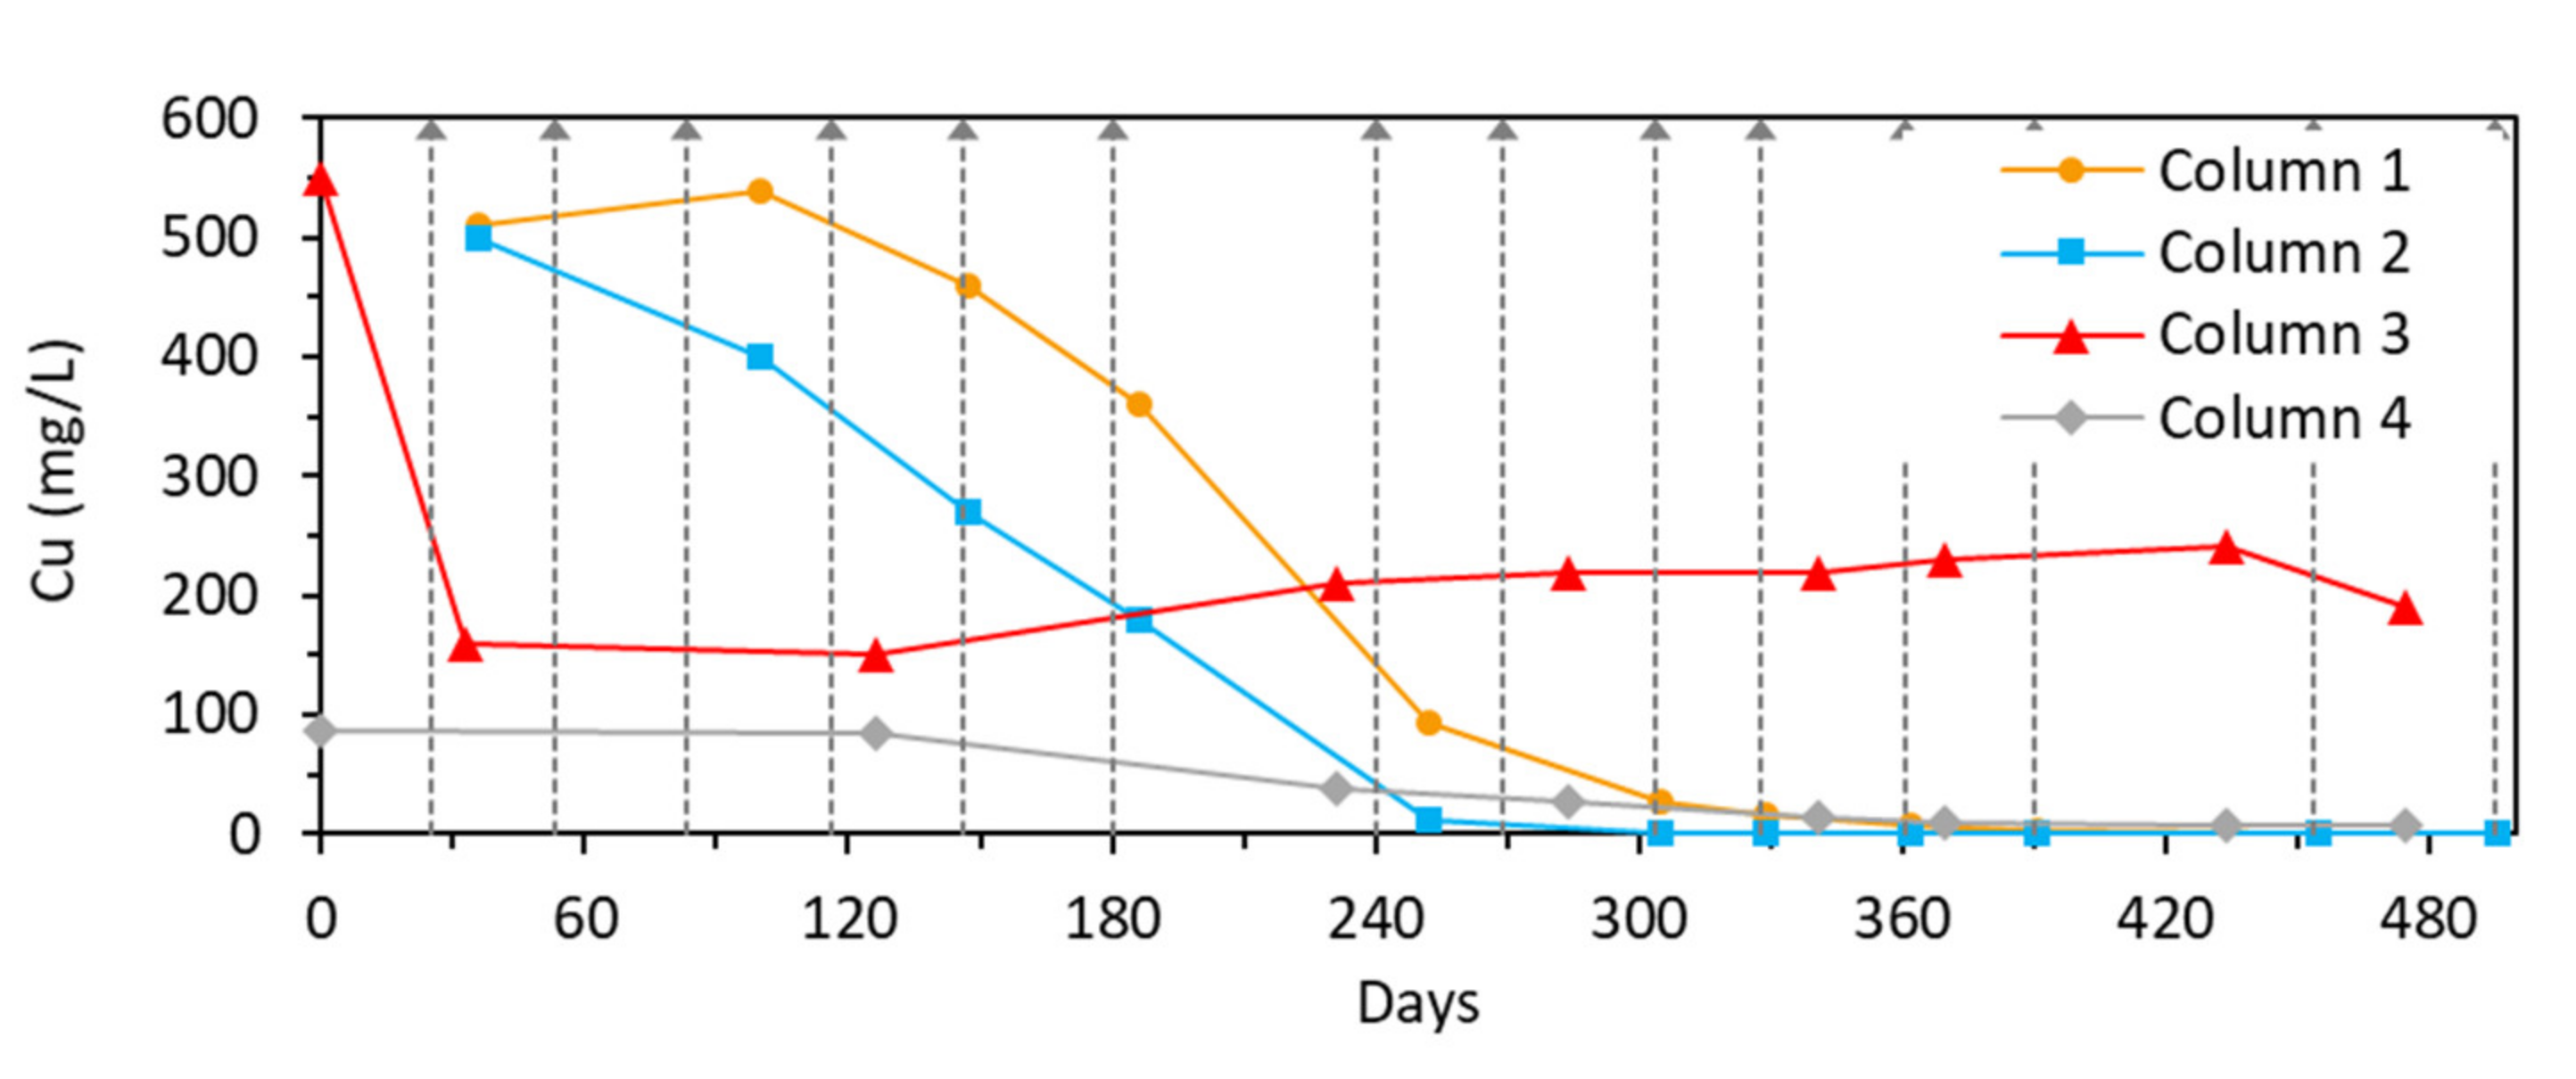
The Fe and S concentrations were strongly correlated and followed similar trends in each column (Figure 8).
In the control column with HS tailings (column 3), Fe and S concentrations were relatively constant and high after the first wetting-drying cycle. The average S concentration was 5900 ± 550 mg/L in the leachates collected from column 3 between 231 days and 475 days, and the average Fe concentration was 6600 ± 500 mg/L during the same period of time (Figure 8). In column 4 (LS tailings), S concentrations were significantly smaller and steadily decreased from 2100 mg/L to 560 mg/L after the two first wetting-drying cycles. Fe concentrations were also low and steadily decreased from 390 mg/L to 26 mg/L after the two first wetting-drying cycles (Figure 8).
For columns 1 and 2, initial Fe and S concentrations were similar to those of the control column 3. The Fe and S concentrations remained constant (column 2) or increased (column 1) during the first three months (i.e., the three first wetting-drying cycles) (Figure 8). After three months, which also corresponds to the time when the pH started to increase (Figure 7), the concentrations of Fe and S decreased in both columns 1 and 2 (Figure 8) and tended to stabilize around 4300 and 3900 mg/L, respectively. By the end of the test, Fe and S concentrations in the leachates of both columns 1 and 2 were similar and approximately 2-fold lower than in the control column 3 (HS tailings).

3.2.3. Cu

The evolution of Cu concentrations during the wetting-drying cycles was similar to the evolution of S and Fe concentrations, both for the control columns and the columns with a CCBE (Figure 8 and Figure 9).
The Cu concentrations in the control column with HS tailings (columns 3) were relatively constant around 220 mg/L throughout the wetting-drying cycles, and significantly greater than in column 4 (LS tailings), where Cu decreased from an initial concentration around 87 mg/L to below 7 mg/L by the end of the experiment.
During the first seven months of the experiments (i.e., the first 6 wetting-drying cycles), Cu concentrations were larger in the covered columns 1 and 2 than in the control column 3. Then, Cu concentrations decreased rapidly and reached concentrations below 50 µg/L after 330 days for column 2 (with fine sand as the MRL) and after 400 days for column 1 (with LS tailings as the MRL).

3.2.4. Other Elements

The concentrations of Na, Ca, Mg, Al, Mn, and Zn in column 3 (control column with HS tailings) decreased during the first two wetting-drying cycles and then remained relatively constant for the rest of the experiment (Figure 10). Concentrations of Na, Mn, and Zn were particularly low at below 4 mg/L.
Concentrations of Na, Mg, Al, Mn, and Zn in column 4 followed initially different trends, but stabilized to final concentrations that were similar (Na, Mn, and Zn) or significantly smaller (Mg and Al) than those in column 3 (Figure 10). The concentrations of Na in column 4 followed the same trend as in column 3, i.e., a rapid decrease during the first wetting-drying cycle and then a stabilization of the concentration at low values. Mg, Al, Mn, and Zn concentrations in column 4 also decreased between the start and the end of the experiment, but more slowly. The Ca concentrations measured in column 4 were greater than those of column 3, and, after the first few wetting-drying cycles, they stabilized at around 500 mg/L. This is consistent with the fact that the Ca solid content was one order of magnitude greater in the LS tailings than in the HS tailings (Table 1).
In columns 1 and 2, most of the elements showed significantly different behaviours compared to the reference columns; in particular, during the first 300 days (Figure 10). The time evolution of the concentrations of Mg, Al, and Mn was similar in columns 1 and 2, starting with a significant increase until day 180, followed by a decrease to 190 mg/L Mg, 78 mg/L Al, and 9 mg/L Mn in column 1, and 59 mg/L Mg, <12 µg/L Al, and 1.8 mg/L Mn in column 2. Na concentrations were initially relatively small and constant, but started to increase significantly after 120 days to around 40 mg/L and 70 mg/L in columns 1 and 2, respectively. This behaviour in columns 1 and 2 was contrary to the control columns, where Na concentrations remained below 4 mg/L.
The final concentrations of Mn and Zn were significantly greater in column 1 (covered with LS tailings) than in column 2 (covered with fine sand) and in the control columns. This is consistent with the fact that the LS tailings contained larger concentrations of Mn and Zn compared to the fine sand (Table 1).
The concentration of Ca in column 1 increased linearly from around 300 mg/L to 500 mg/L during the first 330 days and then remained relatively constant. Contrary to this, the concentration of Ca in column 2 was relatively constant around 250 mg/L during the first 180 days, and then decreased and stabilized around 50 mg/L for the rest of the test. The final concentration of Ca in column 2 was similar to that in column 3 (control column with HS tailings), whereas the final concentration of Ca in column 1 was significantly higher and similar to that in column 4 (control column with LS tailings). This result suggests that the LS tailings were the main source of Ca in the leachates from column 1.

4. Discussion

4.1. Reactivity of HS and LS Tailings

The HS tailings from the Folldal site were reactive and acid-generating, as expected from the relatively large concentration of sulfides detected by XRD (9 wt% pyrite, Table 2). The oxidation of HS tailings in column 3 led to the generation of a leachate, containing around 5600 mg/L of sulfur and 6400 mg/L of iron, and a pH of around 2.0. The concentrations of copper were also relatively high at around 200 mg/L. The geochemical behaviour of the HS tailings was relatively constant during the tests (Figure 7, Figure 8, Figure 9 and Figure 10), showing no signs of sulfide depletion. Even though 2 wt% calcite and 2 wt% dolomite were detected by XRD in the initial HS tailings (Table 2), carbonates did not seem to have a perceptible buffering effect on the leachate, which remained strongly acidic (pH < 2), and the Ca concentrations in the leachates also remained low.
The LS tailings alone (column 4) generated a leachate with relatively low Cu and S concentrations, especially towards the end of the experiment (Figure 8 and Figure 9). Nevertheless, Cu and S concentrations were not negligible during the first months, with up to 87 mg/L of Cu and 2100 mg/L of S. These relatively large initial concentrations are consistent with the composition of the initial material. Indeed, Fe, S, and Cu concentrations in the LS tailings were only one order of magnitude lower than in the HS tailings initially (Table 1), and, even though they were highly oxidized, the initial LS tailings contained traces of pyrite (Table 2). This suggests that the LS tailings could be a minor, but significant source of contamination, especially in the short term.
In addition, even though the pH in column 4 (LS tailings) was higher than in column 3 (HS tailings), it remained very acidic, with pH between 2 and 3 (Figure 7). The LS tailings initially contained only traces of pyrite (Table 2), and the concentrations of Fe and S leached from column 4 were relatively low (Figure 8), suggesting that the oxidation of the sulfides cannot explain the H+ production completely. The LS tailings also contained, initially, 1% jarosite and a total of 1.3 wt% SO42− (Table 2). Therefore, the acidity could have been produced by a combination of sulfide oxidation (Equation (1)) and the dissolution of soluble iron sulfate salts or jarosite (Equation (3)), followed by iron hydrolysis (Equation (4)) or catalysis of sulfide oxidation [61,62,63].
KFe3(SO4)2(OH)6(s) + 6 H+(aq) = 3 Fe+3(aq) + 6 H2O(l) + K+(aq) + 2 SO42−(aq)
3 Fe3+(aq) + 9 H2O(l) = 3 Fe(OH)3(s) + 9 H+(aq)
It is also possible that schwertmannite (Fe8O8(SO4)(OH)6), which typically forms in AMD [64], precipitates under the conditions of the column tests [65], releasing H+ (Equation (5)).
8 Fe3+(aq) + SO42−(aq) + 14 H2O(l) = Fe8O8(SO4)(OH)6(s) + 22 H+(aq)
Schwertmannite was not detected with XRD in the tailings at the end of the column tests (data not shown), but it is possible that it was present under poorly crystalline forms. Further investigation of Fe speciation is needed to identify the secondary phases precipitated and discuss further the processes that occurred within the columns.
Nevertheless, the pH seemed to slowly and steadily increase in column 4, and Fe, S, and Cu concentrations, which were very low by the end of the experiment, were still decreasing after 510 days. This could indicate a depletion in the source(s) of acidity and Cu contamination from the LS tailings.

4.2. Limited Performance of the CCBE Made of LS Tailings

The CCBE in column 1 (LS tailings as a MRL) was efficient to maintain a high degree of saturation in the MRL, and it, therefore, created an efficient barrier to oxygen. As a positive consequence, the concentrations of Fe and S in column 1 decreased by the end of the experiment and were about two-fold smaller than in column 3, where the HS tailings were left exposed to atmospheric conditions and oxidation. However, Fe and S concentrations remained relatively high in column 1, with around 4000 mg/L and 3700 mg/L, respectively. The LS tailings most likely contributed to these results (see Section 4.1), but cannot account for all the Fe and S measured in the leachate of column 1. Indeed, Fe and S concentrations were, respectively, one and two orders of magnitude lower in the control column 4 compared to columns 1 (with LS tailings) and 2 (without LS tailings) after a number of wetting-drying cycles (Figure 8). The concentrations of Fe and S, therefore, seem to indicate that oxidation of sulfide minerals continued in the covered HS tailings (at least to a certain extent), despite the efficient oxygen barrier. The cover therefore appears only partially efficient at preventing oxidation. One explanation could be that indirect oxidation (Equation (2)) continued to oxidize the HS tailings. Indeed, indirect oxidation can occur when iron (Fe(III)) remains in solution (at low pH) and acts as the main electron acceptor [30,31]. The Fe(III)-promoted oxidation of sulfide minerals under anoxic conditions was observed in the laboratory, for example in the case of pyrite [32,33,34]. Sulfide oxidation in the HS tailings would also explain the low pH observed in column 1, even though protons may also have been released by the LS tailings (see previous section). The Fe(III) causing indirect oxidation was probably mobilised from the LS tailings, where abundant Fe oxyhydroxides were observed by SEM-EDX. Indeed, column 4 showed that iron concentrations were between 520 mg/L during the first wetting-drying cycles and 26 mg/L by the end of the test. The amorphous character or poor crystallinity of Fe(III)-(oxy)hydroxide, which would explain the fact that no Fe hydroxide was detected by XRD, could have favoured the mobilisation of Fe(III) at a low pH. Fe(III) could also be mobilised from the HS tailings themselves, where some Fe oxyhydroxides were observed visually and using SEM-EDX. In the HS tailings, where O2 concentrations are low, Fe(III) ions may also be produced by reductive dissolution of Fe oxyhydroxides, followed by Fe(II) oxidation. The limited efficiency of oxygen barrier covers to prevent oxidation from partially oxidized tailings was previously highlighted [29]. Pabst et al. (2018) [29] showed that, in the case of tailings that are already partially oxidized, relying only on typical targets for oxygen fluxes may be misleading. Even though the oxygen flux remained below 50 g/m2/year, which is a practical objective for cover design [13,25], hydrogeochemical simulations indicated that significant AMD generation may continue over time. Therefore, based on our column test as well as the literature, an MRL saturation degree above 85% does not seem sufficient to guarantee an improvement of the water quality in pre-oxidized tailings.
In addition, the typical criterion of 85% saturation to assess the performance of an MRL can also be questioned by comparing the performance of columns 1 (LS as MRL) and column 2 (fine sand as MRL). Indeed, the CCBE in column 2 was not able to maintain the degree of saturation in the MRL (made of fine sand) above 85%, i.e., the usual performance target. Yet, the performance of the CCBE made of fine sand was as good as the performance of the CCBE made of almost-saturated LS tailings. The poor water retention of the fine sand MRL could explain the low pH and the relatively high concentrations of Fe and S in the leachate (approximately 50% of concentrations measured in the control column 3). Despite the limited efficiency of the MRL made of fine sand, Fe and S concentrations were similar to those measured in column 1. This could indicate that oxidation in column 2 was also controlled by indirect mechanisms. Indirect oxidation can indeed outcompete direct oxidation under low pH conditions (Moses et al., 1987 [32]). In addition, considering that the concentration of Fe in the fine sand is one order of magnitude lower than in the LS tailings (0.5% compared to 4%, Table 1), the similar Fe and S concentrations in columns 1 and 2 could indicate that Fe(III) actually originated from the HS tailings.
By the end of the experiment, when the pH was relatively stable in all the columns, the pH values in both covered columns were still very low (pH < 3). An increase of nearly 1 pH unit compared to the uncovered HS tailings showed that the CCBE did have a positive, yet limited, effect on the water quality. However, freshwater with a pH lower than 5 is classified as “very bad” water quality in the EU Water framework directive [66].
In addition, the covered HS tailings leached significantly more Mn and Zn than the uncovered control with only HS tailings. This secondary effect might be of minor consequence, as the concentrations of Zn remained in the same range as in the control column 4 (only LS tailings), and the Mn concentrations were still decreasing towards the end of the experiment, suggesting that the release of Mn would be transitory only. Nevertheless, these results suggest a potential risk of undesired contamination due to the implementation of a cover on HS tailings.

4.3. Positive Effects on Cu Concentrations

Despite the limited efficiency of the CCBE in terms of sulfide oxidation and acid mine drainage generation, both of the CCBE tested allowed a decrease of nearly 100% Cu concentrations by the end of the experiment, compared to initial Cu concentrations (Figure 9). The CCBE with an MRL made of fine sand, despite unsatisfying water retention performance, was particularly efficient for decreasing Cu concentrations in the leachate. Indeed, final concentrations of Cu in column 2 (below 50 µg/L) were much lower than in the control column 3 (190 mg/L), and even lower than in column 1 (63 µg/L). By the end of the column tests, only 4 wt% and 3 wt% of the Cu initially present in the HS tailings had been leached out of columns 1 and 2, respectively (Table 4). This suggests that the decrease in Cu concentrations in the leachate from columns 1 and 2 was due to lower rates of oxidation/dissolution rather than Cu depletion. Such a decrease of Cu leaching could actually contribute to the reclamation of the Folldal site, and improve the conditions in the river Folla.
Cu is typically associated with sulfide minerals in sulfide-rich mine tailings. Therefore, there is an apparent contradiction between the extensive decrease of Cu concentrations and the only very limited decrease of sulfide oxidation. A hypothesis could be that Cu is associated with a mineral phase that is less reactive than bulk pyrite under the conditions of the experiment. SEM-EDX analysis (Figure 2) showed that at least some Cu is associated with chalcopyrite (CuFeS2), which is typically less reactive than pyrite [67]. The changes of geochemical conditions after 300 days may have been sufficient to limit chalcopyrite reactivity, but not pyrite oxidation. Chalcopyrite could have been overlooked by XRD due to concentrations below XRD detection limit. It is also possible that a part of the Cu leached during the first 300 days was released by the dissolution of Cu-sorbed Fe(III)-phases upon decrease of pH, but there is no data available that can confirm this at the moment and no Cu was detected in association with Fe-oxides using SEM-EDX.
A more detailed study of the speciation of Fe and Cu and the crystallinity of Fe, Cu-bearing phases could provide data to test these hypotheses. A better understanding of the processes responsible for the behaviour of Cu is critical for improving the water quality at the Folldal mine site over the long-term.

5. Conclusions

The local LS tailings seemed efficient as a water-retention material for building a CCBE. The use of a local waste as a resource material presents economic and practical advantages. However, acid leachate was still produced after 510 days of column testing with a CCBE. Moreover, despite some improvement, the oxidation of sulfide minerals seemed to continue in the HS tailings, which was probably due to indirect oxidation with Fe(III) mobilised under low pH conditions. The performance of the CCBE with the LS tailings was actually not superior to the performance of a CCBE with a non-efficient MRL.
Nevertheless, the tested CCBE proved efficient at decreasing the concentration of Cu in the leachate significantly. Future research efforts should aim at determining the processes responsible for the sulfide oxidation under suboxic conditions and confirm the role of indirect oxidation. It would also be relevant to study the speciation of Cu in the mine tailings in order to explain why Cu concentrations are proportionally responding more rapidly than Fe and S after applying a CCBE, despite an apparently continued oxidation of sulfide.
If a CCBE was chosen as a reclamation solution for the Folldal site, it would probably be required to complement the strategy with, for example, measures to treat the leachates, at least during the first months or years after construction of the CCBE.

Author Contributions

Conceptualization, methodology and validation, T.P. and A.B.S.; formal analysis, M.K.T., A.B.S., A.M.V. and S.K.G.; site investigation, T.P., M.K.T., G.O., G.D.B. and M.K.; data management, M.K.T., A.M.V., G.D.-A. and G.D.B.; writing—original draft preparation, G.D.-A. and T.P.; writing—review and editing, T.P., G.D.-A., G.D.B., G.O. and C.S.; supervision, G.D.B. and G.O.; funding acquisition, G.D.B. and G.O.; project administration, G.D.B. All authors have read and agreed to the published version of the manuscript.

Funding

Funding for this research was supplied by the Norwegian Directorate of Mining, in the scope of the project 20140321 Folldal gruver—vurdering av avrenning til Folla, as well as the Research Council of Norway and internal funds at the Norwegian Geotechnical Institute for the research projects GBV20160117 and SP12: “Towards sustainable mine tailings” (https://www.ngi.no/eng/Projects/-Sustainable-mine-tailings/About-the-project, accessed on 5 September 2021). The ACP was funded by internal funds at the Norwegian Geotechnical Institute.

Acknowledgments

The authors acknowledge Valentina Zivanovic, at the isotope laboratory of the Norwegian University of Life Science (NMBU), for ICP-MS and ICP-OES analysis. Siri Simonsen is also thanked for SEM-EDX analysis at the University of Oslo. Lorenza Sardisco at xrayminerals, UK, is acknowledged for doing the XRD analysis and Rietveld refinement.

Conflicts of Interest

The authors declare no conflict of interest.

References

  1. Spitz, K.; Trudinger, J. Mining and the Environment. From Ore to Metal, 2nd ed.; CRC Press; Taylor and Francis: London, UK, 2019; 812p. [Google Scholar]
  2. Hawley, P.M.; Cunning, J. Guidelines for Mine Waste Dump and Stockpile Design; CRC Press; Taylor and Francis: London, UK, 2017; 368p. [Google Scholar]
  3. Blowes, D.W.; Ptacek, C.J.; Jambor, J.L.; Weisener, C.G.; Paktunc, D.; Gould, W.D.; Johnson, D.B. The geochemistry of acid mine drainage. In Treatise on Geochemistry, 2nd ed.; Holland, H., Turekian, K., Eds.; Elsevier: Amsterdam, The Netherlands, 2014; Volume 11, pp. 131–190. [Google Scholar]
  4. Nordstrom, D.K.; Blowes, D.W.; Ptacek, C.J. Hydrogeochemistry and microbiology of mine drainage: An update. Appl. Geochem. 2015, 57, 3–16. [Google Scholar] [CrossRef]
  5. Neculita, C.M.; Zagury, G.J.; Bussière, B. Passive treatment of acid mine drainage in bioreactors using sulfate-reducing bacteria: Critical review and research needs. J. Environ. Qual. 2007, 36, 1–16. [Google Scholar] [CrossRef]
  6. Skousen, J.; Zipper, C.; Rose, A.; Ziemkiewicz, P.F.; Nairn, R.; McDonald, L.M.; Kleinmann, R.L. Review of passive systems for acid mine drainage treatment. Mine Water Environ. 2016, 36, 133–153. [Google Scholar] [CrossRef] [Green Version]
  7. Ben Ali, H.E.; Neculita, C.M.; Molson, J.W.; Maqsoud, A.; Zagury, G.J. Performance of passive systems for mine drainage treatment at lowtemperature and high salinity: A review. Miner. Eng. 2019, 134, 325–344. [Google Scholar] [CrossRef]
  8. Aubertin, M.; Bussière, B.; Pabst, T.; James, M.; Mbonimpa, M.; Farid, A.; De, A.; Reddy, K.R.; Yesiller, N.; Zekkos, D. Review of the reclamation techniques for acid-generating mine wastes upon closure of disposal sites. In Proceedings of Geo-Chicago; Zekkos, D., Farid, A., De, A., Reddy, K.R., Yesiller, N., Eds.; American Society of Civil Engineers: Reston, VA, USA; pp. 343–358.
  9. Aubertin, M.; Bussière, B.; Bernier, L. Environnement et Gestion des Rejets Miniers; Presses Polytechnique Internationales: Montreal, QC, Canada, 2002. [Google Scholar]
  10. Bussière, B.; Guittonny, M. Hard rock mine reclamation. In Prediction to Management of Acid Mine Drainage; CRC Press; Taylor and Francis: London, UK, 2020; 408p. [Google Scholar]
  11. Awoh, A.S.; Mbonimpa, M.; Bussière, B. Field study of the chemical and physical stability of highly sulphide-rich tailings stored under a shallow water cover. Mine Water Environ. 2013, 32, 42–55. [Google Scholar] [CrossRef]
  12. Awoh, A.S.; Mbonimpa, M.; Bussiere, B. Water covers. In Hard Rock Mine Reclamation. From Prediction to Management of Acid Mine Drainage; Bussière, B., Guittonny, M., Eds.; CRC Press; Taylor and Francis: London, UK, 2020; 408p. [Google Scholar]
  13. Aubertin, M.; Bussière, B.; Monzon, M.; Joanes, A.M.; Gagnon, D.; Barbera, J.M.; Aachib, M.; Bédard, C.; Chapuis, R.P.; Bernier, L. Etude sur les Barrières Sèches Construites à Partir des Résidus Miniers. Phase II, Essais en Place; Research Report, Projet CDT P1899. NEDEM/MEND 2.22.2c; Bureau de la Recherche et Centre de Developpement Technologique, Ecole Polytechnique de Montreal: Montreal, QC, Canada, 1999. [Google Scholar]
  14. Bussière, B.; Aubertin, M.; Chapuis, R.P. The behavior of inclined covers used as oxygen barriers. Can. Geotech. J. 2003, 40, 512–535. [Google Scholar] [CrossRef]
  15. Demers, I.; Pabst, T. Covers with capillary barrier effects. In Hard Rock Mine Reclamation. From Prediction to Management of Acid Mine Drainage; Bussière, B., Guittonny, M., Eds.; CRC Press; Taylor and Francis: London, UK, 2020; 408p. [Google Scholar]
  16. Ouangrawa, M.; Molson, J.; Aubertin, M.; Bussière, B.; Zagury, G. Reactive transport modelling of mine tailings columns with capillarity-induced high water saturation for preventing sulfide oxidation. Appl. Geochem. 2009, 24, 1312–1323. [Google Scholar] [CrossRef]
  17. Pabst, T.; Aubertin, M.; Bussière, B.; Molson, J. Experimental and numerical evaluation of single-layer covers placed on acid-generating tailings. Geotech. Geol. Eng. 2017, 35, 1421–1438. [Google Scholar] [CrossRef]
  18. Pabst, T.; Molson, J.; Aubertin, M.; Bussière, B. Reactive transport modelling of the hydro-geochemical behaviour of partially oxidized acid-generating mine tailings with a monolayer cover. Appl. Geochem. 2017, 78, 219–233. [Google Scholar] [CrossRef]
  19. Pabst, T. Elevated water table with monolayer covers. In Hard Rock Mine Reclamation. From Prediction to Management of Acid Mine Drainage; Bussière, B., Guittonny, M., Eds.; CRC Press; Taylor and Francis: London, UK, 2020; 408p. [Google Scholar]
  20. Collin, M.; Rasmuson, A. A comparison of gas diffusivity models for unsaturated porous media. Soil Sci. Soc. Am. J. 1988, 52, 1559–1565. [Google Scholar] [CrossRef]
  21. Mbonimpa, M.; Boulanger-Martel, V.; Bussière, B.; Maqsoud, A. Water, gas, and heat movement in cover materials. In Hard Rock Mine Reclamation. From Prediction to Management of Acid Mine Drainage; Bussière, B., Guittonny, M., Eds.; CRC Press; Taylor and Francis: London, UK, 2020; 408p. [Google Scholar]
  22. Nicholson, R.V.; Gillham, R.W.; Cherry, J.A.; Reardon, E.J. Reduction of acid generation through the use of moisture-retaining cover layers as oxygen barriers. Can. Geotech. J. 1997, 26, 1–8. [Google Scholar] [CrossRef]
  23. Ricard, J.; Aubertin, M.; Firlotte, F.; Knapp, R.; McMullen, J.; Julien, M. Design and construction of a dry cover made of tailings for the closure of Les Terrains Aurifères site, Malartic, Québec, Canada. In Proceedings of the 4th International Conference on Acid Rock Drainage, Vancouver, BC, Canada, 31 May–6 June 1997; pp. 1515–1530. [Google Scholar]
  24. Bussière, B.; Maqsoud, A.; Aubertin, M.; Martschuk, J.; McMullen, J.; Julien, M. Performance of the oxygen limiting cover at the LTA site, Malartic, Quebec. CIM Bull. 2006, 1, 1–11. [Google Scholar]
  25. Dagenais, A.-M.; Aubertin, M.; Bussière, B.; Cyr, J.; Fontaine, R. Auscultation et suivi du recouvrement multicouche construit au site minier Lorraine, Latulipe, Québec. In Proceedings of the Défis & Perspectives: Symposium sur l’Environnement et les Mines, Rouyn-Noranda, QC, Canada, 3–5 November 2002; pp. 3–5. [Google Scholar]
  26. Dagenais, A.-M. Techniques de Contrôle du Drainage Minier Acide Basées sur les Effets Capillaires. Ph.D. Thesis, École Polytechnique de Montréal, Montreal, QC, Canada, 2005. [Google Scholar]
  27. Dagenais, A.M.; Aubertin, M.; Bussière, B. Parametric study on the water content profiles and oxidation rates in nearly saturated tailings above the water table. In Proceedings of the 7th International Conference on Acid Rock Drainage, St-Louis, MO, USA, 27–30 March 2006; pp. 405–420. [Google Scholar]
  28. Ethier, M.-P.; Bussière, B.; Broda, S.; Aubertin, M. Three-dimensional hydrogeological modeling to assess the elevated-water-table technique for controlling acid generation from an abandoned tailings site in Quebec, Canada. Hydrogeol. J. 2018, 26, 1201–1219. [Google Scholar] [CrossRef]
  29. Pabst, T.; Bussière, B.; Aubertin, M.; Molson, J. Comparative performance of cover systems to prevent acid mine drainage from pre-oxidized tailings: A numerical hydro-geochemical assessment. J. Contam. Hydrol. 2018, 214, 39–53. [Google Scholar] [CrossRef]
  30. Williamson, M.A.; Rimstidt, J. The kinetics and electrochemical rate-determining step of aqueous pyrite oxidation. Geochim. Cosmochim. Acta 1994, 58, 5443–5454. [Google Scholar] [CrossRef]
  31. Nordstrom, D.K. Advances in the hydrogeochemistry and microbiology of acid mine waters. Int. Geol. Rev. 2000, 42, 499–515. [Google Scholar] [CrossRef]
  32. Moses, C.O.; Nordstrom, D.K.; Herman, J.S.; Mills, A.L. Aqueous pyrite oxidation by dissolved oxygen and by ferric iron. Geochim. Cosmochim. Acta 1987, 51, 1561–1571. [Google Scholar] [CrossRef]
  33. Sasaki, K.; Tsunekawa, M.; Ohtsuka, T.; Konno, H. Confirmation of a sulfur-rich layer on pyrite after oxidative dis-solution by Fe (lIl) ions around pH2. Geochim. Cosmochim. Acta 1995, 59, 3155–3158. [Google Scholar] [CrossRef]
  34. Mazumdar, A.; Goldberg, T.; Strauss, H. Abiotic oxidation of pyrite by Fe(III) in acidic media and its implications for sulfur isotope measurements of lattice-bound sulfate in sediments. Chem. Geol. 2008, 253, 30–37. [Google Scholar] [CrossRef]
  35. Janzen, M.P.; Nicholson, R.V.; Scharer, J.M. Pyrrhotite reaction kinetics: Reaction rates for oxidation by oxygen, ferric iron, and for nonoxidative dissolution. Geochim. Cosmochim. Acta 2000, 64, 1511–1522. [Google Scholar] [CrossRef]
  36. Bussière, B.; Aubertin, M. Clean tailings as cover material for preventing acid mine drainage: An in situ experiment. In Proceedings of the Sudbury 2003, Mining and the Environment Conference, Sudbury, ON, Canada, 5–28 May 2003; Volume 99, pp. 19–28. [Google Scholar]
  37. Bussière, B.; Aubertin, M.; Mbonimpa, M.; Molson, J.; Chapuis, R.P. Field experimental cells to evaluate the hydrogeological behaviour of oxygen barriers made of silty materials. Can. Geotech. J. 2007, 44, 245–265. [Google Scholar] [CrossRef]
  38. Benzaazoua, M.; Bussière, B.; Kongolo, M.; McLaughlin, J.; Marion, P. Environmental desulphurization of four Canadian mine tailings using froth flotation. Int. J. Miner. Proc. 2000, 60, 57–74. [Google Scholar] [CrossRef]
  39. Benzaazoua, M.; Bussière, B.; Demers, I.; Aubertin, M.; Fried, E.; Blier, A. Integrated mine tailings management by combining environmental desulphurization and cemented paste backfill: Application to mine Doyon, Quebec, Canada. Miner. Eng. 2008, 21, 330–340. [Google Scholar] [CrossRef]
  40. Benzaazoua, M.; Aubertin, M.; Mbonimpa, M. A laboratory study of covers made of low-sulphide tailings to prevent acid mine drainage. Environ. Earth Sci. 2003, 45, 609–622. [Google Scholar] [CrossRef]
  41. Bjerkgård, T.; Scack, S.P.; Siedlecka, A. Folldal. Berggrunnskart; Folldal; 15192; 1:50 000; Foreløpig Utgave Plotteversjon. In Folldal. Berggrunnskart; Folldal; 15192; 1:50 000; Foreløpig Utgave Plotteversjon; Norges Geologiske Undersokelse: Trondheim, Norway, 2002. [Google Scholar]
  42. Folldal Verk. Folldal Verk Gjennom 240 År: Historiske Trekk, 1748–1988; Folldal verk: Folldal, Norway, 1988; 116p, Available online: https://urn.nb.no/URN:NBN:no-nb_digibok_2011011103034 (accessed on 16 August 2021).
  43. Streitlien, I.A. Bygdebok for Folldal. B.3: Geologi, Arkeologi m.m.; Trykk AS: Elverum, Norway, 1980; 326p, Available online: https://urn.nb.no/URN:NBN:no-nbdigibok2014052606018 (accessed on 16 August 2021).
  44. Iversen, E.; Knudsen, C.H. Miljøsikringsfondet Folldal verk. Utredning av Forurensningsbegrensende Tiltak i Gruveområdet i Folldal Sentrum; Norsk Institutt for Vannforskning: Oslo, Norway, 2002. [Google Scholar]
  45. Norwegian Environmental Agency. Faktaark Vannregistreringer og Måledata, Vannlokalitet: Folla Oppstrøms Folla Sentrum ved Skytebanen (FO5), 1970 to 2020. Available online: https://vannmiljofaktaark.miljodirektoratet.no/Home/Details/44732 (accessed on 14 June 2021).
  46. Norwegian Environmental Agency. Faktaark Vannregistreringer og Måledata, Vannlokalitet: Folla Nedstrøms Gruve (F3), 2015 to 2020. Available online: https://vannmiljofaktaark.miljodirektoratet.no/Home/Details/92634 (accessed on 16 August 2021).
  47. Miljødirektoratet. Forurensning fra tidligere gruvedrift i folldal sentrum; Miljødirektoratet, Nærings- og Handelsdepartementet, Eds.; Environmental Protection Agency: Oslo, Norway, 2003. [Google Scholar]
  48. De Caritat, P.; Reimann, C.; Smith, D.; Wang, X. Chemical elements in the environment: Multi-element geochemical datasets from continental- to national-scale surveys on four continents. Appl. Geochem. 2017, 89, 150–159. [Google Scholar] [CrossRef]
  49. Sobeck, A.A.; Schuller, W.A.; Freeman, J.R.; Smith, R.M. Field and Laboratory Methods Applicable to Overburdens and Minesoils; EPA-600/2-78-054; U.S. Environmental Protection Agency: Washington, DC, USA, 1978.
  50. Lawrence, R.W.; Wang, Y. Determination of neutralization potential in the prediction of acid rock drainage. In Proceedings of the 4th International Conference on Acid Rock Drainage, Vancouver, BC, Canada, 31 May–6 June 1997; Volume 1, pp. 449–464. [Google Scholar]
  51. Van Genuchten, M.T. A closed-form equation for predicting the hydraulic conductivity of unsaturated soils. Soil Sci. Soc. Am. J. 1980, 44, 892–898. [Google Scholar] [CrossRef] [Green Version]
  52. Fredlund, D.; Xing, A. Equations for the soil-water characteristic curve. Can. Geotech. J. 1994, 31, 521–532. [Google Scholar] [CrossRef]
  53. Bussière, B. Colloquium 2004: Hydro-geotechnical properties of hard rock tailings from metal mines and emerging geo-environmental disposal approaches. Can. Geotech. J. 2007, 44, 1019–1052. [Google Scholar] [CrossRef]
  54. Demers, I.; Bussière, B.; Benzaazoua, M.; Mbonimpa, M.; Blier, A. Column test investigation on the performance of monolayer covers made of desulphurized tailings to prevent acid mine drainage. Miner. Eng. 2008, 21, 317–329. [Google Scholar] [CrossRef]
  55. Aubertin, M.; Chapuis, R.P.; Aachib, M.; Bussière, B.; Ricard, J.F.; Tremblay, L. Evaluation en Laboratoire de Barrières Sèches Construites à Partir de Résidus Miniers; NEDEM/MEND Projet 2.22.2a; Ecole Polytechnique de Montréal: Montreal, QC, Canada, 1995. [Google Scholar]
  56. Demers, I.; Bussière, B.; Aachib, M.; Aubertin, M. Repeatability evaluation of instrumented column tests in cover efficiency evaluation for the prevention of acid mine drainage. Water Air Soil Pollut. 2010, 219, 113–128. [Google Scholar] [CrossRef]
  57. Pabst, T.; Aubertin, M.; Bussière, B.; Molson, J. Column tests to characterise the hydrogeochemical response of pre-oxidised acid-generating tailings with a monolayer cover. Water Air Soil Pollut. 2014, 225, 1–21. [Google Scholar] [CrossRef]
  58. Lieber, E.; Demers, I.; Pabst, T.; Bresson, E. Simulating the effect of climate change on the performance of a monolayer cover combined with an elevated water table placed on acid generating mine tailings. Can. Geotech. J. 2021, in press. [Google Scholar] [CrossRef]
  59. Topp, G.C.; Davis, J.L.; Annan, A.P. Electromagnetic determination of soil water content: Measurements in coaxial transmission lines. Water Resour. Res. 1980, 16, 574–582. [Google Scholar] [CrossRef] [Green Version]
  60. Demers, I.; Bussière, B.; Mbonimpa, M.; Benzaazoua, M. Oxygen diffusion and consumption in low-sulphide tailings covers. Can. Geotech. J. 2009, 46, 454–469. [Google Scholar] [CrossRef]
  61. Cravotta, C.A., III. Secondary iron-sulfate minerals as sources of sulfate and acidity. In Environmental Geochemistry of Sulfide Oxidation; Alpers, C.N., Blowes, D.W., Eds.; Imperial College Press: London, UK, 1994; Volume 550, pp. 345–364. [Google Scholar]
  62. Welch, S.A.; Kirste, D.; Christy, A.G.; Beavis, F.R.; Beavis, S.G. Jarosite dissolution II—Reaction kinetics, stoichi-ometry and acid flux. Chem. Geol. 2008, 254, 73–86. [Google Scholar] [CrossRef]
  63. Desborough, G.A.; Smith, K.S.; Lowers, H.A.; Swayze, G.A.; Hammarstrom, J.M.; Diehl, S.F.; Leinz, R.W.; Driscoll, R.L. Mineralogical and chemical characteristics of some natural jarosites. Geochim. Cosmochim. Acta 2010, 74, 1041–1056. [Google Scholar] [CrossRef] [Green Version]
  64. Sánchez-España, J.; Yusta, I.; López, G.A. Schwertmannite to jarosite conversion in the water column of an acidic mine pit lake. Mineral. Mag. 2012, 76, 2659–2682. [Google Scholar] [CrossRef]
  65. Bigham, J.; Schwertmann, U.; Traina, S.; Winland, R.; Wolf, M. Schwertmannite and the chemical modeling of iron in acid sulfate waters. Geochim. Cosmochim. Acta 1996, 60, 2111–2121. [Google Scholar] [CrossRef]
  66. The European Parliament and the Council of the European Union. Directive 2000/60/EC of the European Parliament and the Council Establishing a Framework for the Community Action in the Field of Water Policy; EU: Brussels, Belgium, 2000. [Google Scholar]
  67. Tao, H.; Dongwei, L. Presentation on mechanisms and applications of chalcopyrite and pyrite bioleaching in biohydrometallurgy—A presentation. Biotechnol. Rep. 2014, 4, 107–119. [Google Scholar] [CrossRef] [Green Version]
Figure 1. (a) aerial view of the Folldal mine with location of the two sites where the HS tailings and the LS tailings were sampled. The location of the River Folla, which is affected by AMD, is also shown. (b) HS tailings during homogenisation and (c) LS tailings during the column setup.
Minerals 11 00987 g001
Figure 2. SEM image and EDX spectrum of Cu-Fe sulfide minerals observed in HS tailings.
Minerals 11 00987 g002
Figure 3. (a) particle size distribution of the materials used to build the column experiments. (b) water retention curves of the materials used to build the column experiments.
Minerals 11 00987 g003
Figure 4. Instrumented columns design. Location of oxygen sensors (yellow triangles), water potential sensors (blue circles), and volumetric water content sensors (cyan squares) are shown.
Minerals 11 00987 g004
Figure 5. Variation of the degree of saturation with time for column 1 (a) and column 2 (b). The elevation z of the sensors in the column is indicated (also see Figure 4). Day 0 was 27 May 2016. The vertical dashed arrows mark the beginning of each wetting-drying cycle. Data acquisition stopped for 50 days between 7 July 2017 and 26 August 2017. The horizontal dashed line shows the usual performance target for the MRL, i.e., a degree of saturation of 85%.
Minerals 11 00987 g005
Figure 6. O2 concentrations measured in columns 1 and 2 as a function of time. Vertical dashed lines mark the beginning of wetting-drying cycles. The location of oxygen sensors is indicated in Figure 4.
Minerals 11 00987 g006
Figure 7. The pH measurements in the column leachates. Vertical dashed lines mark the beginning of each wetting-drying cycle.
Minerals 11 00987 g007
Figure 8. Concentrations of (a) total Fe and (b) total S in the column leachates. Vertical dashed lines mark the beginning of each wetting-drying cycle.
Minerals 11 00987 g008
Figure 9. Concentrations of Cu in the column leachates. Vertical dashed lines mark the beginning of each wetting-drying cycle.
Minerals 11 00987 g009
Figure 10. Concentrations of Na, Ca, Mg, Al, Mn, and Zn, as a function of time, in the column leachates. Vertical dashed lines mark the beginning of each wetting-drying cycle.
Minerals 11 00987 g010
Table 1. Chemical composition of the HS tailings, LS tailings, fine sand, and coarse sand used in the column tests.
ParameterUnitsHS TailingsLS TailingsFine SandCoarse Sand
Fe wt%14.73.980.470.18
STotal wt%5.10.4<0.003<0.003
Al wt%0.210.890.230.12
As mg/kg 832.80.8<0.5
Ba mg/kg 30627268
Be mg/kg <0.010.040.040.09
Cd mg/kg <0.1<0.1<0.1<0.1
Co mg/kg 487.23.01.0
Cr mg/kg 6.5319.34.1
Cu mg/kg 33401198.12.2
Hg mg/kg <0.20<0.20<0.20<0.20
Mn mg/kg 261269562
Mo mg/kg 380.7<0.4<0.4
Ni mg/kg <5.0166<5.0
P mg/kg 80468258192
Pb mg/kg 74522
Sr mg/kg 5.57.39.16.8
V mg/kg 25468.22.7
Zn mg/kg 494874
Li mg/kg <1.0623
TICwt% 0.020.01<0.010<0.010
CO3wt% 0.120.06<0.050<0.050
SO4wt%4.21.3<0.1<0.1
Ca wt%0.040.17--
Table 2. Mineralogical composition of the HS tailings and LS tailings, as estimated by Rietveld analysis of XRD patterns (wt%).
HS TailingsLS Tailings
Ilite + Mica39
Chlorite147
Quartz3642
K-Feldspar<16
Plagioclase1725
Amphibole1510
Calcite2<1
Dolomite2<1
Jarosite21
Pyrite9<1
Table 3. Physical and hydraulic properties of the tested materials. D10: 10% passing, D60: 60% passing, CU: coefficient of uniformity (CU = D60/D10), Gs: specific gravity, n: porosity, ksat-KC: saturated hydraulic conductivity at porosity n, predicted with the Kozeny-Carman model; AEV: air-entry value.
MaterialD10
(mm)
D60
(mm)
CU
(-)
Gs
(-)
n
(-)
ksat-KC
(m/s)
AEV
(cm)
HS tailings0.0020.351773.020.503 × 10−735
LS tailings0.0020.18882.800.377 × 10−8200
Coarse sand0.171.0162.690.382 × 10−455
Fine sand0.020.1262.690.434 × 10−6220
Table 4. Calculated masses of Fe, S, and Cu leached from the columns during the whole experiment, and comparison with initial concentrations in HS tailings.
Labsolute (mg/kg) aLinitial (wt%) b Performance (%) c
FeSCuFeSCuFeSCu
HS tailings (column 3)15,44113,965525112716
HS tailings covered with LS tailings (column 1)607153111464%10%4%61%62%72%
HS tailings covered with fine sand (column 2)537041771024%8%3%65%70%81%
a Labsolute [mg/kg] = leachate concentration [mg/L] × volume of water [L] × number of watering events/mass of HS tailings [kg], Labsolute [mg/kg]. This is an indicator for the mass of element leached during the experiment relative to the mass of HS tailings in the column. b Linitial [wt%] = Labsolute [mg/kg]/mass concentration at start of the column test [mg/kg]. Linitial is an indicator of the depletion of an element in the column. c Performance (%) = 1 − Labsolute(column 1)/Labsolute(column 3). This is an indicator of the extent to which the cover has limited leaching of the element compared to uncapped HS tailings.
Publisher’s Note: MDPI stays neutral with regard to jurisdictional claims in published maps and institutional affiliations.

