
Gold in Ferromanganese Deposits from the NW Pacific

Abstract
1. Introduction
2. Materials and Methods
2.1. Materials
2.2. Methods
- Weighed samples (2 g) of powder samples were placed in porcelain boats for 3 h in a muffle furnace at 600 °C for their mineralization;
- The mineralization product was transferred into glassy carbon crucibles;
- A total of 20 mL of HF conc. was added to the crucibles and left for 10 h;
- Crucibles with a solution were heated until HF vapor appeared in an electric furnace and evaporated to dryness;
- A total of 20 mL of “aqua regia” (3 parts HCl conc. + 1 part HNO3 conc.) was added to the dry residue;
- This was kept for 20 min, and the solution was evaporated; 5 mL of “aqua regia” was added again and evaporated to wet salts;
- Addition of 10 mL HCl conc. with evaporation to wet salts;
- Addition of 5 mL of HCl conc. with evaporation to wet salts;
- Addition of 30 mL of 1M HCl solution. Boiling was performed, and they were filtered into glass beakers and washed with a hot solution of 1 M HCl;
- Addition of 3 mL of Te solution (concentration 2 mg/mL);
- The solutions were heated on an electric furnace;
- Addition of 10% solution of SnCl2 to a persistently dark color. We then added 10 mL of excess solution and carried out boiling until the solution became clear;
- The solutions were filtered; the glasses were washed with hot 2 M HCl; the filtrate was removed;
- The precipitate was dissolved in 10 mL of a mixture of HCl conc. and H2O2 conc. in a ratio of 1:1;
- The solutions were filtered; the filtrate was washed with warm 1 M HCl and evaporated to 10 mL;
- The concentration of Au was measured in the solutions on a spectrophotometer.
3. Results and Discussion
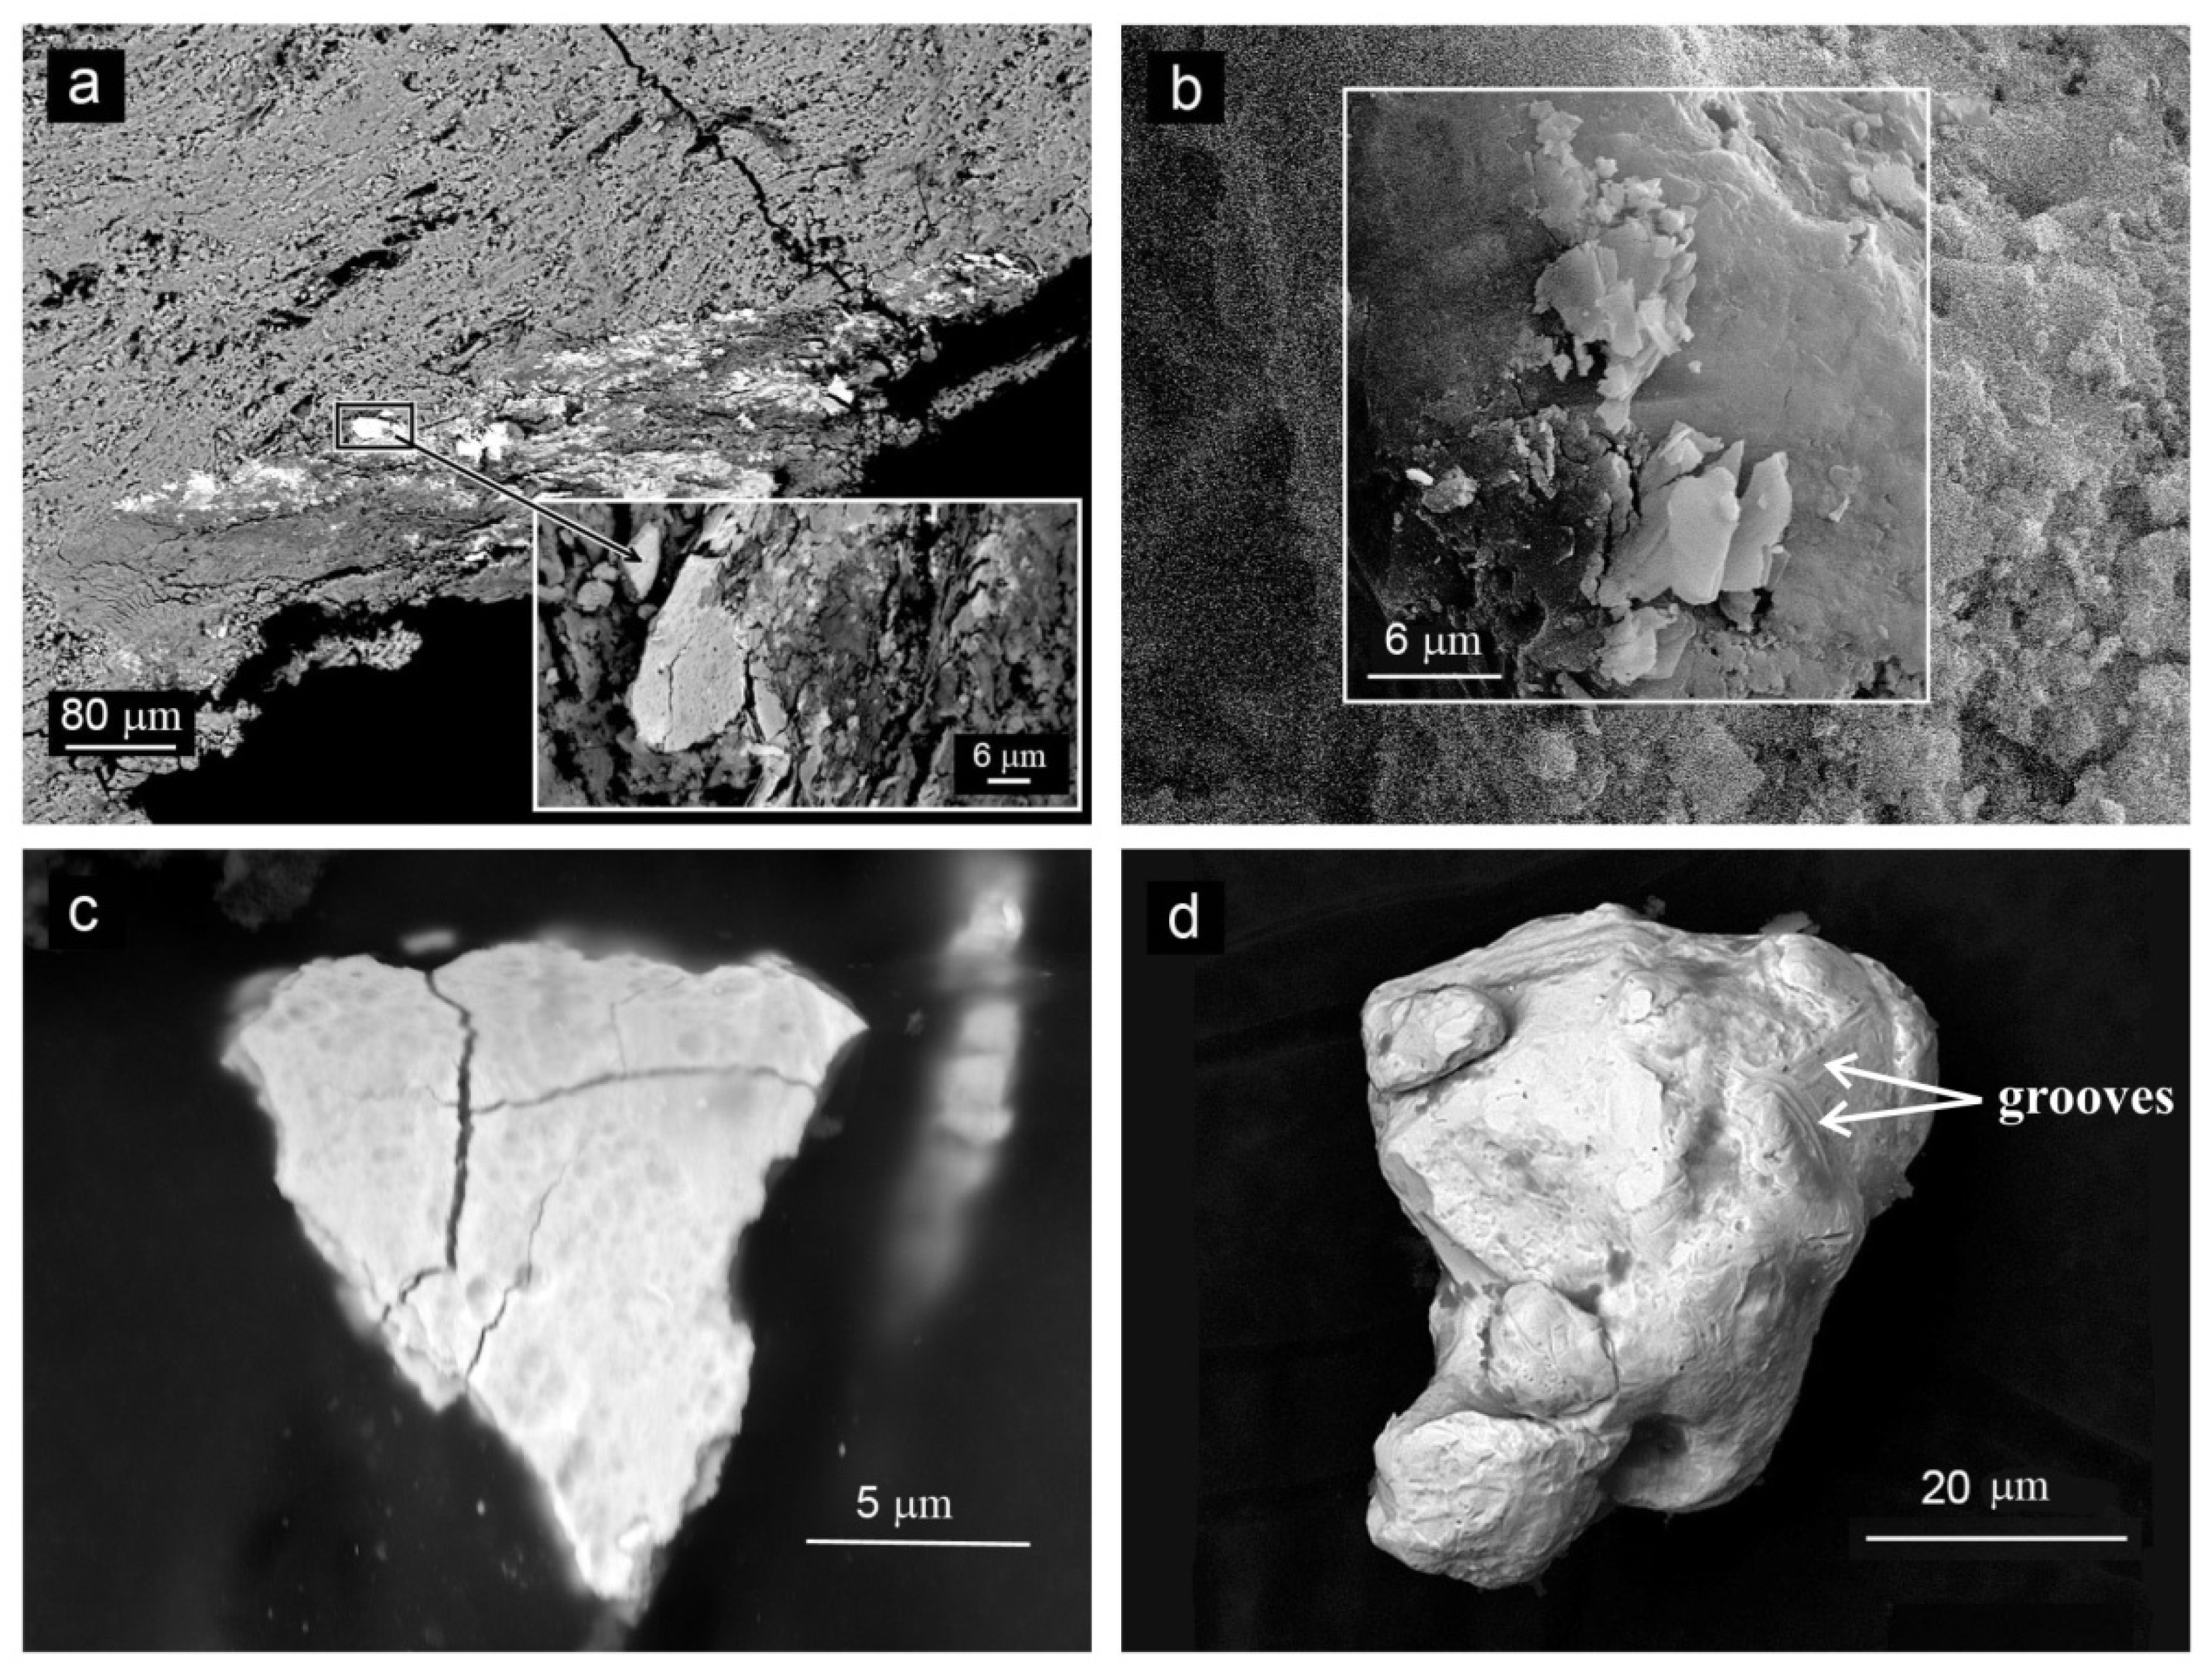
3.1. Morphology
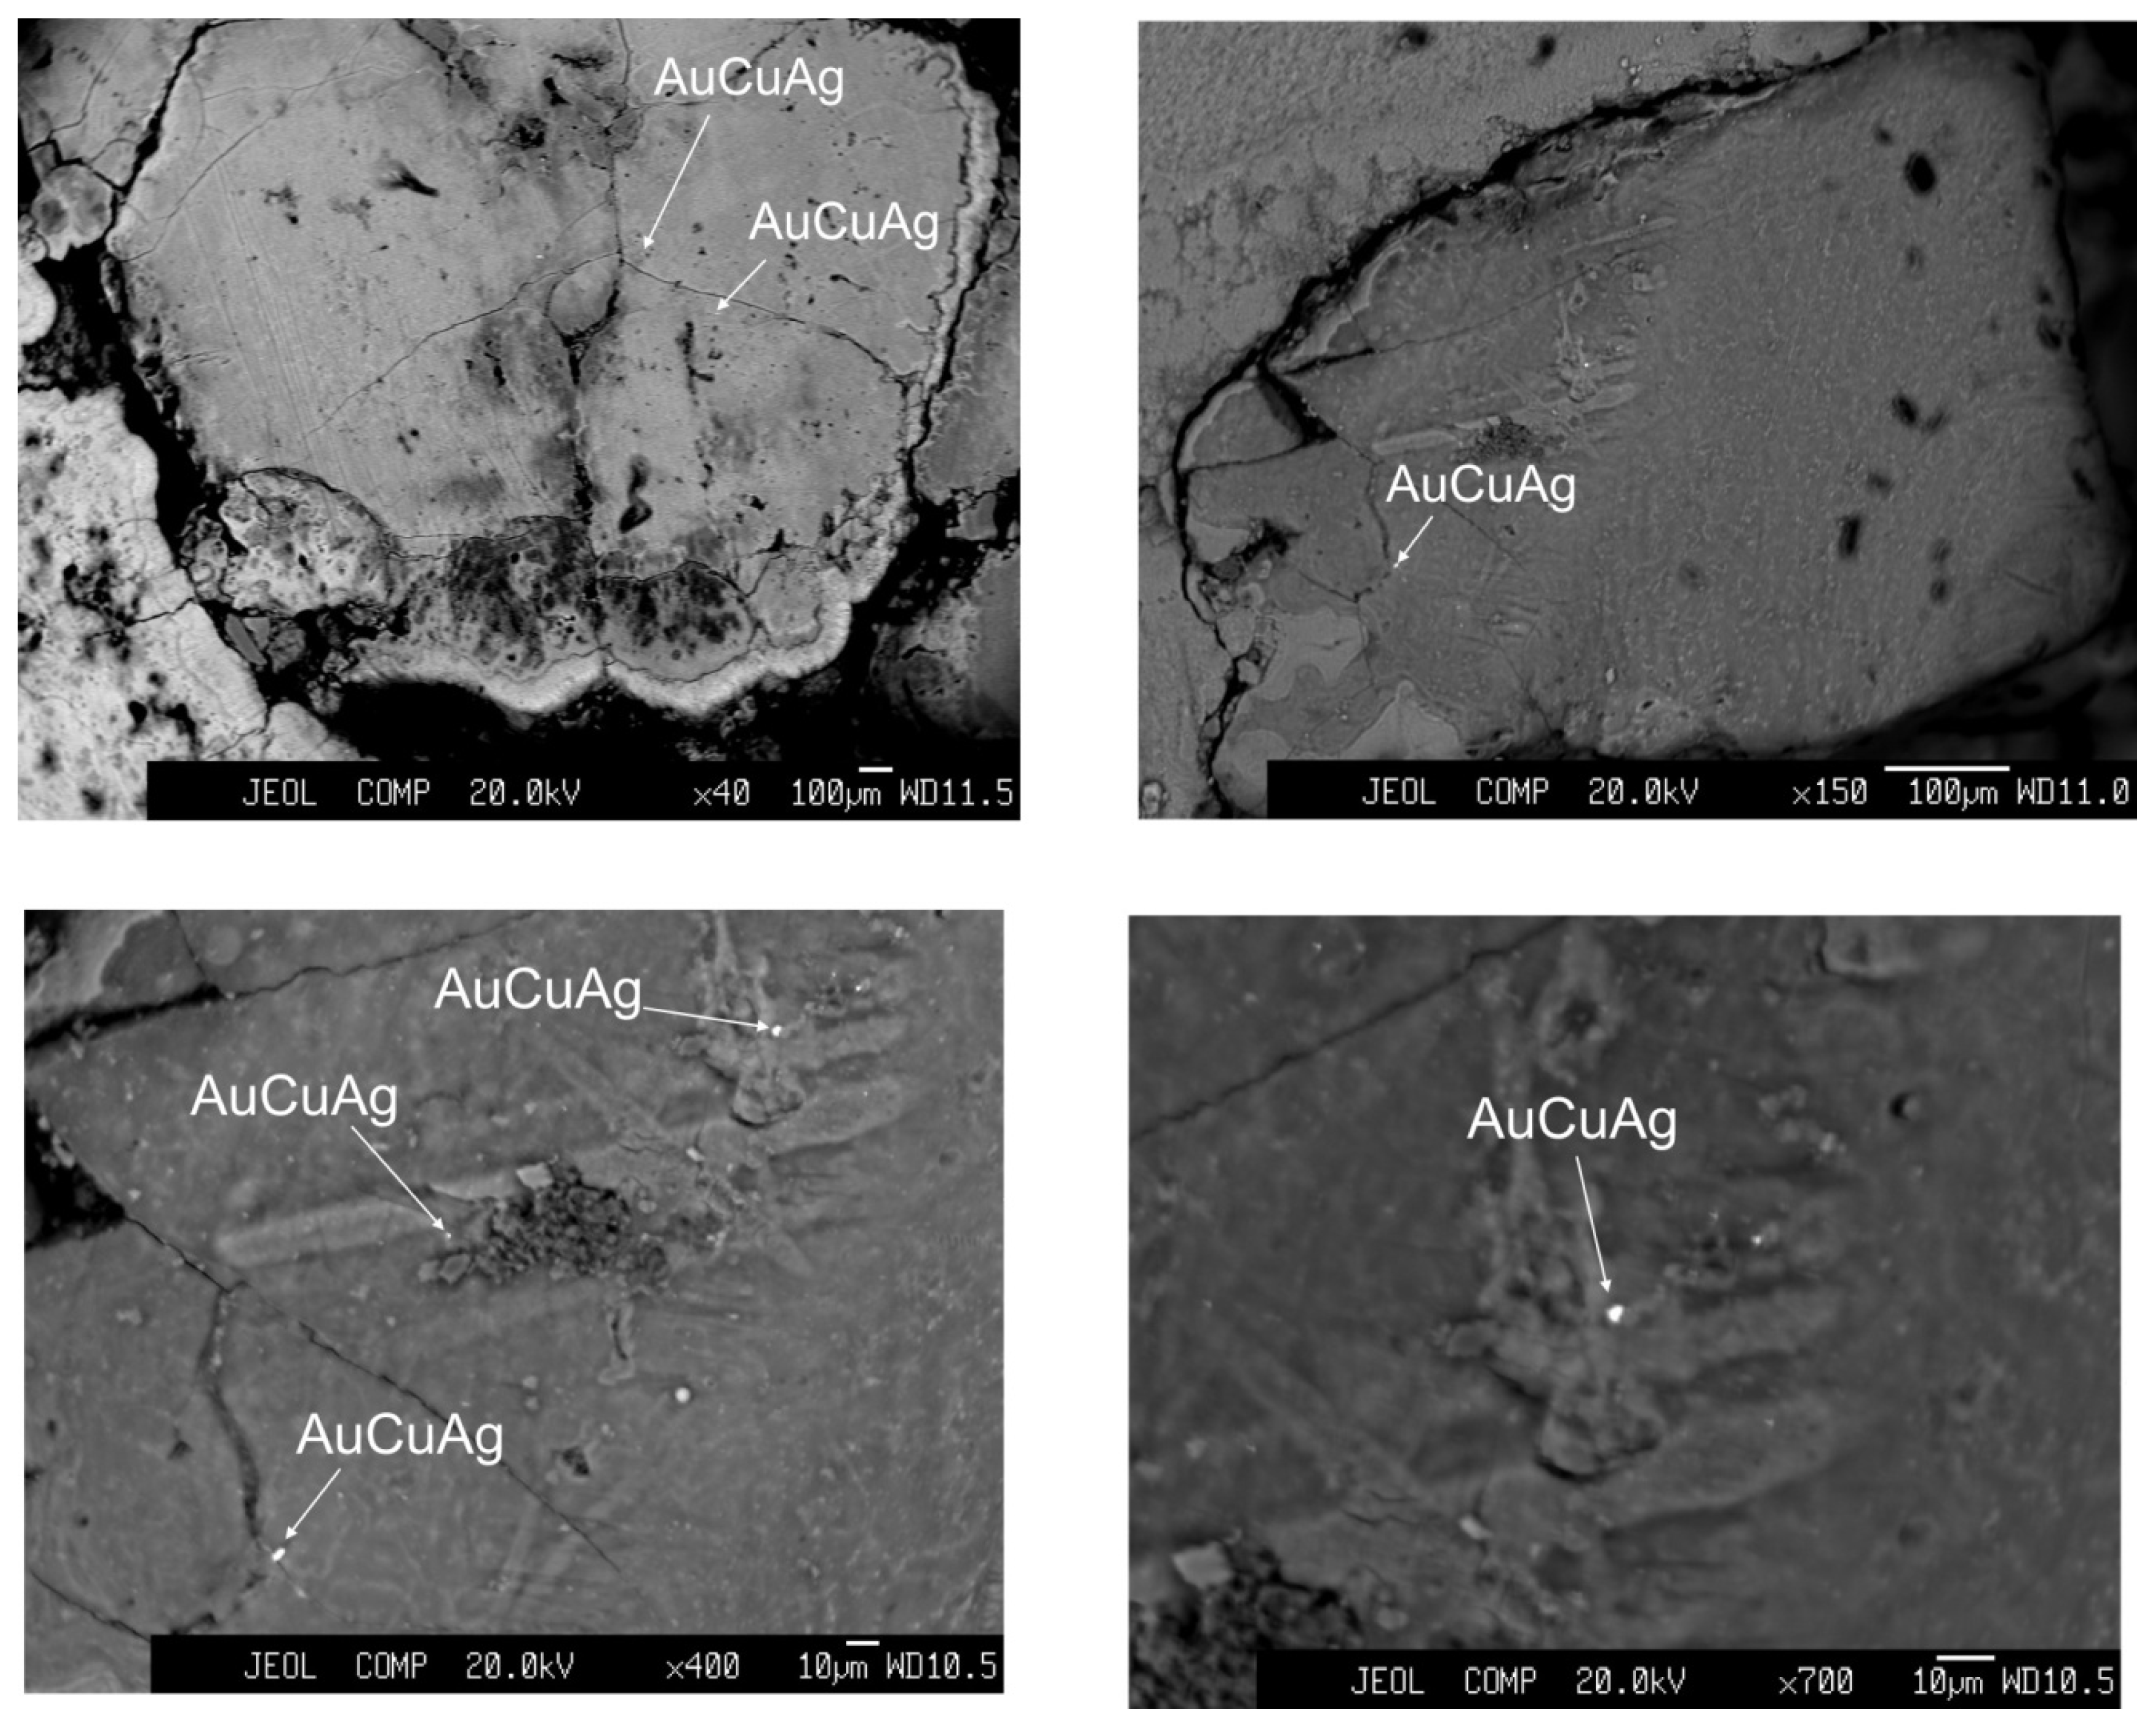
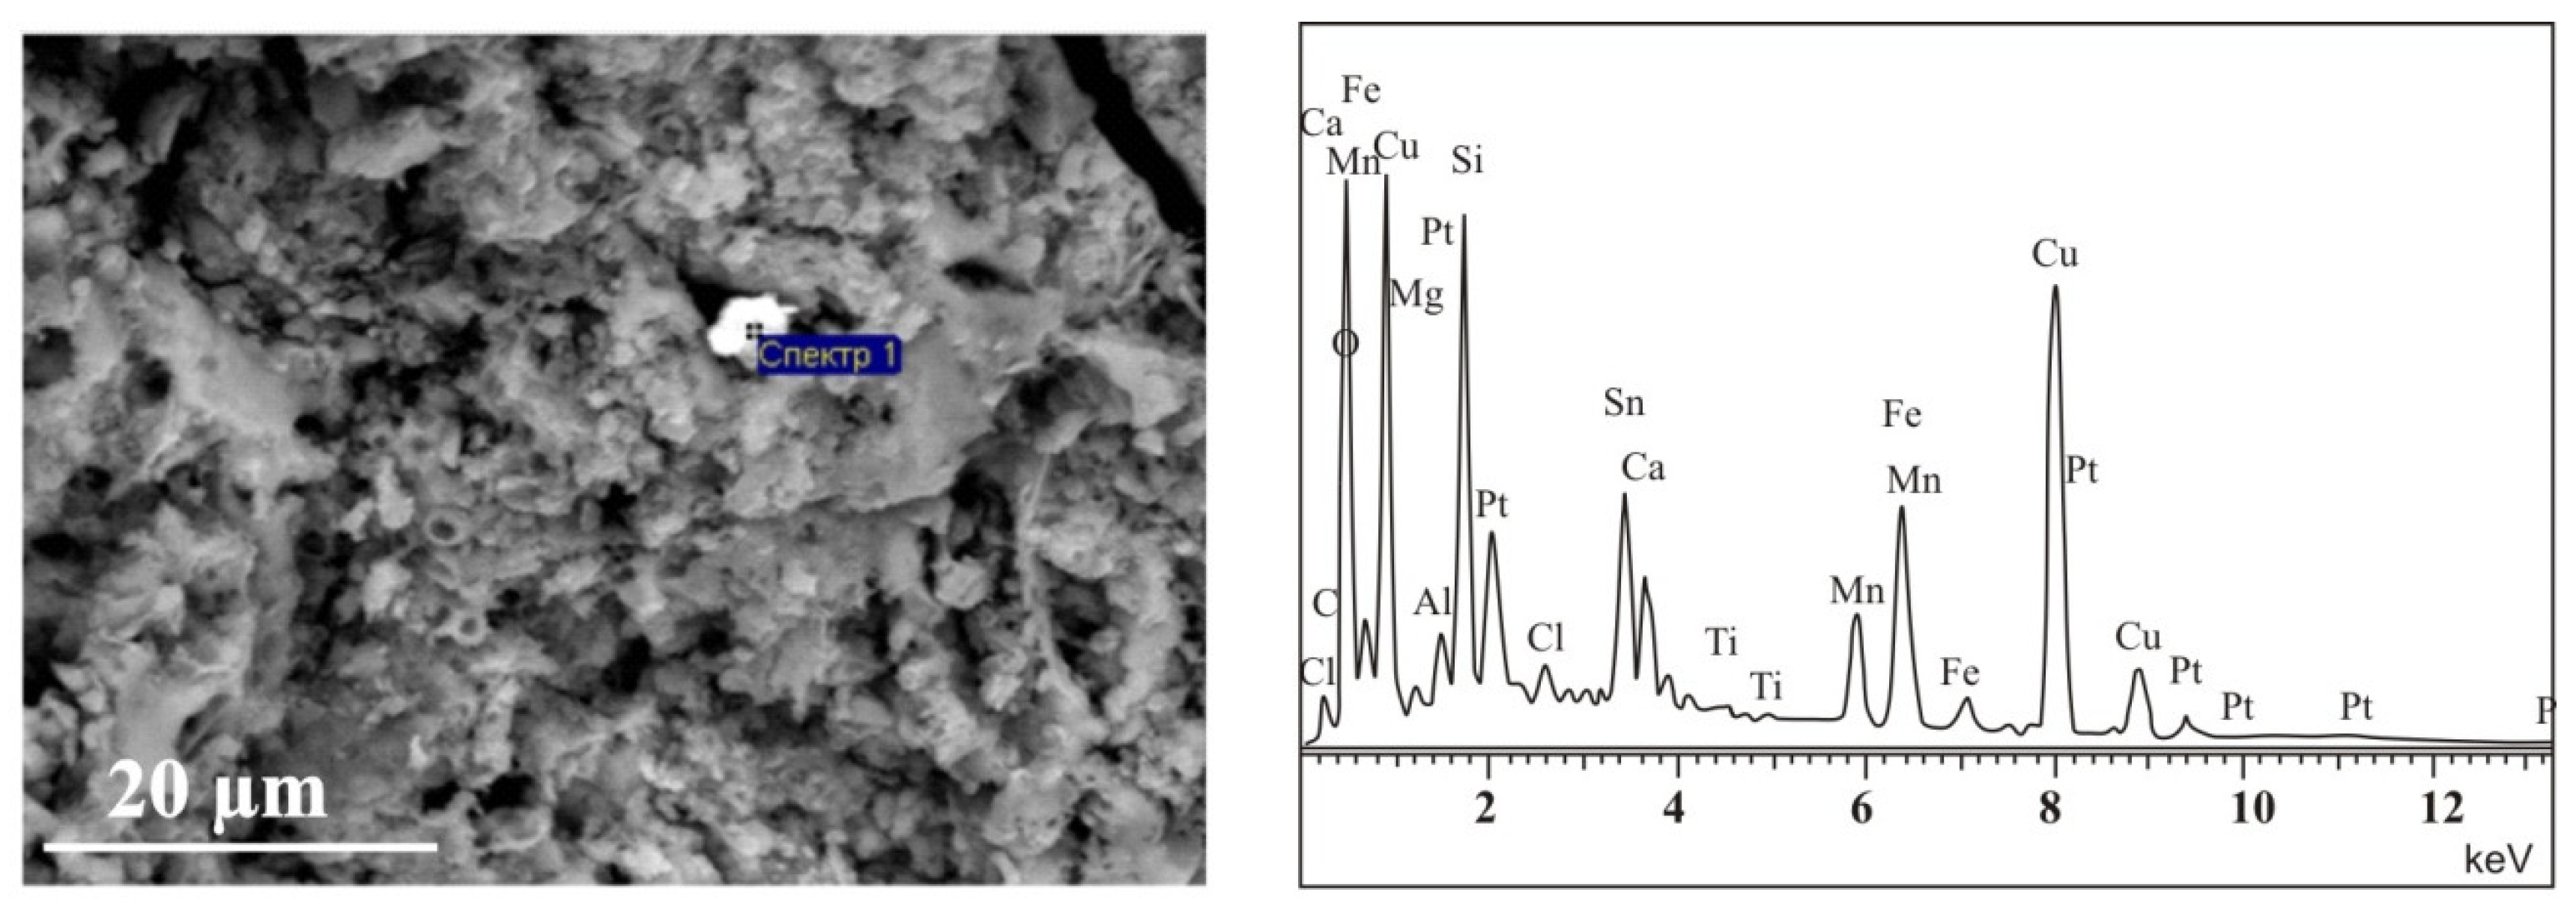
3.2. Mineralogy
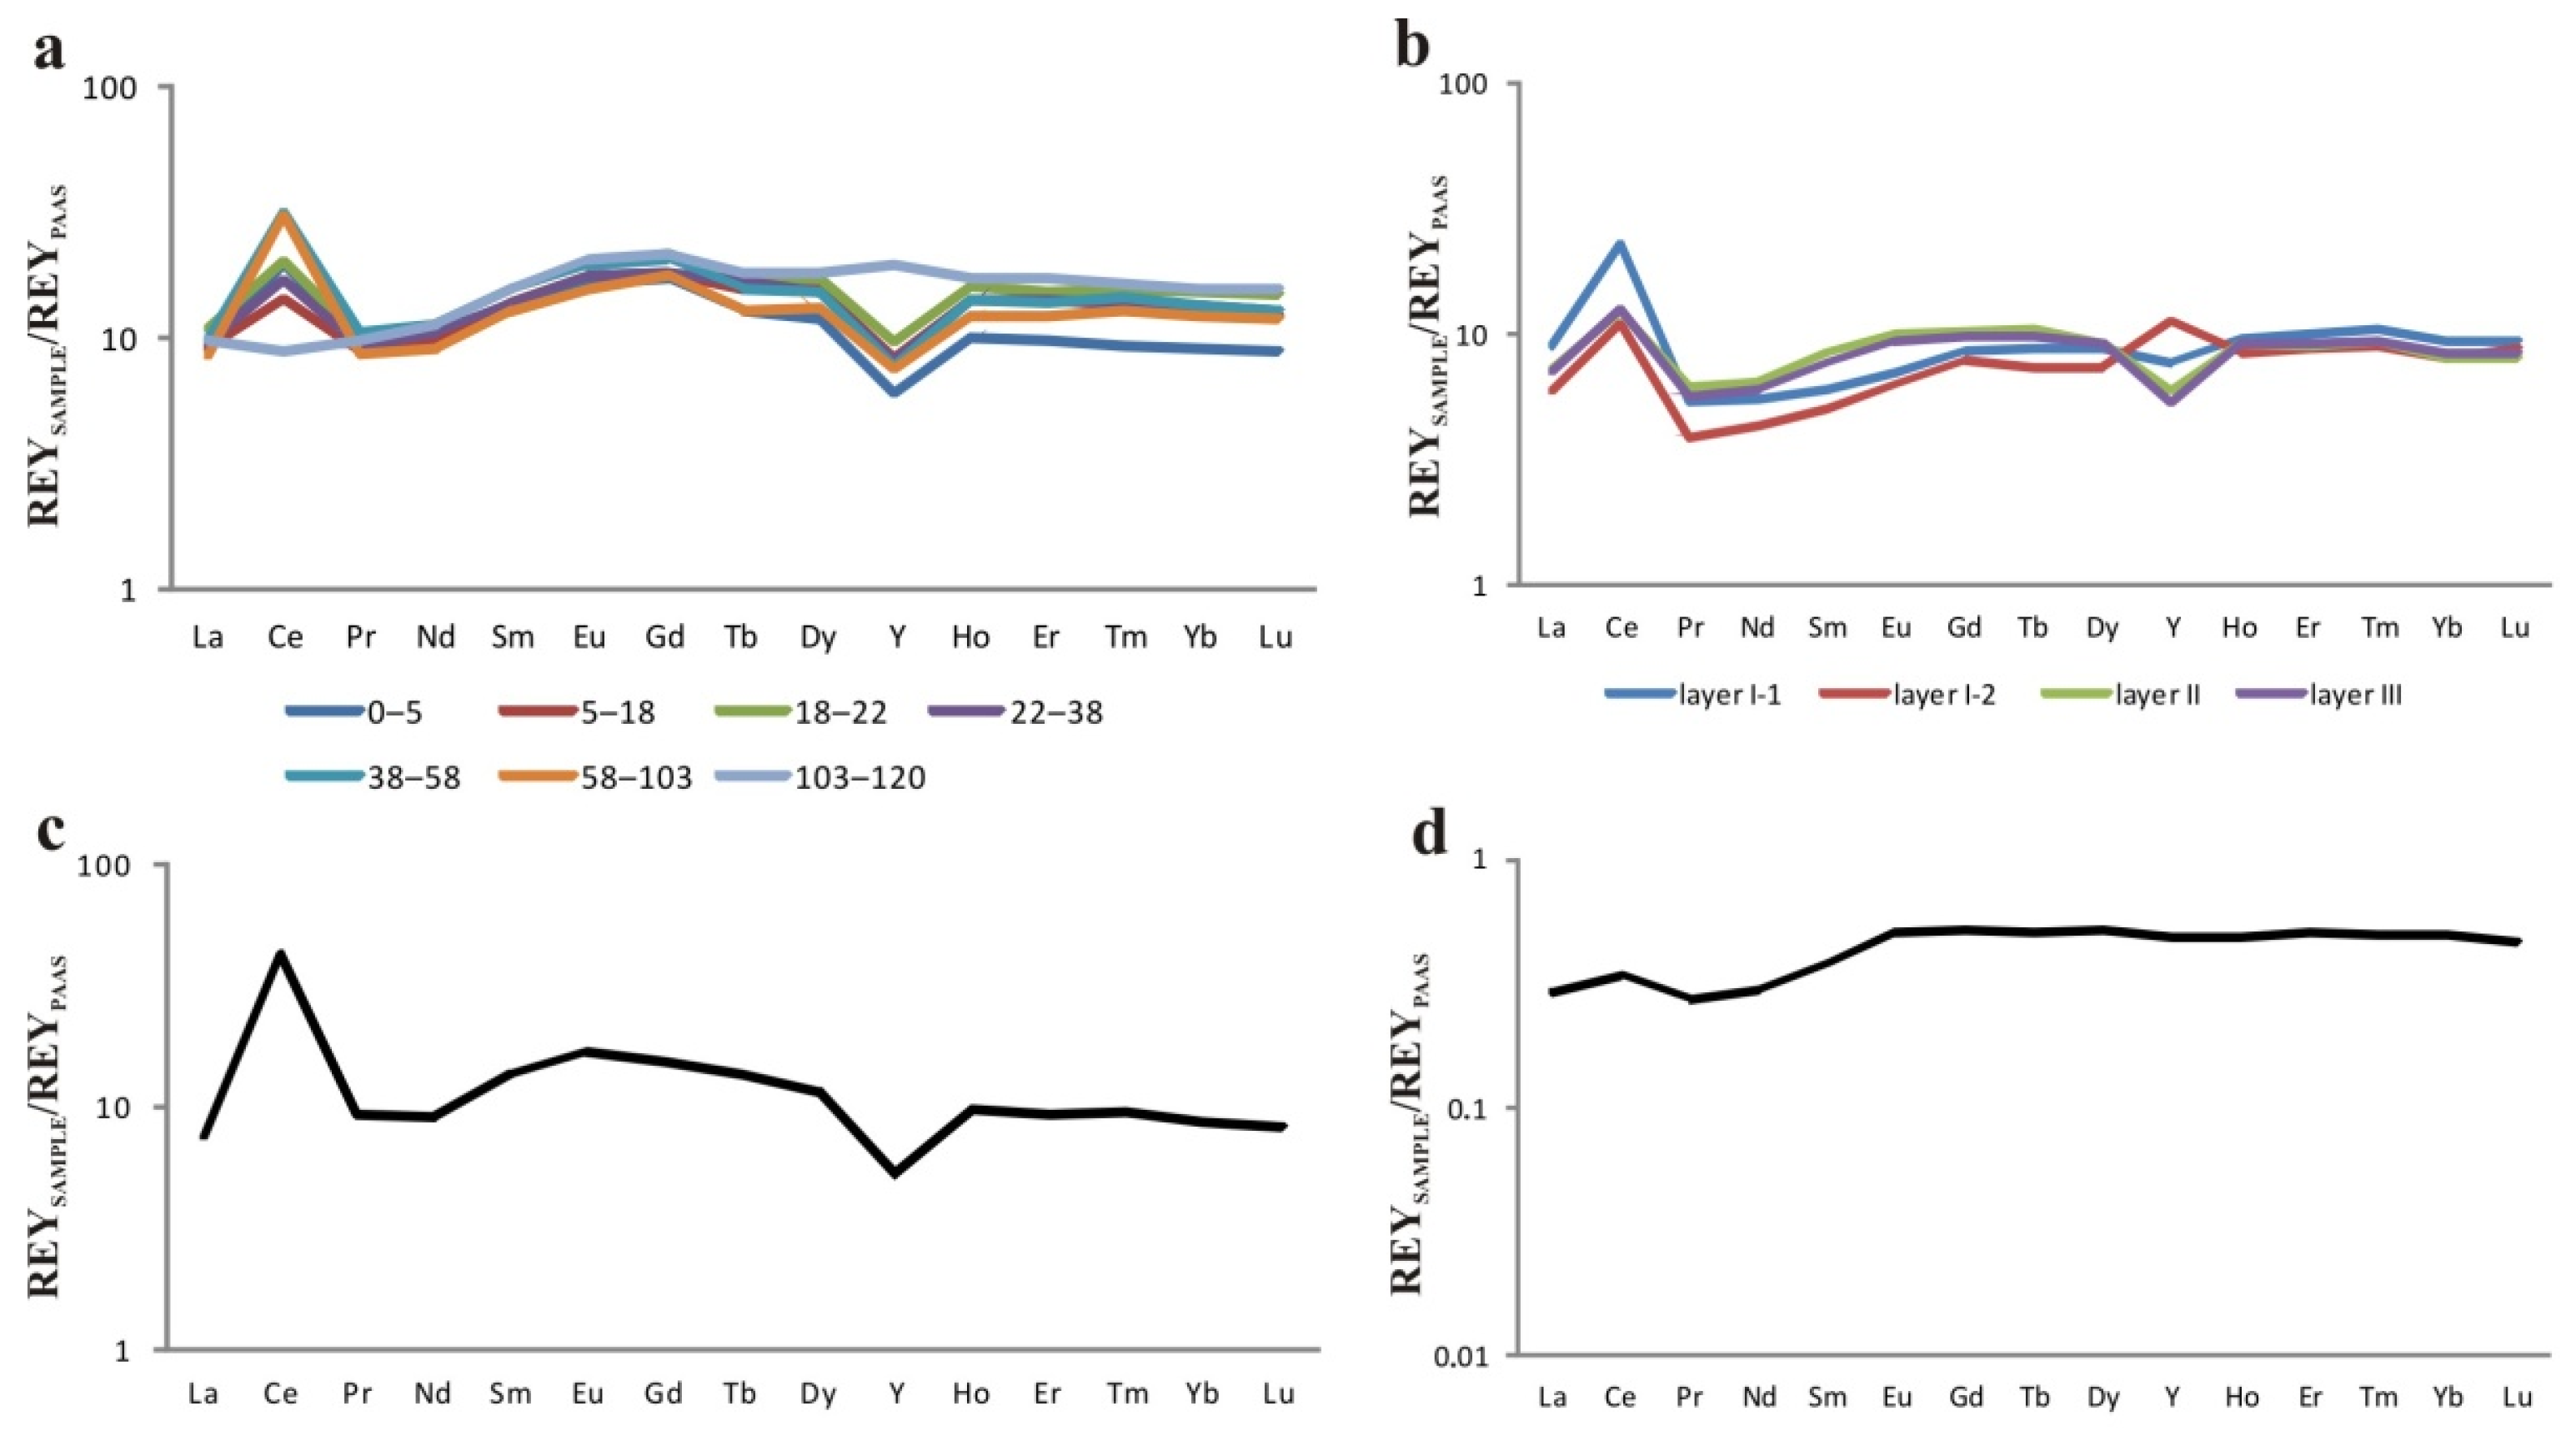
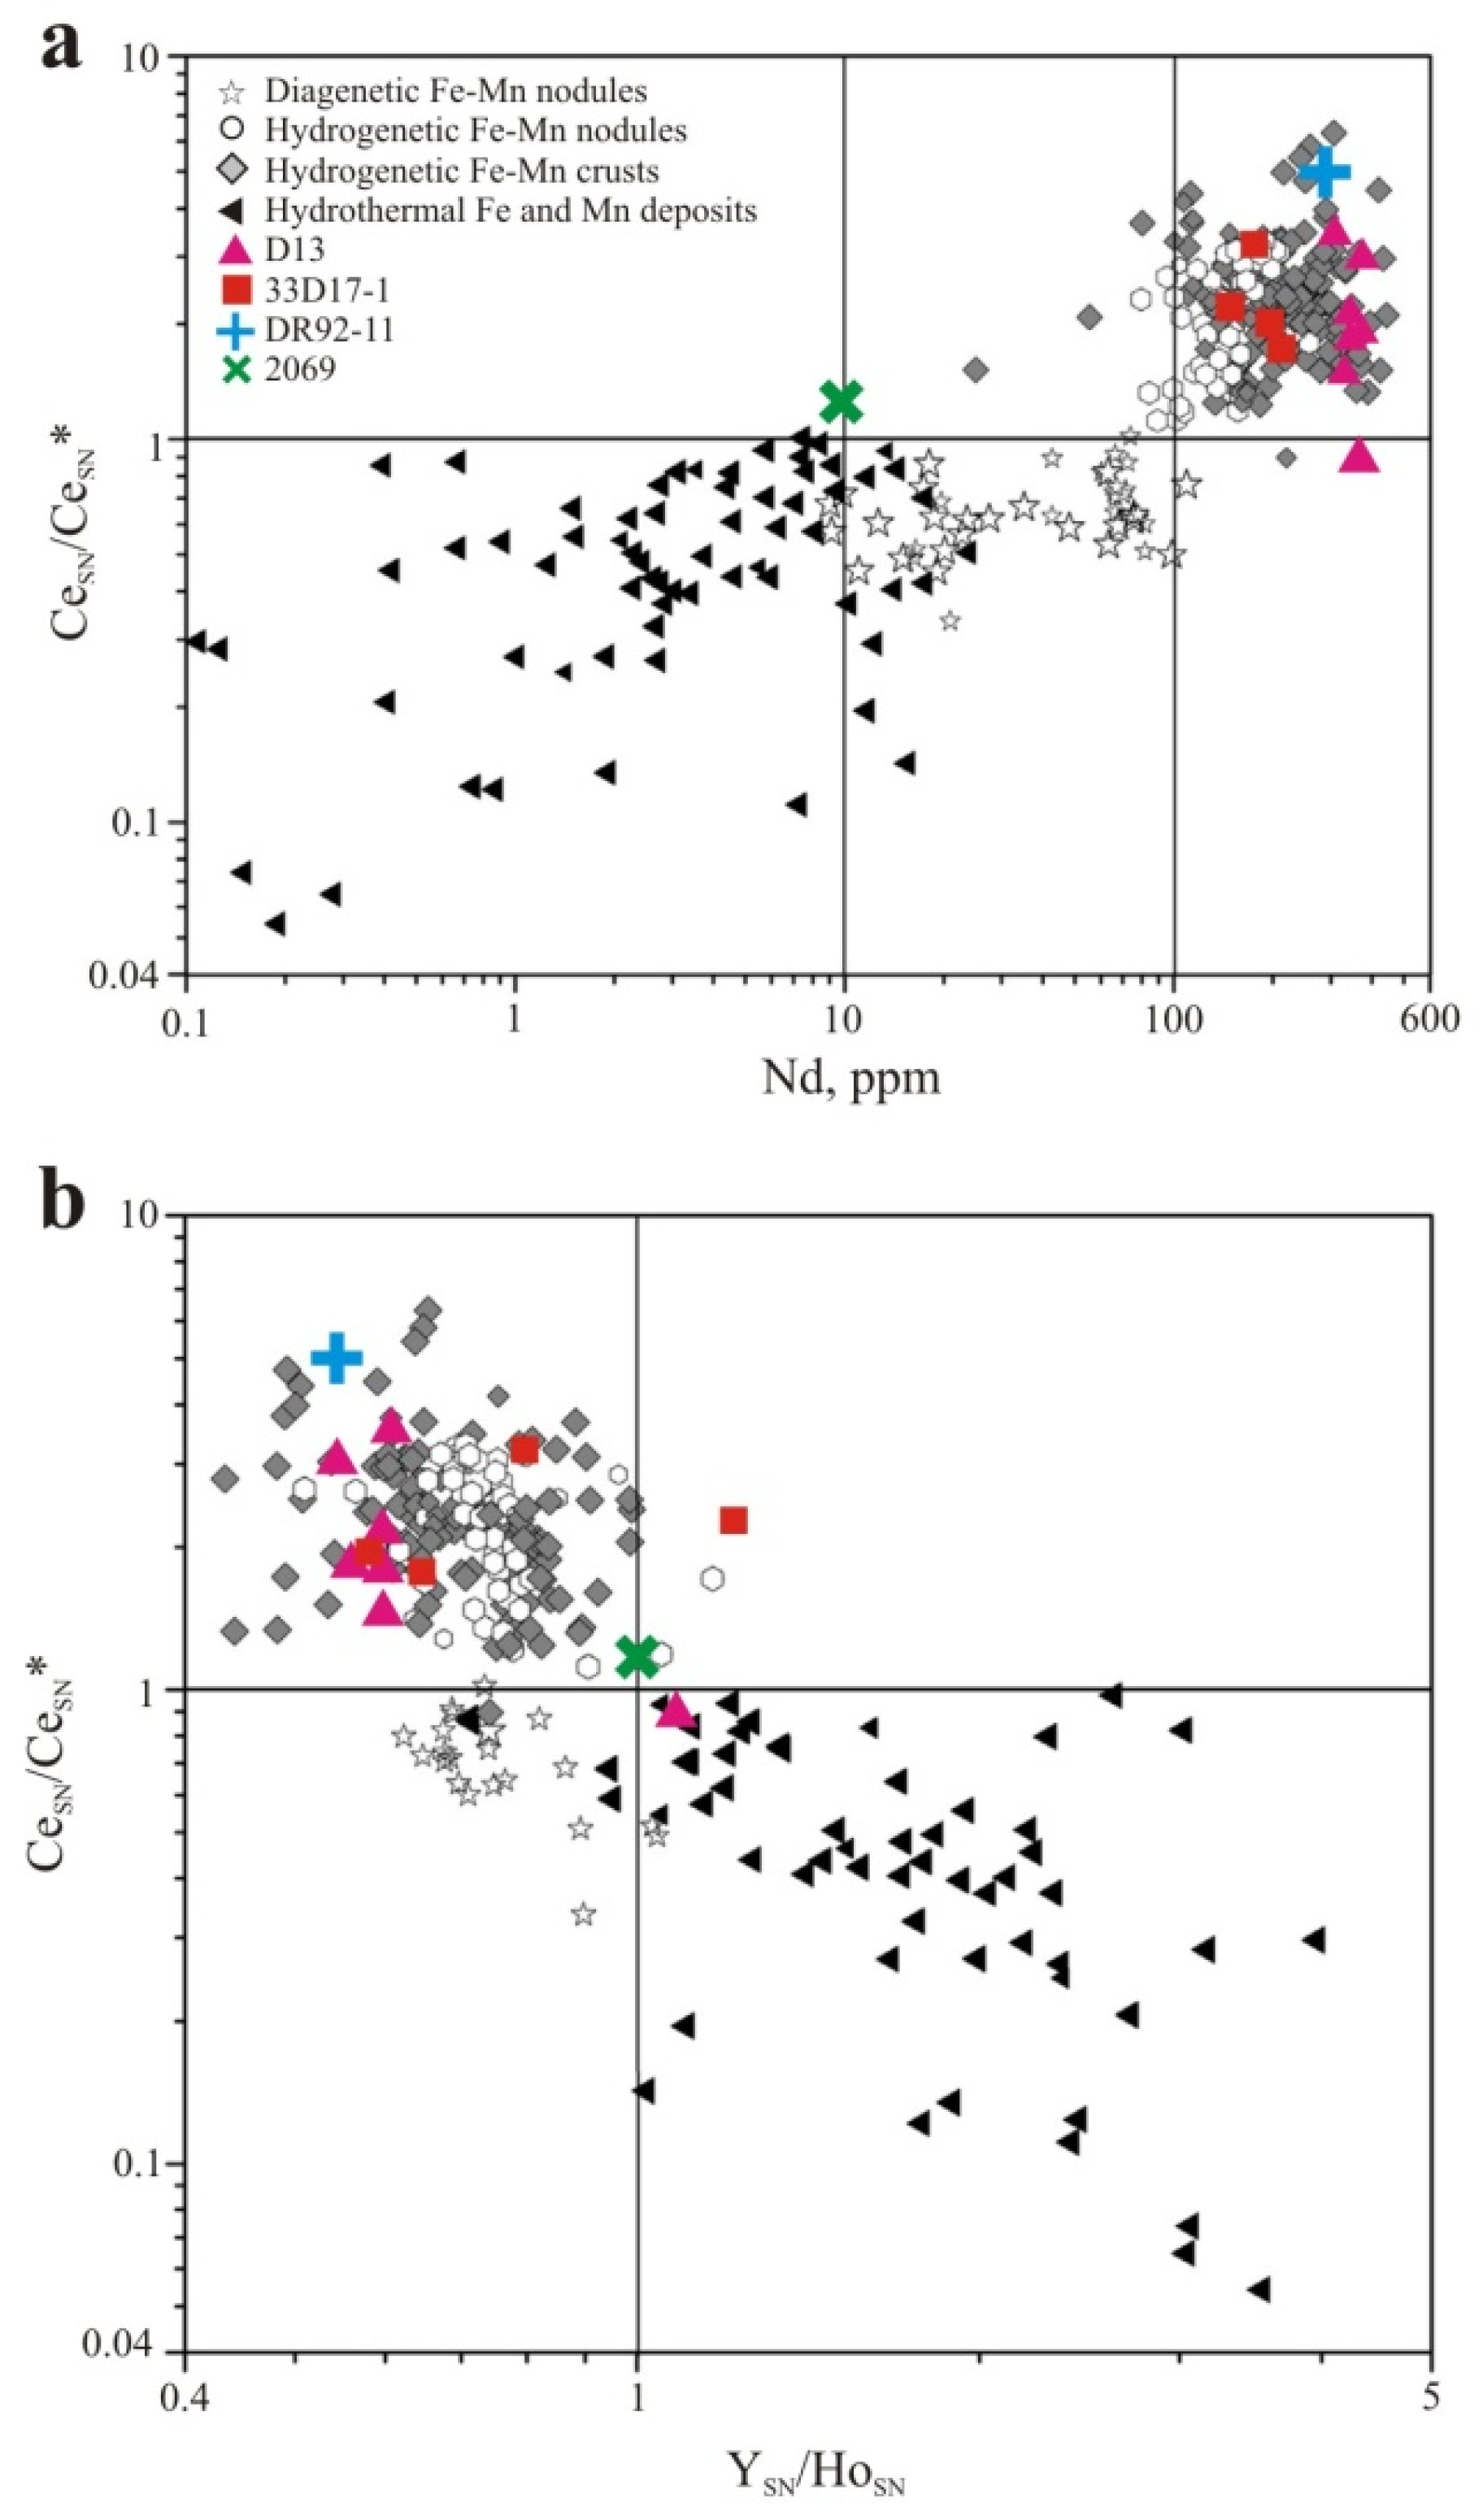
3.3. Geochemistry
3.4. Growth Rate
3.5. Gold Concentration
4. Conclusions
Author Contributions
Funding
Acknowledgments
Conflicts of Interest
References
- Jones, R.S. Gold in Meteorites and in the Earth’s Crust; U.S. Geological Survey: Reston, VA, USA, 1968.
- Nekrasov, I.Y. Geochemistry, Mineralogy and Genesis of Gold Deposits; Routledge: London, UK, 1996; p. 344. [Google Scholar] [CrossRef]
- Nguimatsia, D.F.W.; Bolarinwa, A.T.; Yongue, R.F.; Ndikumana, J.d.D.; Olajide-Kayoude, J.O.; Olisa, O.G.; Abdu-Salam, M.O.; Kamga, M.A.; Djou, E.S. Diversity of Gold Deposits, Geodynamics and Conditions of Formation: A Perspective View. Open J. Geol. 2017, 7, 1690–1709. [Google Scholar] [CrossRef][Green Version]
- Petrella, L.; Thébaud, N.; Fougerouse, D.; Evans, K.; Quadir, Z.; Laflamme, C. Colloidal gold transport: A key to high-grade gold mineralization? Miner. Depos. 2020, 55, 1247–1254. [Google Scholar] [CrossRef]
- McLeish, D.F.; Williams-Jones, A.E.; Vasyukova, O.V.; Clark, J.R.; Board, W.S. Colloidal transport and flocculation are the cause of the hyperenrichment of gold in nature. Proc. Natl. Acad. Sci. USA 2021, 118, e2100689118. [Google Scholar] [CrossRef] [PubMed]
- White, W.M. Geochemistry; Wiley-Blackwell: Hoboken, NJ, USA, 2013; ISBN 978-0-470-65667-9. [Google Scholar]
- Kenison Falkner, K.; Edmond, J.M. Gold in seawater. Earth Planet. Sci. Lett. 1990, 98, 208–221. [Google Scholar] [CrossRef]
- Goldberg, E.D. Chemistry—The oceans as a chemical system. In Composition of Seawater, Comparative and Descriptive Oceanography of the Sea: New York; Hill, M.N., Ed.; Interscience Publishers: Geneva, Switzerland, 1963; Volume 2, pp. 3–25. [Google Scholar]
- Gatellier, J.; Jean-RobertDisnar, J. Kinetics and mechanism of the reduction of Au(III) to Au(0) by sedimentary organic materials. Organ. Geochem. 1990, 16, 631–640. [Google Scholar] [CrossRef]
- Koschinsky, A.; Hein, J.R. Uptake of elements from seawater by ferromanganese crusts: Solid phase associations and seawater speciation. Mar. Geol. 2003, 198, 331–351. [Google Scholar] [CrossRef]
- Frank, M.; O’Nions, R.K.; Hein, J.R.; Banakar, V.K. 60 Myr records of major elements and Pb–Nd isotopes from hydrogenous ferromanganese crusts: Reconstruction of seawater paleochemistry–implications for sediment provenance and the source of trace metals in sea water. Geochim. Cosmochim. Acta 1999, 63, 1689–1708. [Google Scholar] [CrossRef]
- Hein, J.R.; Mizell, K.; Koschinsky, A.; Conrad, T.A. Deep-ocean mineral deposits as a source of critical metals for high- and green-technology applications: Comparison with land-based resources. Ore Geol. Rev. 2013, 51, 1–14. [Google Scholar] [CrossRef]
- Haldar, S.K. (Ed.) Chapter 2-Economic Mineral Deposits and Host Rocks. In Mineral Exploration; Elsevier: Amsterdam, The Netherlands, 2013; pp. 23–39. [Google Scholar] [CrossRef]
- Reimnitz, E.; Plafker, G. Marine Gold Placers along the Gulf of Alaska Margin; USGS: Reston, VA, USA, 1976; p. 1415. [CrossRef]
- Fuchs, S.; Hannington, M.D.; Petersen, S. Divining gold in seafloor polymetallic massive sulfide systems. Min. Depos. 2019, 54, 789–820. [Google Scholar] [CrossRef]
- Spiess, F.N.; Macdonald, K.; Atwater, T.; Ballard, R.D.; Carranza, A.; Cordoba, D.; Cox, C.; Garcia, V.M.; Francheteau, J.; Guerrero, J.; et al. East Pacific Rise: Hot springs and geophysical experiments. Science 1980, 28, 1421–1433. [Google Scholar] [CrossRef]
- Petersen, S.; Herzig, P.M.; Hannington, M.D.; Jonasson, I.R.; Arribas, A. Submarine Gold Mineralization Near Lihir Island, New Ireland Fore-Arc, Papua New Guinea. Econ. Geol. 2002, 97, 1795–1813. [Google Scholar] [CrossRef]
- Harris, R.C.; Crocket, J.H.; Stainton, M. Palladium, iridium and gold in deep sea manganese nodules. Geochim. Cosmochim. Acta 1968, 32, 1049–1056. [Google Scholar] [CrossRef]
- Keys, R.R.; Scott, R.B. Precious metals in ocean-ridge basalts: Implications for basalts as a source rock for gold mineralization. Econ. Geol. 1976, 71, 705–720. [Google Scholar] [CrossRef]
- Frakes, L.F.; Exon, N.F.; Granath, J.W. Chemistry of manganese nodules from Cape Leeuwin field off Western Australia. BMR J. Aust. Geol. Geophys. 1977, 2, 232–233. [Google Scholar]
- Glasby, G.P.; Keays, R.R.; Rankin, P.C. The distribution of rare earth, precious metals and other trace elements in Recent and fossil deep-sea manganese nodules. Geochem. J. 1978, 12, 229–243. [Google Scholar] [CrossRef]
- Baturin, G.N.; Konopleva, E.V.; Dubinchuk, V.T.; Melnikov, M.E. Platinum and gold in the ferromanganese crusts of the Pacific Ocean. Oceanology 2005, 45, 269–276. [Google Scholar]
- Asavin, A.M.; Anikeeva, L.I.; Kazakova, V.A.; Andreev, S.I.; Sapozhnikov, D.A.; Kogarko, L.N. Trace element and PGE distribution in layered ferromanganese crusts. Geochem. Int. 2008, 46, 1179–1205. [Google Scholar] [CrossRef]
- Banakar, V.K.; Hein, J.R.; Rajani, R.P.; Chodankar, A.R. Platinum group elements and gold in ferromanganese crusts from Afanasiy-Nikitin seamount, equatorial Indian Ocean: Sources and fractionation. J. Earth Syst. Sci. 2007, 116, 3–13. [Google Scholar] [CrossRef]
- Bolton, B.; Ostwald, J.; Monzier, M. Precious metals in ferromanganese crusts from the south-west Pacific. Nature 1986, 320, 518–520. [Google Scholar] [CrossRef]
- Baturin, G.N.; Dubinchuk, V.T. Microstructures of Oceanic Ferromanganese Nodules; Nauka: Moscow, Russia, 1989; p. 288. [Google Scholar]
- Rea, D.K.; Basov, L.A.; Scholl, D.W.; Allan, J.F. (Eds.) Proceedings ODP, Science Results; Ocean Drilling Program: College Station, TX, USA, 1995; Volume 145, p. 690. [Google Scholar] [CrossRef]
- Tarduno, J.A.; Duncan, R.A.; Scholl, D.W.; Cottrel, R.D.; Steinberger, B.; Thordarson, T.; Kerr, B.C.; Neal, C.R.; Frey, F.A.; Torii, M.; et al. Motion of the Hawaiian hotspot: A paleomagnetic test. In Proceedings ODP, Initial Reports; Shipboard Scientific Party: College Station, TX, USA, 2002; Volume 197, pp. 1–125. [Google Scholar] [CrossRef]
- Van de Flierdt, T.; Frank, M.; Lee, D.-C.; Halliday, A.N.; Reynolds, B.C.; Hein, J.R. New constraints on the sources and behavior of neodymium and hafnium in seawater from Pacific Ocean ferromanganese crusts. Geochim. Cosmochim. Acta 2004, 68, 3827–3843. [Google Scholar] [CrossRef]
- Schlanger, S.O.; Campbell, J.F.; Jackson, M.W. Post-Eocene subsidence of the Marshall Islands recorded by drowned atolls on Harrie and Sylvania guyots. In Seamounts, Islands and Atolls, Geophysical Monograph Series 43; Keating, B.H., Fryer, P., Batiza, R., Boehlert, G.W., Eds.; American Geophysical Union: Washington, DC, USA, 1987; Volume 43, pp. 165–174. [Google Scholar] [CrossRef]
- Hein, J.R.; Schwab, W.C.; Davis, A.S. Cobalt and platinum-rich ferromanganese crusts and associated substrate rocks from the Marshall Islands. Mar. Geol. 1988, 78, 255–283. [Google Scholar] [CrossRef]
- Mel’nikov, M.E.; Pletnev, S.P.; Anokhin, V.M.; Sedysheva, T.E.; Ivanov, V.V. Volcanic edifices on guyots of the Magellan Seamounts (Pacific Ocean). Russ. J. Pac. Geol. 2016, 10, 435–442. [Google Scholar] [CrossRef]
- Werner, R.; Hoernle, K.; Hauff, F.; Portnyagin, M.; Yogodzinsky, G.; Ziegler, A. (Eds.) RV SONNE Fahrtbericht/Cruise Report SO249 BERING–Origin and Evolution of the Bering Sea: An Integrated Geochronological, Volcanological, Petrological and Geochemical Approach, Leg 1: Dutch Harbor (U.S.A.)-Petropavlovsk-Kamchatsky (Russia), 05.06.2016–15.07.2016, Leg 2: Petropavlovsk-Kamchatsky (Russia)-Tomakomai (Japan), 16.07.2016–14.08.2016. Geomar Report, N. Ser. 030; Geomar Helmholtz-Zentrum für Ozeanforschung: Kiel, Germany, 2016; p. 451. [Google Scholar] [CrossRef]
- Svininnikov, A.I.; S’edin, V.T. Physical properties of rocks of the Cenozoic volcanic complexes from the Sea of Japan//Tihookeanskaya geologiya. Ocean Geol. 1984, 3, 7–15. [Google Scholar]
- Prokudin, V.G.; S’edin, V.T.; Valitov, M.G.; Medvedev, S.N. The central basin of the Sea of Japan-History and Tectonics. Vestn. KRAUNTs Nauk. Zemle 2018, 4, 82–104. [Google Scholar] [CrossRef]
- Mikhailik, P.E.; Mikhailik, E.V.; Zarubina, N.V.; Barinov, N.N.; S’edin, V.T.; Lelikov, E.P. Composition and distribution of REE in ferromanganese crusts of the Belyaevsky and Medvedev Seamounts in the Sea of Japan. Russ. J. Pac. Geol. 2014, 8, 315–329. [Google Scholar] [CrossRef]
- Chursanov, Y.V.; Starovoytov, A.V. Atomic absorption determination of gold in electrothermal atomizer after separation by coprecipitation with tellurium. Vestn. Tver Tech. Univ. 2013, 15, 18–24. [Google Scholar]
- Mikhailik, E.V.; Khanchuk, A.I.; Mikhailik, P.E.; Barinov, N.N.; Zarubina, N.V. The first find of visible gold in ferromanganese crusts of the Pacific Ocean. Dokl. Earth Sci. 2013, 449, 422–426. [Google Scholar] [CrossRef]
- Melnikov, M.E.; Pletnev, S.P. Age and formation conditions of the Co-rich manganese crust on guyots of the Magellan seamounts. Lithol. Miner. Resour. 2013, 48, 1–13. [Google Scholar] [CrossRef]
- Ivanov, V.V.; Khanchuk, A.I.; Mikhailik, P.E. Nature of Native Gold in Ferromanganese Crusts on the Seafloor of the Northwestern Pacific Ocean. Dokl. Earth Sci. 2021, 497, 223–226. [Google Scholar] [CrossRef]
- Hein, J.R.; Whisman, S. Resource potential of hydrothermal manganese deposits from global ocean. In Proceedings of the 28th Goldschmidt Conference, Boston, MA, USA, 12–17 August 2018; p. 1305. [Google Scholar]
- Volokhin, Y.G.; Mikhailik, P.E.; Mikhailik, E.V. Minerals in Manganese Deposits of Belyaevsky Volcano, the Sea of Japan. Russ. J. Pac. Geol. 2020, 14, 340–362. [Google Scholar] [CrossRef]
- Koschinsky, A.; Stascheit, A.; Bau, M.; Halbach, P. Effect phosphatization on the geochemical and mineralogical composition of marine ferromanganese crusts. Geochim. Cosmochim. 1997, 61, 4079–4094. [Google Scholar] [CrossRef]
- Bau, M.; Dulski, P. Comparative study of yttrium and rare-earth elements behaviours in fluorine-rich hydrothermal fluids. Contrib. Miner. Petrol. 1995, 119, 213–223. [Google Scholar] [CrossRef]
- Halbach, P.; Manheim, F.T.; Otten, P. Co-rich ferromanganese deposits in the marginal seamount regions of the Central Pacific Basin—results of the Midpac’81. Erzmetall 1982, 35, 447–453. [Google Scholar]
- Hein, J.R.; Conrad, T.A.; Frank, M.; Christl, M.; Sager, W.W. Copper-nickel-rich, amalgamated ferromanganese crust-nodule deposits from Shatsky Rise, NW Pacific. Geochem. Geophys. Geosyst. 2012, 13, Q10022. [Google Scholar] [CrossRef]
- McLennan, S.M. Rare earth elements in sedimentary rocks: Influence of provenance and sedimentary processes. In Geochemistry and Mineralogy of the Rare Earth Elements. Review Mineralogy; Lipin, B.R., McKay, G.A., Eds.; De Gruyter: Berlin, Germany, 1989; Volume 21, pp. 169–200. [Google Scholar]
- Bau, M.; Koschinsky, A.; Dulski, P.; Hein, J.R. Comparison of the partitioning behaviors of yttrium, rare earth elements, and titanium between hydrogenetic marine ferromanganese crusts and seawater. Geochim. Cosmochim. 1996, 60, 1709–1725. [Google Scholar] [CrossRef]
- Bau, M.; Schmidt, K.; Koschinsky, A.; Hein, J.R.; Kuhn, T.; Usui, A. Discriminating between different genetic types of marine ferro-manganese crusts and nodules based on rare earth elements and yttrium. Chem. Geol. 2014, 381, 1–9. [Google Scholar] [CrossRef]
- Hein, J.R.; Koschinsky, A. 13.11-Deep-Ocean Ferromanganese Crusts and Nodules. In Treatise on Geochemistry, 2nd ed.; Holland, H.D., Turekian, K.K., Eds.; Elsevier: Amsterdam, The Netherlands, 2014; pp. 273–291. [Google Scholar] [CrossRef]
- Usui, A.; Nishimura, A. Submersible observations of hydrothermal manganese deposits on the Kaikata Seamount, Izu-Ogasawara (Bonin). Arc. Mar. Geol. 1992, 106, 203–216. [Google Scholar] [CrossRef]
- Kuhn, T.; Bau, M.; Blum, N.; Halbach, P. Origin of negative Ce anomalies in mixed hydrothermal–hydrogenetic Fe–Mn crusts from the Central Indian Ridge. Earth Planet. Sci. Lett. 1998, 163, 207–220. [Google Scholar] [CrossRef]
- Mikhailik, P.E.; Mikhailik, E.V.; Zarubina, N.V.; Blokhin, M.G. Distribution of rare-earth elements and yttrium in hydrothermal sedimentary ferromanganese crusts of the Sea of Japan (from phase analysis results). Russ. Geol. Geophys. 2017, 58, 1530–1542. [Google Scholar] [CrossRef]
- McMurtry, G.M.; VonderHaar, D.L.; Eisenhauer, A.; Mahoney, J.J.; Yeh, H.-W. Cenozoic accumulation history of a Pacific ferromanganese crust. Earth Planet. Sci. Lett. 1994, 125, 105–118. [Google Scholar] [CrossRef]
- Halbach, P.; Segl, M.; Puteanus, D.; Mangini, A. Co fluxes and growth rates in ferromanganese deposits from central Pacific seamount areas. Nature 1983, 304, 719–722. [Google Scholar] [CrossRef]
- Halbach, P.; Puteanus, D. The influence of the carbonate dissolution rate on the growth and composition of Co-rich ferromanganese crusts from Central Pacific seamount areas. Earth Planet. Sci. Lett. 1984, 68, 73–87. [Google Scholar] [CrossRef]
- Puteanus, D.; Halbach, P. Correlation of Co concentration and growth rate—A method for age determination of ferromanganese crusts. Chem. Geol. 1988, 69, 73–85. [Google Scholar] [CrossRef]
- Emelyanova, T.A.; Lelikov, E.P.; Pugachev, A.A. Pliocene–Holocene Alkali-Basaltoid Volcanism of the Tsushima Basin of the Sea of Japan: New Geochemical and Geodynamic Data. Oceanology 2020, 60, 236–247. [Google Scholar] [CrossRef]
- Mirlin, E.G.; Lygina, T.A.; Asavin, A.M.; Chesalova, E.I. Volcano-tectonic activity of ocean lithosphere in the eastern sector of the Pacific Ocean. Okeanol. Issled. 2019, 47, 198–222. [Google Scholar] [CrossRef]
- Halbach, P.; Nakamura, K.; Wahsher, M.; Lange, J.; Sakai, H.; Kaselitz, L.; Hansen, R.-D.; Yamano, M.; Post, J.; Prause, B.; et al. Probable modern analogue of Kuroko-type massive sulphide deposits in the Okinawa trough back-arc basin. Nature 1989, 338, 496–499. [Google Scholar] [CrossRef]
- Hannington, M.; Herzig, P.; Scott, S.; Thompson, G.; Rona, P. Comparative mineralogy and geochemistryof gold-bearing sulfide deposits on the mid-oceanic ridges. Mar. Geol. 1991, 101, 217–248. [Google Scholar] [CrossRef]
- Lizasa, K.; Fiske, R.S.; Ishizuka, O.; Yuasa, M.; Hashimoto, J.; Ishibashi, J.; Naka, J.; Horii, Y.; Fujiwara, Y.; Imai, A.; et al. A Kuroko-type polymetallic sulfide deposit in a submarine silicic caldera. Science 1999, 283, 975–977. [Google Scholar] [CrossRef]
- Volokhin, Y.G.; Karabtsov, A.A.; Ustinov, A.Y. Manganese Mineralization in the Mesozoic Siliceous Deposits of the Central Sikhote-Alin and Nadanhada-Alin. Russ. J. Pac. Geol. 2019, 13, 29–50. [Google Scholar] [CrossRef]
- Puddephatt, R.J. The Chemistry of Gold; Elsevier: Amsterdam, The Netherlands, 1978; p. 274. [Google Scholar] [CrossRef]
- Reith, F.; Rogers, S.L.; McPhail, D.C.; Webb, D. Biomineralization of Gold: Biofilms on Bacterioform Gold. Science 2006, 313, 233–236. [Google Scholar] [CrossRef] [PubMed]
- Shuster, J.; Reith, F. Reflecting on Gold Geomicrobiology Research: Thoughts and Considerations for Future Endeavors. Minerals 2018, 8, 401. [Google Scholar] [CrossRef]
- Pavlova, L.M.; Shumilova, L.P.; Radomskaya, V.I.; Sorokin, A.P.; Ivanov, V.V. Biosorption of Chemical Elements from Multicomponent Solutions by Microfungal Biomass. Dokl. Earth Sci. 2019, 488, 1178–1181. [Google Scholar] [CrossRef]
- Berezhnaya, E.D.; Dubinin, A.V. Determination of the platinum-group elements and gold in ferromanganese nodule reference material NOD-A-1. Geochem. Int. 2017, 55, 218–224. [Google Scholar] [CrossRef]


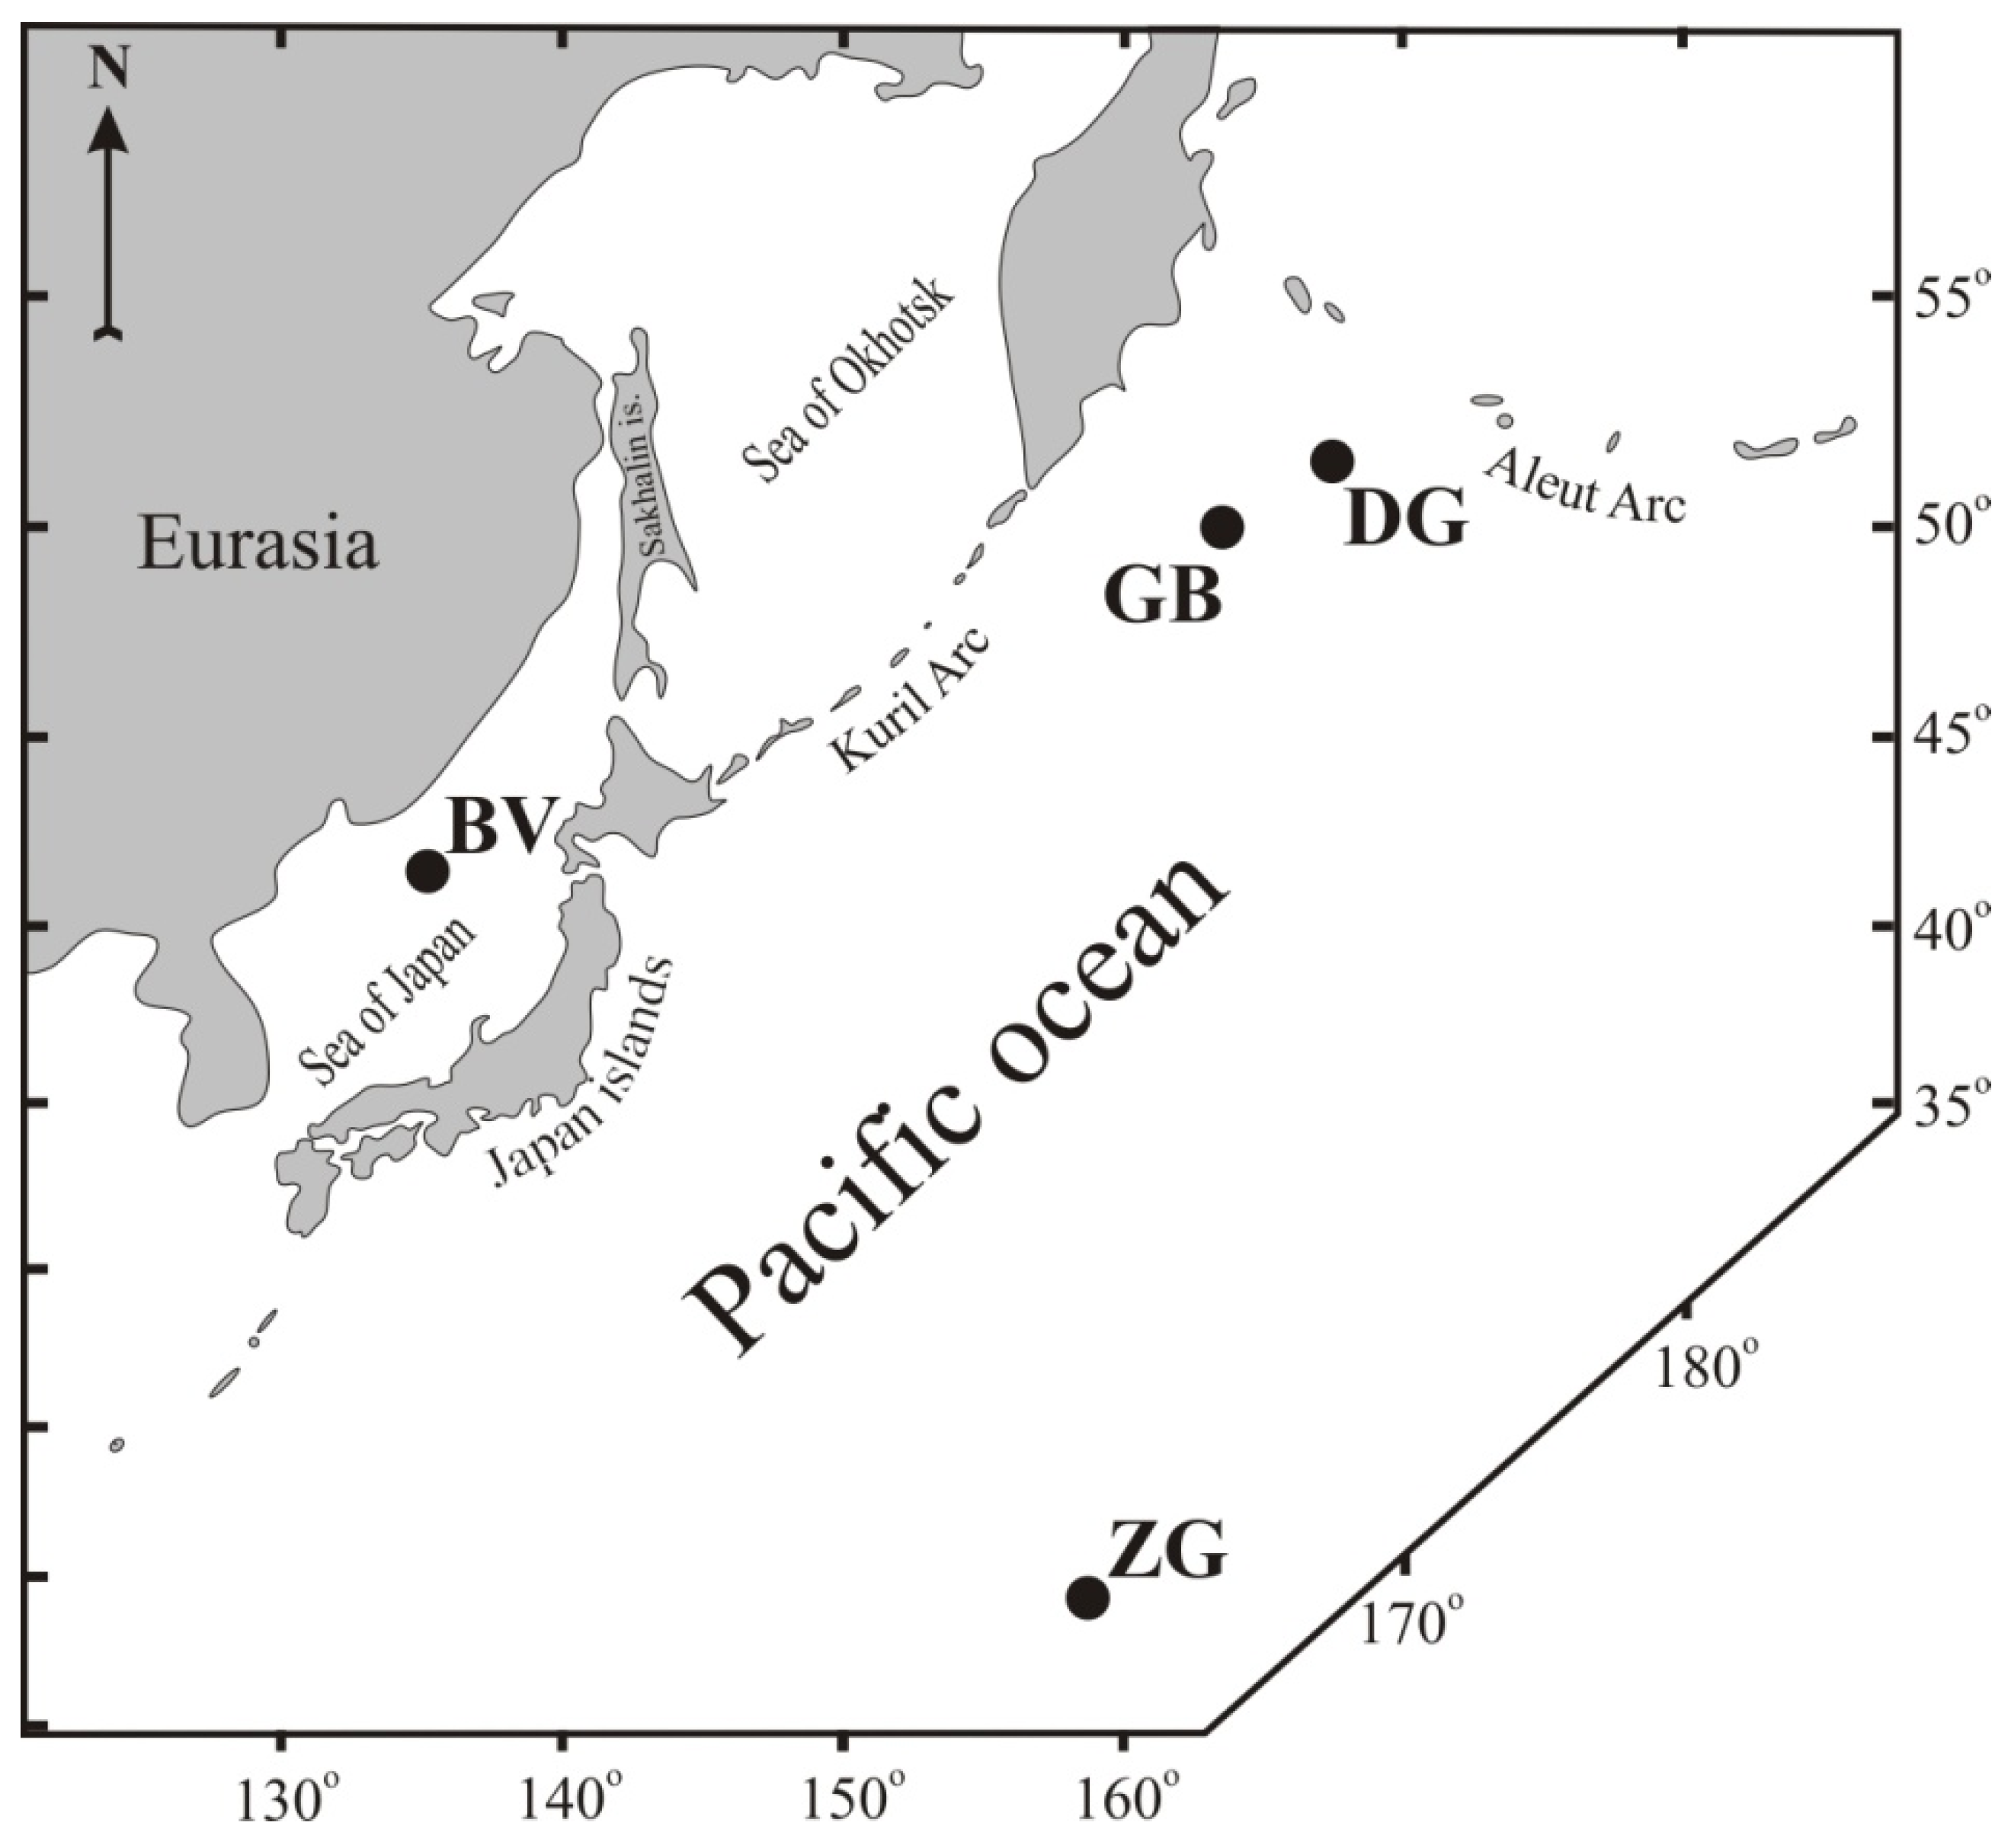
| Sample, Name | Latitude, N | Longitude, W | Depth, m | Geologic Setting |
|---|---|---|---|---|
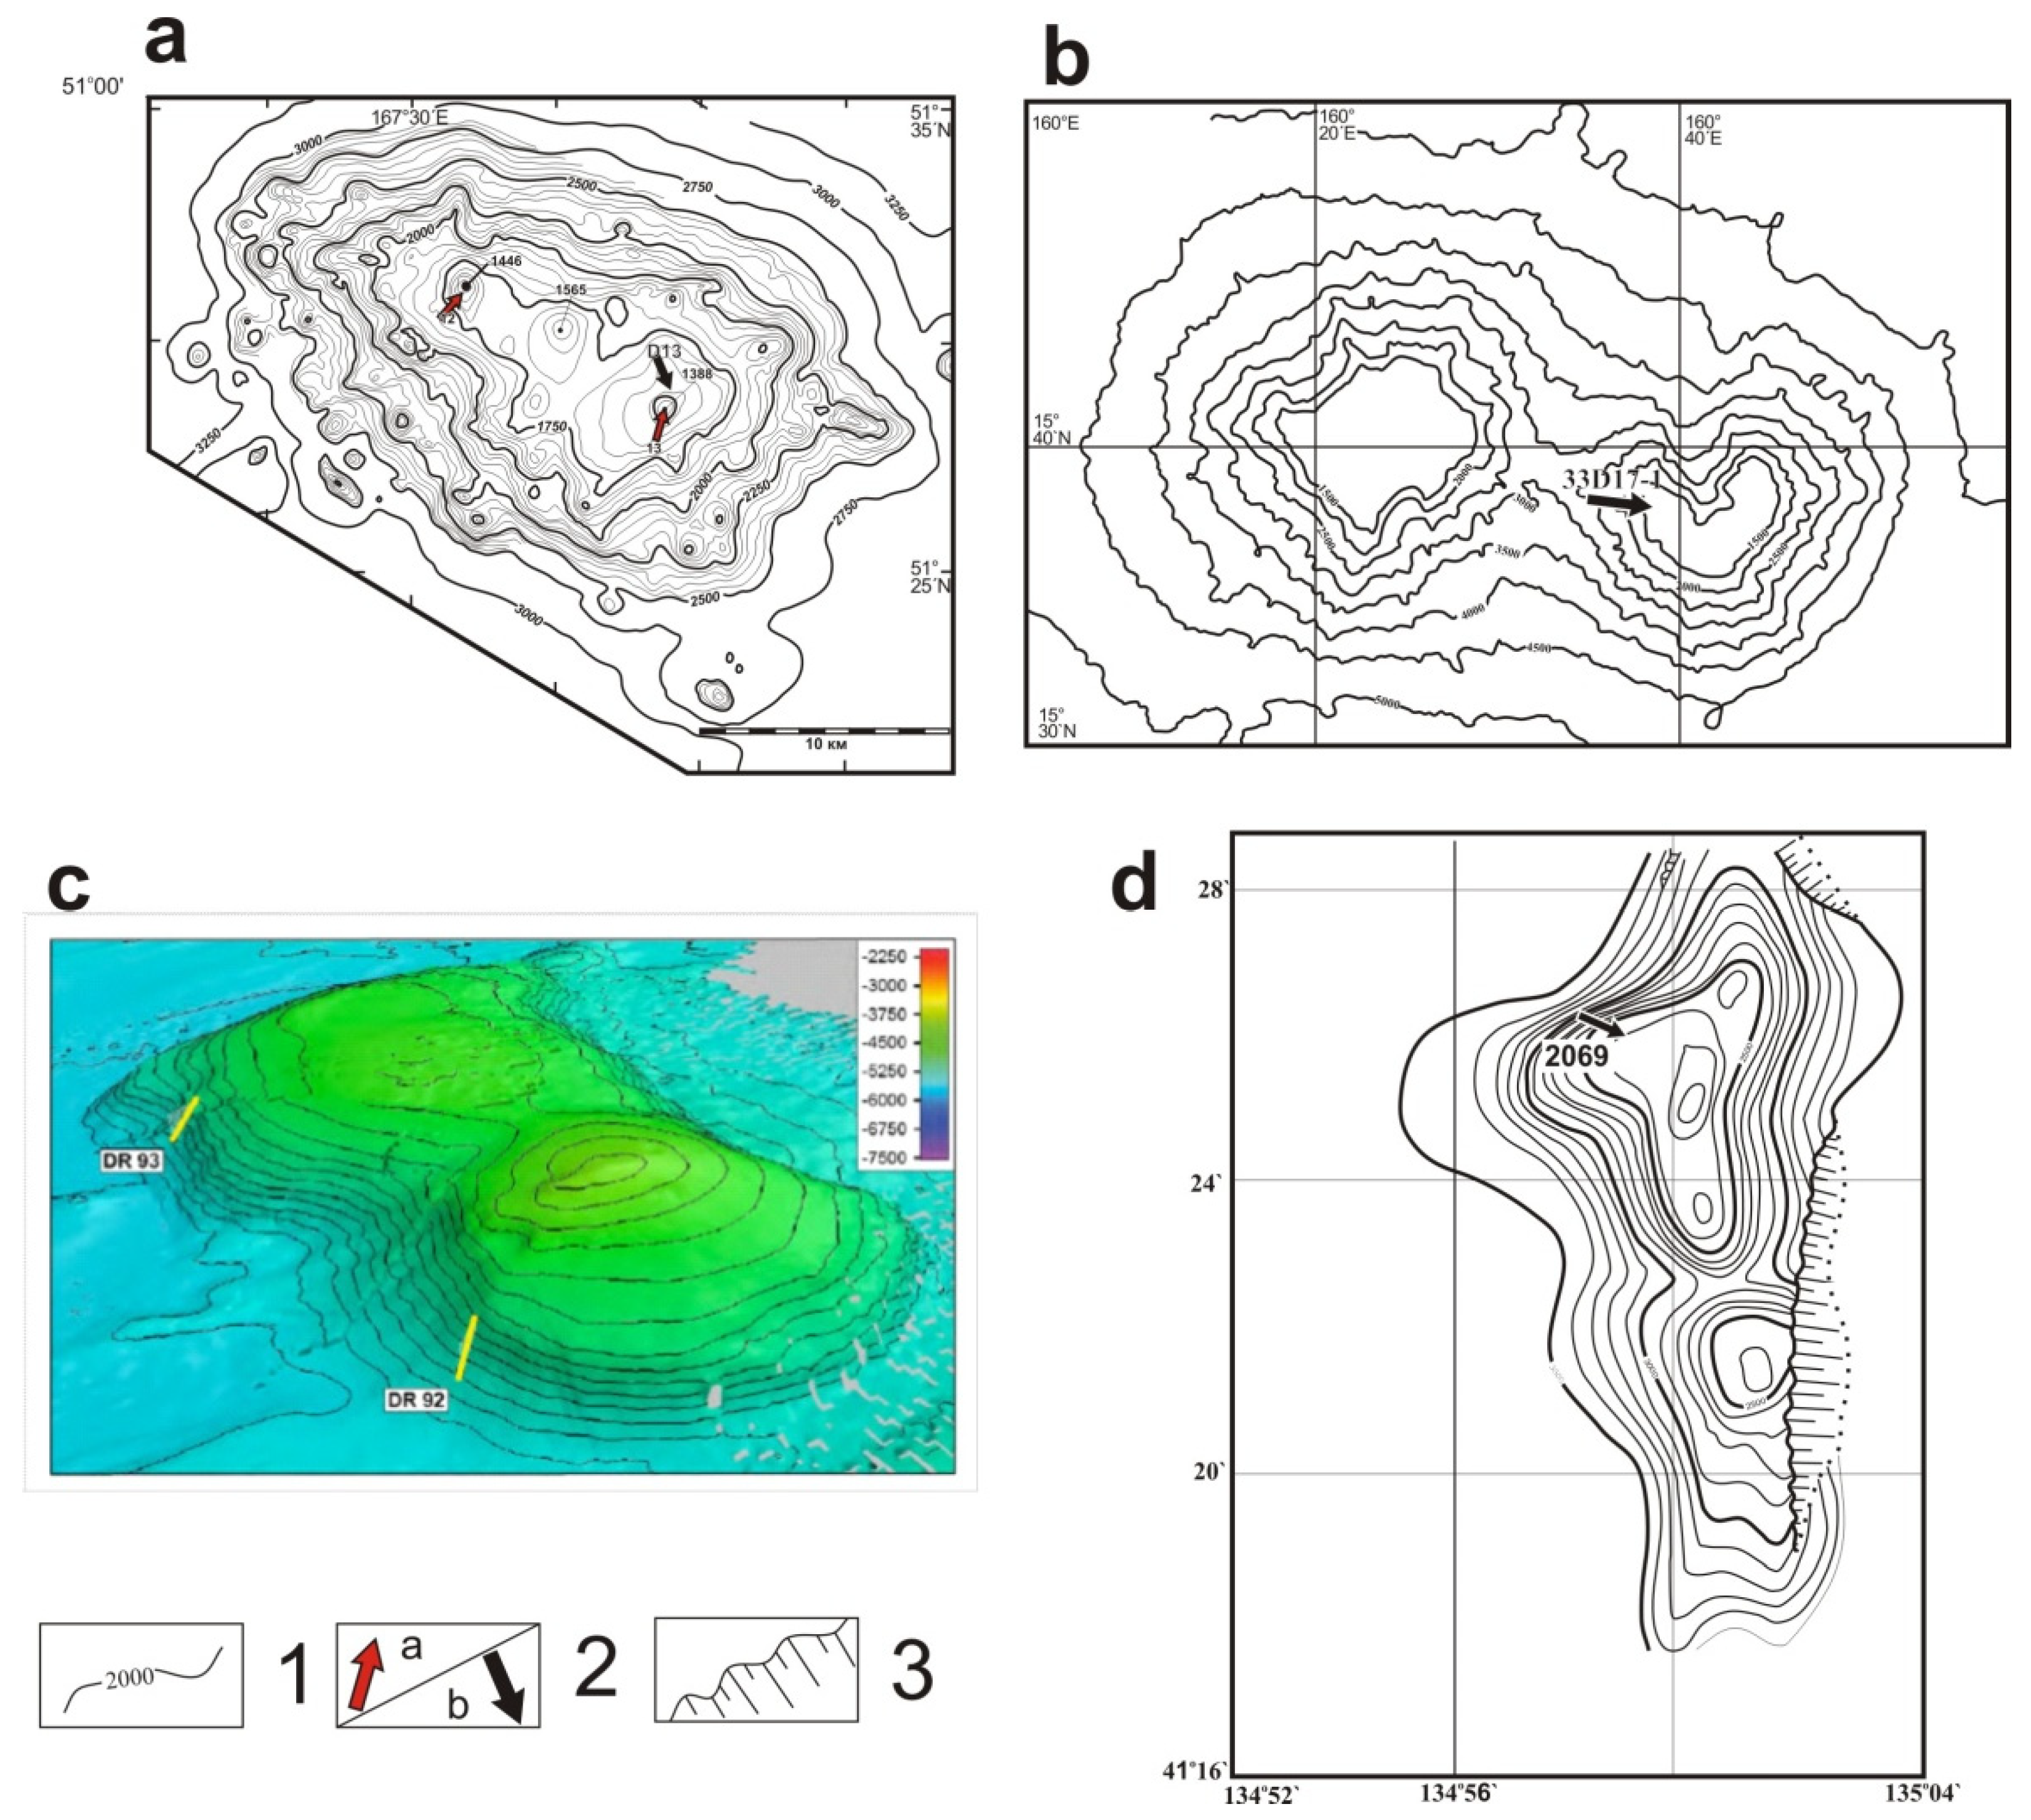
| D13, Detroit Guyot | 51°29.1′ | 167°38.9′ | 1650 | Guyot |
| 33D17-1, Zubov Guyot | 15°38.4′ | 160°37.6′ | 2000 | Guyot |
| DR92-11, “Gummi Bear” | 50°04.8′ | 163°02.8′ | 5043 | Intraplate volcano |
| 2069, Belyaevsky | 41°26′ | 134°59.6′ | 2500 | Back-arc volcano |
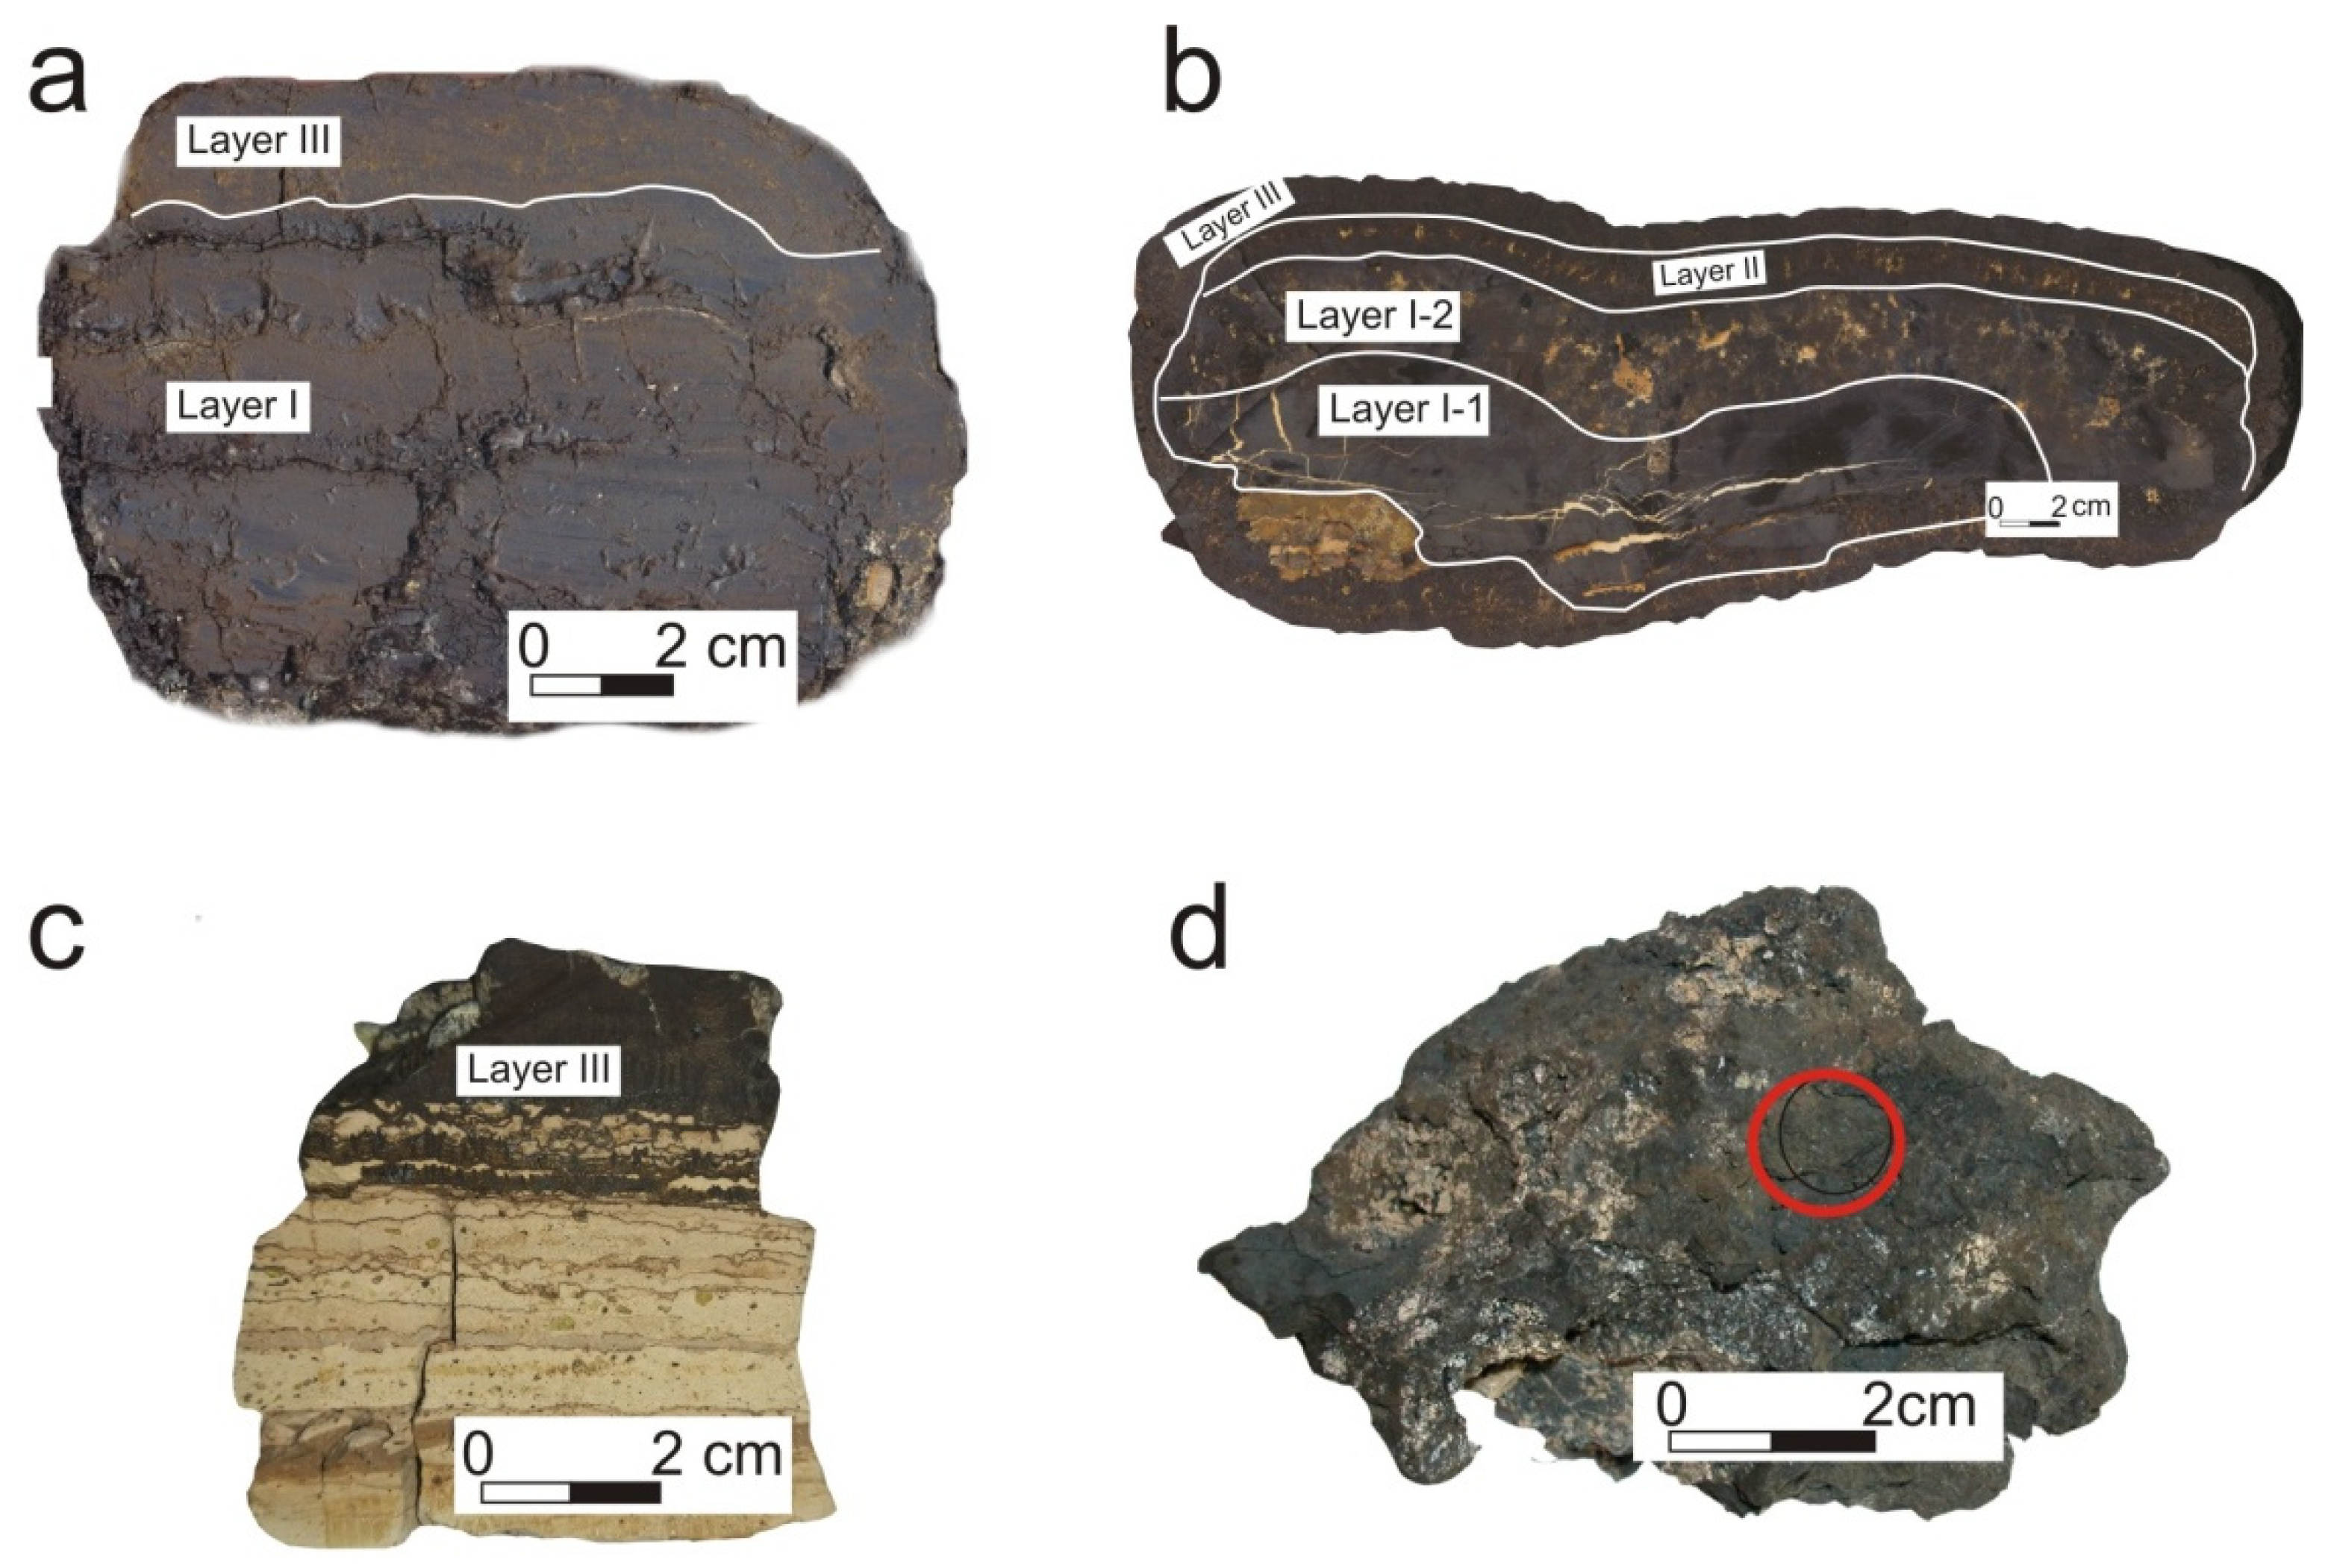
| Sample | Interval/Section | Mineral Composition |
|---|---|---|
| D13 | 0–103, mm | vernadite (δ-MnO2), quartz, plagioclase, clay minerals |
| 103–120, mm | vernadite (δ-MnO2), bernessite, 10 Å-manganite, CFA | |
| 33D17 | layer II; III | vernadite (δ-MnO2), quartz, plagioclase, clay minerals |
| laeyr I-1; I-2 | vernadite (δ-MnO2), CFA | |
| DR92-11 | layer III | vernadite (δ-MnO2), quartz, plagioclase |
| 2069 | bulk | vernadite(δ-MnO2), burnessite, todorokite, manganite, pyrolusite, manganosite, quenselite, tungomelan, manganotantalite, rhodochrosite. |
| Element | Detroit Guyot, D13 | ||||||
| Layer III | Layer I | ||||||
| Interval, mm | |||||||
| 0–5 | 5–18 | 18–22 | 22–38 | 38–58 | 58–103 | 103–120 | |
| Si (%) | 3.83 | 7.24 | 4.92 | 4.13 | 4.76 | 4.11 | 9.16 |
| Ti | 0.95 | 0.7 | 0.93 | 0.77 | 1 | 0.95 | 0.72 |
| Al | 1.55 | 1.73 | 0.82 | 0.48 | 0.79 | 0.89 | 2.06 |
| Fe | 31.25 | 21.42 | 23.73 | 20.58 | 22.75 | 16.59 | 13.06 |
| Mn | 9.99 | 18.45 | 21.82 | 24.03 | 22.02 | 27.7 | 18.22 |
| Mg | 0.91 | 1.01 | 0.98 | 1.05 | 1 | 1.03 | 1.79 |
| Ca | 1.45 | 2.19 | 2.33 | 2.37 | 2.39 | 2.82 | 6.46 |
| Na | 1.66 | 2.09 | 2 | 2.08 | 1.99 | 2 | 1.99 |
| K | 0.55 | 0.7 | 0.55 | 0.48 | 0.53 | 0.72 | 1.27 |
| P | 0.51 | 0.43 | 0.44 | 0.46 | 0.44 | 0.41 | 2.25 |
| Li (ppm) | 5.73 | 6.64 | 7.76 | 3.53 | 1.9 | 8.8 | 70.8 |
| Be | 5.5 | 4.9 | 6.2 | 5.28 | 5.7 | 6.2 | 2.7 |
| Sc | 21.1 | 13 | 12 | 10 | 7.9 | 9.2 | 20.3 |
| V | 748 | 638 | 779 | 758 | 770 | 626 | 339 |
| Cr | 298 | 83 | 12 | 88 | 5 | 7 | 115 |
| Co | 2668 | 2887 | 2937 | 3031 | 2845 | 4228 | 1647 |
| Ni | 803 | 1504 | 2507 | 3260 | 2727 | 4067 | 4293 |
| Cu | 117 | 362 | 384 | 398 | 415 | 1372 | 730 |
| Zn | 561 | 482 | 658 | 610 | 630 | 622 | 724 |
| Ga | n.d. | n.d. | n.d. | n.d. | n.d. | n.d. | n.d. |
| As | n.d. | n.d. | n.d. | n.d. | n.d. | n.d. | n.d. |
| Rb | 10.2 | 12.8 | 5.98 | 4.54 | 5.3 | 6. 6 | 22.1 |
| Sr | 1216 | 1548 | 1727 | 1757 | 1892 | 1763 | 933 |
| Y | 168 | 229 | 267 | 223 | 214 | 207 | 551 |
| Zr | 967 | 613 | 690 | 649 | 519 | 629 | 228 |
| Nb | 73 | 46 | 59 | 41 | 52 | 83 | 58 |
| Mo | 174 | 625 | 757 | 616 | 823 | 626 | 358 |
| Cd | 2.8 | 4 | 4.8 | 4.07 | 5.4 | 5.6 | 7.3 |
| Cs | 0.5 | 0.7 | 0.3 | 0.21 | 0.1 | 0.2 | 0.9 |
| Ba | 1797 | 1978 | 2053 | 1735 | 2373 | 2530 | 2298 |
| La | 346 | 347 | 416 | 361 | 372 | 322 | 376 |
| Ce | 1562 | 1116 | 1579 | 1350 | 2472 | 2415 | 709 |
| Pr | 84 | 79 | 89 | 82 | 93 | 76 | 87 |
| Nd | 354 | 335 | 382 | 357 | 383 | 311 | 386 |
| Sm | 76 | 76 | 86 | 77 | 88 | 71 | 87 |
| Eu | 18 | 19 | 21 | 19 | 21 | 17 | 22 |
| Gd | 80 | 85 | 102 | 85 | 95 | 83 | 102 |
| Tb | 10 | 12 | 13 | 13 | 12 | 10 | 14 |
| Dy | 56 | 73 | 80 | 71 | 72 | 61 | 85 |
| Ho | 10 | 14 | 16 | 14 | 14 | 12 | 17 |
| Er | 28 | 40 | 44 | 40 | 39 | 35 | 49 |
| Tm | 3.8 | 5.5 | 6.3 | 5.6 | 5.9 | 5.15 | 6.7 |
| Yb | 25.3 | 36.8 | 42.7 | 38 | 37.9 | 34.5 | 44 |
| Lu | 3.8 | 5.3 | 6.4 | 5.6 | 5.5 | 5.1 | 6.7 |
| Hf | 20.3 | 10.9 | 10.9 | 6.7 | 7.2 | 12.1 | 3.9 |
| Ta | 0.4 | 0.3 | 0.4 | 0.32 | 0.4 | 0.6 | 0.9 |
| W | 27 | 87 | 124 | 127 | 163 | 145 | 63 |
| Tl | 10 | 27 | 64 | 46 | 51 | 40 | 31 |
| Pb | 1692 | 1135 | 1548 | 1713 | 1858 | 1439 | 459 |
| Th | 71.9 | 48.1 | 24.9 | 23 | 19.6 | 24.4 | 14.7 |
| U | 11.3 | 14.8 | 17.7 | 16 | 17.4 | 17.5 | 8.5 |
| Au, ppb | <10 | <10 | <10 | <10 | 67 | 68 | <10 |
| Mn/Fe | 0.32 | 0.86 | 0.92 | 1.16 | 1.57 | 1.67 | 1.43 |
| ΣP3Э + Y | 2825 | 2473 | 3108 | 2741 | 3924 | 3664 | 2542 |
| R, mm/Ma | 6.18 | 5.41 | 5.26 | 4.99 | 5.55 | 2.86 | 4.91 |
| Element | Zubov Guyot, 33D17-1 | “Gummi Bear” DR92-11 | Belyaevsky Volcano 2069 | ||||
| Layer III | Layer II | Layer I-2 | Layer I-1 | Layer III | |||
| Interval, mm | |||||||
| 0–11 | 11–28 | 28–65 | 65–106 | ||||
| Si (%) | 3.39 | 4.82 | 1.15 | 1.82 | 7.00 | 1.76 | |
| Ti | 1.22 | 1.29 | 0.61 | 0.84 | 1.18 | 0.03 | |
| Al | 0.79 | 1.25 | 0.65 | 0.36 | 1.39 | 0.62 | |
| Fe | 17.87 | 18.52 | 9.5 | 13.45 | 16.23 | 2.85 | |
| Mn | 25.93 | 22.97 | 15.49 | 22.87 | 23.24 | 49.97 | |
| Mg | 1.01 | 1.01 | 0.69 | 0.71 | 0.99 | 1.40 | |
| Ca | 2.82 | 2.94 | 21.63 | 11.16 | 2.03 | 1.27 | |
| Na | 1.78 | 1.67 | 1.32 | 1.36 | 2.06 | 1.88 | |
| K | 0.49 | 0.67 | 0.41 | 0.37 | 0.79 | 1.03 | |
| P | 0.26 | 0.29 | 3.19 | 1.58 | 0.23 | 0.05 | |
| Li (ppm) | 3.84 | 2.19 | 10.1 | 4.71 | 4.83 | 342 | |
| Be | 4.43 | 5.33 | 2.96 | 5.67 | 5.37 | 0.33 | |
| Sc | 5.99 | 9.44 | 9.72 | 7.12 | 14.01 | 1.51 | |
| V | 675 | 636 | 372 | 731 | 547 | 609 | |
| Cr | 4.88 | 9.58 | 5.85 | 1.58 | <DL | 8.98 | |
| Co | 6802 | 5414 | 1981 | 2832 | 1765 | 361 | |
| Ni | 4632 | 4165 | 3283 | 3125 | 2924 | 870 | |
| Cu | 1377 | 1340 | 1059 | 1212 | 1486 | 120 | |
| Zn | 618 | 639 | 471 | 592 | 500 | 231 | |
| Ga | 4.89 | 5.61 | 3.92 | 6.01 | 10.9 | 19.1 | |
| As | 248 | 215 | 117 | 193 | 148 | 51.3 | |
| Rb | 4.12 | 10.5 | 6.99 | 3.34 | 9.08 | 14.4 | |
| Sr | 1688 | 1564 | 1616 | 1903 | 1316 | 1900 | |
| Y | 147 | 165.4 | 314 | 216 | 147 | 13.7 | |
| Zr | 662 | 745 | 449 | 604 | 802 | 15.7 | |
| Nb | 62.3 | 73.3 | 26.5 | 36.3 | 42.19 | 1.18 | |
| Mo | 562 | 451 | 259 | 686 | 494 | 251 | |
| Cd | 4.58 | 3.86 | 2.62 | 3.63 | 3.36 | 3.26 | |
| Cs | 0.03 | 0.58 | 0.63 | 0.03 | 0.40 | 0.59 | |
| Ba | 1647 | 1743 | 1315 | 2470 | 2184 | 13375 | |
| La | 271 | 274 | 225 | 344 | 289 | 11.1 | |
| Ce | 988 | 975 | 878 | 1802 | 3444 | 27.1 | |
| Pr | 50.3 | 54.7 | 34.2 | 47.4 | 83 | 2.39 | |
| Nd | 205 | 219 | 145 | 188 | 308 | 10.1 | |
| Sm | 42.8 | 47.1 | 28.2 | 33.2 | 76.8 | 2.1 | |
| Eu | 10 | 10.7 | 6.82 | 7.64 | 18.3 | 0.55 | |
| Gd | 45.6 | 47.9 | 36.6 | 40.3 | 72.2 | 2.41 | |
| Tb | 7.64 | 8.08 | 5.7 | 6.77 | 10.6 | 0.39 | |
| Dy | 42.8 | 43.3 | 34.6 | 40.9 | 53.6 | 2.41 | |
| Ho | 9.01 | 9.00 | 8.4 | 9.42 | 9.67 | 0.49 | |
| Er | 26 | 25.7 | 25.2 | 28.3 | 26.6 | 1.44 | |
| Tm | 3.81 | 3.79 | 3.64 | 4.23 | 3.86 | 0.20 | |
| Yb | 23.8 | 22.9 | 22.6 | 26.2 | 24.7 | 1.39 | |
| Lu | 3.67 | 3.47 | 3.79 | 4.10 | 3.58 | 0.2 | |
| Hf | 8.84 | 12.6 | 7.51 | 6.91 | 13.4 | 0.28 | |
| Ta | 0.82 | 0.94 | 0.63 | 0.76 | 0.62 | 0.07 | |
| W | 88.1 | 71.7 | 43.6 | 55.9 | 66.8 | 95.1 | |
| Tl | 155 | 163 | 109 | 125 | 117 | 4.18 | |
| Pb | 1673 | 1349 | 756 | 1899 | 805 | 13.5 | |
| Th | 10.1 | 11.8 | 2.91 | 9.91 | 59.4 | 0.79 | |
| U | 14.8 | 11.8 | 8.82 | 11.9 | 11.5 | 11.2 | |
| Au, ppb | <10 | <10 | 180 | 1390 | <10 | <10 | |
| Mn/Fe | 1.45 | 1.24 | 1.63 | 1.7 | 1.43 | 17.5 | |
| ΣP3Э + Y | 1878 | 1912 | 1774 | 2800 | 4574 | 76 | |
| R, mm/Ma | 4.25 | 6.83 | 1.89 | 1.29 | 12.3 | 174 | |
| Sample | Ag | Au | Cu | Sum | |
|---|---|---|---|---|---|
| D13 | Detroit guyot interval 58–103 mm | 6.3 | 64.2 | 29.5 | 100 |
| Detroit guyot interval 38–58 mm | 23.2 | 10.6 | 66.2 | 100 | |
| 33D17-1 | Zubov guyot | - | 100 | - | 100 |
| 92DR-11 | “Gummi Bear” seamount | 37.8 | 62.2 | - | 100 |
| 2069 | Belyaevsky underwater volcano | 8.1 | 70.4 | 21.2 | 99.7 |
Publisher’s Note: MDPI stays neutral with regard to jurisdictional claims in published maps and institutional affiliations. |
© 2021 by the authors. Licensee MDPI, Basel, Switzerland. This article is an open access article distributed under the terms and conditions of the Creative Commons Attribution (CC BY) license (https://creativecommons.org/licenses/by/4.0/).
Share and Cite
Mikhailik, P.; Mikhailik, E.; Ivanov, V. Gold in Ferromanganese Deposits from the NW Pacific. Minerals 2021, 11, 979. https://doi.org/10.3390/min11090979
Mikhailik P, Mikhailik E, Ivanov V. Gold in Ferromanganese Deposits from the NW Pacific. Minerals. 2021; 11(9):979. https://doi.org/10.3390/min11090979
Chicago/Turabian StyleMikhailik, Pavel, Evgenii Mikhailik, and Vladimir Ivanov. 2021. "Gold in Ferromanganese Deposits from the NW Pacific" Minerals 11, no. 9: 979. https://doi.org/10.3390/min11090979
APA StyleMikhailik, P., Mikhailik, E., & Ivanov, V. (2021). Gold in Ferromanganese Deposits from the NW Pacific. Minerals, 11(9), 979. https://doi.org/10.3390/min11090979