Article

Iron-Speciation Control of Chalcopyrite Dissolution from a Carbonatite Derived Concentrate with Acidic Ferric Sulphate Media

by
Kolela J. Nyembwe
1,2,
Elvis Fosso-Kankeu
1,3,*,
Frans Waanders
1 and
Martin Mkandawire
1,2,*
1
Water Pollution Monitoring and Remediation Initiative Research Group in the Centre of Excellence of Carbon-Based Fuels, North-West University, Potchefstroom 2520, South Africa
2
Department of Chemistry, School of Science and Technology, Cape Breton University, Sydney, NS B1P 6L2, Canada
3
Department of Electrical and Mining Engineering, College of Science Engineering and Technology, Florida Science Campus, University of South Africa, Florida Park, Roodepoort 1709, South Africa
*
Authors to whom correspondence should be addressed.
Minerals 2021, 11(9), 963; https://doi.org/10.3390/min11090963
Submission received: 26 July 2021 / Revised: 23 August 2021 / Accepted: 26 August 2021 / Published: 3 September 2021
(This article belongs to the Section Mineral Processing and Extractive Metallurgy)

Abstract

:
The mechanisms involved in the dissolution of chalcopyrite from a carbonatite concentrate in a ferric sulphate solution at pH 1.0, 1.5 and 1.8, and temperatures 25 °C and 50 °C were investigated. Contrary to expectations and thermodynamic predictions according to which low pH would favour high Cu dissolution, the opposite was observed. The dissolution was also highly correlated to the temperature. CuFeS2 phase dissolution produced intermediate Cu rich phases: CuS, Cu2S and Cu5FeS4, which appeared to envelop CuFeS2. Thermodynamic prediction revealed CuS to be refractory and could hinder dissolution. CuFeS2 phase solid-state dissolution process was further discussed. Free Fe3+ and its complexes (Fe(HSO4)2+, Fe(SO4)2– and FeSO4+ were responsible for Cu dissolution, which increased with increasing pH and temperature. The dissolution improved at pH 1.8 rather than 1.0 due to the increase of (Fe(HSO4)2+, Fe(SO4)2– and FeSO4+, which were also the predominating species at a higher temperature. The fast and linear first dissolution stage was attributed to the combined effect of Fe3+ and its complex (Fe(HSO4)2+, while Fe(SO4)2– was the main species for the second Cu dissolution stage characterised by a slow rate.

1. Introduction

The demand for copper (Cu) has risen over the past few decades due to the rapid growth of the electronic industry. A major source of Cu is chalcopyrite (CuFeS2), a copper sulphide mineral, which accounts for around 70–80% of the total global production of Cu. The pyrometallurgy route produces about 85% of worldwide Cu through a reverberatory furnace or flash smelting [1]. However, this process is becoming expensive due to ever-increasing stringent environmental regulations coupled with abnormal SO2 emissions and the huge volume of tailings generated through froth flotation. For instance, for every ton of copper obtained through flotation processes, 151 tonnes of tailings are produced [2]. On the other hand, the relative decrease in profit margins for mineral processing caused by the scarcity of high-grade ore bodies is also a concern. Consequently, hydrometallurgy can be economically attractive for the production of Cu from CuFeS2 and present several advantages, including high selectivity, environmental friendliness, suitable for low or complex chalcopyrite ore bodies [3].
Hydrometallurgy is the extraction of minerals from the ore by leaching with aqueous solvents (aka medium). Some of the solvents for CuFeS2 include sulphate-based media (H2SO4-Fe2(SO4)3) [4], chloride-based media (HCl-FeCl3) [5], mixed chloride-sulphate media (H2SO4-Fe2(SO4)3-NaCl) [6] and nitrate-based media (Fe(NO3)3) [7]. CuFeS2 is highly refractory and regarded as one of the most difficult minerals to leach regardless of the media. Its leaching is slow and incomplete due to the formation of a diffusion barrier that builds up between the leaching solution and CuFeS2. The nature and composition of this barrier, together with the dissolution mechanism, still remain controversial [4,8,9]. There are three hypotheses regarding the structure of the formed diffusion barrier. The first hypothesis is that elemental sulphur (S0), formed during leaching, prevents further diffusion of the reactant from reaching the un-leached chalcopyrite [10,11]. The second hypothesis, commonly cited, attributes it to the formation of Cu-rich polysulphides, formed due to solid-state transformation through the preferential Fe dissolution. This hypothesis is referred to as the metal-deficient sulphide theory [12,13]. The third hypothesis refers to iron-precipitates jarosite, jarosite-like species and goethite [13,14].
According to the Eh-pH (Pourbaix) diagram (Figure S1) for the Cu-Fe-S-H2O system, dissolution of CuFeS2 in acidic media takes place through a solid transformation in different intermediate sulphide (Cu5FeS4, CuS and Cu2S) phases. The formation of these phases may, to some extent, be attributed to the slow chemical kinetics associated with the products of the reaction. The diagram also shows that successful copper dissolution from the mineral could be achieved after increasing the redox potential above 0.44 V (SHE) [10]. Consequently, acidic ferric sulphates (H2SO4-Fe2(SO4)3-FeSO4-H2O) are gaining prominence as preferred dissolution media for the chalcopyrite leaching process in hydrometallurgical extraction of Cu. The H2SO4-Fe2(SO4)3-FeSO4-H2O presents several advantages, including its simple chemistry, low capital and operational costs and environmental friendliness [15]. In this media, Fe is distributed as free Fe3+ and Fe2+ and or as complexed iron compounds (e.g., FeHSO4+, FeSO40, Fe(HSO4)2+, Fe(SO4)2− and FeSO4+) and their content in solution depend on the pH and temperature [16,17]. The thermodynamic function and equilibrium constant of the various species are presented in Table S1 (supplementary information). Therefore, the oxidising power/strength of H2SO4-Fe2(SO4)3-FeSO4-H2O solution must be viewed as a function of all the possible ferric species present in the solution. Hirato and co-workers [18] examined the speciation of (H2SO4-Fe2(SO4)3-FeSO4-H2O) and plotted the distribution of Fe species according to Sapieszko et al. [19] and concluded that Fe3+ and FeHSO42+ are the important Fe species for the CuFeS2 dissolution in H2SO4-Fe2(SO4)3-FeSO4-H2O.
The leaching kinetics may be related to the distribution of iron species in the solution. In addition, the inherent problem with the direct application of Eh-pH diagrams (Figure S1) to leaching is the possible formation of intermediate phases, and there is no way to predict the presence of metastable phases from thermodynamics considerations alone. Nevertheless, a comprehensive CuFeS2 dissolution mechanism could be obtained by systematic leached residue characterization employing surface analytical methods (such as X-ray photoelectron spectroscopy, X-ray absorption spectroscopy, X-ray diffraction, scanning electron microscope and Raman spectroscopy) and through control of solution chemical aspects, among which the solution redox and pH are very important.
Most previous studies reporting on the Cu recoveries from CuFeS2 only characterized solids residue at the resolved experimental end time. This has not allowed for evaluating the entire mineral phase evolution taking place during dissolution. This work, therefore, conducts the dissolution of CuFeS2 in H2SO4-Fe2(SO4)3-FeSO4-H2O system at different pH regimes (1.0, 1.5 and 1.8) and operating temperatures (25 °C and 50 °C) and identify the likely refractory intermediates based on the solid-state transformation taking place throughout the dissolution process. Furthermore, it investigates the evolution of Fe species during CuFeS2 leaching in H2SO4-Fe2(SO4)3-FeSO4-H2O.

2. Materials and Methods

2.1. Materials

Solutions of the desired pH were prepared using analytical grade sulphuric acid (H2SO4 98% A.C.E.), ferric sulphate (Fe2(SO4)3·H2O A.C.E.), and deionised water (<5.0 µs/cm). The measured redox potential (Ag/AgCl) measurements were referenced to the Standard Hydrogen Electrode (SHE).

2.2. Chalcopyrite Sample Preparation and Characterisation

The chalcopyrite concentrate samples were obtained from a carbonatitic ore body treated through flotation at Phalaborwa Copper Mining Company (Limpopo Province, South Africa). Its major phases were chalcopyrite (CuFeS2 (68.37%)), Mg-rich calcite (Mg-CaCO3 (29.27%)) and traces of another copper sulphide (Cu7S4 (3.41%), Cu9S5 (2.51%) and Cu5FeS4(4.51)) with quartz (SiO2 (2.20)) (Figure S2). The sample had a bulk Cu content of 36.39% and was dried in an oven at 50 °C for seven days before sub-sampling. First, the homogenisation of samples was carried out according to the soil sampling protocol by the U.S. Environmental Protection Agency [20]. Then, approximately 0.5 kg of concentrate was sub-sampled and further dried for 2 h at 105 °C. The grains with sizes smaller than 200 µm were used as the dissolution feed at an average grain size of 32 µm (Figure S2d). The powdered sample was characterised in an earlier study by Nyembwe et al. [21] for its chemistry, mineral composition and morphology using the XRF, X-ray diffraction (XRD) and scanning electron microscopy–energy dispersive spectroscopy (SEM-EDX), respectively. They are provided in Supplementary Information Figure S2.

2.3. Leaching Media and Tests

The CuFeS2 dissolution was conducted in acidified ferric sulphate solution (H2SO4-Fe2(SO4)3), obtained by mixing Fe2(SO4)3 with H2O water and H2SO4. An initial Fe content (Fe3+ = 0.05 M Fe) was used for all tests. The media was agitated for 12 h prior to use. Dissolution tests were performed at atmospheric conditions at 25 °C or 50 °C. The media pH was measured and maintained at 1.0, 1.5 and 1.8 with periodic addition of H2SO4 (98%) while the solution’s oxidation reduction potential (ORP) could evolve throughout the dissolution test. An initial pulp density of 10% was used in all tests, with 40 g of the dried chalcopyrite sample mixed with 400 mL of the leaching liquor in a 600 mL Erlenmeyer flask (conical wide neck). The agitation (500 rpm) was achieved through use of an overhead stirred (stirrer ES, Velp Scientica (0–1300 pm)) placed on top of the dissolution vessel (Figure S3). An initial pulp density of 10% was used in all tests, with 40 g of the dried chalcopyrite sample mixed with 400 mL of the leaching liquor in a 600 mL Erlenmeyer flask. 10 mL sample was withdrawn every 20 min for chemical analysis, while the solution ORP was measured at intervals and converted to the SHE. Total Cu and Fe were analysed using atomic absorption flame spectrometry (AAFS, Thermo Scientific ICE 3000 series).

2.4. Leachate Speciation

Chemical Fe speciation was calculated using the geochemical modelling software, PhreeqC (version 3.3.12-12704, U.S. Geological Survey). Fe speciation and its evolution throughout the dissolution were based on the initial (prepared medium) characterization and each withdrawn leachate solution. The characterization of each solution involved the determination of total cations, sulphates (SO42−), pH, Eh (Ag/AgCl), T (°C), and solution density (ρ). These measurements were used as individual inputs (data block of interest), inserted for Fe leachate speciation modelling. Each solution was considered an independent data block (master species with inputs of the measured concentration, pH, Eh and temperature) from which the curves of the aqueous Fe species were obtained and drawn.
The software is based on an ion association aqueous model. The equilibrium speciation is defined by a set of equations governed by element mass balance electrical charge balance [18]. The redox chemistry is defined by Equation (1), which is based on the electron activity whereby R is the gas constant (8.314 JK−1 mol−1), T is the temperature (K), F represents the Faraday constant (96,485 C mol−1), pE negative log of the electron activity (equilibrium position for all redox couples in the system), which is related to Eh and delivered using Equation (1).
E h = p E ( 2.302 × R × T ) / F

2.5. Residue Characterisation

Solid were analysed for mineral composition using XRD and optical phase identification and surface morphology using SEM–EDX. The XRD analysis using a Rigaku Ultima IV (Rigaku Corporation, Tokyo, Japan) was operated at 40 kV and 30 mA. PDXL analysis software was used, and the instrument’s detection limit was 2%. Data were recorded over the range 5° ≤ 2θ ≤ 95° at a scan rate of 0.5°/min and step width of 0.01°. Tescan S.E.M. (operated at 20 kV) with E.D.X. analysis was used for grain morphology and chemistry. Residues were carbon-coated prior to analysis.

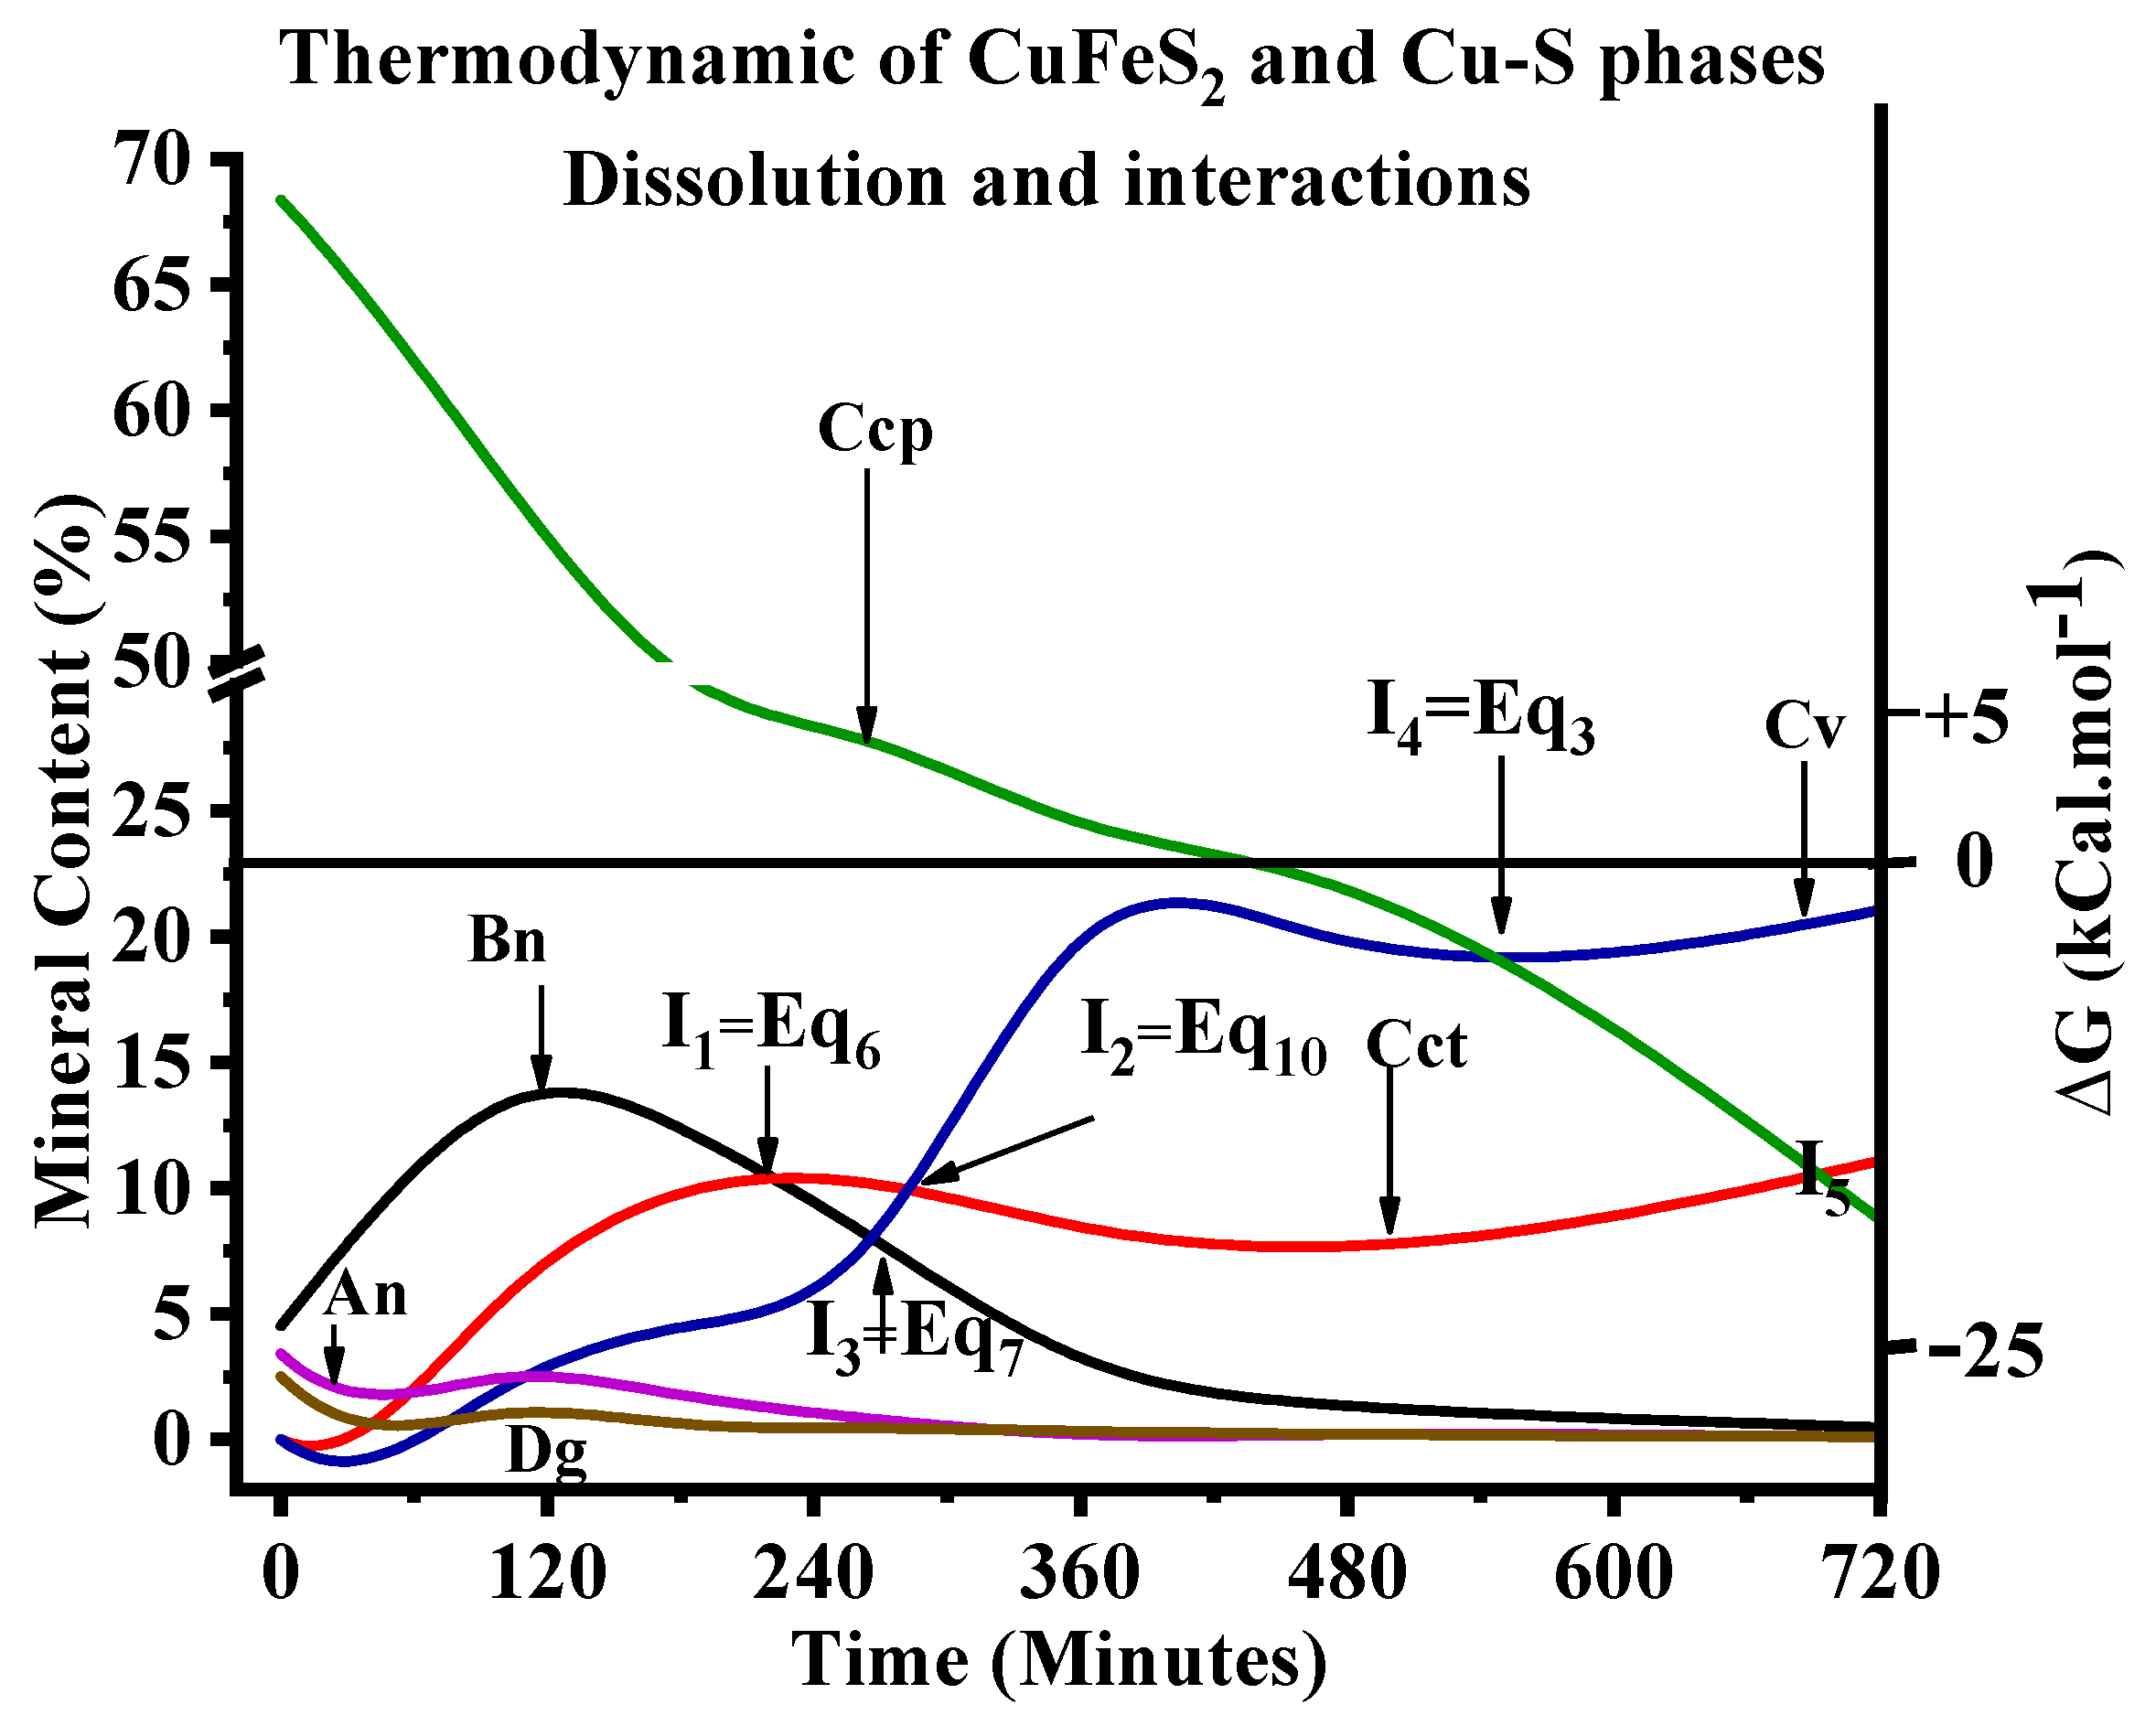
3. Results and Discussion

3.1. Initial Fe Speciation of the Media

The initial Fe speciation at pH 1.0, 1.5 and 1.8 at 25 or 50 °C was simulated using PhreeqC and is shown in Figure 1. Fe2+ and Fe(HSO4)+ were the main iron species observed (Figure 1a) at all the pH and temperatures. The increase in pH and temperature appears to have slightly increased the concentration of Fe3+ and its sulphate complexes (Fe(HSO4)2+, Fe(SO4)2− and FeSO4+) to the expense of free Fe2+ (Figure 1a) even much more with the increase of temperature 25–50 °C (Figure 1b). The high ORP and pE support this at higher pH or temperature. pE values at 25 °C were 9.3, 9.41 and 9.57 at a pH of 1.0, 1.5 and 1.8, respectively. While at 50 °C, pE values of 9.51, 9.7 and 9.86 were recorded.

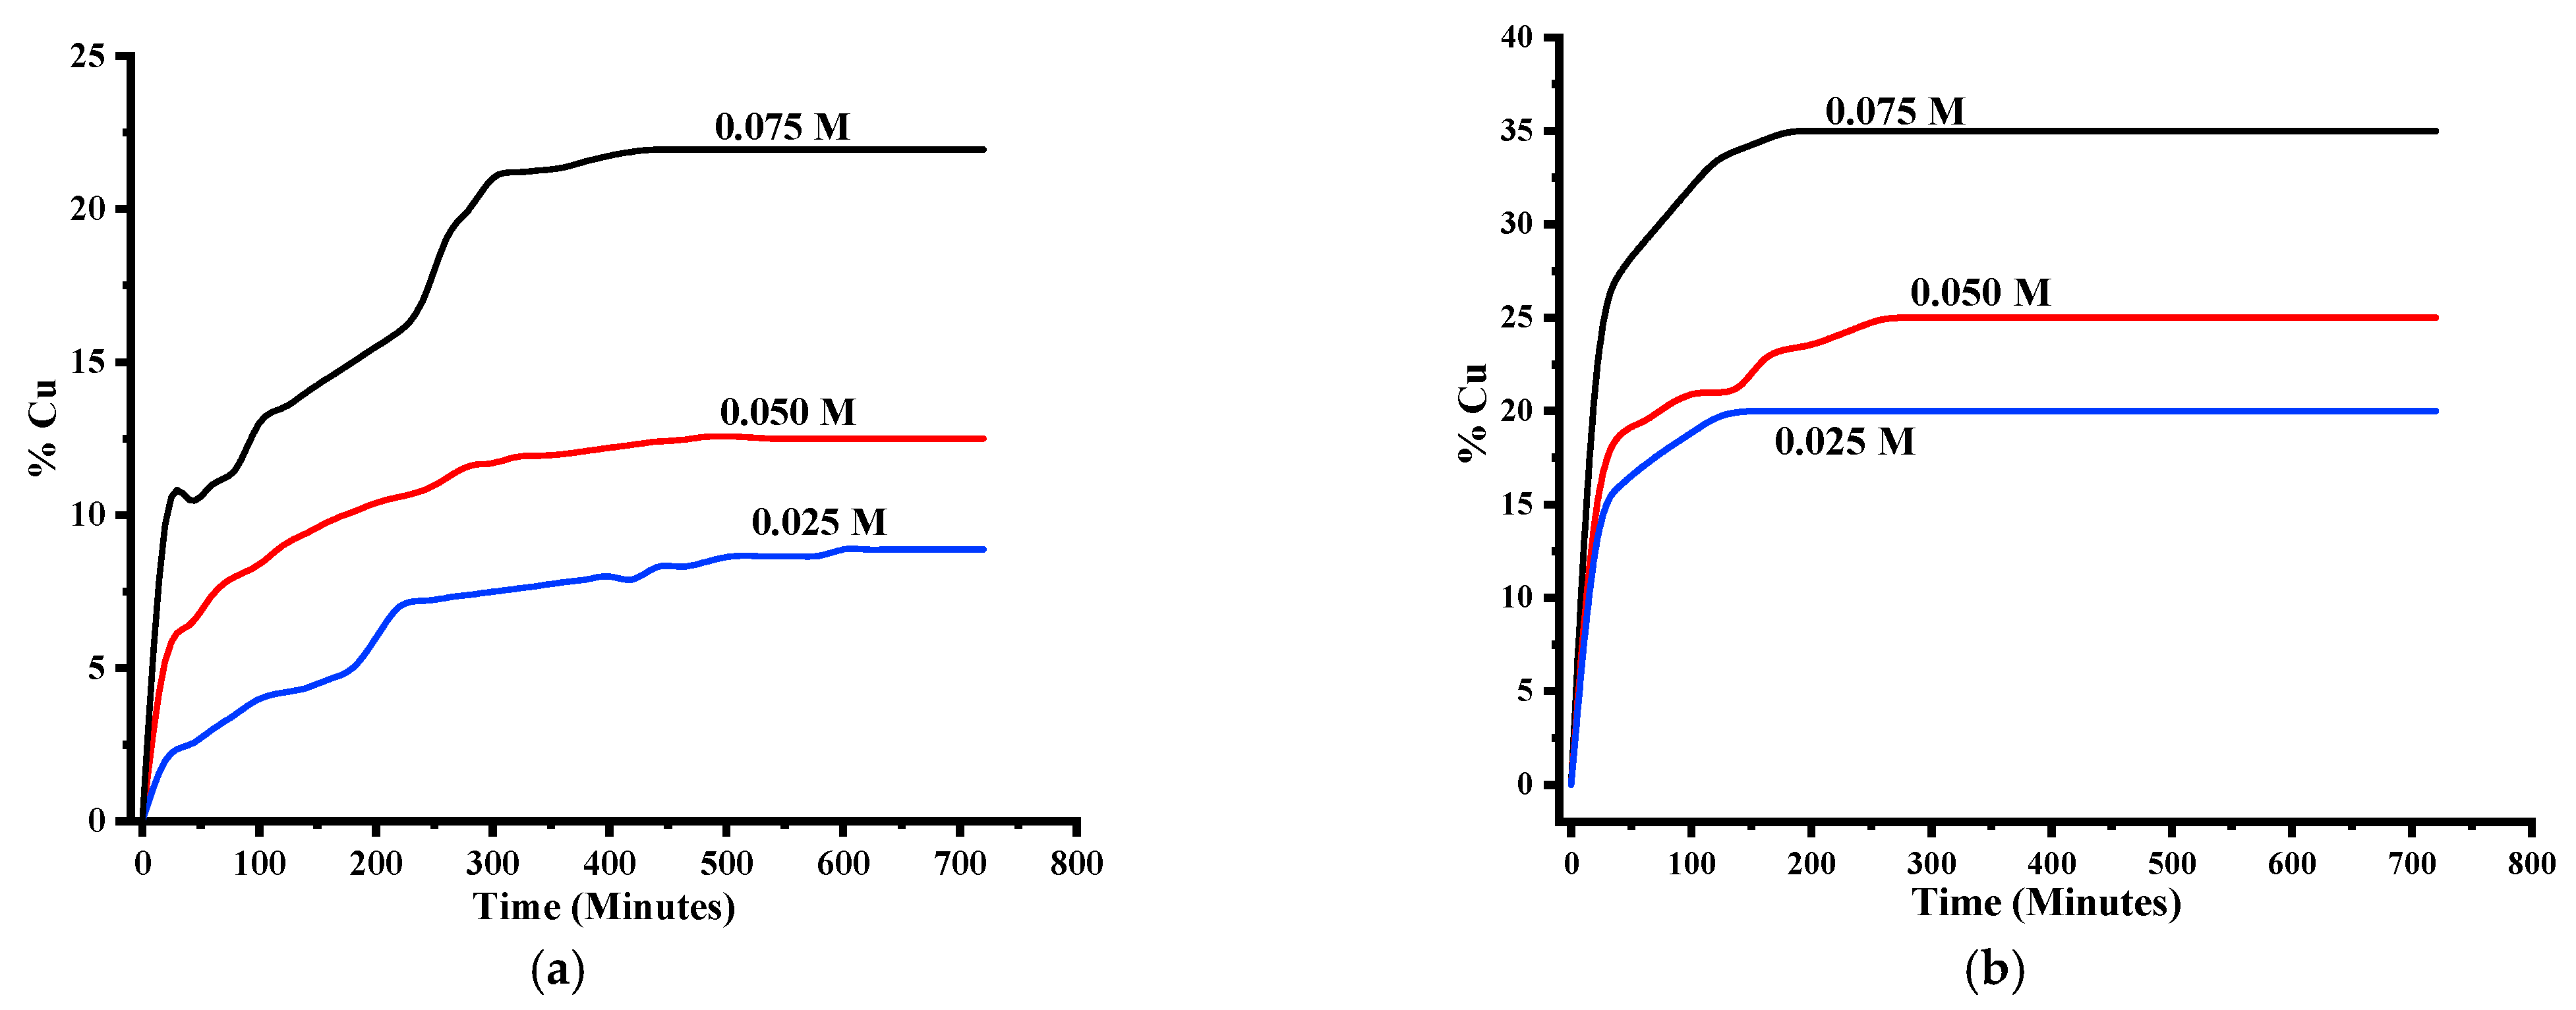
3.1.1. Cu Dissolution Rate and Recovery

The leaching of CuFeS2 at different temperatures under variable pH of media is presented in Figure 2. More Cu dissolved at 50 °C than at 25 °C and slightly more at pH 1.8 than 1.5 and 1.0 (evident at 50 °C, not so at 25 °C). It can be seen that pH plays an essential role in the dissolution of CuFeS2. Previous reports suggest that an acidic environment minimises hydrolysis and ferric precipitation. The obtained recoveries agreed with Antonijevic and Bogdanovic [22], and Córdoba et al. [23] point out that chalcopyrite easily oxidises at higher pH values when oxygen is present in solutions.
All dissolution curves were asymptotic and characterised by three stages: the first was more rapid (from 0–60 min) than the second (40–360 min), and the third was a plateau with no Cu dissolution (360–720 min). Our results support those of Klauber et al. [10] and Salinas et al. [24], but not those of Jones and Peters [25], who observed a linear kinetic probably due to an extended dissolution time over 55 days. The form of the dissolution curve showed the plateau is reached around 380–420 min of dissolution at room temperature (i.e., 25 °C). While at 50 °C, the maximum Cu recovery is reached after 180–220 min of dissolution, which could be attributed to a more rapid reaction at higher temperatures and formation of the reaction products.

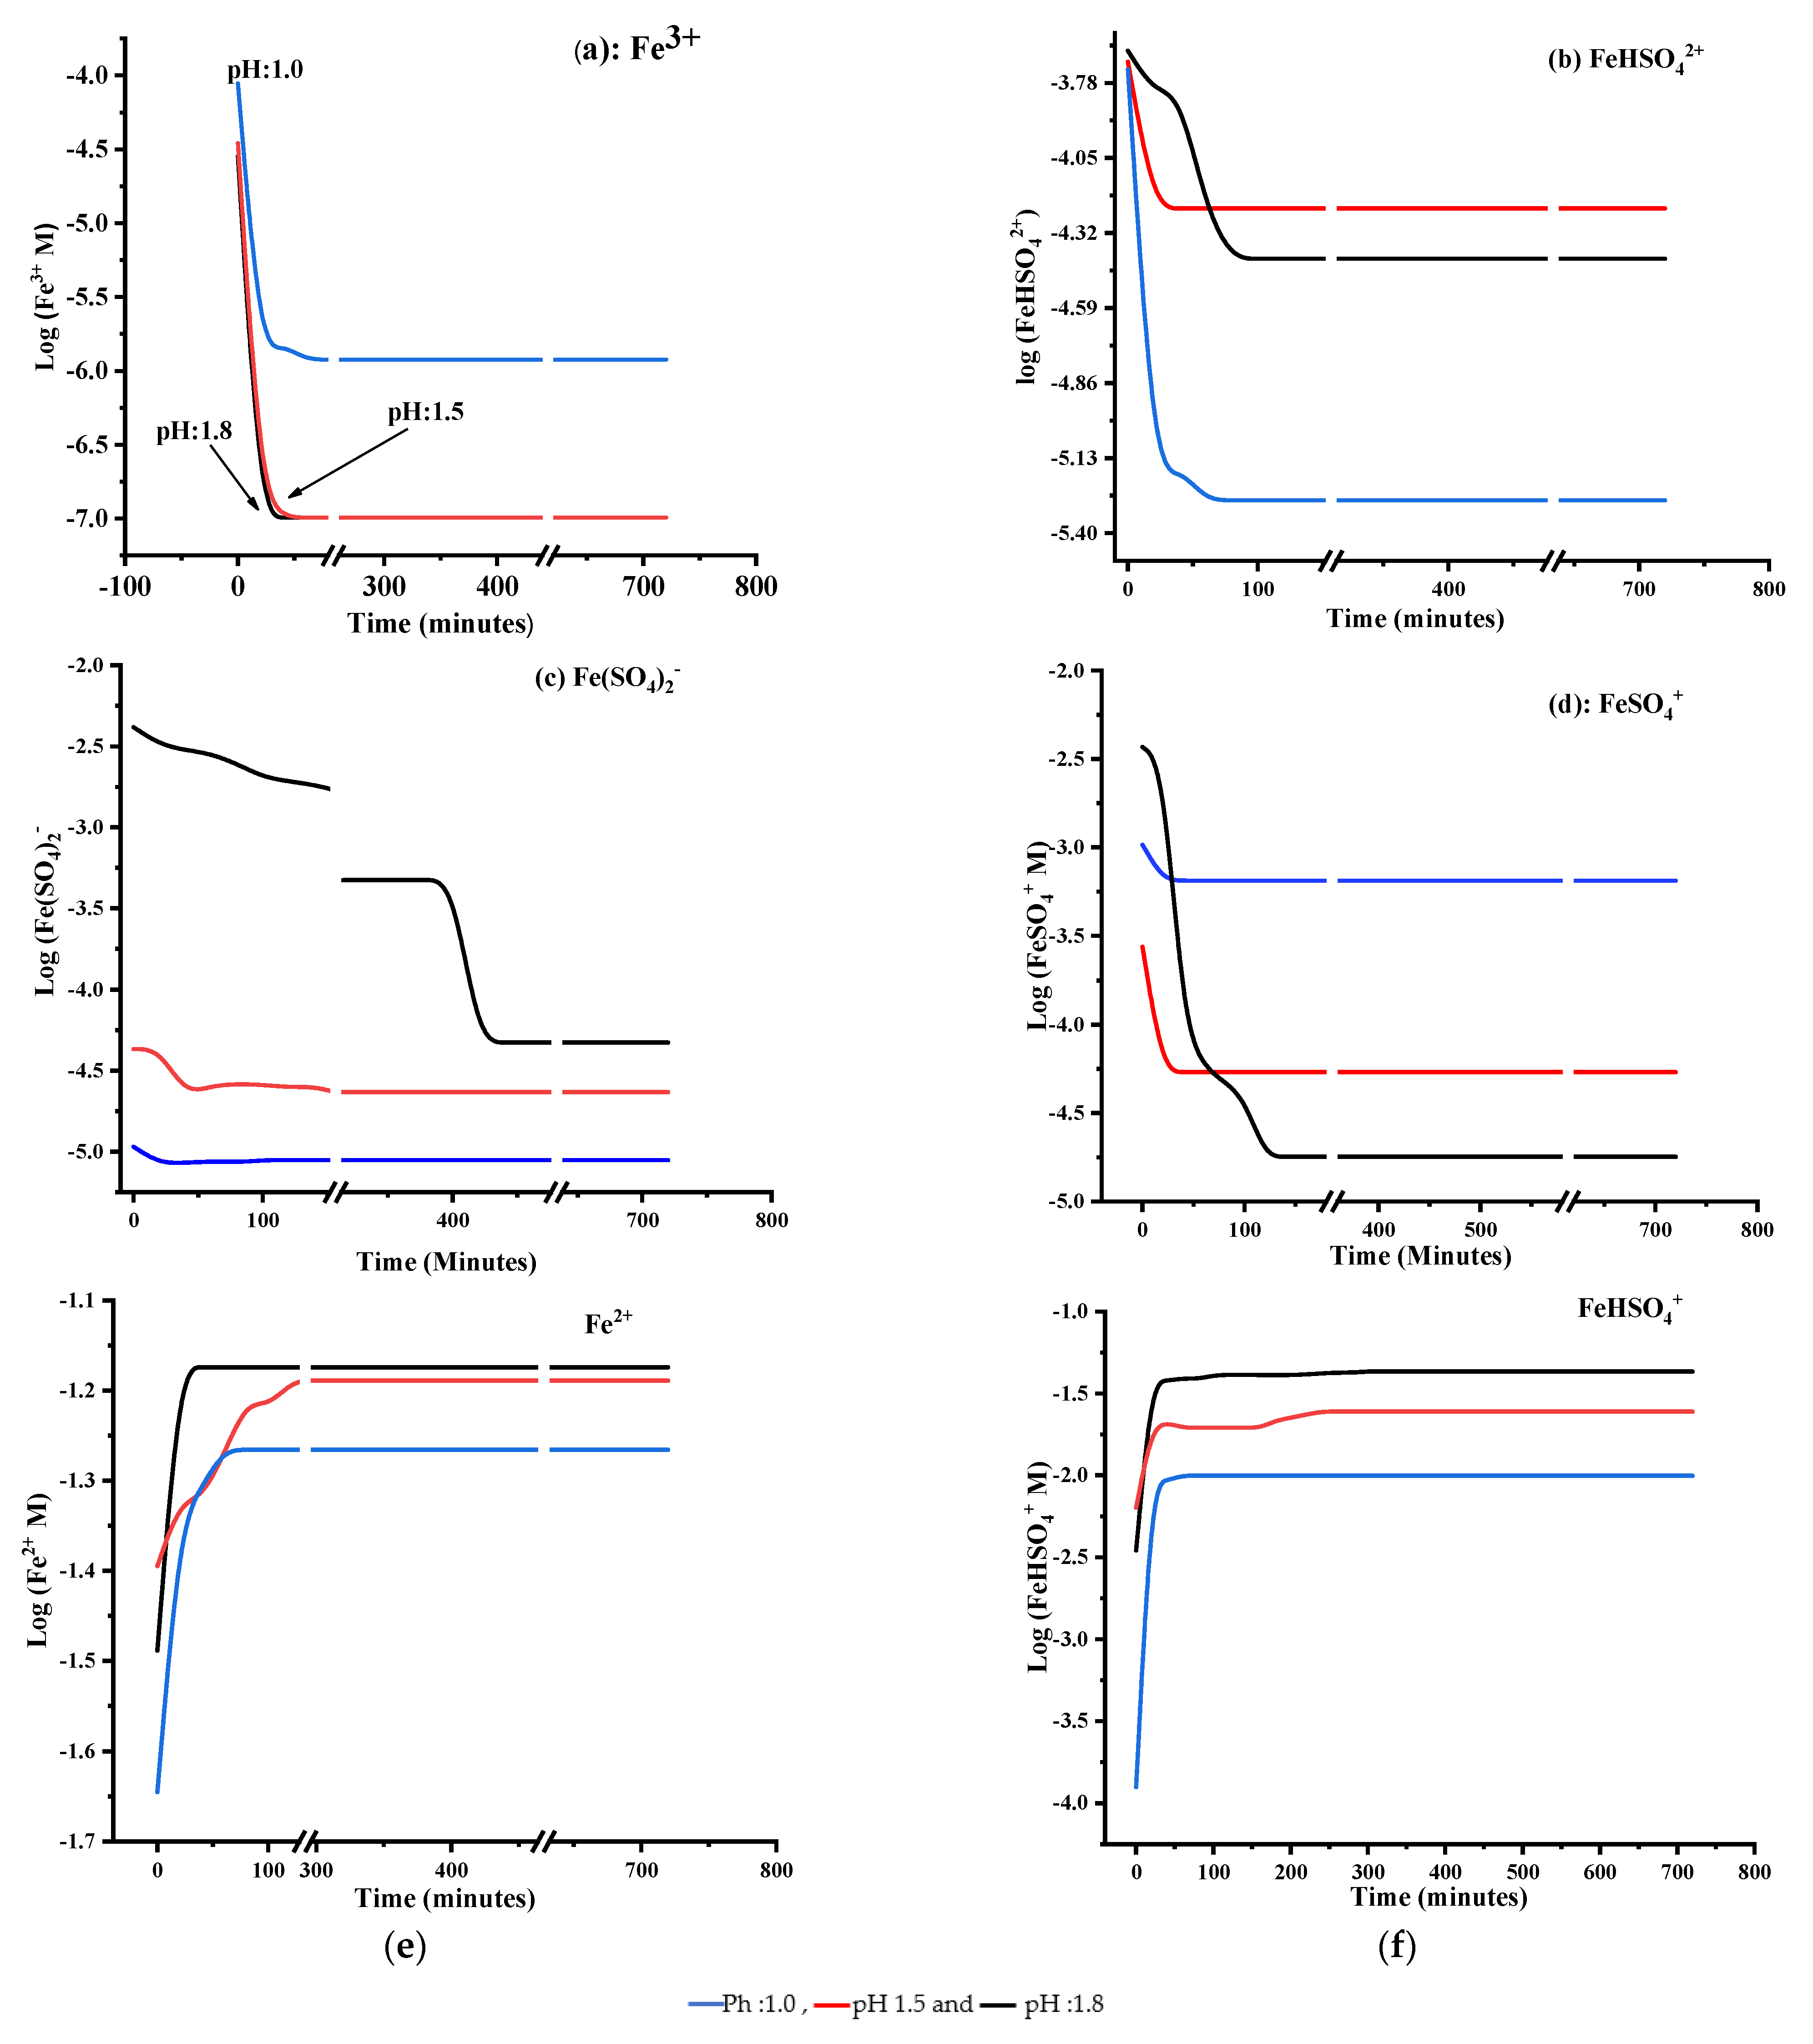
3.1.2. Ferric Speciation during Chalcopyrite Leaching

The leaching of Cu from the chalcopyrite mineral over a time spate is presented in Figure 3, which also shows the evolution of Fe speciation at 50 °C for different pH. Speciation was calculated using the measured total Fe and Cu in the solution and the recorded redox potential. It was observed that the initial concentration of Fe3+ and its complexes dropped during Cu dissolution, which suggests that Fe3+ is not the only species responsible for CuFeS2 oxidation.
Fe3+ and Fe(HSO4)2+ both linearly dropped within the first 40 or 80 min (Figure 3a,b) of the Cu dissolution while the Cu recovery curve continued over 200 min (Figure 3a,b). At 25 °C, Fe3+ decreased by 90, 67 and 78% at pH 1.0, 1.5 and 1.8. While at 50 °C, its content decreased further by 97, 82 and 87, respectively. Fe(HSO4)2+ also decreased by 17, 28 57% at 25 °C. At 50 °C, its content went down by 32, 51 and 71%. Our results support Hirato et al. [26], who concluded that Fe3+ and Fe(HSO4)2+ play a significant role during ferric leaching of CuFeS2. Our results show that the initial fast rapid and linear Cu dissolution stage corresponds to the combined effect of Fe3+ and Fe(HSO4)2+.
The increase in pH from 1.0~1.8 led to an increase in Fe(SO4)2− content (Figure 2b). At pH 1.8, for instance, this species appeared to be the dominant form of Fe(III) in solution after the FeSO4+. The results showed that Fe(SO4)2− decreased during Cu leaching from its initial content by 15 and 85%, respectively, at 25 and 50 °C. Its decrease was gradual and prolonged over 300 min (Figure 3c) and could correspond to the second dissolution stage (from 80 to 340 min), characterised by a relatively low rate than the first stage. Thus, implying that Fe(SO4)2− contributed to Cu dissolution. FeSO4+ also decreased to a less extent within the first 40 min of leaching. Its content went down at 25 °C by 7, 16 and 24, further by 28, 35 and 41% at 50 °C. The speciation results further revealed that the decrease rate of the various Fe(III) species and Fe(II) increase matches the Cu dissolution rate.

3.1.3. Effect of Temperature

Raising the temperature revealed a positive response to the rate of metal dissolution and recovery during the dissolution process. Its effect appeared to be pronounced when the temperature was increased from 25 to 50 °C (Figure 3b). Previous studies have reported that more than ten times the extraction of Cu has been identified when dissolving CuFeS2 by raising the temperature from 30 to 90 °C [12]. The obtained results support the improved Cu leaching. For instance, at 50 °C and pH 1.8, the Cu dissolution rate doubled, while at 1.5 and 1.0, it increased by a factor of 1.6 and 1.2, respectively. Thus, it supports the positive impact of temperature upon mineral dissolution.

3.2. Effect of Initial Solution Potential

It should be worth noting that the initial solution oxido-reduction potential (ORP) varied according to the solution pH, probably due to the various Fe species distribution existing at the different pH values (Figure 1), which also play a major role in the Cu recovery different pH values. At both temperatures, it was observed that high pH (1.8) media possessed a high initial ORP value. In all cases, the initial ORP values showed a similar trend, which decreased at the early dissolution stage and then remained steady till the end of the leaching. At 25 °C, A decline from 550.25 to 52931 mV, 556.183 to 547.362 mV, and 566.434 to 539.1600 mV was recorded for the solution-free pH 0.5, 1.0, 1.5 and 1.8 respectively. While at 50 °C, their initial ORP value decreased from 608 to 572 mV, 621 to 588 mV, and 631 to 591 mV individually. This decrease could suggest the direct oxidation of that mineral by ferric species, increasing the solution’s ferrous content. Earlier studies showed the existence of a potential range interval, referred to as critical (400–450 mV Ag/AgCl corresponding to 600–660 CEH approximately while using the conversion as published by Stringgow), [27] in which optimum copper recoveries are obtained [28,29]. Except for the dissolution at pH 1.8, which was within the range and quickly dropped (after 40 min of leaching), all the pH conditions ORP values (pH: 1.0 and 1.5) were well below the critical potential range and could support the low recoveries observed under the various pH regimes and could support the importance of maintaining the solution potential within the stipulated range for the efficient dissolution process.

3.3. Effect of Initial Fe3+

Figure 4 shows copper extraction as a function of time for initial concentrations of Fe3+ ions up to 0.075 M at pH 1.8 and temperature 25 °C or 50 °C. The results show that an improved rate and recovery are observed with an increase in Fe3+. The results(Table 1) revealed key kinetic information and showed that Cu recovery depends on Fe3+ at first order and with a rate law of r = [Fe3+]0.979 within 0.025 to 0.075 M ferric sulphate. These results support Veloso et al. [6], who observed an increase in Cu extraction with increasing Fe3+ up to 0.5 M and observed no further increase at 1.0 M Fe3+. Unlike Córdoba et al. [20], who highlighted from past studies that CuFeS2 dissolution rate is strongly affected by Fe3+ only at low concentrations. In contrast, at high concentration, its effect is negligible, and no clear kinetic effect with ferric content higher than 0.01 M. The findings of the present work show the first-order dependency up to 0.075 M.
Both rate and recovery were enhanced with the increase of Fe3+. A significant rate increase was observed after increasing the Fe3+ solution content. At 25 °C, 8% Cu was obtained after 540 min (Figure 4), at a Fe3+ content of 0.025 M. The dissolution increased to 12% after 420 min with a Fe3+ concentration of 0.05 M. It increased further to 22% after 320 min at a Fe3+ concentration of 0.075 M. At 50 °C, Cu dissolution rate appeared to have doubled for each Fe3+ concentration increase (0.025, 0.050 and 0.075 M). This result suggests that the dissolution of Cu is related to both the Fe3+ concentration and temperature.

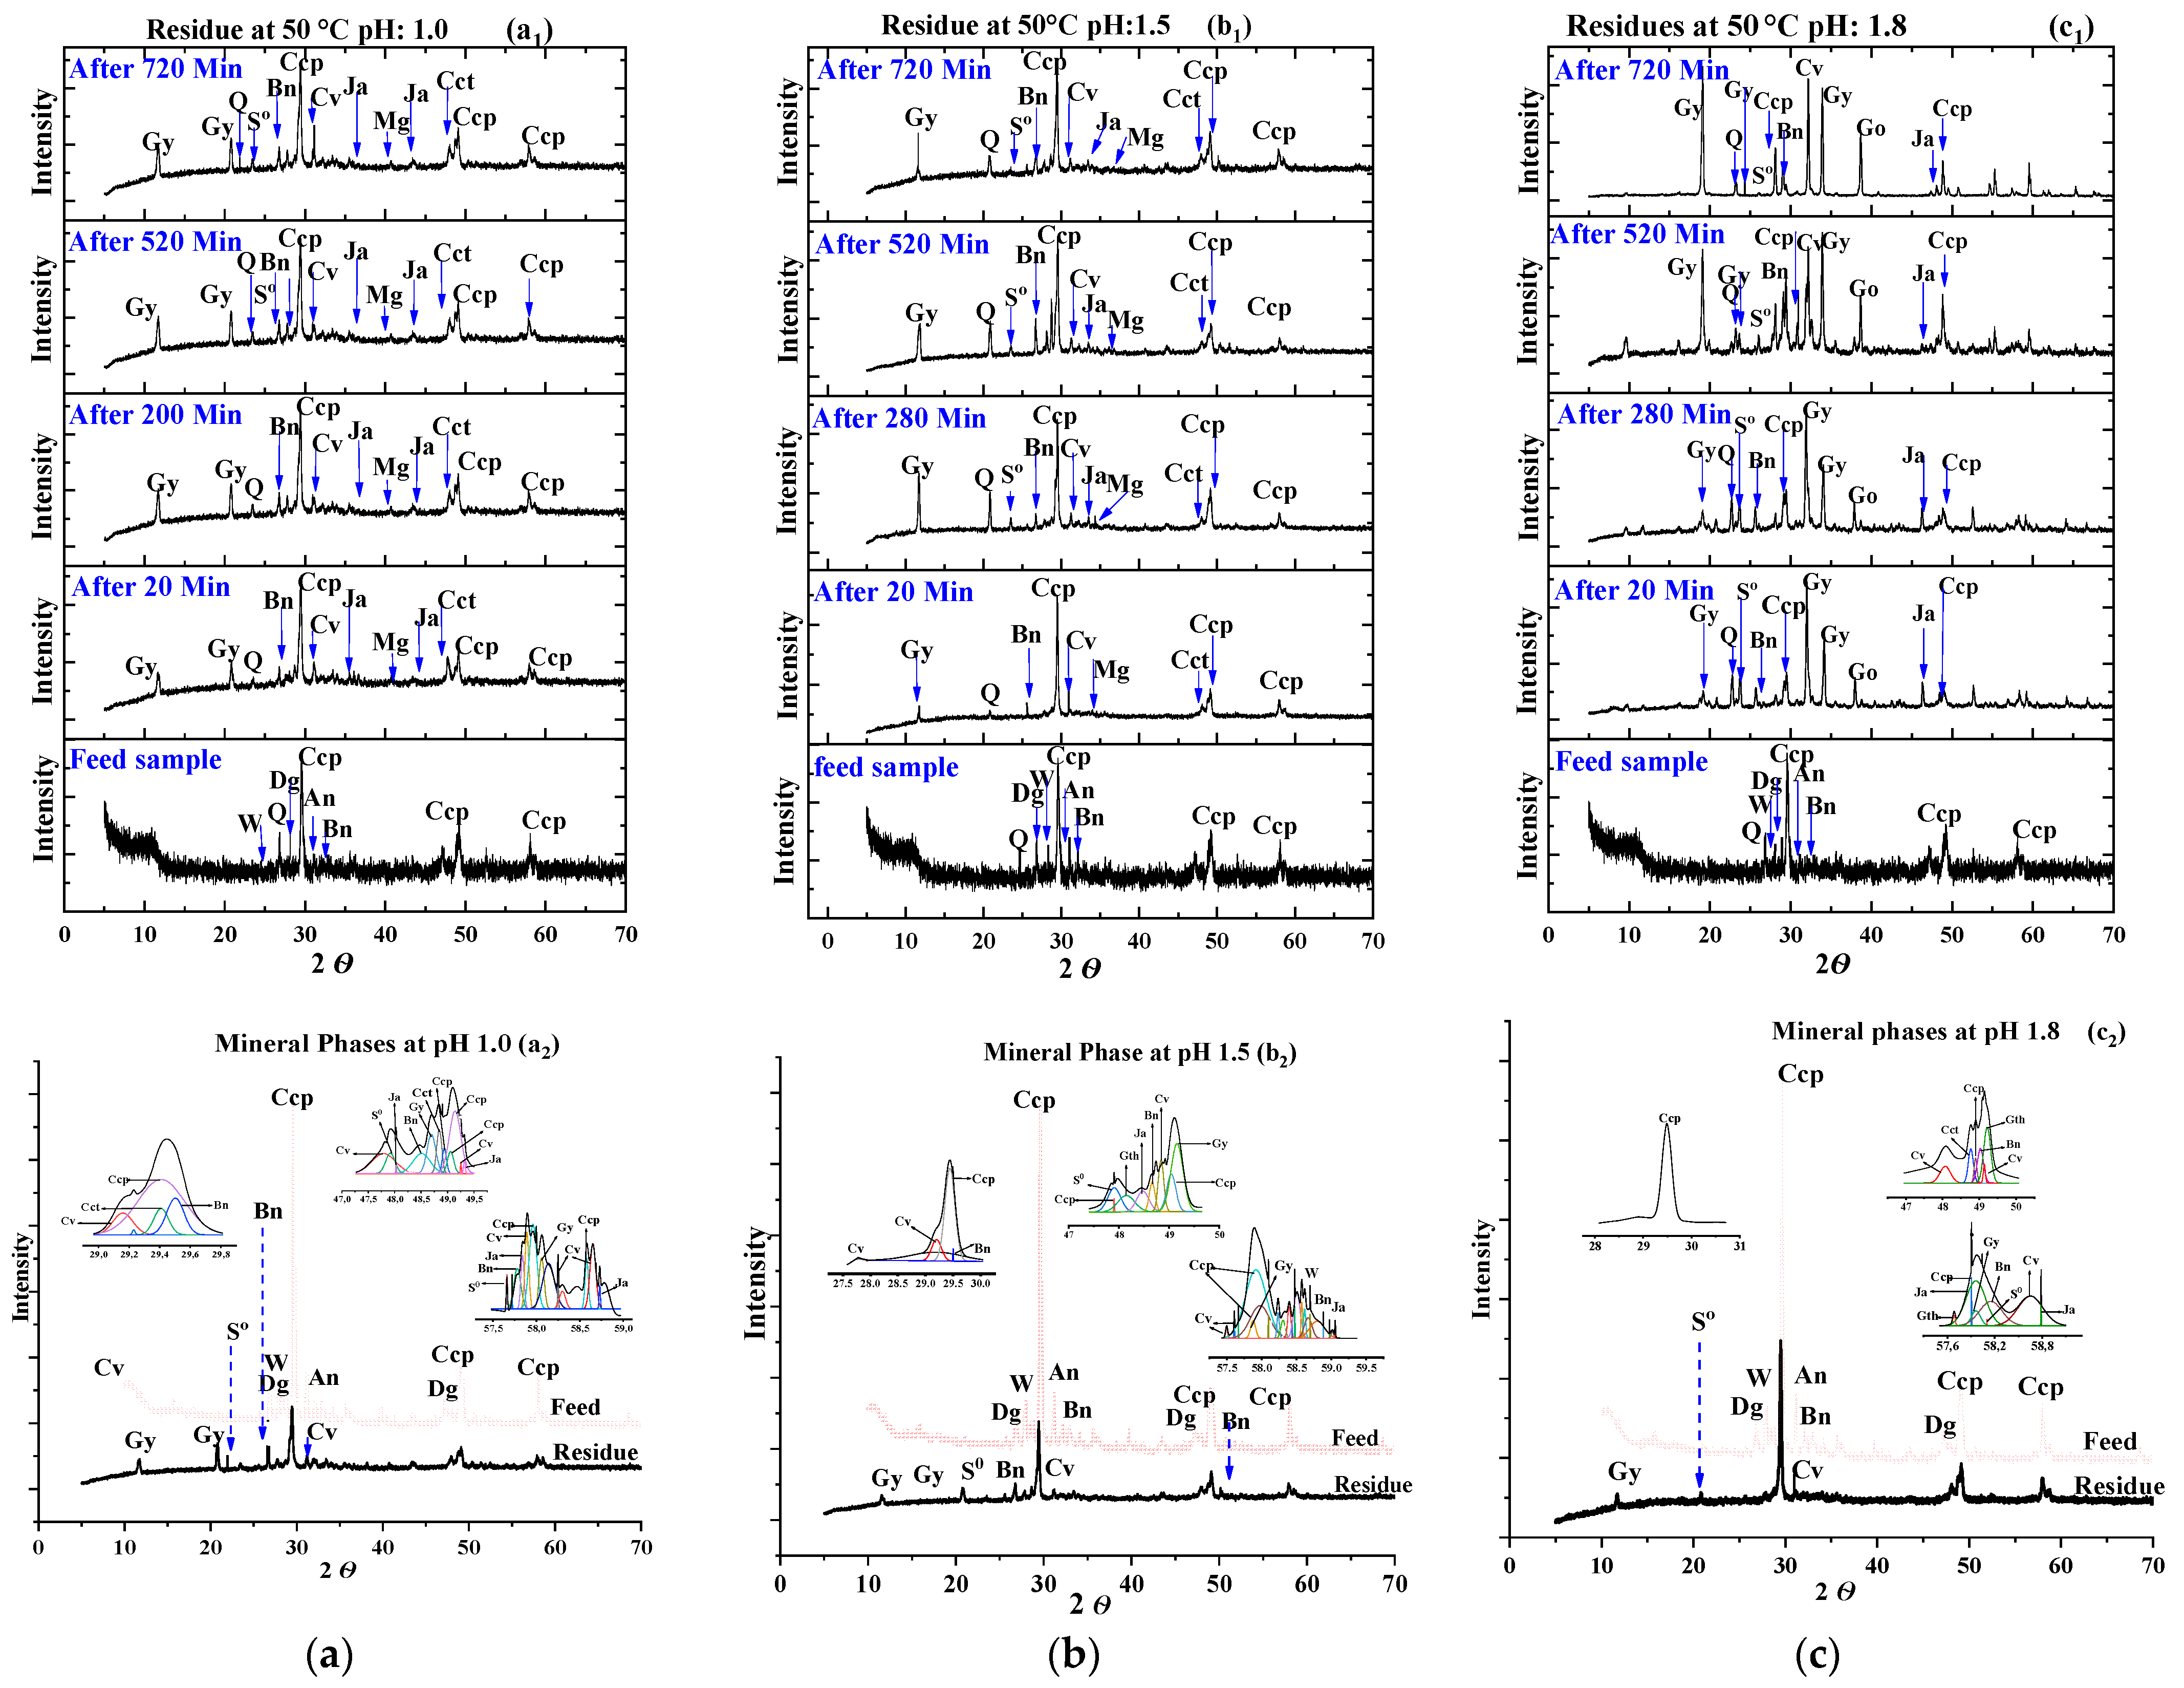
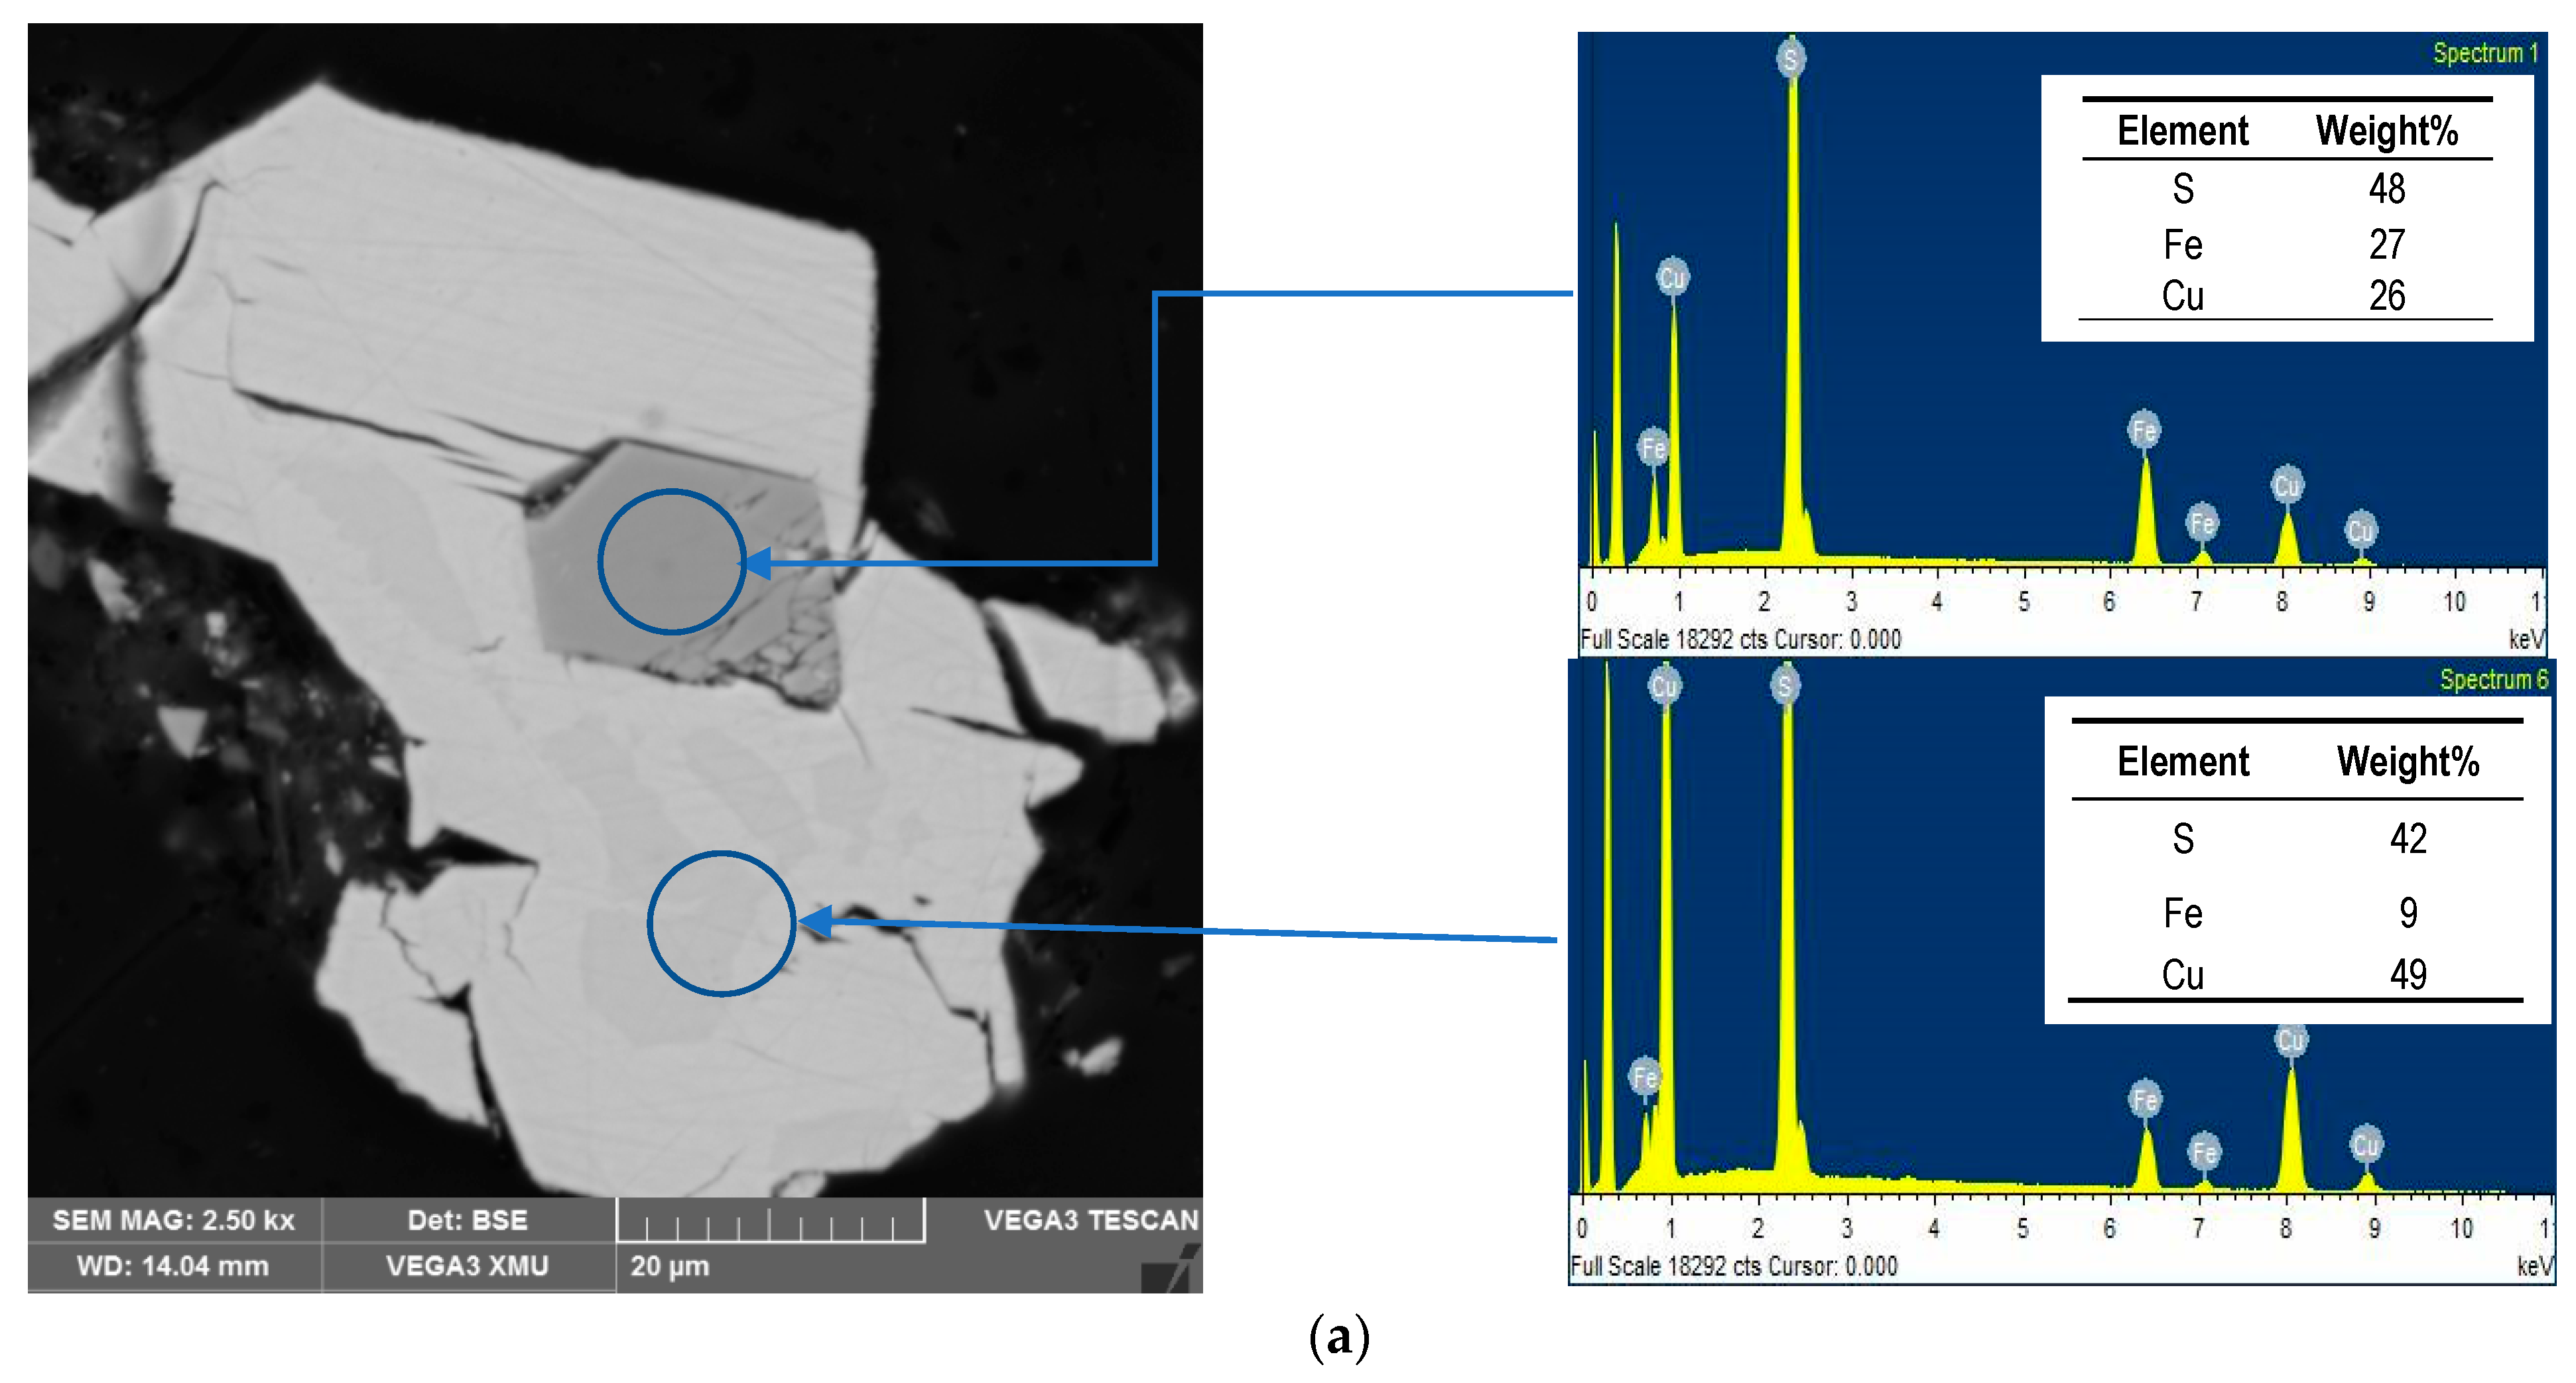
3.4. Residues Characterisation

Figure 5 shows the mineral content of the leached residues at 50 °C for the various pH conditions (1.0, 1.5 and 1.8) and compares their evolution to the feed sample. It was observed that the CuFeS2 leached residue main peaks (2θ: 29.46, 48.93 and 57.95) appeared to have decreased in their intensity compared to the feed sample. In addition, the XRD analysis revealed that the other copper phases different from CuFeS2 also dissolved and contributed to the overall Cu recovery. It was observed that anilite (Cu7S4) and digenite (Cu9S5) disappeared during the dissolution (Figure 5a–c), their contribution to the overall Cu dissolution if completely dissolved is 5% Cu. At pH 1.8, the total Cu was 24.7%, suggesting that Cu from CuFeS2 also dissolved. Further, new copper sulphide phases were observed in the leached residues. These phases were low and inexistent in the feed sample and included chalcocite (Cu2S) and covellite (CuS). These new phases could be attributed to the dissolution of CuFeS2 by forming intermediate phases. The presence of these Cu-rich intermediates appeared to support an earlier investigation by Acero et al. [30] which underlined the preferential dissolution of Fe over Cu, leading to the formation of a Fe deficient chalcopyrite mineral (defect chalcopyrite structure Cu1−xFe1−yS2−z) to which our identified species could be part.
The covellite (CuS, 2θ: 28.75, 34.36 38.84 and 48.36) phase appeared to cumulate through the dissolution, suggesting its refractoriness as it has encapsulated the unreacted CuFeS2 mineral, causing the dissolution to cease. The phases of the gypsum (Gy, 2θ: 11.69 & 20.81) and sulphur (So 2θ: 23.47, 40.71 and 50.19) were identified in all solid residues. The former (Gy) could be related to the carbonatite host rock. Its content appeared to increase with increasing media pH. The obtained results contradict those obtained by Tshilombo and Ojumu [28], who highlighted gypsum’s presence, preventing further oxidation and mineral surface availability to the leach solution. Our results have shown that despite the presence of CaSO4-H2O, its effect on the dissolution was minimal since its content increases with increased pH value, at which better Cu dissolution was observed. S0 is attributed to the dissolution reaction product (Equation (3)), as also reported in the studies conducted by Hammer et al. [31] and Sokic et al. [32]. Goethite and jarosite would be formed through the hydrolysis of Fe during leaching. Again, these two phases increased with increasing media pH value at which high Cu recoveries were obtained and could suggest that their effect on hindering Cu dissolution was negligible.
Thermodynamics could assist by predicting the formation of the various observed phases and supporting their existence. In addition, it could assist with the determination of the dissolution pathway model based on the solid phase changes. Bornite appears to be the most favourable phase formed (Equation (4)), followed by chalcocite (Equation (3)) and, lastly, covellite (Equation (2)). The equations for the formation of copper intermediate phases and the energies involved (i.e., ΔG in kcal) are as follows:
CuFeS2 + Fe2(SO4)3 ⇌ CuS + 3FeSO4 + S ΔG = −18.6
2CuFeS2 + 2Fe2(SO4)3 ⇌ Cu2S + 6FeSO4 + 3S ΔG = −30.8
5CuFeS2 + 4Fe2(SO4)3 ⇌ Cu5FeS4 + 12FeSO4 + 6S ΔG = −68.7
These Cu-S phases could react further into new Cu-S richer (Equations (5)–(8)) or leach to promote Cu recovery (Equations (8)–(10)). CuS is likely to form from Cu5FeS4 than Cu2S. Similarly, Dutrizac et al. [33] and Zhao et al. [28] also reported the presence of CuS due to a transient species during the ferric leaching of Cu5FeS4. Cu2S could also evolve and produce CuS (Equation (7)). Cu5FeS4 preferably dissolves before Cu2S, which also dissolves before CuS (Equation (10)). In addition to that, the covellite phase appeared as phase mutation of bornite during the withdrawal of Cu.
The reaction involved of intermediate phase mutation/alterations and the change in energy (i.e., ΔG in kcal) are as follows:
Cu5FeS4 + Fe2(SO4)3 ⇌ 2.5Cu2S + 3FeSO4 + 1.5S ΔG = −8.00
Cu5FeS4 + 2Fe2(SO4)3 ⇌ 4CuS + 5FeSO4 + CuSO4 ΔG = −22.14
2Cu2S + Fe2(SO4)3 ⇌ 2CuS + 2FeSO4 + Cu2SO4 ΔG = +4.42
Then, the dissolution of intermediate phases for complete copper dissolution process and energy changes (i.e., ΔG in kcal) follows:
CuS + Fe2(SO4)3 ⇌ 2FeSO4 + S + CuSO4 ΔG = +2.12
Cu2S + 2Fe2(SO4)3 ⇌ 4FeSO4 + S + 2CuSO4 ΔG = −2.25
2Cu2S + Fe2(SO4)3 ⇌ 2CuS + 2FeSO4 + Cu2SO4 ΔG = +4.42
Finally, the steps and energy change in phase formation related to gangue mineral (ΔG in kcal) is represented with the equation:
CaCO3 + H2SO4 ⇌ CaSO4 + H2O + CO2 ΔG = −32.1
Figure 6 summarizes the solid-state dissolution process, based on the thermodynamics dissolution reactions, the evolution and interactions of the various copper phases observed during Cu leaching from the sulphide concentrate sample (XRD-RIR phase quantification) at pH 1.8 and a temperature of 50 °C. It was found that the rich traces of copper sulphide, including Cu7S4 and Cu9S5, were completely dissolved. The results suggest that most of the existing CuFeS2 have been converted to its intermediate phases: Cu5FeS4, Cu2S and CuS (Equations (2)–(4)).
The points of intersection in between the different transient phases could suggest, on the one hand, the competition of dissolution between the phases. Alternatively, it could also be attributed to the transformation from one phase to another. In this sense, I1 observed between Cu5FeS4 and Cu2S could suggest that Cu5FeS4 was converted into the Cu2S phase (Equation (6)). While I2 for CuS and Cu2S could be attributed to the competition of dissolving Cu among both phases, eventually, Cu2S would dissolve since it is much soluble than CuS (Equations (9) and (10)). I3 observed for Cu5FeS4/CuS and Cu2S/CuS could suggest that Cu dissolves from the Cu5FeS4 phase through the formation of CuS (Equation (7)). Finally, I4 is attributed to the strict conversion of CuFeS2 into CuS without dissolving Cu (Equation (3)). The CuS phase appears to be more refractory than the other intermediates. Figure 7 presents and supports its cumulative behaviour throughout the dissolution.
Figure 7 summarizes the morphology and the relative weight fraction of Cu, Fe and S of 12 H solid residue. In all cases, both S and Cu have increased relative to Fe. This confirms the preferential dissolution of Fe over Cu and supports the presence of the Cu-S intermediate phase. S0 was not identified under SEM-EDS as earlier reported by previous authors [29]. This could be because the residual solids were mounted, and the S0 could have been removed through polishing. However, the SEM-EDS results showed that the dissolution could have been hindered by intermediates species, reaction products and gangue minerals. Figure 7 displays an intermediate species enveloping the chalcopyrite mineral, due to the low content of Fe (Figure 4a EDS results), this phase could be covellite mineral (CuS). Our results support those obtained earlier by Nyembwe and co-workers [34], who identified CuS as the refractory Cu-rich phase. In addition to that, micrograph C showed gypsum coating the surface of Cu sulphide and could also act as a dissolution barrier.

4. Conclusions

This work investigated the dissolution of a copper sulphide concentrate in acidic Fe2(SO4)3. The dissolution reaction displayed is first order with respect to the Fe2(SO4)3 within the investigated range (0.025–0.075 M). The solution speciation showed that Fe3+ and its complexes (Fe(HSO4)2+, Fe(SO4)2− and FeSO4+) are responsible for Cu dissolution from CuFeS2, leaching in H2SO4-Fe2(SO4)3-FeSO4-H2O. The fast and linear first dissolution stage was attributed to the combined effect of Fe3+ and its complexes (Fe(HSO4)2+, while Fe(SO4)2− was the main species for the second Cu dissolution stage characterised by a slow rate. The dissolution of CuFeS2 is accompanied by intermediate phases which could either dissolve or evolve into bornite, chalcocite and covellite, in which covellite was identified as refractory and was also found to envelop the unreacted CuFeS2 phase. Fe precipitates (goethite and jarosite) with gypsum appeared to have little effect on Cu dissolution hindrance.

Supplementary Materials

The following are available online at https://www.mdpi.com/article/10.3390/min11090963/s1, Figure S1: Potential-pH diagram of the Cu-Fe-S-H2O system, Figure S2: Chalcopyrite bulk chemistry, mineral content grain morphology and particle size distribution, Figure S3: Set up of the leaching experiment showing picture of the actual overhead stirrer used in the experiments and the illustration of the apparatus set up, Table S1: The thermodynamic functions (ΔG0 and S0) and the equilibrium constants for the various iron species at 25, 35, 50 and 70 °C. Source references., Table S2: The conditions for kinetics investigation and the rates obtained at pH 1.8 media.

Author Contributions

Conceptualization, E.F.-K. and K.J.N.; methodology, E.F.-K., M.M. and K.J.N.; software, E.F.-K., M.M. and K.J.N.; validation, M.M., F.W. and E.F.-K.; formal analysis, K.J.N.; investigation, K.J.N., E.F.-K. and M.M.; resources, E.F.-K., F.W. and M.M.; data curation, K.J.N.; writing—original draft preparation, K.J.N.; writing—review and editing, M.M.; visualization, K.J.N.; supervision, E.F.-K. and M.M.; project administration, E.F.-K. and F.W.; funding acquisition, E.F.-K. and M.M. All authors have read and agreed to the published version of the manuscript.

Funding

This research was funded by National Research Foundation (NRF) in South Africa, grant number 120323.

Institutional Review Board Statement

Not applicable.

Informed Consent Statement

Not applicable.

Data Availability Statement

The data presented in this study are available on request from the corresponding author. The data are not publicly available due to intellectual property issues, including patent related and continuation of the research work.

Acknowledgments

We thank the support from the NSERC-DG, Research Nova Scotia, CFI, NSRIT, ACOA and NRC-IRAP in Canada.

Conflicts of Interest

The authors declare no conflict of interest.

References

  1. Li, Y.; NKawashima, N.; Li, J.; Chandra, A.P.; Gerson, A.R. A review of the structure, and fundamental mechanisms and kinetics of the leaching of chalcopyrite. Adv. Colloid Interface Sci. 2013, 197, 1–32. [Google Scholar] [CrossRef] [PubMed]
  2. Rodriguez, F.; Moraga, C.; Castillo, J.; Edelmira, G.; Robles, P.; Toro, N. Submarine Tailings in Chile—A Review. Meatls 2008, 11, 780. [Google Scholar]
  3. Lundström, M.; Aromaa, J.; Forsén, O.; Barker, M.H. Reaction product layer on chalcopyrite in cupric chloride leaching. Can. Metall. Q 2008, 47, 245–252. [Google Scholar] [CrossRef]
  4. Olvera, O.G.; Rebolledo, M.; Asselin, E. Atmospheric ferric sulfate leaching of chalcopyrite: Thermodynamics, kinetics and electrochemistry. Hydrometallurgy 2016, 165, 148–158. [Google Scholar] [CrossRef]
  5. Dutrizac, J.E. Elemental sulphur formation during the ferric chloride leaching of chalcopyrite. Hydrometallurgy 1990, 23, 153–176. [Google Scholar] [CrossRef]
  6. Veloso, T.C.; Peixoto, J.J.M.; Pereira, M.S.; Leao, V.A. Kinetics of chalcopyrite leaching in either ferric sulphate or cupric sulphate media in the presence of NaCl. Int. J. Miner. Process. 2016, 148, 147–154. [Google Scholar] [CrossRef]
  7. Nikkhou, F.; Xia, F.; Deditius, A.P. Variable surface passivation during direct leaching of sphalerite by ferric sulfate, ferric chloride, and ferric nitrate in a citrate medium. Hydrometallurgy 2019, 188, 201–215. [Google Scholar] [CrossRef]
  8. Tshilombo, A.F. Mechanism and Kinetics of Chalcopyrite Passivation and Depassivation during Ferric and Microbial Leaching; The University of British Columbia: Vancouver, BC, Canada, 2004. [Google Scholar] [CrossRef]
  9. Naderi, H.; Abdollahy, M.; Mostoufi, N.; Koleini, M.; Shojaosadati, S.A.; Manafi, Z. Kinetics of chemical leaching of chalcopyrite from low grade copper ore: Behavior of different size fractions. Int. J. Miner. Met. Mater. 2011, 18, 638–645. [Google Scholar] [CrossRef]
  10. Klauber, C.; Parker, A.; Van Bronswijk, W.; Watling, H. Sulphur speciation of leached chalcopyrite surfaces as determined by x-ray photoelectron spectroscopy. Int. J. Miner. Process. 2001, 62, 65–94. [Google Scholar] [CrossRef]
  11. Salehi, S.; Noaparast, M.; Ziaeddin, S. The role of catalyst in chalcopyrite passivation during leaching. Int. J. Min. Geo-Eng. 2017, 1, 91–96. [Google Scholar]
  12. Debernardi, G.; Carlesi, C. Chemical-electrochemical approaches to the study passivation of chalcopyrite. Miner. Process. Extr. Met. Rev. 2013, 34, 10–41. [Google Scholar] [CrossRef]
  13. Ghahremaninezhad, A. The Surface Chemistry of Chalcopyrite during Electrochemical Dissolution. Ph.D. Thesis, The University of British Columbia, Vancouver, BC, Canada, 2012. [Google Scholar]
  14. Zhao, H.; Zhang, Y.; Zhang, X.; Qian, L.; Sun, M.; Yang, Y.; Zhang, Y.; Wang, J.; Kim, H.; Qiu, G. The dissolution and passivation mechanism of chalcopyrite in bioleaching: An overview. Miner. Eng. 2019, 136, 140–154. [Google Scholar] [CrossRef]
  15. Ruiz-sánchez, A.; Lapidus, G.T. Hydrometallurgy Study of chalcopyrite leaching from a copper concentrate with hydrogen peroxide in aqueous ethylene glycol media. Hydrometallurgy 2017, 169, 192–200. [Google Scholar] [CrossRef]
  16. Casas, J.M.; Crisóstomo, G.; Cifuentes, L. Speciation of the Fe(II)-Fe(III)-H2SO4-H2O system at 25 and 50 °C. Hydrometallurgy 2005, 80, 254–264. [Google Scholar] [CrossRef]
  17. Yue, G.; Asselin, E. Kinetics of Ferric Ion Reduction on Chalcopyrite and Its Influence on Leaching up to 150 °C. Electrochim. Acta 2014, 146, 307–321. [Google Scholar] [CrossRef]
  18. Hirato, T.; Majima, H.; Awakura, Y. The leaching of chalcopyrite with ferric sulfate. Met. Mater. Trans. A 1987, 18, 489–496. [Google Scholar] [CrossRef]
  19. Sapieszko, R.S.; Patel, R.C.; Matijevic, E. Ferric hydrous oxide sols. 2. Thermodynamics of aqueous hydroxo and sulfato ferric complexes. J. Phys. Chem. 1977, 81, 1061–1068. [Google Scholar] [CrossRef]
  20. Simons, K. Soil Sampling; Gilson, Inc.: Geogia, GA, USA, 2014. [Google Scholar]
  21. Nyembwe, K.J.; Fosso-Kankeu, E.; Waanders, F.; Nyembwe, K.D. Structural, compositional and mineralogical characterization of carbonatitic copper sulfide: Run of mine, concentrate and tailings. Int. J. Miner. Metall. Mater. 2019, 26, 143–151. [Google Scholar] [CrossRef]
  22. Antonijevic, G.D.; Bogdanovic, M.M. Investigation of the leaching of chalcopyritic ore in acidic solutions. Hydrometallurgy 2004, 73, 245–256. [Google Scholar] [CrossRef]
  23. Córdoba, E.M.; Muñoz, J.A.; Blázquez, M.L.; González, F.; Ballester, A. Leaching of chalcopyrite with ferric ion. Part I: General aspects. Hydrometallurgy 2008, 93, 81–87. [Google Scholar] [CrossRef]
  24. Salinas, K.E.; Herreros, O.; Torres, C.M. Leaching of Primary Copper Sulfide Ore. Mineral 2018, 8, 312. [Google Scholar] [CrossRef] [Green Version]
  25. Jones, D.L.; Peters, E. Extractive Metallurgy of Copper; AIME: New York, NY, USA, 1976. [Google Scholar]
  26. Hirato, T.; Majima, H.; Awakura, Y. The leaching of chalcopyrite with cupric chloride. Met. Mater. Trans. A 1987, 18, 31–39. [Google Scholar] [CrossRef]
  27. Striggow, B. Field Measurement of Oxidation-Reduction Potential (ORP); United States Environmental Protection Agency: Georgia, GA, USA, 2013. [Google Scholar]
  28. Zhao, H.; JWang, J.; Qin, W.; Hu, M.; Qiu, G. Electrochemical dissolution of chalcopyrite concentrates in stirred reactor in the presence of Acidithiobacillus ferrooxidans. Int. J. Electrochem. Sci. 2015, 10, 848–858. [Google Scholar]
  29. Sokić, M.D.; Marković, B.; Živković, D. Kinetics of chalcopyrite leaching by sodium nitrate in sulphuric acid. Hydrometallurgy 2009, 95, 273–279. [Google Scholar] [CrossRef]
  30. Acero, P.; Cama, P.; Ayora, J.; Asta, C.M. Chalcopyrite dissolution rate law from pH 1 to 3. Geol. Acta 2009, 7, 389–397. [Google Scholar]
  31. Harmer-bassell, S.L.; Thomas, J.E.; Harmer, S.L.; Thomas, J.E. The evolution of surface layers formed during chalcopyrite leaching The evolution of surface layers formed during chalcopyrite leaching. Geochim. Cosmochim. Acta 2006, 70, 4392–4402. [Google Scholar] [CrossRef]
  32. Sokic, M.D.; Markovic, B.R.; Matkovic, V.L.; Strbac, N.D.; Zivkovic, D.T. Mechanism of Chalcopyrite Leaching in Oxidative Sulphuric Acid Solution. J. Chem. Chem. Eng. 2011, 5, 37–41. [Google Scholar]
  33. Dutrizac, J.E.; Chen, T.T.; Jambor, J.L. Mineralogical changes occurring during the ferric lon leaching of bornite. Met. Mater. Trans. A 1985, 16, 679–693. [Google Scholar] [CrossRef]
  34. Nyembwe, K.J.; EFosso-kankeu, E.; Waanders, F.; Mkandawire, M. pH-dependent leaching mechanism of carbonatitic chalcopyrite in ferric sulfate solution. Trans. Nonferrous Met. Soc. China 2021, 31, 2139–2152. [Google Scholar] [CrossRef]
Figure 1. Initial Fe speciation at the various pH regimes (1.0, 1.5 and 1.8) and temperatures vis 25 and 50 °C, where (a) shows speciation of Fe2+ and (b) is the speciation of Fe3+.
Minerals 11 00963 g001
Figure 2. Isotherms of chalcopyrite dissolution and recovery of Cu in leachates using media with different pH values and conducted at (a) 25 °C and (b) 50 °C.
Minerals 11 00963 g002
Figure 3. Fe speciation at different pH (1.0, 1.5 and 1.8) at 250 °C. (a) displaying the evolution of Fe3+, (b) Fe(HSO4)2+, (c) Fe(SO4)2−, (d) FeSO4+, (e) Fe2+, and (f) FeHSO4+.
Minerals 11 00963 g003
Figure 4. Effect of Fe3+ on Cu dissolution (rate and recovery): (a) dissolution at 25 °C and (b) dissolution at 50 °C.
Minerals 11 00963 g004
Figure 5. Diffraction patterns at the various pH condition at 50 °C, mineral phases evolution and interactions. Peak decomposition of main CuFeS2 supporting the presence of intermediates phases. (a) summarises the solid residue’s mineral phases at pH 1.0 while (b,c) displays the mineral phases at pH 1.5 and 1.8, respectively. Gy: gypsum, So: sulphur, Cv: covellite, Cct: chalcocite, Ccp: chalcopyrite, Bn: bornite, Mg: magnetite, Gth: goethite and Ja: jarosite.
Minerals 11 00963 g005
Figure 6. Solid-state dissolution process at 50 °C and pH of 1.8. Bo: bornite, An: anilite, Dg: digenite, Cct: chalcocite, Ccp: chalcopyrite and Cv: covellite.
Minerals 11 00963 g006
Figure 7. Leached residues morphology and chemistry (SEM-EDS): (a) displaying the mounted sample where the CuFeS2 is locked or enveloped by Cu rich intermediate phases (Cu-S); (b) showing the unmounted sample where the Ca phase (Gypsum) represents the dissolution barrier.
Minerals 11 00963 g007aMinerals 11 00963 g007b
Table 1. Kinetic parameters of CuFeS2 leaching in Fe3+.
T
(K)
Fe2(SO4)3
(M)
Rate Cu2+K
M−1S−1
Rxt0 Order
Fe3+
Ea
(kJ/mol)
298.150.0258.31 × 10−53.3 × 10−30.97979.04
0.0501.61 × 10−43.2 × 10⁻³
0.0752.45 × 10−43.3 × 10⁻³
323.50.0259.70 × 10−43.9 × 10⁻²-
0.0501.91 × 10−33.8 × 10⁻²
0.0752.91 × 10−33.8 × 10⁻²
Publisher’s Note: MDPI stays neutral with regard to jurisdictional claims in published maps and institutional affiliations.

