
Thermochronology of Alkali Feldspar and Muscovite at T > 150 °C Using the 40Ar/39Ar Method: A Review


Abstract
:1. Introduction
2. Recovering Continuous Thermal History Information Using the 40Ar/39Ar Method
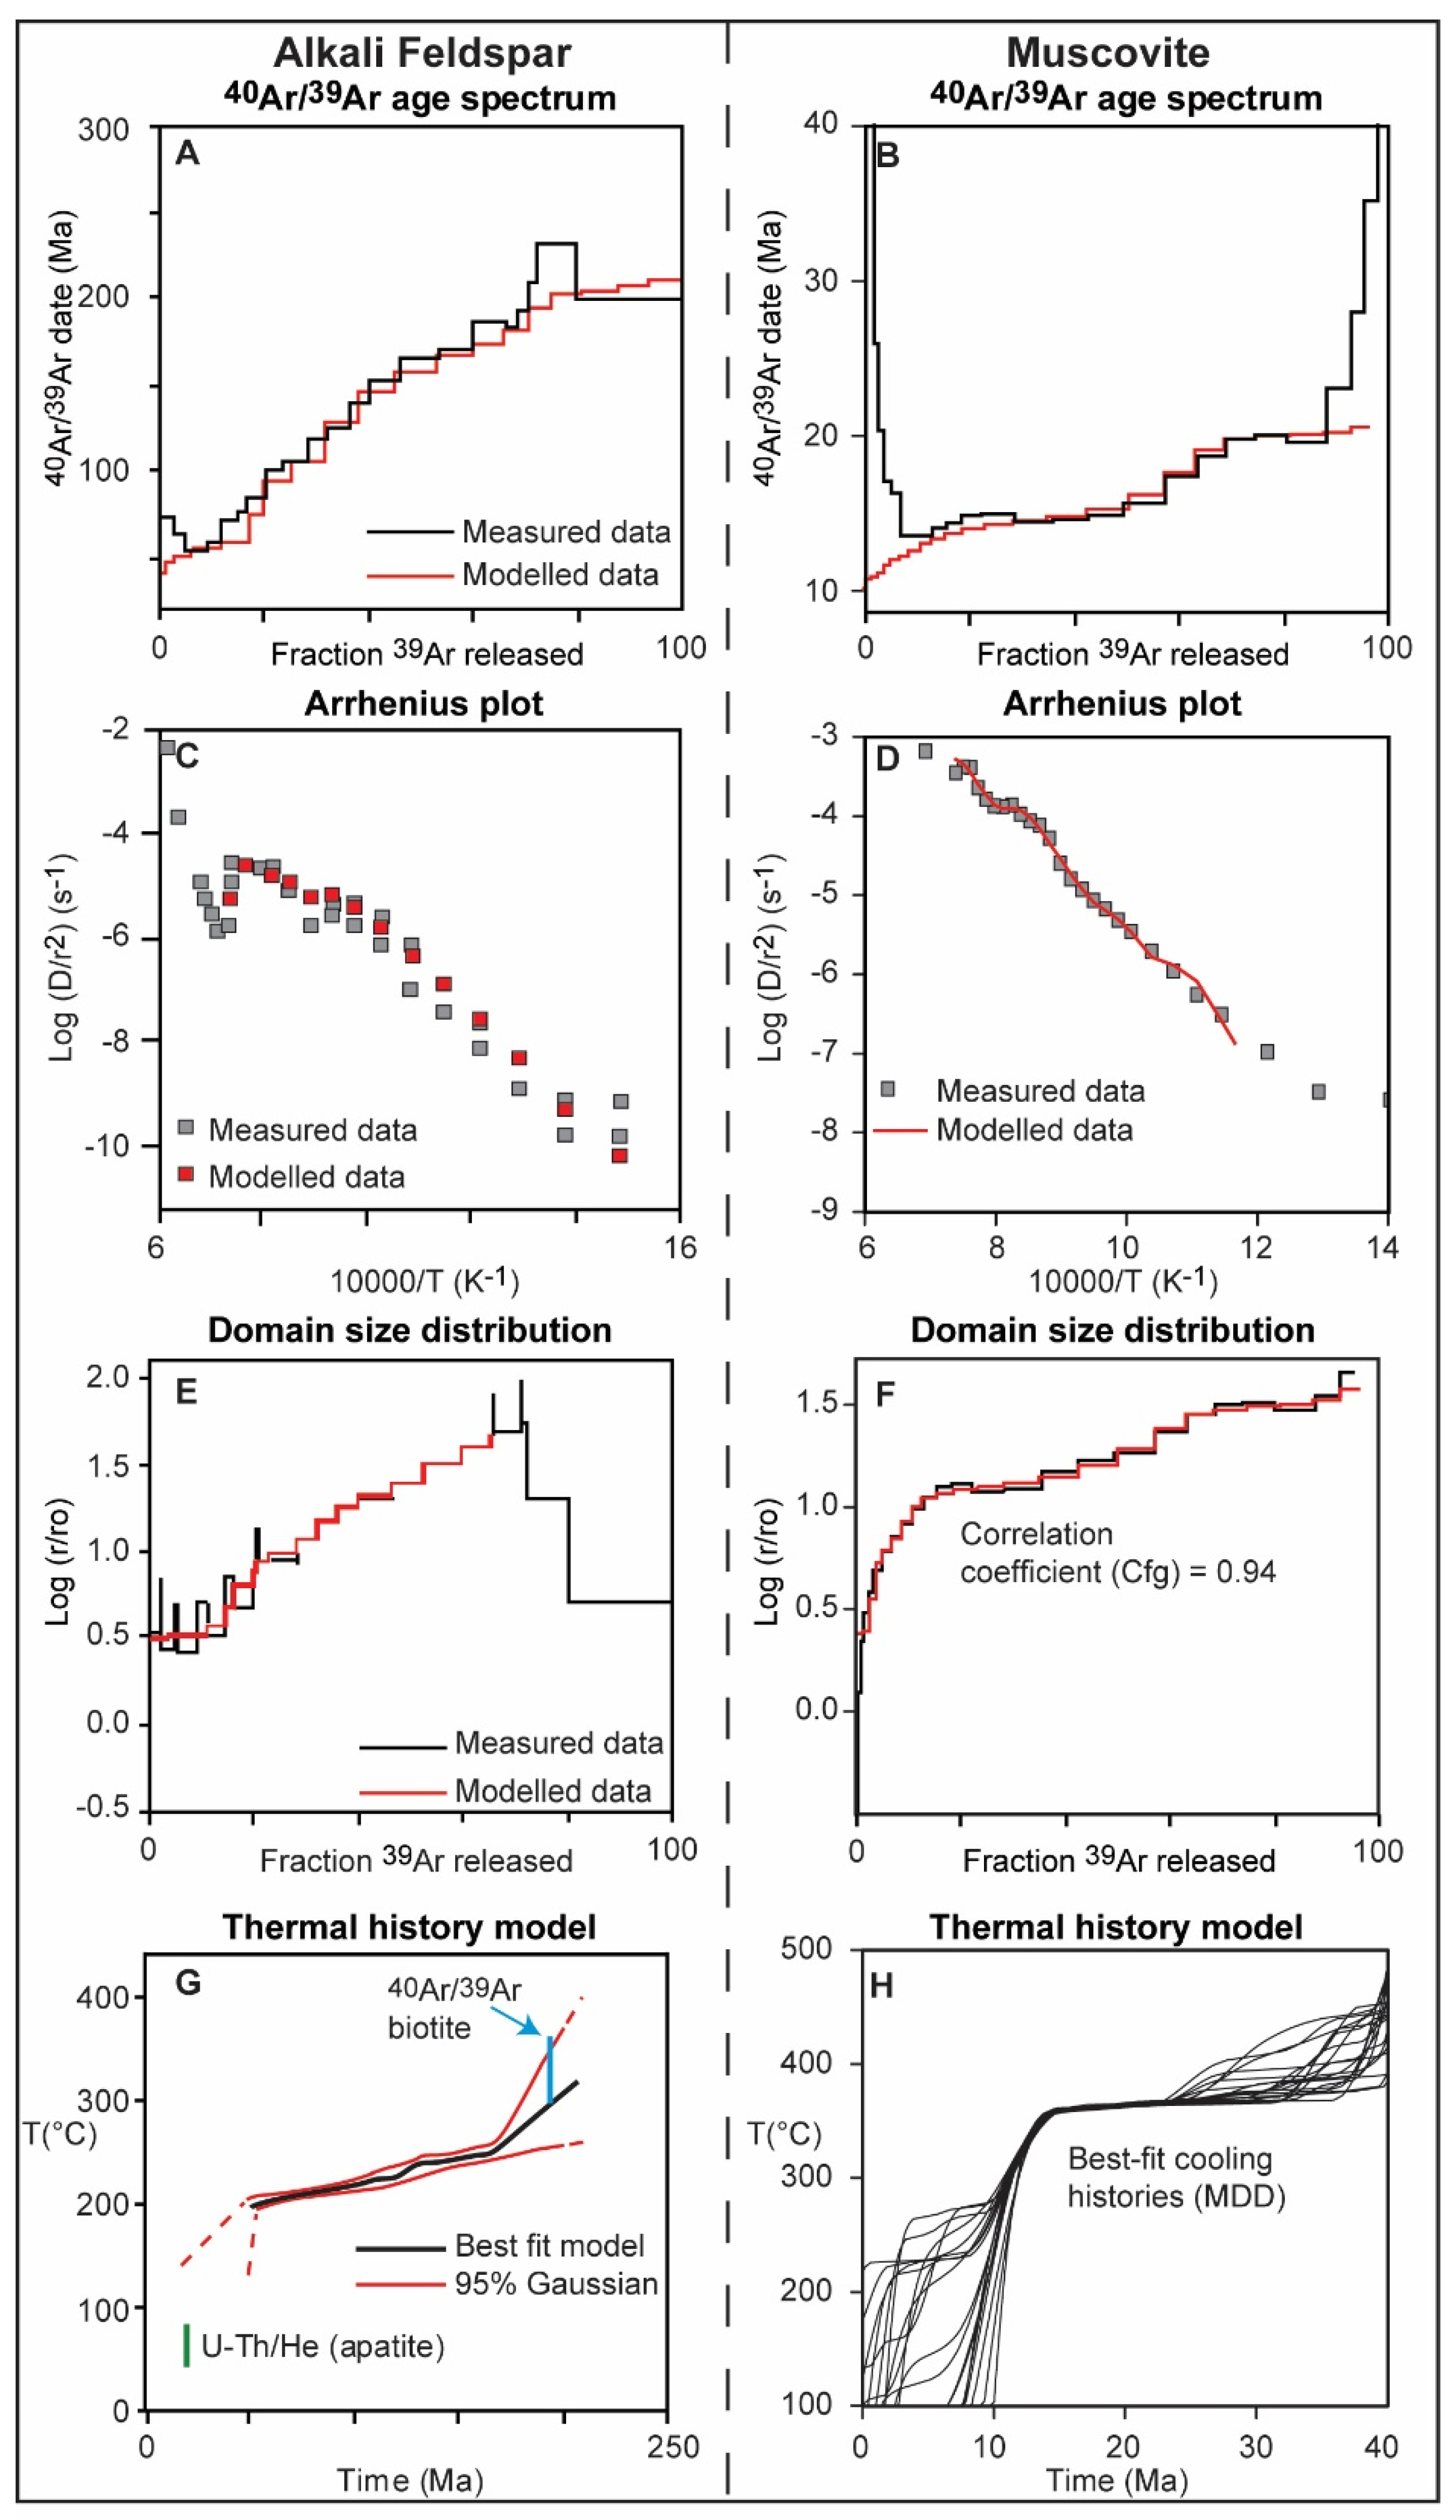
2.1. Alkali Feldspar
2.2. Muscovite
2.3. Cross Correlation as a Means to Validate MDD Modelling
3. Arguments against the Reconstruction of Continuous t-T Paths Using the 40Ar/39Ar Method
3.1. The Effects of Fluid Interaction and Closed-System Behaviour
3.1.1. Alkali Feldspar
The Chain of Ponds Pluton, USA, and the Aar Massif, Swiss Alps
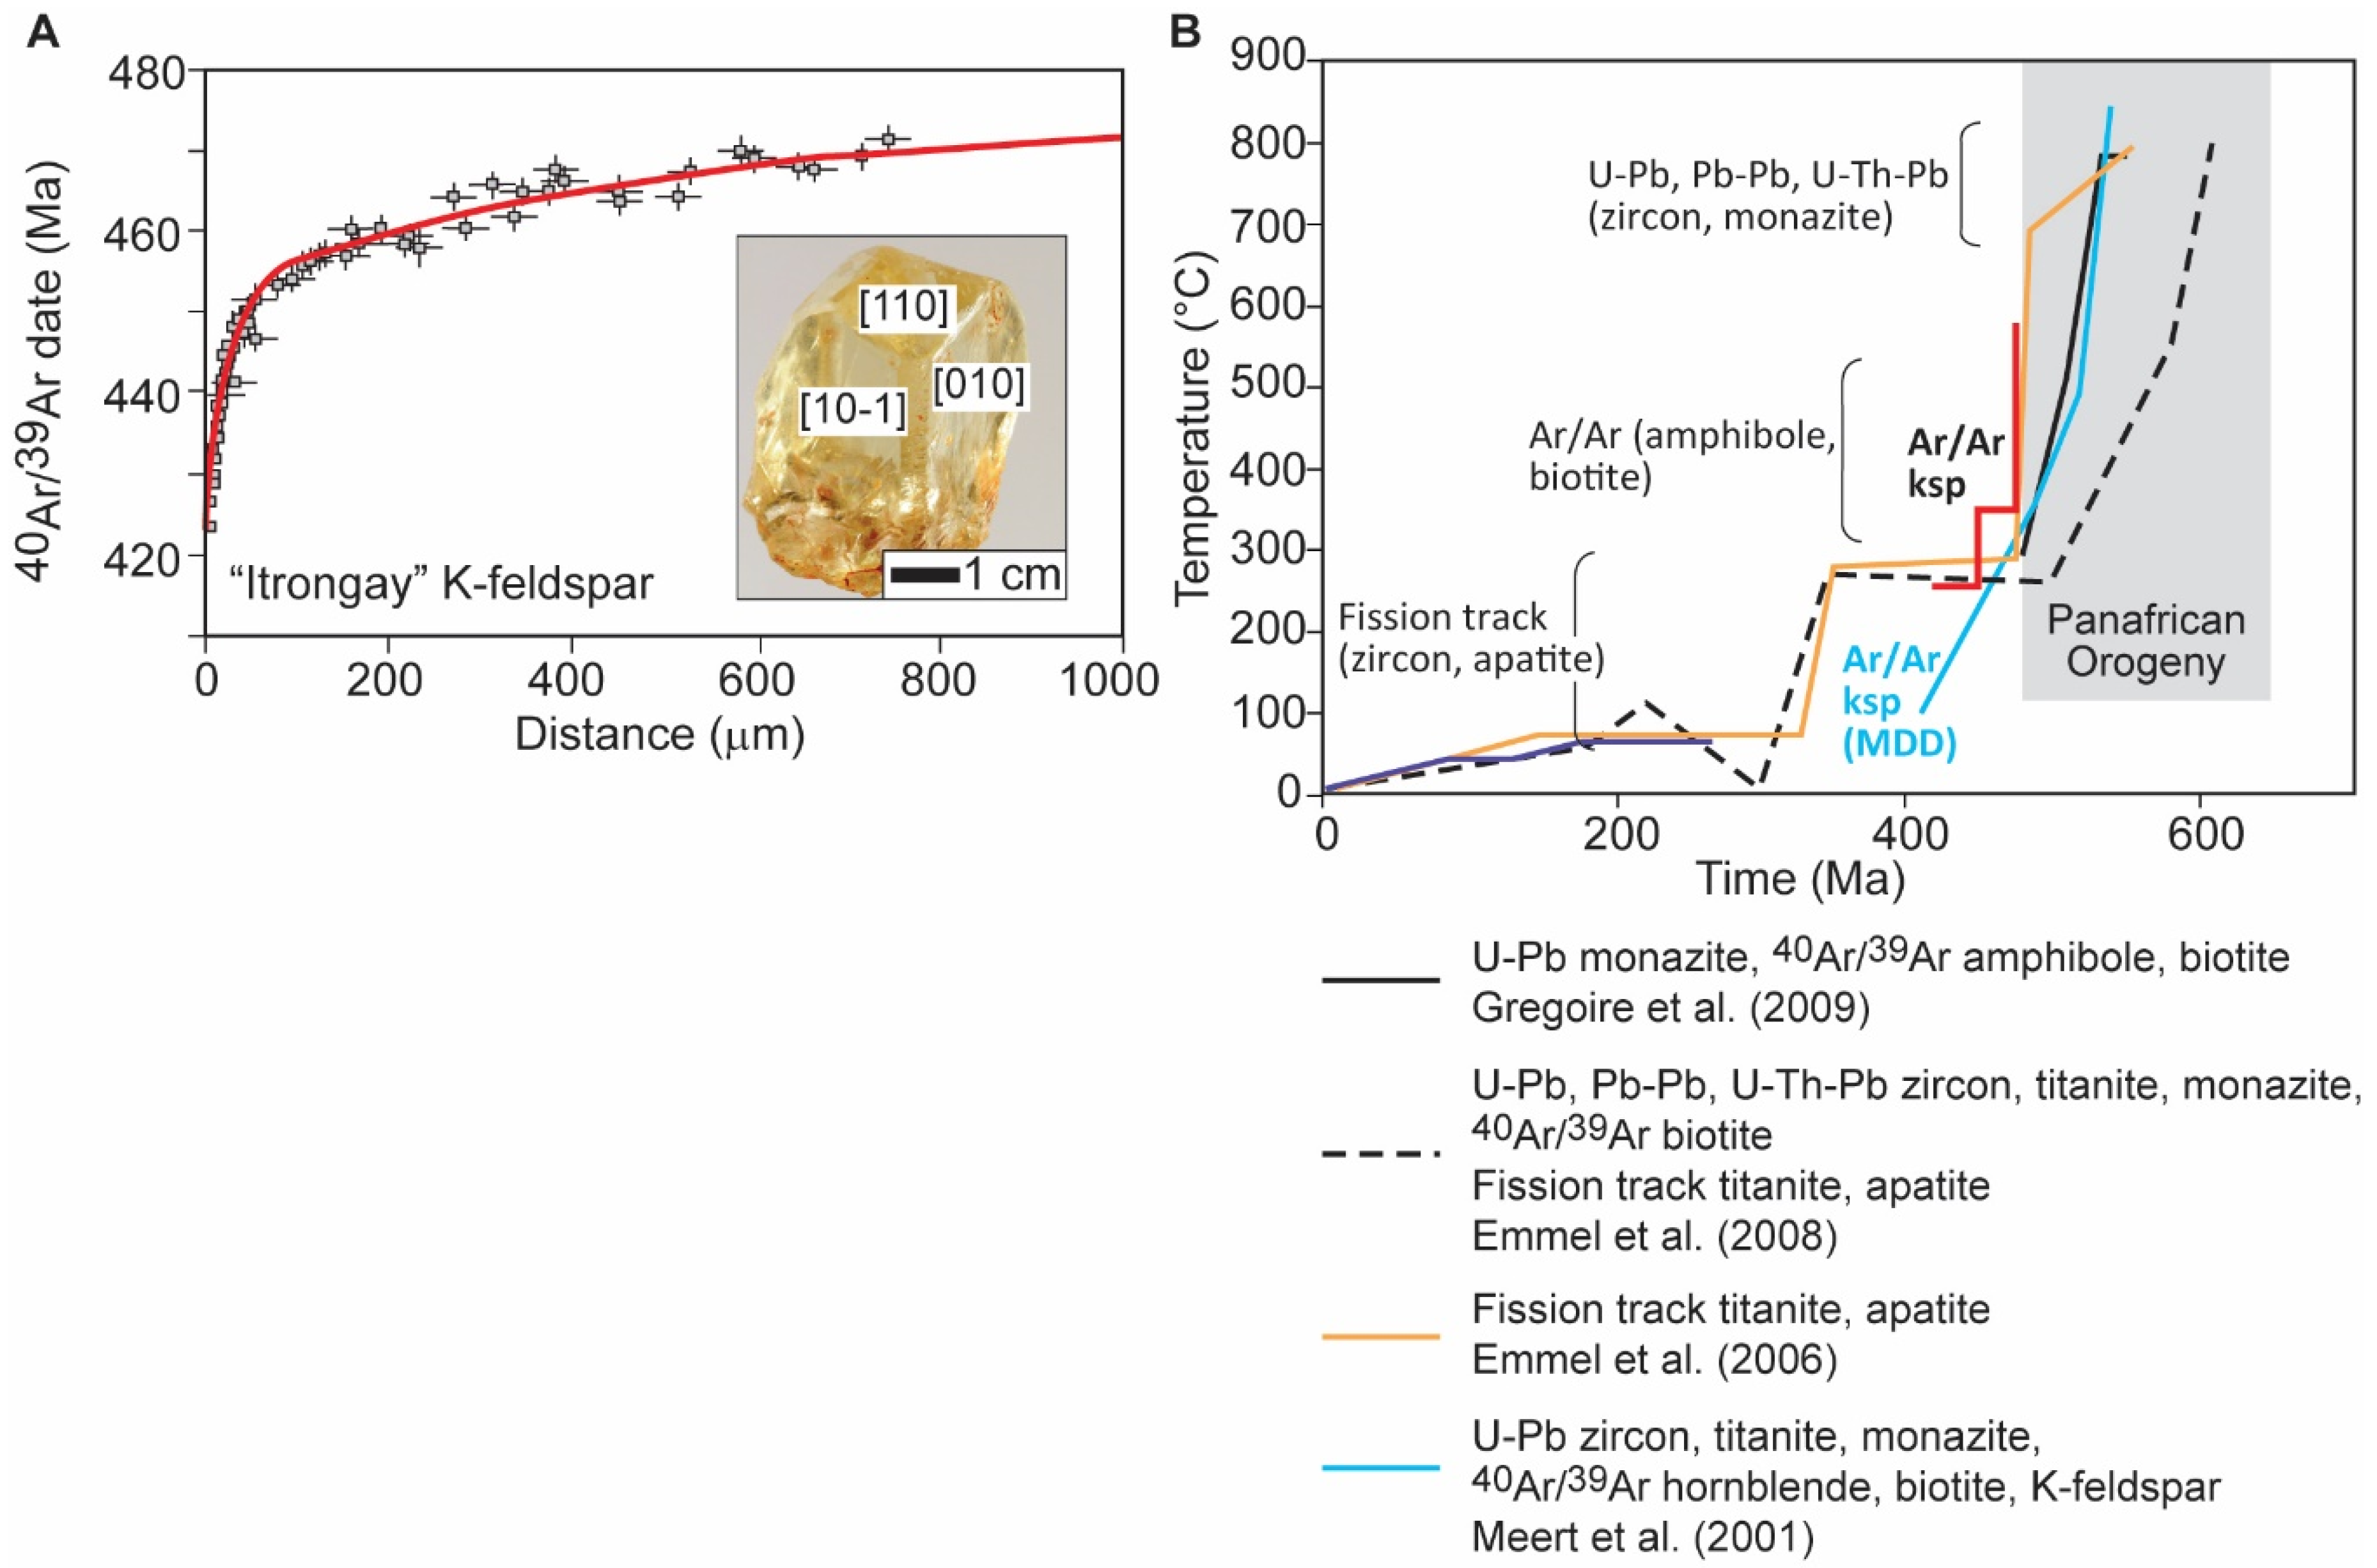
Megacrystic Alkali feldspar from Itrongay, Madagascar
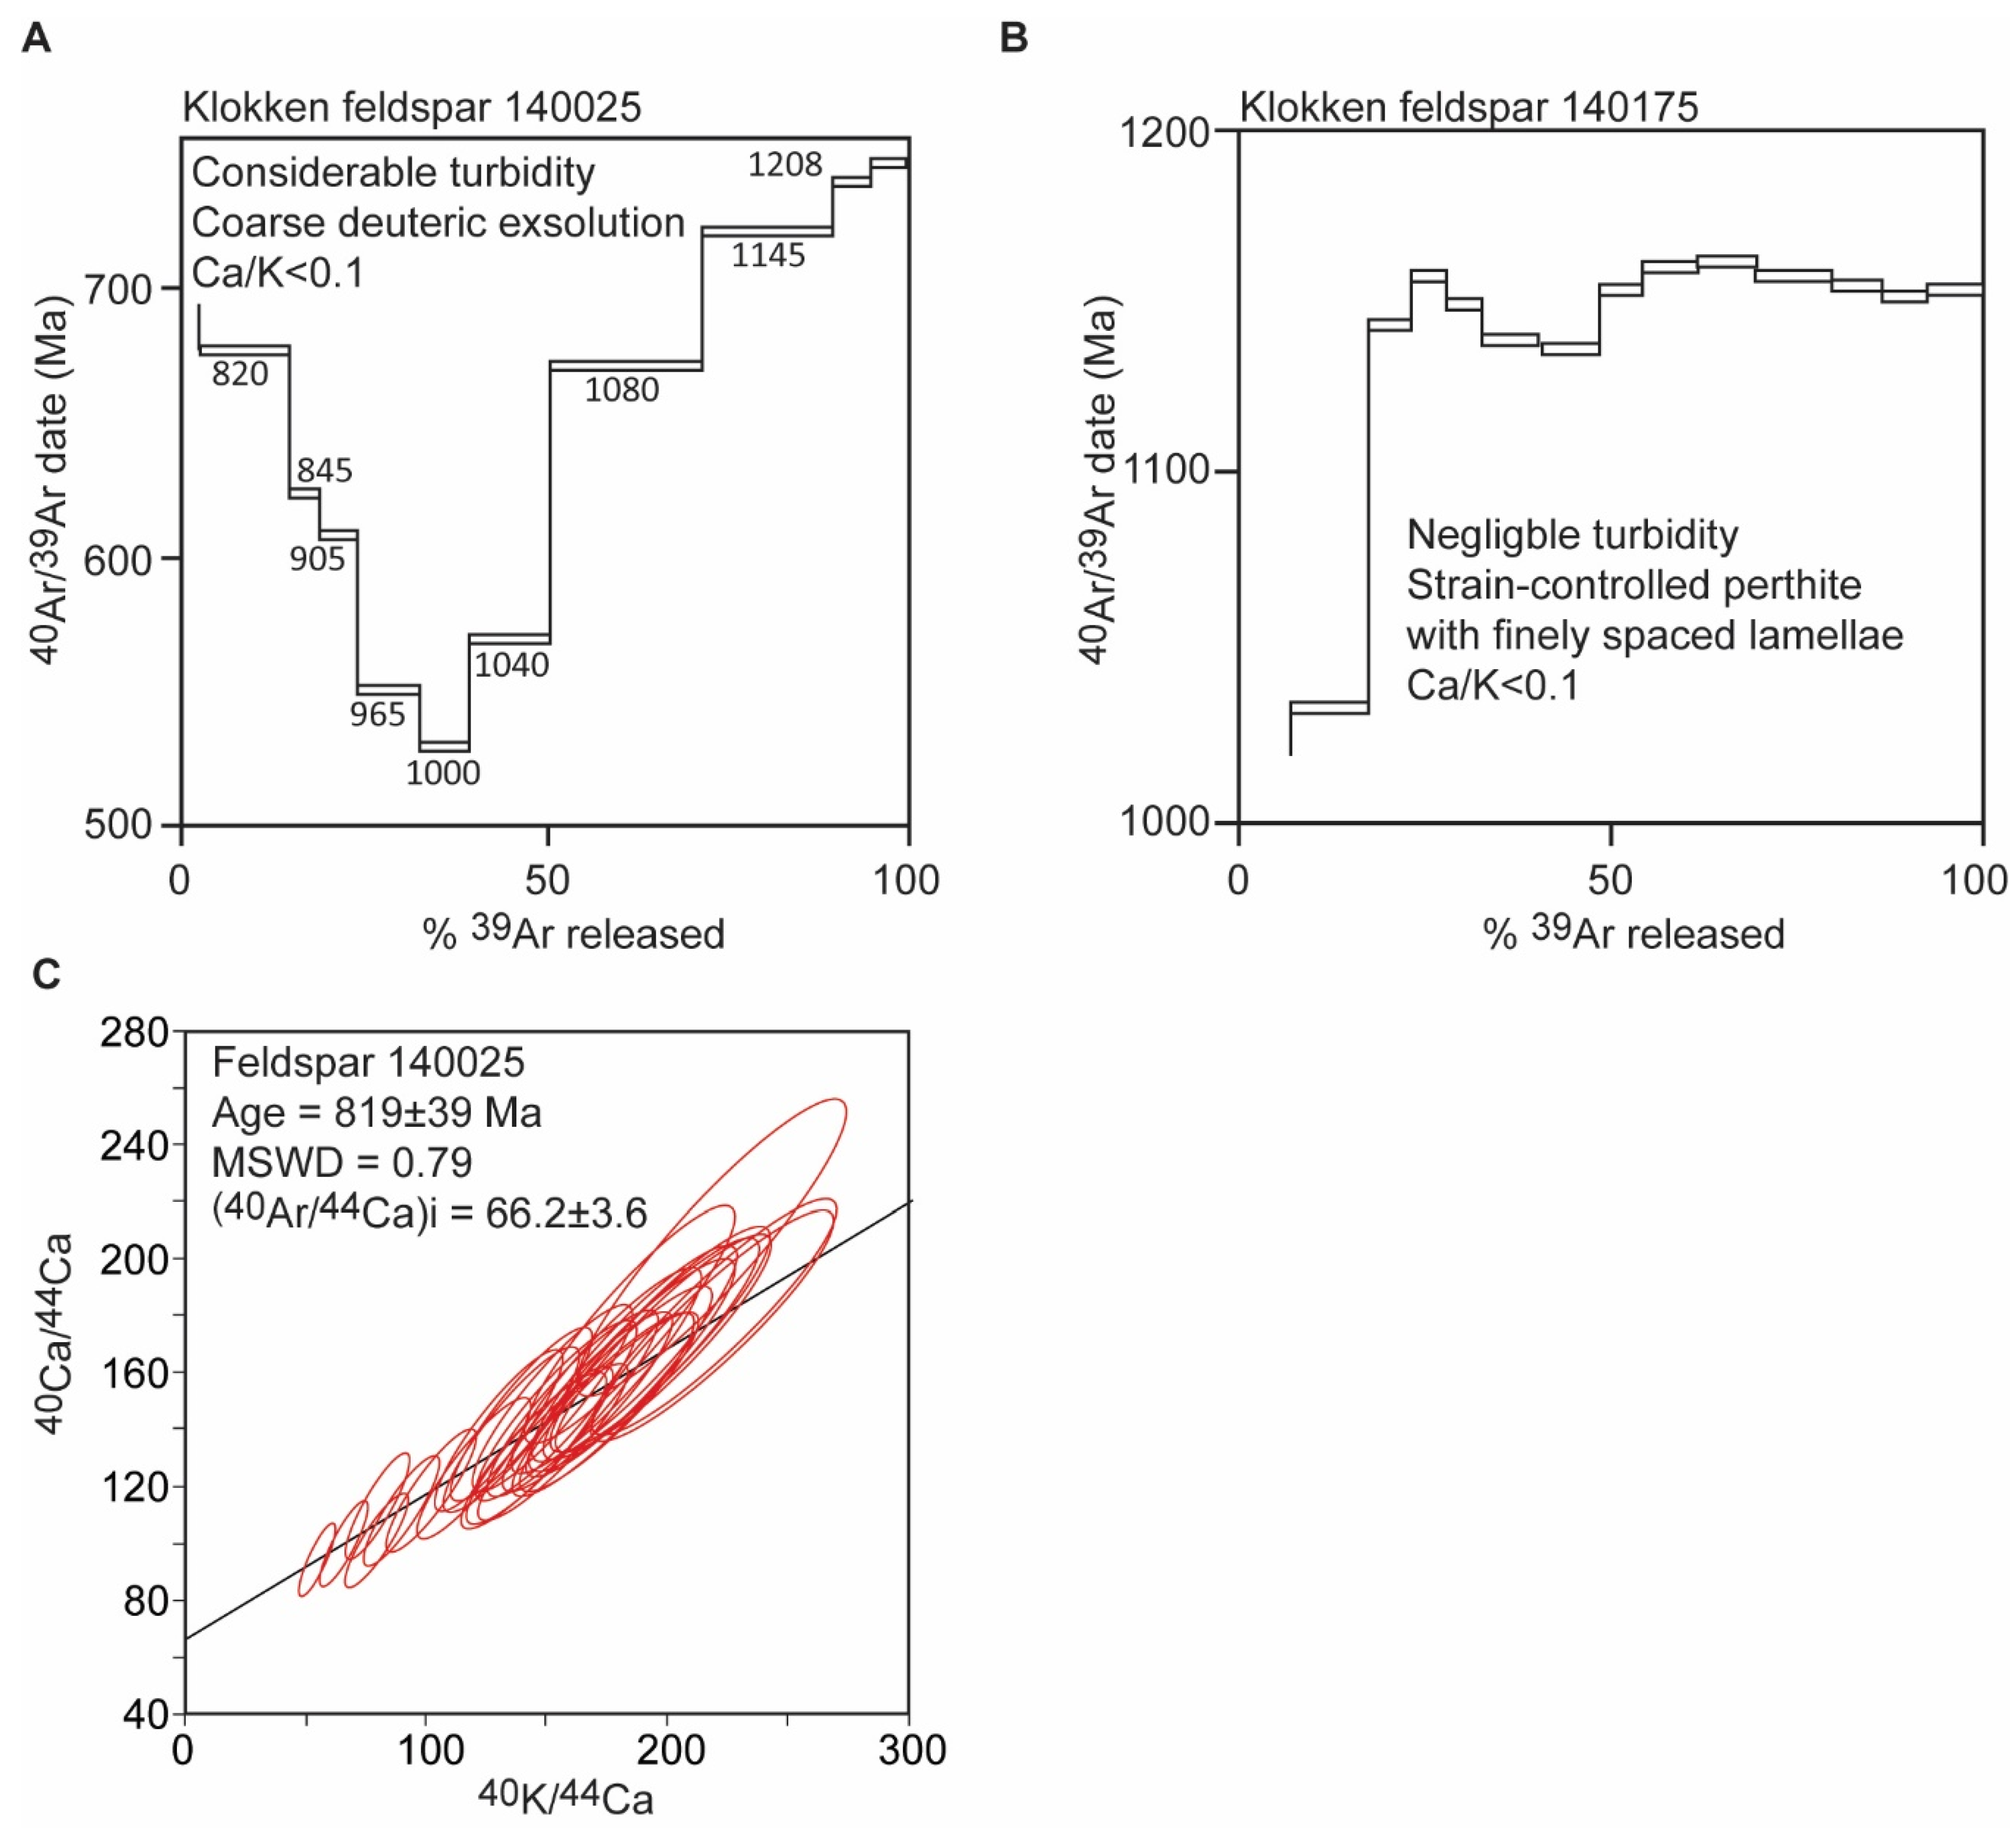
Klokken Syenite, Greenland
3.1.2. Muscovite
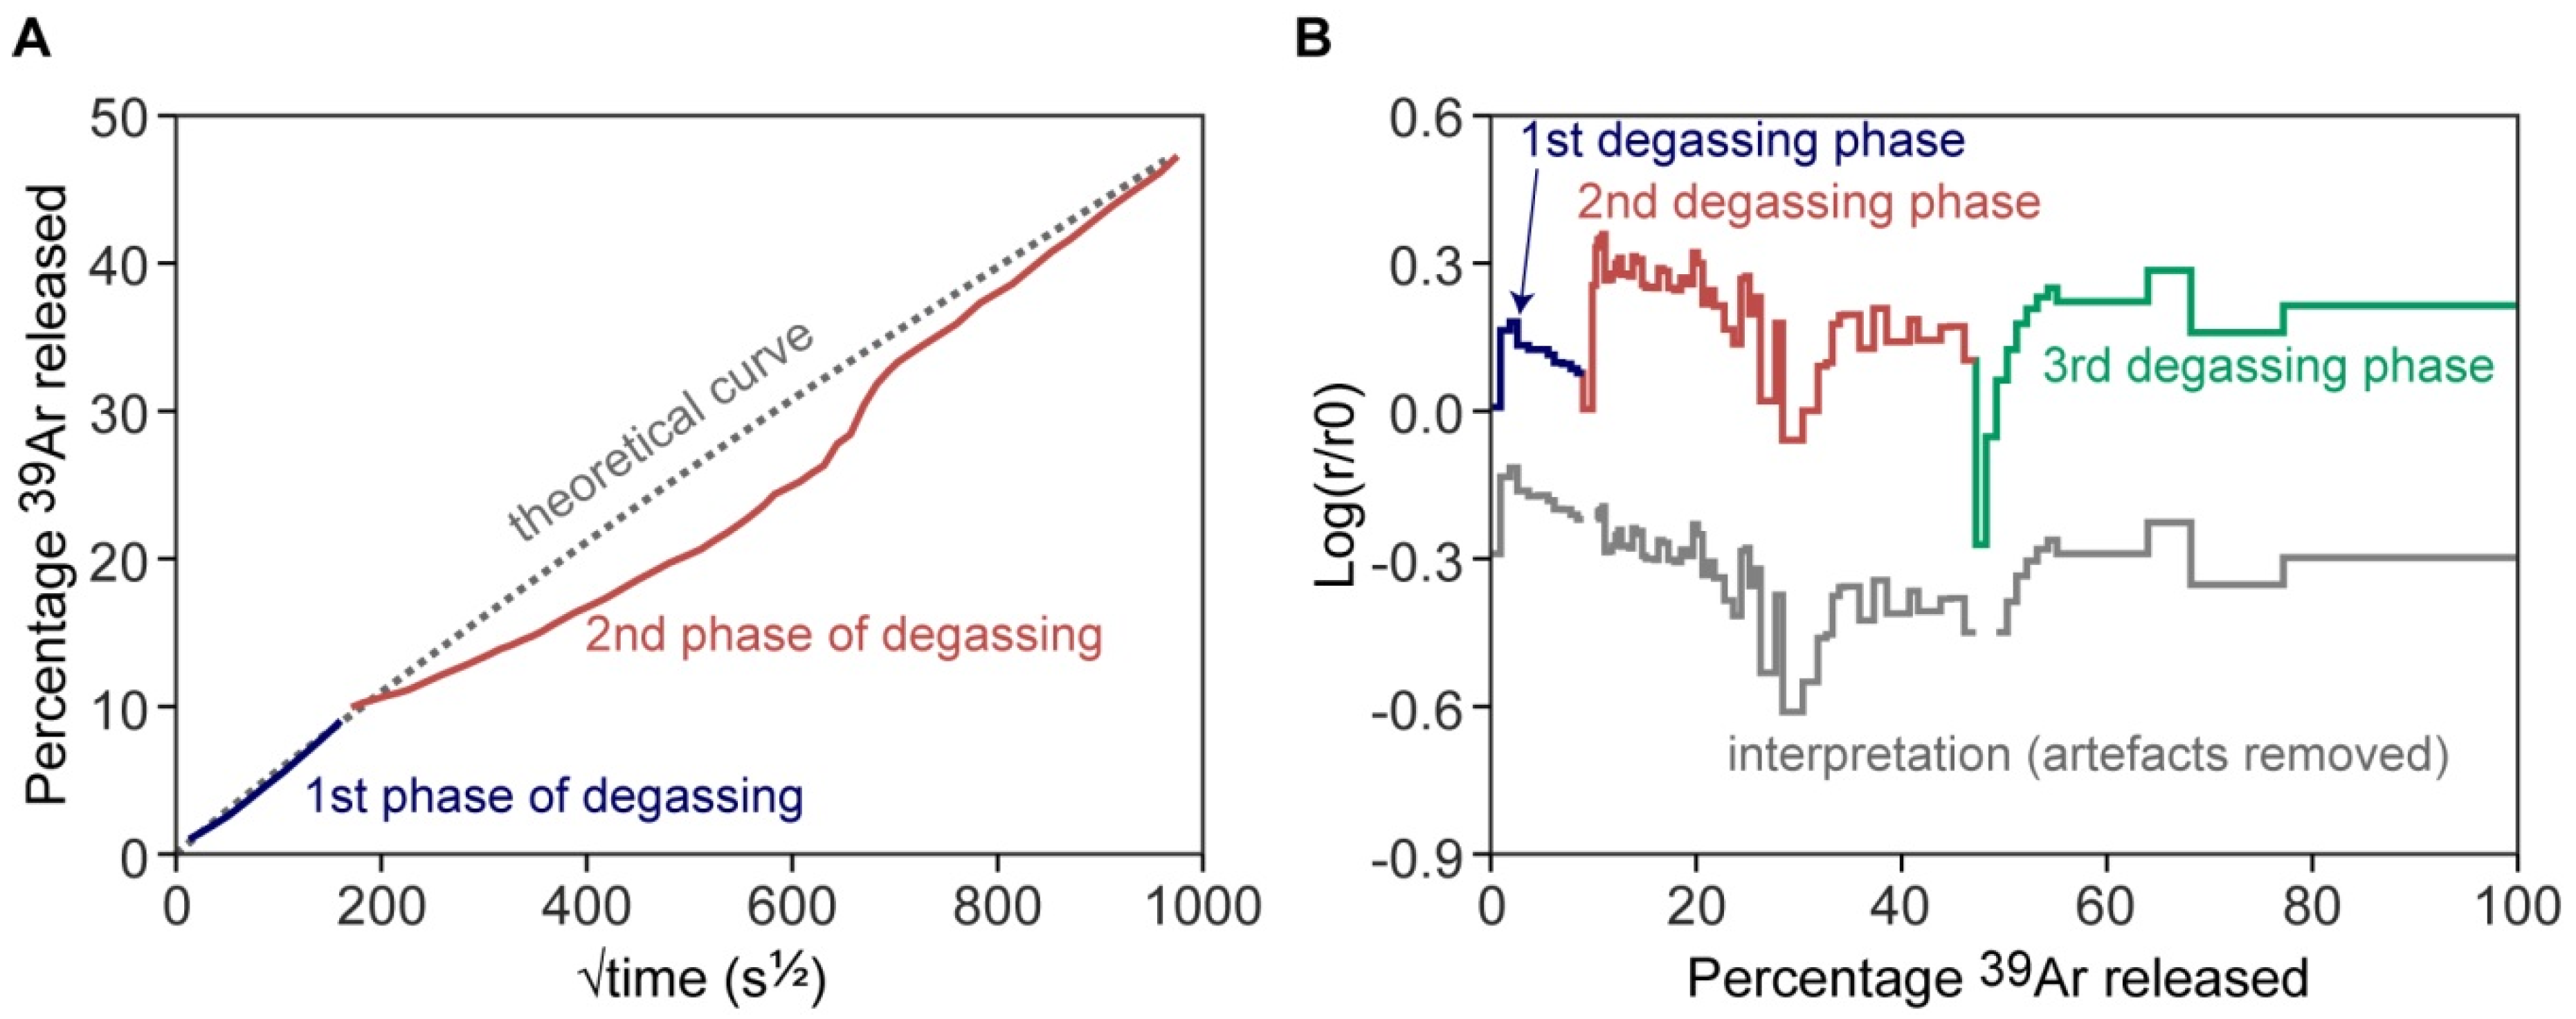
3.2. Laboratory Degassing and Changes in Diffusivity (D)
3.2.1. Alkali Feldspar
3.2.2. Muscovite
3.3. Relevance of Cross-Correlation of log(r/r0) Plots with Age Spectra
4. Recommendations
Author Contributions
Funding
Data Availability Statement
Acknowledgments
Conflicts of Interest
References
- Mulch, A.; Cosca, M.A. Recrystallization or Cooling Ages: In Situ UV-Laser 40Ar/39Ar Geochronology of Muscovite in Mylonitic Rocks. J. Geol. Soc. 2004, 161, 573–582. [Google Scholar] [CrossRef] [Green Version]
- Villa, I.M.; Hanchar, J.M. K-Feldspar Hygrochronology. Geochim. Cosmochim. Acta 2013, 101, 24–33. [Google Scholar] [CrossRef]
- McDonald, C.S.; Warren, C.J.; Mark, D.F.; Halton, A.M.; Kelley, S.P.; Sherlock, S.C. Argon Redistribution during a Metamorphic Cycle: Consequences for Determining Cooling Rates. Chem. Geol. 2016, 443, 182–197. [Google Scholar] [CrossRef] [Green Version]
- Lovera, O.M.; Richter, F.M.; Harrison, T.M. The 40Ar/39Ar Thermochronometry for Slowly Cooled Samples Having a Distribution of Diffusion Domain Sizes. J. Geophys. Res. 1989, 94, 17917. [Google Scholar] [CrossRef] [Green Version]
- Lovera, O.M.; Richter, F.M.; Harrison, T.M. Diffusion Domains Determined by 39Ar Released during Step Heating. J. Geophys. Res. 1991, 96, 2057. [Google Scholar] [CrossRef] [Green Version]
- Flude, S.; Halton, A.M.; Kelley, S.P.; Sherlock, S.C.; Schwanethal, J.; Wilkinson, C.M. Observation of Centimetre-Scale Argon Diffusion in Alkali Feldspars: Implications for 40Ar/39Ar Thermochronology. Geol. Soc. Lond. Spec. Publ. 2014, 378, 265–275. [Google Scholar] [CrossRef] [Green Version]
- Harrison, T.M.; Célérier, J.; Aikman, A.B.; Hermann, J.; Heizler, M.T. Diffusion of 40Ar in Muscovite. Geochim. Cosmochim. Acta 2009, 73, 1039–1051. [Google Scholar] [CrossRef]
- Warren, C.J.; Hanke, F.; Kelley, S.P. When Can Muscovite 40Ar/39Ar Dating Constrain the Timing of Metamorphic Exhumation? Chem. Geol. 2012, 291, 79–86. [Google Scholar] [CrossRef]
- Forster, M.A.; Lister, G.S. 40Ar/39Ar Geochronology and the Diffusion of 39Ar in Phengite–Muscovite Intergrowths during Step-Heating Experiments in Vacuo. Geol. Soc. Lond. Spec. Publ. 2014, 378, 117–135. [Google Scholar] [CrossRef]
- Long, S.P.; Heizler, M.T.; Thomson, S.N.; Reiners, P.W.; Fryxell, J.E. Rapid Oligocene to Early Miocene Extension Along the Grant Range Detachment System, Nevada, USA: Insights From Multipart Cooling Histories of Footwall Rocks. Tectonics 2018, 37, 4752–4779. [Google Scholar] [CrossRef] [Green Version]
- Gonzalez, J.P.; Baldwin, S.L. Modelling White Mica Pressure-temperature-time (P-T-t) Paths Using Thermobarometric and 40Ar/39Ar Thermochronologic Data. Terra Nova 2019, 31, 169–178. [Google Scholar] [CrossRef]
- Parsons, I.; Brown, W.L.; Smith, J.V. 40 Ar/ 39 Ar Thermochronology Using Alkali Feldspars: Real Thermal History or Mathematical Mirage of Microtexture? Contrib. Mineral. Petrol. 1999, 136, 92–110. [Google Scholar] [CrossRef]
- Di Vincenzo, G.; Ghiribelli, B.; Giorgetti, G.; Palmeri, R. Evidence of a Close Link between Petrology and Isotope Records: Constraints from SEM, EMP, TEM and in Situ 40Ar–39Ar Laser Analyses on Multiple Generations of White Micas (Lanterman Range, Antarctica). Earth Planet. Sci. Lett. 2001, 192, 389–405. [Google Scholar] [CrossRef]
- Villa, I.M. Diffusion of Ar in K-Feldspar: Present and Absent. Geol. Soc. Lond. Spec. Publ. 2014, 378, 107–116. [Google Scholar] [CrossRef]
- Uunk, B.; Brouwer, F.; ter Voorde, M.; Wijbrans, J. Understanding Phengite Argon Closure Using Single Grain Fusion Age Distributions in the Cycladic Blueschist Unit on Syros, Greece. Earth Planet. Sci. Lett. 2018, 484, 192–203. [Google Scholar] [CrossRef]
- Popov, D.V.; Spikings, R.A.; Scaillet, S.; O’Sullivan, G.; Chew, D.; Badenszki, E.; Daly, J.S.; Razakamanana, T.; Davies, J.H.F.L. Diffusion and Fluid Interaction in Itrongay Pegmatite (Madagascar): Evidence from in Situ 40Ar/39Ar Dating of Gem-Quality Alkali Feldspar and U Pb Dating of Protogenetic Apatite Inclusions. Chem. Geol. 2020, 556, 119841. [Google Scholar] [CrossRef]
- Popov, D.V.; Spikings, R.A.; Kouzmanov, K. Pathways for 39Ar Loss during Step-Heating of Alkali Feldspar Megacrysts from the Shap Granite (UK): Combined Evidence from Diffusion Experiments and Characterisation of Heating-Induced Texture Modifications. Chem. Geol. 2020, 547, 119677. [Google Scholar] [CrossRef]
- Scaillet, S. Excess 40Ar Transport Scale and Mechanism in High-Pressure Phengites: A Case Study from an Eclogitized Metabasite of the Dora-Maira Nappe, Western Alps. Geochim. Cosmochim. Acta 1996, 60, 1075–1090. [Google Scholar] [CrossRef]
- Camacho, A.; Lee, J.K.W.; Hensen, B.J.; Braun, J. Short-Lived Orogenic Cycles and the Eclogitization of Cold Crust by Spasmodic Hot Fluids. Nature 2005, 435, 1191–1196. [Google Scholar] [CrossRef]
- Popov, D.V.; Spikings, R.A. Numerical Modelling of Radiogenic Ingrowth and Diffusion of Pb in Apatite Inclusions with Variable Shape and U-Th Zonation. Minerals 2021, 11, 364. [Google Scholar] [CrossRef]
- Lovera, O.M. Computer Programs to Model 40Ar/39Ar Diffusion Data from Multidomain Samples. Comput. Geosci. 1992, 18, 789–813. [Google Scholar] [CrossRef]
- Zeitler, P.K. Inversion of 40Ar/39Ar Age Spectra Using the Controlled-Random-Search Method. EOS 1993, 74, 650. [Google Scholar]
- Lister, G.S.; Baldwin, S.L. Modelling the Effect of Arbitrary P-T-t Histories on Argon Diffusion in Minerals Using the MacArgon Program for the Apple Macintosh. Tectonophysics 1996, 253, 83–109. [Google Scholar] [CrossRef]
- Pickles, C.S.; Kelley, S.P.; Reddy, S.M.; Wheeler, J. Determination of High Spatial Resolution Argon Isotope Variations in Metamorphic Biotites. Geochim. Cosmochim. Acta 1997, 61, 3809–3833. [Google Scholar] [CrossRef]
- Skipton, D.R.; Schneider, D.A.; Kellett, D.A.; Joyce, N.L. Deciphering the Paleoproterozoic Cooling History of the Northeastern Trans-Hudson Orogen, Baffin Island (Canada), Using 40Ar/39Ar Step-Heating and UV Laser Thermochronology. Lithos 2017, 284–285, 69–90. [Google Scholar] [CrossRef]
- Skipton, D.R.; Warren, C.J.; Hanke, F. Numerical Models of P–T, Time and Grain-Size Controls on Ar Diffusion in Biotite: An Aide to Interpreting 40Ar/39Ar Ages. Chem. Geol. 2018, 496, 14–24. [Google Scholar] [CrossRef]
- Wheeler, J. Diffarg: A Program for Simulating Argon Diffusion Profiles in Minerals. Comput. Geosci. 1996, 22, 919–929. [Google Scholar] [CrossRef]
- Baxter, E.F. Quantification of the Factors Controlling the Presence of Excess 40 Ar or 4 He. Earth Planet. Sci. Lett. 2003, 216, 619–634. [Google Scholar] [CrossRef]
- Fitz Gerald, J.D.; Parsons, I.; Cayzer, N. Nanotunnels and Pull-Aparts: Defects of Exsolution Lamellae in Alkali Feldspars. Am. Mineral. 2006, 91, 772–783. [Google Scholar] [CrossRef]
- Parsons, I.; Fitz Gerald, J.D.; Lee, J.K.W.; Ivanic, T.; Golla-Schindler, U. Time–Temperature Evolution of Microtextures and Contained Fluids in a Plutonic Alkali Feldspar during Heating. Contrib. Mineral. Petrol. 2010, 160, 155–180. [Google Scholar] [CrossRef]
- Lee, J.K.W. Multipath Diffusion in Geochronology. Contrib. Mineral. Petrol. 1995, 120, 60–82. [Google Scholar] [CrossRef]
- Harrison, T.M.; Lovera, O.M. The Multi-Diffusion Domain Model: Past, Present and Future. Geol. Soc. Lond. Spec. Publ. 2014, 378, 91–106. [Google Scholar] [CrossRef] [Green Version]
- Richter, F.M.; Lovera, O.M.; Mark Harrison, T.; Copeland, P. Tibetan Tectonics from 40Ar/39Ar Analysis of a Single K-Feldspar Sample. Earth Planet. Sci. Lett. 1991, 105, 266–278. [Google Scholar] [CrossRef]
- Wartho, J.-A.; Kelley, S.P.; Brooker, R.A.; Carroll, M.R.; Villa, I.M.; Lee, M.R. Direct Measurement of Ar Diffusion Profiles in a Gem-Quality Madagascar K-Feldspar Using the Ultra-Violet Laser Ablation Microprobe (UVLAMP). Earth Planet. Sci. Lett. 1999, 170, 141–153. [Google Scholar] [CrossRef]
- Copeland, P.; Mark Harrison, T.; Le Fort, P. Age and Cooling History of the Manaslu Granite: Implications for Himalayan Tectonics. J. Volcanol. Geother. Res. 1990, 44, 33–50. [Google Scholar] [CrossRef]
- Arnaud, N.O.; Brunel, M.; Cantagrel, J.M.; Tapponnier, P. High Cooling and Denudation Rates at Kongur Shan, Eastern Pamir (Xinjiang, China) Revealed by 40Ar/39Ar Alkali Feldspar Thermochronology. Tectonics 1993, 12, 1335–1346. [Google Scholar] [CrossRef]
- Kirby, E.; Reiners, P.W.; Krol, M.A.; Whipple, K.X.; Hodges, K.V.; Farley, K.A.; Tang, W.; Chen, Z. Late Cenozoic Evolution of the Eastern Margin of the Tibetan Plateau: Inferences from 40Ar/39Ar and (U-Th)/He Thermochronology: Late cenozoic evolution of eastern tibet. Tectonics 2002, 21, 1001. [Google Scholar] [CrossRef] [Green Version]
- Metcalf, J.R.; Fitzgerald, P.G.; Baldwin, S.L.; Muñoz, J.-A. Thermochronology of a Convergent Orogen: Constraints on the Timing of Thrust Faulting and Subsequent Exhumation of the Maladeta Pluton in the Central Pyrenean Axial Zone. Earth Planet. Sci. Lett. 2009, 287, 488–503. [Google Scholar] [CrossRef]
- Spikings, R.A.; Foster, D.A.; Kohn, B.P.; Lister, G.S. Post-Orogenic (<1500 Ma) Thermal History of the Palaeo-Mesoproterozoic, Mt. Isa Province, NE Australia. Tectonophysics 2002, 349, 327–365. [Google Scholar] [CrossRef]
- McDannell, K.T.; Schneider, D.A.; Zeitler, P.K.; O’Sullivan, P.B.; Issler, D.R. Reconstructing Deep-time Histories from Integrated Thermochronology: An Example from Southern Baffin Island, Canada. Terra Nova 2019, 31, 189–204. [Google Scholar] [CrossRef]
- Foster, D.A.; John, B.E. Quantifying Tectonic Exhumation in an Extensional Orogen with Thermochronology: Examples from the Southern Basin and Range Province. Geol. Soc. Lond. Spec. Publ. 1999, 154, 343–364. [Google Scholar] [CrossRef]
- Wong, M.S.; Gans, P.B.; Scheier, J. The 40Ar/39Ar Thermochronology of Core Complexes and Other Basement Rocks in Sonora, Mexico: Implications for Cenozoic Tectonic Evolution of Northwestern Mexico. J. Geophys. Res. 2010, 115, B07414. [Google Scholar] [CrossRef]
- Dunlap, W.J.; Fossen, H. Early Paleozoic Orogenic Collapse, Tectonic Stability, and Late Paleozoic Continental Rifting Revealed through Thermochronology of K-Feldspars, Southern Norway. Tectonics 1998, 17, 604–620. [Google Scholar] [CrossRef]
- Lovera, O.M.; Harrison, T.M.; Grove, M. Comment on “Multipath Ar Transport in K-Feldspar Deduced from Isothermal Heating Experiments” by Igor Villa. Earth Planet. Sci. Lett. 1996, 140, 281–283. [Google Scholar] [CrossRef]
- Lovera, O.M.; Grove, M.; Harrison, T.M. Systematic Analysis of K-Feldspar 40 Ar/ 39 Ar Step Heating Results II: Relevance of Laboratory Argon Diffusion Properties to Nature. Geochim. Cosmochim. Acta 2002, 66, 1237–1255. [Google Scholar] [CrossRef]
- Lovera, O.M.; Heizler, M.T.; Harrison, T.M. Argon Diffusion Domains in K-Feldspar II: Kinetic Properties of MH-10. Contrib. Mineral. Petrol. 1993, 113, 381–393. [Google Scholar] [CrossRef]
- Hames, W.E.; Hodges, K.V. Laser 40Ar/39Ar Evaluation of Slow Cooling and Episodic Loss of 40Ar from a Sample of Polymetamorphic Muscovite. Science 1993, 261, 1721–1723. [Google Scholar] [CrossRef]
- Scharf, A.; Handy, M.R.; Schmid, S.M.; Favaro, S.; Sudo, M.; Schuster, R.; Hammerschmidt, K. Grain-Size Effects on the Closure Temperature of White Mica in a Crustal-Scale Extensional Shear Zone—Implications of in-Situ 40Ar/39Ar Laser-Ablation of White Mica for Dating Shearing and Cooling (Tauern Window, Eastern Alps). Tectonophysics 2016, 674, 210–226. [Google Scholar] [CrossRef]
- Baldwin, S.L.; Harrison, T.M. Geochronology of Blueschists from West-Central Baja California and the Timing of Uplift in Subduction Complexes. J. Geol. 1989, 97, 149–163. [Google Scholar] [CrossRef]
- Heizler, M.; Ralser, S.; Karlstrom, K.E. Late Proterozoic (Grenville?) Deformation in Central New Mexico Determined from Single-Crystal Muscovite 40Ar/39Ar Age Spectra. Precambrian Res. 1997, 84, 1–15. [Google Scholar] [CrossRef]
- Heizler, M.T.; Harrison, T.M. Continuous Thermal Histories from Muscovite 40Ar/39Ar Age Spectra. Geochim. Cosmochim. Acta 2009, 73 , A497. [Google Scholar]
- Forster, M.A.; White, L.T.; Ahmad, T. Thermal History of a Pebble in the Indus Molasse at the Margin of a Himalayan Metamorphic Core Complex. J. Virt. Ex. 2011, 38, 1–21. [Google Scholar] [CrossRef]
- McDonald, C.S.; Regis, D.; Warren, C.J.; Kelley, S.P.; Sherlock, S.C. Recycling Argon through Metamorphic Reactions: The Record in Symplectites. Lithos 2018, 300–301, 200–211. [Google Scholar] [CrossRef]
- Villa, I.M. Isotopic Closure. Terra Nova 1998, 10, 42–47. [Google Scholar] [CrossRef]
- Villa, I.M. From Nanometer to Megameter: Isotopes, Atomic-Scale Processes, and Continent-Scale Tectonic Models. Lithos 2006, 87, 155–173. [Google Scholar] [CrossRef]
- Villa, I.M.; Bulle, F.; Rubatto, D.; Ruggieri, G.; Luisier, C.; Baumgartner, L.P. The Oxygen-Argon Connection in Micas from a Long-Lived Hydrothermal System, Larderello-Travale Geothermal Field, Italy; American Geophysical Union: Washington, DC, USA, 2019; Volume V34A-03. [Google Scholar]
- Bulle, F.; Rubatto, D.; Ruggieri, G.; Luisier, C.; Villa, I.M.; Baumgartner, L. Episodic Hydrothermal Alteration Recorded by Microscale Oxygen Isotope Analysis of White Mica in the Larderello-Travale Geothermal Field, Italy. Chem. Geol. 2020, 532, 119288. [Google Scholar] [CrossRef]
- Kung, J.; Villa, I.M. The in Vacuo Release of Ar from Minerals: 2. The Role of Structural Modifications of K-Feldspar during Heating Revealed by Raman Microprobe Analyses. Chem. Geol. 2021, 580, 120382. [Google Scholar] [CrossRef]
- Popov, D.V.; Spikings, R.A. Diffusion vs. Fluid Alteration in Alkali Feldspar 40Ar/39Ar Thermochronology: Does Cross-Correlation of Log(r/R0) and Age Spectra Validate Thermal Histories? Chem. Geol. 2020, 539, 119506. [Google Scholar] [CrossRef]
- Lasaga, A.C. Chapter 7. The atomistic basis of kinetics: Defects in minerals. In Kinetics of Geochemical Processes; Lasaga, A.C., Kirkpatrick, J., Eds.; De Gruyter: Berlin, Germany, 1981; pp. 261–320. ISBN 978-1-5015-0823-3. [Google Scholar]
- Glodny, J.; Austrheim, H.; Molina, J.F.; Rusin, A.I.; Seward, D. Rb/Sr Record of Fluid-Rock Interaction in Eclogites: The Marun-Keu Complex, Polar Urals, Russia. Geochim. Cosmochim. Acta 2003, 67, 4353–4371. [Google Scholar] [CrossRef]
- Geochronology: Linking the isotopic record with petrology and textures. In Geochronology: Linking the Isotopic Record with Petrology and Textures; Vance, D.; Müller, W.; Villa, I.M.; Geological Society of London (Eds.) Geological Society special publication; Geological Society: London, UK, 2003; ISBN 978-1-86239-146-8. [Google Scholar]
- Putnis, A. Mineral Replacement Reactions. Rev. Mineral. Geochem. 2009, 70, 87–124. [Google Scholar] [CrossRef]
- Villa, I.M. Diffusion in Mineral Geochronometers: Present and Absent. Chem. Geol. 2016, 420, 1–10. [Google Scholar] [CrossRef]
- Akker, I.V.; Berger, A.; Zwingmann, H.; Todd, A.; Schrank, C.E.; Jones, M.W.M.; Kewish, C.M.; Schmid, T.C.; Herwegh, M. Structural and Chemical Resetting Processes in White Mica and Their Effect on K-Ar Data during Low Temperature Metamorphism. Tectonophysics 2021, 800, 228708. [Google Scholar] [CrossRef]
- Cole, D.R.; Ohmoto, H.; Lasaga, A.C. Isotopic Exchange in Mineral-Fluid Systems. I. Theoretical Evaluation of Oxygen Isotopic Exchange Accompanying Surface Reactions and Diffusion. Geochim. Cosmochim. Acta 1983, 47, 1681–1693. [Google Scholar] [CrossRef]
- Parsons, I.; Rex, D.C.; Guise, P.; Halliday, A.N. Argon-Loss by Alkali Feldspars. Geochim. Cosmochim. Acta 1988, 52, 1097–1112. [Google Scholar] [CrossRef]
- Reddy, S.M.; Potts, G.J.; Kelley, S.P.; Arnaud, N.O. The Effects of Deformation-Induced Microstructures on Intragrain 40Ar/39Ar Ages in Potassium Feldspar. Geology 1999, 27, 363–366. [Google Scholar] [CrossRef]
- Challandes, N.; Marquer, D.; Villa, I.M. P-T-t Modelling, Fluid Circulation, and 39Ar-40Ar and Rb-Sr Mica Ages in the Aar Massif Shear Zones (Swiss Alps). Swiss J. Geosci. 2008, 101, 269–288. [Google Scholar] [CrossRef]
- Harrison, T.M.; Heizler, M.T.; McKeegan, K.D.; Schmitt, A.K. In Situ 40K–40Ca ‘Double-plus’ SIMS Dating Resolves Klokken Feldspar 40K–40Ar Paradox. Earth Planet. Sci. Lett. 2010, 299, 426–433. [Google Scholar] [CrossRef]
- Chafe, A.N.; Villa, I.M.; Hanchar, J.M.; Wirth, R. A Re-Examination of Petrogenesis and 40Ar/39Ar Systematics in the Chain of Ponds K-Feldspar: “Diffusion Domain” Archetype versus Polyphase Hygrochronology. Contrib. Mineral. Petrol. 2014, 167, 1010. [Google Scholar] [CrossRef]
- Heizler, M.T.; Lux, D.R.; Decker, E.R. The Age and Cooling History of the Chain of Ponds and Big Island Pond Plutons and the Spider Lake Granite, West-Central Maine and Quebec. Am. J. Sci. 1988, 288, 925–952. [Google Scholar] [CrossRef]
- Fitz Gerald, J.D.; Harrison, T.M. Argon Diffusion Domains in K-Feldspar I: Microstructures in MH-10. Contrib. Mineral. Petrol. 1993, 113, 367–380. [Google Scholar] [CrossRef]
- Lee, M.R.; Parsons, I. Dislocation Formation and Albitization in Alkali Feldspars from the Shap Granite. Am. Mineral. 1997, 82, 557–570. [Google Scholar] [CrossRef]
- Parsons, I.; Lee, M.R. Minerals are not just chemical compounds. Can. Mineral. 2005, 43, 1959–1992. [Google Scholar] [CrossRef] [Green Version]
- Parsons, I.; Fitz Gerald, J.D.; Heizler, M.T.; Heizler, L.L.; Ivanic, T.; Lee, M.R. Eight-Phase Alkali Feldspars: Low-Temperature Cryptoperthite, Peristerite and Multiple Replacement Reactions in the Klokken Intrusion. Contrib. Mineral. Petrol. 2013, 165, 931–960. [Google Scholar] [CrossRef]
- Nägler, T.F.; Villa, I.M. In Pursuit of the 40K Branching Ratios: K-Ca and 39Ar–40Ar Dating of Gem Silicates. Chem. Geol. 2000, 169, 5–16. [Google Scholar] [CrossRef]
- Harper, C.L. On the Nature of Time in Cosmological Perspective; University of Oxford: Oxford, UK, 1988. [Google Scholar]
- Walker, F.D.L.; Lee, M.R.; Parsons, I. Micropores and Micropermeable Texture in Alkali Feldspars: Geochemical and Geophysical Implications. Mineral. Mag. 1995, 59, 505–534. [Google Scholar] [CrossRef]
- Worden, R.H.; Walker, F.D.L.; Parsons, I.; Brown, W.L. Development of Microporosity, Diffusion Channels and Deuteric Coarsening in Perthitic Alkali Feldspars. Contrib. Mineral. Petrol. 1990, 104, 507–515. [Google Scholar] [CrossRef]
- McLaren, S.; Dunlap, W.J.; Powell, R. Understanding K-Feldspar 40Ar/39Ar Data: Reconciling Models, Methods and Microtextures. J. Geol. Soc. 2007, 164, 941–944. [Google Scholar] [CrossRef]
- Sanders, S. K-Feldspar Thermochronology of Proterozoic Basement Rocks: Reconciling Regional Tectonism, Fluid Alteration, and Argon Transport in Microtexturally Complex Feldspar. Ph.D. Thesis, New Mexico Institute of Mining and Technology, Socorro, NM, USA, 2008. [Google Scholar]
- Burgess, R.; Kelley, S.P.; Parsons, I.; Walker, F.D.L.; Worden, R.H. 40Ar39Ar Analysis of Perthite Microtextures and Fluid Inclusions in Alkali Feldspars from the Klokken Syenite, South Greenland. Earth Planet. Sci. Lett. 1992, 109, 147–167. [Google Scholar] [CrossRef]
- Hames, W.E.; Cheney, J.T. On the Loss of from Muscovite during Polymetamorphism. Geochim. Cosmochim. Acta 1997, 61, 3863–3872. [Google Scholar] [CrossRef]
- Allaz, J.; Engi, M.; Berger, A.; Villa, I.M. The Effects of Retrograde Reactions and of Diffusion on 40Ar–39Ar Ages of Micas. J. Petrol. 2011, 52, 691–716. [Google Scholar] [CrossRef] [Green Version]
- Warren, C.J.; Sherlock, S.C.; Kelley, S.P. Interpreting High-Pressure Phengite 40Ar/39Ar Laserprobe Ages: An Example from Saih Hatat, NE Oman. Contrib. Mineral. Petrol. 2011, 161, 991–1009. [Google Scholar] [CrossRef]
- Warren, C.J.; Kelley, S.P.; Sherlock, S.C.; McDonald, C.S. Metamorphic Rocks Seek Meaningful Cooling Rate: Interpreting 40Ar/39Ar Ages in an Exhumed Ultra-High Pressure Terrane. Lithos 2012, 155, 30–48. [Google Scholar] [CrossRef]
- Warren, C.J.; Smye, A.J.; Kelley, S.P.; Sherlock, S.C. Using White Mica 40Ar/39Ar Data as a Tracer for Fluid Flow and Permeability under High-P Conditions: Tauern Window, Eastern Alps. J. Metamorph. Geol. 2012, 30, 63–80. [Google Scholar] [CrossRef]
- Di Vincenzo, G. The Relationship between Tectono-Metamorphic Evolution and Argon Isotope Records in White Mica: Constraints from in Situ 40Ar-39Ar Laser Analysis of the Variscan Basement of Sardinia. J. Petrol. 2004, 45, 1013–1043. [Google Scholar] [CrossRef]
- Young, D.J.; Kylander-Clark, A.R.C. Does Continental Crust Transform during Eclogite Facies Metamorphism? J. Meta. Geol. 2015, 33, 331–357. [Google Scholar] [CrossRef]
- Arnaud, N.O.; Kelley, S.P. Argon Behaviour in Gem-Quality Orthoclase from Madagascar: Experiments and Some Consequences for Geochronology. Geochim. Cosmochim. Acta 1997, 61, 3227–3255. [Google Scholar] [CrossRef]
- Cassata, W.S.; Renne, P.R. Systematic Variations of Argon Diffusion in Feldspars and Implications for Thermochronometry. Geochim. Cosmochim. Acta 2013, 112, 251–287. [Google Scholar] [CrossRef]
- Evernden, J.F.; Curtis, G.H.; Kistler, R.W.; Obradovich, J.D. Argon Diffusion in Glauconite, Microcline, Sanidine, Leucite and Phlogopite. Am. J. Sci. 1960, 258, 583–604. [Google Scholar] [CrossRef]
- Foland, K.A. Argon Diffusion in Feldspars. In Feldspars and Their Reactions; Parsons, I., Ed.; Springer: Dordrecht, The Netherlands, 1994; pp. 415–447. ISBN 978-94-010-4483-7. [Google Scholar]
- Schmeling, P. Influence of Radiation Damage upon the Diffusion of Argon in Potassium Chloride. Phys. Stat. Solid (b) 1965, 11, 175–184. [Google Scholar] [CrossRef] [Green Version]
- Saad, A.; Velichko, O.I.; Shaman, Y.P.; Mazanik, A.V.; Fedotov, A.K.; Fedotova, V.V. Modeling of Hydrogen Diffusion in Silicon Crystals. Nuclear Instrum. Methods Phys. Res. Sect. B Beam Interact. Mater. Atoms 2006, 253, 118–121. [Google Scholar] [CrossRef]
- Dohmen, R.; Kasemann, S.A.; Coogan, L.; Chakraborty, S. Diffusion of Li in Olivine. Part I: Experimental Observations and a Multi Species Diffusion Model. Geochim. Cosmochim. Acta 2010, 74, 274–292. [Google Scholar] [CrossRef]
- Gerin, C.; Gautheron, C.; Oliviero, E.; Bachelet, C.; Mbongo Djimbi, D.; Seydoux-Guillaume, A.-M.; Tassan-Got, L.; Sarda, P.; Roques, J.; Garrido, F. Influence of Vacancy Damage on He Diffusion in Apatite, Investigated at Atomic to Mineralogical Scales. Geochim. Cosmochim. Acta 2017, 197, 87–103. [Google Scholar] [CrossRef]
- Lovera, O.M.; Harrison, T.M.; Boehnke, P. Comment on “Systematic Variations of Argon Diffusion in Feldspars and Implications for Thermochronometry” by Cassata and Renne. Geochim. Cosmochim. Acta 2015, 151, 168–171. [Google Scholar] [CrossRef]
- Hodges, K.V.; Harries, W.E.; Bowring, S.A. 40Ar/39Ar Age Gradients in Micas from a High-Temperature-Low-Pressure Metamorphic Terrain: Evidence for Very Slow Cooling and Implications for the Interpretation of Age Spectra. Geology 1994, 22, 55–58. [Google Scholar] [CrossRef]
- Udagawa, S.; Urabe, K.; Hasu, H. The Crystal Structure of Muscovite Dehydroxylate. J. Jpn. Assoc. Min. Petr. Econ. Geol. 1974, 69, 381–389. [Google Scholar] [CrossRef]
- Tokiwai, K.; Nakashima, S. Dehydration Kinetics of Muscovite by in Situ Infrared Microspectroscopy. Phys. Chem. Miner. 2010, 37, 91–101. [Google Scholar] [CrossRef]
- Heller-Kallai, L.; Lapides, I. Dehydroxylation of Muscovite: Study of Quenched Samples. Phys. Chem. Miner. 2015, 42, 835–845. [Google Scholar] [CrossRef]
- Gemmi, M.; Merlini, M.; Pavese, A.; Curetti, N. Thermal Expansion and Dehydroxylation of Phengite Micas. Phys. Chem. Miner. 2008, 35, 367–379. [Google Scholar] [CrossRef]
- Celerier, J. The Structural and Thermal Evolution of the Kumaon and Garwhal (Sic) Lesser Himalaya, India. Ph.D. Thesis, Australian National University, Canberra, Australia, 2007. [Google Scholar]
- Kula, J.; Spell, T.L. Recovery of Muscovite Age Gradients by 40Ar/39Ar Vacuum Furnace Step-Heating Analysis. Chem. Geol. 2012, 304–305, 166–174. [Google Scholar] [CrossRef]
- Villa, I.M. The in Vacuo Release of Ar from Minerals: 1. Hydrous Minerals. Chem. Geol. 2021, 564, 120076. [Google Scholar] [CrossRef]
- Hess, J.C.; Lippolt, H.J.; Wirth, R. Interpretation of Biotites: Evidence from Hydrothermal Degassing Experiments and TEM Studies. Chem. Geol. Isotope Geosci. Sect. 1987, 66, 137–149. [Google Scholar] [CrossRef]
- Kelley, S. Excess Argon in K–Ar and Ar–Ar Geochronology. Chem. Geol. 2002, 188, 1–22. [Google Scholar] [CrossRef]


Publisher’s Note: MDPI stays neutral with regard to jurisdictional claims in published maps and institutional affiliations. |
© 2021 by the authors. Licensee MDPI, Basel, Switzerland. This article is an open access article distributed under the terms and conditions of the Creative Commons Attribution (CC BY) license (https://creativecommons.org/licenses/by/4.0/).
Share and Cite
Spikings, R.A.; Popov, D.V. Thermochronology of Alkali Feldspar and Muscovite at T > 150 °C Using the 40Ar/39Ar Method: A Review. Minerals 2021, 11, 1025. https://doi.org/10.3390/min11091025
Spikings RA, Popov DV. Thermochronology of Alkali Feldspar and Muscovite at T > 150 °C Using the 40Ar/39Ar Method: A Review. Minerals. 2021; 11(9):1025. https://doi.org/10.3390/min11091025
Chicago/Turabian StyleSpikings, Richard A., and Daniil V. Popov. 2021. "Thermochronology of Alkali Feldspar and Muscovite at T > 150 °C Using the 40Ar/39Ar Method: A Review" Minerals 11, no. 9: 1025. https://doi.org/10.3390/min11091025
APA StyleSpikings, R. A., & Popov, D. V. (2021). Thermochronology of Alkali Feldspar and Muscovite at T > 150 °C Using the 40Ar/39Ar Method: A Review. Minerals, 11(9), 1025. https://doi.org/10.3390/min11091025