
Effect of Fine Aggregate Particle Characteristics on Mechanical Properties of Fly Ash-Based Geopolymer Mortar


 ,
,  and
and
Abstract
:1. Introduction
2. Materials and Methods
2.1. Materials
2.2. Methods
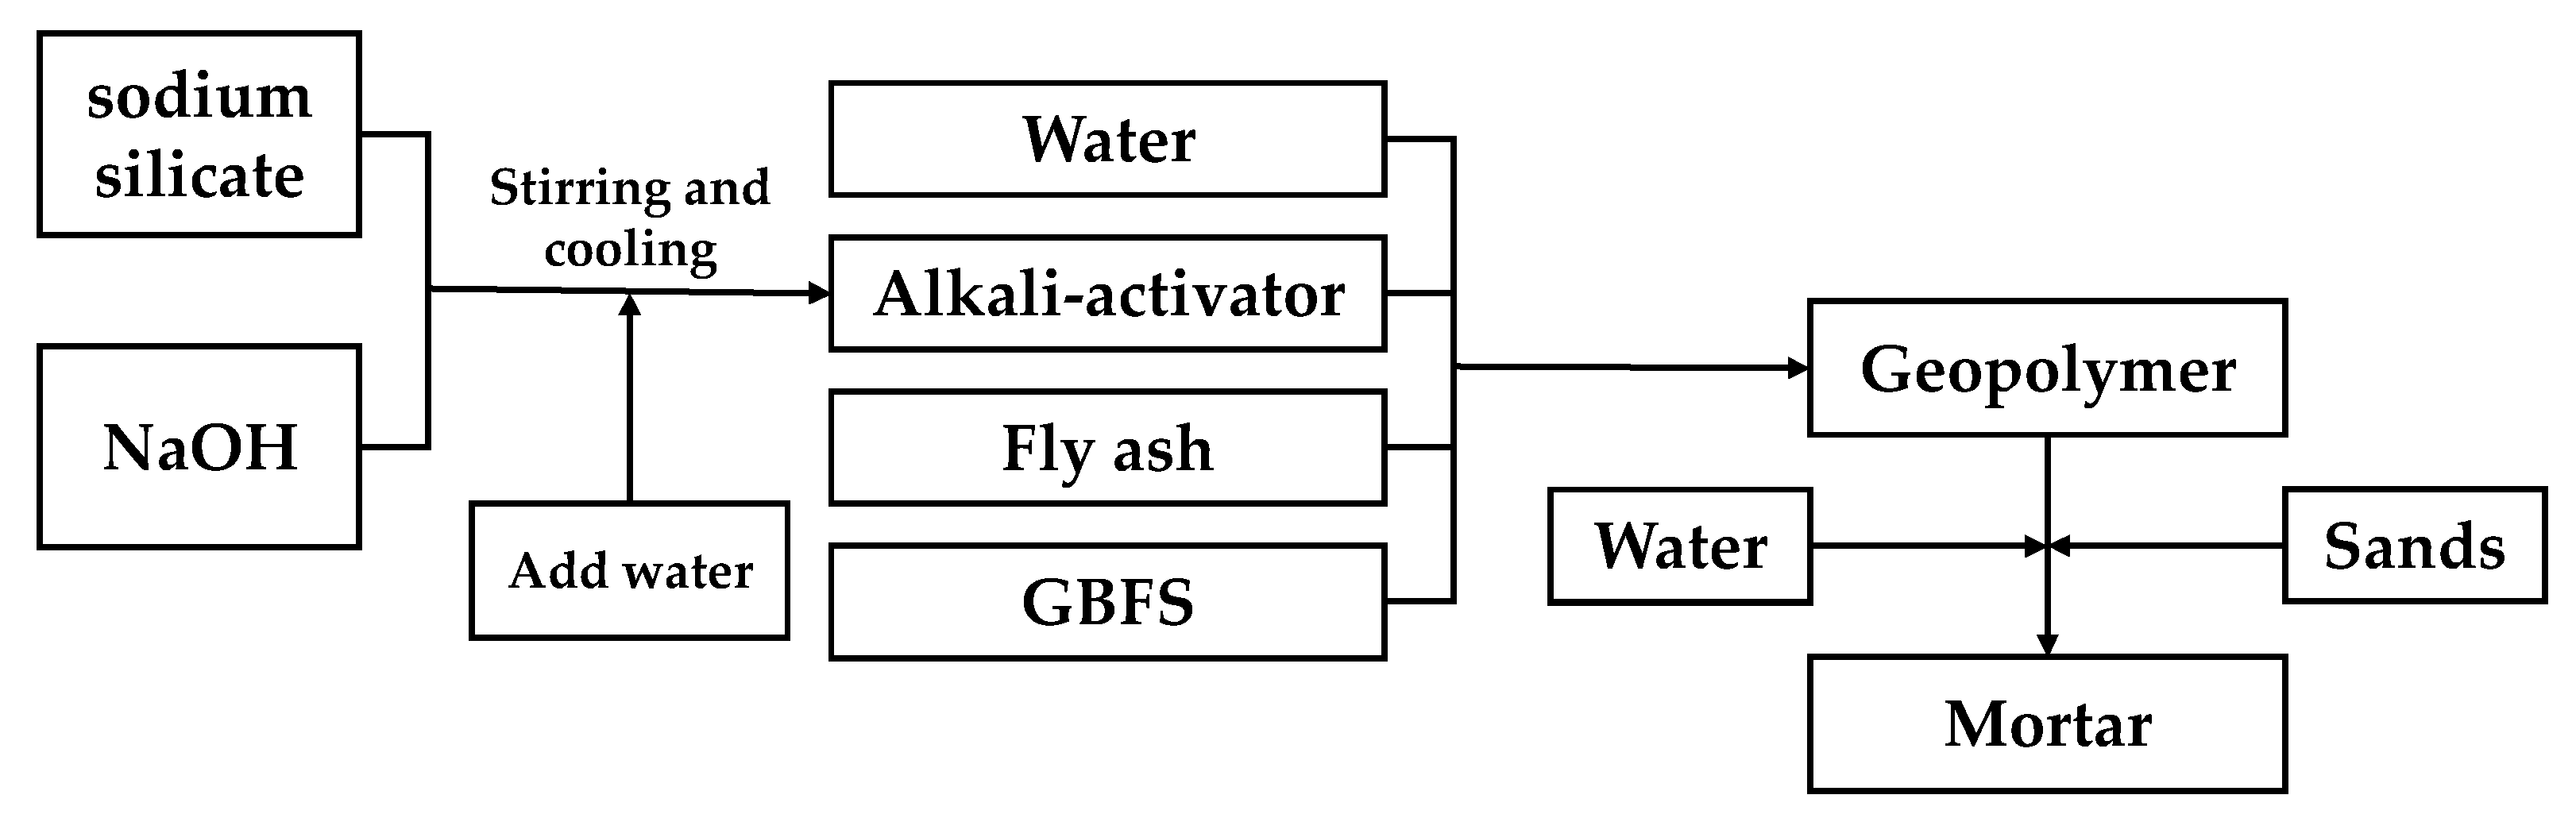
2.2.1. Preparation Procedure of Fly Ash-Based Geopolymer Mortar
2.2.2. Fluidity Property Tests
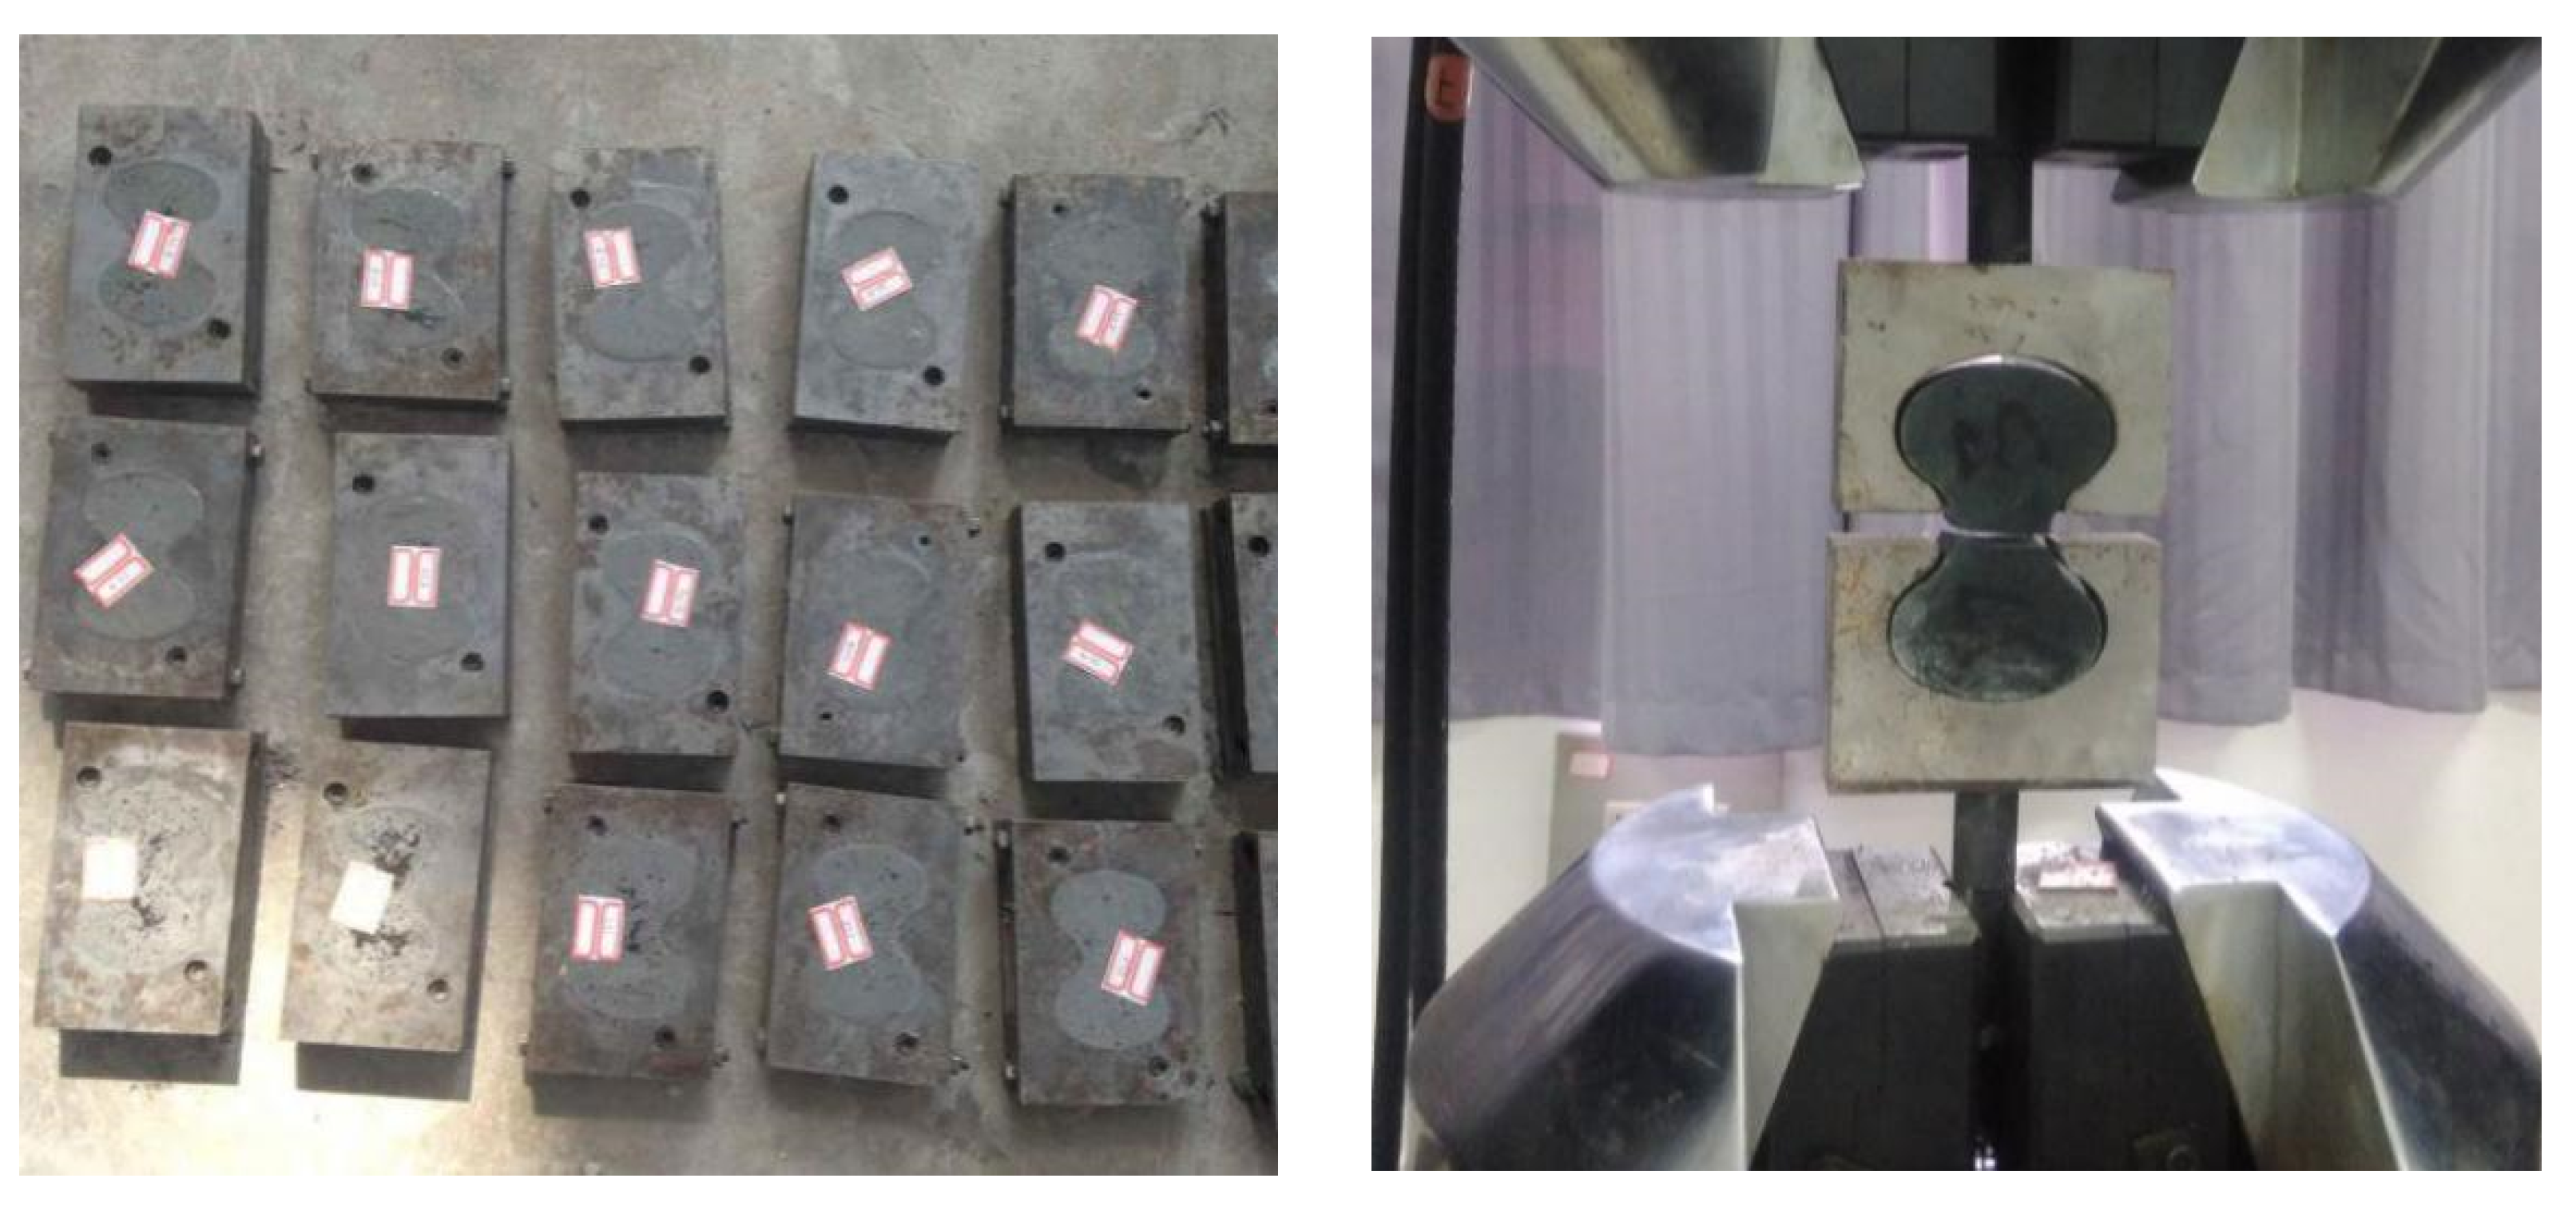
2.2.3. Mechanical Performance Tests
2.2.4. Specific Surface Area Tests
2.2.5. Voidage Tests
2.2.6. Scanning Electron Microscope Observation
2.2.7. X-ray Diffraction Tests
2.2.8. Mix Ratio of Fly Ash-Based Geopolymer Mortar with Standard Sands
2.2.9. Mix Ratio of Fly Ash-Based Geopolymer Mortar with River Sands
3. Results
3.1. Properties of Fly Ash-Based Geopolymer Mortar with Standard Sands
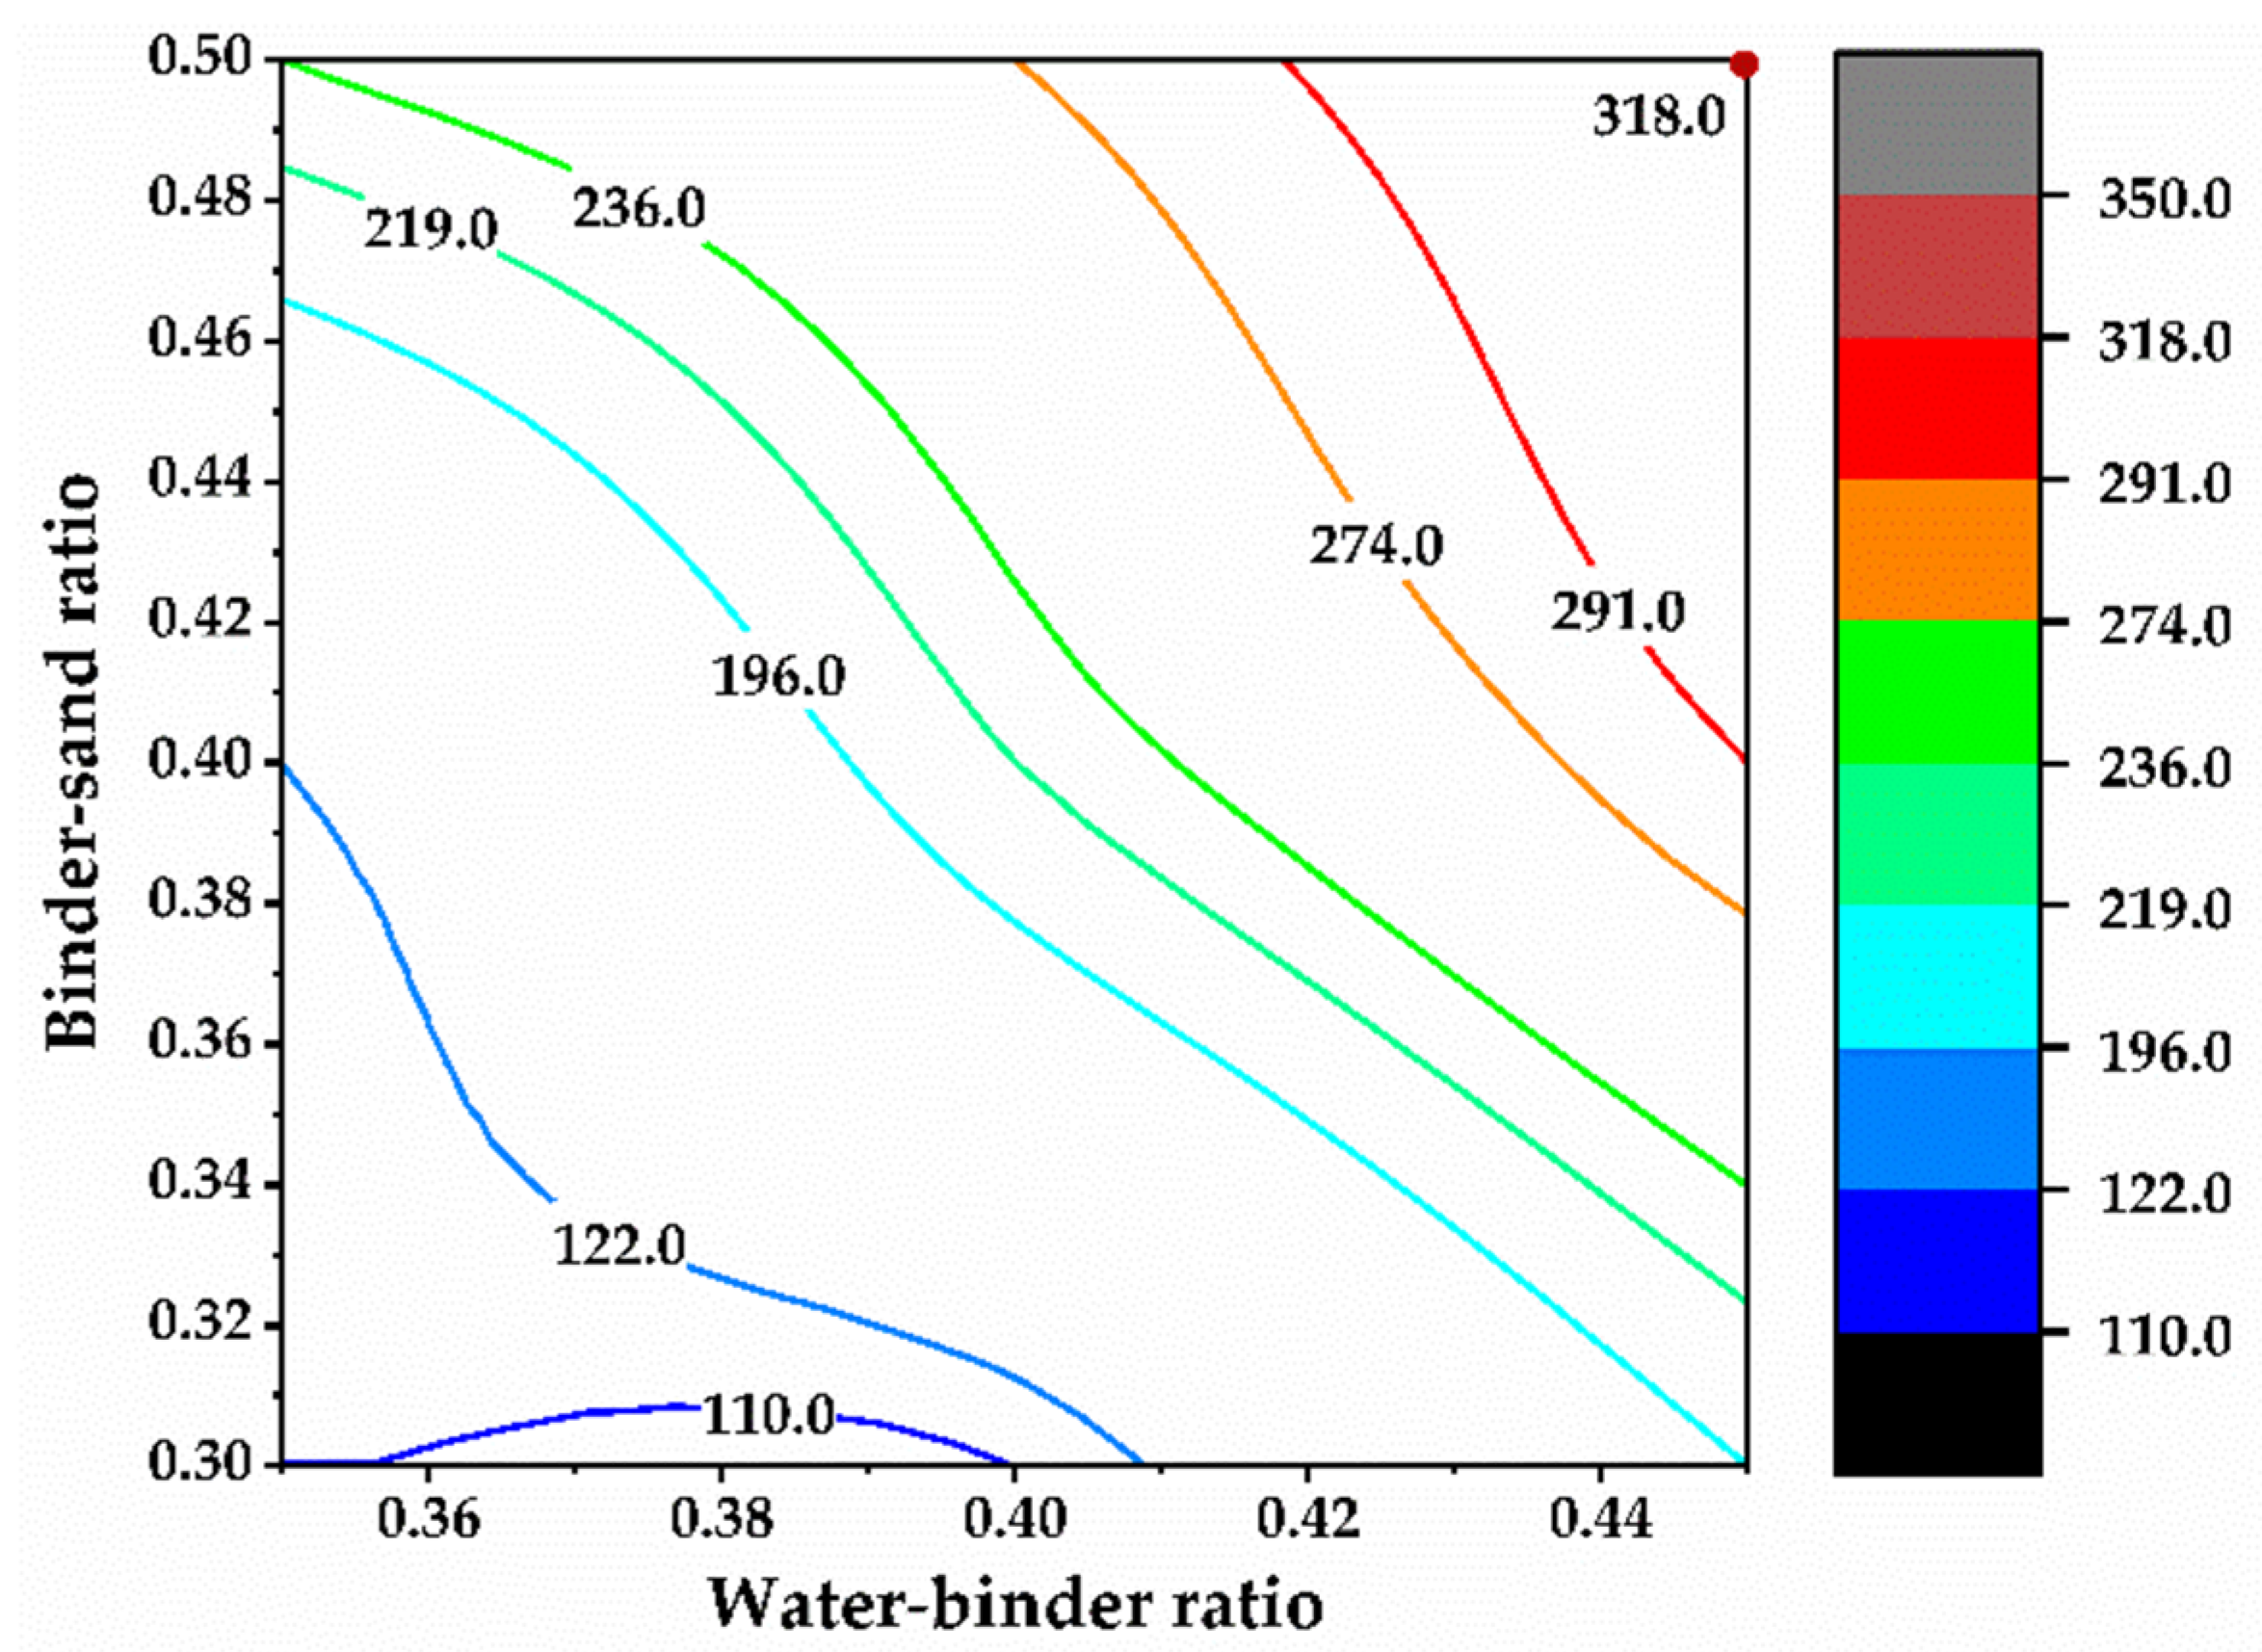
3.1.1. Flow Performance
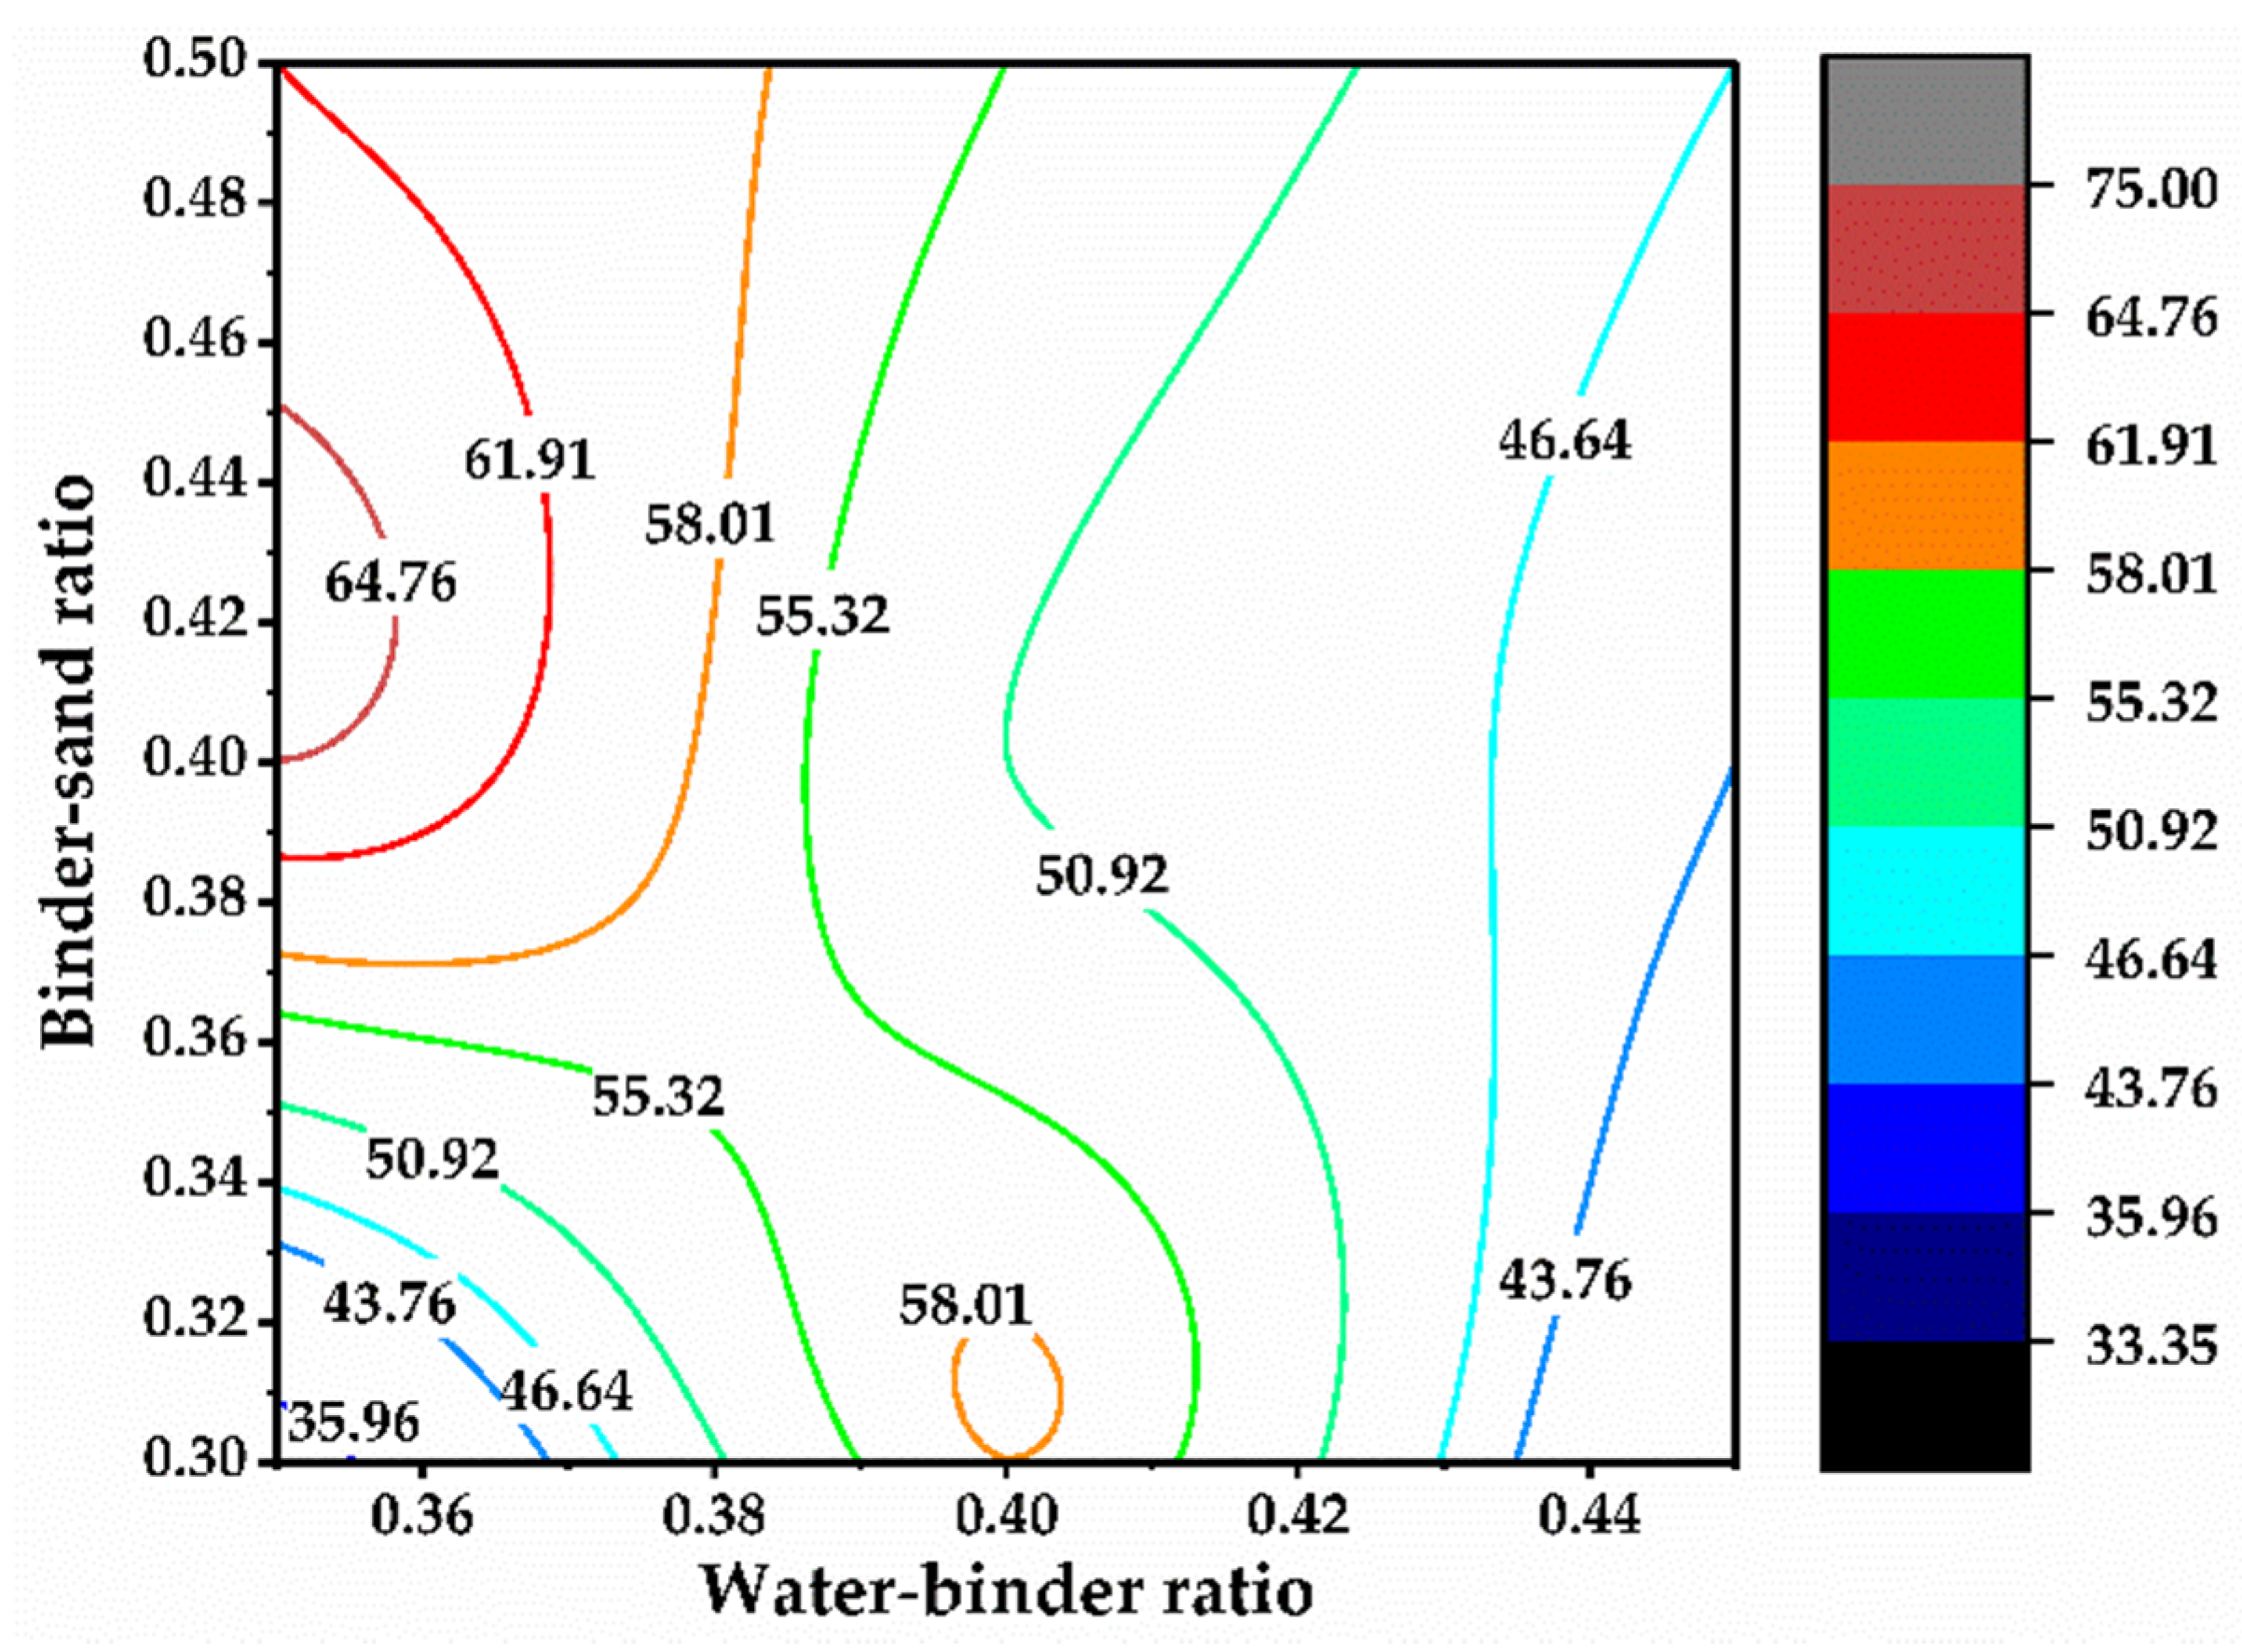
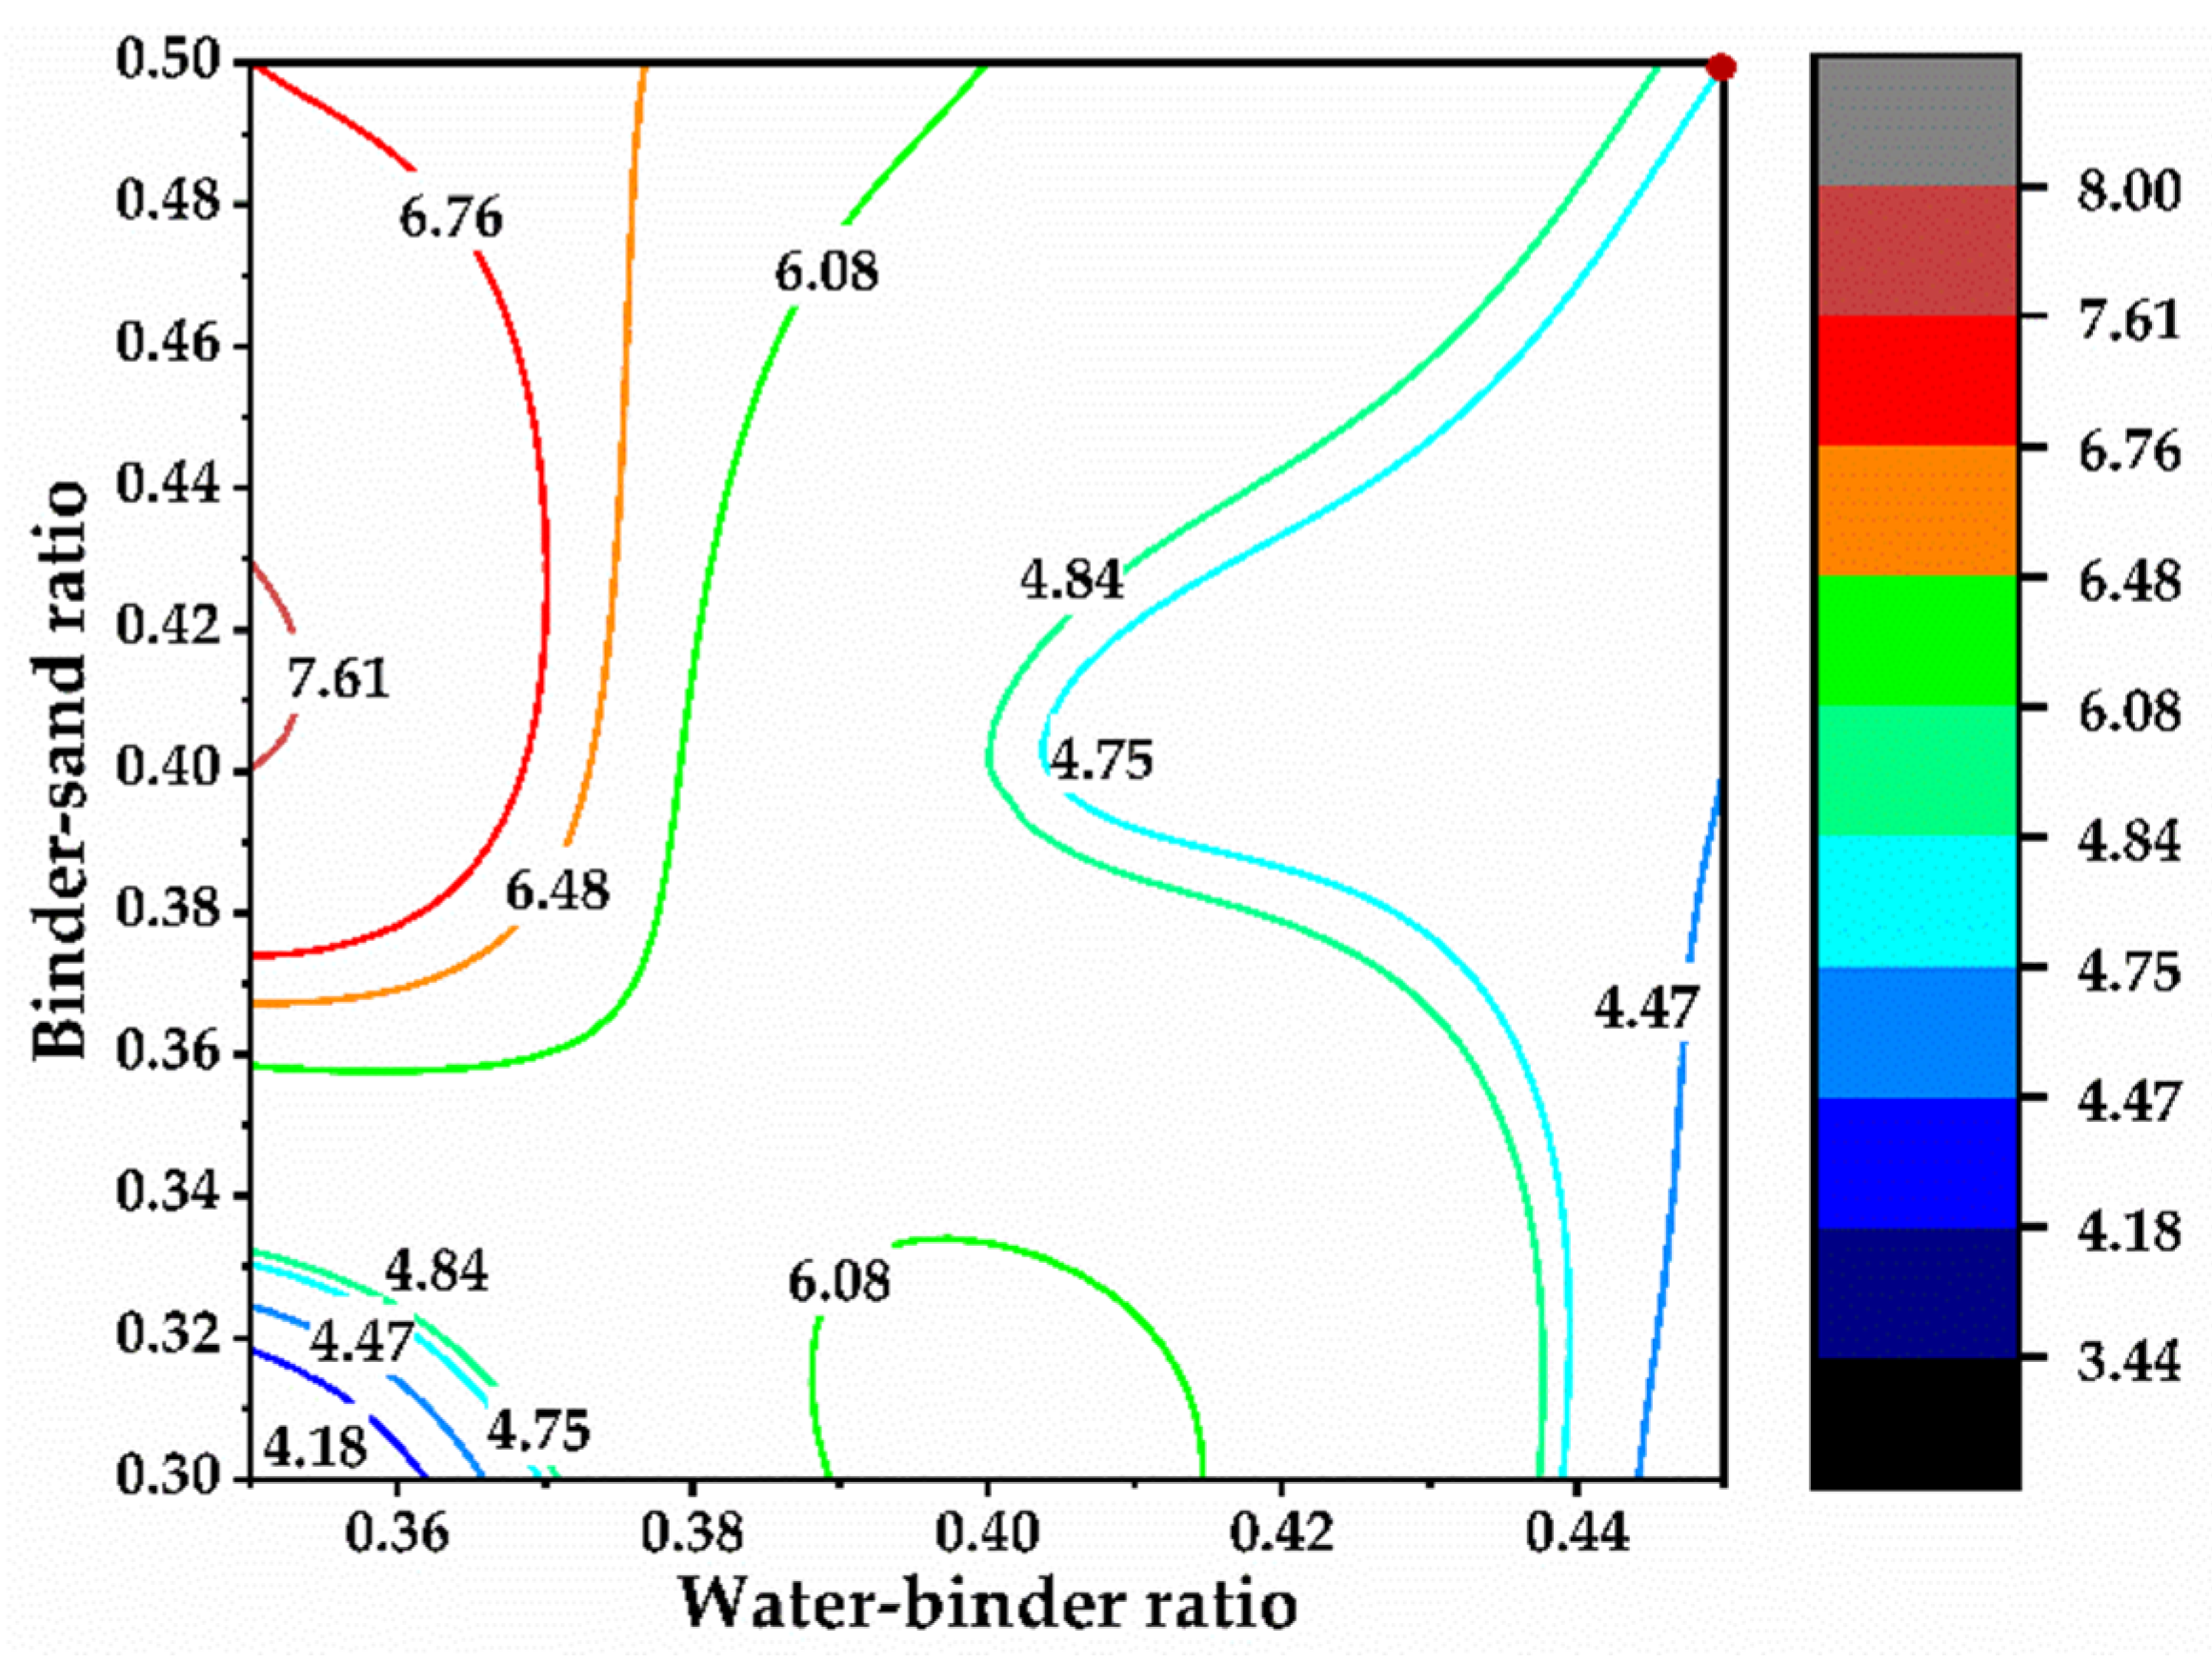
3.1.2. Mechanical Performance
3.2. Influence of River Sands Gradation on Performances of Mortar
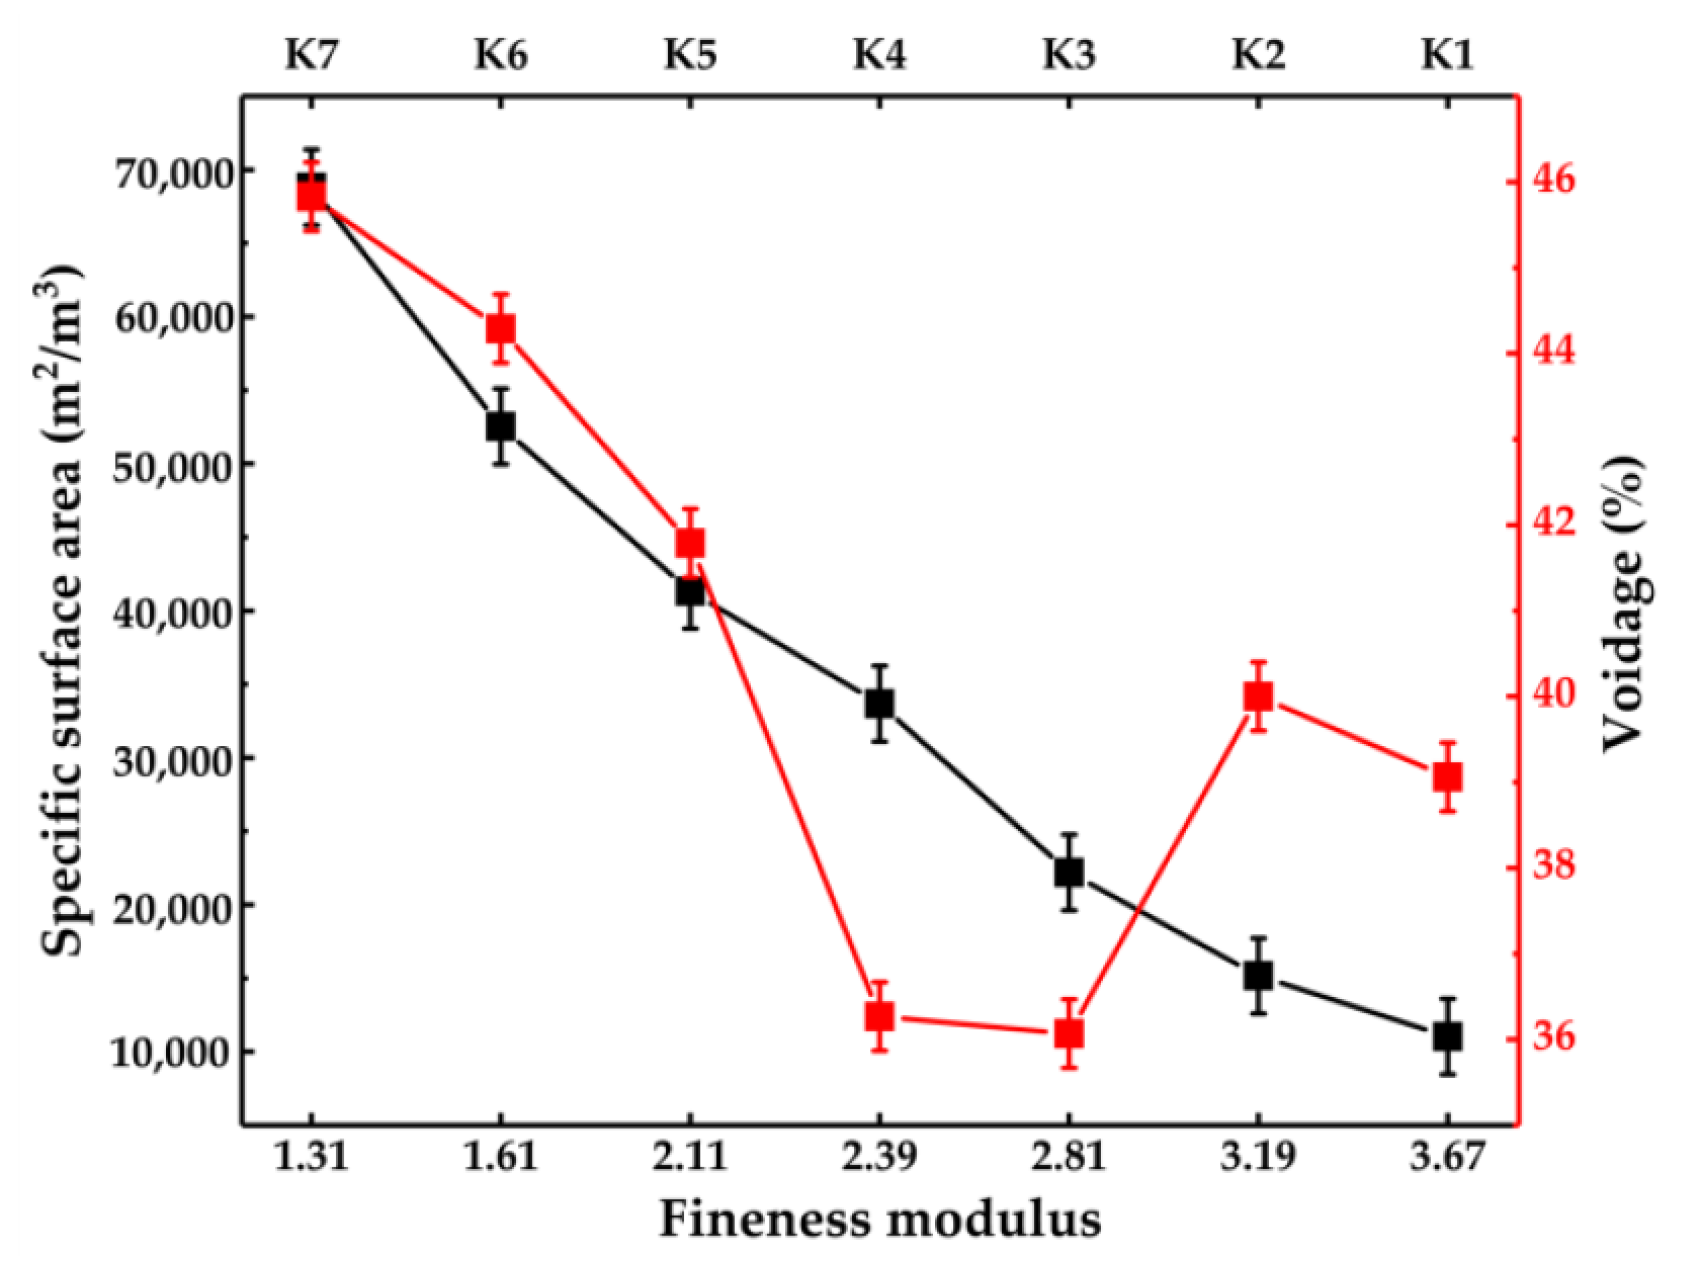
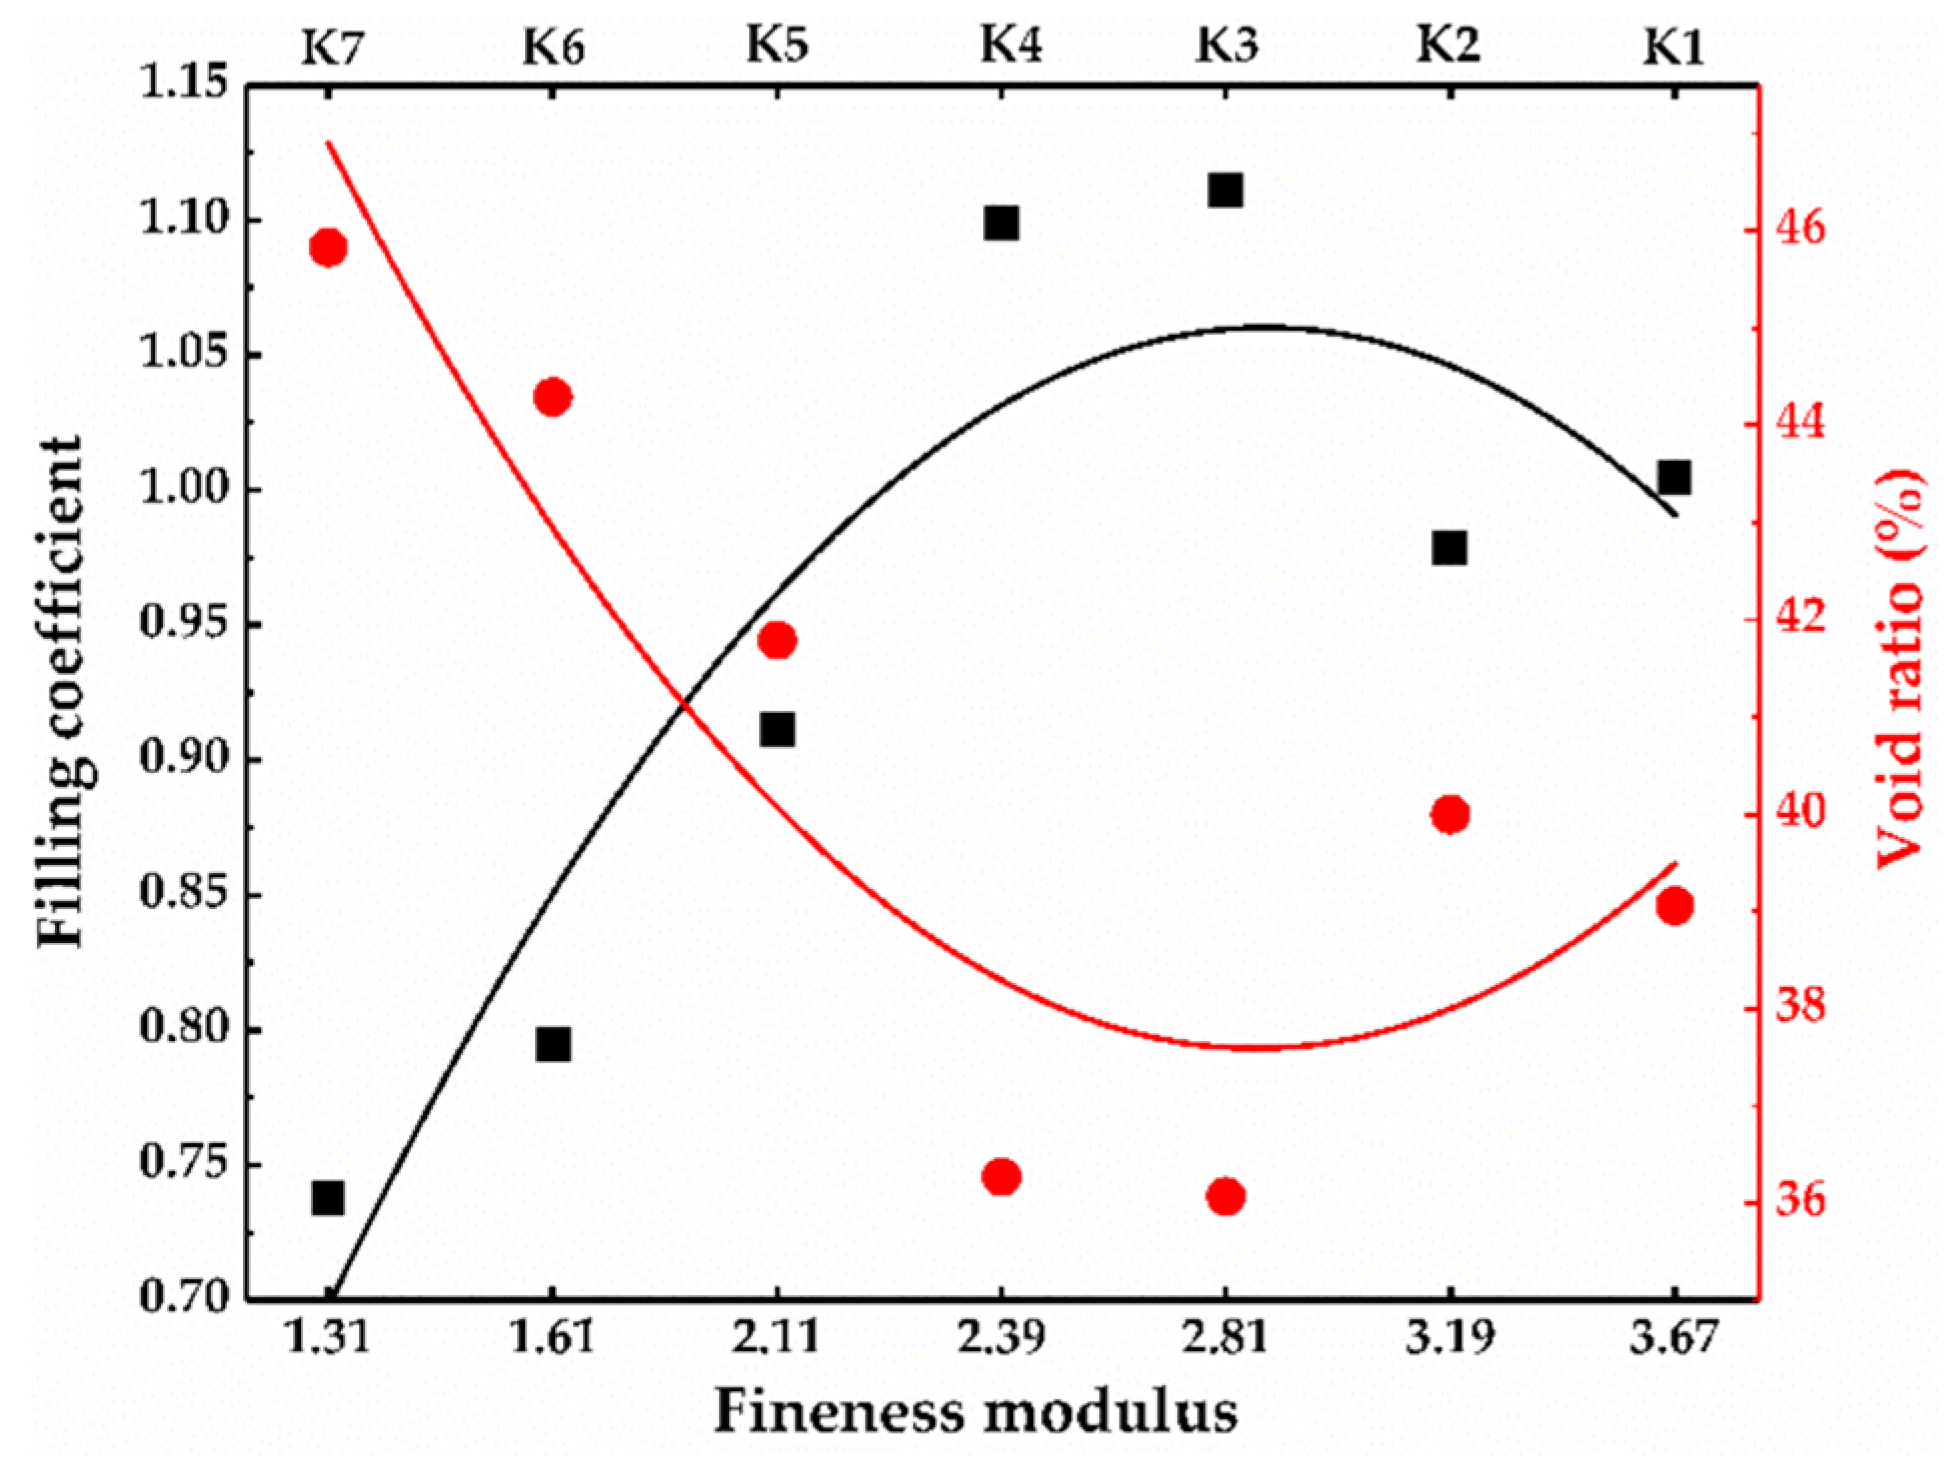
3.2.1. Specific Surface Area and Voidage of River Sands
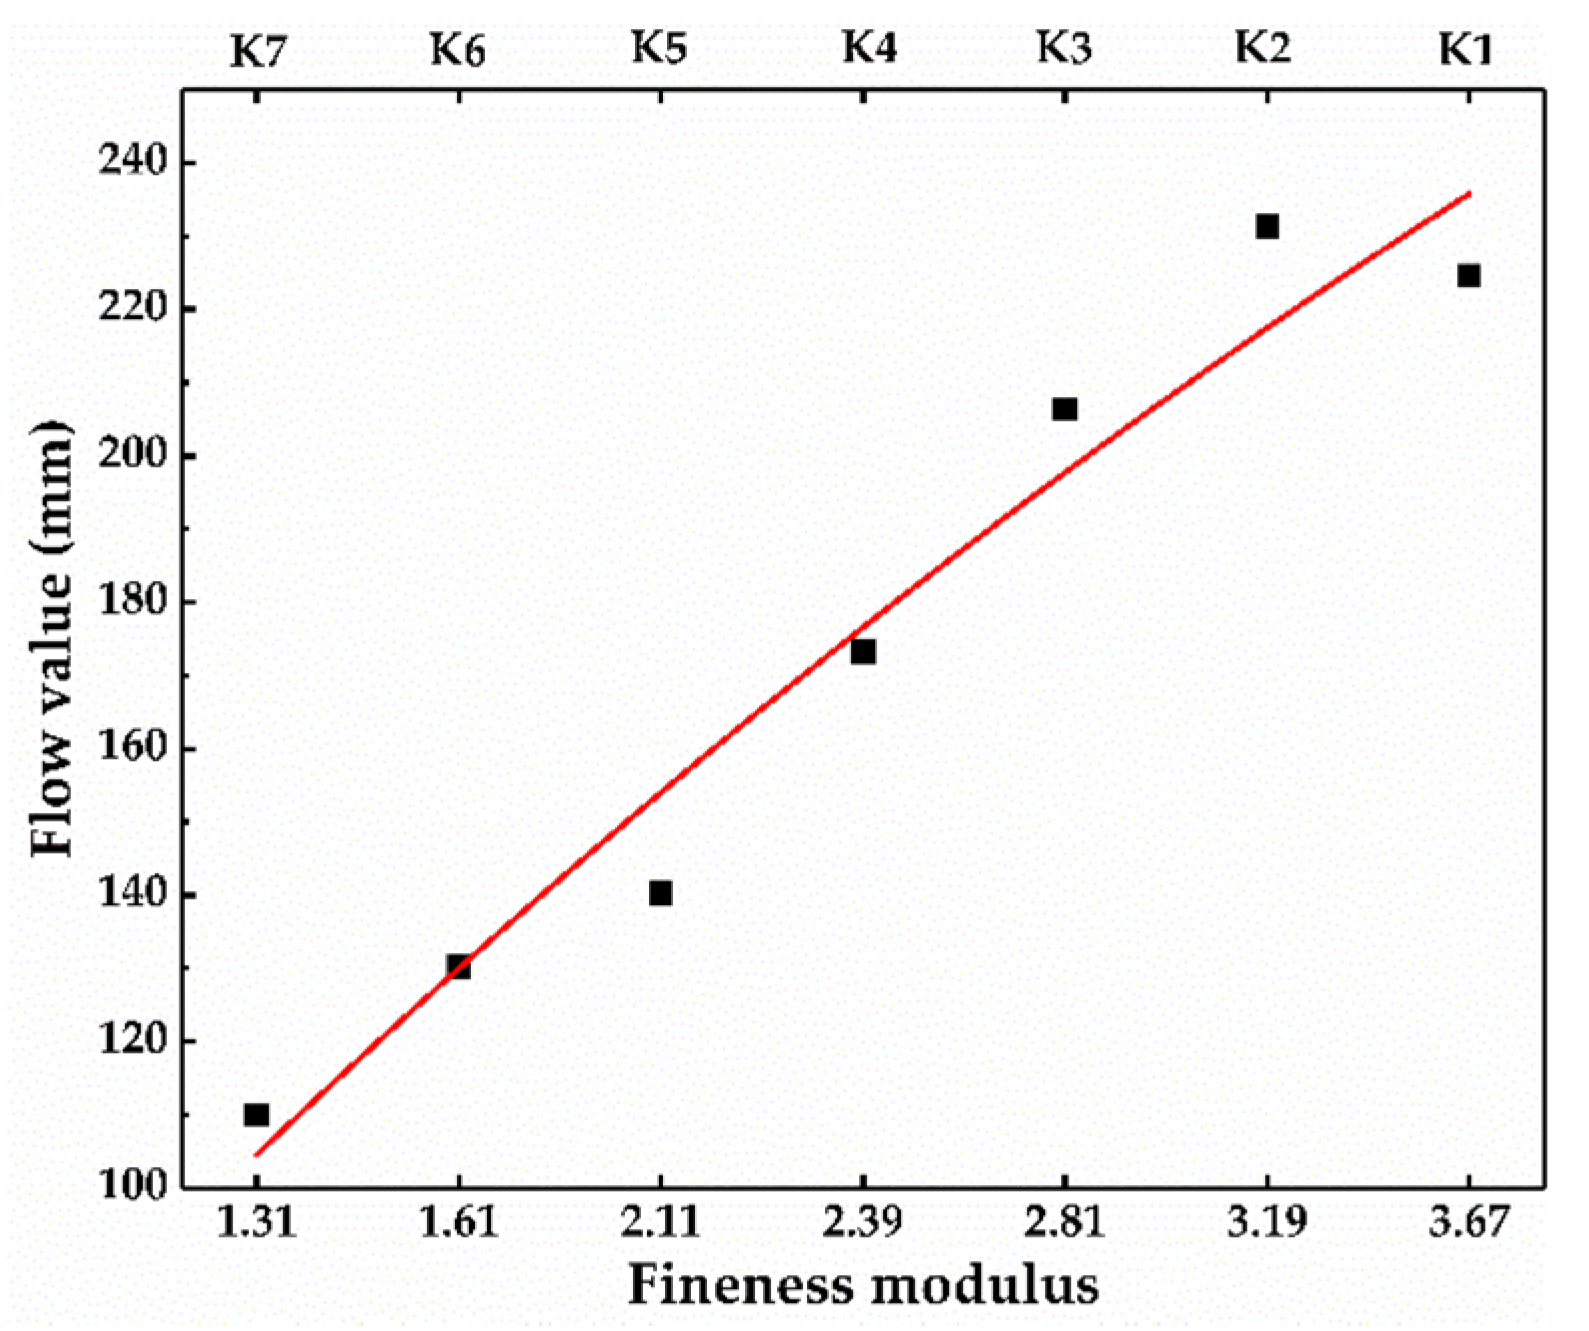
3.2.2. Fluidity
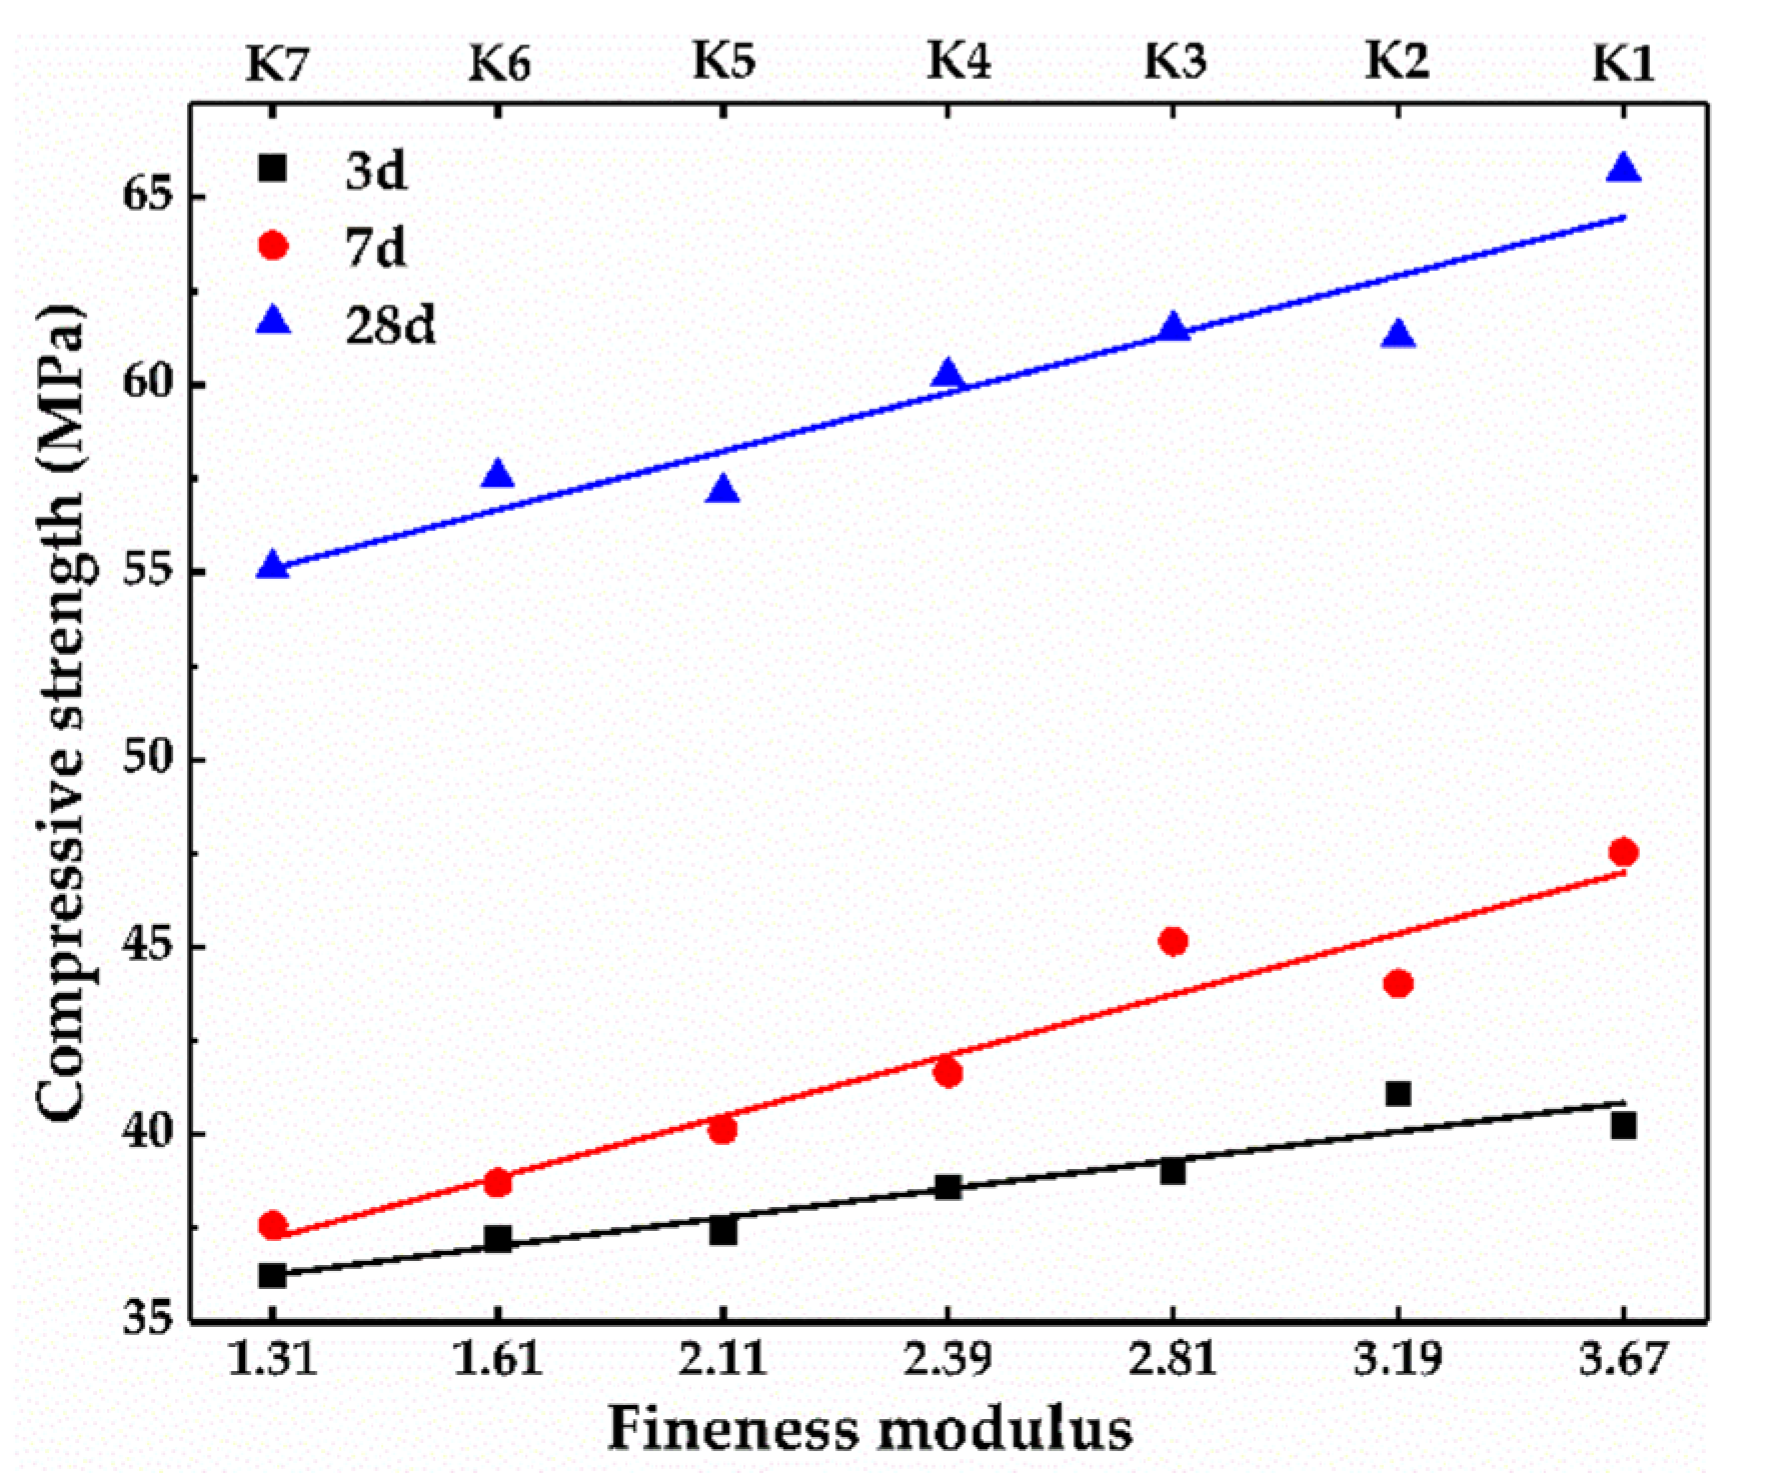
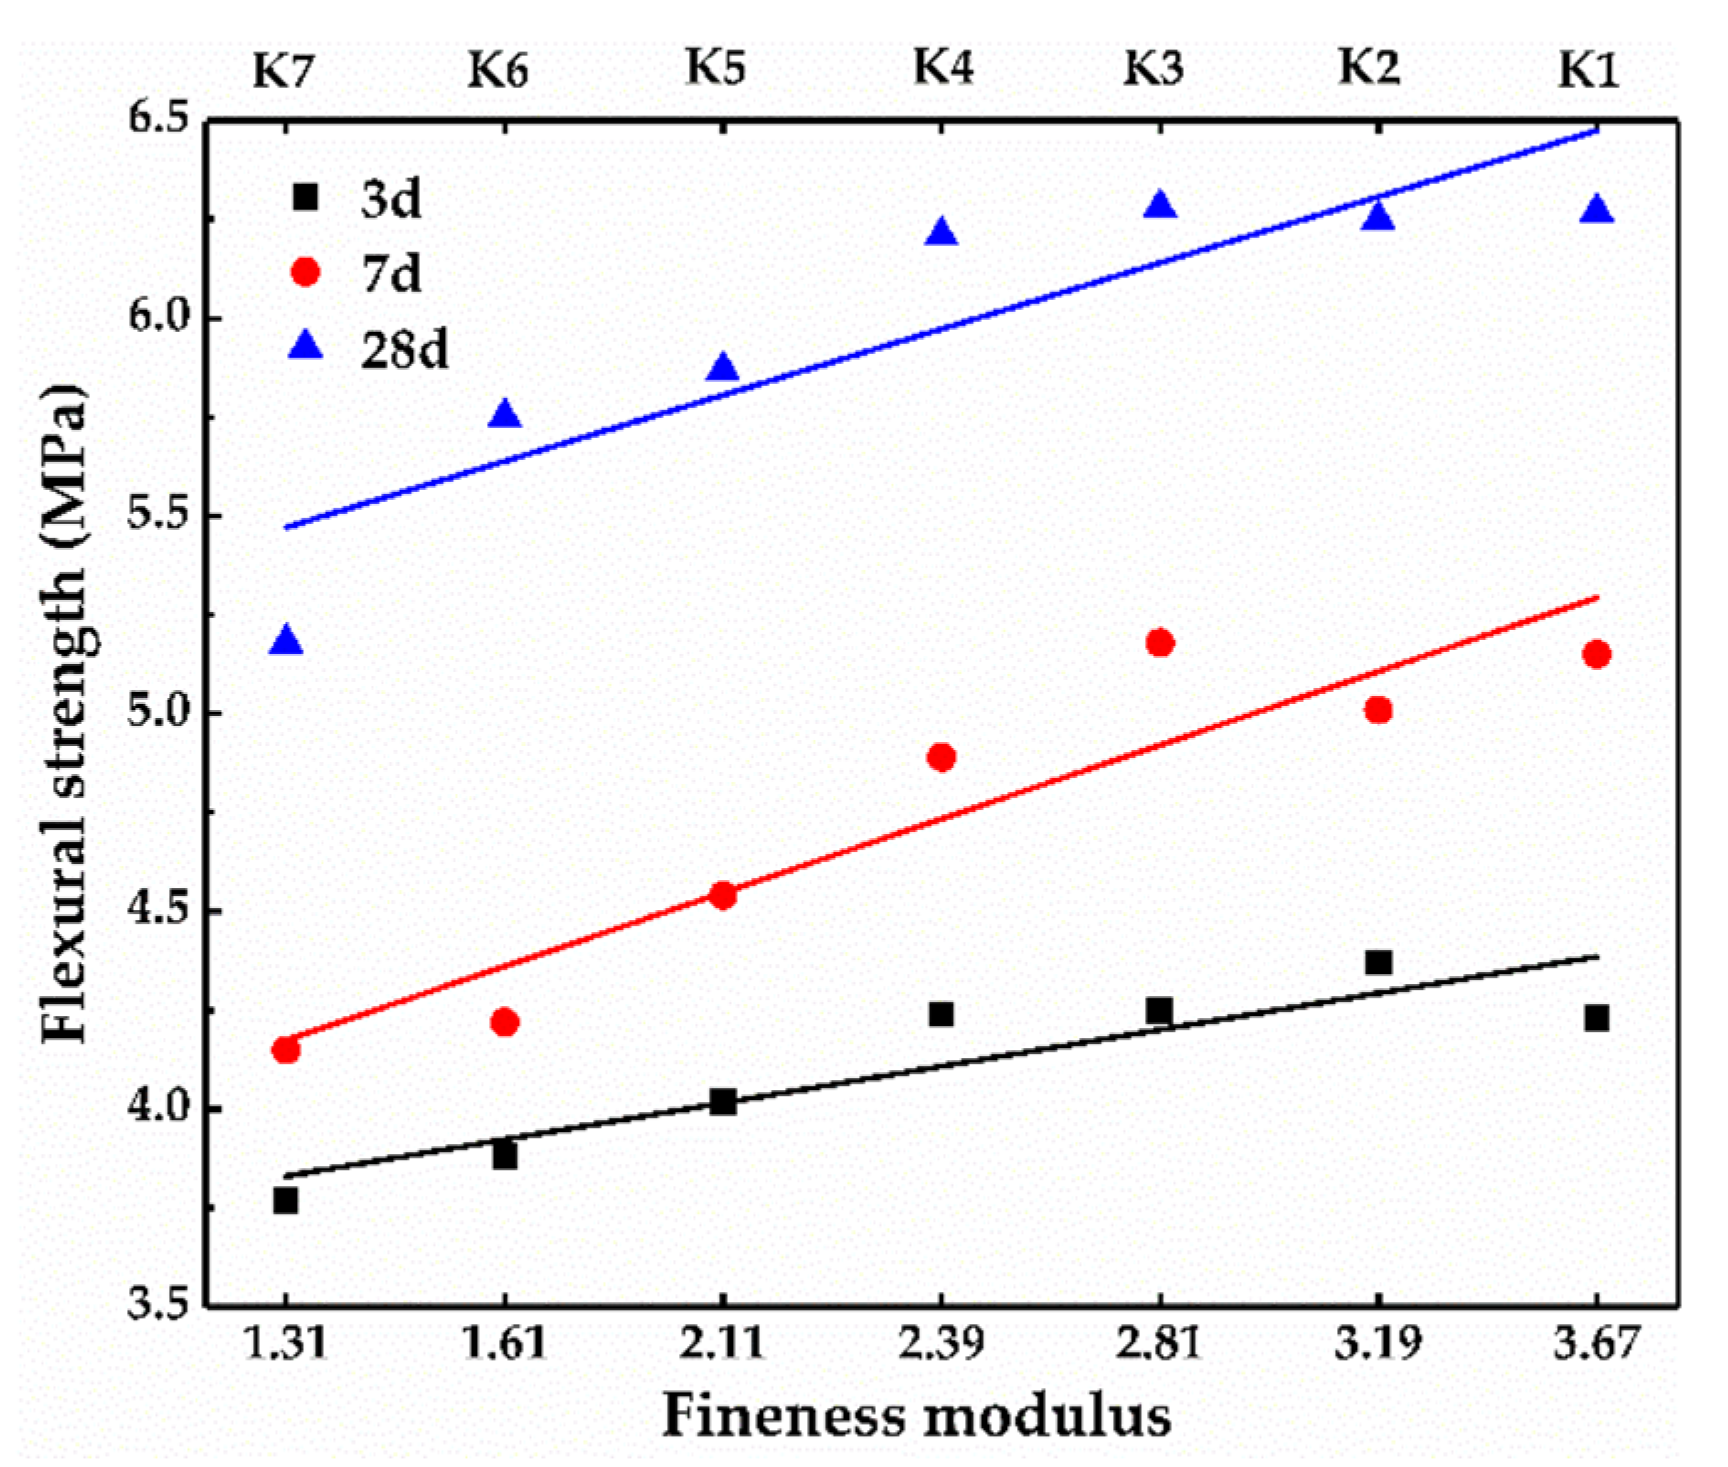
3.2.3. Compressive and Flexural Strength
3.2.4. Flexural Strength (σf)/Compressive Strength (σc) Ratio
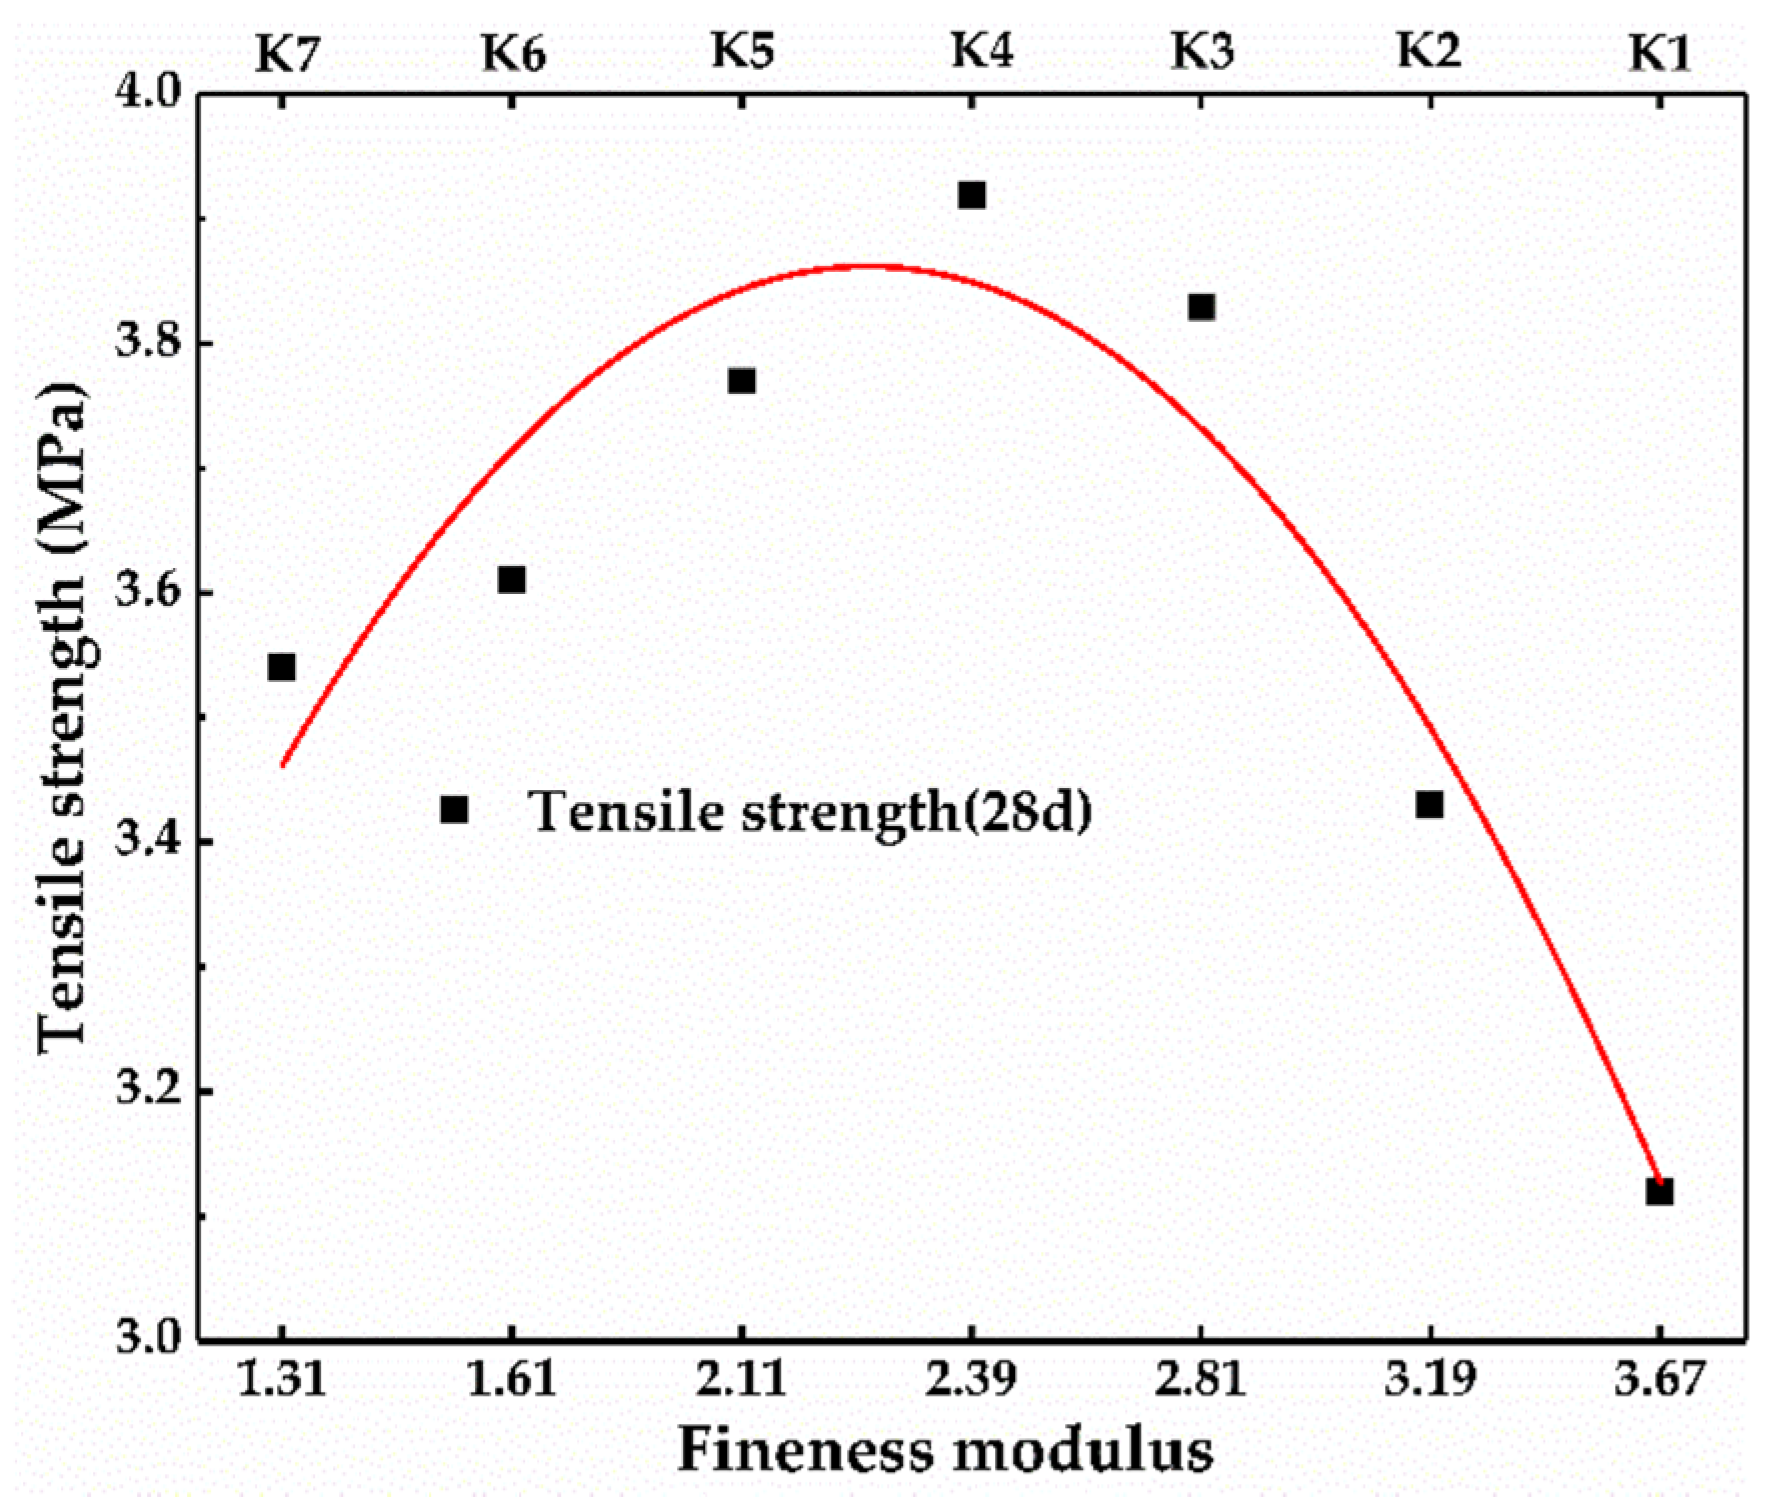
3.2.5. Tensile Strength
4. Discussion
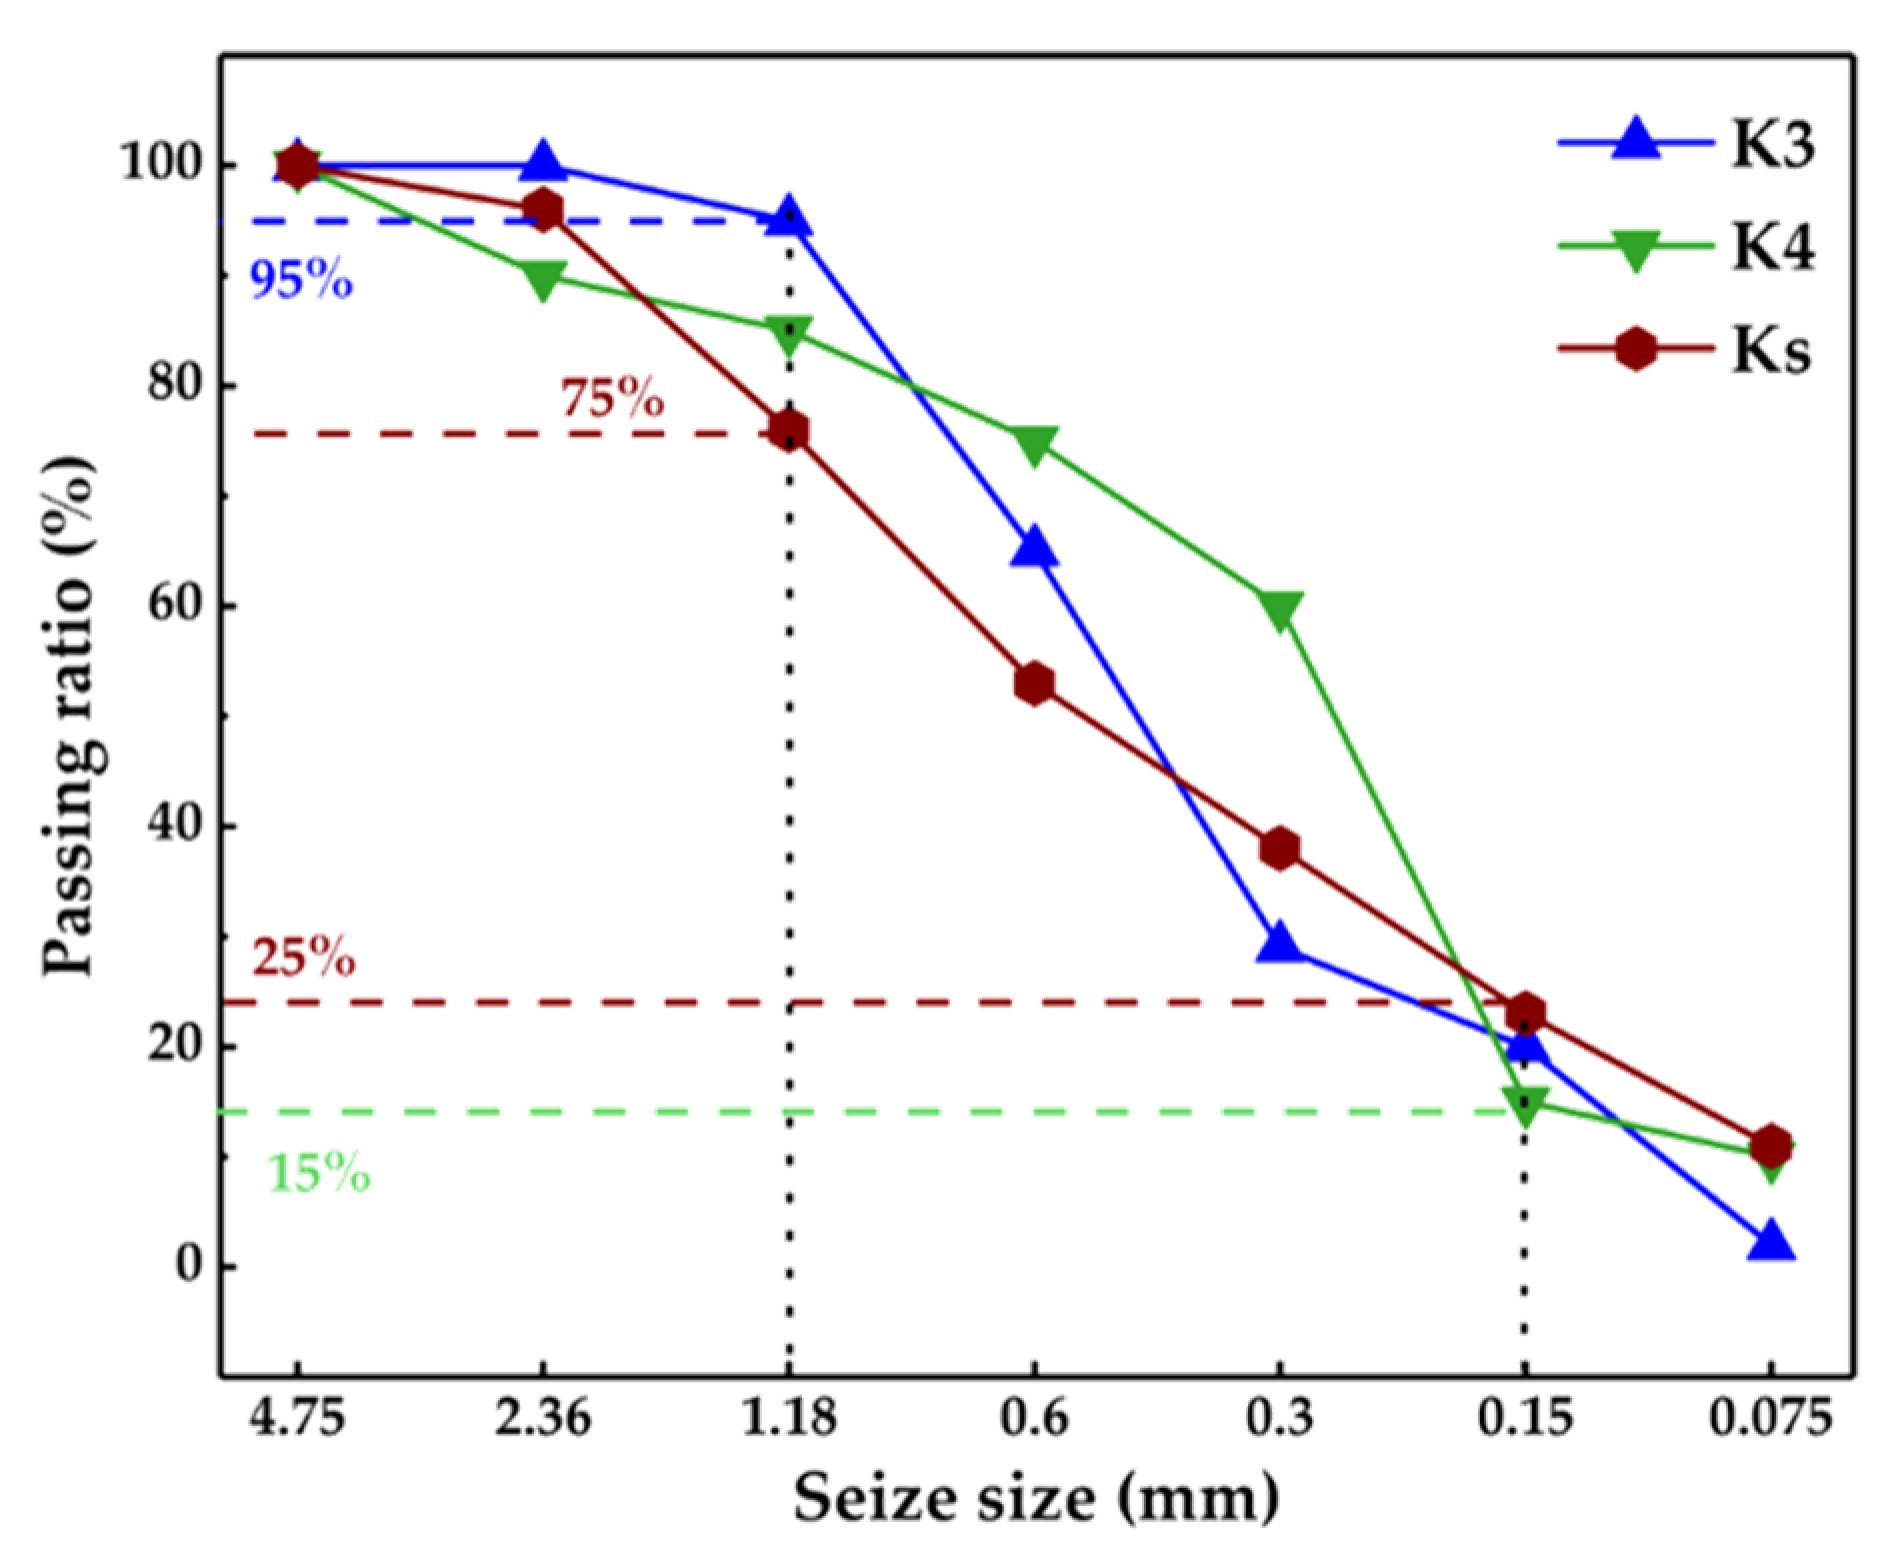
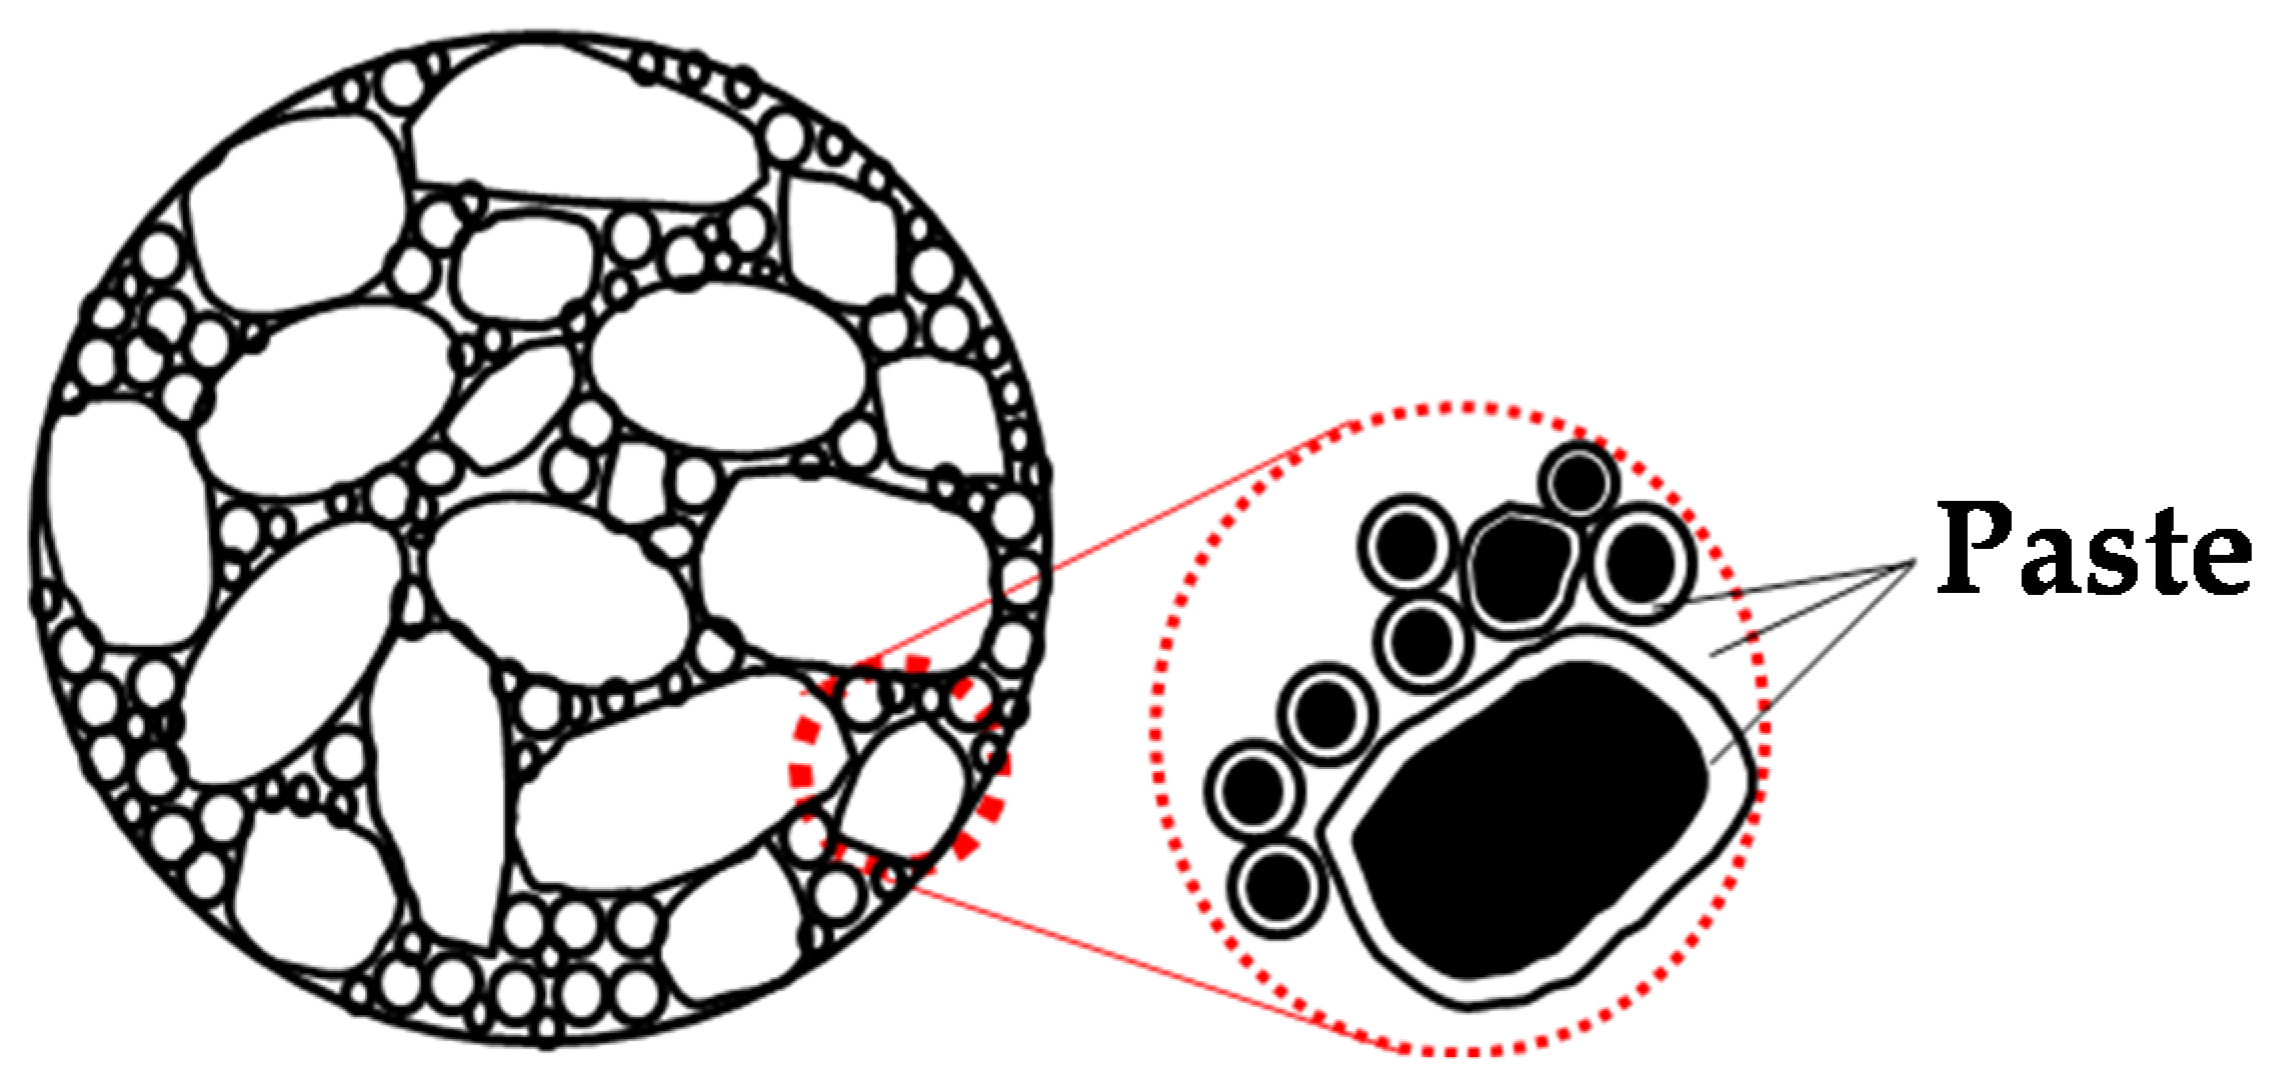
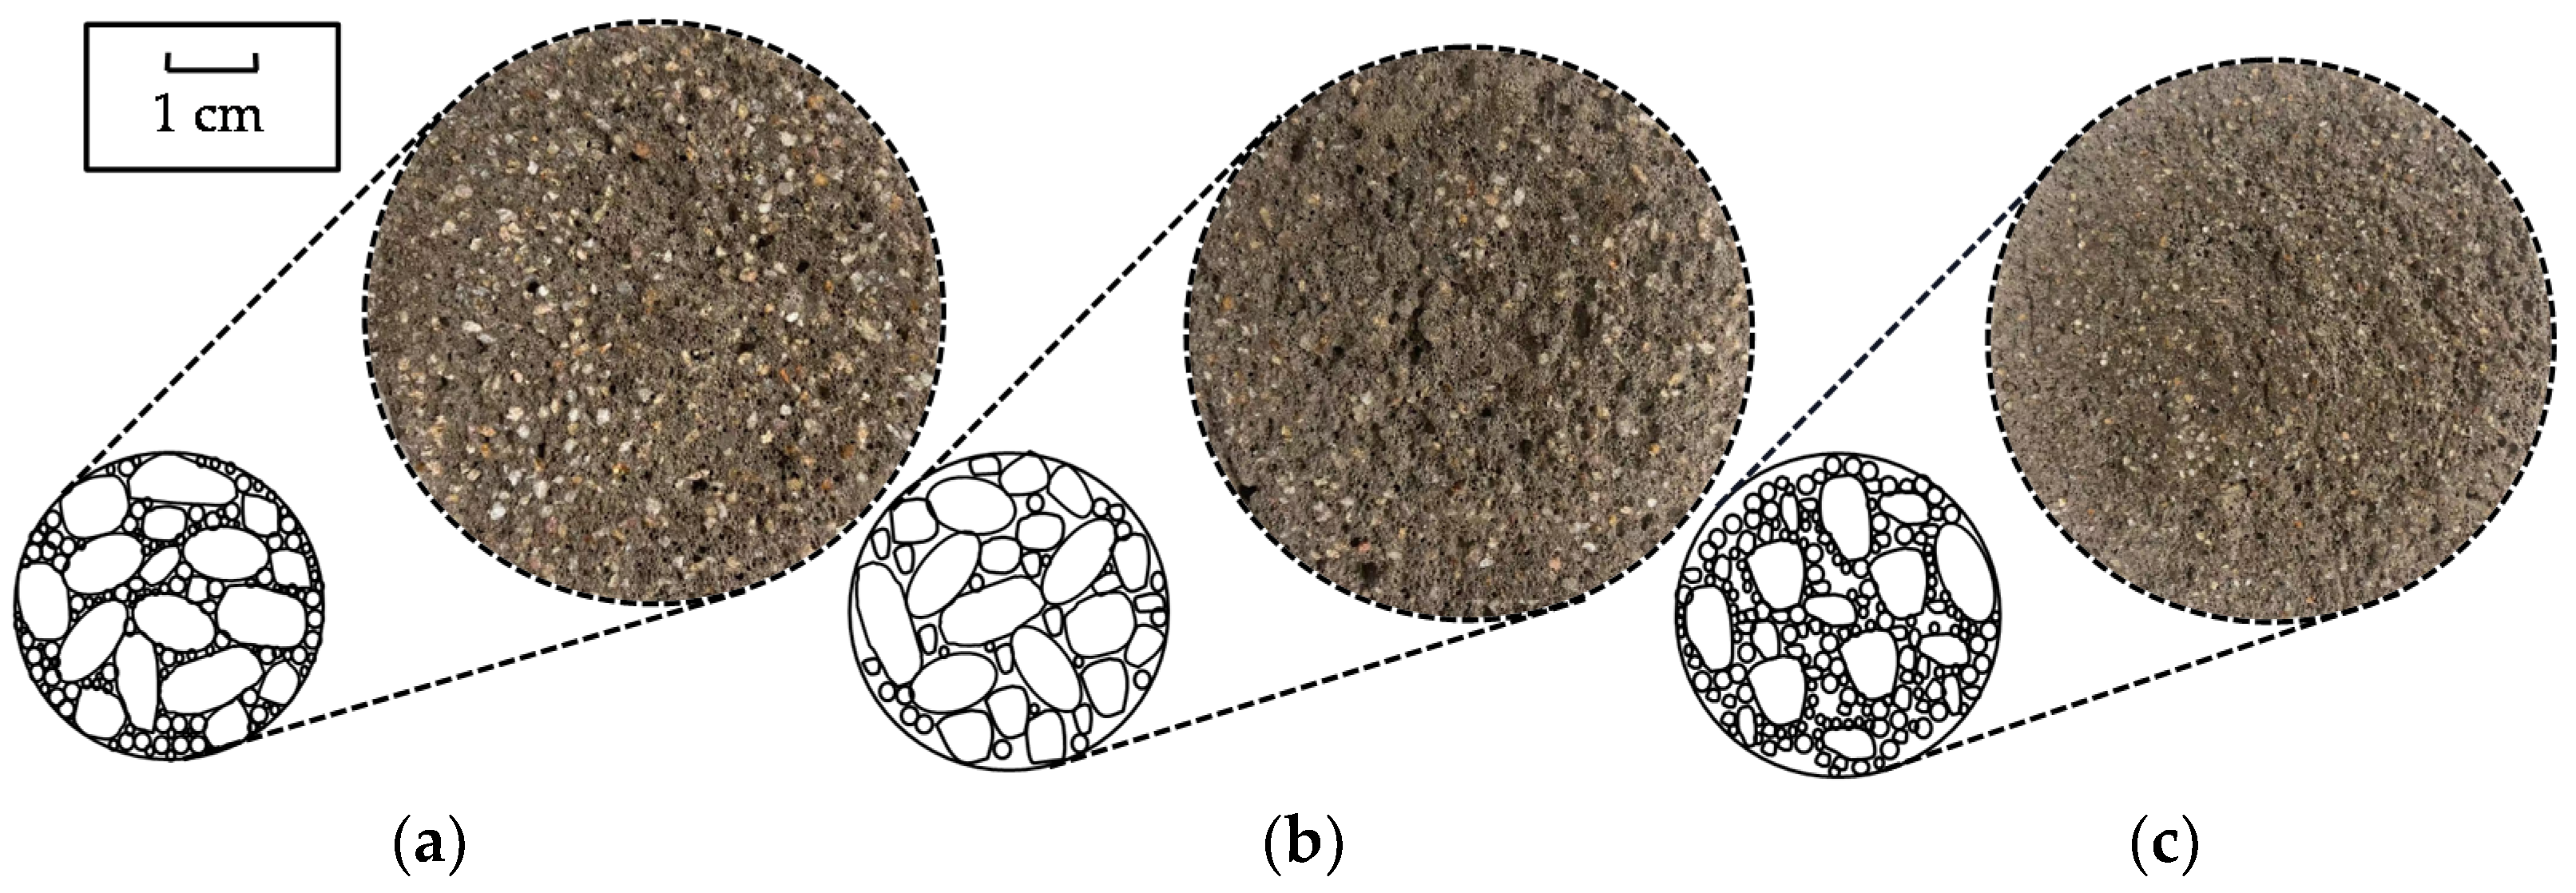
4.1. Classification and Analysis of Packed Sands Structure in Matrix
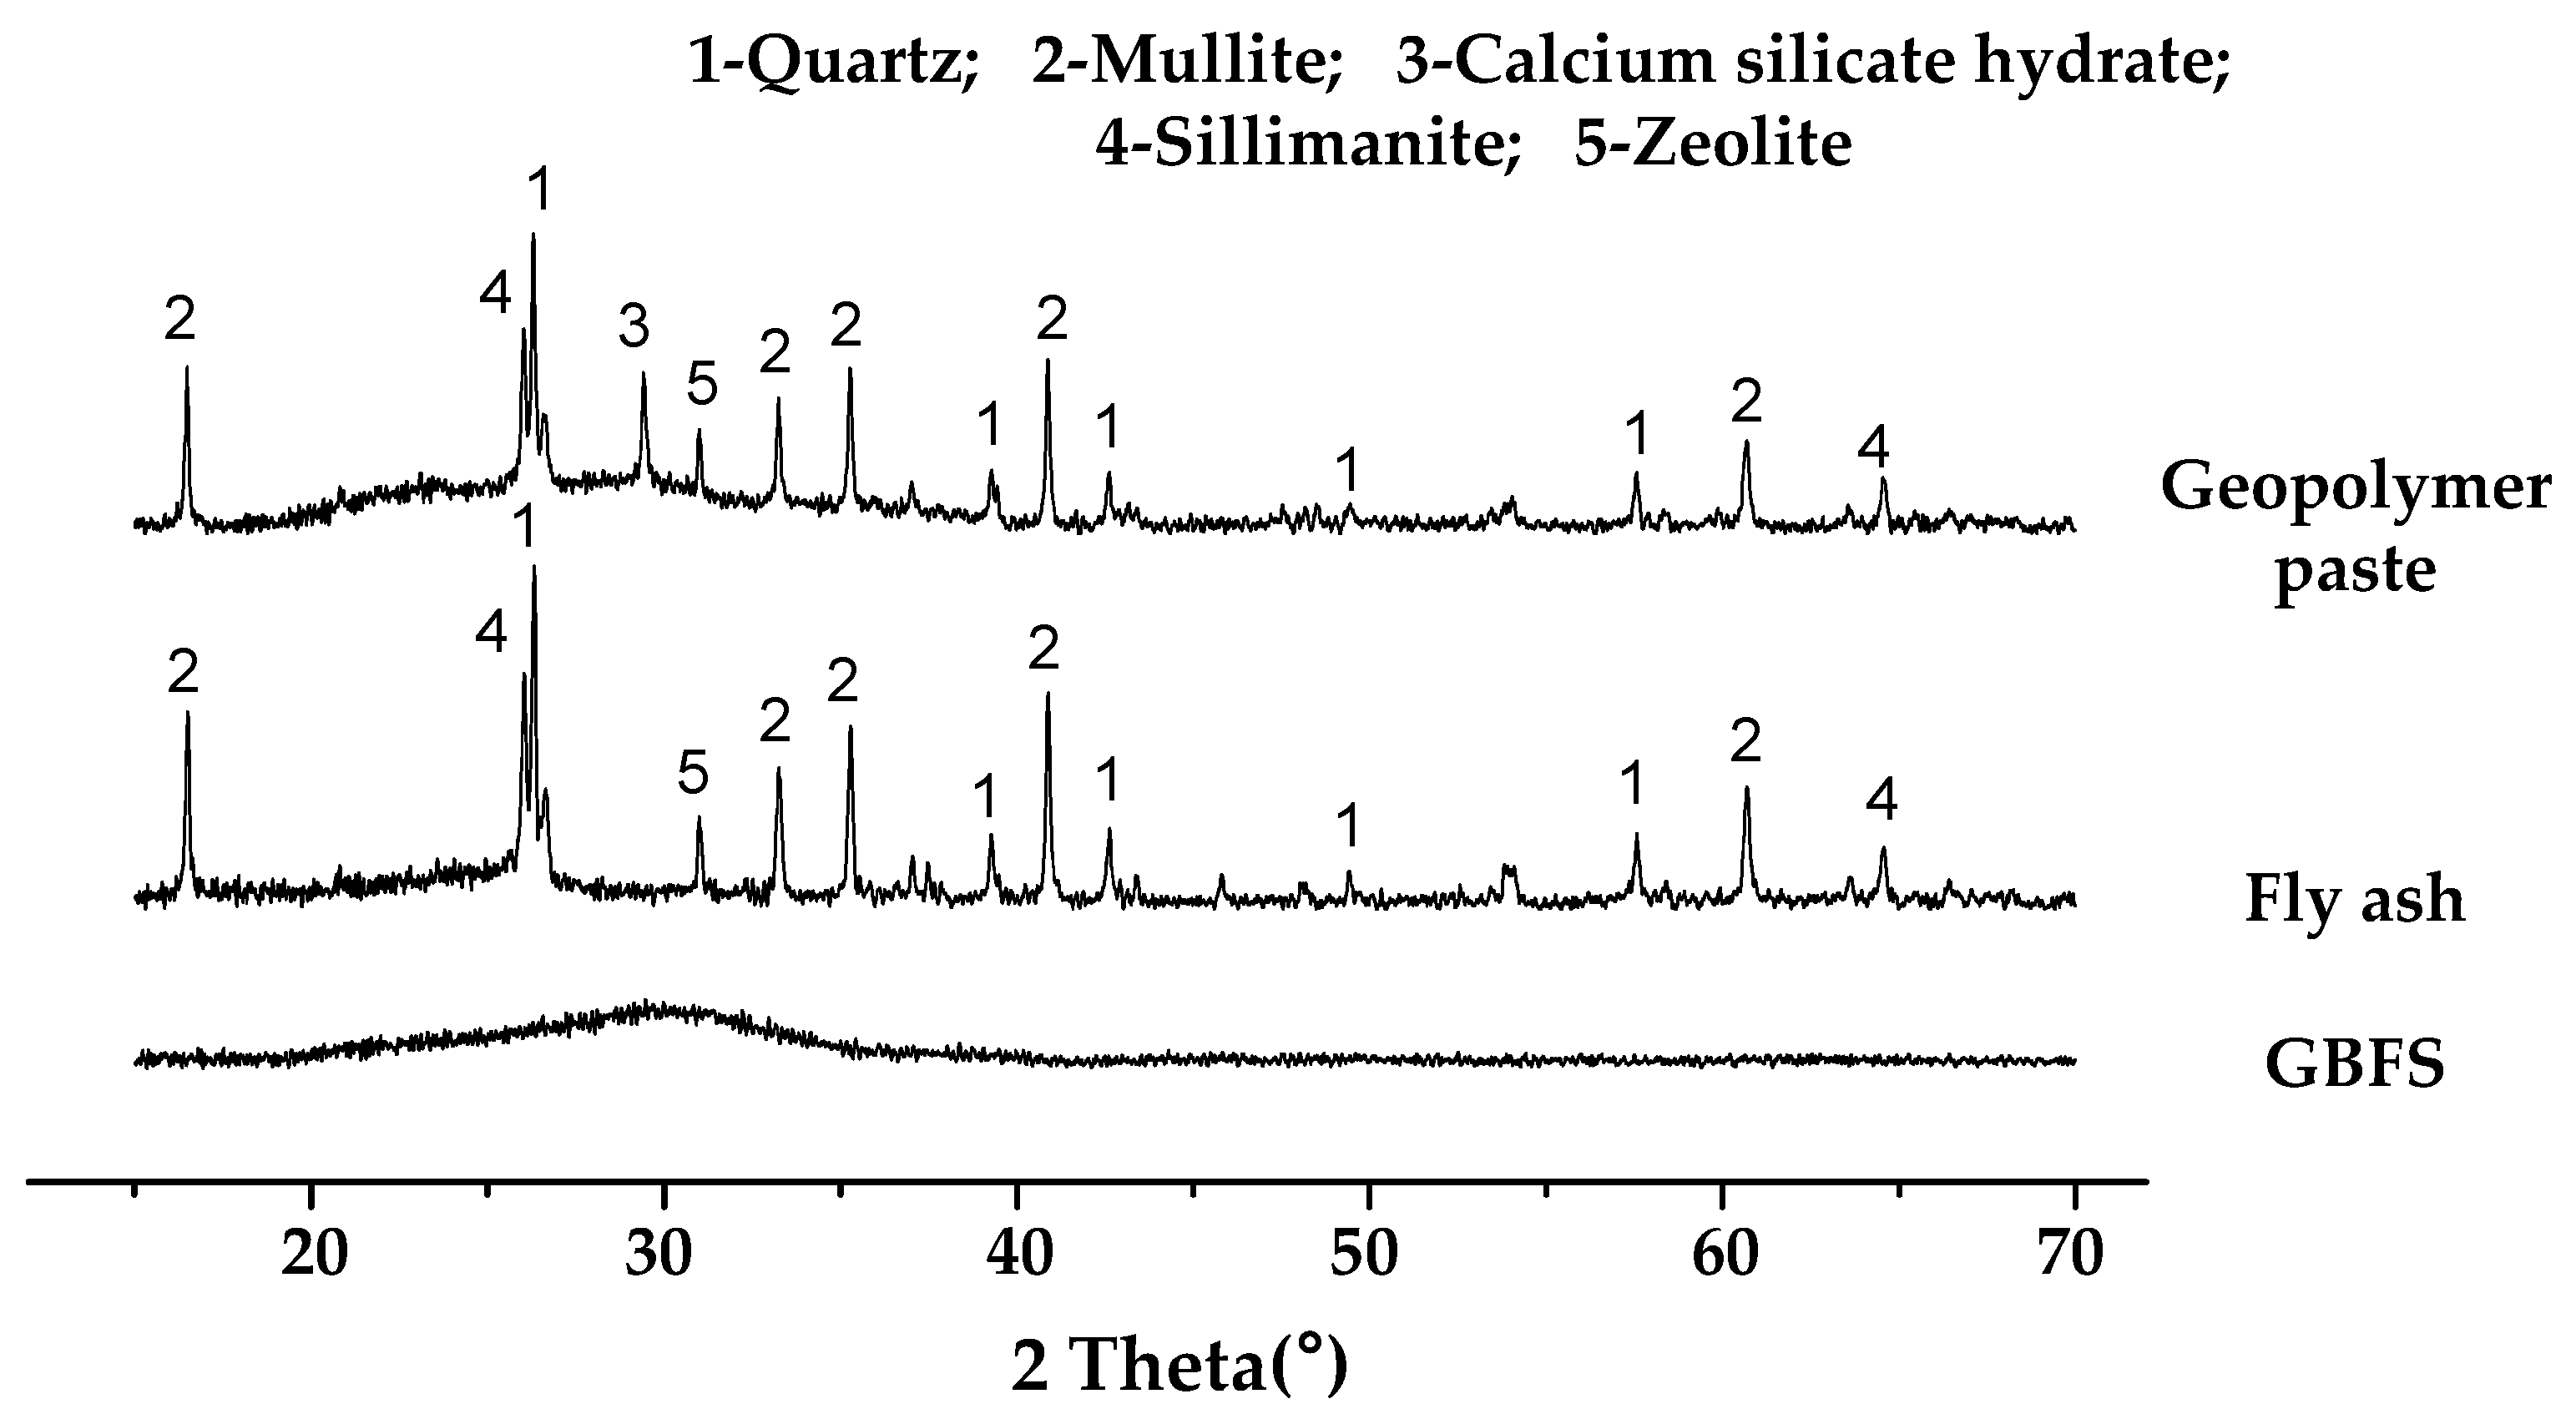
4.2. XRD Analysis
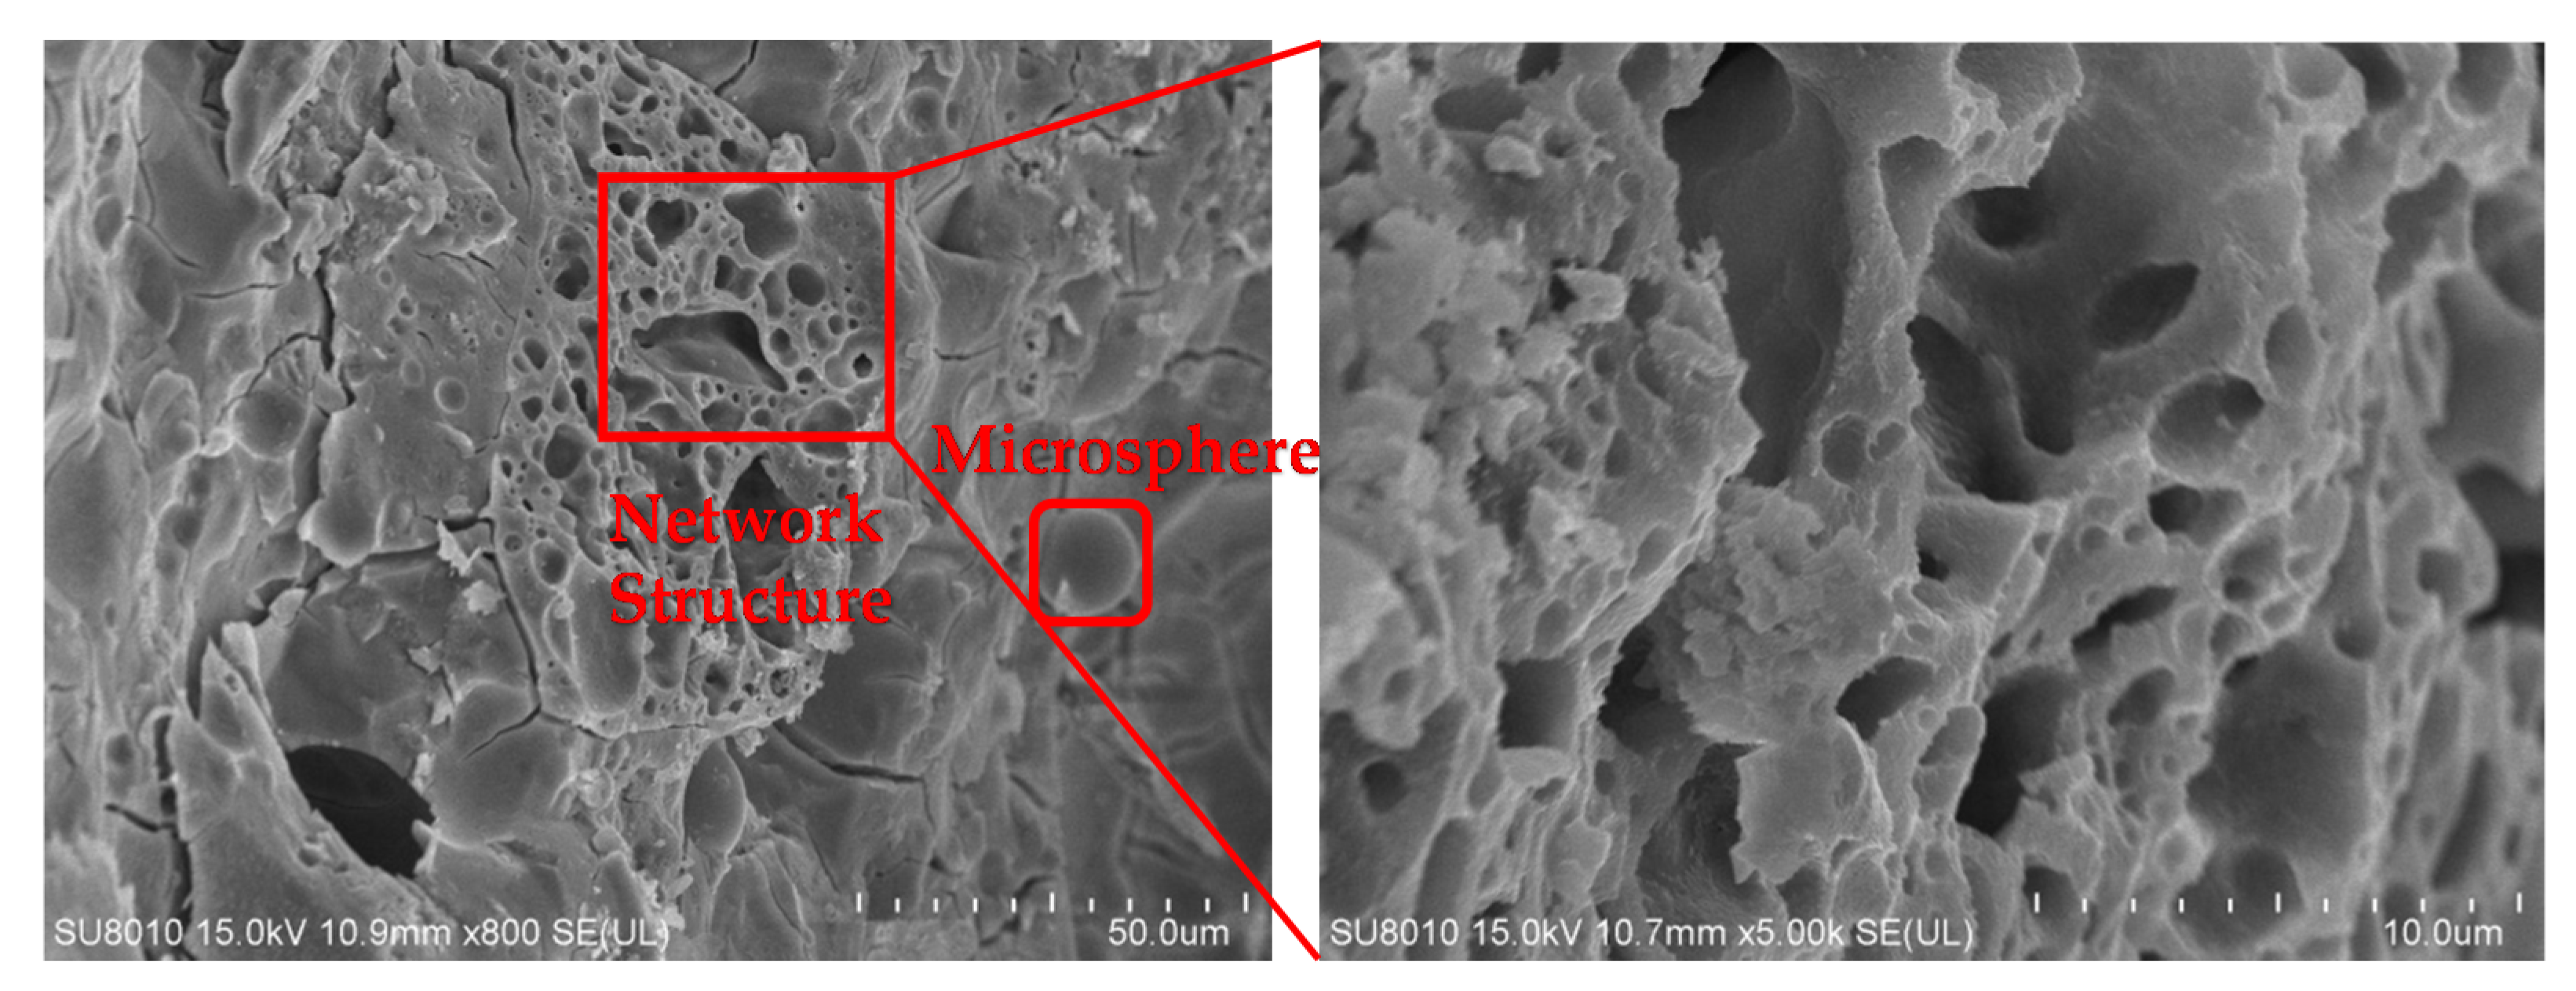
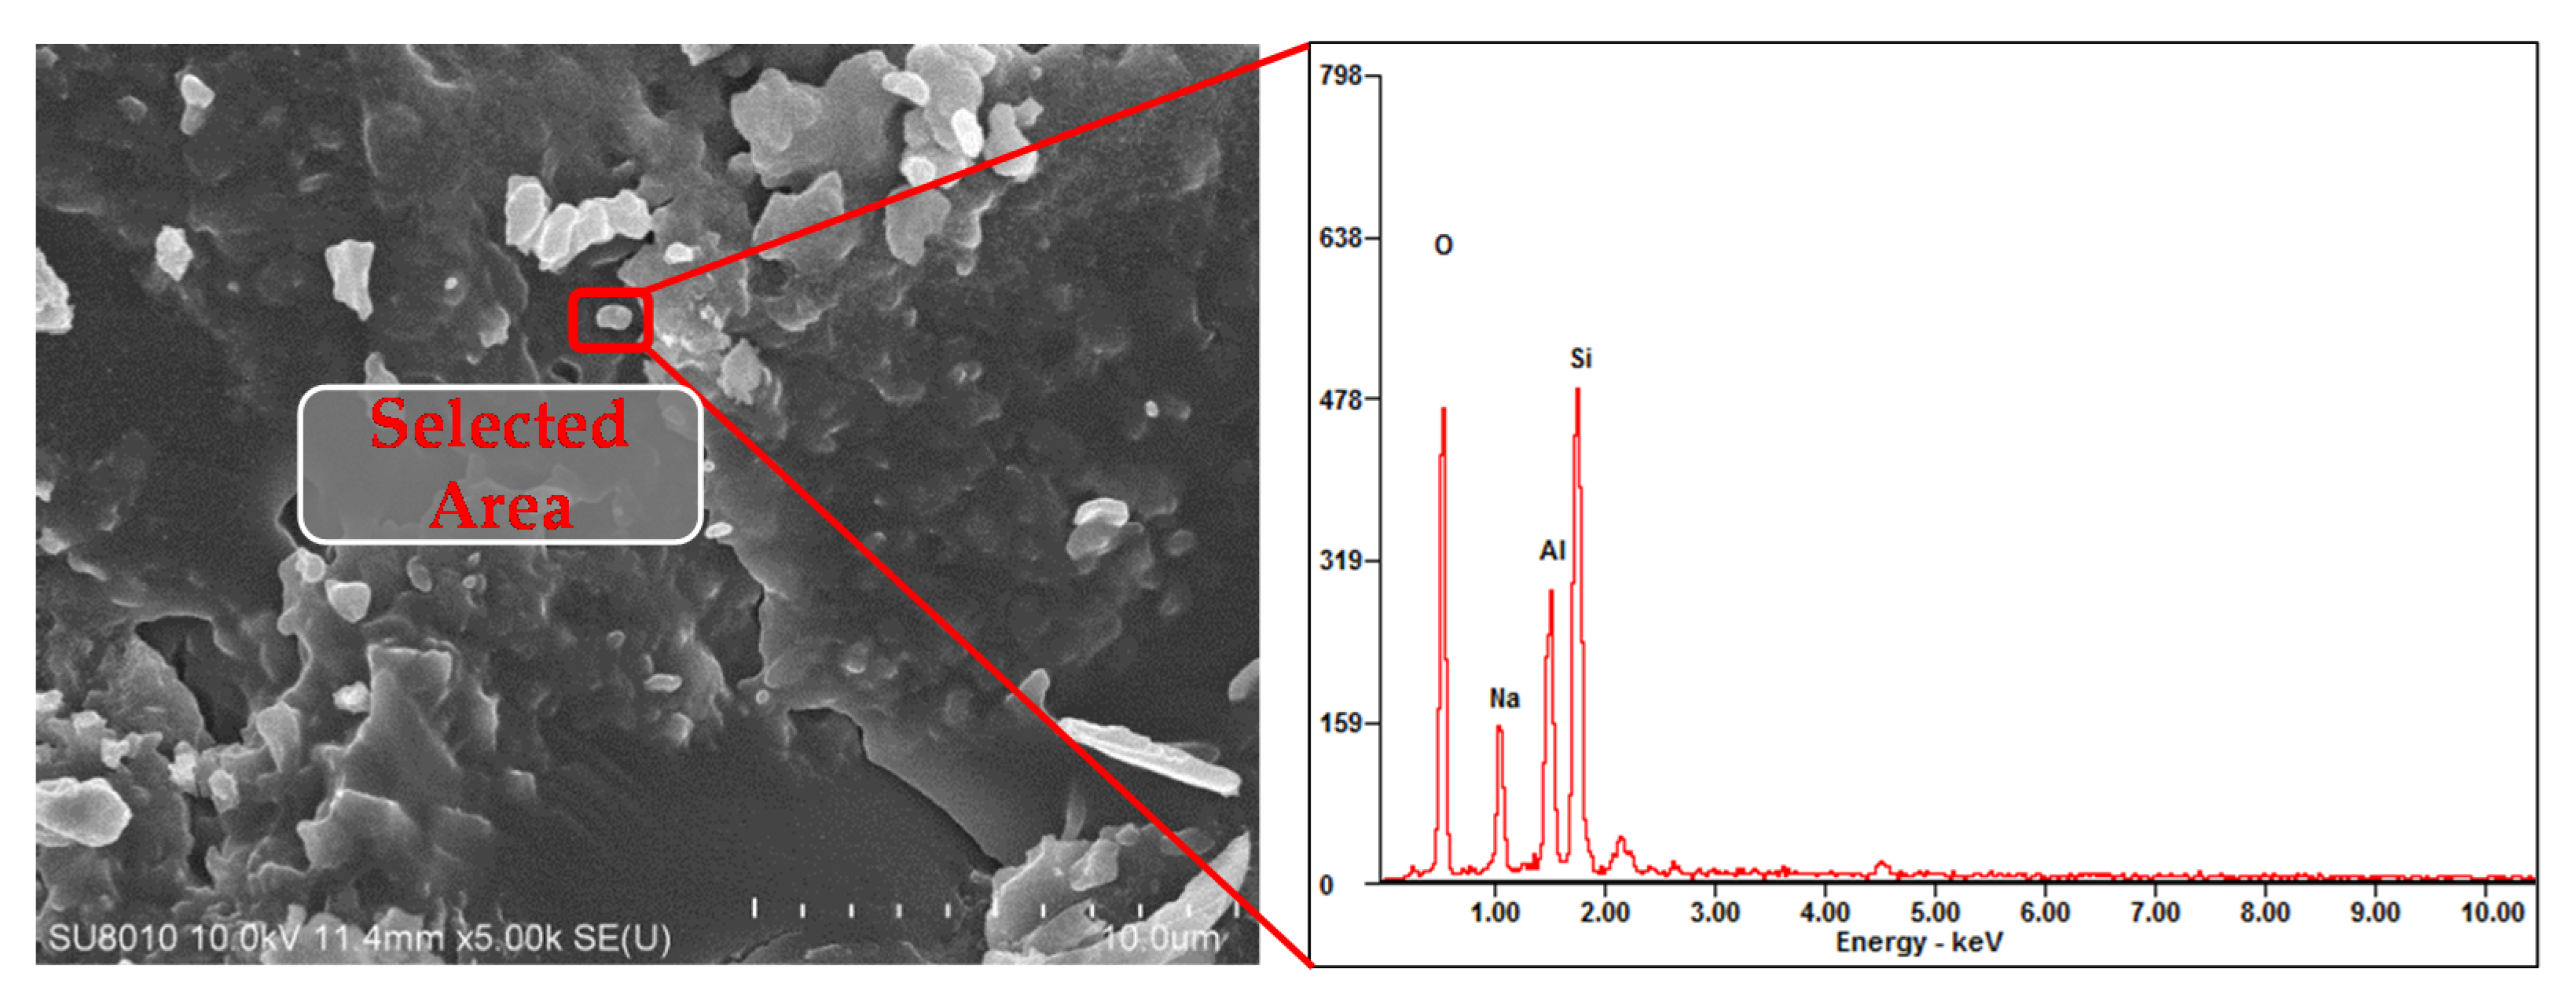
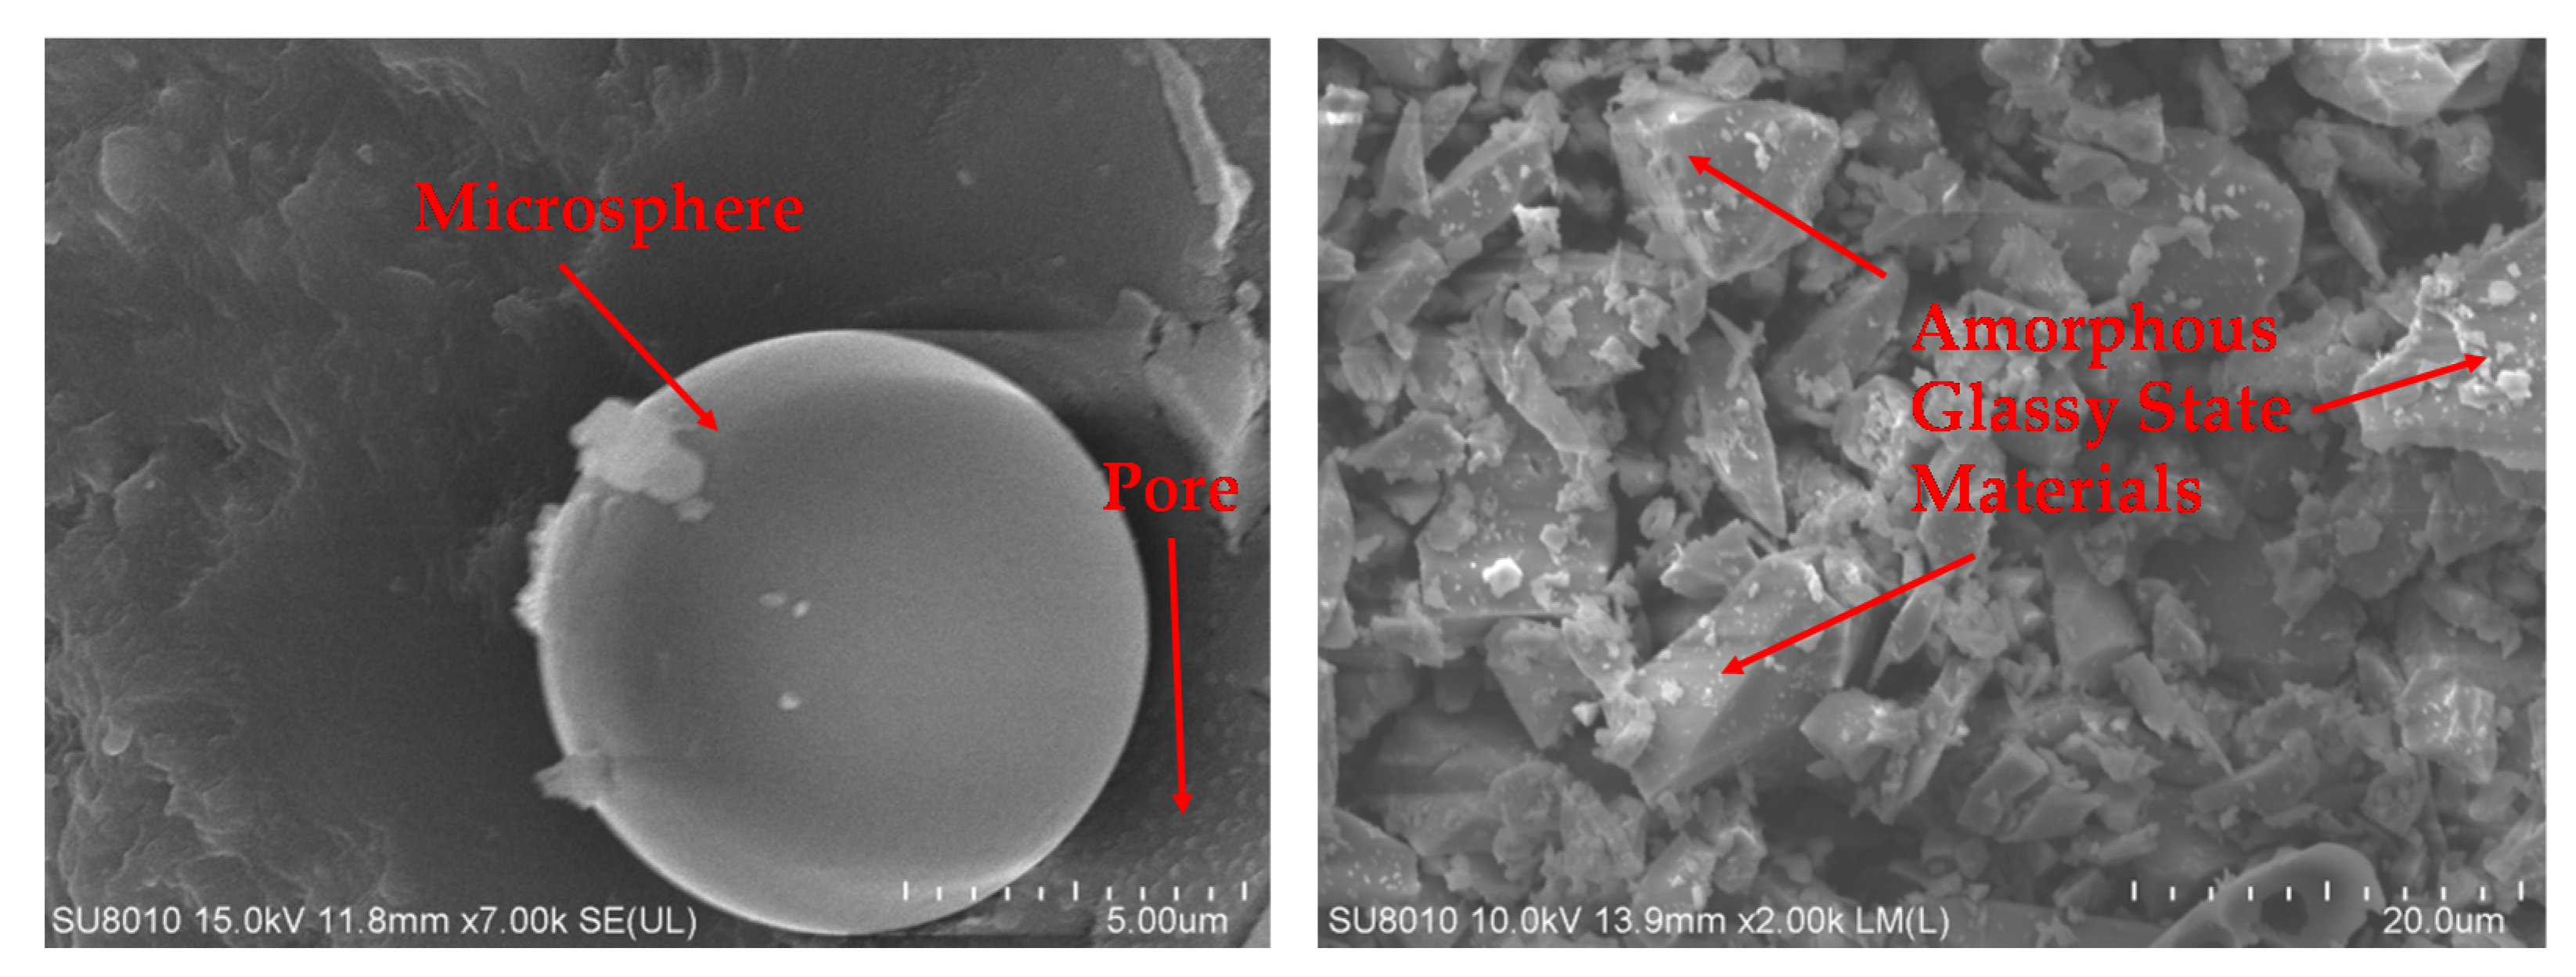
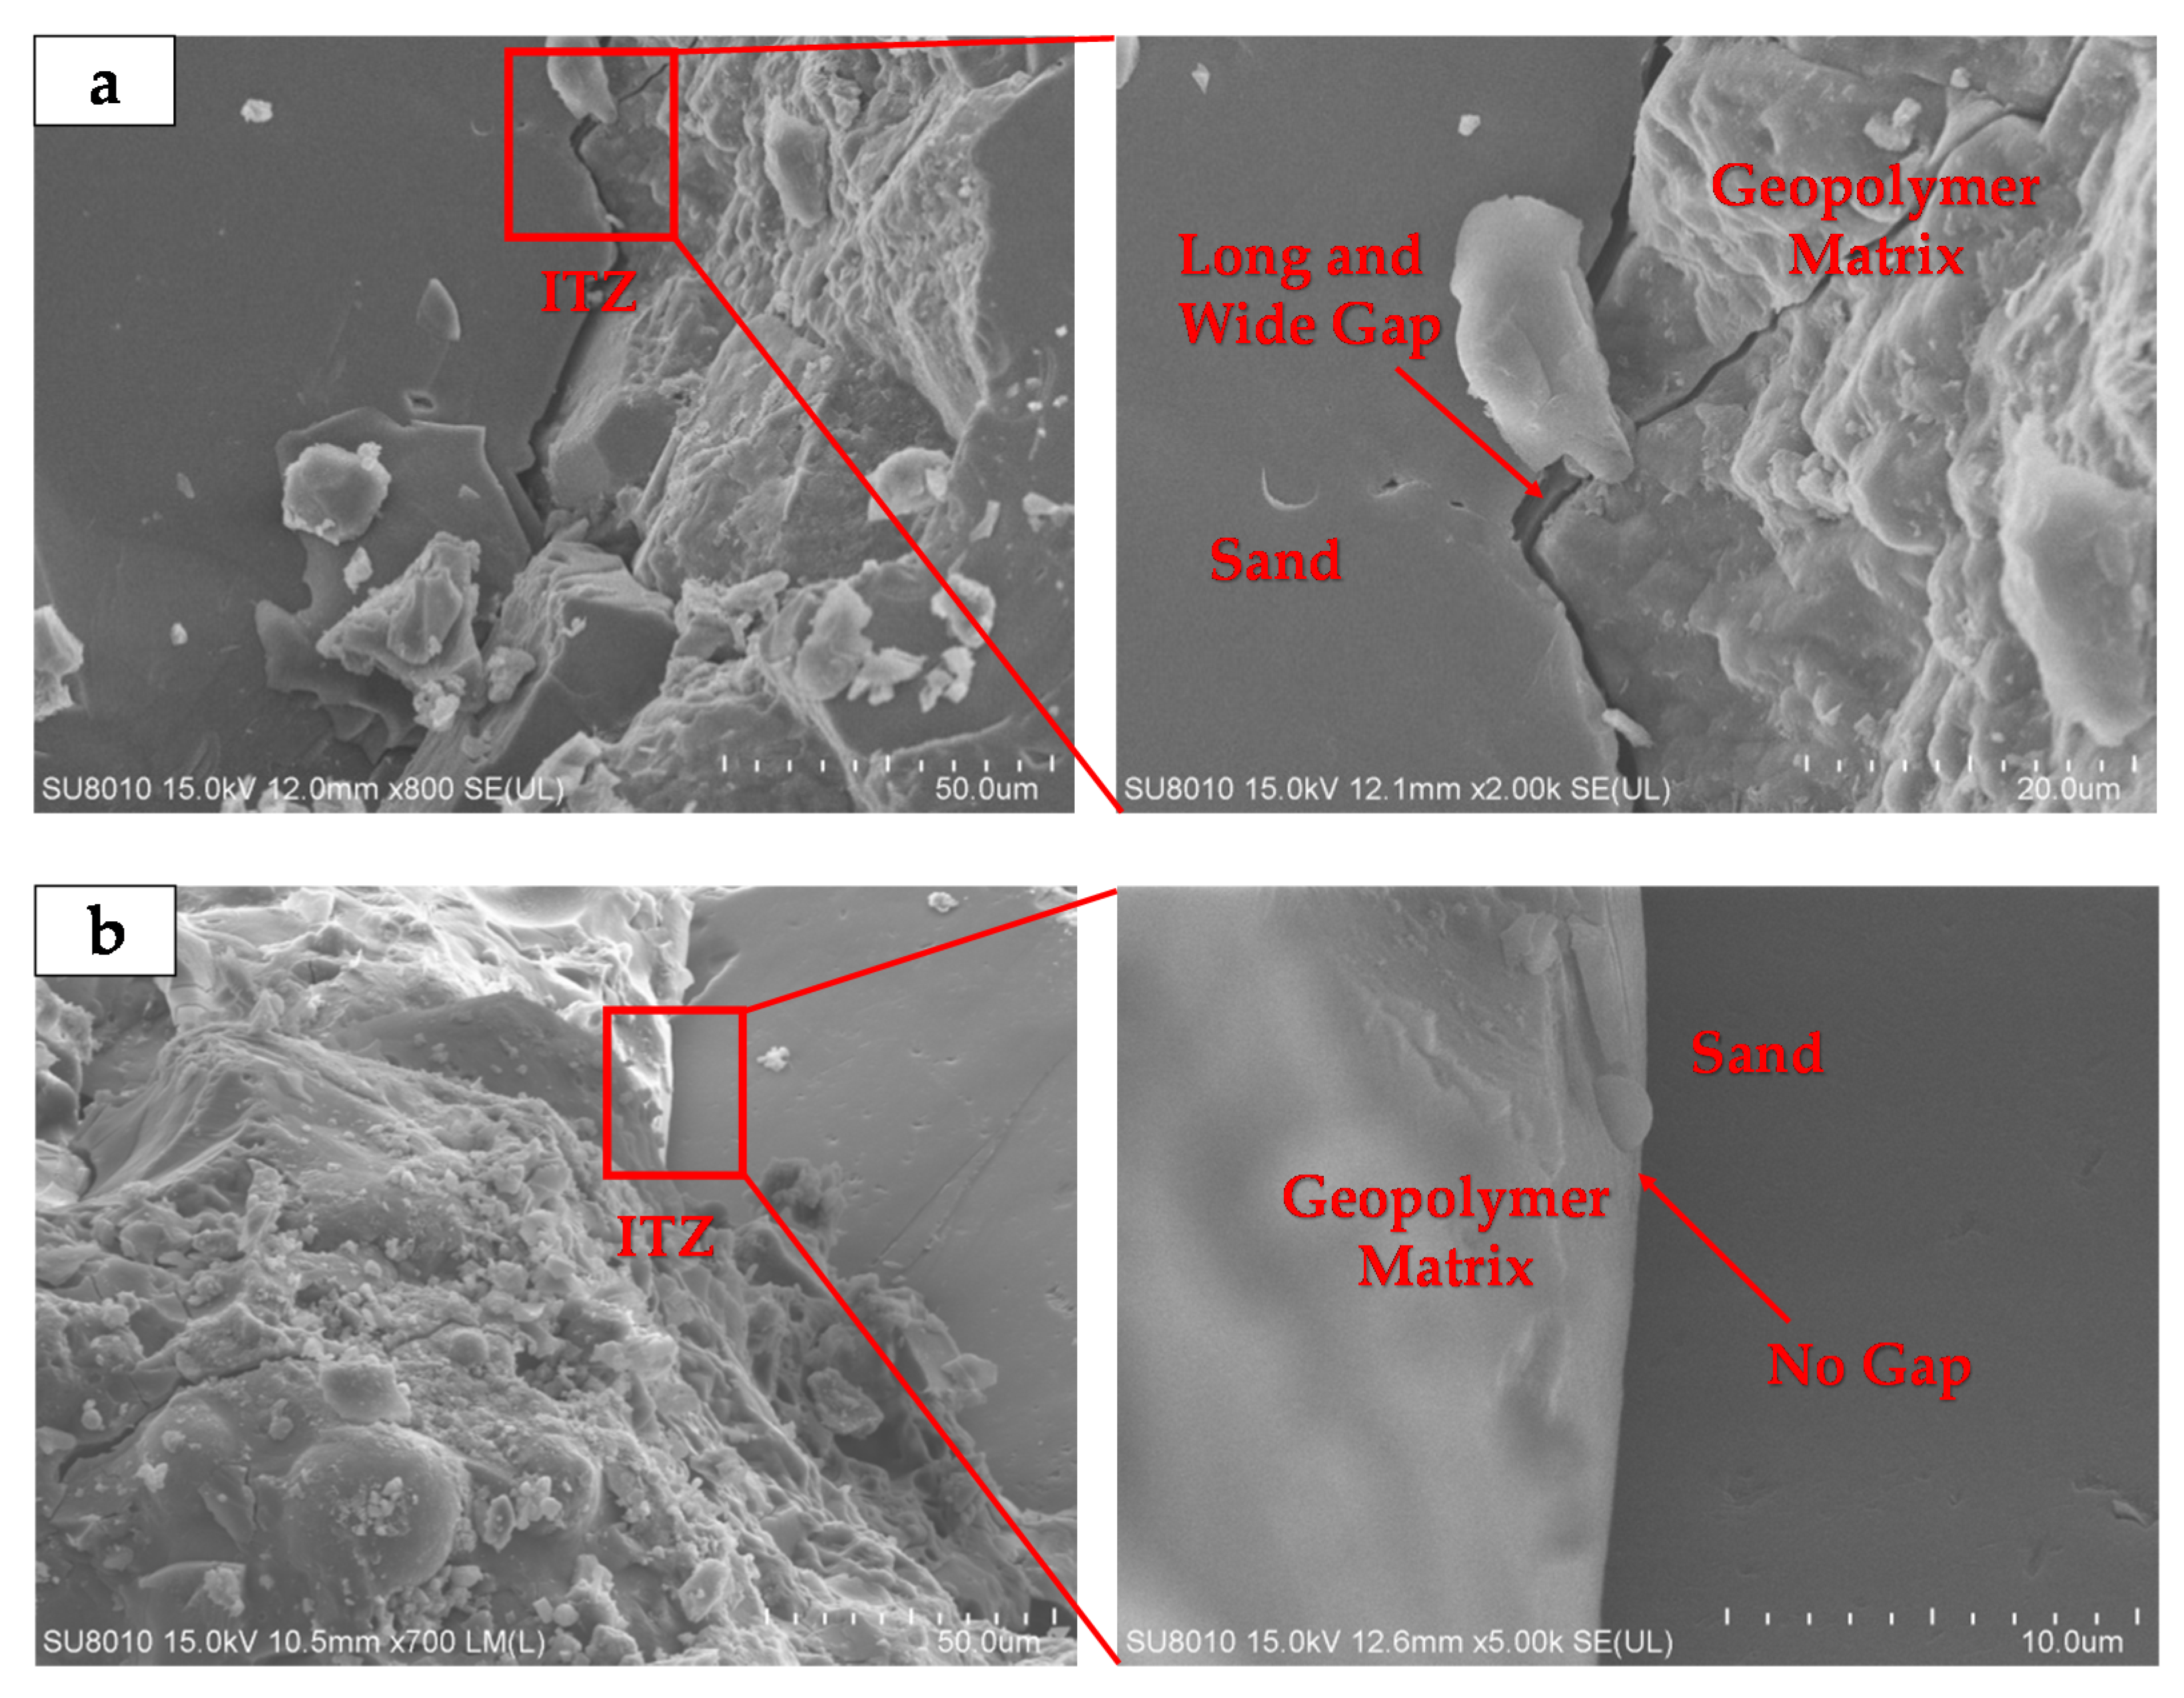
4.3. SEM Analysis
5. Conclusions
Author Contributions
Funding
Institutional Review Board Statement
Informed Consent Statement
Data Availability Statement
Acknowledgments
Conflicts of Interest
Appendix A

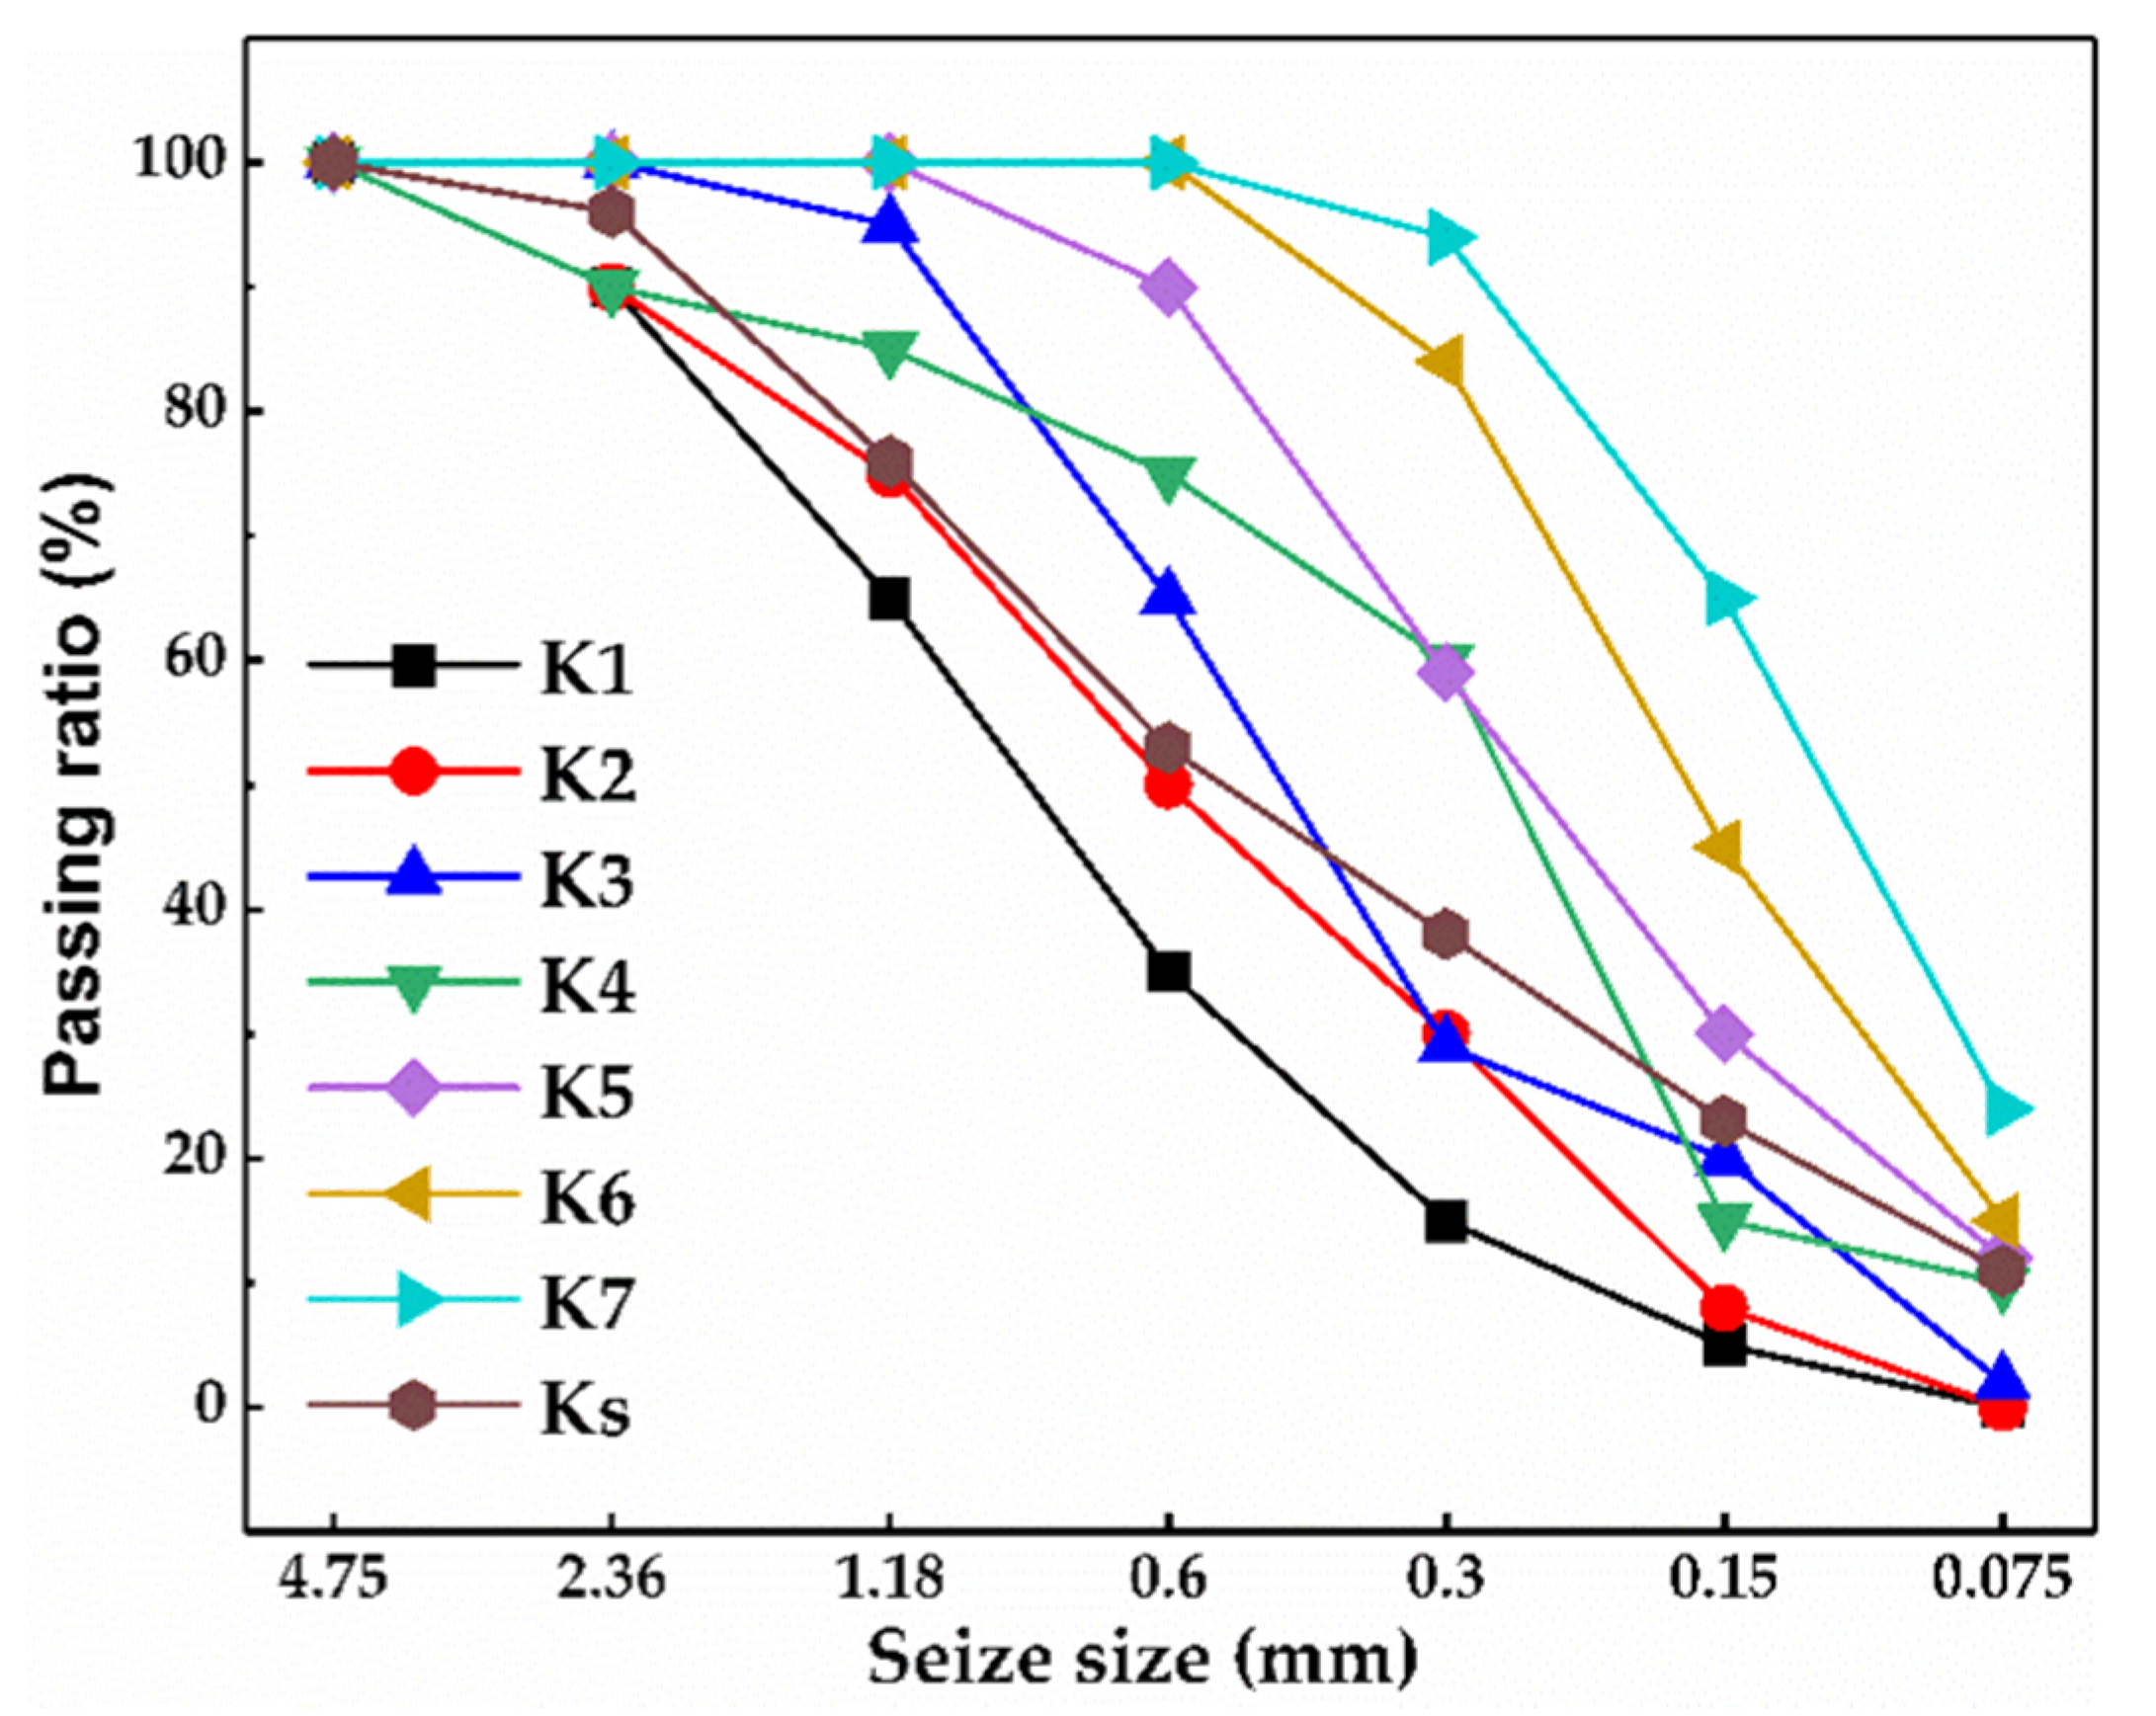
| Seize Size (mm) | 4.75 | 2.36 | 1.18 | 0.6 | 0.3 | 0.15 | 0.075 | Fineness Modulus | Categories | |
|---|---|---|---|---|---|---|---|---|---|---|
| Passing ratio (%) | K1 | 100 | 90 | 65 | 35 | 15 | 5 | 0 | 3.67 | I |
| K2 | 100 | 90 | 75 | 50 | 30 | 8 | 0 | 3.19 | II | |
| K3 | 100 | 100 | 95 | 65 | 29 | 20 | 2 | 2.81 | I | |
| K4 | 100 | 90 | 85 | 75 | 60 | 15 | 10 | 2.39 | III | |
| K5 | 100 | 100 | 100 | 90 | 59 | 30 | 12 | 2.11 | II | |
| K6 | 100 | 100 | 100 | 100 | 84 | 45 | 15 | 1.61 | III | |
| K7 | 100 | 100 | 100 | 100 | 94 | 65 | 24 | 1.31 | III | |
| Ks | 100 | 96 | 76 | 53 | 38 | 23 | 11 | 3.0 | II | |
| NO. | Fluidity (mm) | 28d Compressive Strength/σc (MPa) | 28d Flexural Strength/σf (MPa) | The σf/σc Ratio |
|---|---|---|---|---|
| S1 | 110 | 33.35 | 3.44 | 0.1031 |
| S2 | 122 | 64.76 | 7.61 | 0.1175 |
| S3 | 236 | 61.91 | 6.76 | 0.1092 |
| S4 | 110 | 58.01 | 6.48 | 0.1117 |
| S5 | 219 | 50.92 | 4.84 | 0.0951 |
| S6 | 274 | 55.32 | 6.08 | 0.1099 |
| S7 | 196 | 35.96 | 4.18 | 0.1162 |
| S8 | 291 | 43.76 | 4.47 | 0.1021 |
| S9 | 318 | 46.64 | 4.75 | 0.1018 |
| NO. | Fineness Modulus | Sand Type | Category | Specific Surface Area (m2/m3) | Voidage (%) | Flow Value (mm) | 28d Tensile Strength (MPa) |
|---|---|---|---|---|---|---|---|
| K1 | 3.67 | Coarse | I | 11,039.06 | 39.06% | 224.67 | 3.12 |
| K2 | 3.19 | Coarse | II | 15,163.13 | 40.00% | 231.30 | 3.43 |
| K3 | 2.81 | Medium | I | 22,192.67 | 36.07% | 206.43 | 3.83 |
| K4 | 2.39 | Medium | III | 33,680.16 | 36.27% | 173.27 | 3.92 |
| K5 | 2.11 | Fine | II | 41,342.14 | 41.79% | 140.28 | 3.77 |
| K6 | 1.61 | Fine | III | 52,535.01 | 44.29% | 130.22 | 3.61 |
| K7 | 1.31 | Special fine | III | 68,802.19 | 45.83% | 110.00 | 3.54 |
| NO. | Compressive Strength (σc) | Flexural Strength (σf) | The σf/σc Ratio | ||||||
|---|---|---|---|---|---|---|---|---|---|
| 3d | 7d | 28d | 3d | 7d | 28d | 3d | 7d | 28d | |
| K1 | 40.25 | 47.53 | 65.72 | 4.23 | 5.15 | 6.27 | 0.1051 | 0.1084 | 0.0954 |
| K2 | 41.08 | 44.02 | 61.29 | 4.37 | 5.01 | 6.25 | 0.1064 | 0.1138 | 0.1020 |
| K3 | 39.04 | 45.16 | 61.48 | 4.25 | 5.18 | 6.28 | 0.1089 | 0.1147 | 0.1021 |
| K4 | 38.6 | 41.64 | 60.24 | 4.24 | 4.89 | 6.21 | 0.1098 | 0.1174 | 0.1031 |
| K5 | 37.43 | 40.12 | 57.13 | 4.02 | 4.54 | 5.87 | 0.1074 | 0.1132 | 0.1027 |
| K6 | 37.21 | 38.71 | 57.54 | 3.88 | 4.22 | 5.75 | 0.1043 | 0.1090 | 0.0999 |
| K7 | 36.23 | 37.58 | 55.11 | 3.77 | 4.15 | 5.18 | 0.1041 | 0.1104 | 0.0940 |
| NO. | Relative Paste Volume (mL) | Void Ratio (%) | Relative Void Volume (mL) | Filling Coefficient |
|---|---|---|---|---|
| K1 | 380.1 | 39.06% | 378.35 | 1.005 |
| K2 | 380.1 | 40.00% | 388.43 | 0.979 |
| K3 | 380.1 | 36.07% | 342.21 | 1.111 |
| K4 | 380.1 | 36.27% | 345.94 | 1.099 |
| K5 | 380.1 | 41.79% | 417.13 | 0.911 |
| K6 | 380.1 | 44.29% | 478.21 | 0.795 |
| K7 | 380.1 | 45.83% | 514.76 | 0.738 |
References
- Shen, W.; Cao, L.; Li, Q.; Zhang, W.; Wang, G. Quantifying CO2 emissions from China’s cement industry. Renew. Sustain. Energy Rev. 2015, 50, 1004–1012. [Google Scholar] [CrossRef]
- Shen, W.; Cao, L.; Li, Q.; Wen, Z.; Wang, J.; Liu, Y.; Dong, R.; Tan, Y.; Chen, R. Is magnesia cement low carbon? Life cycle carbon footprint comparing with Portland cement. J. Clean. Prod. 2016, 131, 20–27. [Google Scholar] [CrossRef]
- Benhelal, E.; Zahedi, G.; Shamsaei, E.; Bahadori, A. Global strategies and potentials to curb CO2 emissions in cement industry. J. Clean. Prod. 2013, 51, 142–161. [Google Scholar] [CrossRef]
- Davidovits, J. Geopolymer: Inorganic polymeric new materials. J. Therm. Anal. Calorim. 1991, 37, 1633–1656. [Google Scholar] [CrossRef]
- Alomayri, T.; Shaikh, F.U.A.; Low, I.M. Mechanical and thermal properties of ambient cured cotton fabric-reinforced fly ash-based geopolymer composites. Ceram. Int. 2014, 40, 14019–14028. [Google Scholar] [CrossRef]
- Graytee, A.; Sanjayan, J.G.; Nazari, A. Development of a high strength fly ash-based geopolymer in short time by using microwave curing. Ceram. Int. 2018, 44, 8216–8222. [Google Scholar] [CrossRef]
- Flower, D.J.M.; Sanjayan, J.G. Green house gas emissions due to concrete manufacture. Int. J. Life Cycle Assess. 2007, 12, 282–288. [Google Scholar] [CrossRef]
- Aredes, F.G.M.; Campos, T.M.B.; Machado, J.P.B.; Sakane, K.K.; Thim, G.P.; Brunelli, D.D. Effect of cure temperature on the formation of metakaolinite-based geopolymer. Ceram. Int. 2015, 41, 7302–7311. [Google Scholar] [CrossRef]
- Okoye, F.N.; Durgaprasad, J.; Singh, N.B. Effect of silica fume on the mechanical properties of fly ash based-geopolymer concrete. Ceram. Int. 2016, 42, 3000–3006. [Google Scholar] [CrossRef]
- Davidovits, J. Geopolymer Chemistry and Applications, 5th ed.; Geopolymer Institute: Saint-Quentin, France, 2011. [Google Scholar]
- Çevik, A.; Alzeebaree, R.; Humur, G.; Niş, A.; Gülşan, M.E. Effect of nano-silica on the chemical durability and mechanical performance of fly ash based geopolymer concrete. Ceram. Int. 2018, 44, 12253–12264. [Google Scholar] [CrossRef]
- Castel, A.; Foster, S.J. Bond strength between blended slag and Class Fly ash geopolymer concrete with steel reinforcement. Cem. Concr. Res. 2015, 72, 48–53. [Google Scholar] [CrossRef]
- Albitar, M.; Ali, M.S.M.; Visintin, P.; Drechsler, M. Effect of granulated lead smelter slag on strength of fly ash-based geopolymer concrete. Constr. Build. Mater. 2015, 83, 128–135. [Google Scholar] [CrossRef]
- Xu, F.; Deng, X.; Peng, C.; Zhu, J.; Chen, J. Mix design and flexural toughness of PVA fiber reinforced fly ash-geopolymer composites. Constr. Build. Mater. 2017, 150, 179–189. [Google Scholar] [CrossRef]
- Xu, H.; Gong, W.; Syltebo, L.; Izzo, K.; Lutze, W.; Pegg, I.L. Effect of blast furnace slag grades on fly ash based geopolymer waste forms. Fuel 2014, 133, 332–340. [Google Scholar] [CrossRef]
- Gao, X.; Yu, Q.; Brouwers, H.J.H. Properties of alkali activated slag-fly ash blends with limestone addition. Cem. Concr. Compos. 2015, 59, 119–128. [Google Scholar] [CrossRef] [Green Version]
- Sarkar, M.; Dana, K.; Das, S. Microstructural and phase evolution in metakaolin geopolymers with different activators and added aluminosilicate fillers. J. Mol. Struct. 2015, 1098, 110–118. [Google Scholar] [CrossRef]
- Tchakoute, H.K.; Rüscher, C.H.; Djobo, J.N.Y.; Kenne, B.B.D.; Njopwouo, D. Influence of gibbsite and quartz in kaolin on the properties of metakaolin-based geopolymer cements. Appl. Clay Sci. 2015, 107, 188–194. [Google Scholar] [CrossRef]
- Yang, K.H.; Song, J.K.; Song, K.I. Assessment of CO2 reduction of alkali-activated concrete. J. Clean. Prod. 2013, 39, 265–272. [Google Scholar] [CrossRef]
- Shojaei, M.; Behfarnia, K.; Mohebi, R. Application of alkali-activated slag concrete in railway sleepers. Mater. Des. 2015, 69, 89–95. [Google Scholar] [CrossRef]
- Zejak, R.; Nikolic, I.; Blecic, D.; Radmilovi, V.V.; Radmilovi, V.R. Mechanical and microstructural properties of the fly-ash-based geopolymer paste and mortar. Mater. Tehnol. 2013, 47, 535–540. [Google Scholar]
- Chindaprasirt, P.; Chareerat, T.; Sirivivatnanon, V. Workability and strength of coarse high calcium fly ash geopolymer. Cem. Concr. Compos. 2007, 29, 224–229. [Google Scholar] [CrossRef]
- Islam, A.; Alengaram, U.J.; Jumaat, M.Z.; Bashar, I.I. The development of compressive strength of ground granulated blast furnace slag-palm oil fuel ash-fly ash based geopolymer mortar. Mater. Des. 2014, 56, 833–841. [Google Scholar] [CrossRef]
- Ranjbar, N.; Mehrali, M.; Alengaram, U.J.; Simon, H.; Jumaat, M.Z. Compressive strength and microstructural analysis of fly ash/palm oil fuel ash based geopolymer mortar. Constr. Build. Mater. 2014, 65, 532–539. [Google Scholar] [CrossRef]
- Zhang, Z.; Wang, H.; Zhu, Y.; Andrew, R.; John, L.P.; Frank, B. Using fly ash to partially substitute metakaolin in geopolymer synthesis. Appl. Clay Sci. 2014, 88, 194–201. [Google Scholar] [CrossRef]
- Park, S.S.; Kang, H.Y. Characterization of fly ash-pastes synthesized at different activator conditions. Korean J. Chem. Eng. 2008, 25, 78–83. [Google Scholar] [CrossRef]
- Sun, Y.; Fu, K.; Zhu, H.; Zhu, T. Silica-alumina molar ratio and some factors effect on the synthesis of zeolites from fly ash. J. Coal Sci. Eng. 2009, 15, 430–433. [Google Scholar] [CrossRef]
- Guo, X.; Shi, H.; Dick, W.A. Utilization of thermally treated flue gas desulfurization (FGD) gypsum and class-C fly ash (CFA) to prepare CFA-based geopolymer. J. Wuhan Univ. Technol. 2013, 28, 132–138. [Google Scholar] [CrossRef]
- Garcia-Lodeiro, I.; Palomo, A.; Fernandez-Jimenez, A. Alkali-aggregate reaction in activated fly ash systems. Cem. Concr. Res. 2007, 37, 175–183. [Google Scholar] [CrossRef]
- Rao, S.M.; Acharya, I.P. Synthesis and Characterization of Fly Ash Geopolymer Sand. J. Mater. Civ. Eng. 2014, 26, 912–917. [Google Scholar] [CrossRef]
- Lee, W.K.W.; Van Deventer, J.S.J. The interface between natural siliceous aggregates and geopolymers. Cem. Concr. Res. 2004, 34, 195–206. [Google Scholar] [CrossRef]
- Temuujin, J.; Riessen, A.V.; MacKenzie, K.J.D. Preparation and characterisation of fly ash based geopolymer mortars. Constr. Build. Mater. 2010, 24, 1906–1910. [Google Scholar] [CrossRef]
- Brough, A.R.; Atkinson, A. Sodium silicate-based alkali-activated slag mortars Part I. Strength, hydration and microstructure. Cem. Concr. Res. 2002, 32, 865–879. [Google Scholar] [CrossRef]
- Nath, P.; Sarker, P.K. Effect of GGBFS on setting, workability and early strength properties of fly ash geopolymer concrete cured in ambient condition. Constr. Build. Mater. 2014, 66, 163–171. [Google Scholar] [CrossRef] [Green Version]
- Lee, N.K.; Lee, H.K. Setting and mechanical properties of alkali-activated fly ash/slag concrete manufactured at room temperature. Constr. Build. Mater. 2013, 47, 1201–1209. [Google Scholar] [CrossRef]
- Singh, B.; Rahman, M.R.; Paswan, R.; Bhattacharyya, S.K. Effect of activator concentration on the strength, ITZ and drying shrinkage of fly ash/slag geopolymer concrete. Constr. Build. Mater. 2016, 118, 171–179. [Google Scholar] [CrossRef]
- Yang, K.H.; Song, J.K.; Lee, K.S.; Ashour, A.F. Flow and compressive strength of alkali-activated mortars. ACI Mater. J. 2009, 106, 50–58. [Google Scholar]
- Yang, K.H.; Song, J.K. Workability loss and compressive strength development of cementless mortars activated by combination of sodium silicate and sodium hydroxide. J. Mater. Civ. Eng. 2009, 21, 119–127. [Google Scholar] [CrossRef]
- Chuah, S.; Duan, W.; Pan, Z.; Hunter, E.; Korayem, A.H.; Zhao, X.; Collins, F.; Sanjayan, J.G. The properties of fly ash based geopolymer mortars made with dune sand. Mater. Des. 2016, 92, 571–578. [Google Scholar] [CrossRef]
- ASTM International. Standard Specification for Coal Fly Ash and Raw or Calcined Natural Pozzolan for Use in Concrete; ASTM C618-03; ASTM: West Conshohocken, PA, USA, 2003. [Google Scholar]
- Gu, G.; Xu, F.; Ruan, S.; Huang, X.; Zhu, J.; Peng, C. Influence of precast foam on the pore structure and properties of fly ash-based geopolymer foams. Constr. Build. Mater. 2020, 256, 119410. [Google Scholar] [CrossRef]
- Gu, G.; Xu, F.; Huang, X.; Ruan, S.; Peng, C.; Lin, J. Foamed geopolymer: The relationship between rheological properties of geopolymer paste and pore-formation mechanism. J. Clean. Prod. 2020, 277, 123238. [Google Scholar] [CrossRef]
- ASTM International. Standard Specification for Ready-Mixed Concrete; ASTM C94; ASTM: West Conshohocken, PA, USA, 2015. [Google Scholar]
- ISO. Cement—Test methods—Determination of Strength; ISO 679; ISO: Geneva, Switzerland, 1989. [Google Scholar]
- AQSIQ; SAC. Sand for Construction; GB/T 14684-2011; GB: Beijing, China, 2011.
- ASTM International. Standard Specification for Flow Table for Use in Tests of Hydraulic Cement; ASTM C230/C230M; ASTM: West Conshohocken, PA, USA, 2003. [Google Scholar]
- ASTM International. Standard Practice for Mechanical Mixing of Hydraulic Cement Pastes and Mortars of Plastic Consistency; ASTM C305; ASTM: West Conshohocken, PA, USA, 2014. [Google Scholar]
- ASTM International. Standard Test Method for Flexural Strength of Hydraulic-Cement Mortars; ASTM C348; ASTM: West Conshohocken, PA, USA, 2018. [Google Scholar]
- ASTM International. Standard Test Method for Compressive Strength of Cylindrical Concrete Specimens; ASTM C39; ASTM: West Conshohocken, PA, USA, 1996. [Google Scholar]
- Xu, F.; Zhou, M.; Chen, J.; Ruan, S. Mechanical performance evaluation of polyester fiber and SBR latex compound-modified cement concrete road overlay material. Constr. Build. Mater. 2014, 63, 142–149. [Google Scholar] [CrossRef]
- Xu, F.; Chen, J.; Ruan, S.; Zhou, M. Influence of PP fiber and SBR latex on the mechanical properties of crumb rubber mortar. J. Appl. Polym. Sci. 2014, 131, 64–73. [Google Scholar] [CrossRef]
- Arioz, E.; Arioz, O.; Kockar, O.M. Geopolymer Synthesis with Low Sodium Hydroxide Concentration. Iran. J. Sci. Technol. Trans. Civ. Eng. 2020, 44, 525–533. [Google Scholar] [CrossRef]
- Bohra, V.; Nerella, R.; Madduru, S.; Rohith, P. Microstructural characterization of fly ash based geopolymer. Mater. Today Proc. 2020, 27, 1625–1629. [Google Scholar] [CrossRef]
- Davidovits, J. Geopolymers: Inorganic polymeric new materials. J. Mater. Educ. 1994, 16, 91–139. [Google Scholar] [CrossRef]
- Lecomte, I.; Liegeois, M.; Rulmont, A.; Cloots, R.; Maseri, F. Synthesis and characterization of new inorganic polymeric composites based on kaolin or white clay and on ground-granulated blast furnace slag. J. Mater. Res. 2003, 18, 2571–2579. [Google Scholar] [CrossRef]
- Lizcano, M.; Kim, H.S.; Basu, S.; Radovic, M. Mechanical properties of sodium and potassium activated metakaolin-based geopolymers. J. Mater. Sci. 2012, 47, 2607–2616. [Google Scholar] [CrossRef]
- Zhang, Y.; Sun, W.; Li, Z. Hydration process of potassium polysialate (K-PSDS) geopolymer cement. Adv. Cem. Res. 2005, 17, 23–28. [Google Scholar] [CrossRef]
- Liew, Y.M.; Heah, C.Y.; Mohd Mustafa, A.B.; Kamarudin, H. Structure and properties of clay-based geopolymer cements: A review. Prog. Mater. Sci. 2016, 83, 595–629. [Google Scholar] [CrossRef]
- Gu, G.; Xu, F.; Zhou, Y.; Huang, X.; Li, Y. Formation mechanism of early strength in geopolymer based on molar ratio of mineral components. Acta Mater. Compos. Sin. 2020, 37, 2036–2044. [Google Scholar]
- Zhang, P.; Wang, K.; Wang, J.; Guo, J.; Ling, Y. Macroscopic and microscopic analyses on mechanical performance of metakaolin/fly ash based geopolymer mortar. J. Clean. Prod. 2021, 294, 126193. [Google Scholar] [CrossRef]


| Chemical Analysis | Fly Ash (wt.%) | GBFS (wt.%) |
|---|---|---|
| SiO2 | 50.34 | 34.32 |
| Al2O3 | 35.97 | 16.06 |
| Fe2O3 | 3.711 | 0.334 |
| MgO | 0.552 | 8.6 |
| CaO | 4.798 | 35.04 |
| Na2O | 0.45 | 0.44 |
| K2O | 0.812 | 0.508 |
| MnO | 0.053 | 0.326 |
| TiO2 | 1.361 | 0.813 |
| Loss on Ignition | 1.953 | 3.559 |
| Appearance | Modulus | Baume Degree (%) | Na2O (%) | SiO2 (%) |
|---|---|---|---|---|
| Colorless and transparent | 3.23 | 39.50 | 8.81 | 27.40 |
| NO. | Fineness Modulus | Sand Type | Categories |
|---|---|---|---|
| K1 | 3.67 | Coarse | I |
| K2 | 3.19 | Coarse | II |
| K3 | 2.81 | Medium | I |
| K4 | 2.39 | Medium | III |
| K5 | 2.11 | Fine | II |
| K6 | 1.61 | Fine | III |
| K7 | 1.31 | Special fine | III |
| Ks | 3.0 | / | II |
| NO. | Water–Binder Ratio | Binder–Sand Ratio | Water (g) | Fly Ash (g) | GBFS (g) | Alkali-Activator (g) | Standard Sands (g) |
|---|---|---|---|---|---|---|---|
| S1 | 0.35 | 0.3 | 67.2 | 209.0 | 139.3 | 131.2 | 1350 |
| S2 | 0.35 | 0.4 | 89.6 | 278.6 | 185.8 | 175.0 | 1350 |
| S3 | 0.35 | 0.5 | 112.0 | 348.3 | 232.2 | 218.7 | 1350 |
| S4 | 0.40 | 0.3 | 87.5 | 209.0 | 139.3 | 131.2 | 1350 |
| S5 | 0.40 | 0.4 | 116.6 | 278.6 | 185.8 | 175.0 | 1350 |
| S6 | 0.40 | 0.5 | 145.8 | 348.3 | 232.2 | 218.7 | 1350 |
| S7 | 0.45 | 0.3 | 107.7 | 209.0 | 139.3 | 131.2 | 1350 |
| S8 | 0.45 | 0.4 | 143.6 | 278.6 | 185.8 | 175.0 | 1350 |
| S9 | 0.45 | 0.5 | 179.5 | 348.3 | 232.2 | 218.7 | 1350 |
| NO. | Water–Binder Ratio | Binder–Sand Ratio | Water (g) | Fly Ash (g) | GBFS (g) | Alkali-Activator (g) | Sand Type | River Sands (g) |
|---|---|---|---|---|---|---|---|---|
| K1 | 0.35 | 0.4 | 89.6 | 278.6 | 185.8 | 175.0 | K1 | 1350 |
| K2 | 0.35 | 0.4 | 89.6 | 278.6 | 185.8 | 175.0 | K2 | 1350 |
| K3 | 0.35 | 0.4 | 89.6 | 278.6 | 185.8 | 175.0 | K3 | 1350 |
| K4 | 0.35 | 0.4 | 89.6 | 278.6 | 185.8 | 175.0 | K4 | 1350 |
| K5 | 0.35 | 0.4 | 89.6 | 278.6 | 185.8 | 175.0 | K5 | 1350 |
| K6 | 0.35 | 0.4 | 89.6 | 278.6 | 185.8 | 175.0 | K6 | 1350 |
| K7 | 0.35 | 0.4 | 89.6 | 278.6 | 185.8 | 175.0 | K7 | 1350 |
Publisher’s Note: MDPI stays neutral with regard to jurisdictional claims in published maps and institutional affiliations. |
© 2021 by the authors. Licensee MDPI, Basel, Switzerland. This article is an open access article distributed under the terms and conditions of the Creative Commons Attribution (CC BY) license (https://creativecommons.org/licenses/by/4.0/).
Share and Cite
Li, H.; Gao, P.; Xu, F.; Sun, T.; Zhou, Y.; Zhu, J.; Peng, C.; Lin, J. Effect of Fine Aggregate Particle Characteristics on Mechanical Properties of Fly Ash-Based Geopolymer Mortar. Minerals 2021, 11, 897. https://doi.org/10.3390/min11080897
Li H, Gao P, Xu F, Sun T, Zhou Y, Zhu J, Peng C, Lin J. Effect of Fine Aggregate Particle Characteristics on Mechanical Properties of Fly Ash-Based Geopolymer Mortar. Minerals. 2021; 11(8):897. https://doi.org/10.3390/min11080897
Chicago/Turabian StyleLi, Heng, Pengpeng Gao, Fang Xu, Tao Sun, Yu Zhou, Jing Zhu, Chao Peng, and Juntao Lin. 2021. "Effect of Fine Aggregate Particle Characteristics on Mechanical Properties of Fly Ash-Based Geopolymer Mortar" Minerals 11, no. 8: 897. https://doi.org/10.3390/min11080897
APA StyleLi, H., Gao, P., Xu, F., Sun, T., Zhou, Y., Zhu, J., Peng, C., & Lin, J. (2021). Effect of Fine Aggregate Particle Characteristics on Mechanical Properties of Fly Ash-Based Geopolymer Mortar. Minerals, 11(8), 897. https://doi.org/10.3390/min11080897