Article

Explaining Colour Change in Pyrope-Spessartine Garnets

School of Gemmology, China University of Geosciences (Beijing), Beijing 100083, China
*
Author to whom correspondence should be addressed.
Minerals 2021, 11(8), 865; https://doi.org/10.3390/min11080865
Submission received: 18 June 2021 / Revised: 3 August 2021 / Accepted: 6 August 2021 / Published: 11 August 2021
(This article belongs to the Special Issue Colours in Minerals and Rocks)

Abstract

:
A colour-changing garnet exhibits the “alexandrite effect”, whereby its colour changes from green in the presence of daylight to purplish red under incandescent light. This study examines this species of garnets as well as the causes of the colour change by using infrared and ultraviolet visible (UV-Vis) spectroscopy. The infrared spectra show that the colour-changing garnets in this paper belong to the solid solution of pyrope-spessartine type. CIE1931 XYZ colour matching functions are used to calculate the colour parameters influencing garnet colour-changing under different light sources. The UV-Vis spectra show two zones of transmittance, in the red region at 650–700 nm and the blue-green region at 460–510 nm. As they exhibit the same capacity to transmit light, the colour of the gem is determined by the external light source. The absorption bands of Cr3+ and V3+ at 574 nm in the UV-Vis spectra are the main cause of the change in colour. With the increase in the area of peak absorption, the differences in the chroma and colour of the garnet gradually increase in daylight and incandescent light, and it exhibits a more prominent colour-changing effect.

1. Introduction

Garnets are a common group of minerals that undergo complex changes in their composition. The island silicate garnet belongs to the cubic space group, Ia 3 ¯ d, Z = 8 [1], and has the general chemical formula A3B2[SiO4]3. Position A is occupied by divalent cations, such as Mg2+, Fe2+, Mn2+, and Ca2+, with eight-fold coordination in a dodecahedral site. Position B is occupied by trivalent cations, such as Al3+, Fe3+, and Cr3+, with six-fold coordination occupying the octahedral site. Si4+ is a tetravalent cation that can be partially replaced by a small amount of Ti4+, and occupies the tetrahedral position with four-fold coordination [2]. The divalent cations Mg2+, Fe2+, and Mn2+ have smaller ionic radii than Ca2+, and thus struggle to replace one another. Garnets can hence be divided into two isomeric series: pyralspite and ugrandite.
In gemology, a change in colour that occurs when the source of illumination switches from daylight to incandescent light is called “alexandrite effect”. Many gemstones naturally change colour, such as alexandrite [3], diaspore [4,5], Tavernier diamond [6], corundum [7], and garnet [8,9,10,11].
A special kind of pyralspite garnet exhibits the alexandrite change in colour. Such garnets appear yellow-green in daylight and purple-red under incandescent light. Colour-changing garnets can be divided into two categories based on their chemical composition: Cr-rich spessartine, and Cr, V-rich pyrope-spessartine solid solutions [12].
Generally the perceived colour of the surface of an object remains constant when the intensity of light and the spectral components of illumination change. The alexandrite effect is a phenomenon of distinctive changes in the colour of a gem when observed under daylight and incandescent light [13]. A change of 20° in the absolute hue angle is used to identify the alexandrite effect [14].
Tang [15], Cheng [16], and Wang [17] used an X-Rite SP62 portable spectrophotometer to visually measure the colours of gems. Guo et al. [18,19] used Spectrophotometer Colour i5 and the GemDialogue colour chip to quantitatively characterize the colour of jadeite, and Tooms et al. [20] used colour matching functions to calculate colour. Kasajima et al. [21,22] used the CIE1931RGB colour matching functions to calculate the colours of the leaves and flowers of the genera Torenia and Cyclamen. Sun et al. [23] used the CIEXYZ colour matching functions to calculate the colour of synthetic Cr-bearing chrysoberyl.
The human retina has three kinds of colour photoreceptors, or cones, that are sensitive to red, green, and blue light. The S cones detect the short wavelength (blue), the M cones detect the medium wavelength (green), and the L cones detect the long wavelength (red). Xie et al. [24] used the responses of the L, M, and S spectra to calculate the colour of alexandrite.
When irradiated, the spectral stimulation energy is absorbed by photoreceptors of the three cones in our eyes. The cone cells produce different degrees of responses followed by neurophysiological reactions. The International Commission on Illumination (CIE) establishes a series of colour-matching functions through visual experiments. As a proxy for functions of the responsivity of the cones, CIE colour-matching functions are used to represent linear combinations of the average visual response [25].
Matching functions can be used to calculate the energy of light that enters the human eye and produces the sensation of colour. Due to the particularity of colour-changing garnets, this study uses CIE1931XYZ colour-matching functions to quantitatively characterize colour, and investigates the colour of garnets between daylight and incandescent light. The authors also analyze the relationship between the ultraviolet–visible (UV-Vis) spectra and the parameters influencing the perception of colour.

2. Materials and Methods
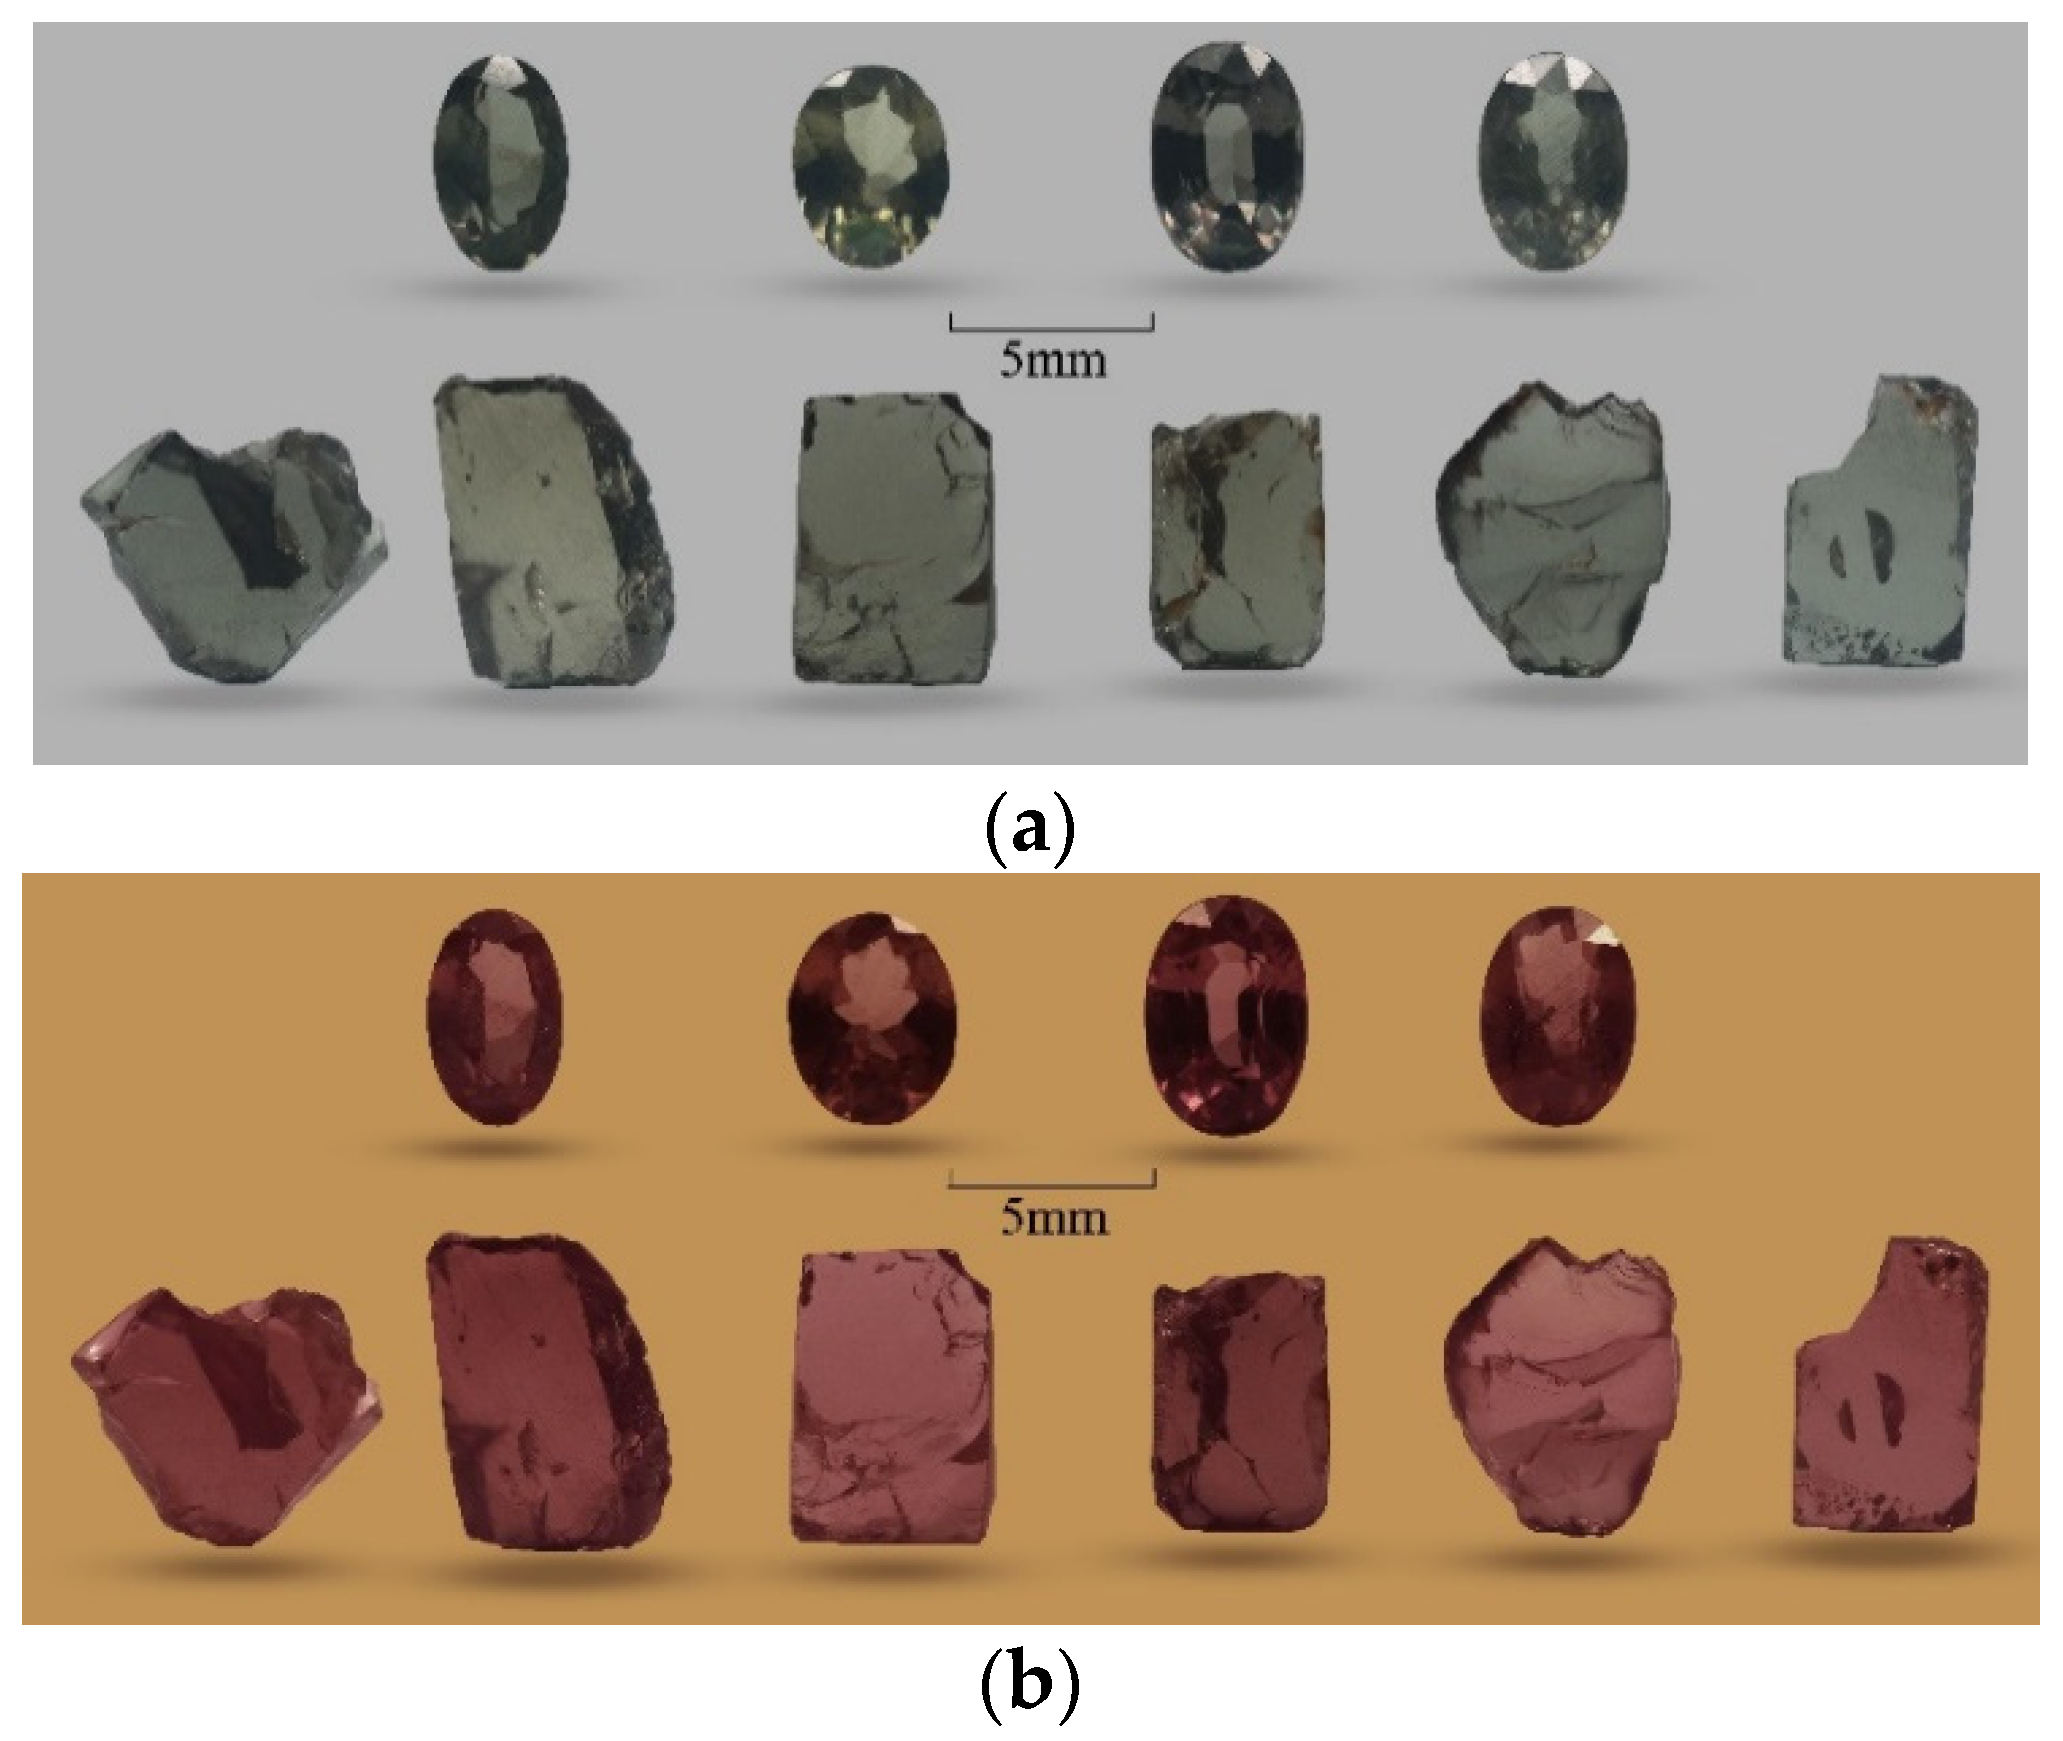
2.1. Samples

We collected 10 samples of colour-changing garnets, four oval faceted gems (dimensions from 3 mm × 5 mm to 4 mm × 5.7 mm) and six double-sided polished flats with a thickness of 3 mm. They appeared gray-green under daylight (Figure 1a) and purplish red under incandescent light (Figure 1b), showing a distinct colour-changing effect.

2.2. Fourier Transform Infrared (FTIR) Spectroscopy

The infrared spectra of the samples were measured by a Tensor 27 FTIR spectrometer (Bruker, Germany). The settings of the instrument were: resolution 4 cm−1; scanning range 400–2000 cm−1; run time 30 s per scan.

2.3. UV-Vis Spectroscopy

The UV-Vis were carried out using a UV-3600 UV-VIS spectrophotometer (Shimadzu, Tokyo, Japan). The test conditions were: wavelength range 200–900 nm; slit width 2 nm; scanning speed high; sampling interval 0.5 s; and the single scanning mode was used.

2.4. Correcting the UV-Vis Spectra

Energy is used in three ways when light passes through a sample. A is the total absorbance of the sample measured directly from the spectrophotometer, and includes Ac (loss of chromophore light), Arl (loss due to reflection of light on the surface of the gem), and Aisl (loss due to inclusion scattering of light) [12]:
A = A c + A r l + A i s l
The absorption (Arl) of the incident light reflects along the boundary is related to the refractive index (n) of the sample. The Sellmeier equation is an empirical formula describing the refractive index and wavelength in a specific transparent medium, and is used to determine the dispersion of light in a medium. Different materials have different Sellmeier coefficients. According to research by Wemple and Di Domenico [26,27], and Wemple et al. [28], we obtained the following Sellmeier equation:
1 n 2 1 = A λ 2 + B
n 2 = 1 + λ 2 B λ 2 A
Medenbach et al. [29] measured the relevant empirical formulae for silicate minerals, and obtained the Sellmeier coefficients of garnets as A = 54 × 10−16 m2 = 5400 nm2, and B = 0.4599. The relationship between the refractive index of garnet and the wavelength is as follows:
n 2 = 1 + λ 2 0.4599 λ 2 5400
According to the Lambert–Beer law:
A = lg 1 T = kbc
where A is absorbance, T is transmissivity, k is the molar absorbance coefficient, c is the concentration of the absorbent substance, and b is the optical path of light.
In the ideal state, when unpolarized light is perpendicular to the incident on the surface of the sample, it has not produced a certain length of the optical path inside the gem. In this case, optical absorption inside the gem can be ignored and the transmittance through the surface of the gem can be expressed as:
T = 1 R
Transmissivity can be converted into absorbance according to the Lambert–Beer law:
T = 10 A = 1 R
A = lg T = lg ( 1 R )
R = ( n 0 n 1 n 0 + n 1 ) 2
A r l = 2 A = 2 lg [ 1 ( n 0 n 1 n 0 + n 1 ) 2 ]
where R is reflectivity, n0 =1 is the refractive index of light in air, n1 is the refractive index of light in the garnet, T is transmissivity, A is the absorbance generated by reflection at a single boundary, and Arl is the absorbance generated by reflection at two boundaries [30,31].

2.5. CIE1931 XYZ Colour Matching Functions

In 1931, the CIEXYZ colour system was proposed by the International Commission on Illumination. A colour-matching function, the CIE 1931 standard colorimetric observer spectrum tristimulus value, was obtained by matching the isoenergetic spectrum. The tristimulus values X, Y, and Z can be calculated by the colour-matching functions as follows:
X = λ k φ ( λ ) x ¯ ( λ ) d λ 380 780 k φ ( λ ) x ¯ ( λ ) Δ λ
Y = λ k φ ( λ ) y ¯ ( λ ) d λ 380 780 k φ ( λ ) y ¯ ( λ ) Δ λ
Z = λ k φ ( λ ) z ¯ ( λ ) d λ 380 780 k φ ( λ ) z ¯ ( λ ) Δ λ
k = 100 λ S ( λ ) y ¯ ( λ ) Δ λ
In the formula, S(λ) is the relative spectral power distribution of the light source. For non-luminous objects, φ(λ) is the product of the spectral transmittance T(λ) and the relative spectral power of the light source S(λ), expressed as T(λ) S(λ), or the product of its spectral reflectance R(λ) and the relative spectral power S(λ), expressed as R(λ)S(λ). K is the naturalization coefficient. For non-luminous objects, the value of Y of the selected standard illuminant was adjusted to 100 [32,33].

2.6. CIE1976 La*b* Colour System

The CIE1976 La*b* colour space is the most widely used in the field of colourimetry. The system consists of the axes of plane chromaticity a* and b*, and the vertical axis L*. +a* represents red, −a* represents green; +b* represents yellow, and −b* represents blue. The chroma C* and hue angle h(°) can be calculated from the chromaticities a* and b* [32,34]:
C * = a * 2 + b * 2
h = arctan b * a *
To calculate the colour difference of garnets under different sources of illumination, we chose the CIE Lab(ΔE*ab) colour difference formula:
Δ E a b * = ( Δ L * ) 2 + ( Δ a * ) 2 + ( Δ b * ) 2
where Δ a * = a D 65 * a A * , Δ b * = b D 65 * b A * , and Δ L * = L D 65 * L A * , and Δh(°) is the hue angle difference under different sources of illumination:
Δ h = h D 65 h A
where Δ C * is the chroma difference under different sources of illumination:
Δ C * = C D 65 * C A *

2.7. Colour Space Conversion

To easily observe the colour distribution, the colour tristimulus values in CIEXYZ were non-linearly converted to obtain the colour parameters L*, a* and b* in the CIE1976 L*a*b* colour space system [32,34]. The formula for conversion is as follows:
L * = 116 ( X X n ) 1 3 16
a * = 500 [ ( X X n ) 1 3 ( Y Y n ) 1 3 ]
b * = 200 [ ( Y Y n ) 1 3 ( Z Z n ) 1 3 ]
For the D65 light source, Xn = 95.04, Yn = 100, and Zn = 108.88. For light source A, Xn = 109.85, Yn = 100, and Zn = 35.58. Xn, Yn, and Zn are colorimetric data obtained from the CIE 1931 standard colorimetric observer (2°) [35].

3. Results

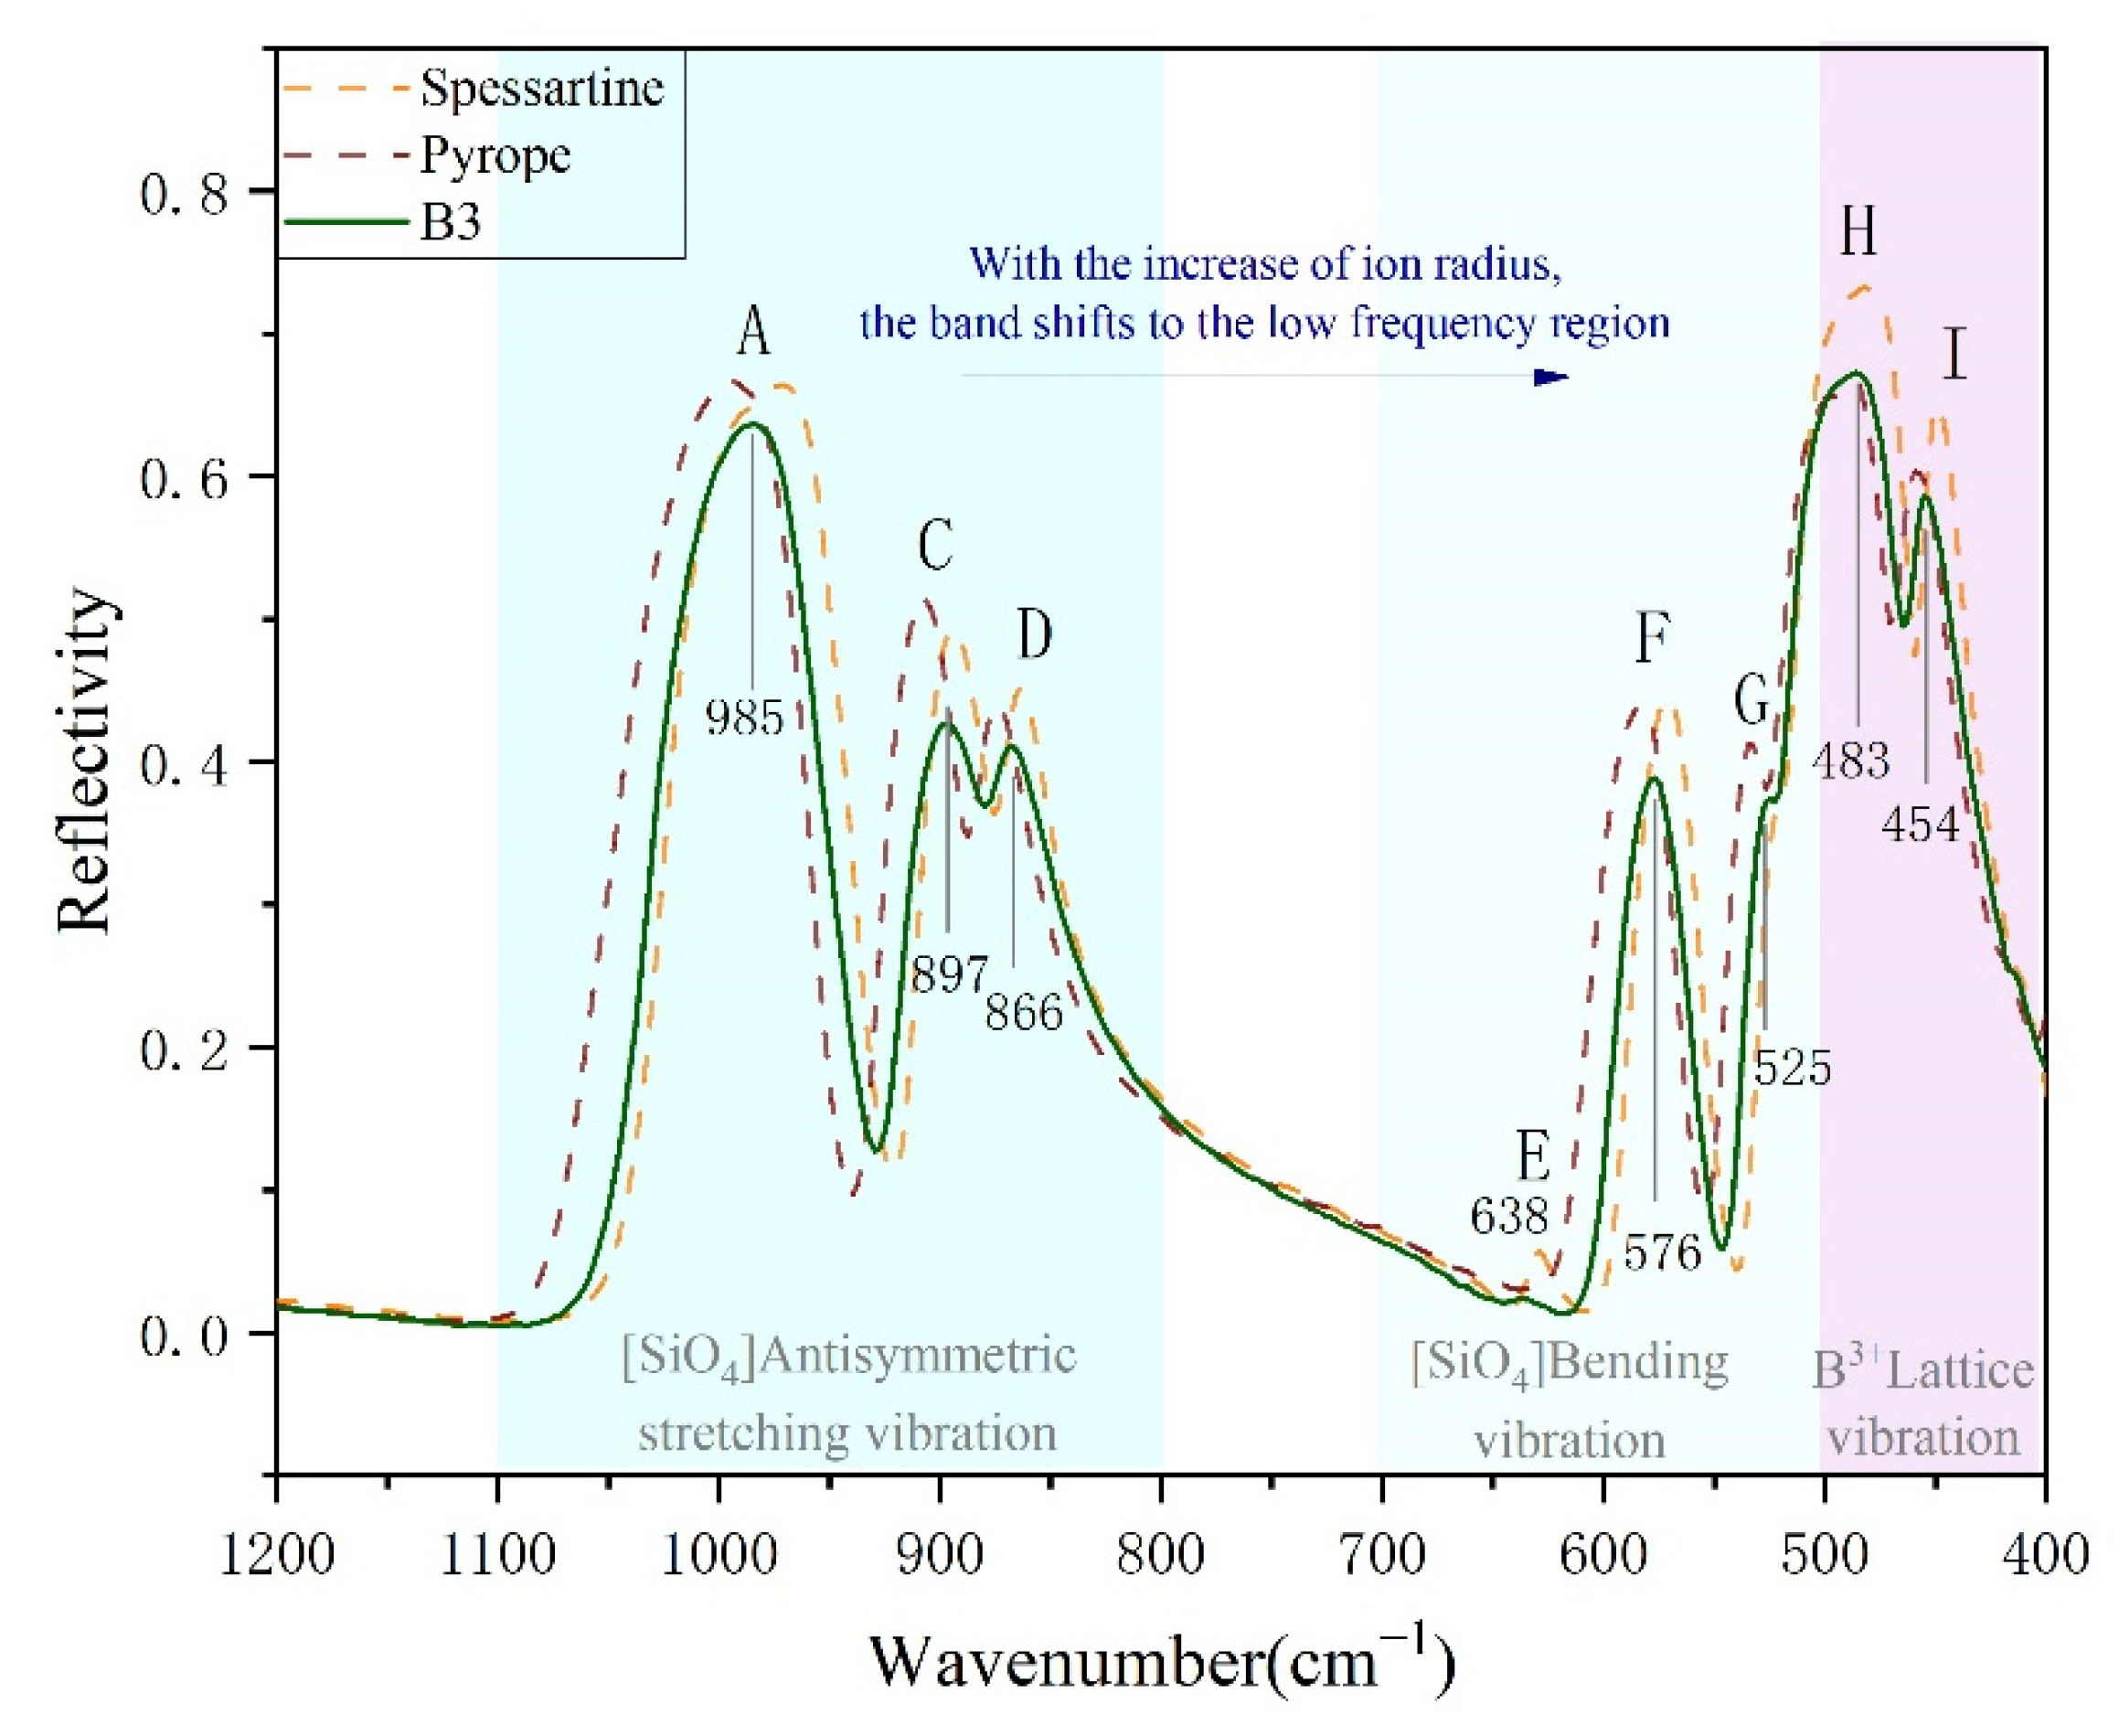
3.1. Infrared Spectral Characteristics of Colour-Changing Garnet

The infrared spectra of the garnets are shown in Figure 2. Vibrations inside the [SiO4]4− group produced the A–G absorption bands above 500 cm−1. The A–D absorption zone (bands in the range 800–1100 cm−1) is due to the antisymmetric stretching vibration of the [SiO4] tetrahedron, and is caused by the splitting of the υ3 triplet degenerate inside [SiO4]. The E–G absorption zone relates to the antisymmetric bending vibration of [SiO4], and shows a peak at 500–700 cm−1 due to double-degeneracy splitting of υ2 or triple-degeneracy splitting of υ4. External vibrations, namely lattice vibrations, produce the H–K absorption band, below 500 cm−1. The H–I absorption bands within this are related to vibrations of the trivalent cation (B3+), and the J–K absorption band to vibrations of the divalent cation (A2+) [36,37]. In the lattice of the garnets, the volume of the octahedral [BO6] group is higher than that of [SiO4], and the B-O bond is weaker than the Si-O bond. This is reflected in the decrease in the bond force constant K in the infrared spectra, and leads to the absorption band appearing in the low-frequency region [36].
Most garnets have E bands in the 600–650 cm−1 range. The intensity of band E is related to the ratio Pyr/Alm, and it decreases with the increase of the composition content of pyrope. Band E is stronger in spessartine, but the band G is weak or even missing [36]. When irradiated by infrared light, the sample selectively absorbs wavelengths that match its vibrational frequency and produce energy-level transitions. The energy required for vibration-induced transition depends on the reduced mass of atoms at both ends of the bond and its force constant. According to the vibration equation ν = 1 2 Π K m , when the group is fixed, its vibrational frequency is proportional to the chemical bond force constant K. That is, with the increase in the radius of the cation, electronegativity decreases, as does the bond energy between the metal cation and the oxygen ion. This reduces the vibrational frequency of the chemical bond, and the band frequency shifts to the region of low frequency [38]. In the garnets considered, the radius of Mn2+ is larger than those of Fe2+ and Mg2+ (Mn2+ > Fe2+ > Mg2+). As the radius increases, the bond force constant decreases and the band frequency shifts to the red region. The infrared spectrum of the colour-changing garnet is located between spessartine and pyrope, and belongs to the solid solution of pyrope-spessartine garnets.

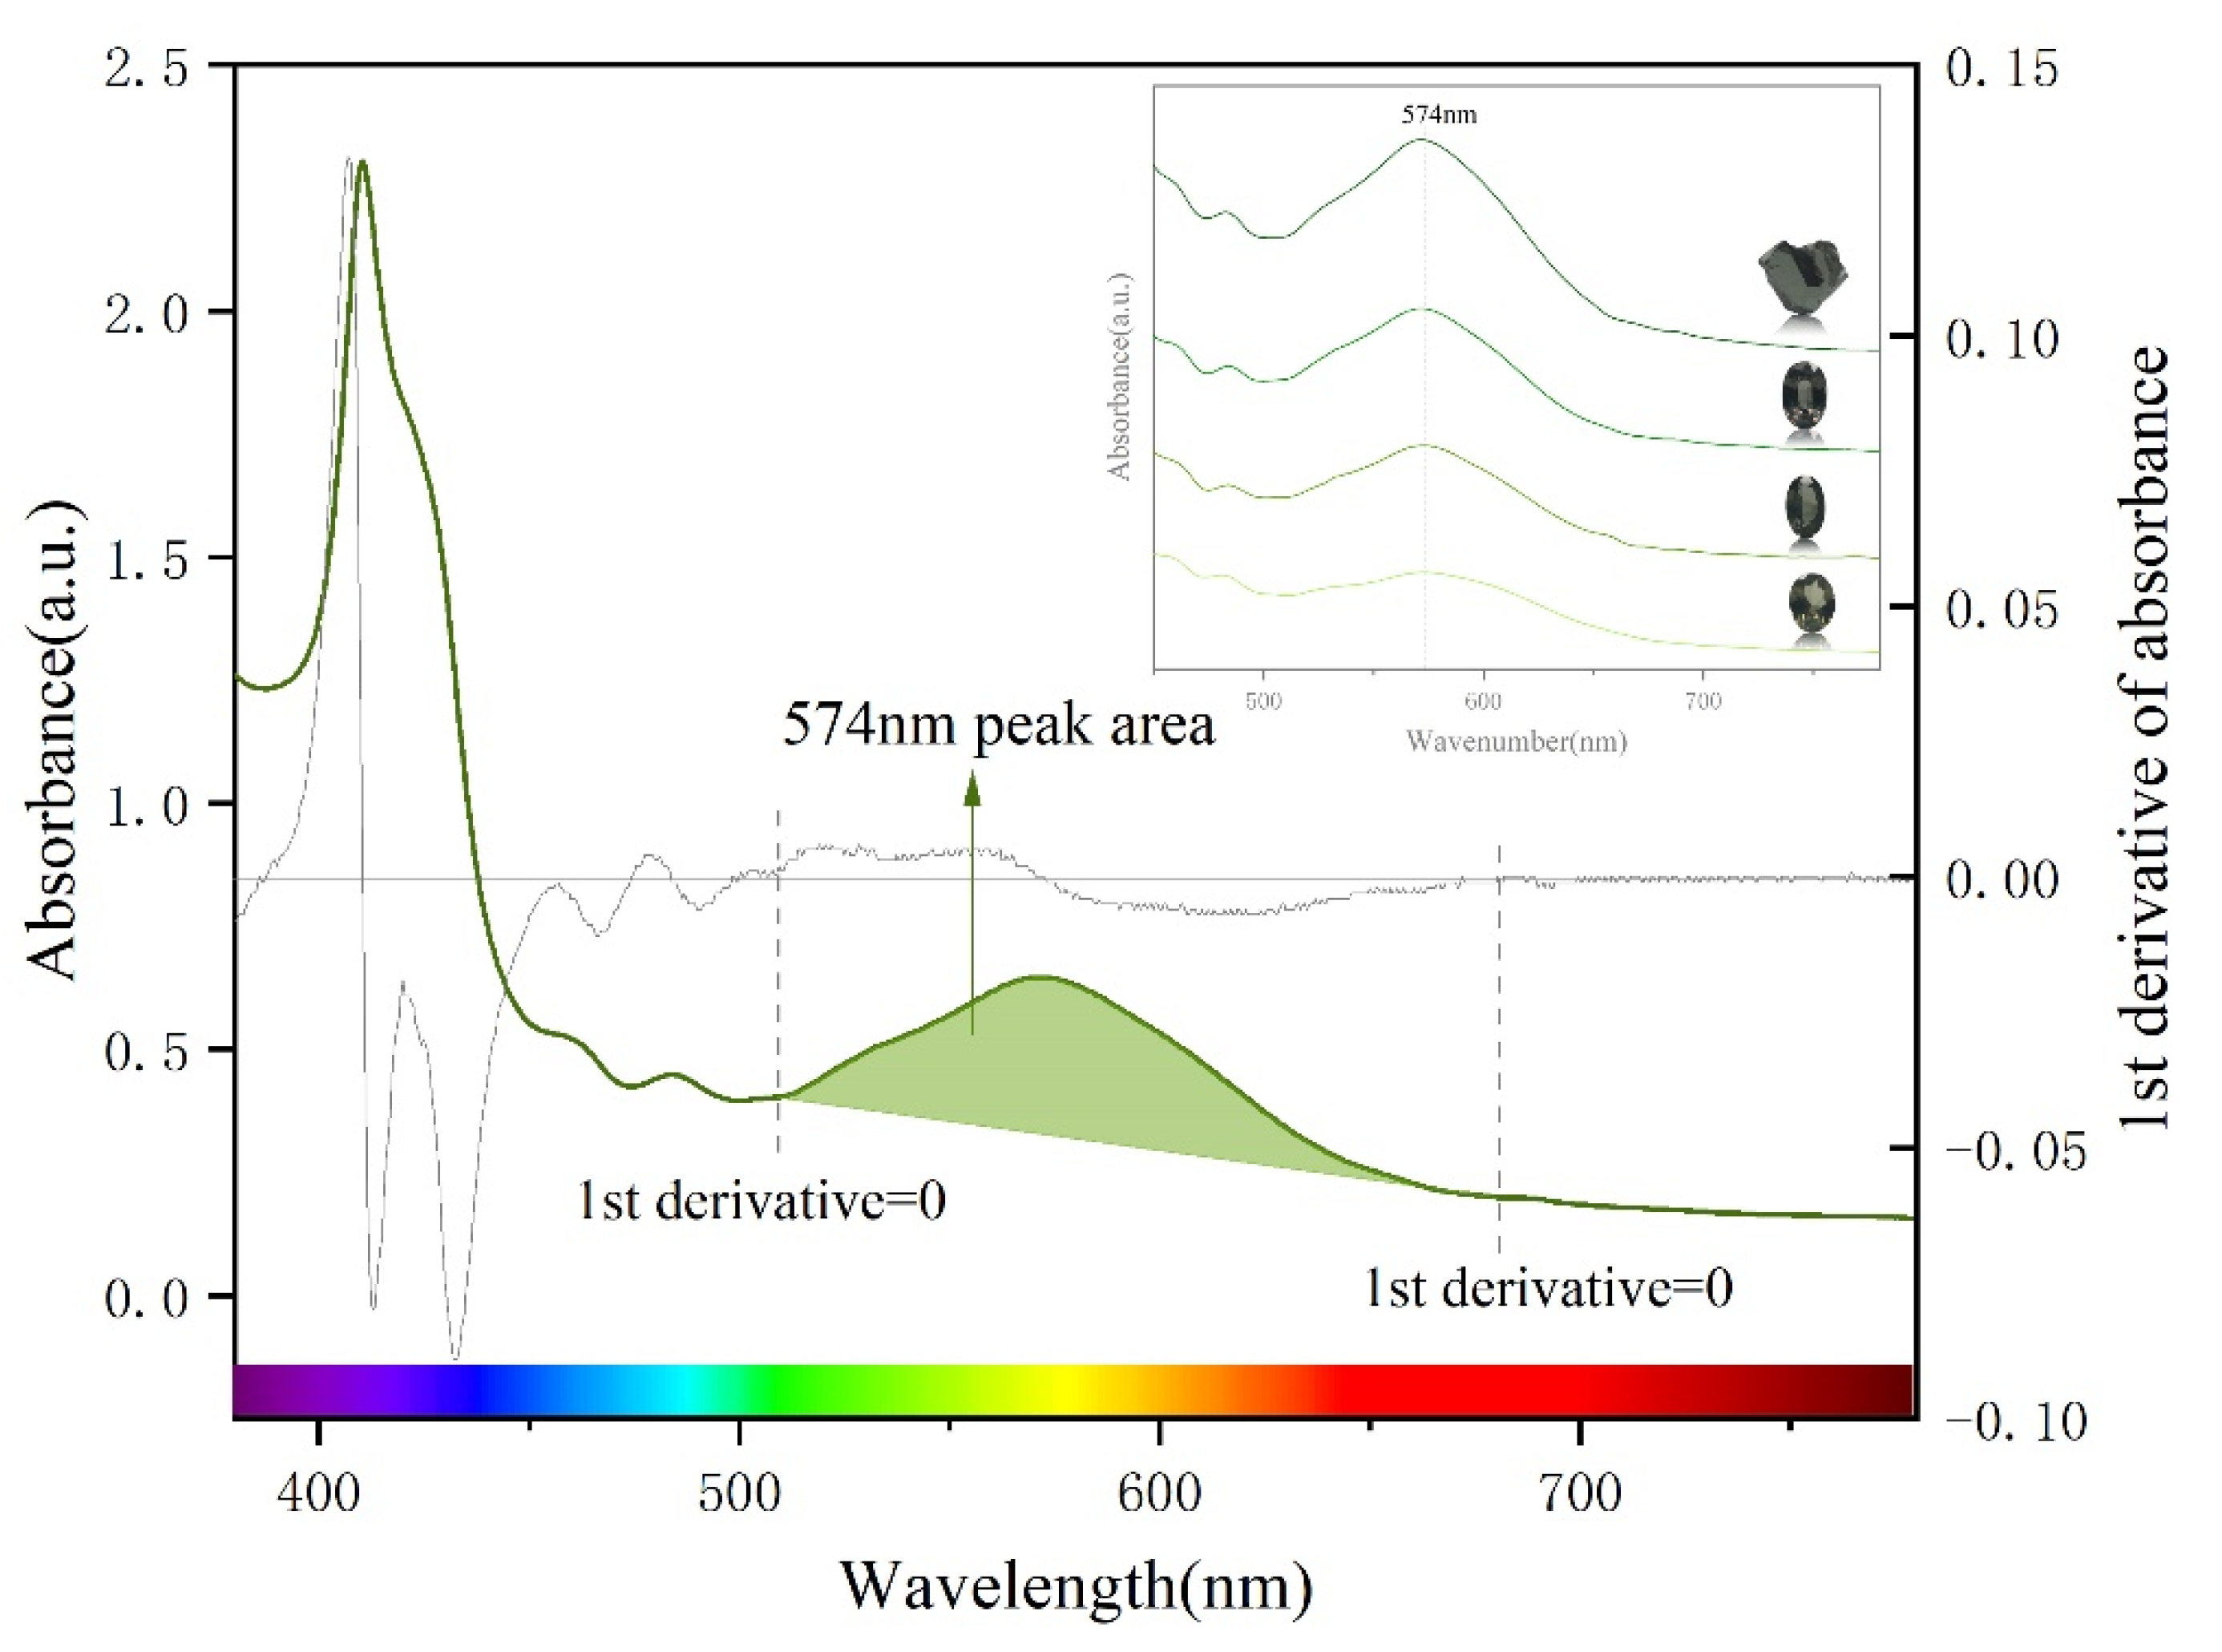
3.2. UV-Vis Spectral Characteristics of Colour-Changing Garnet

The crystal structure of garnet (Figure 3) is composed of an isolated [SiO4] tetrahedron bound to an [AlO6] octahedron in which some Al3+ ions are replaced by Fe3+ and Cr3+. Some large dodecahedral voids are formed between the tetrahedron and the octahedron, the top of each corner is occupied by O2- ions, and the center contained divalent metal ions. Each divalent ion is surrounded by eight oxygen, and have eight-fold coordination. The optical absorption spectra and colour of the garnet are determined by transition metal ions that occupied site A of the dodecahedron ([AO8]) and site B of the octahedron ([BO6]). On site A, Mn2+ and Fe2+ induce optical absorption bands in the visible spectrum, while on site B, Fe3+, Mn3+, V3+, and Cr3+ are responsible for optical transitions [39].
The UV-visible spectrum of the colour-changing garnet is shown in Figure 4. Four weak absorption peaks are present in the blue-green region. The absorption at 525 nm and 460 nm correspond to Mn2+ and the spin-forbidden transitions of Fe2+ (5Eg-3T1g and 5Eg-3E1g). The absorption at 506 nm corresponds to spin-forbidden transitions of Fe2+, 484 nm corresponds to Mn2+, and 424 nm corresponds to Mn2+ and six-fold spin-forbidden transitions of Fe3+ (6A1g-4A1g and 6A1g-4Eg). The three absorption bands of Fe3+ in the yellow-green area showed the typical absorption pattern of the “iron–aluminum window” in the spectroscope [40,41,42,43,44].
Two strong absorption bands are centered at 410 nm and 574 nm in the blue–purple and orange–yellow region, respectively. The absorption at these two positions are related to the d–d electron transition of V3+, and are assigned to the spin-allowed transitions 3T1g(3F) → 3T2g(3F) and3T1g(3F) → 3T1g(3P) [45], respectively. Cr3+ mainly occupies site B in the garnet crystal. With the action of the octahedral field, the d orbital undergo energy-level splitting, and electrons in the low-energy d orbital absorb energy and transmit to the high-energy d orbital. The 4A2g4T2g transition leads to absorption in the blue and purple region, and the 4A2g4T1g transition leads to absorption in the orange and yellow region of visible light [46]. Two transmission windows appear at 460–510 and 650–700 nm that transmit blue-green and red light, respectively. When the transmittance of the two regions is almost the same, the colour of the gem is determined by the external light source.

3.3. Correcting the Absorbance of UV-Vis Spectra

Accurate visible spectroscopic measurements rely on correctly identifying the spectral baseline. A relatively clean place in the interior was selected for the UV-Vis spectrum test to eliminate loss due to the scattering of light caused by inclusion. Sample B3 is used as an example. The spectrum after baseline correction by the Sellmeier equation is shown in Figure 5. The green line represents the original spectrum, the yellow line the absorption spectrum after baseline correction, and the gray line, which is approximately a straight line, represents absorption caused by boundary reflection.

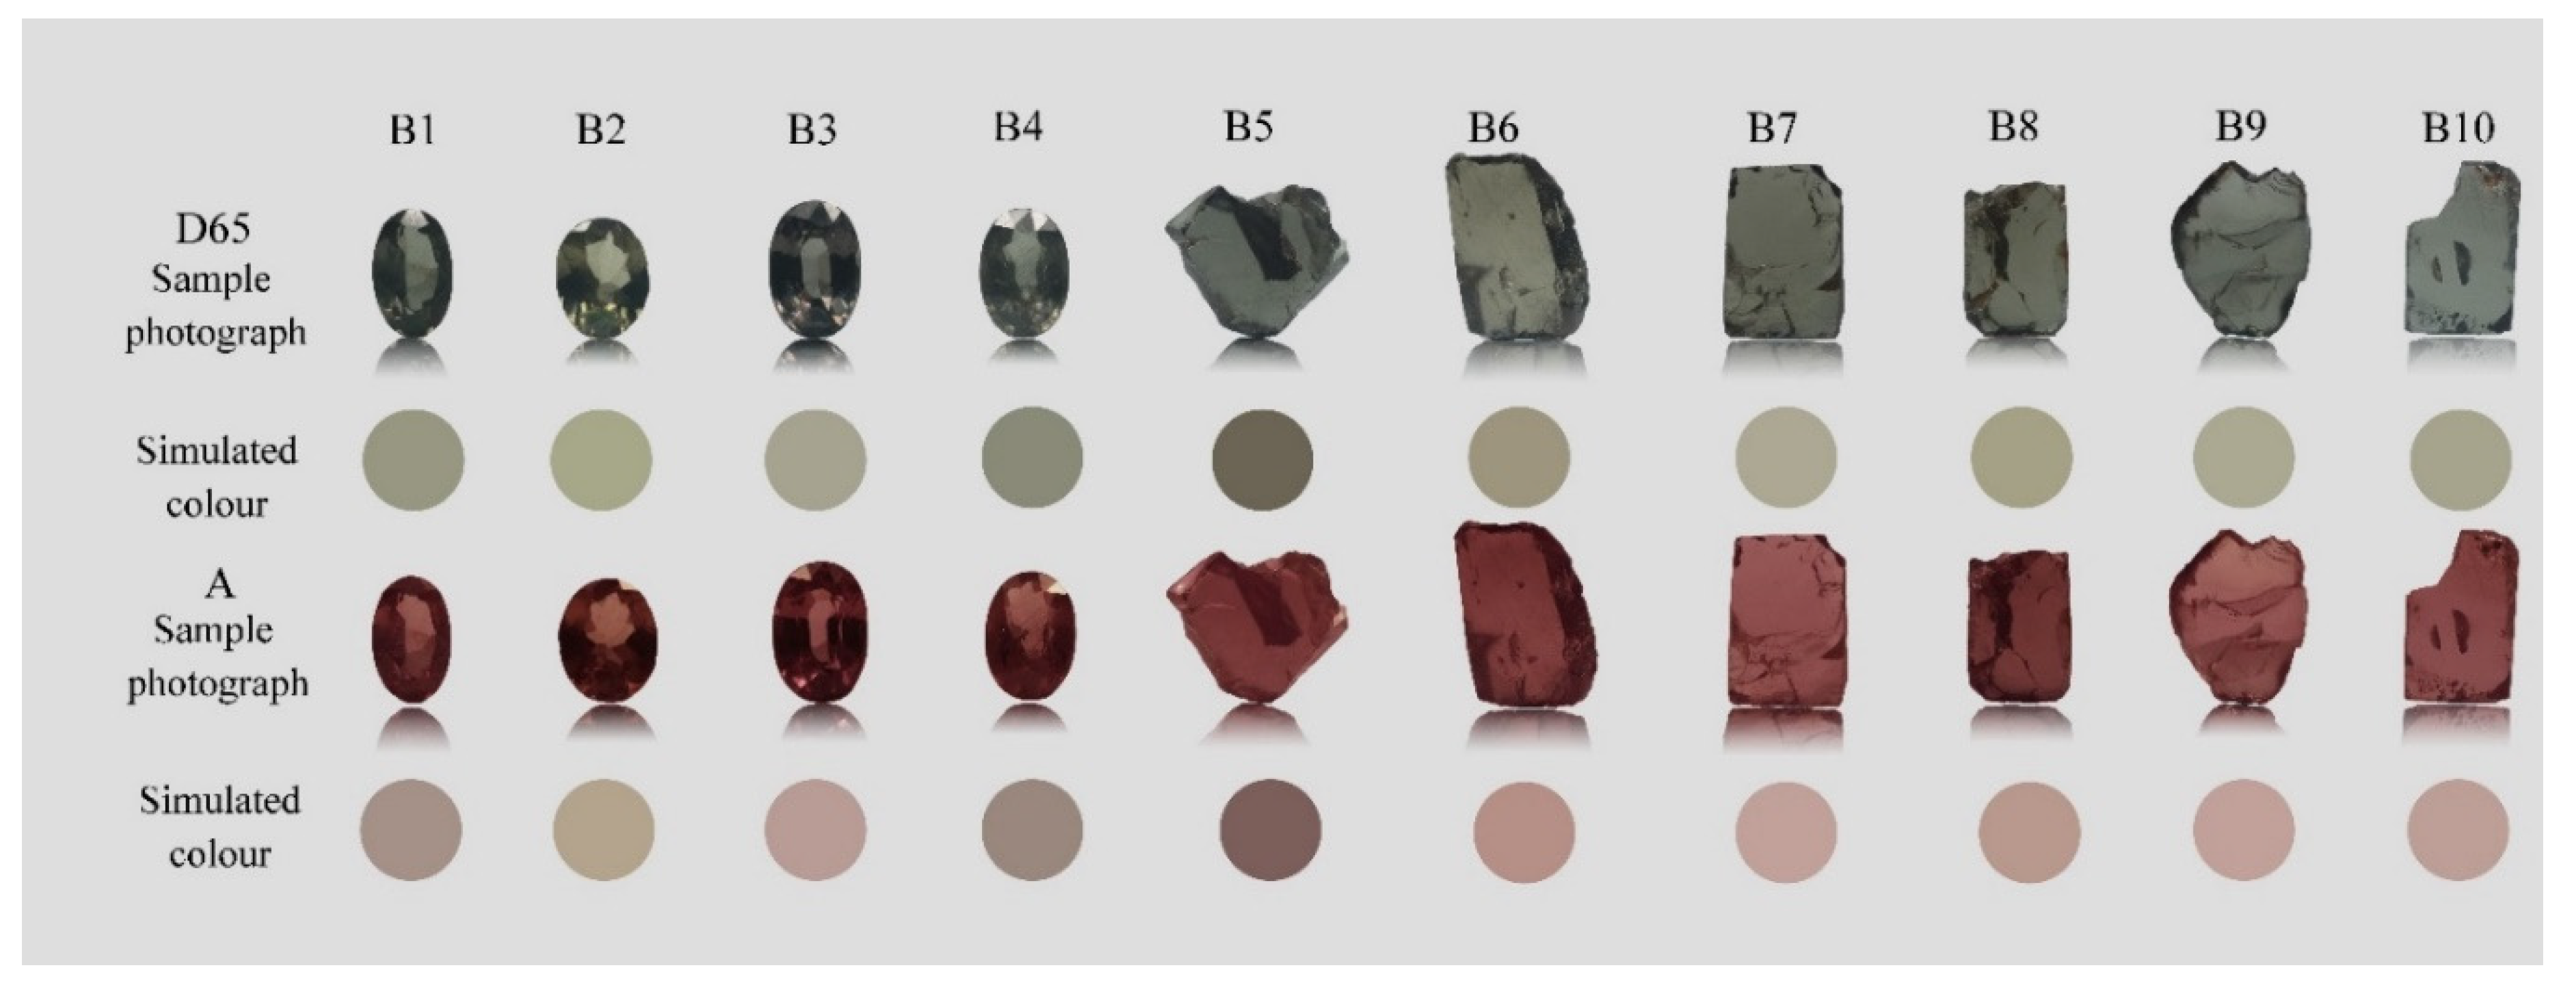
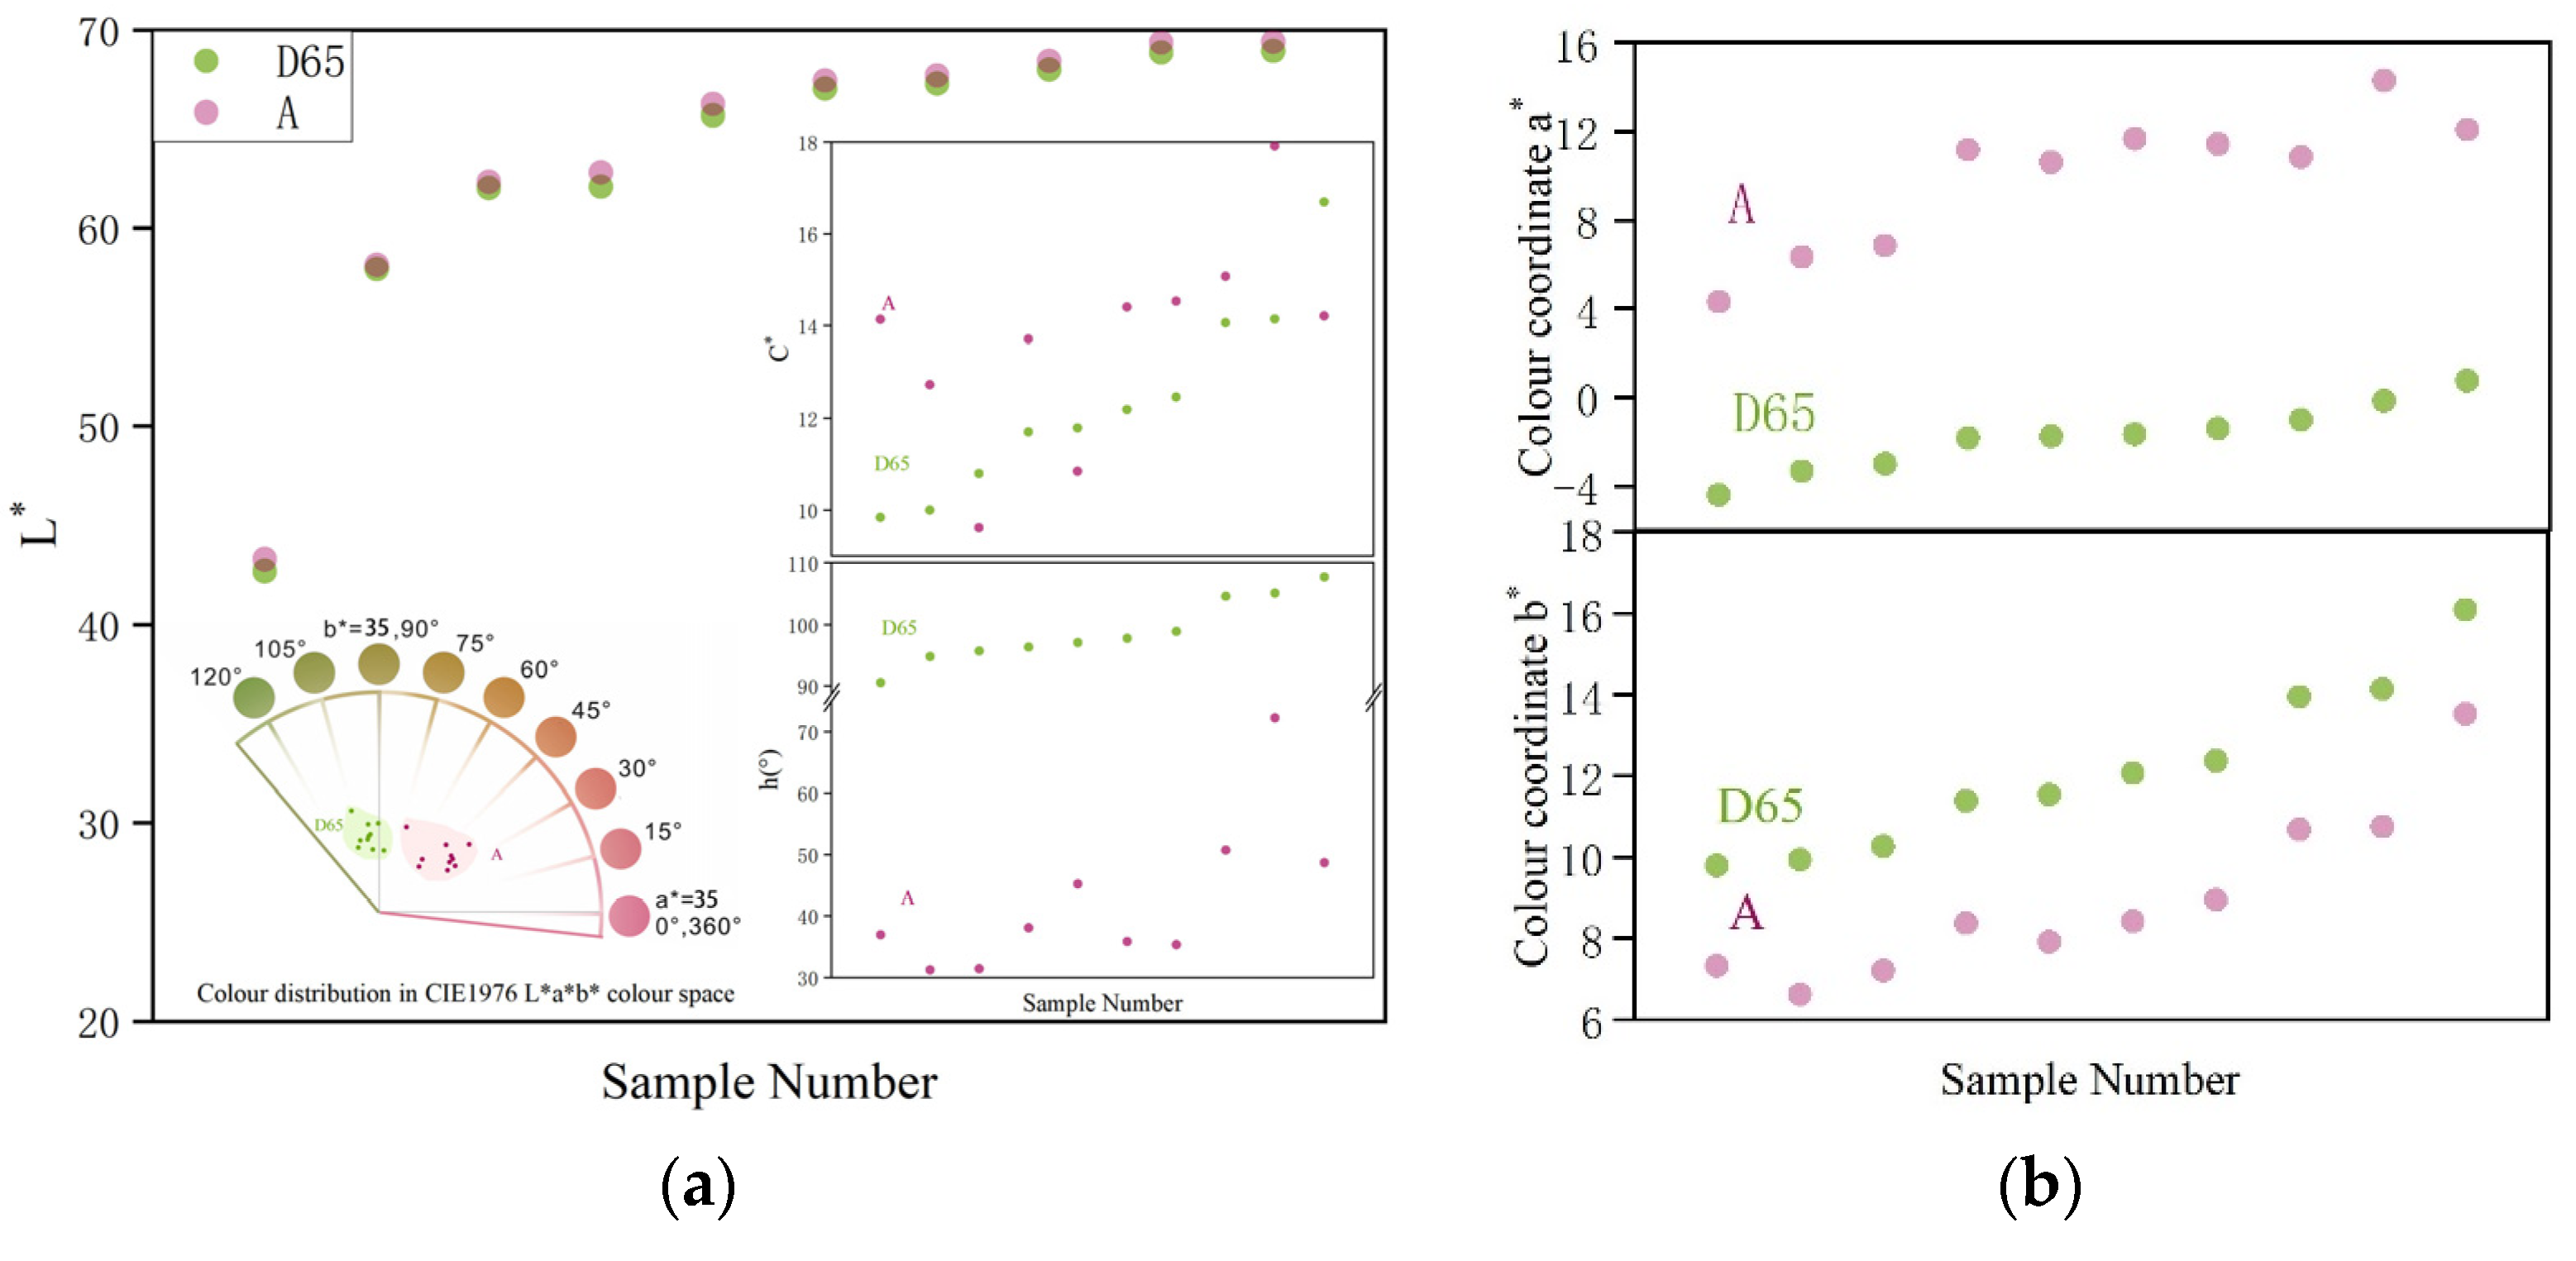
3.4. Colour Calculation by CIE1931 XYZ Colour Matching Functions

The “alexandrite effect” originally referred to an observed change in colour in the variety of the mineral chrysoberyl (from green under daylight to reddish-purple under incandescent light) [47]. Typically, the light sources are represented in colourimetry by standardized illuminants. The CIE Illuminant D65 represents average daylight with a correlated colour temperature of approximately 6504 K, and the CIE Illuminant A represents incandescent light with a correlated colour temperature of approximately 2856 K. Their spectral power distributions are shown in Figure 6a,b.
The colour of transparent gems can be calculated according to the spectra of the light source and the transmission spectra of the gems. The integral of the curve of spectral response corresponds to the signal emitted by cones of the human eye. The spectra of responses of the cones, the illuminants, and the transmittance of the stones are combined to determine the perception. Figure 6 shows spectral responses of the CIEXYZ colour-matching functions. In Figure 6c,d, the products of the illuminant spectra and the spectra of the colour matching functions are plotted. The integrals of these curves correspond to signals sent by the cones, and their values are marked (D65: X = 95.04, Y = 100, Z = 108.87; A: X = 109.85, Y = 100, Z = 35.58). These are approximately the colours of white objects perceived under the two light sources. The spectral response curve obtained in Figure 6c,d is multiplied by the transmission spectra (T(λ)) of garnet to obtain the colour of the gems under the D65 and A light sources by integrating the response curve (Figure 6e,f) (data on the CIEXYZ colour-matching functions were obtained from the official CIE website [48]).
In light of the UV-Vis spectrum of the colour-changing garnet, it is clear that the gem absorbs the blue-violet light and orange-yellow light, and allows equal transmittance of red and green light. The colour of the gem is thus determined by the external light source. Daylight has a higher spectral energy distribution in the blue-green region. When light is incident on the gem, Figure 6e shows that the spectral curve has the strongest response in the blue-green region. The sample appears green under daylight (X = 34.58, Y = 36.69, Z = 32.19).
Incandescent light has a higher spectral energy distribution in the red zone, causing the sample to transmit more components of red that obscured the green light. Figure 6f shows that the spectral curve has the strongest response in the red zone; red light was dominant, and is superimposed with a small amount of the transmitted purple light. The garnet thus appears purplish-red (X = 44.72, Y = 37.24, Z = 11.50).
The values of the colour tristimulus XYZ were non-linearly converted into the parameters of colour in the CIE1976 L*a*b* colour space, and the chroma value C* and hue angle h(°) of the colour under the D65 and A light sources were calculated. The results are shown in Table 1. Under D65 light, the average colour lightness ( L * ¯ ) is 63.07, the chroma average ( C * ¯ ) is 12.37, and the average hue angle ( h ¯ ) is 97.92°, representing green. Under light source A, the average colour lightness ( L * ¯ ) is 63.53, the chroma average ( C * ¯ ) is 13.72, and the average hue angle ( h ¯ ) is 42.56°, representing red.
In the CIE1976 L*a*b* colour space, the difference in hue angle is often used to quantitatively evaluate the intensity of colour-changing effect. When the difference in the hue angle is greater than 20°, prominent changes in colour can be observed [14]. The 10 samples selected in this study exhibit significant change in colour with hue angle difference greater than 20°. Figure 7 shows the simulated colour block calculated by the colour matching functions. It had a high degree of reduction to the real colour of the sample.

4. Discussion

4.1. Effect of Standard Light Source on Appearance of Colour-Changing Garnet

An one-way analysis of variance (ANOVA) of the parameters influencing colour is conducted under the D65 and A light sources, and the results are shown in Table 2. The different standard light sources have no significant effect on the lightness L* and chroma C* of the colour-changing garnet (p > 0.05), but have a significant effect on the colorimetric coordinates a* and b* as well as the hue angle h(°) (p < 0.05).
Figure 8 shows a comparison of the colour parameters under the D65 and A light sources. The results show that the lightness of the garnet under A is slightly higher than that under D65, and most of the samples exhibit higher chroma values under A. When the light source is changed from D65 to A, the colorimetric coordinate a* changes from negative to positive, that is, from green to red; the colorimetric coordinate b* decreases, and the concentration of yellow decreases. Samples with higher colorimetric coordinates a* and b* in the light source D65 are also higher under light source A.

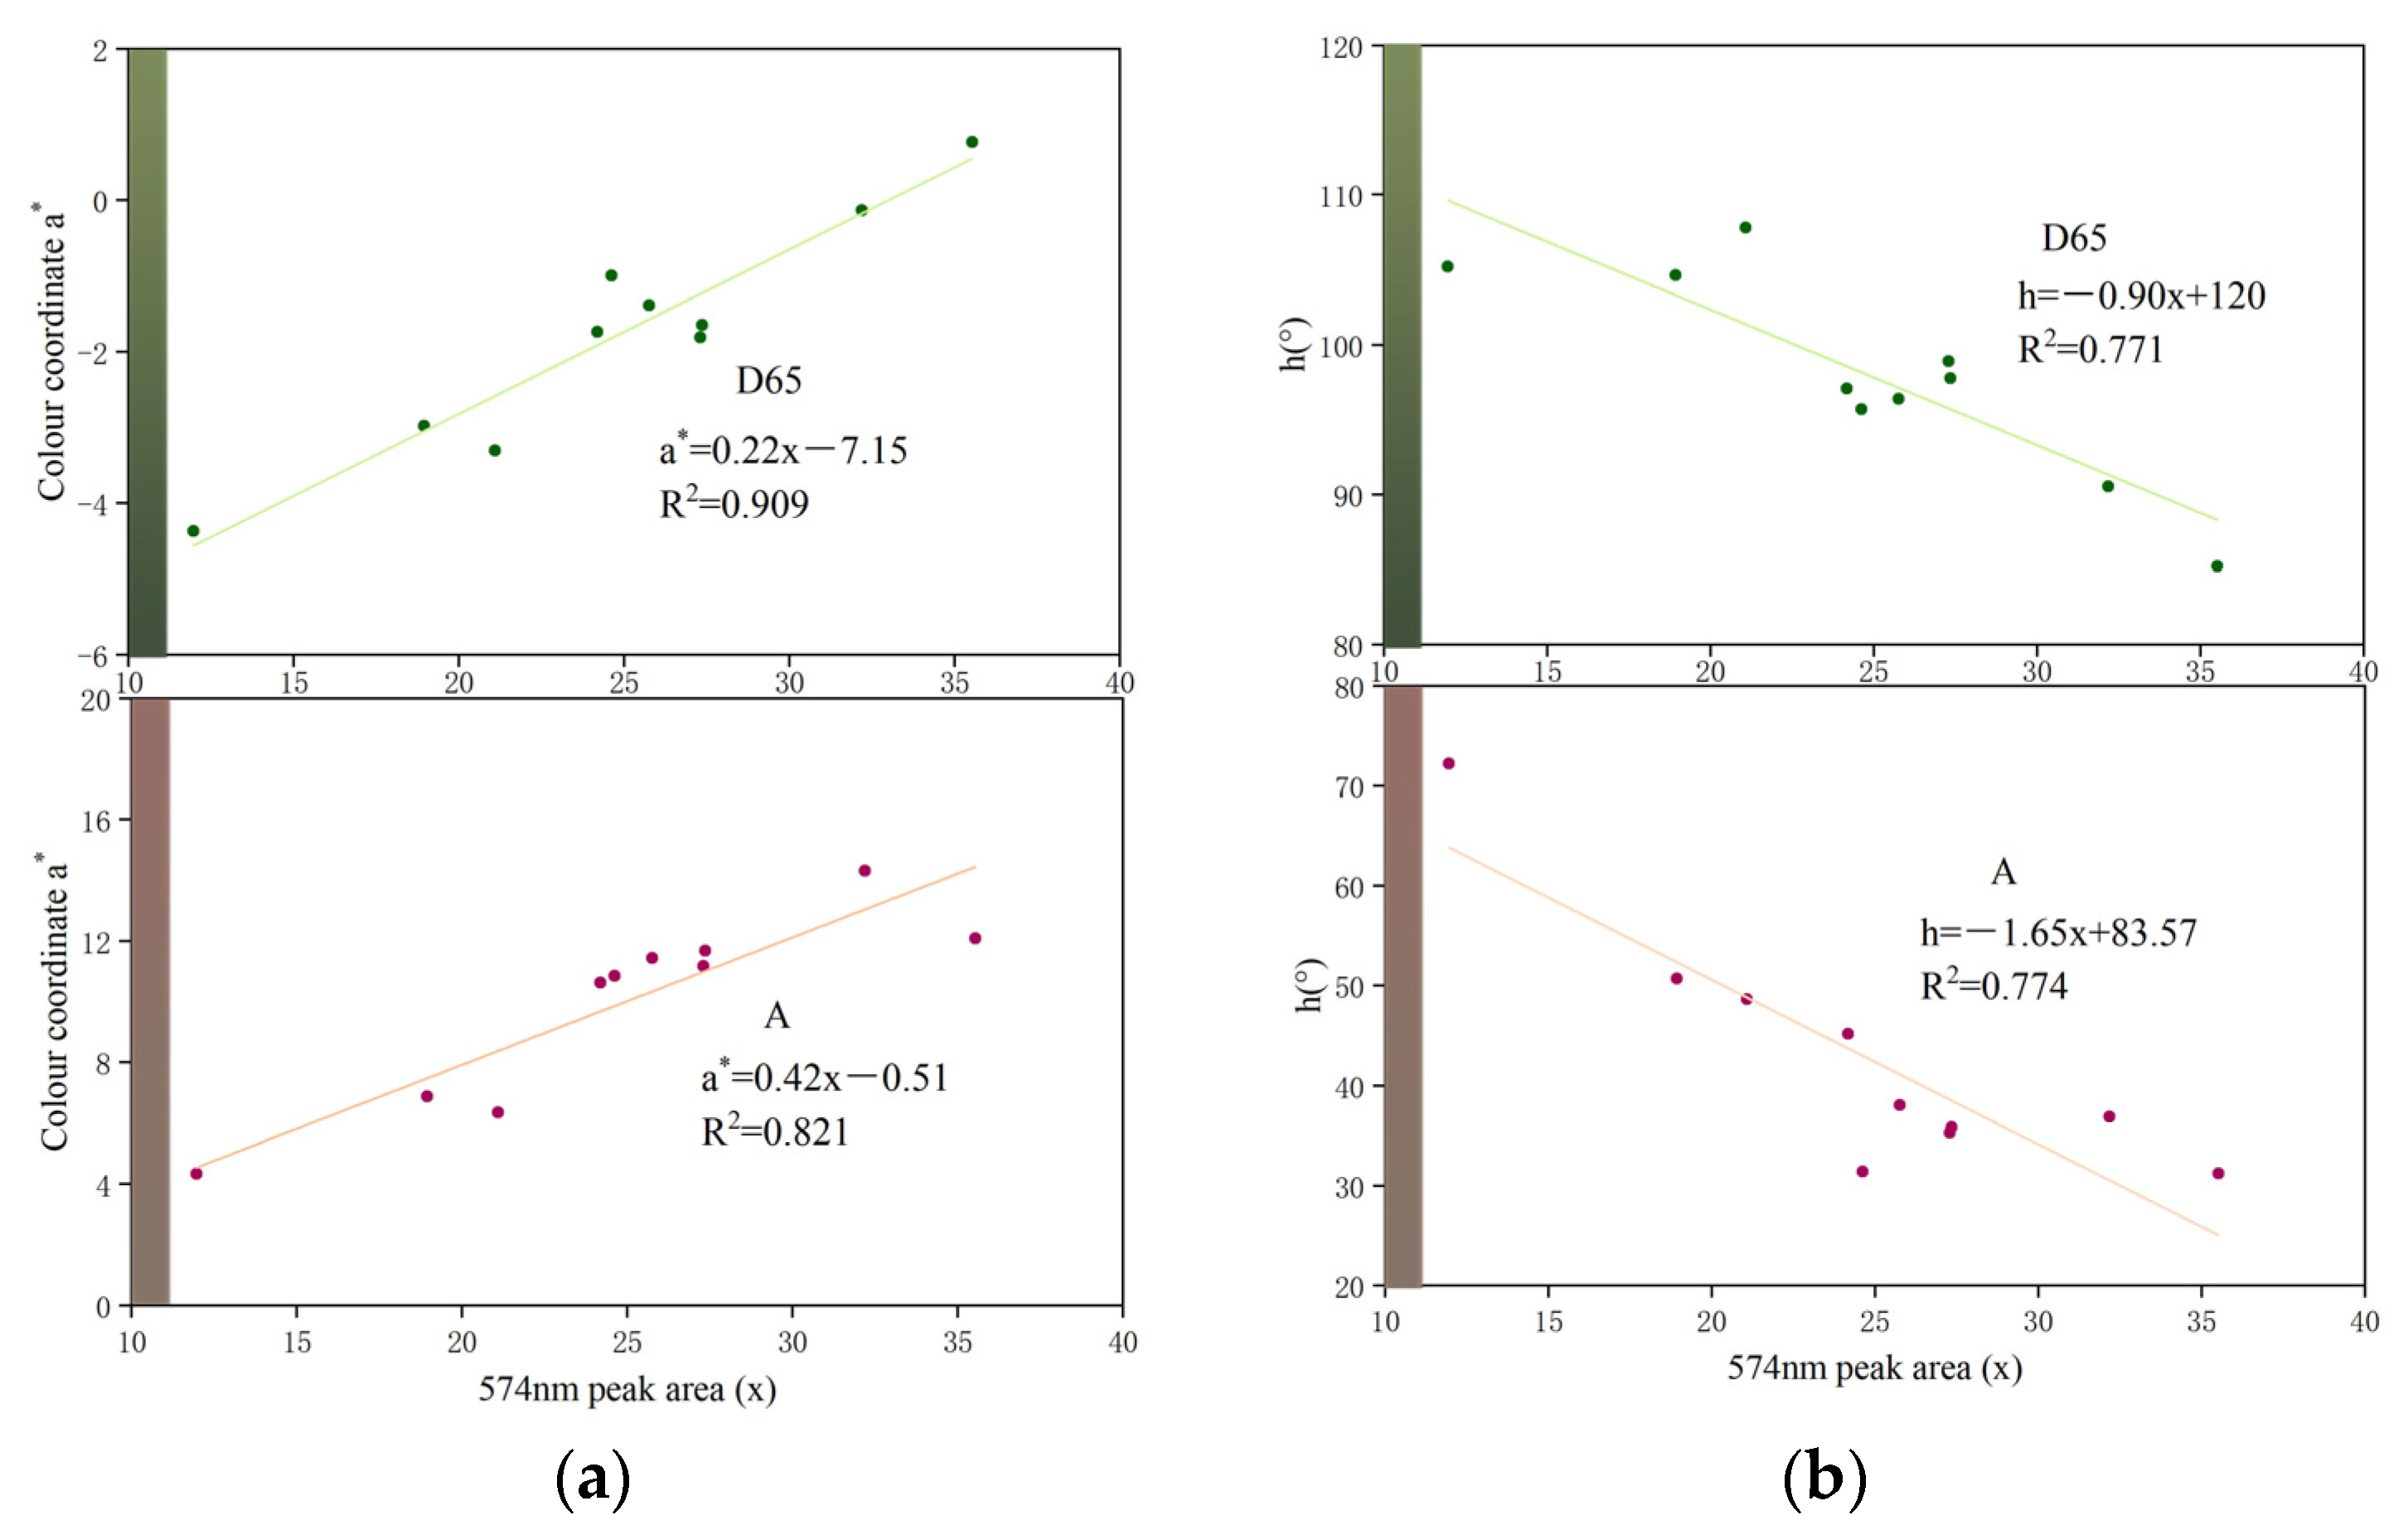
4.2. Effect of UV-Vis Absorbance Peak Area on Colorimetric Coordinate a* and Hue Angle h(°)

The strong absorption band at 574 nm in the UV-Vis spectrum plays a decisive role in determining the colour of a colour-changing garnet [39]. The first derivative of the UV-Vis spectrum is calculated, and points with a zero derivative near 510 nm and 680 nm are selected as starting and ending points, respectively, for calculating the peak area of absorption at 574 nm (Figure 9).
The results show that the colorimetric coordinate a* is positively correlated with the area of the peak at 574 nm (D65: R2 = 0.909; A: R2 = 0.821, Figure 10a). With the increase in the area, the colorimetric coordinate a* gradually increases, that is, the concentration of green decreases under the D65 light source, and the concentration of red increases under the A light source.
A negative correlation is noted between the hue angle h(°) and the peak area at 574 nm (D65: R2 = 0.771; A: R2 = 0.774, Figure 10b). With the increase in the peak area, the hue angle h(°) decreases gradually. Under the D65 light source, h(°) changes from 107.80° to 85.22°, and the colour of the garnet changes from green to yellow-green. Under light source A, h(°) changes from 72.22° to 31.26°, and the colour of the garnet changes from orange-red to red and purplish-red.

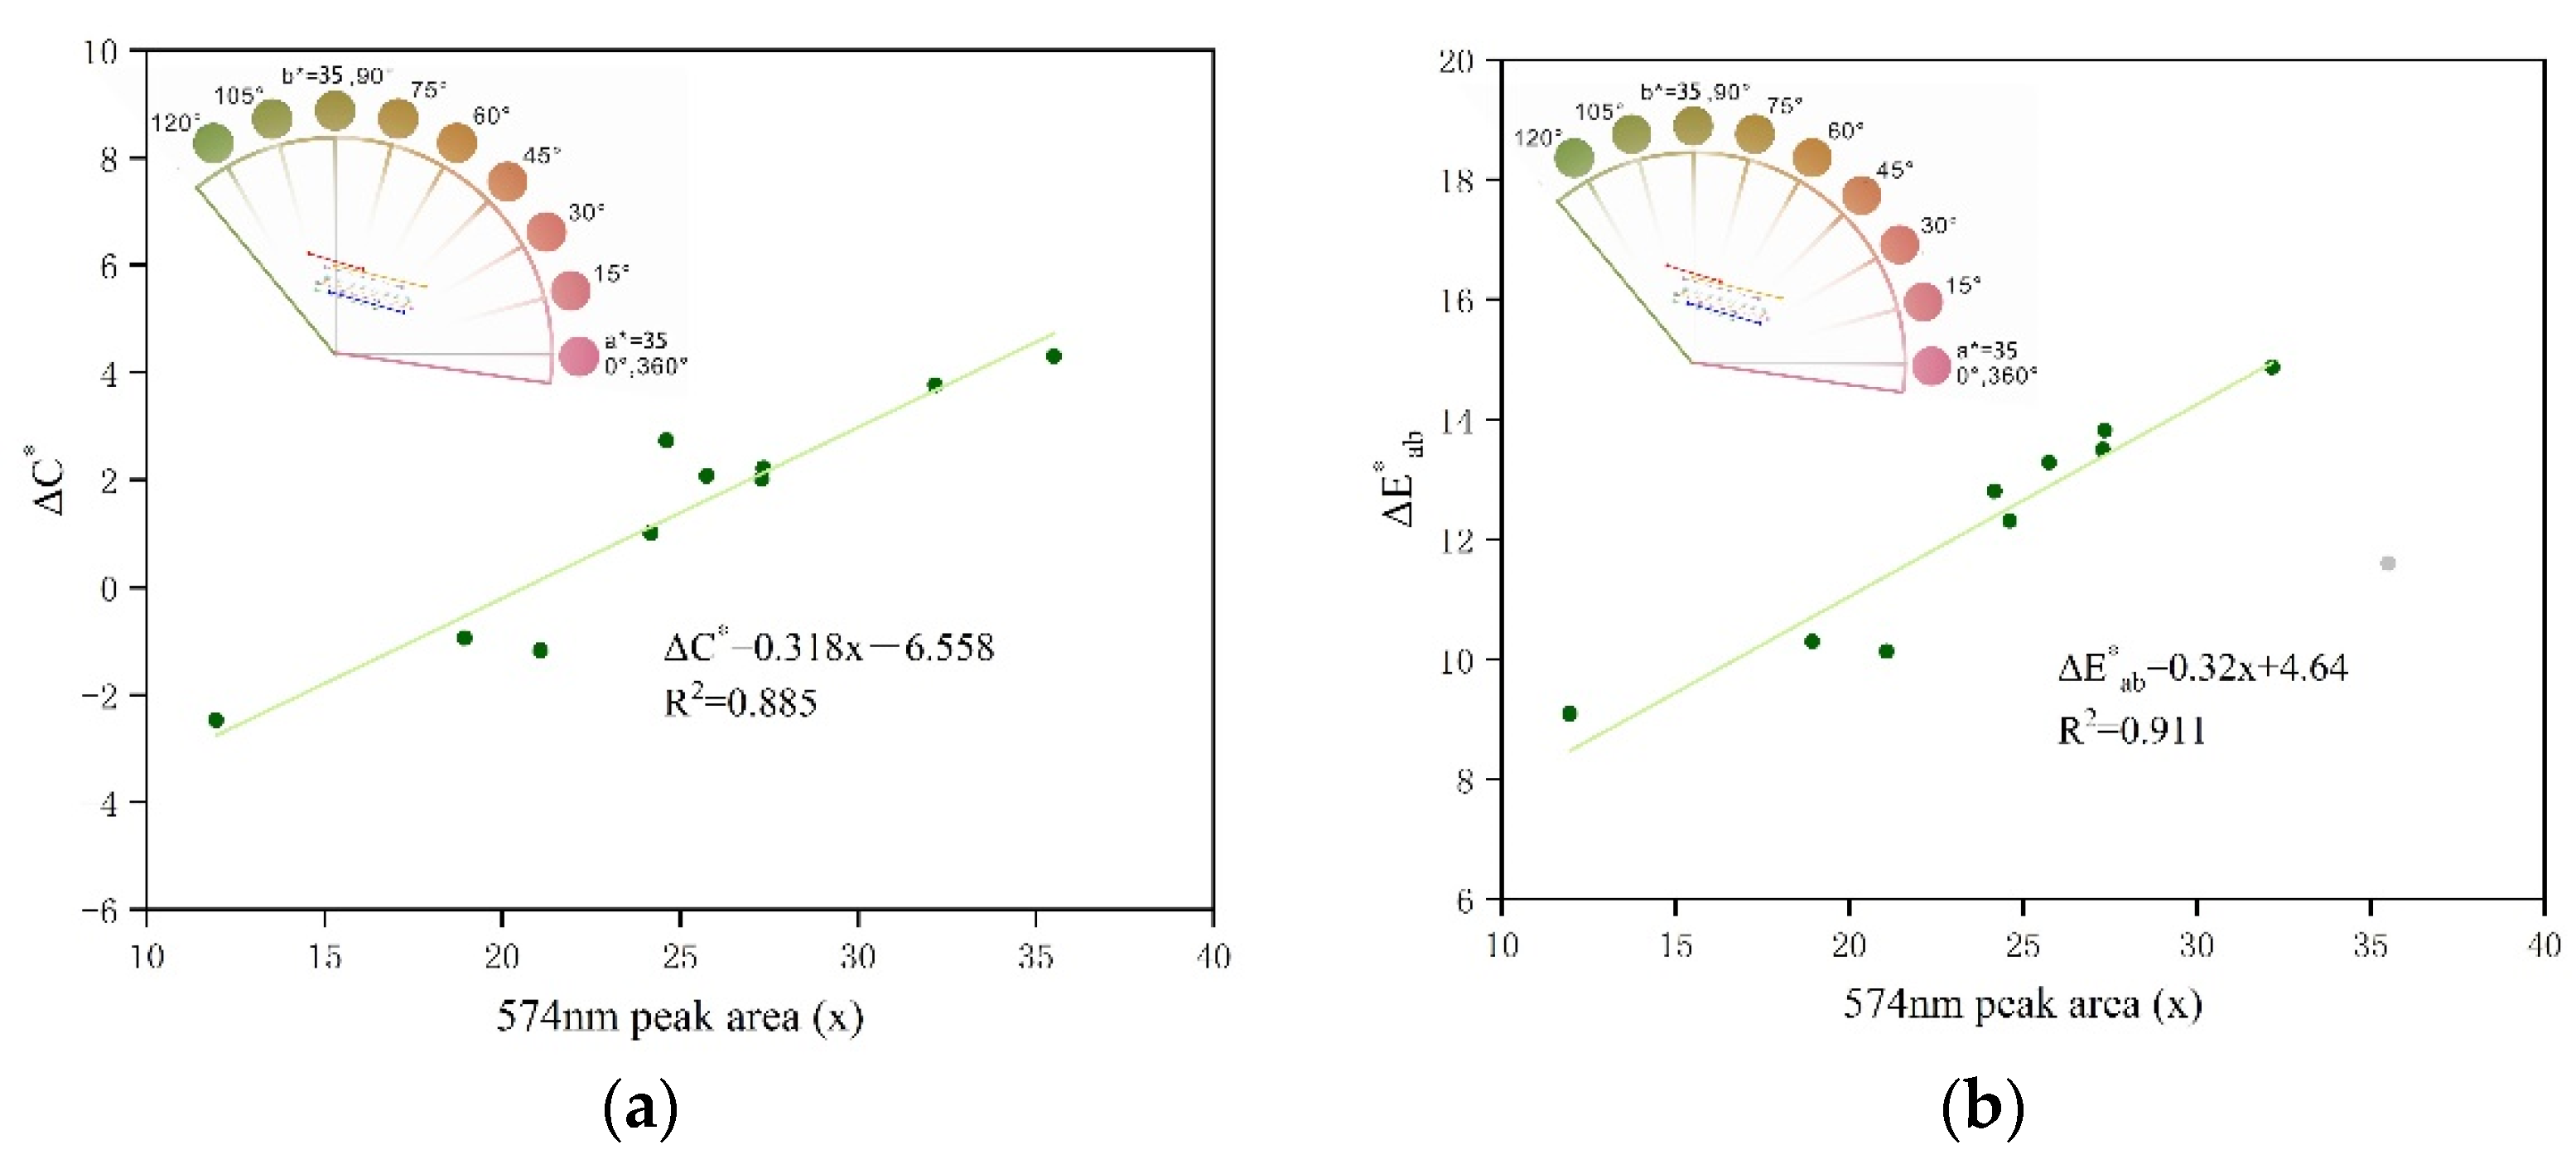
4.3. Effect of UV-Vis Absorbance Peak Area on Chroma Difference ΔC* and Colour Difference Δ E a b *

The calculated colour of the garnet is plotted in the CIE1976 La*b* colour space (Figure 11). In three-dimensional space, the line connecting the points under the two light sources signifies the Euclidean distance, which represents the colour difference ( Δ E a b * ) between the light sources. The colour of the garnets changes from green under D65 light source to orange-red and purple-red under A light source, with a change in the hue angle greater than 20°. When changing the light source from D65 to A, difference in the hue angle Δh(°) varies from 32.97° to 64.27°, the difference in chroma ΔC* varies from −2.48 to 4.30, and the colour difference Δ E a b * varies from 9.10 to 14.87. When the colour difference value Δ E a b * is greater than 6, the difference between colour is unacceptable in visual perception, and obvious color change can be observed visually [32].
To explore factors affecting colour when the light source is changed, the relationship between the area of peak absorption UV-Vis and colour parameters is analyzed. The differences in the chroma and colour of the garnet between the light sources are positively correlated with the absorption peak at 574 nm (R2 is 0.885 and 0.911, respectively; Figure 12), exhibiting good fitting. The results show that with the increase in the area of peak absorption at 574 nm, the differences in chroma and colour under D65 and A are large. This leads to a noticeable change in colour.

5. Conclusions

The infrared spectra show that the colour-changing garnets described in this paper belong to the solid solution of pyrope-spessartine garnets type. There are two zones of transmittance in the red region, 650–700 nm, and the blue-green region, 460–510 nm, of the UV-Vis spectra of a colour-changing garnet. They allow the same amount of light to pass through, because of which the colour of the gem is determined by the external light source. Daylight (D65) has a higher spectral energy distribution in the blue-green zone than incandescent light, which causes the garnet to appear green ( L * ¯ = 63.07 , C * ¯ = 12.37 , h ¯ = 97.92 ° ). Incandescent light (A) has higher spectral energy distribution in the red zone, which causes the colour-changing garnet to appear purple-red ( L * ¯ = 63.53 , C * ¯ = 13.72 , h ¯ = 42.56 ° ).
The absorption bands of Cr3+ and V3+ at 574 nm in the UV-Vis spectrum are the main cause of the change in colour. With the increase in the area of peak absorption, the colour of the garnet changes from green to yellow green under daylight (D65), and from orange red to purple-red under incandescent light (A). The colour difference and chroma difference also increases with the peak area, rendering prominent changes in the colour of the garnet more likely.

Supplementary Materials

The following are available online at https://www.mdpi.com/article/10.3390/min11080865/s1, Table S1: colour parameters, hue angle, chroma and colour difference between the light sources in CIE 1976 La*b* colour space.

Author Contributions

Conceptualization, Y.Q. and Y.G.; Methodology, Y.Q. and Y.G.; Validation, Y.Q. and Y.G.; Formal analysis, Y.Q.; Investigation, Y.Q. and Y.G.; Resources, Y.Q. and Y.G.; Data Curation, Y.Q.; Writing—original draft preparation, Y.Q.; Writing—review and editing, Y.G.; Visualization, Y.Q.; Supervision, Y.G.; Project administration, Y.G. Both authors have read and agreed to the published version of the manuscript.

Funding

This research received no external funding.

Data Availability Statement

Not applicable.

Acknowledgments

Thanks to the School of Gemmology, China University of Geoscience, Beijing.

Conflicts of Interest

The authors declare no conflict of interest.

References

  1. Kolesov, B.A.; Geiger, C.A. Raman spectra of silicate garnets. Phys. Chem. Miner. 1998, 25, 142–151. [Google Scholar] [CrossRef]
  2. Novak, G.A.; Gibbs, G.V. The crystal chemistry of the silicate garnets. Am. Mater. 1971, 56, 791–825. [Google Scholar]
  3. Pinheir, M.V.B.; Basiho, M.S. The cause of colour of the blue alexandrites from Malacacheta, Minas Gerais, Brazil. J. Gemol. 2000, 27, 161–170. [Google Scholar] [CrossRef]
  4. Zhou, D.Y.; Lu, T.J.; Sun, R.D.; Shi, G.H.; Chen, H.; Ke, J. Explanation of the alexandrite effect of zultanite: From the view of colorimetry and chemical analysis. Color Res. Appl. 2019, 44, 925–931. [Google Scholar] [CrossRef]
  5. Shen, C.; Lu, R. The color origin of gem diaspore: Correlation to corundum. Gems Gemol. 2018, 54, 394–403. [Google Scholar] [CrossRef]
  6. Liu, Y.; Shigley, J.; Moses, T.; Reinitz, I. The alexandrite effect of the Tavernier diamond caused by fluorescence under daylight. Color Res. Appl. 1998, 23, 323–327. [Google Scholar] [CrossRef]
  7. Chen, C.Y.; Huang, W.Z.; Shao, T.; Shen, C.; Li, Z.B.; Shen, A.H. The study on UV-Vis spectrum of a special color-changed sapphire. Spectrosc. Spectr. Anal. 2019, 39, 2470–2473. [Google Scholar]
  8. Sun, Z.Y.; Palke, A.C.; Renfro, N.; Breitzmann, H.; Hand, D.; Muyal, J. Discovery of color-change chrome grossular garnets from Ethiopia. Gems Gemol. 2018, 54, 233–236. [Google Scholar]
  9. Promwongnan, S.; Buathong, A. A rare nearly pure end-member grossular garnet with color-change effect. Gems Gemol. 2018, 54, 336. [Google Scholar]
  10. Schmetzer, K.; Hainschwang, T.; Bernhardt, H.-J.; Kiefert, L. New chromium- and vanadium-bearing garnets from Tranoroa, Madagascar. Gems Gemol. 2002, 38, 148–155. [Google Scholar] [CrossRef]
  11. Schmetzer, K.; Bernhardt, H.-J. Garnets from Madagascar with a color change of blue-green to purple. Gems Gemol. 1999, 35, 196–201. [Google Scholar] [CrossRef] [Green Version]
  12. Sun, Z.Y.; Palke, A.C.; Renfro, N. Vanadium- and chromium-bearing pink pyrope garnet: Characterization and quantitative colorimetric analysis. Gems Gemol. 2015, 51, 348–369. [Google Scholar] [CrossRef] [Green Version]
  13. Gübelin, E.; Schmetzer, K. Gemstones with alexandrite effect. Gems Gemol. 1982, 18, 197–203. [Google Scholar] [CrossRef]
  14. Liu, Y.; Shigley, J.; Fritsch, E.; Hemphill, S. The “alexandrite effect” in gemstones. Color Res. Appl. 1994, 19, 186–191. [Google Scholar] [CrossRef]
  15. Tang, J.; Guo, Y.; Xu, C. Color effect of light sources on peridot based on CIE1976 L*a*b* color system and round RGB diagram system. Color Res. Appl. 2019, 44, 932–940. [Google Scholar] [CrossRef]
  16. Cheng, R.P.; Guo, Y. Study on the effect of heat treatment on amethyst color and the cause of coloration. Sci. Rep. 2020, 10, 14927. [Google Scholar] [CrossRef] [PubMed]
  17. Wang, X.D.; Guo, Y. The impact of trace metal cations and absorbed water on colour transition of turquoise. R. Soc. Open Sci. 2021, 8, 201110. [Google Scholar] [CrossRef] [PubMed]
  18. Guo, Y. Quality grading system of Jadeite-Jade green based on three colorimetric parameters under CIE standard light sources D-65, CWF and A. Bulg. Chem. Commun. 2017, 49, 961–968. [Google Scholar]
  19. Guo, Y.; Zong, X.; Qi, M. Feasibility study on quality evaluation of Jadeite-jade color green based on GemDialogue color chip. Multimed. Tools Appl. 2019, 78, 841–856. [Google Scholar] [CrossRef]
  20. Tooms, M.S. Exploiting colorimetric relationships in characterizing the spectral response functions of the human visual system directly from colour matching functions. Color Res. Appl. 2020, 45, 782–795. [Google Scholar] [CrossRef]
  21. Kasajima, I.; Sasaki, K. Dichromatism causes color variations in leaves and spices. Color Res. Appl. 2015, 40, 605–611. [Google Scholar] [CrossRef]
  22. Kasajima, I. Alexandrite-like effect in purple flowers analyzed with newly devised round RGB diagram. Sci. Rep. 2016, 6, 29630. [Google Scholar] [CrossRef] [Green Version]
  23. Sun, Z.Y.; Palke, A.C.; Muyal, J.; McMurtry, R. How to facet gem-quality chrysoberyl: Clues from the relationship between color and pleochroism, with spectroscopic analysis and colorimetric parameters. Am. Miner. 2017, 102, 1747–1758. [Google Scholar] [CrossRef]
  24. Xie, F.; Cao, Y.; Ranchon, C.; Hart, A.; Hansen, R. Explanation of the colour change in alexandrites. Sci. Rep. 2020, 10, 6130. [Google Scholar] [CrossRef] [Green Version]
  25. Fairchild, M.D. Color appearance models and complex visual stimuli. J. Dent. 2010, 38, e25–e33. [Google Scholar] [CrossRef]
  26. DiDomenico, M.; Wemple, S.H. Oxygen-octahedra ferroelectrics. I. Theory of electro-optical and nonlinear optical effects. J. Appl. Phys. 1969, 40, 720–734. [Google Scholar] [CrossRef]
  27. Wemple, S.H.; DiDomenico, M. Behavior of the electronic dielectric constant in covalent and ionic materials. Phys. Rev. B 1971, 3, 1338–1351. [Google Scholar] [CrossRef]
  28. Wemple, S.H. Optical oscillator strengths and excitation energies in solids, liquids, and molecules. J. Chem. Phys. 1977, 67, 2151–2168. [Google Scholar] [CrossRef]
  29. Medenbach, O.; Shannon, R.D. Refractive indices and optical dispersion of 103 synthetic and mineral oxides and silicates measured by a small-prism technique. J. Opt. Soc. Am. B 1997, 14, 3299–3318. [Google Scholar] [CrossRef]
  30. Han, Z.Y.; Sun, D.L.; Zhang, H.L.; Luo, J.Q. Investigation on the growth and properties of six garnet single crystals with large lattice constants. Cryst. Res. Technol. 2021, 56, 2000221. [Google Scholar] [CrossRef]
  31. Shen, C. Color quantification of gem corundum. Master’s Thesis, China University of Geosciences, Wuhan, China, 2019. [Google Scholar]
  32. Liao, N.F.; Shi, J.S.; Wu, W.M. An Introduction to Digital Color Management System; Beijing Institute of Technology Press: Beijing, China, 2009. [Google Scholar]
  33. ISO/CIE 11664-3:2012(E) Colorimetry—Part 3: CIE Tristimulus Values; ISO: Geneva, Switzerland; CIE: Vienna, Austria, 2012.
  34. ISO/CIE 11664-4:2019(E) Colorimetry—Part 4: CIE 1976 L*a*b* Colour Space; ISO: Geneva, Switzerland; CIE: Vienna, Austria, 2019.
  35. CIE International Commission on Illumination. CIE15-2004: Colorimetry, 3rd ed.; CIE: Vienna, Austria, 2004. [Google Scholar]
  36. Moore, R.K.; White, W.B.; Long, T.V. Vibrational spectra of the common silicates: I. The garnets. Am. Miner. 1971, 56, 54–71. [Google Scholar]
  37. Hofmeister, A.M.; Fagan, T.J.; Campbell, K.M.; Schaal, R.B. Single-crystal IR spectroscopy of pyrope-almandine garnets with minor amounts of Mn and Ca. Am. Mineral. 1996, 81, 418–429. [Google Scholar] [CrossRef]
  38. Weng, S.F.; Xu, Y.Z. Fourier Transform Infrared Spectroscopy Analysis, 3rd ed.; Chemical Industry Press: Beijing, China, 2016; pp. 10–429. (In Chinese) [Google Scholar]
  39. Schmetzer, K.; Bernhardt, H.-J.; Bosshart, G.; Hainschwang, T. Colour-change garnets from Madagascar: Variation of chemical, spectroscopic and colorimetric properties. J. Gemol. 2010, 31, 235–282. [Google Scholar] [CrossRef]
  40. Moore, R.K.; White, W.B. Electronic spectra of transition metal ions in silicate garnets. Can. Mineral. 1972, 11, 791–811. [Google Scholar]
  41. Taran, M.N.; Dyar, M.D.; Matsyuk, S.S. Optical absorption study of natural garnets of almandine-skiagite composition showing intervalence Fe2+ + Fe3+→Fe3+ + Fe2+ charge-transfer transition. Am. Miner. 2008, 92, 753–760. [Google Scholar] [CrossRef]
  42. Krambrock, K.; Guimarães, F.S.; Pinheiro, M.V.B. Purplish-red almandine garnets with alexandrite-like effect: Causes of colors and color-enhancing treatments. Phys. Chem. Miner. 2013, 40, 555–562. [Google Scholar] [CrossRef]
  43. Schmetzer, K.; Hainschwang, T.; Kiefert, L.; Bernhardt, H.-J. Pink to pinkish orange Malaya garnets from Bekily, Madagascar. Gems Gemol. 2001, 37, 296–308. [Google Scholar] [CrossRef]
  44. Heidi, B.; Breitzmann, H.; Sun, Z.Y.; Palke, A.C. Color-change spessartine garnet: A first report. Gems Gemol. 2019, 55, 254–257. [Google Scholar]
  45. Geiger, C.A.; Stahl, A.; Rossman, G.R. Single-crystal IR- and UV/VIS-spectroscopic measurements on transition-metal-bearing pyrope: The incorporation of hydroxide in garnet. Eur. J. Mineral. 2000, 12, 259–271. [Google Scholar] [CrossRef]
  46. Li, L.P.; Ye, D. Role of Cr and V in colour change effect of gemstones. Gems Gemol. 2003, 5, 17–21, (In Chinese with English abstract). [Google Scholar]
  47. Liu, Y.; Shigley, J.; Fritsch, E.; Hemphill, S. Abnormal hue-angle change of the gemstone tanzanite between CIE illuminants D65 and a in CIELAB color space. Color Res. Appl. 1995, 20, 245–250. [Google Scholar] [CrossRef]
  48. CIE International Commission on Illumination. Available online: http://cie.co.at/technical-work/technical-resources. (accessed on 2 March 2021).
Figure 1. Photograph of 10 samples of colour-changing garnets. (a) Gray-green under standard D65 light. (b) Purplish red under standard A light.
Minerals 11 00865 g001
Figure 2. FTIR spectra of the colour-changing garnet (the spectral line data of pyrope and spessartine in the figure derived from subspecies of garnets identified by EPMA).
Minerals 11 00865 g002
Figure 3. Crystal structure of the garnet (Novak and Gibbs (1971) [2]).
Minerals 11 00865 g003
Figure 4. UV-Vis specturm of the colour-changing garnet sample B3 (Two transmission windows appear at 460–510 and 650–700 nm).
Minerals 11 00865 g004
Figure 5. Corrected UV-Vis spectra of the colour-changing garnet sample B3, and relationship between refractive index and wavelength.
Minerals 11 00865 g005
Figure 6. Analysis and explanation of the alexandrite effect (with sample B3 as an example). The spectral response curves of the CIE1931 XYZ colour matching functions are shown. (a) The spectral power distribution of the CIE D65 representing daylight (colour temperature, 6504 K). (b) The spectral power distribution of the incandescent light CIE A (colour temperature, 2856 K). (c) Response curves of spectra of D65 obtained from the colour-matching functions. (d) Response curves of spectra of A obtained from the colour-matching functions. (e) Response curves of the colour matching functions of the colour-changing garnet under D65. (f) Response curves of the colour matching functions of the colour-changing garnet under A. The tristimulus values and the simulated colour obtained by the integration of the curve are shown in the figure.
Minerals 11 00865 g006
Figure 7. Fashioned gems and the corresponding simulated colours calculated by using the colour matching functions.
Minerals 11 00865 g007
Figure 8. Comparison of colour parameters under two kinds of standard light sources. (a) Comparison of lightness L*, chroma C*, and hue angle h(°); (b) Comparison of colorimetric coordinates a* and b*.
Minerals 11 00865 g008
Figure 9. The area of the absorption peak at 574 nm affects the colour-changing garnet. Taking sample B3 as an example, the gray line is the first derivative curve of its UV-Vis spectrum, and the point where the first derivative is equal to zero is selected as the starting and ending points of the range at 574 nm absorption peak.
Minerals 11 00865 g009
Figure 10. The colorimetric coordinate a* and the hue angle h(°) are related to the peak area of absorption at 574 nm. Under the D65 and A light sources, a* is positively correlated with the area of the absorption peak (a) whereas h is negatively correlated with it at 574 nm (b).
Minerals 11 00865 g010
Figure 11. The differences in chroma and colour under the D65 and A light sources in CIE1976 L*a*b* colour space.
Minerals 11 00865 g011
Figure 12. Chroma difference ΔC* (a) and colour difference ΔE*ab (b) are positively correlated with the area of the absorption peak at 574 nm.
Minerals 11 00865 g012
Table 1. Colour parameters, hue angle, chroma and colour difference between the light sources in CIE 1976 La*b* colour space (the original data is presented in the supplementary materials).
SampleD65AΔh(°)ΔC*ΔE*ab
L*C*h(°)L*C*h(°)
B162.0411.79104.6462.3410.8450.7153.93−0.9410.30
B268.0116.69105.1868.4414.2272.2232.97−2.489.10
B367.0410.0095.7067.4612.7331.4364.272.7312.31
B457.9410.80107.8058.169.6248.6759.13−1.1810.13
B542.709.8485.2243.3014.1431.2653.964.3011.60
B662.1114.1590.5462.8317.9236.9253.623.7714.87
B768.8712.4696.3769.3814.5438.0658.312.0813.29
B865.7014.0797.0866.2615.0845.1851.901.0112.80
B968.9512.1997.7569.4214.4135.8561.892.2213.82
B1067.2911.7098.9167.7113.7135.3463.572.0213.50
Table 2. ANOVA results for the colour parameters.
Colour ParametersdfMean SquareFp
L*11.0700.0170.898
a*1688.632116.7620.000
b*150.44411.6960.003
C*19.1461.8880.186
h(°)115,320.707152.2440.000
Publisher’s Note: MDPI stays neutral with regard to jurisdictional claims in published maps and institutional affiliations.

