Article

Ex and In Situ Reactivity and Sorption of Selenium in Opalinus Clay in the Presence of a Selenium Reducing Microbial Community

1
SCK CEN, Boeretang 200, BE-2400 Mol, Belgium
2
Research Centre for Radwaste Disposal, Department of Earth and Environmental Sciences, The University of Manchester, Manchester M13 9PL, UK
3
ANDRA, 1-7 Rue Jean Monnet, CEDEX, FR-92298 Châtenay-Malabry, France
4
FANC, Ravensteinstraat 36, BE-1000 Brussels, Belgium
5
IRSN, BP17, FR-92262 Fontenay-aux-Roses, France
*
Author to whom correspondence should be addressed.
Minerals 2021, 11(7), 757; https://doi.org/10.3390/min11070757
Submission received: 10 May 2021 / Revised: 18 June 2021 / Accepted: 8 July 2021 / Published: 13 July 2021

Abstract

:
79Se is a critical radionuclide concerning the safety of deep geological disposal of certain radioactive wastes in clay-rich formations. To study the fate of selenium oxyanions in clayey rocks in the presence of a selenium reducing microbial community, in situ tests were performed in the Opalinus Clay at the Mont Terri Rock Laboratory (Switzerland). Furthermore, biotic and abiotic batch tests were performed to assess Se(VI) and Se(IV) reactivity in the presence of Opalinus Clay and/or stainless steel, in order to support the interpretation of the in situ tests. Geochemical modeling was applied to simulate Se(VI) reduction, Se(IV) sorption and solubility, and diffusion processes. This study shows that microbial activity is required to transform Se(VI) into more reduced and sorbing Se species in the Opalinus Clay, while in abiotic conditions, Se(VI) remains unreactive. On the other hand, Se(IV) can be reduced by microorganisms but can also sorb in the presence of clay without microorganisms. In situ microbial reduction of Se oxyanions can occur with electron donors provided by the clay itself. If microorganisms would be active in the clay surrounding a disposal facility, microbial reduction of leached Se could thus contribute to the overall retention of Se in clayey host rocks.

1. Introduction

In several countries relying on nuclear energy, deep clay formations are studied as potential host rocks for geological disposal of intermediate-level and high-level long-lived waste (ILW and HLW). For both types of waste (mainly vitrified HLW and nitrate-bearing bituminized waste), 79Se (T½ = 327 ka [1]) is considered as one of the main radionuclides contributing to the dose-to-man after final disposal [2,3,4,5]. As selenium is a redox sensitive element, it can exist under different oxidation states depending on the environmental conditions: mainly Se(VI), Se(IV), Se(0), Se(-I), and Se(-II). Due to the oxidizing conditions during spent fuel reprocessing, radiolysis in the waste and/or due to the presence of large amounts of nitrate in nitrate-bearing bituminized ILW, Se is expected to be released—at least in part—as Se oxyanions [3,6]. Although part of these oxyanions could sorb onto corrosion products present on the steel canisters or steel rebars [7], the remainder is expected to reach the clay host rock surrounding the waste repository.
In the clay, Se mobility is largely controlled by its oxidation state, which is affected by the prevailing redox conditions and pH. Based on thermodynamic and experimental data in soils and ground waters [3,8,9,10,11], Se(0) and metal-selenide minerals (e.g., FeSe2 as ferroselite) are stable and poorly soluble (and thus immobile) at low redox potential. At slightly higher redox potentials, though still reducing conditions and at neutral pH, Se(IV) (i.e., SeO32– or selenite) can be found in soil pore waters. As Se(IV) can remain in solution, its mobility is higher compared to Se(0) or selenides, though it is constrained by precipitation and sorption processes. Metal-selenite minerals are rarely found in soils, though under certain pH and Eh conditions, anhydrous and hydrous metal-selenites (e.g., with Fe, Al, or Cu) have been found in near-surface environments [11,12]. Nevertheless, selenite concentrations in solution are largely controlled by its sorption onto certain minerals, such as clay minerals, pyrite, siderite, mackinawite, and iron (hydr)oxides [7,8,13,14,15,16,17,18,19,20]. Retention of selenite on redox-active clay components (e.g., Fe(II) minerals) involves surface adsorption followed by reduction to Se(0) or selenide and precipitation [16,17,20,21,22]. In addition, selenite can adsorb directly onto clay minerals via the formation of inner-sphere complexes [22,23]. Sorption of selenite onto clays has indeed been observed in batch tests with Toarcian argillites, Opalinus Clay, and Boom Clay [18,22,24]. Finally, under oxidizing conditions, Se(VI) (i.e., SeO42− or selenate) would be the most dominant species. This Se oxyanion has a high solubility and is poorly or non-sorbing (depending on the pH value of the solution with respect to the point of zero charge (pzc) of the considered mineral surface), and it can therefore remain in solution at higher concentrations. In batch sorption experiments with different clays (Boom Clay, Toarcian argillites, and Opalinus Clay), sorption of selenate could not be observed [18,24], though under certain conditions Se(VI) was able to sorb onto certain minerals (e.g., iron (oxy)hydroxides and clay minerals) [7,13,25,26,27]).
In addition to the pH and redox conditions, microorganisms also play an important role in Se cycling in nature and can transform Se through three distinct processes: assimilation, detoxification, and dissimilatory reduction. While assimilation and detoxification can occur under both anaerobic and aerobic conditions, dissimilatory reduction (or respiration) of Se can only occur under anoxic conditions [28]. Selenium has beneficial or toxic health properties depending on a very narrow concentration window. At low concentration, selenium is an essential micronutrient to microorganisms and is incorporated in selenoproteins necessary for enzymatic activity (e.g., for protecting cell membranes against oxidative damage) by assimilatory reduction of Se oxyanions [28,29,30,31]. However, high selenium concentrations are toxic, and detoxification is then required. Several detoxification pathways are possible, including the formation of Se(0) particles or methylation of non-volatile reduced Se species to volatile compounds [28,29,30,31]. Finally, several microbial strains are known to perform dissimilatory reduction of selenate and/or selenite. In this metabolic process, Se is used as an electron acceptor for energy production and microbial growth, while mainly organic compounds, but also inorganic compounds such as H2, can act as electron donors [28]. In general, selenium oxyanions are reduced to the less soluble and less biologically available elemental Se(0). The formation of Se(0) is considered a biomineralization process and can occur either intracellularly or extracellularly [28].
To our knowledge, diffusion studies investigating the migration of Se in the clay are rather scarce, though some data is available for selenate in Boom Clay [3] and Opalinus Clay (Mont Terri Diffusion and Retention (DR) experiment [32]), and for both Se oxyanions in Callovo–Oxfordian Clay [19,33]. According to these experiments, retention of Se(VI) is very limited and its migration through the clay would be predominantly driven by diffusion of a mobile species. Reduction of Se(VI) was either not detected or not measured. On the other hand, diffusion experiments with Se(IV) in Callovo–Oxfordian Clay suggest sorption of Se(IV) on the clay, based on the decrease in Se(IV) concentration in the feed solution and on the detection of reduced Se species (though not specified) by XANES (X-ray absorption near-edge structure) along the diffusion pathway [19].
It is important to note that, most of the sorption and diffusion studies with Se oxyanions did not include microbial activity as a possible pathway for Se reduction. In other studies, microbial activity was not assessed, even though this could have contributed to the observed results. Furthermore, studies focusing on microbial Se reduction often include the addition of easily biodegradable carbon sources or electron donors, which also influences the observed processes. As microbial activity cannot be ruled out in a repository for radioactive waste, the fate and transport of Se in the near field of a radioactive waste disposal facility may not only rely on purely abiotic chemical processes but should also include microbially mediated reactivity and retention of Se. A good understanding of the diffusion, sorption, and reactivity of Se oxyanions in a clay host rock of such a disposal facility, including the effect of microorganisms, is required to support the selection of transport parameters for performance assessment calculations of the deep geological repository.
In this paper, the in situ fate of selenium oxyanions in the Opalinus Clay, including the effect of a selenium reducing microbial community, was studied for the first time. For this, in situ injection tests with selenate were performed in the borehole of the BN experiment (bitumen–nitrate–clay interaction experiment) at the Mont Terri Rock Laboratory (Switzerland), in which microbial nitrate reactivity and diffusion were previously studied [34]. Additional batch tests were performed to support the results of the in situ experiment. Both biotic and abiotic batch tests were performed in water sampled from the BN borehole and in the presence of Opalinus Clay, stainless steel, and (for the biotic tests) a microbial community, all originating from the in situ BN experiment. No additional carbon source or electron donor were provided, to ensure biogeochemical conditions as close as possible to those prevailing in situ. The acquired data from the batch tests were used to develop a model to predict the behavior of selenium in Opalinus Clay.

2. Materials and Methods

All preparatory work was performed and test suspensions were prepared and stored under anoxic conditions in a UV-sterilized glove box (Ar atmosphere with O2 < 0.001%). All chemicals used had a high purity (≥99%) and were equilibrated with inert atmosphere, by bringing them in the glove box one day in advance to remove all traces of oxygen gas. Note that both the Na2SeO4 and Na2SeO3 (99% Se; Sigma Aldrich, Overijse, Belgium) used in the batch and in situ tests contained impurities: ~0.4% of the total Se content in Na2SeO4 was Se(IV) and ~10% of the total Se content in Na2SeO3 was Se(VI).

2.1. Design of the BN Experiment

The BN in situ experiment was performed in a borehole drilled in the Opalinus Clay at the Mont Terri Rock Laboratory (Jura, Switzerland). The Opalinus Clay is a Mesozoic shale formation in the Jura Mountains of northwestern Switzerland. A detailed overview of the Mont Terri Rock Laboratory, including the location of the in situ experiment discussed here and the characteristics of the Opalinus Clay (mineralogy and geochemistry), is provided by Bossart et al. [35] and Pearson et al. [36]. The mineral composition of the Opalinus Clay at the Mont Terri site comprises mainly quartz, illite, and mixed-layer illite–smectite, kaolinite, chlorite, biotite and muscovite, calcite, aragonite, siderite, dolomite and/or ankerite, albite and/or plagioclase, K-feldspar, pyrite, organic matter (mostly kerogen), and other trace minerals like apatite [35,36]. The BN experiment is performed in the shaly lithofacies of the Opalinus Clay, which consists of between 39 and 80 dry wt.% illite, chlorite and kaolinite, and between 5 and 20 dry wt.% of the mixed-layer illite-smectites. Furthermore, it contains between 10 and 27 dry wt.% of quartz, between 4 and 35 dry wt.% of carbonates, between 0.9 and 1.4 dry wt.% pyrite and between 0.8 and 1.4 dry wt.% organic matter [35].
The water collected in situ from the Opalinus Clay is of the NaCl type (~60–400 mM). The chloride concentration depends on the location within the Opalinus Clay, with an increased salinity from the top to the base of the formation [36]. Besides Na+ and Cl-, other major components of the Opalinus Clay pore water are sulfate, other cations (Mg2+, Ca2+, K+ and Sr2+), dissolved carbonate (corresponding to a pCO2 ranging from ~10−2 to 10−3 kPa), and dissolved organic carbon (usually below 1.7 mmol C L−1). The concentration of other cations as well as the alkalinity are linked to the chloride content [36].
The experimental set-up and its installation have been described in detail by Bleyen et al. [34]. In short, the downhole equipment consists of three anoxic test chambers (labeled ‘Interval 1 to 3′) of ~90 cm in length, isolated from each other and from the gallery surface by inflatable packers to avoid both cross-contamination and oxygen ingress from the gallery atmosphere. The intervals are in contact with the surrounding clay through a cylindrical sintered stainless steel porous filter screen surrounding the central supporting stainless steel tube. Stainless steel water lines connect each of the downhole intervals to a water sampling unit (with sampling containers and a sampling port) and an on-line chemical monitoring system inside the gallery of the Rock Laboratory.
The intervals were filled under anoxic conditions with deoxygenated Opalinus Clay artificial pore water (APW; Table 1), immediately after installation of the downhole equipment. The chemical composition of APW is based on the relationship between sulfate, cations, and chloride, as determined by Pearson et al. [36]. Because of the existence of a strong chloride concentration profile in the Mont Terri anticline structure, the APW composition was also adjusted as a function of the salinity to match the in situ Cl concentration of pore water at the exact location of the BN experiment in the rock laboratory [34]. The composition of the solutions sampled in the interval after 8 months of equilibration was close to that of the initially injected APW, except for small increases in total inorganic and organic carbon species (TIC and TOC, respectively; Table 1) and remained stable over time [34].
The water in each of the intervals is continuously circulating from the downhole installation to the surface equipment (with water sampling and online measuring equipment) and back using a magnetically driven gear pump combined with a flow meter. This circulation results in a homogenous solution throughout the circuit of each interval and allows for monitoring of the chemical composition of the interval solutions, either by online measurements or by sampling and offline measurements. Each circuit is equipped with five water sampling containers (40 or 150 mL Whitey stainless steel cylinders from Swagelok), which can be disconnected safely when additional chemical analyses are required, without causing a perturbation to the geochemistry of the interval solution. To monitor the pH and redox potential in the intervals, pH and redox probes (pH::lyser and redo::lyser from S::can Messtechnik GmbH, Vienna, Austria, now subsidiary of Badger Meter) are installed in the water circuit inside gas-tight stainless steel flow-through cells.
In each circuit, additional removable containers (‘clay loops’) can be placed (one or multiple in series), which contain a piece of Opalinus Clay in contact with the interval solution through a stainless steel filter screen (i.e., simulating the borehole). These clay loops can be disconnected in the same way as the sampling containers, allowing the analysis of the solid phases without perturbing the borehole.

2.2. Batch Tests

Na2SeO4 (50 µM) or Na2SeO3 (10 µM) was first added to pooled solutions sampled from BN Interval 1 and Interval 3, providing part of the microbial community present in the BN borehole in the biotic tests. For the abiotic tests, these solutions were sterilized by filtration at 0.22 µm before the start of the batch tests. No natural Se background could be detected in the BN borehole water used for these tests (i.e., <1.7 µM total Se and <0.013 µM Se(VI) and Se(IV), the corresponding limits of detection). To some of the solutions, 0.1 mM Na2HPO4 was added as a source of phosphorus for microbial growth (Table 2). No additional growth nutrient or electron donor was added.
Secondly, small pieces of Opalinus Clay and stainless steel were prepared to investigate their impact on the Se reactivity and retention, as both are present in the BN borehole (Section 2.1). Pieces of Opalinus Clay (~0.1 g each) were cut from a larger piece (35 mm × 35 mm × 5 mm), which had been exposed to in situ conditions inside a removable container (‘clay loop’) in contact with the anoxic solution circulating in Interval 3 during injection of nitrate for 3 years [37]. Pieces of a stainless steel filter (5 mm × 5 mm × 1 mm) were cut from a larger filter plate, which had been in another clay loop in contact with the solution circulating in Interval 1 during injection of nitrate and H2 for 2 years [34]. Both solids were chosen since they were already acclimatized to the conditions of the BN experiment and may contain a different microbial community than the interval solutions. For the abiotic batch tests, the solid pieces were autoclaved (121 °C, 2 bar, 20 min) in empty amber glass septum vials. The efficiency of the sterilization process was verified by placing a Sterikon plus Bioindicator (Sigma-Aldrich, Overijse, Belgium) in a similar glass septum vial, which was autoclaved along with the other vials.
Seventy milliliters of the Se-containing solutions was added to sterile amber glass septum vials containing pieces of Opalinus Clay (C) and/or stainless steel filter (F) according to Table 2. For the abiotic tests, the filter sterilized Se-containing solution was added immediately after autoclaving the solid pieces. Two blanks were included as negative controls, i.e., interval solution with a piece of clay (Blank_C) or with a piece of clay and filter (Blank_CF). The septa were closed for the duration of the experiment. The suspensions were sampled regularly by taking aliquots of 3 mL with a sterile needle after thoroughly shaking to homogenize the suspension. The solution was not filtered before analysis but subsampled to perform the different analyses, as described in Section 2.4 and Section 2.5. The solid phases of the abiotic batch test were analyzed microscopically (Section 2.6).

2.3. In Situ Injection Tests

Two consecutive injections of Interval 3 with Se-containing APW were performed in 2019. The first injection of Interval 3 was performed by replacing only the solution in the surface circulation loop (volume ~0.8 L) with a freshly prepared and sterile Se-containing APW solution, while bypassing the downhole equipment (volume ~1.5 L) and thus the interval itself. For this, APW (composition given in Table 1) with 15 µM Na2SeO4 was prepared under anoxic conditions. The solution was filter sterilized (0.22 µm) and stored in a sterile vessel until injection. The detailed injection procedure is described in [34]. Care was taken to prevent O2 ingress and microbial contamination during injection. After replacement of the solution in the surface equipment, the bypass was opened, and the solution was circulated at 40 mL min−1 through the entire circuit to allow mixing with the remaining solutions in the downhole equipment. After an overnight homogenization period, the flow rate was decreased to 10 mL min−1 for the remainder of the tests. The selenate concentration after overnight homogenization was considered the starting concentration, i.e., 5.3 µM Se(VI) and less than 0.013 µM Se(IV) for the first injection. At the time of injection, two clay loops were installed in the circuit.
The second injection of Interval 3 was performed 106 days after the first. For this, APW with 243 µM Na2SeO4 was prepared and filter sterilized (0.22 µm). Injection was done by reconnecting five sampling containers (volume 0.15 L per container) filled with this solution to the circuit of Interval 3. The solution was first circulated at 40 mL min−1 for 4 h, to achieve a good homogenization of the added solution and a dilution with the remaining interval solution. Afterwards, a sample was taken to determine the start concentration of Se (i.e., ~60 µM Se(VI) and less than 0.013 µM Se(IV)), and the flow rate was decreased to 10 mL min−1 for the rest of the time.
The pH and redox potential were monitored online throughout the tests. Samples were taken regularly by disconnecting sampling containers and storing them at 4 °C until further analyses (Section 2.4 and Section 2.5). At the end of the second injection test, one of the installed clay loops was disconnected from the interval and scanning electron microscopy coupled with energy dispersive X-ray spectroscopy (SEM–EDX) analyses were performed (Section 2.6).
No remaining NO3 and NO2 from previous nitrate injection tests performed to assess the microbial nitrate reduction processes in Interval 3 were found before injection of selenate (cf. former nitrate injections made in the period 2012–2016; see [34,37]). Furthermore, no additional carbon source or electron donor was injected, to assess microbial Se reactivity in the borehole with natural electron donors and carbon sources.

2.4. Chemical Analyses

After each sampling of the batch tests, Se(VI) and Se(IV) speciation analyses were performed on one of the subsamples using LC–ICP–MS (Liquid Chromatography–Inductively Coupled Plasma–Mass Spectrometry) (method modified from [38]) after filtration to remove all particles. Liquid chromatography was performed using a Flexar LC system (Perkin Elmer, Akron, OH, USA) and was coupled to a quadrupole-based ICP–MS instrument (Nexion 300S, Perkin Elmer, Akron, OH, USA), equipped with a MicroFlow PFA-ST concentric nebulizer (Elemental Scientific Inc, Omaha, NE, USA). Note that this method implies that only dissolved Se(VI) and Se(IV) species are detected. Total Se was determined in another (not filtered) subsample by ICP-OES (inductively coupled plasma optical emission spectrometry) (according to NBN EN ISO 11885:2009) after acid digestion in aqua regia (according to NBN EN ISO 15587-1:2002). Both analyses were performed by VITO (Mol, Belgium).
The detection limits for these analyses were 1.7 µM total Se and 0.013 µM Se(VI) and Se(IV). Intermittent Se(IV) measurements were performed for the biotic batch tests by spectrophotometric analyses after reaction of selenite with 2,3-diamino-naphthalene according to [39]. The detection limit of these spectrophotometric analyses of Se(IV) was 1 µM.
The chemical composition of the sampled solutions from the BN borehole was determined as soon as possible after sampling. Total Se, Se(VI), and Se(IV) analyses were performed as described above for the abiotic batch tests. The closed sampling containers were stored at 4 °C until analysis to slow down microbial growth and reactivity. Subsamples of the solution were taken under an anoxic atmosphere (Ar atmosphere with O2 < 0.001%) and analyzed at SCK CEN by ion chromatography (IC; Dionex™ AquionTM with IonPac™ AS22 column, Thermo Fisher Scientific, Geel, Belgium) for SO42−, Cl, and acetate. The detection limit for the acetate concentration was 8 µM. Cations (Na, K, Mg, Ca, and Sr) were detected by inductively coupled plasma optical emission spectroscopy (iCAPTM 7400 rad, Thermo Fisher Scientific, Geel, Belgium). Total organic and inorganic carbon (TOC and TIC, respectively) concentrations were determined using a TOC/TIC analyzer with UV persulfate digestion (IL500 TC analyzer, Hach Lange, Mechelen, Belgium).
Measurement uncertainties were calculated with 95% confidence.

2.5. Microbial Analyses

2.5.1. Microbial Cell Count

The microbial Biothema ATP Kit HS (Isogen Life Science, Utrecht, The Netherlands) was used according to the manufacturer’s procedure to monitor intracellular ATP (adenosine triphosphate), which provides information on the microbial activity level.
Flow cytometry was used to count the total amount of microbial cells. To this end, samples were diluted in filter sterilized (0.22 μm) Evian potable water and stained with SYBR Green I (10,000× concentrate in 0.22 μm filtered dimethyl sulfoxide) (Thermo Fisher Scientific, Geel, Belgium) at a final concentration of 1× concentrate. All samples were stained and incubated in the dark for 20 min at 37 °C. Flow cytometry was performed using a C6 Accuri TM flow cytometer (BD Biosciences, Erembodegem, Belgium) equipped with four fluorescence detectors (530/30 nm, 585/40 nm, >670 nm, and 675/25 nm), two scatter detectors, a 50 mW 488 nm laser, and a 30 mW 640 nm laser. The flow cytometer was operated with Milli-Q water (Merck Chemicals, Overijse, Belgium) as sheath fluid. Samples were analyzed in a fixed volume mode of 50 μL, and the minimal threshold was fixed on the green fluorescence (FL1-H at a relative intensity of 1000). Data were analyzed with the R programming software version 3.6.3 with the package Phenoflow [40].
At day 7 of the abiotic batch experiment, 100 µL of the samples was spread on LB agar medium (lysogeny broth medium; Thermo Fisher Scientific, Geel, Belgium) and incubated under oxic conditions at 30 °C for 3 weeks to verify abiotic conditions. At the end of the abiotic batch experiment, cultures were diluted 1/10 in APW supplemented with 0.2 mM NaH2PO4·2H2O and 1 g Na-lactate to enable growth of sulfate reducing microorganisms. The total cell number was monitored after 18 and 101 days with flow cytometry. Acetate production was measured after 109 days with the K-ACETAK kit (Megazyme, Bray, Ireland) according to the manufacturer’s procedure. Lactate consumption was measured after 143 days with the K-LATE kit (Megazyme, Bray, Ireland) according to the manufacturer’s procedure.

2.5.2. DNA-Based Analysis of the Microbial Community

DNA was extracted from sampled solutions from Interval 3 during the in situ tests. For this, the microbial community of the interval water was collected on a 0.2 µm Whatman Nuclepore track-etched membrane (25 mm Ø; Sigma-Aldrich, Overijse, Belgium). Cell lysis was achieved by adding 850 µL of autoclaved lysis buffer containing 0.1 M Tris-HCl pH 8, 0.062 M potassium ethyl xanthogenate, 0.2 M nitrilotriacetic acid, 4% wt/v Triton QS-15, and 0.8 M ammonium acetate, followed by vigorous vortexing for 30 s and overnight incubation at 70 °C. Then, samples were vortexed for 30 s, stored on ice for 10 min, and centrifuged (12,000× g, 10 min). Afterwards, 750 µL of the supernatant was transferred to Eppendorf tubes containing 5 PRIME Phase Lock Gel (PLG; VWR International, Leuven, Belgium), and 750 µL of phenol:chloroform:isoamyl alcohol (25:24:1) was added. Samples were centrifuged (12,000× g, 10 min), and the upper phase was transferred to a new PLG tube. Then, 750 µL chloroform:isoamyl alcohol (24:1) was added, and phases were separated again by centrifugation (12,000 g, 10 min). The top phase was transferred to a new tube and supplemented with 75 µL LiCl (8 M) and 750 µL 2-propanol, followed by 30 min at room temperature and centrifugation (16,000× g, 30 min, 4 °C). The pellet was air-dried and suspended in 500 µL of Milli-Q water. This suspension was transferred to a 100 kDa Amicon Filter (Millipore, Burlington, Massachusetts, USA) and centrifuged for 10 min at 13,000× g. The samples were washed twice with 450 µL of Milli-Q water and centrifuged each time for 10 min at 13,000× g. Purified DNA was recovered by inverting the filter in a new Eppendorf tube and centrifugation for 2 min at 1000× g. The DNA concentration was determined with a Quantifluor dsDNA sample kit (Promega, Leiden, The Netherlands).
High-throughput amplicon sequencing of the V3–V4 hypervariable region of the 16S rRNA gene was performed with the Illumina® MiSeq platform according to the manufacturer’s guidelines at BaseClear B.V (Leiden, The Netherlands). DNA sequencing data were processed using the OCToPUS pipeline (Optimized CATCh, Mothur, IPED, UPARSE, and SPAdes) [41], which consists of the following steps: quality filtering using the Hammer algorithm implemented in the SPAdes tool [42], merging reads using the make.contigs command from the open source software package Mothur (version 1.39.1), alignment and filtering of the merged reads following the standard operating procedure as described by the authors of the Mothur software (version 1.39.1), error correction using IPED [43], chimera identification using CATCh [44], and OTU (operational taxonomic unit) clustering using UPARSE (version 7.0) with a 97% cut-off [45]. Subsampling was performed based on the lowest number of reads obtained over the ten different samples, i.e., a coverage of 29,061 reads. Rarefaction curves indicated that this level of subsampling adequately represented the bacterial diversity in the samples (Figure S1, Supplementary Materials). The datasets generated and analyzed during the current study are available in the NCBI Sequence Read Archive (SRA) repository (PRJNA717984).

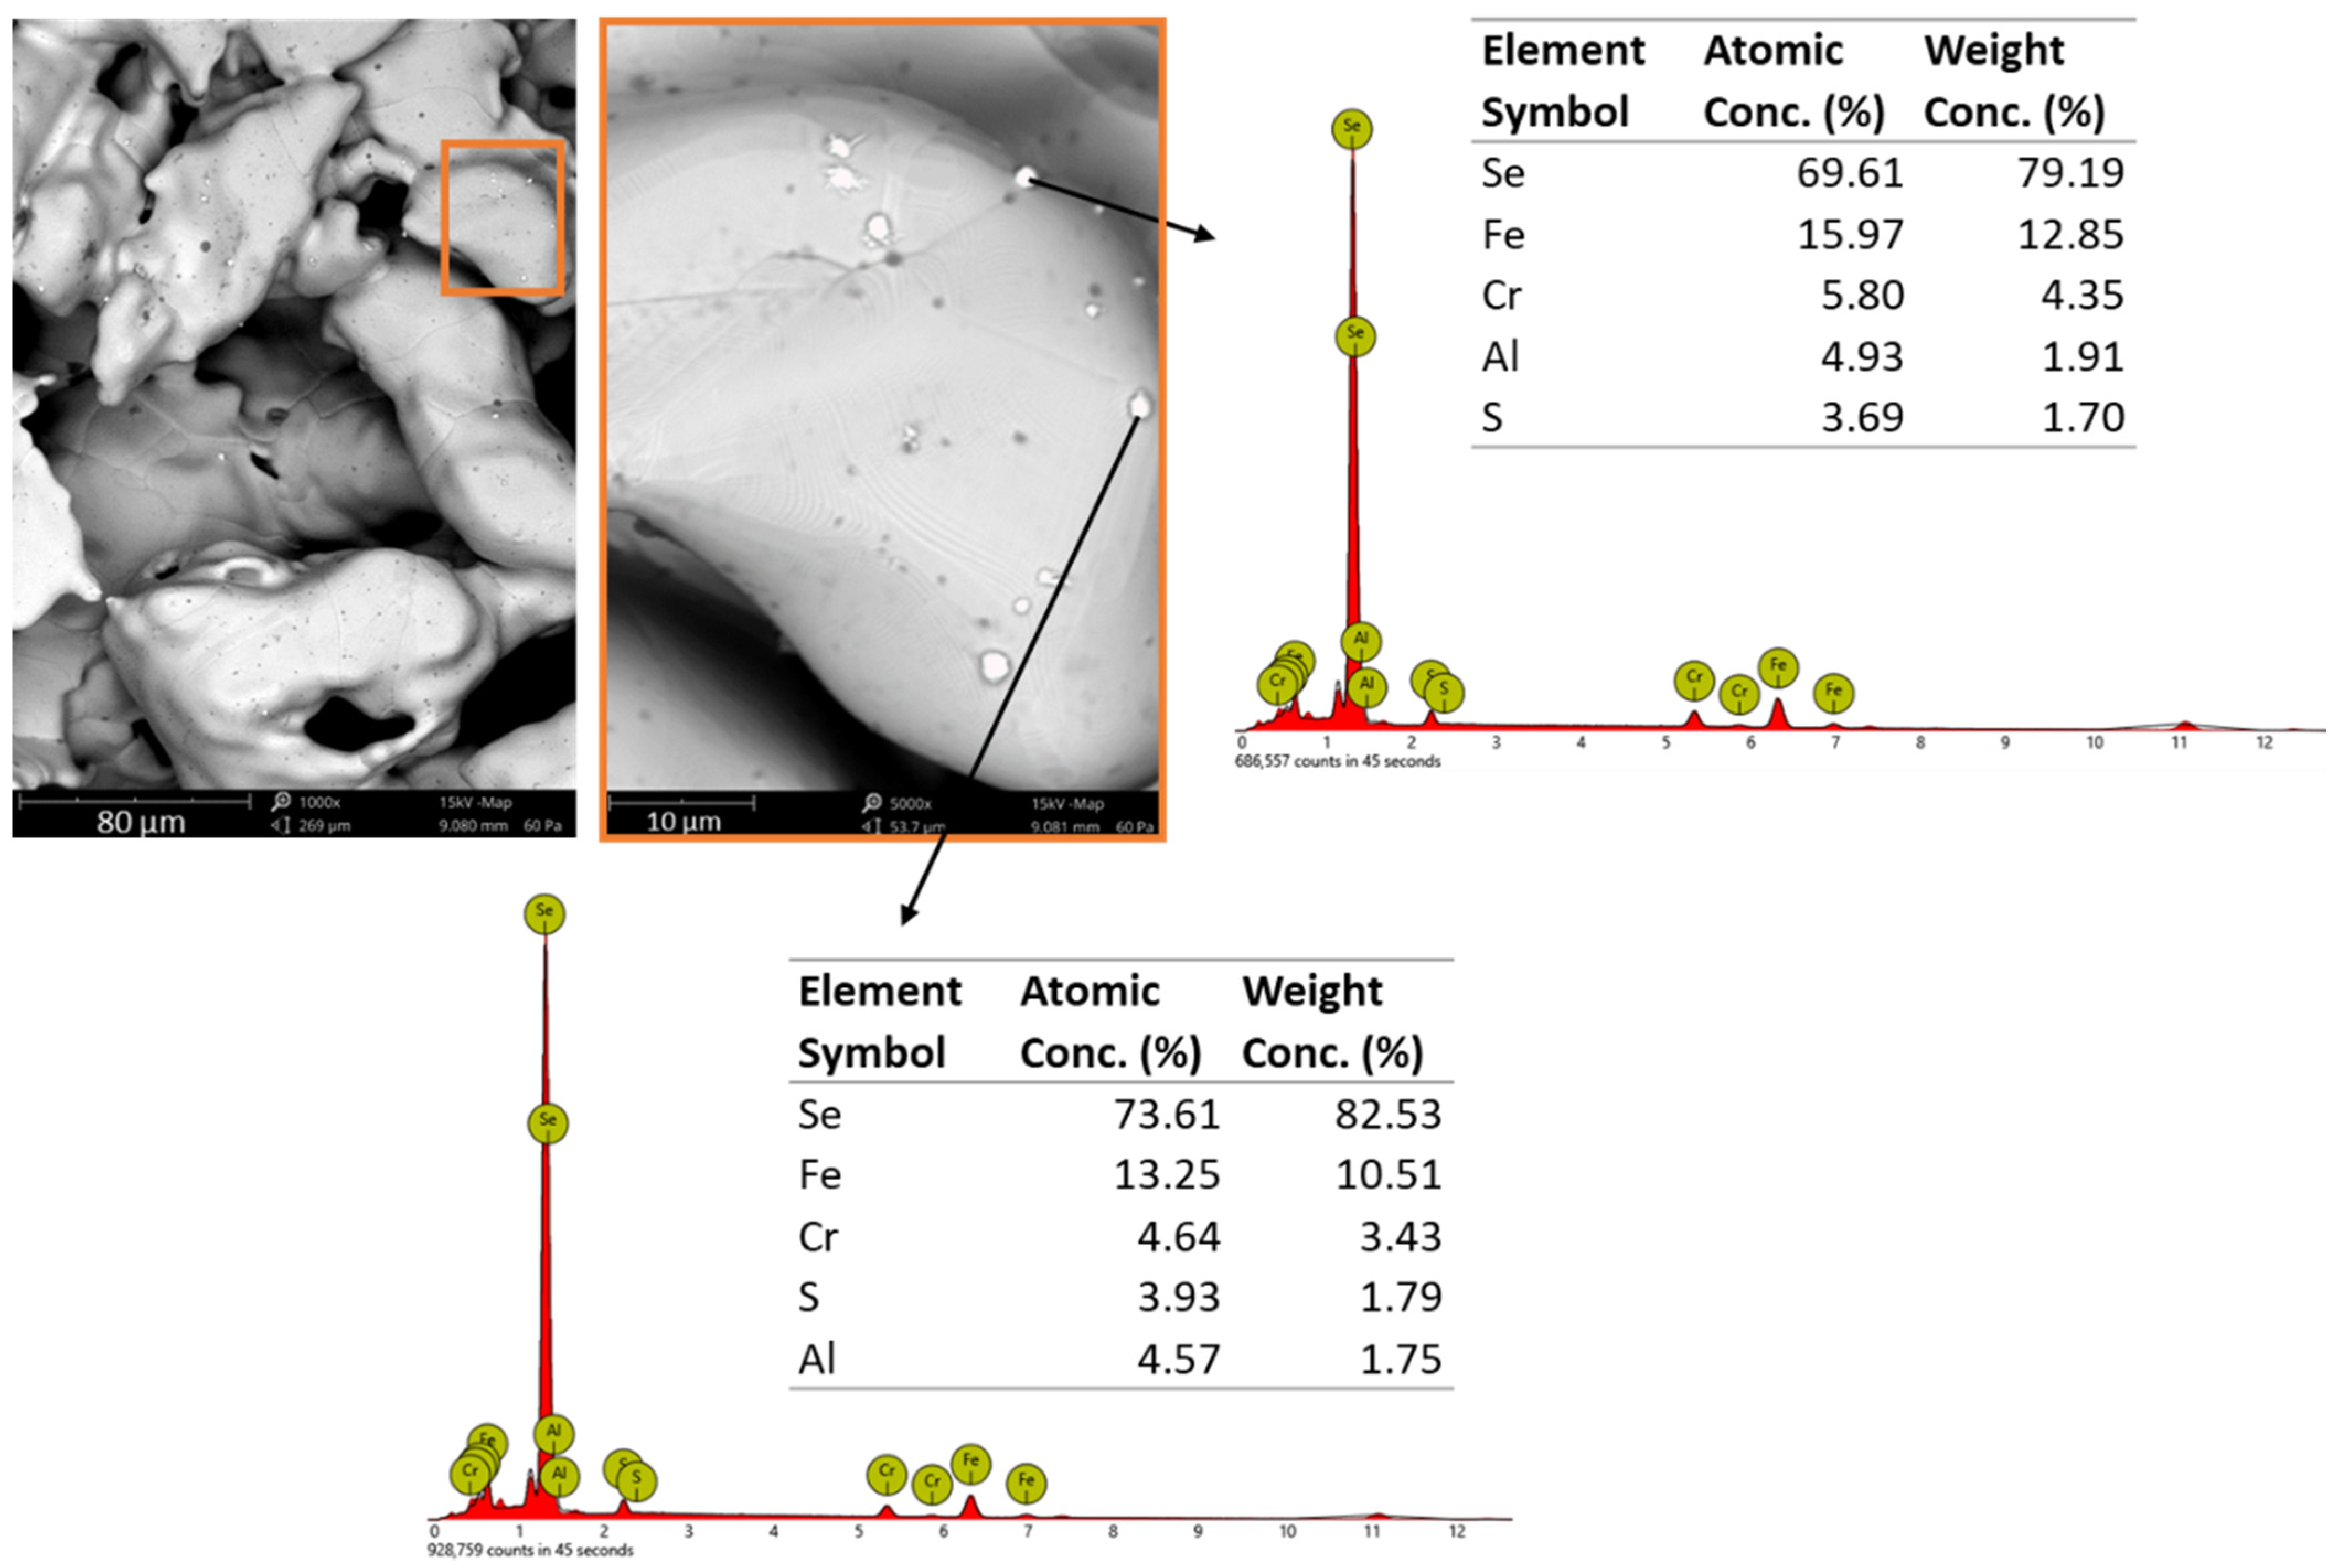
2.6. Microscopic Analyses

SEM–EDX analyses were performed on the stainless steel filter coupons and Opalinus Clay pieces added to the abiotic batch tests (Section 2.2) and obtained from the clay loop after removal from the in situ test (Section 2.3).
After finishing the batch tests, the filter coupons were removed from the suspensions and left to dry in an anaerobic glove box (Ar atmosphere with O2 < 0.001%). Larger pieces of clay were sampled entirely, while smaller pieces dispersed in the batch test solution (in case it was disintegrated into smaller particles) were transferred with a syringe onto a Whatman Nuclepore track-etched membrane (Sigma-Aldrich, Overijse, Belgium) placed in a Swinnex holder (EMD Millipore, Darmstadt, Germany). In addition, smaller pieces of clay and stainless steel filter coupons were cut from the clay and filter present in the clay loop and removed from the circuit of Interval 3. Care was taken not to disturb the surfaces that had been in contact with the interval solution. Both dismantling of the clay loop as well as the cutting of the samples were done in an anaerobic glove box (Ar atmosphere with O2 < 0.001%). All samples were stored in anoxic conditions until analysis.
All solid samples were analyzed with a Phenom ProX tabletop SEM equipped with an EDX element identification probe (Benelux Scientific, Nazareth, Belgium).

2.7. Modeling

Geochemical modeling was undertaken using the geochemical code PHREEQC [46] to aid the interpretation of the experimental data. The modeling considered various processes relevant to the batch and in situ experiments: Se speciation, anion diffusion, Se(VI) reduction kinetics, and Se(IV) sorption. Modeling was focused on the in situ experiment and considered each of these processes in turn to develop a reactive-transport model of increasing complexity. Where relevant, the effect of specific processes was tested against the batch experimental data as detailed below.

2.7.1. Se Speciation

A simplified speciation model considering two species, Se(VI) and Se (IV), was used for the majority of the modeling to compare with the experimental data of these species. The two species were defined as separate components and master species in the PHREEQC input file. This approach enables modeling of reaction kinetics (Section 2.7.3) between the two main species that are confirmed to be present by the chemical analyses. Representation of selenite as a single species also enables the utilization of an existing Se(IV) sorption model (Section 2.7.4).
PHREEQC calculations were also undertaken with a full aqueous speciation model using the Thermochimie database (version 9) [47], which includes thermodynamic data for Se from Olin et al. [48] to examine the hydrolysis of Se(VI) and Se(IV) and the occurrence of Ca and Mg ion pair species under Opalinus Clay conditions. Pourbaix diagrams of the selenium system were constructed using PHREEPLOT [49], again using the Thermochimie database. These diagrams and PHREEQC calculations were performed to determine the solubility and stability of elemental Se(0), a known product of microbial selenate reduction.

2.7.2. Diffusion Modeling

The diffusion of Se(VI) and Se(IV) was represented in the PHREEQC model of the in situ BN experiment by a radial diffusion model following the approach of Appelo and Wersin [50] and used to model other similar Mont Terri borehole diffusion experiments [51]. The circulating borehole fluid was represented by a single cell, which has associated with it a series of 20 ‘stagnant’ cells representing concentric regions around the borehole. The first two stagnant cells represented the filter screen and a void space adjacent to the clay and were assumed to have a radial thickness of 2 mm and 3 mm, respectively. The first cell representing the Opalinus Clay had a radial thickness of 5 mm, and for each successive cell, the radial thickness increased by a factor of 1.3, giving a total radial distance of 3.16 m. Diffusion between the stagnant concentric cells was represented using a mixing function calculated for the above geometry and as described by Appelo et al. [50] and Tournassat et al. [51].
As only two selenium oxyanions (SeO42− and SeO32−) were represented in the model, the multicomponent diffusion option of PHREEQC [46,50] was not utilized. Instead, the diffusion of the two anions was represented by a single pore diffusion coefficient (Dp, m2 s−1) and porosity (ε, -), which were input parameters to the mixing function [50,51]. For simplicity and consistency with previous work [34], anion exclusion effects were represented through the pore diffusion coefficient rather than a lowering of the anion accessible porosity, and ε was assumed to be equal to the total porosity of the Opalinus Clay (0.17) [36]. A similar simplification to consider the same porosity for anions, cations, and neutral species was used in modeling diffusion processes in other borehole experiments at the Mont Terri Rock Laboratory [49]. The total porosity value (0.17) was also considered in previous 1-dimensional modeling of Br and deuterium-labelled water (HDO) non-reactive tracers in diffusion tests in Intervals 1 and 2 of the BN experiment [34]. In the present study, the previously reported Br and HDO data [34] were refitted using the PHREEQC radial diffusion model by pore diffusion coefficients (Dp) of 3 × 10⁻¹¹ m2 s−1 and 1.8 × 10⁻¹⁰ m2 s−1, respectively, assuming a total porosity of 0.17 for both Br and HDO (Figure S2, Supplementary Materials). A recently performed Br diffusion test in Interval 3 (data not shown) showed that anionic diffusion was similar for all three intervals, and the PHREEQC radial diffusion model developed for Interval 1 and 2 was also applicable to fit the data from Interval 3. The pore diffusion coefficient for Br determined from the tracer tests undertaken in Intervals 1 and 2 was assumed to represent the diffusion of the Se(IV) and Se(VI) anions in the selenium injection tests in Interval 3.

2.7.3. Se(VI) Reduction Kinetics

The reduction of Se(VI) to Se(IV) was represented in PHREEQC, using the KINETICS keyword, and where one mole of the Se(VI) master species was replaced by one mole of Se(IV) master species. The PHREEQC RATES keyword was used to define a first order rate law. The first order rate constant was fitted to the Se(VI) concentration data measured in the biotic batch tests and in the circulating solution of the in situ experiment after taking account of the diffusion of Se(VI) from the borehole into the Opalinus Clay.

2.7.4. Se(IV) Sorption onto Opalinus Clay

Se(IV) sorption distribution coefficients (Rd) were calculated based on the data from the abiotic batch tests according to Equation (1):
R d = C 0   C C   V m  
where C0 is the initial aqueous Se(IV) concentration (mol L−1), C is the remaining aqueous Se(IV) concentration (mol L−1), V is the solution volume (mL), and m is the mass of the clay (g).
Frasca et al. [18] compared the sorption of selenium oxyanions on three argillaceous rocks, including samples from a core of Opalinus Clay from a borehole at the Mont Terri Rock Laboratory. They found that while Se(VI) was non-sorbing, Se(IV) sorption behavior could be reproduced by 1- and 2-site Langmuir isotherms, with more accurate representation being obtained by the 2-site model:
C s = S max 1 K L 1 C 1 + K L 1 C + S max 2 K L 2 C 1 + K L 2 C
where Cs is the concentration of Se(IV) sorbed onto the solid phase (mol kg−1), C is the remaining aqueous concentration of Se(IV) (mol L−1), KL is the sorption potential (L mol−1), and Smax is the sorption capacity (mol kg–1) of each site. Parameter values obtained by Frasca et al. [18] for Opalinus Clay are shown in Table 3. No distinction in the sorption mechanism is made (i.e., direct sorption of Se(IV) vs. reduction followed by surface precipitation).
In this study, the Langmuir isotherm was used in models to compare with experimental Se(IV) concentration data from both the batch and in situ experiments. For this, the Langmuir sorption isotherm (Equation (2)) was implemented in PHREEQC representing the two sites as surface master species and defining a Se(IV) surface species for each site. The KL and Smax parameters for Opalinus Clay (Table 3) were used to represent Se(IV) sorption in the batch and in situ experiments. The sorption potential (KL, L mol−1) was input as the log equilibrium constant for the formation of the Se(IV) surface species. The sorption capacity (Smax, mol kg−1) was input to PHREEQC as the number of moles of the surface master species (moles of sorption sites) per liter of water. Smax was scaled to account for the different fluid/rock ratios of the in situ conditions of the Opalinus Clay (0.089 L kg−1, assuming a total porosity of 0.17 and dry density of 2.3 kg L−1) and the batch experiments (700 L kg−1). After considering the data from the abiotic batch experiments, a second modified Langmuir isotherm was parameterized with changes to KL and Smax for sorption site 1 (‘Site 1 fitted’ at the bottom of Table 3) and also used to model subsequent biotic and in situ experiments.
For the in situ experiment, sorption was taken into account in all cells representing the Opalinus Clay, although in practice significant sorption only occurred in the first cell representing the first 5 mm of clay. In addition, it was found that sorption was limited by the diffusion of Se(IV) into the model cells representing clay. To represent the direct sorption onto the borehole skin surface (borehole disturbed zone, BdZ) of the Opalinus Clay from water present in the annular space (without being limited by diffusion), it was assumed that a proportion of the sorption sites present in the first cell representing the first 5 mm of the clay could directly equilibrate with the borehole fluid, i.e., they were assigned to the cell representing a fluid filled void between the filter and the clay. In the graphical results presented in this paper, it was assumed that half of the sorption sites present in the first 5 mm of clay could equilibrate directly with the borehole fluid. The effect of other proportions of sites was also examined in variant model cases.

3. Results

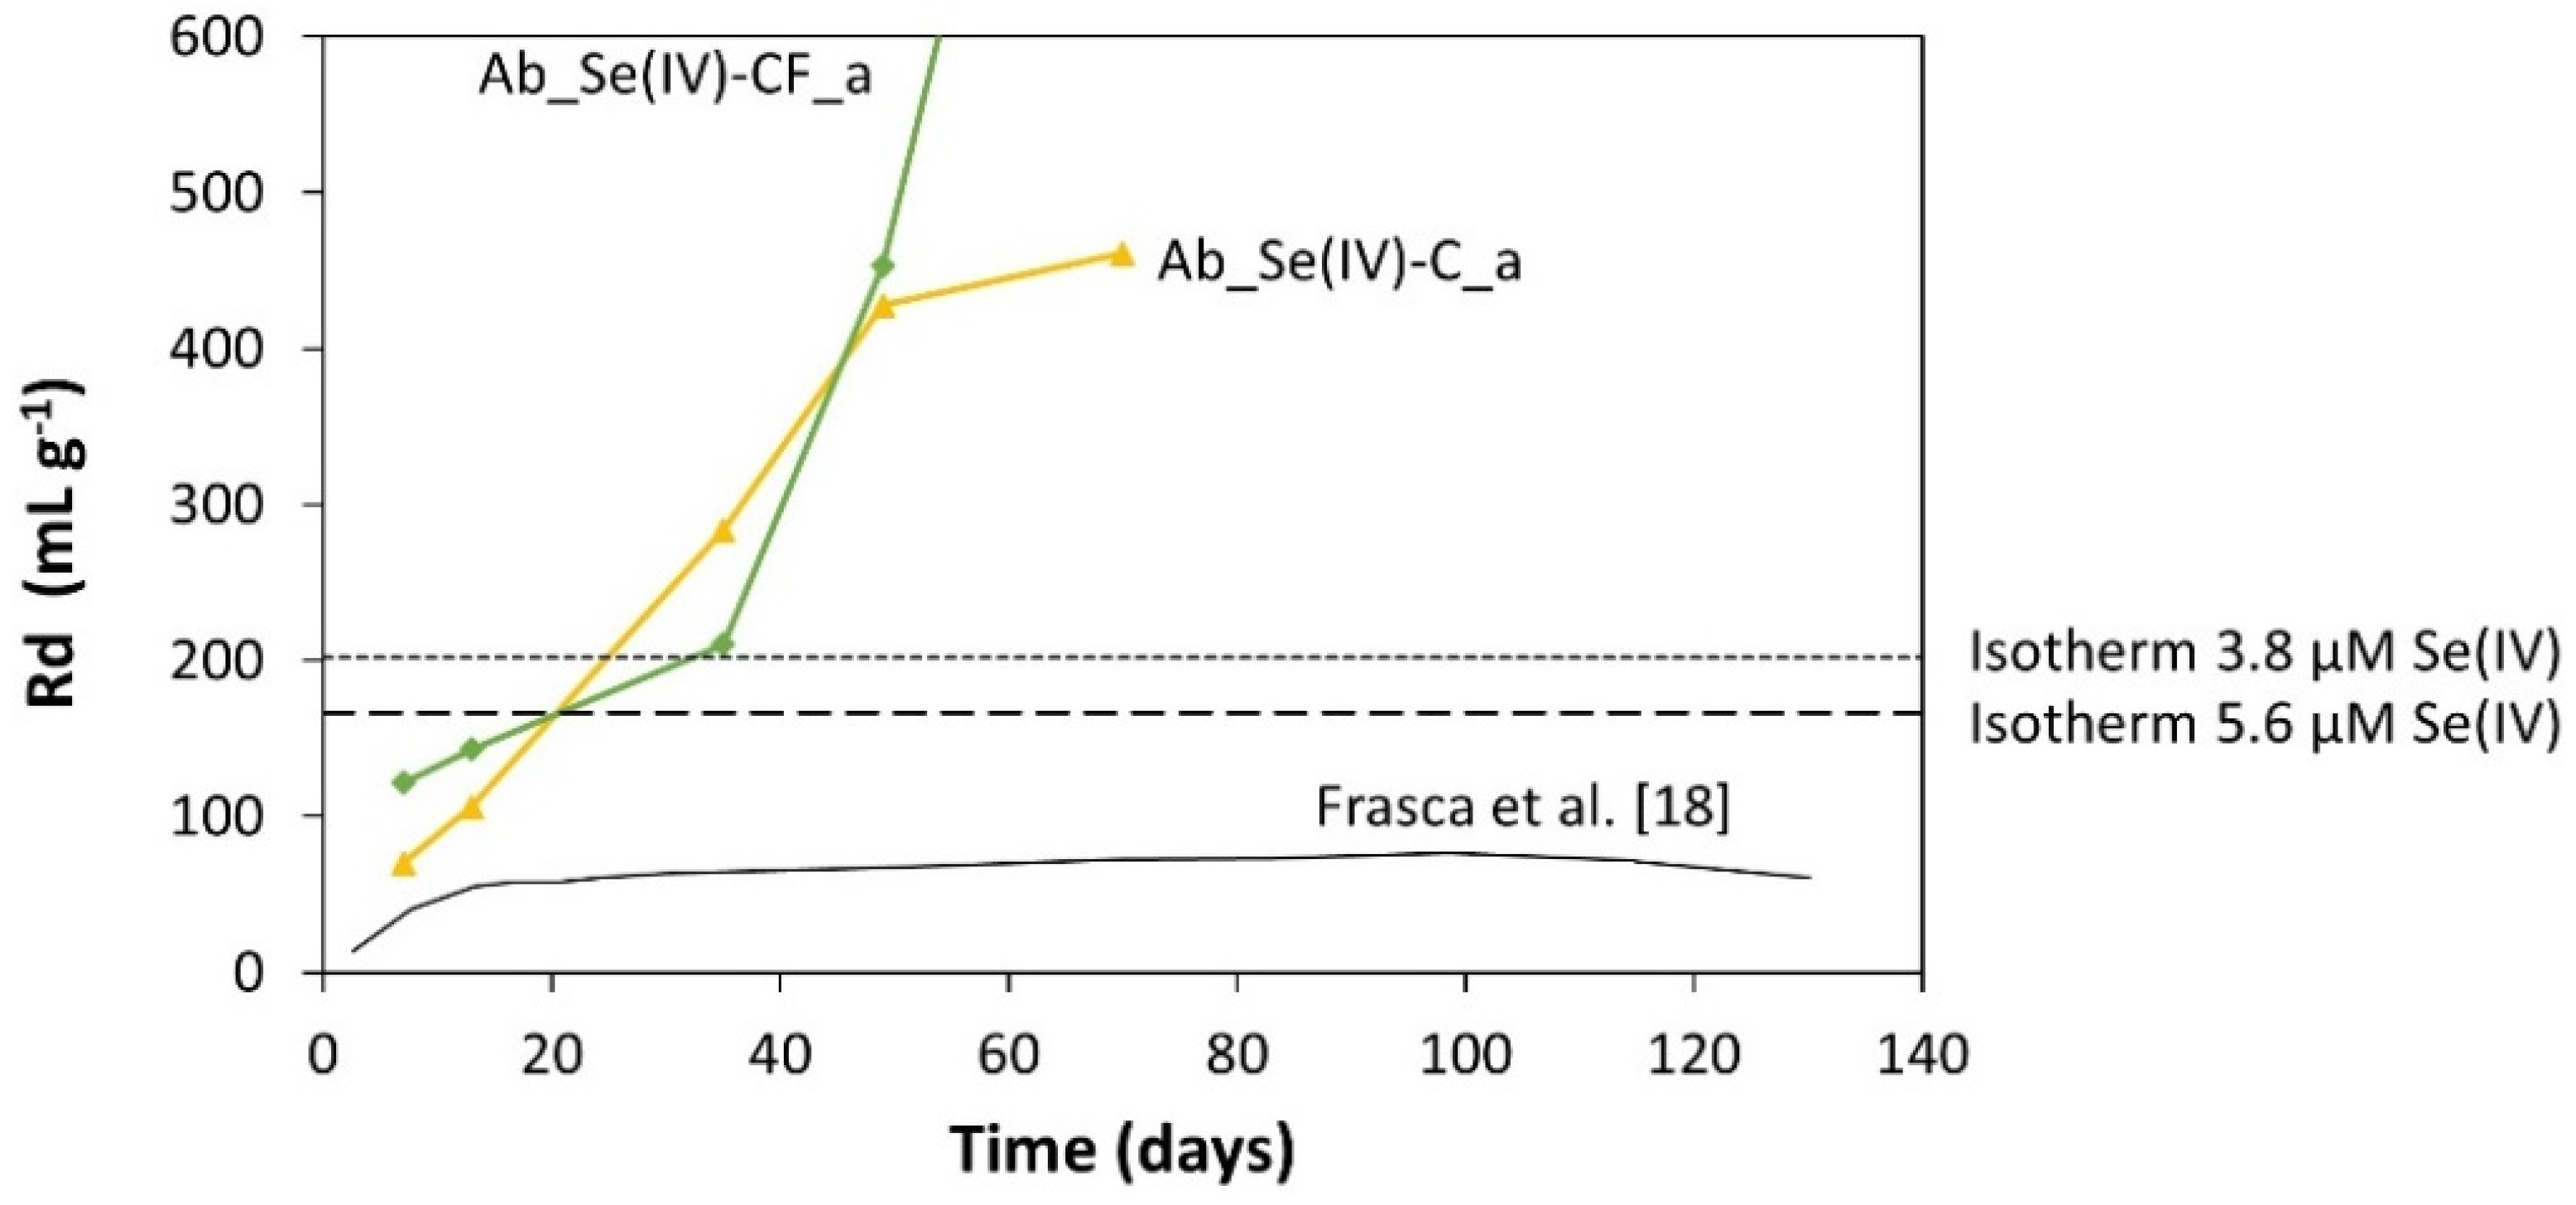
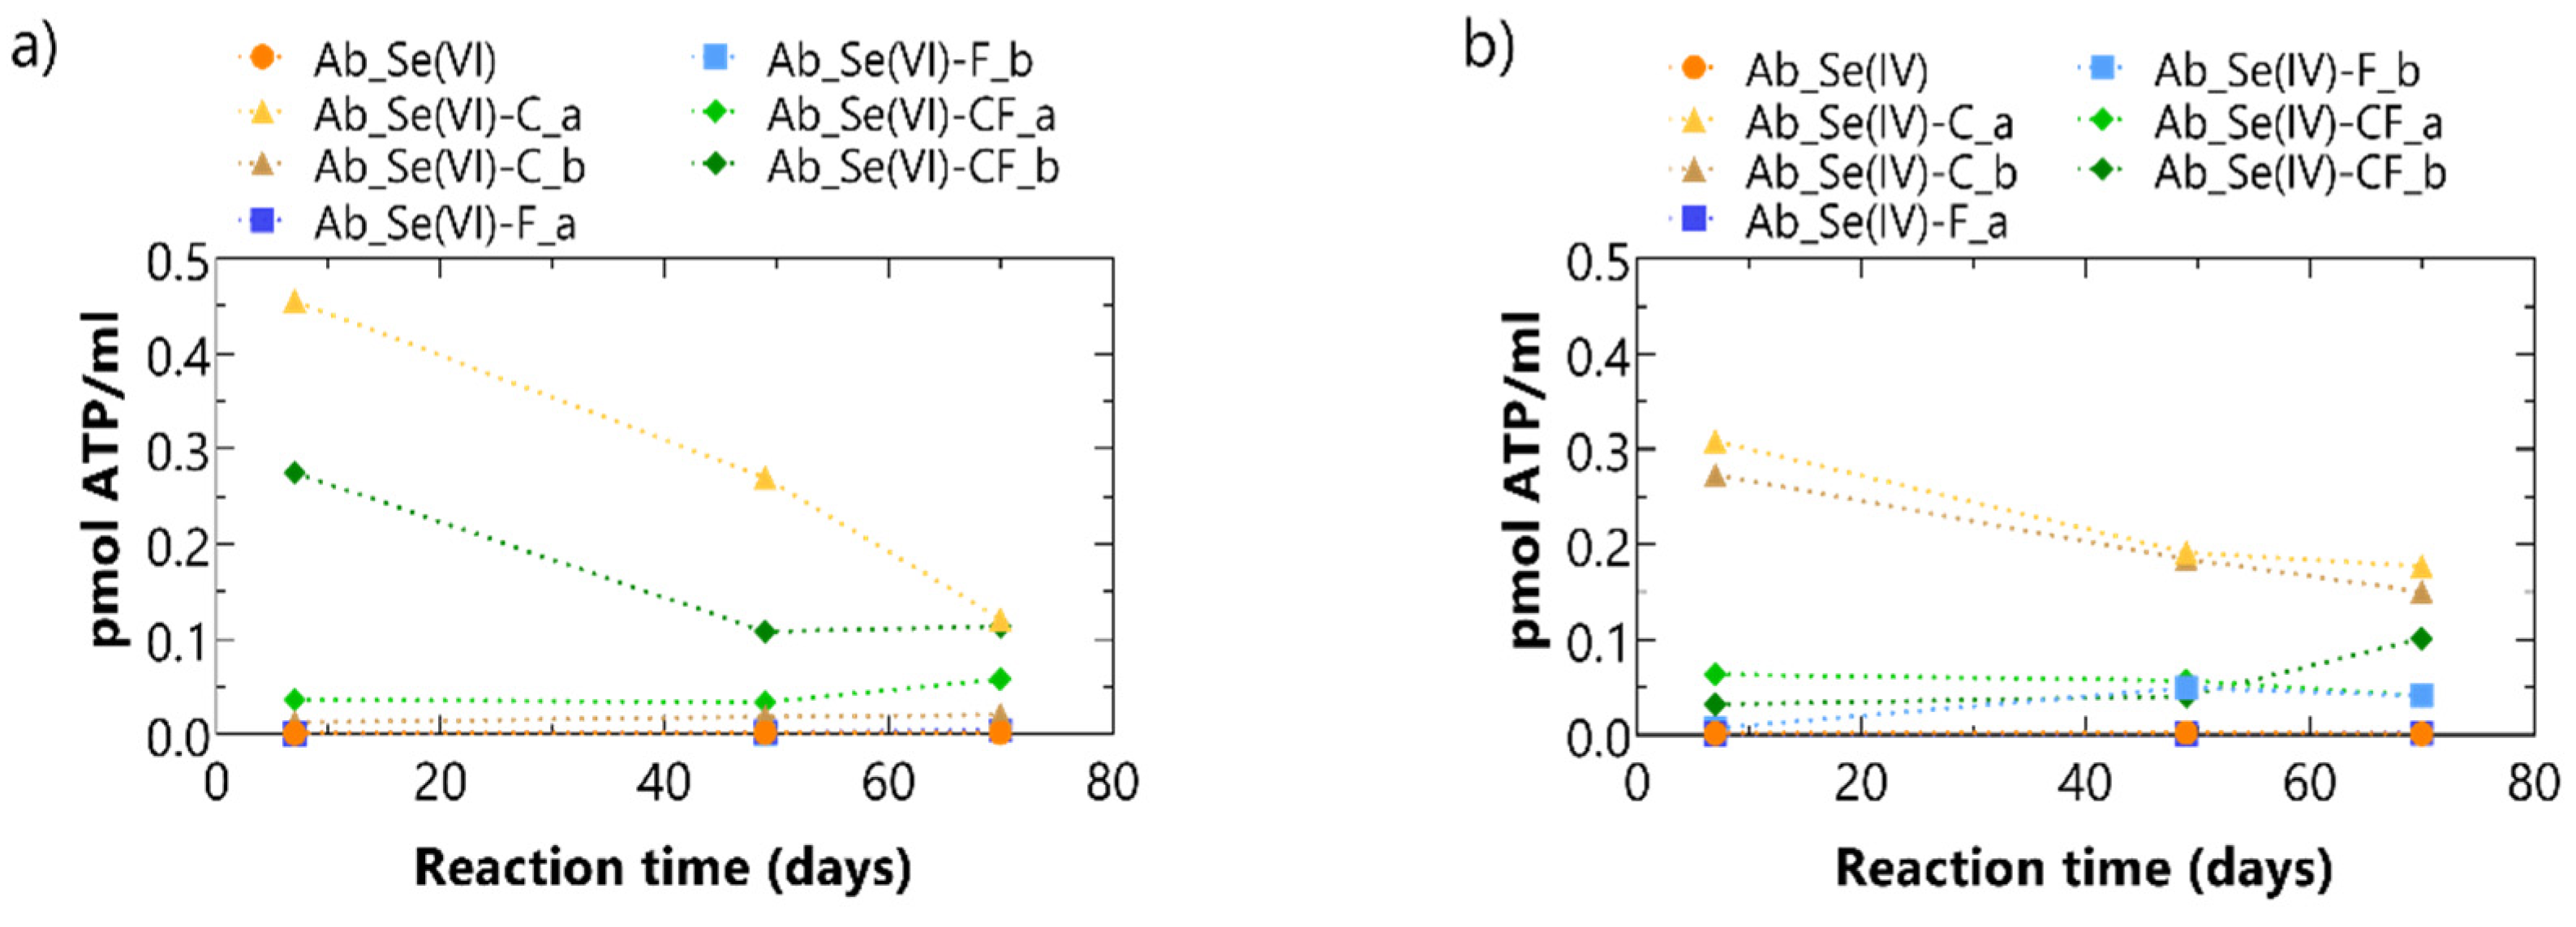
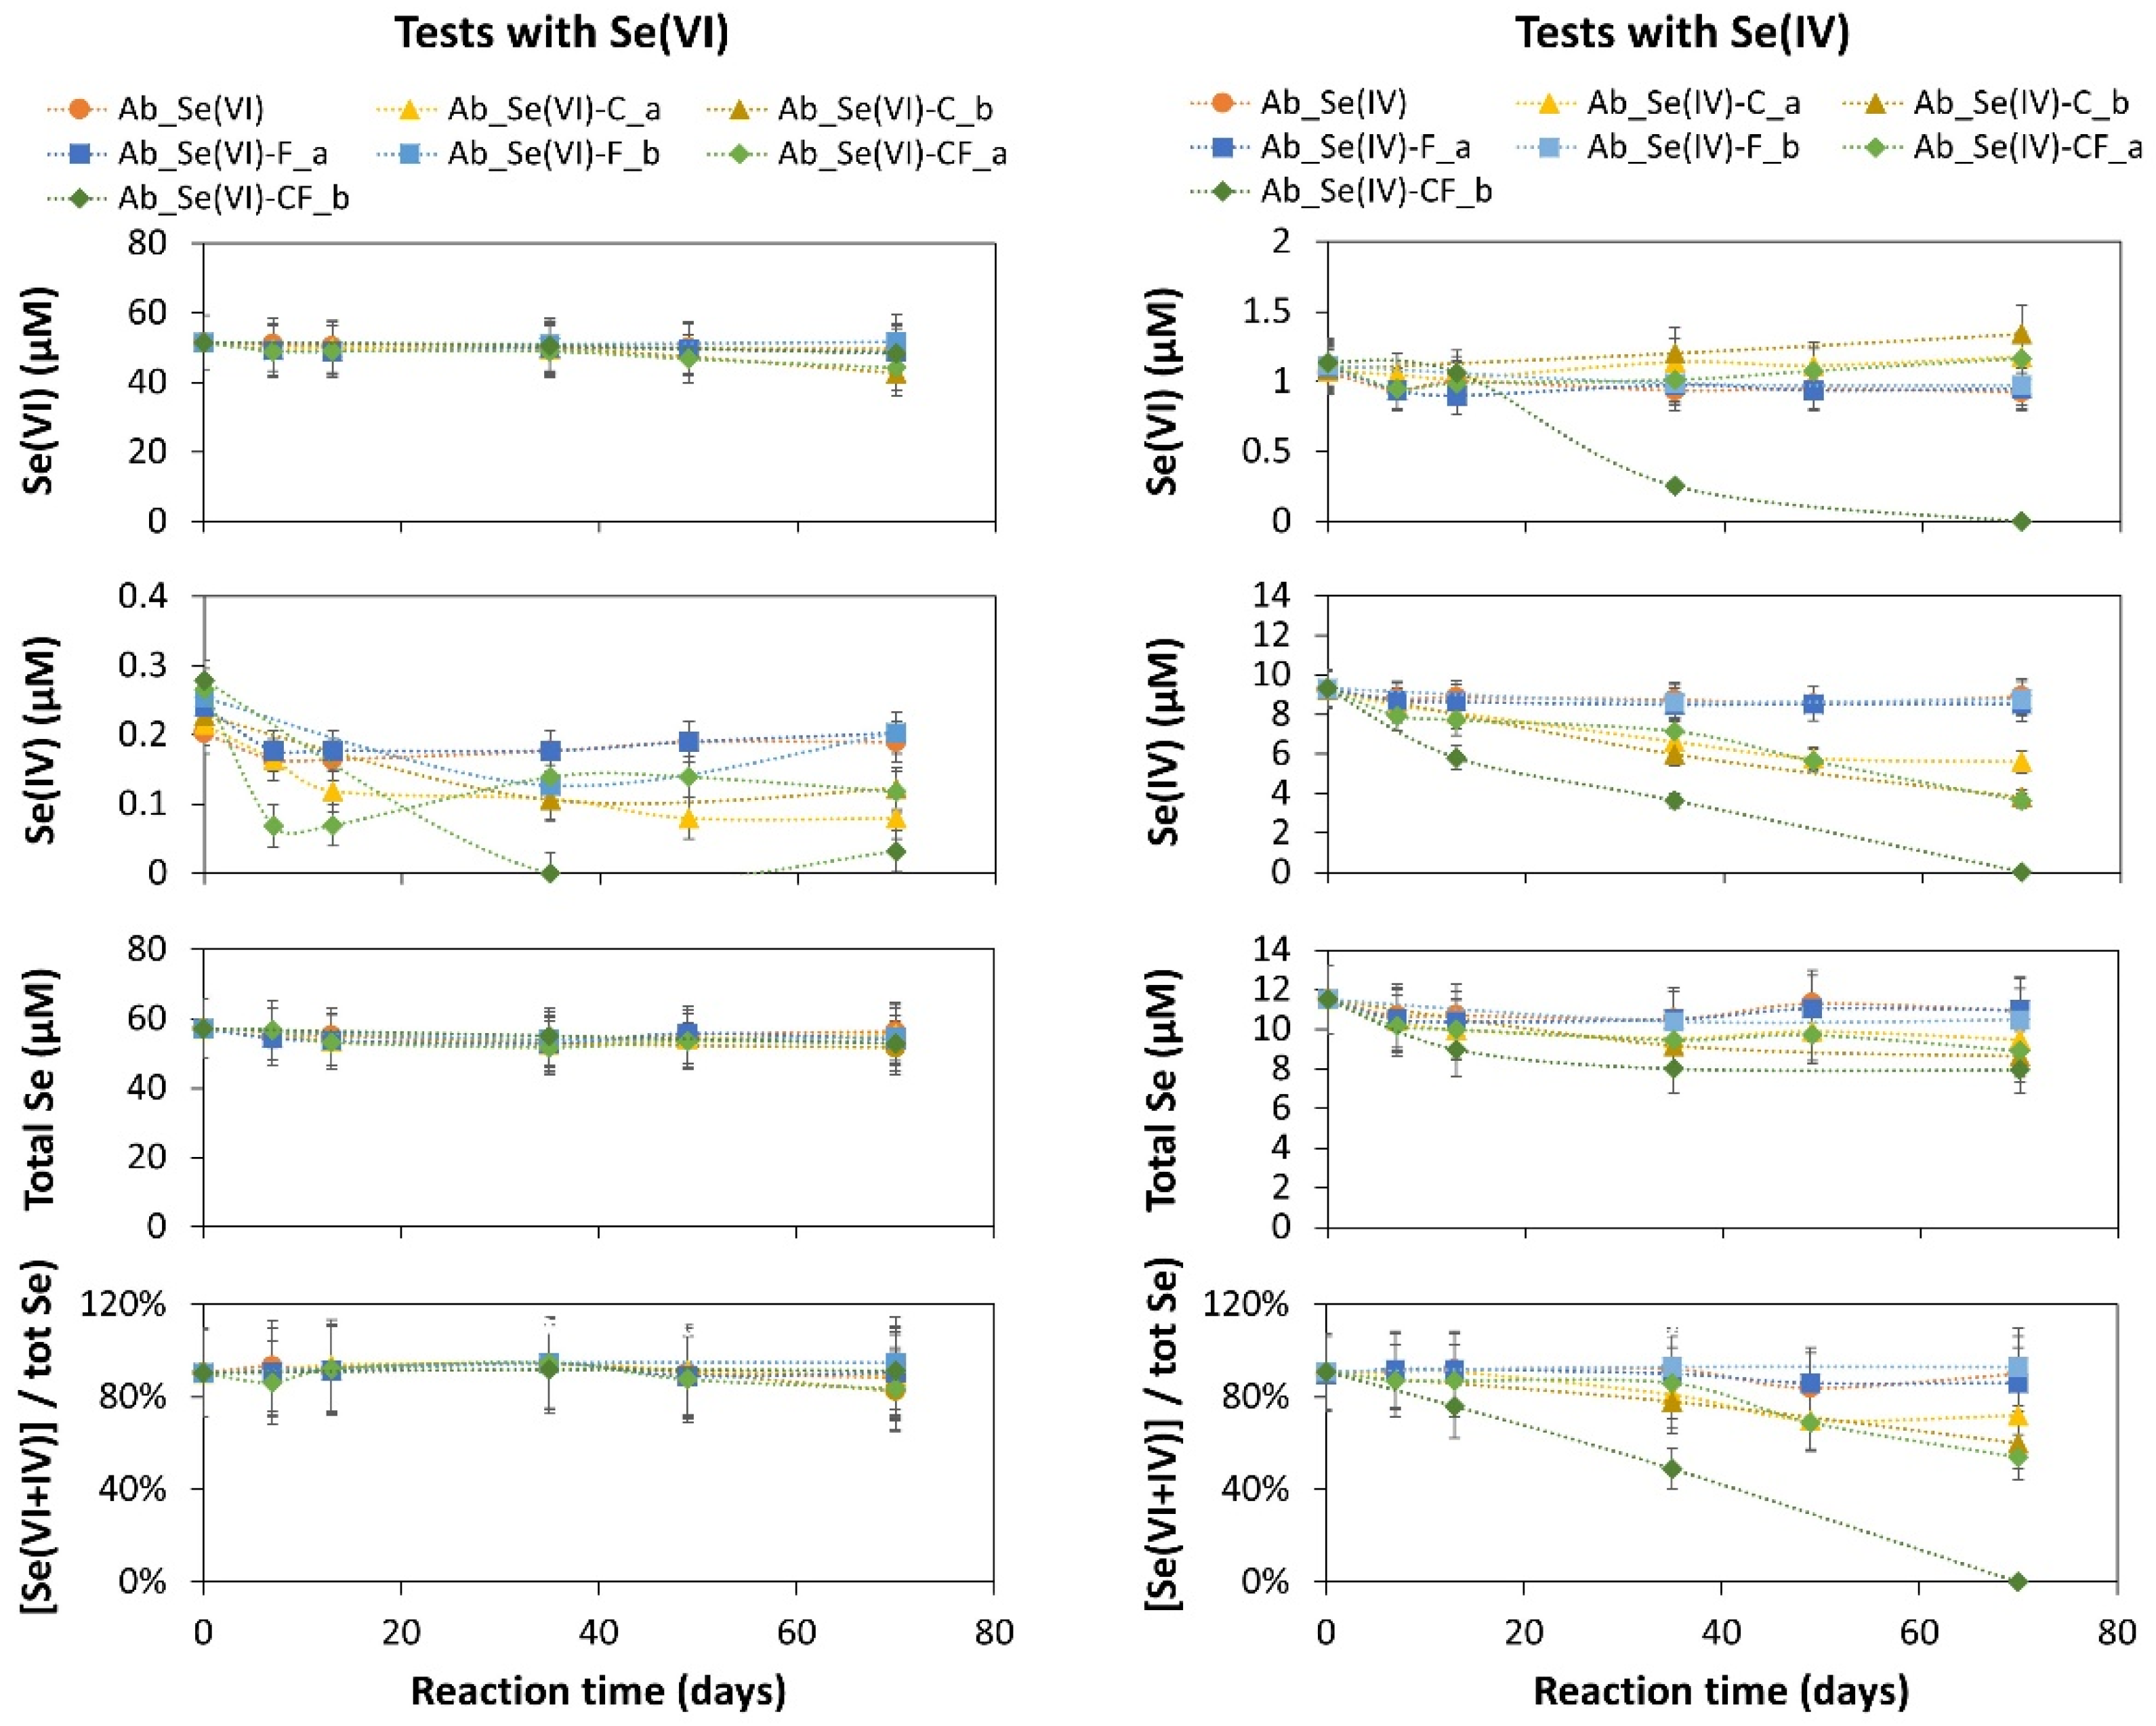
3.1. Abiotic Batch Tests

3.1.1. Experimental Results

Intracellular ATP measurements performed after 7, 49, and 70 days showed that all samples without a solid clay fraction, except Ab_Se(IV)-F_b, were always under the detection limit (0.016 ± 0.013 pmol ATP/mL of clay water), indicating that they remained abiotic (Figure 1). Although intracellular ATP concentrations in samples Ab_Se(VI)-C_a, Ab_Se(VI)-CF_b, Ab_Se(IV)-C_a, and Ab_Se(IV)-C_b were initially high compared to the other samples, these concentrations decreased significantly during the course of the experiments (Figure 1). This suggests that if microorganisms were still initially present, their activity can be neglected. Samples were plated on a rich growth medium (LB) under oxic conditions after 7 days to further confirm the absence of microorganisms. The growth medium has been shown in the past to be highly suitable to cultivate the most dominant species present in BN borehole water. No growth was observed in any of the samples. Furthermore, cultures were prepared at the end of the batch experiments to investigate if possible viable cells could be revived in more optimal growth conditions, i.e., in the presence of sufficient phosphate and lactate, the latter as the preferential carbon and electron source for sulfate-reducing bacteria. No increase in intracellular ATP was observed, lactate was not consumed, and acetate production was not observed. Altogether, these data indicate the absence of active microorganisms, confirming abiotic conditions in the currently discussed batch tests.
Figure 2 shows the evolution of Se(VI), Se(IV), and total Se as a function of time for all abiotic test conditions. No Se was detected in the BN borehole water used for these tests, nor in the blanks with a piece of Opalinus Clay and/or stainless steel filter (Blank_C and Blank_CF).
Under abiotic conditions, Se(VI) remained stable in BN borehole water, and addition of Opalinus Clay and/or stainless steel did not have a significant impact on the Se(VI) concentration nor on the total Se concentration in solution. On the other hand, in the suspensions containing clay (Ab_Se(VI)-C and CF), the selenite concentration (present as an impurity in Na2SeO4) decreased to a significantly lower concentration compared to the initial background concentration observed in all other solutions (Figure 2). When comparing the dissolved Se species (i.e., Se(IV) and Se(VI)) to the concentration of total Se in the suspension, all Se species were accounted for. Note that a selenate impurity was also present in all tests with Se(IV). In one of these tests, a decrease in this Se(VI) background concentration could be observed (test Ab_Se(IV)-CF_b), although in all other test cases, Se(VI) remained stable as in the abiotic tests with Se(VI).
A decrease in the Se(IV) concentration could be observed in some of the batch experiments with added selenite, similar to that observed for the background selenite concentration in the test conditions with added selenate. In sterile BN borehole water without additives, the Se(IV) concentration did not decrease. When Opalinus Clay was added, a decrease in Se(IV) concentration occurred in all suspensions, with or without stainless steel, though more variation in the decrease rate was observed when stainless steel was included (Figure 2). The decrease rate ranged from 0.05 ± 0.02 to 0.1 ± 0.01 µM Se(IV) day−1, with an average of 0.07 µM Se(IV) day−1 for the solutions with only clay and 0.1 µM Se(IV) day−1 for the solutions with both clay and stainless steel. In contrast, the Se(IV) concentration did not decrease in the presence of stainless steel alone (Figure 2). In all test conditions with clay, the total Se concentration decreased (2 to 4 µM), indicating that part of the Se was lost onto the solid phases. This was not the case when only stainless steel was present. Note that after introduction of the clay piece into the water, it slowly disintegrated into smaller particles. Consequently, the observed loss of total Se in the solutions with clay may be slightly underestimated as part of the smallest clay particles was sampled along with the solution, and no additional filtration was performed before total Se measurement. Comparison of the dissolved Se species (Se(VI) + Se(IV)) to the total Se concentration in the suspension shows that part of the total Se in the suspensions with clay after 70 days could not be linked to dissolved Se(VI) or Se(IV), indicating that other—more reduced—Se species were formed.
SEM–EDX analyses were performed on stainless steel filters and clay pieces after finishing the abiotic tests. The main results of sample Ab_Se(IV)-CF_a are shown in Figure 3. More results from this and other samples are shown in a supplementary dataset (Figure S3, Supplementary Materials). Based on these results, Se was present on the stainless steel filter surface in the abiotic tests with selenite only when clay was also present (Figure 3). Clear deposits of Se, more or less spherical in shape, could be observed, though the amount was limited. This is in agreement with the limited decrease in Se(IV) and total Se in the suspensions (Figure 2). EDX spot analysis shows that these spots were mostly containing Se. In these spots, oxygen was not found, while this was the case when performing EDX spot analysis on the stainless steel itself (Figure S3, Supplementary Materials). These results thus suggest that the Se deposits are not composed of precipitated or sorbed selenium oxyanions, but rather of more reduced selenium species such as elemental Se(0) or selenide, Se(-II). This is in agreement with the observed decrease in the ratio of dissolved Se species to the total Se concentration (Figure 2). When Opalinus Clay was not present, Se deposits were not found on the stainless steel filter surface (Figure S3, Supplementary Materials). SEM–EDX analysis on the clay itself did not reveal a significant amount of Se, in any of the test conditions. However, due to the disintegration of the clay pieces, the surface of the clay was quite large, and the limited amount of Se associated with the clay may have been missed by performing EDX-mapping of the clay surface.

3.1.2. Modeling Results

Modeling of the abiotic experiments was performed to examine the extent of sorption of Se(IV) onto Opalinus Clay using the 2-site Langmuir isotherm model parameterized by Frasca et al. [18]. Considering an initial Se(IV) concentration of 9.3 µM (Figure 2), the PHREEQC model of the abiotic experiments calculated that after sorption onto Opalinus Clay, the aqueous Se(IV) concentration would be 7.8 µM. This concentration was broadly consistent with the measured Se (IV) concentration in abiotic experiments with clay as the only additive (Ab_Se(IV)-C_a and Ab_Se(IV)-C_b, Figure 2), which ranged between 5.6 µM and 3.8 µM.
Figure 4 compares the sorption distribution coefficients (Rd, Equation (1)) calculated from the aqueous Se(IV) measurements from the batch tests with clay only (Ab_Se(IV)-C_a) and with clay and filter (Ab_Se(IV)-CF_a), considering a total initial concentration of 9.3 µM, with Rd measurements presented by Frasca et al. [18] for Se(IV) sorption onto Opalinus Clay (obtained from the Mont Terri Rock Laboratory). The data from Frasca et al. [18] were undertaken with an initial Se(IV) concentration of 100 µM (approximately 70 µM at equilibrium), and so the higher Rd values calculated for the present abiotic experiments were expected, given the effect of the sorption isotherm [18]. However, the Rd values calculated using the 2-site Langmuir isotherm model of Frasca et al. [18] for the range of aqueous Se(IV) concentrations (3.8 to 5.6 µM) measured in the present study were lower than (around half) the coefficients calculated from the concentration changes. This suggests that sorption of Se(IV) was enhanced in the BN batch experiments compared to what was observed by Frasca et al. [18]. The comparison also indicates that sorption processes attained a steady state more quickly in the batch experiments undertaken by Frasca et al. [18] than in our study. The slower sorption of Se(IV) apparent in our study may be attributed to the slow disintegration of the clay sample, while Frasca et al. utilized powdered Opalinus Clay material right from the start of the experiments.
Based on the sorption of Se(IV) deduced from our abiotic batch experiments, the Langmuir isotherm parameters of Frasca et al. [18] for Opalinus Clay were revised in order to use these parameters in the subsequent models of the biotic batch experiments (Section 3.2.2) and the in situ experiment (Section 3.3.3). Using sorption potential (KL) and sorption capacity (Smax) values of 7.5 × 10⁴ L mol−1 and 7.5 × 10⁻³ mol kg−1, respectively, for the first site (see Table 3), the isotherm could be offset to represent higher Rd values than that of Frasca et al. [18], with an Rd of 460 mL g−1 at an aqueous Se(IV) concentration of 5.6 µM representing the steady state measured concentration in test Ab_Se(IV)-C_a.

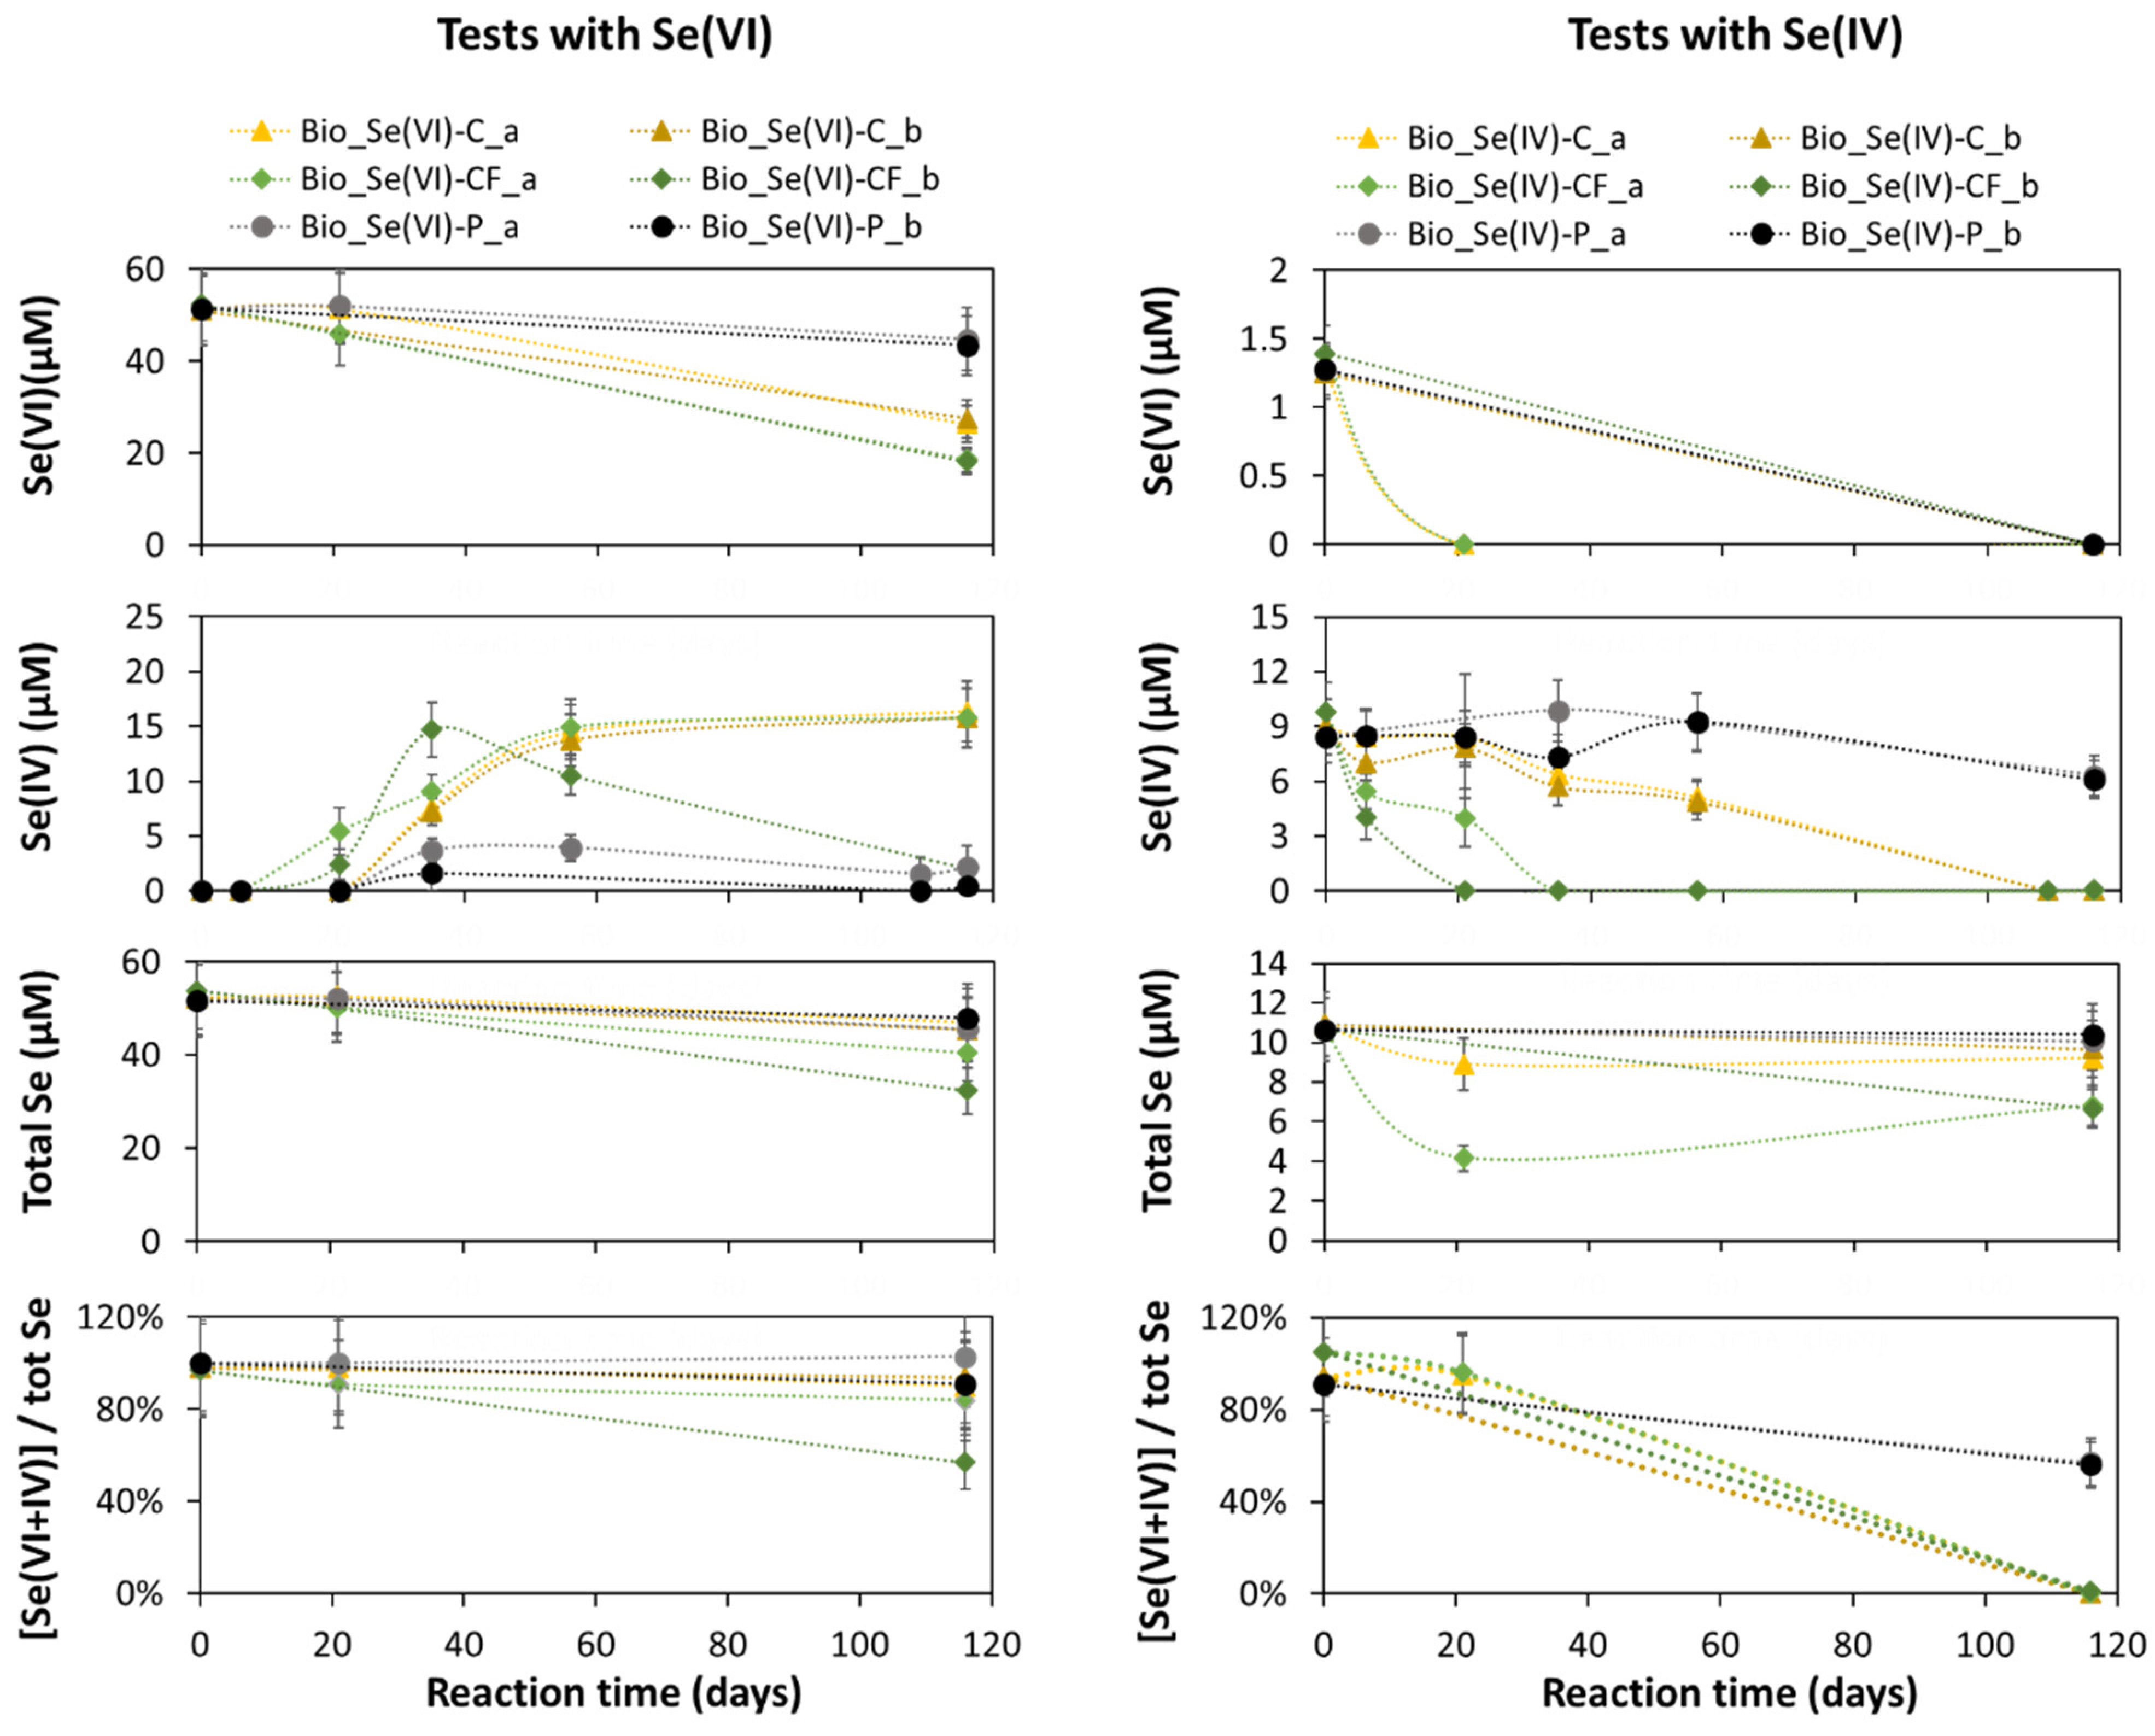
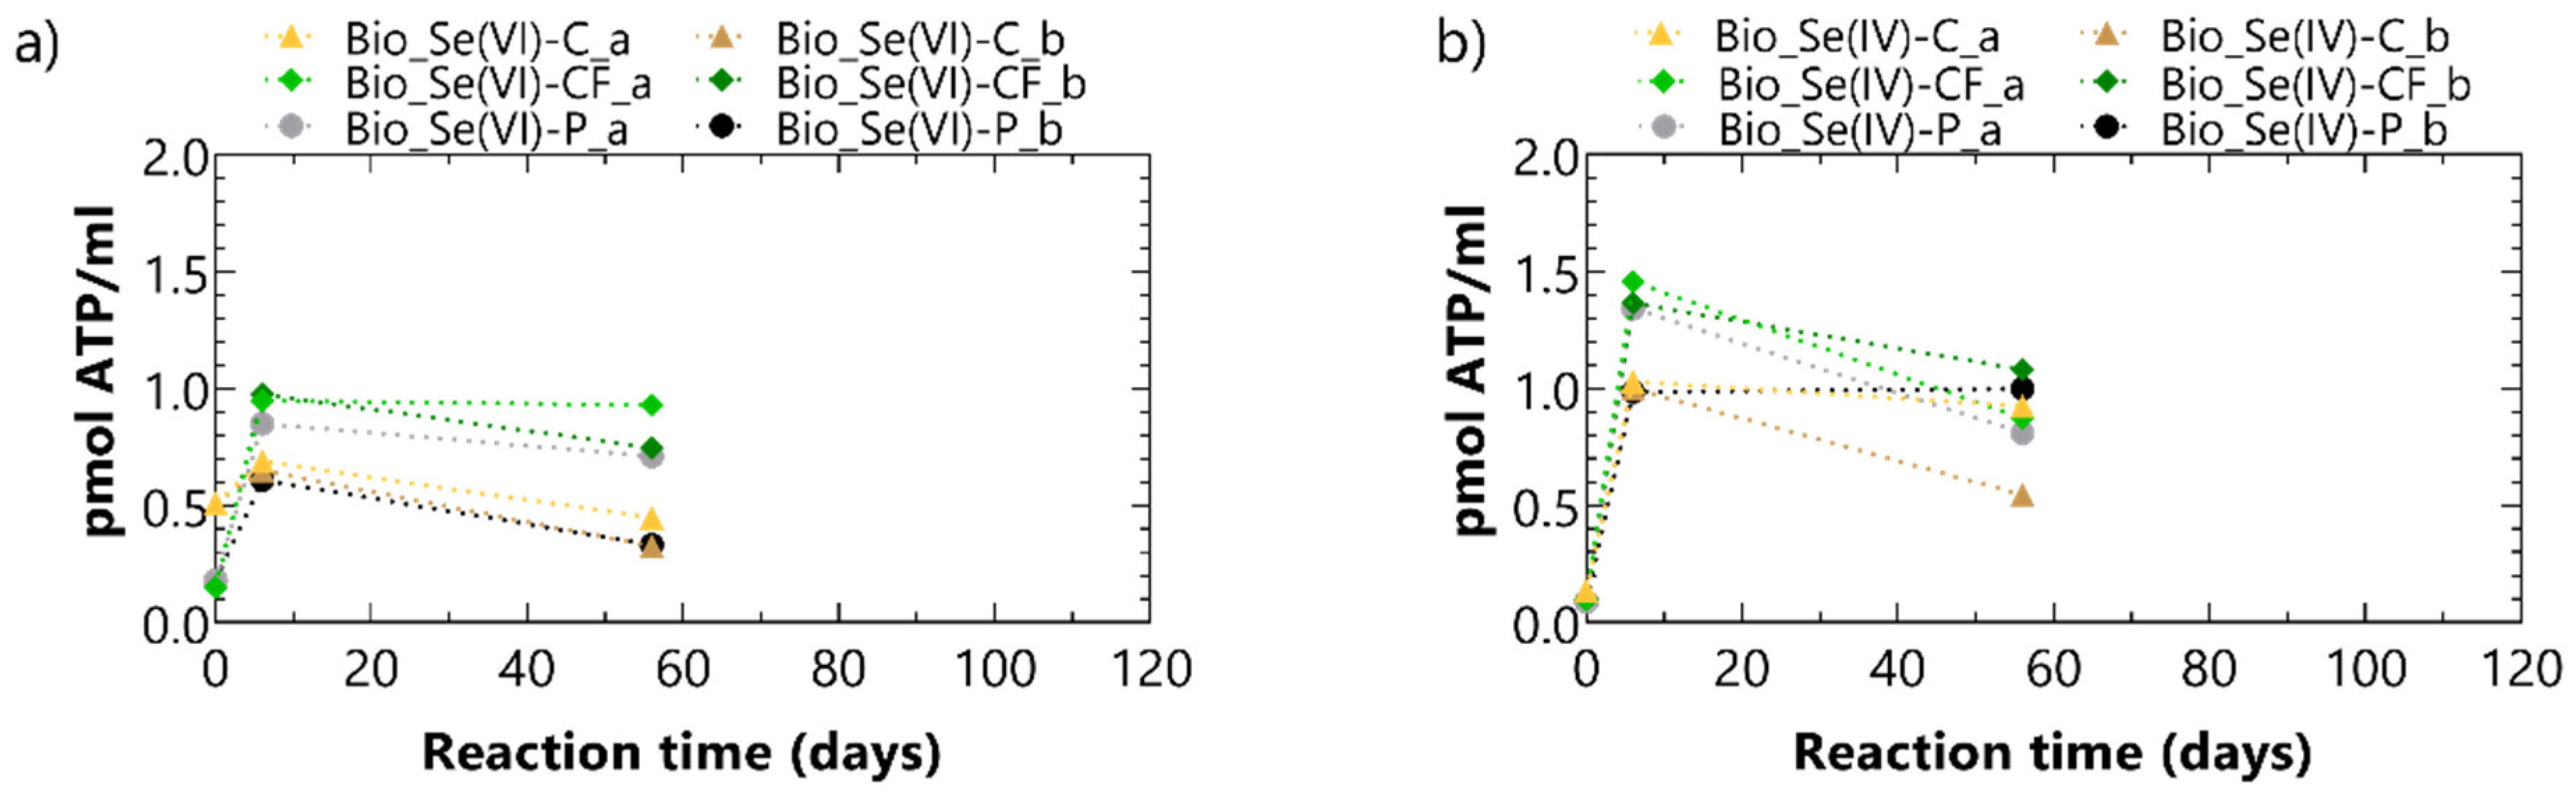
3.2. Biotic Batch Tests

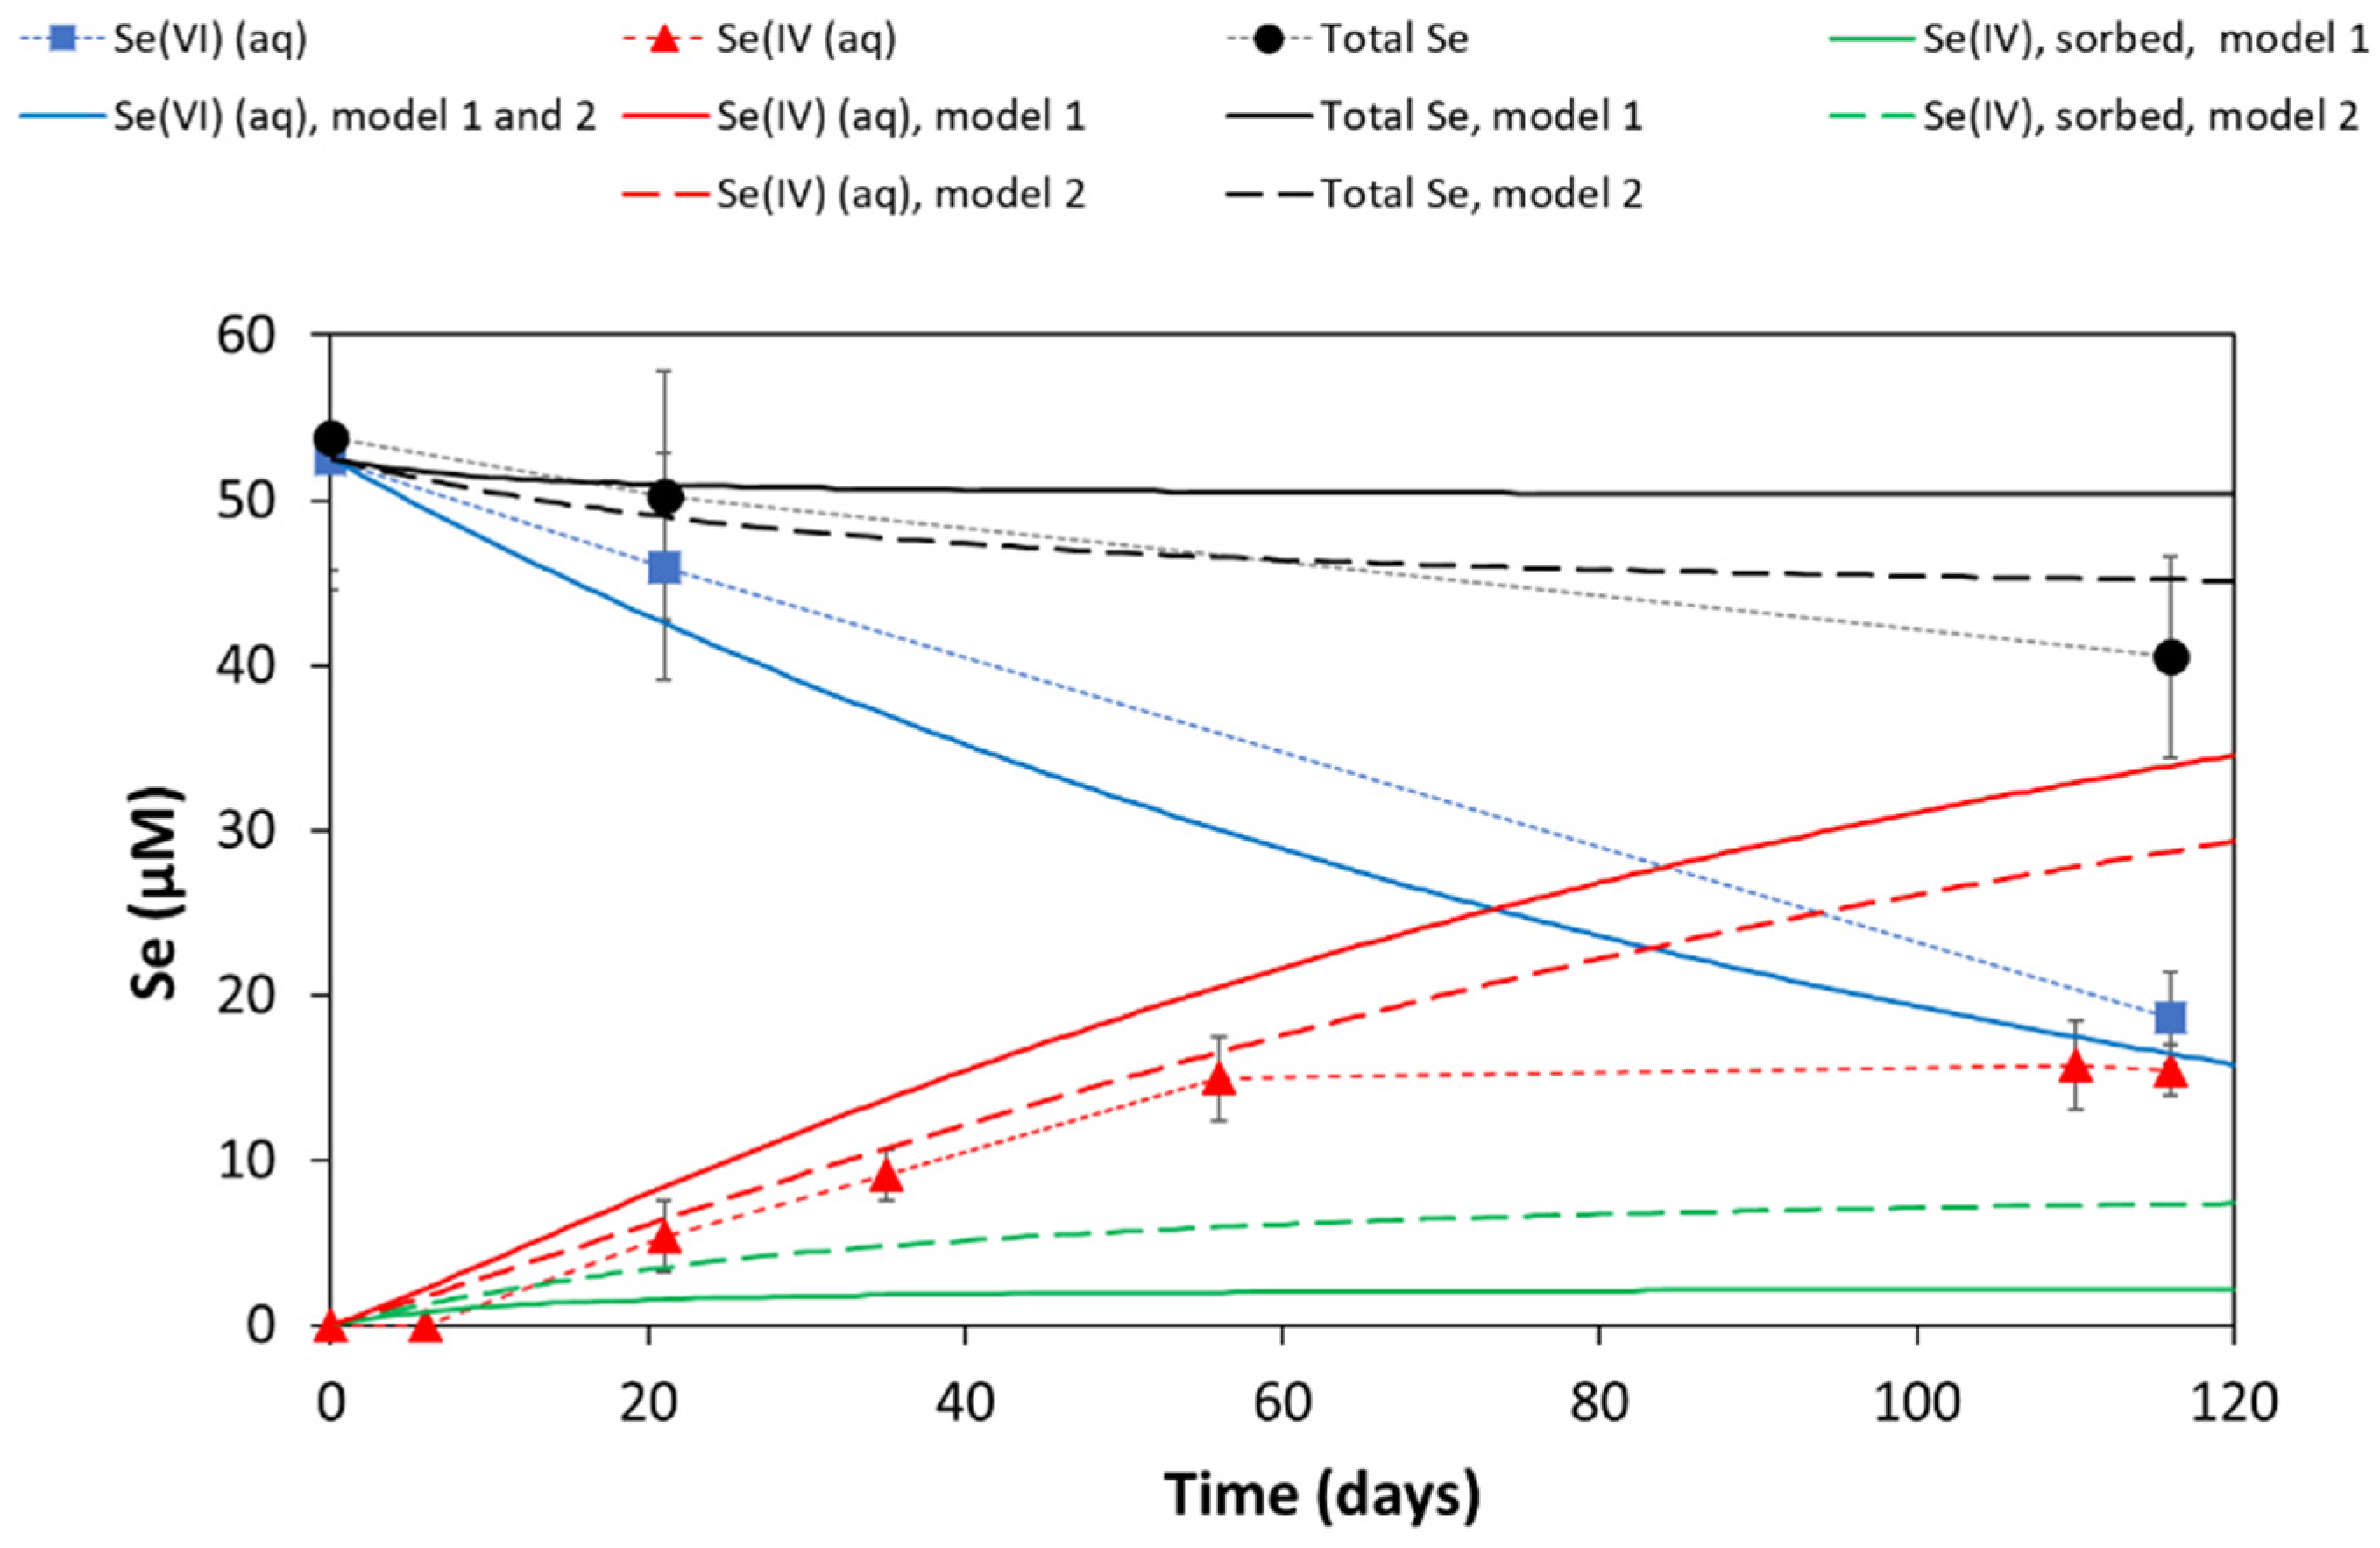
3.2.1. Experimental Results

Intracellular ATP concentrations considerably increased in the first six days, and this increase was more pronounced in the presence of Se(IV) (Figure 5). Afterwards, concentrations decreased slightly or remained stable, which is typically observed in batch experiments with borehole clay water [52,53,54]. No intracellular ATP measurements were performed at the end of the batch experiment.
Under biotic conditions, a decrease in the concentration of Se(VI) was observed in the presence of clay with or without stainless steel filter, though at a slightly higher decrease rate for tests with clay and stainless steel compared to with clay alone (Figure 6). Overall, decrease rates of 0.2 ± 0.07 µM Se(VI) day−1 and of 0.3 ± 0.07 µM Se(VI) day−1 were found for tests with clay and with clay and stainless steel filter, respectively. At the end of the test, ~65% of the total decrease in Se(VI) could be linked to the production of Se(IV) in the solutions with clay alone (Bio_Se(VI)-C), while Se(IV) only made up ~6 and 47% of the Se(VI) concentration decrease in the samples with a stainless steel filter (Bio_Se(VI)-CF). In the absence of clay or stainless steel filter solid phases (Bio_Se(VI)-P), no significant decrease in Se(VI) concentration could be found. However, a small increase in selenite concentration was observed (by 0.4 to 2 µM), indicating that some selenate reduction to selenite had occurred, though at a limited rate (overall decrease rate of 0.06 ± 0.09 µM Se(VI) day−1). Based on the decrease in total Se concentration (by 5 to 7 µM for Bio_Se(VI)-C and by 13 to 22 µM for Bio_Se(VI)-CF), part of the Se must be associated with the solid phase. In addition, here the observed loss of total Se may be slightly underestimated due to the partial disintegration of the clay possibly containing sorbed Se. As part of the smallest clay particles was sampled along with the solution at the end of the experiment and total Se was measured without additional filtration, the measured total Se concentration may have indeed slightly overestimated the total Se in solution (similar to the abiotic tests, see Section 3.1.1). The concentration of total Se did not decrease in the tests without solid phases (Bio_Se(VI)-P).
When comparing the concentration of dissolved Se species [Se(VI) + Se(IV)] to the concentration of total Se in the suspensions, only for tests with stainless steel filter and especially for Bio_Se(VI)-CF-b, part of the total Se could not be linked to Se(IV) or Se(VI). Indeed, the total concentration of Se(IV) and Se(VI) to the total Se concentration in suspension was 57% in sample Bio_Se(VI)-CF-b (Figure 6), indicating the formation of other (more reduced) Se species. The significant decrease in this ratio in test Bio_Se(VI)-CF-b coincided with the observed decrease in the concentration of produced selenite after reaching a maximum at day 35 (Figure 6).
For the biotic batch tests with Se(IV), a fast decrease in the Se(IV) concentration could be observed for the tests with clay (Bio_Se(IV)-C) (Figure 6). This decrease was even enhanced when stainless steel was also present (Bio_Se(IV)-CF). Overall, a decrease rate of 0.1 ± 0.02 µM Se(IV) day−1 and of 0.3 to 0.5 ± 0.05 µM Se(IV) day−1 was observed for tests with clay and with clay and stainless steel filter, respectively, resulting in a complete removal of selenite from the solution. The total selenium concentrations decreased for both test conditions with clay, though for the tests with clay alone, this decrease did not exceed the analytical uncertainty, while a significant decrease was observed for the tests with clay and stainless steel. Note that the total Se concentration in Bio_Se(IV)-CF_a already decreased after 21 days and seemed to re-increase afterwards. This could be tentatively attributed to the fact that the clay sample was not yet disintegrated after 21 days (visual observation), while this was the case at the end of the experiment. Part of the Se species sorbed on the clay was thus detected in the suspension at the end of the test, which was likely not (or less) the case after 21 days. Furthermore, based on the ratio of the total concentration of Se(IV) and Se(VI) to the total Se concentration, the total Se content in tests Bio_Se(IV)-C and Bio_Se(IV)-CF measured at the end of the test was not accounted for by these two dissolved selenium species alone (Figure 3), indicating the formation of other (more reduced) Se species.
In the absence of clay or filter material (Bio_Se(IV)-P), a small decrease in Se(IV) concentration could be observed, corresponding to a Se(IV) decrease rate of 0.02 ± 0.01 µM Se(IV) day−1. On the other hand, no decrease in the total Se concentration could be observed in these solutions. Based on the ratio of the total concentration of Se(IV) and Se(VI) to the total Se, only ~57% of the total Se concentration in the batch tests without solid phases could be linked to dissolved Se species, again indicating that Se(IV) had been reduced.

3.2.2. Modeling Results
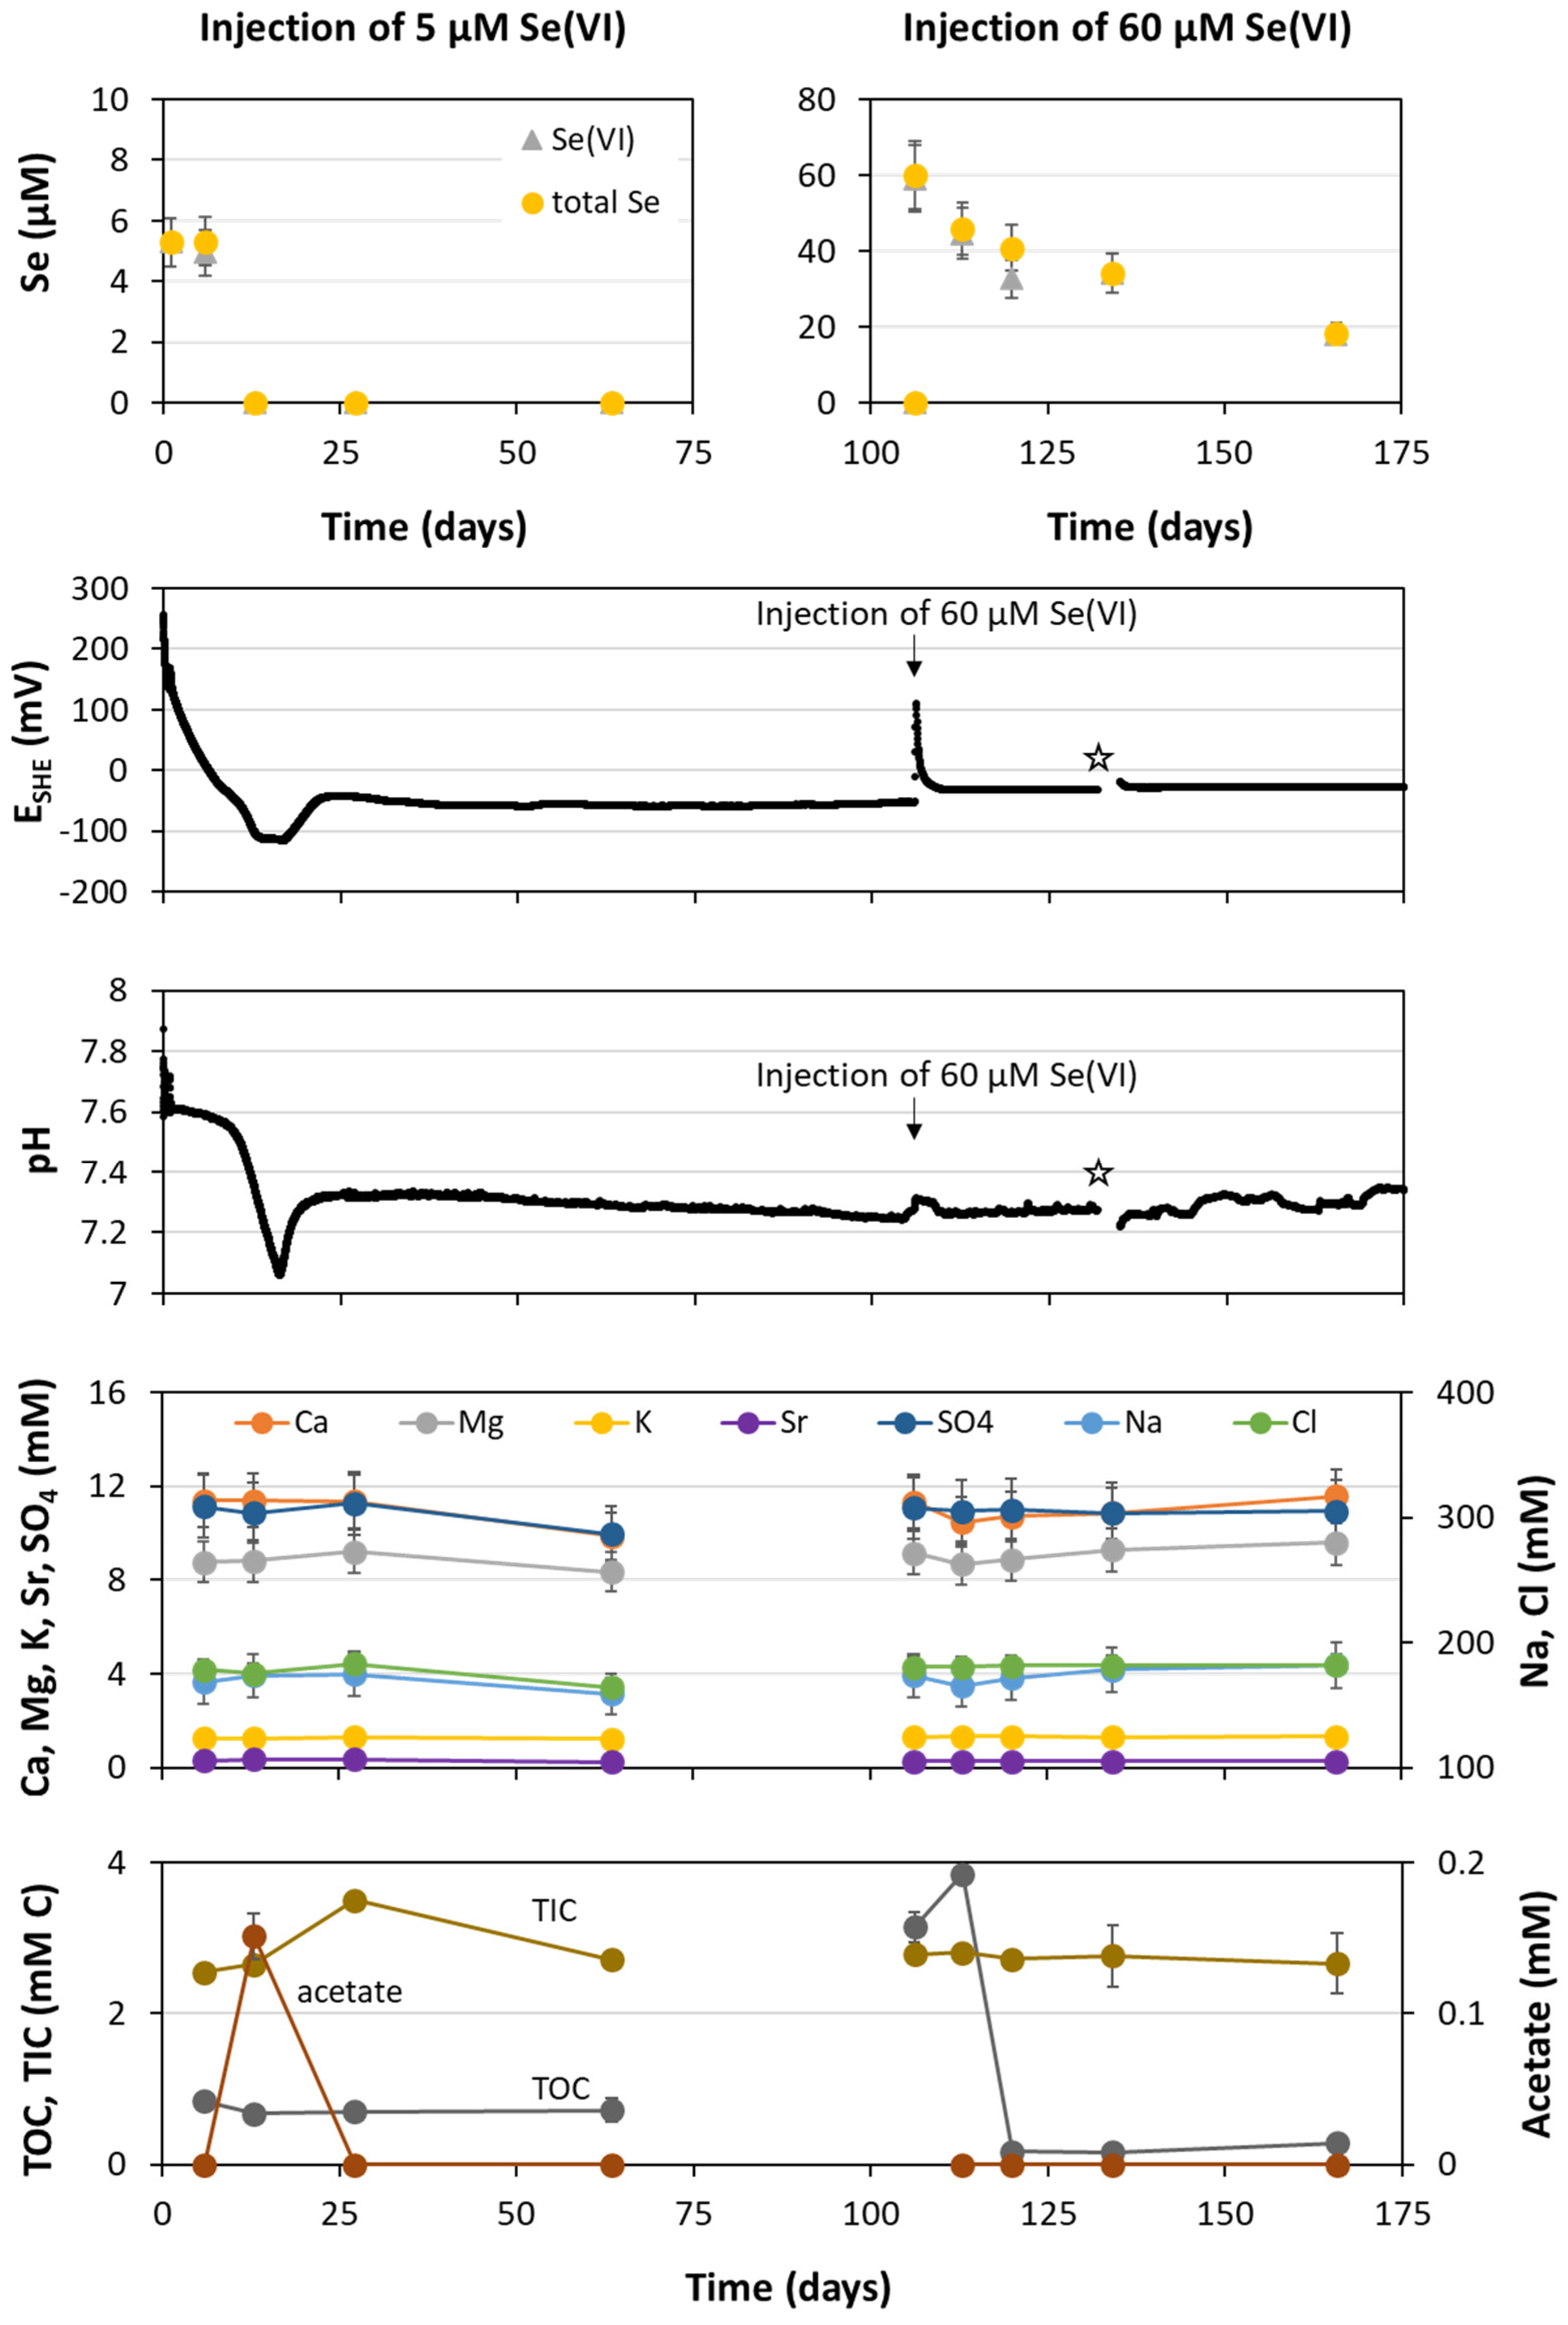
The biotic batch experiment Bio_Se(VI)-CF-a, which examined the reactivity of 50 µM Se(VI) with Opalinus Clay and stainless steel filter material, was selected for geochemical modeling, as it displayed clear trends in the concentration data and since its components were the most representative of the in situ tests described in Section 3.3.
Figure 7 compares the output of the PHREEQC models that include the reduction of Se(VI) to Se(IV) defined by a first order kinetic reaction with a rate constant of 0.01 day−1. The decrease in the modeled Se(VI) concentration agreed well with the experimental data. As a result of the first order reduction process, the model predicted that the aqueous Se(IV) concentration would increase steadily, although part of the produced Se(IV) was modeled to sorb on the solid phases. In Model 1 (Figure 7), Se(IV) sorption was represented by the 2-site Langmuir isotherm of Frasca et al. [18]. Based on this, the aqueous Se(IV) would have increased to 35 µM after 120 days, with around 2 µM of the selenite sorbed onto the solid phases. Model 2 (dashed line in Figure 7) used the modified isotherm model (Table 3) to represent the increased sorption apparent in the abiotic batch tests (Section 3.1.2). This model provided a closer fit to the Se(IV) and total Se data, again indicating the differences in sorption of Se(IV) between the results from Frasca et al. [18] and our study.
During the first 60 days of the batch experiment, the two models provided a reasonable representation of the trend in measured Se(IV) concentrations, i.e., an increase to around 15 µM. However, after ~60 days, the measured Se(IV) stabilized at around 15 µM, whereas the modeled selenite concentration continued to increase, controlled by the continuing selenate reduction process and subsequent selenite sorption. The constant selenite concentration observed in the analytical data may be attributed to a solubility control by a discrete solid phase, perhaps in addition to the sorption process (see further Section 3.4). Comparison of Model 2 with the measured Se(IV) and total aqueous Se concentrations indicates that after 116 days, between 5 and 10 µM of the initially added Se would have sorbed.

3.3. In Situ Tests

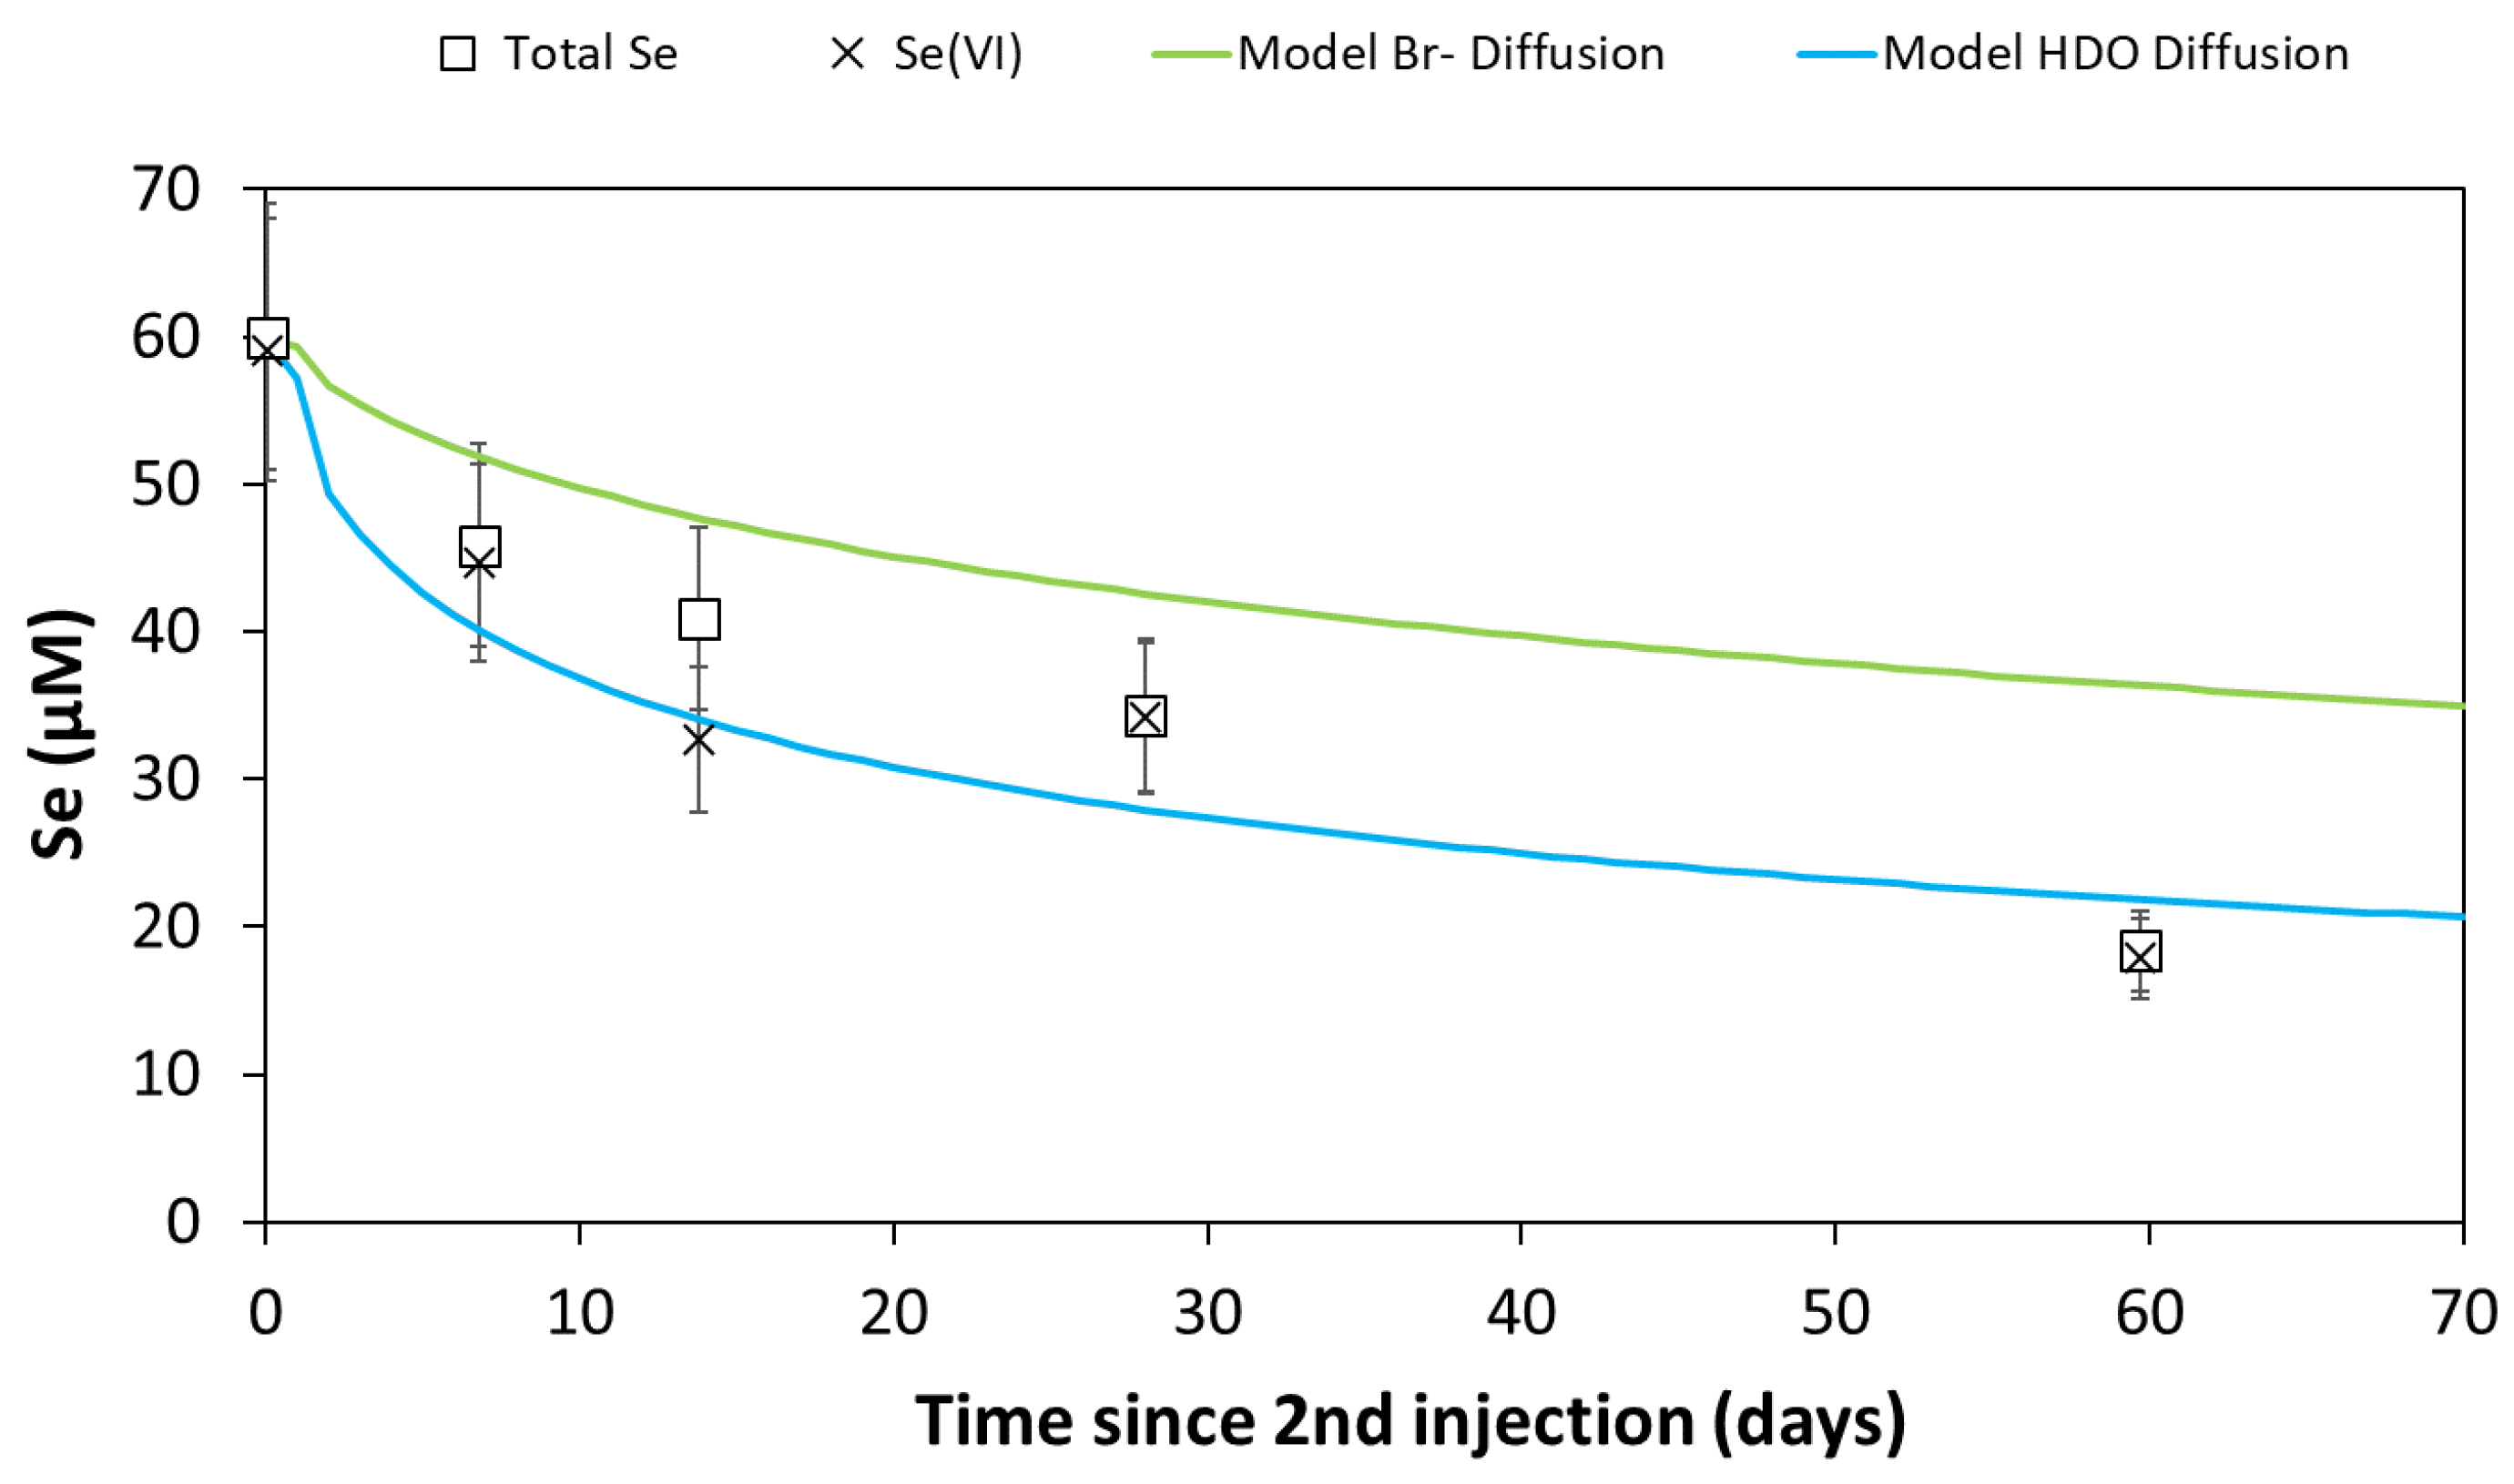
3.3.1. Chemical Analyses Results

Figure 8 shows the evolution of the selenium species in the interval solution after injection with 5 µM (at t = 0) and with 60 µM (at t = 106 days) selenate. The selenite concentration is not shown, since it was below detection limit (0.013 µM) for all time points. Taking into account the analytical uncertainty, the total Se concentration was completely covered by the Se(VI) concentration, indicating that in the circulating interval solution, there was no significant production of other Se species.
During the first injection test, the pH remained rather stable at 7.6, while the selenate concentration decreased (Figure 8). A sharp pH decrease was however noticed after Se was most likely fully removed from the solution, indicating that another reaction occurred after selenium was removed from the solution. Initially, the Eh decreased only slowly, likely due to stabilization of the electrode (after being verified in air). This means that during the initial Se removal, the Eh of the interval solution remains unknown. Concomitantly with the sharp pH decrease, the Eh first decreased and then reached a stable value at –114 mV (Figure 8). This behavior again points towards an additional ongoing reaction in the solution after Se removal. Seventeen days after starting this test, both the pH and the Eh increased again and remained stable afterwards at ~7.3 and –60 mV, respectively. During the second injection test, both pH and Eh remained rather stable in time at a value of 7.3 and –31 mV, respectively.
The concentration of the main cations and anions present in the BN borehole water were stable (within the measurement uncertainty) during both injection tests (Figure 8). On the other hand, some variations in the carbon components could be observed. During the first in situ test, the TOC concentration remained more or less stable, although a slight decrease was observed in the first 13 days (when Se(VI) was removed completely). Between day 6 and 13, the acetate concentration increased from below 0.008 mM (detection limit) to 0.15 mM. Afterwards, the produced acetate was consumed, since it was no longer present after 27 days. The TIC concentration increased slightly during the initial TOC decrease, but increased more during acetate consumption, suggesting complete oxidation of acetate to CO2. During the second in situ test, the TOC concentration was initially rather high (3.1 mM), especially compared to the values observed in the first test. The TOC concentration decreased significantly after 7 days to 0.2 mM C and remained constant afterwards. No changes in TIC concentration and no acetate was detected in the second in situ injection test.
SEM–EDX analyses were performed on the clay sample from the clay loop that was installed in the circuit of Interval 3 during both injection tests with Se(VI) (data not shown). However, due to the low amount of Se injected and the high surface area throughout the in situ experiment, Se was only found on the clay in only very limited amounts. This as well as the limitations of the SEM–EDX technique prevent a conclusive interpretation regarding the speciation of the sorbed or precipitated Se species.

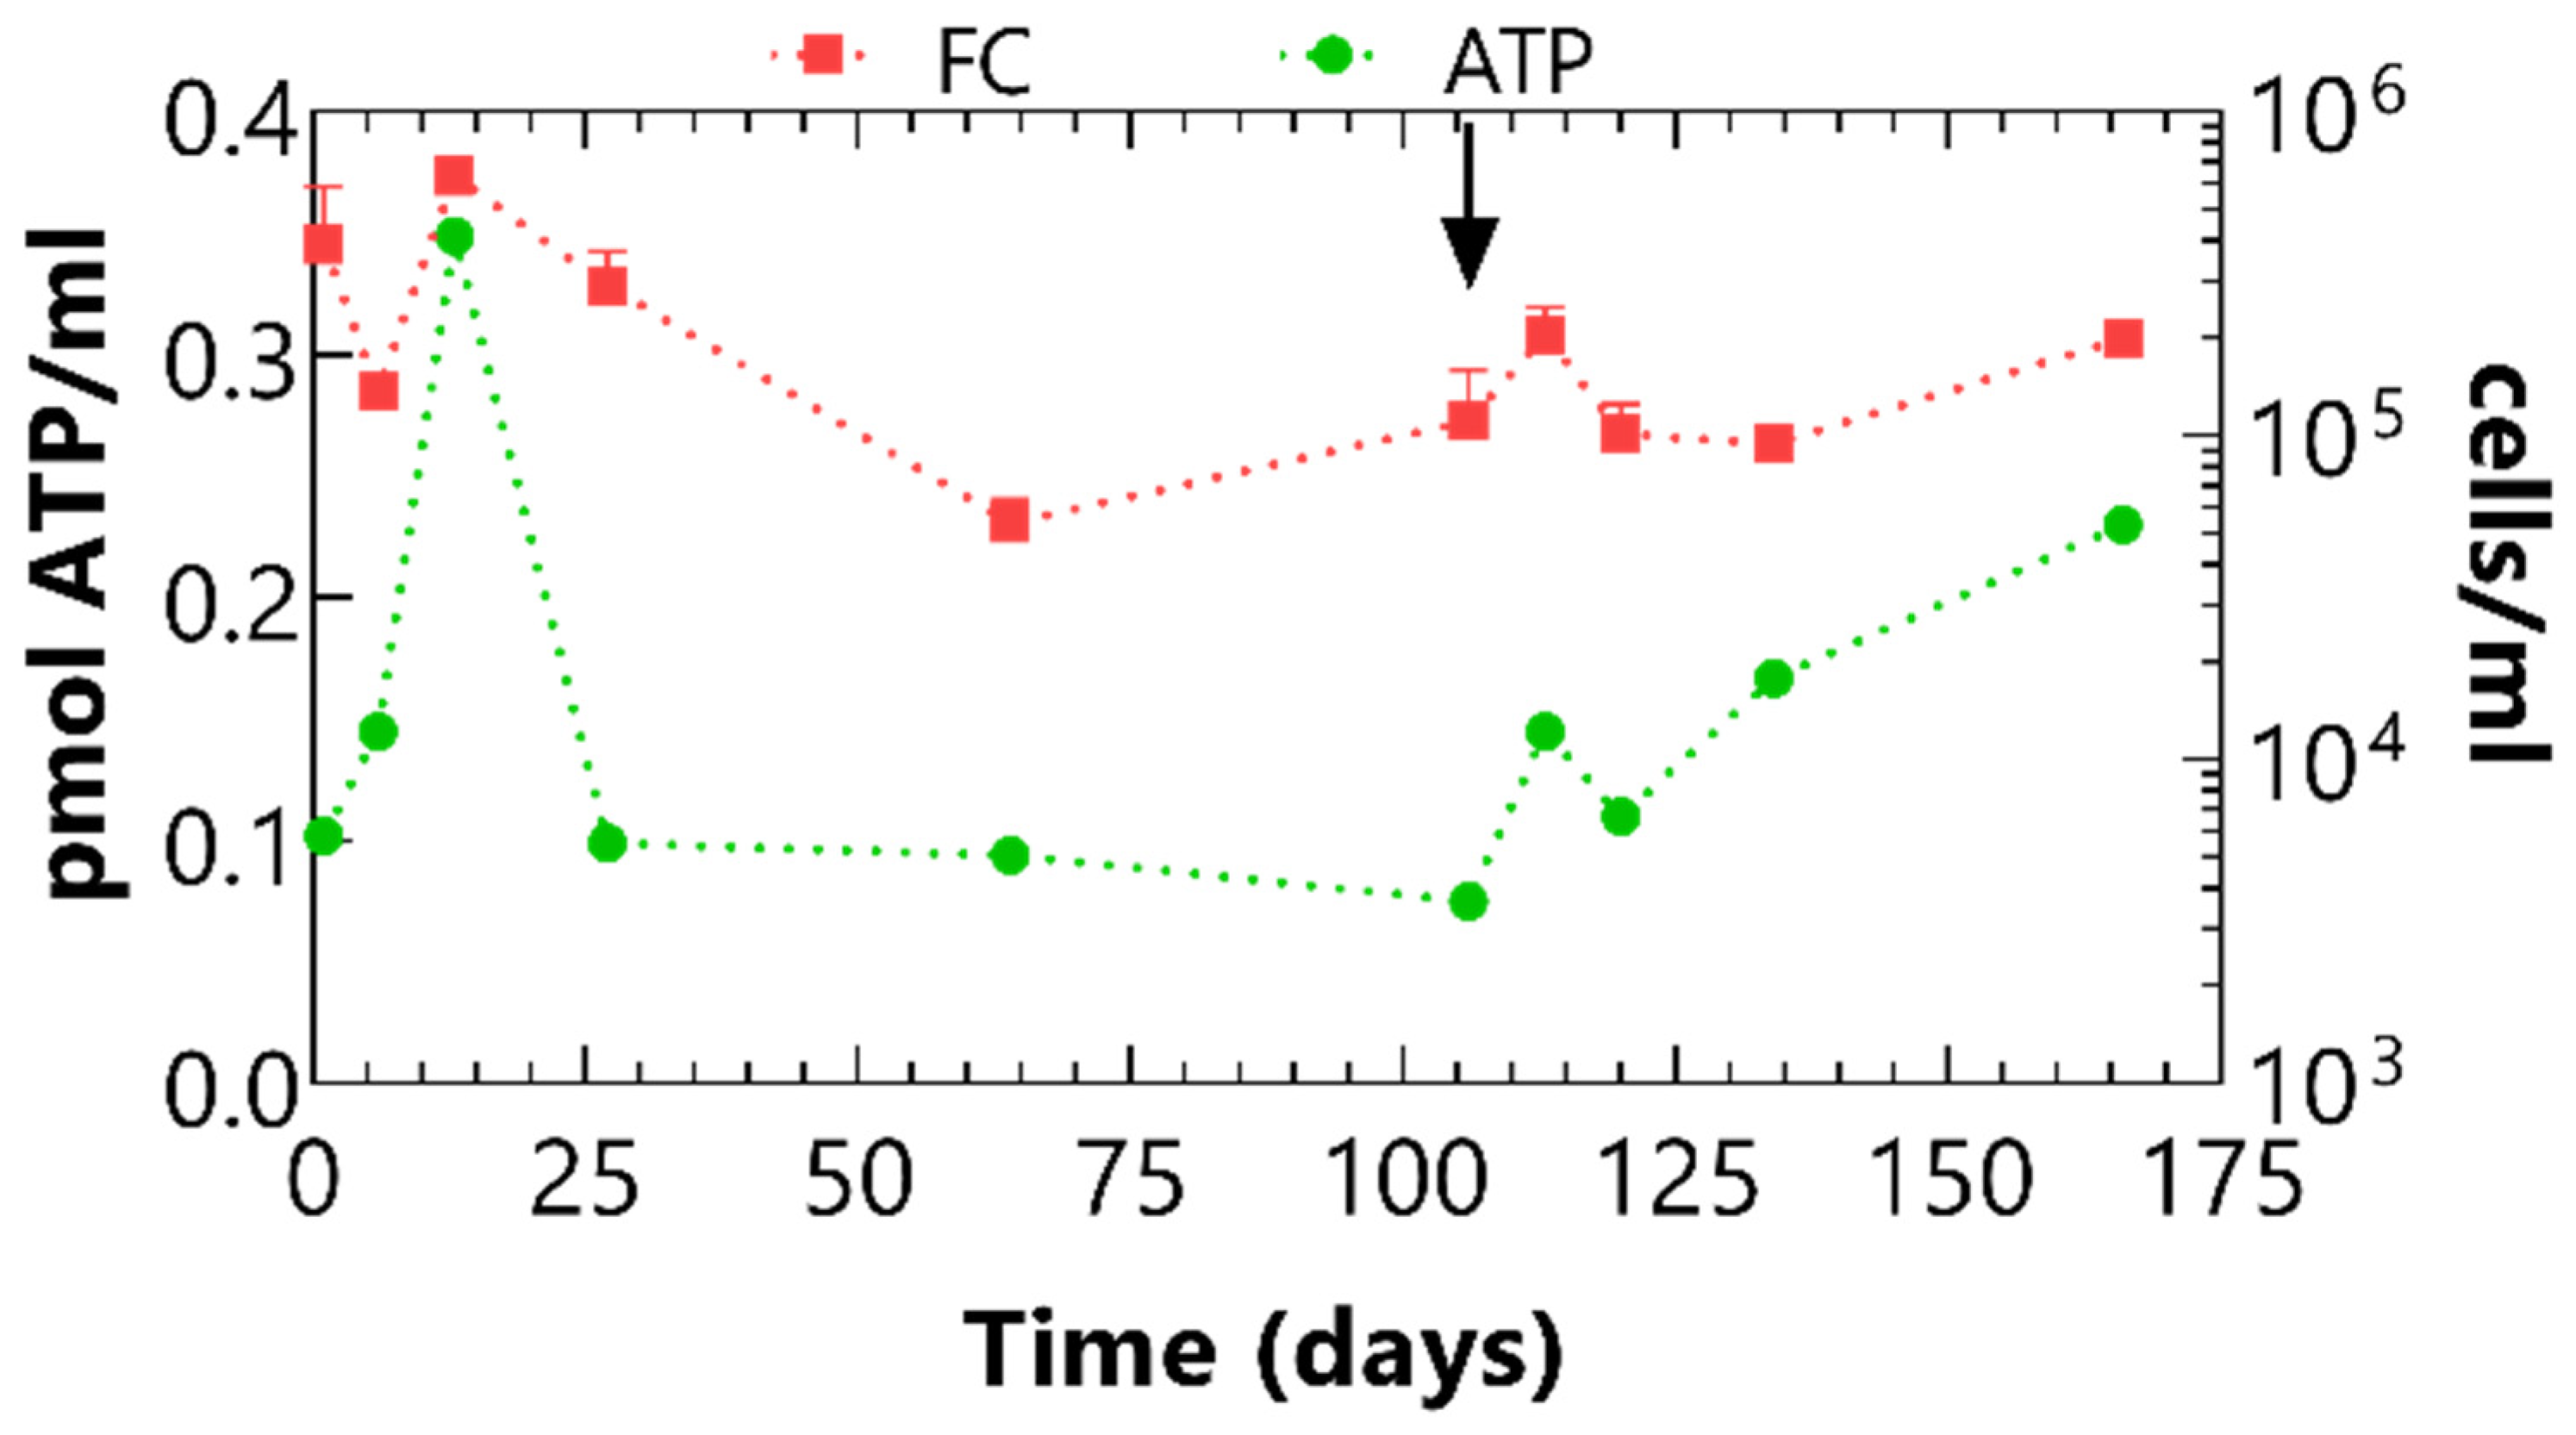
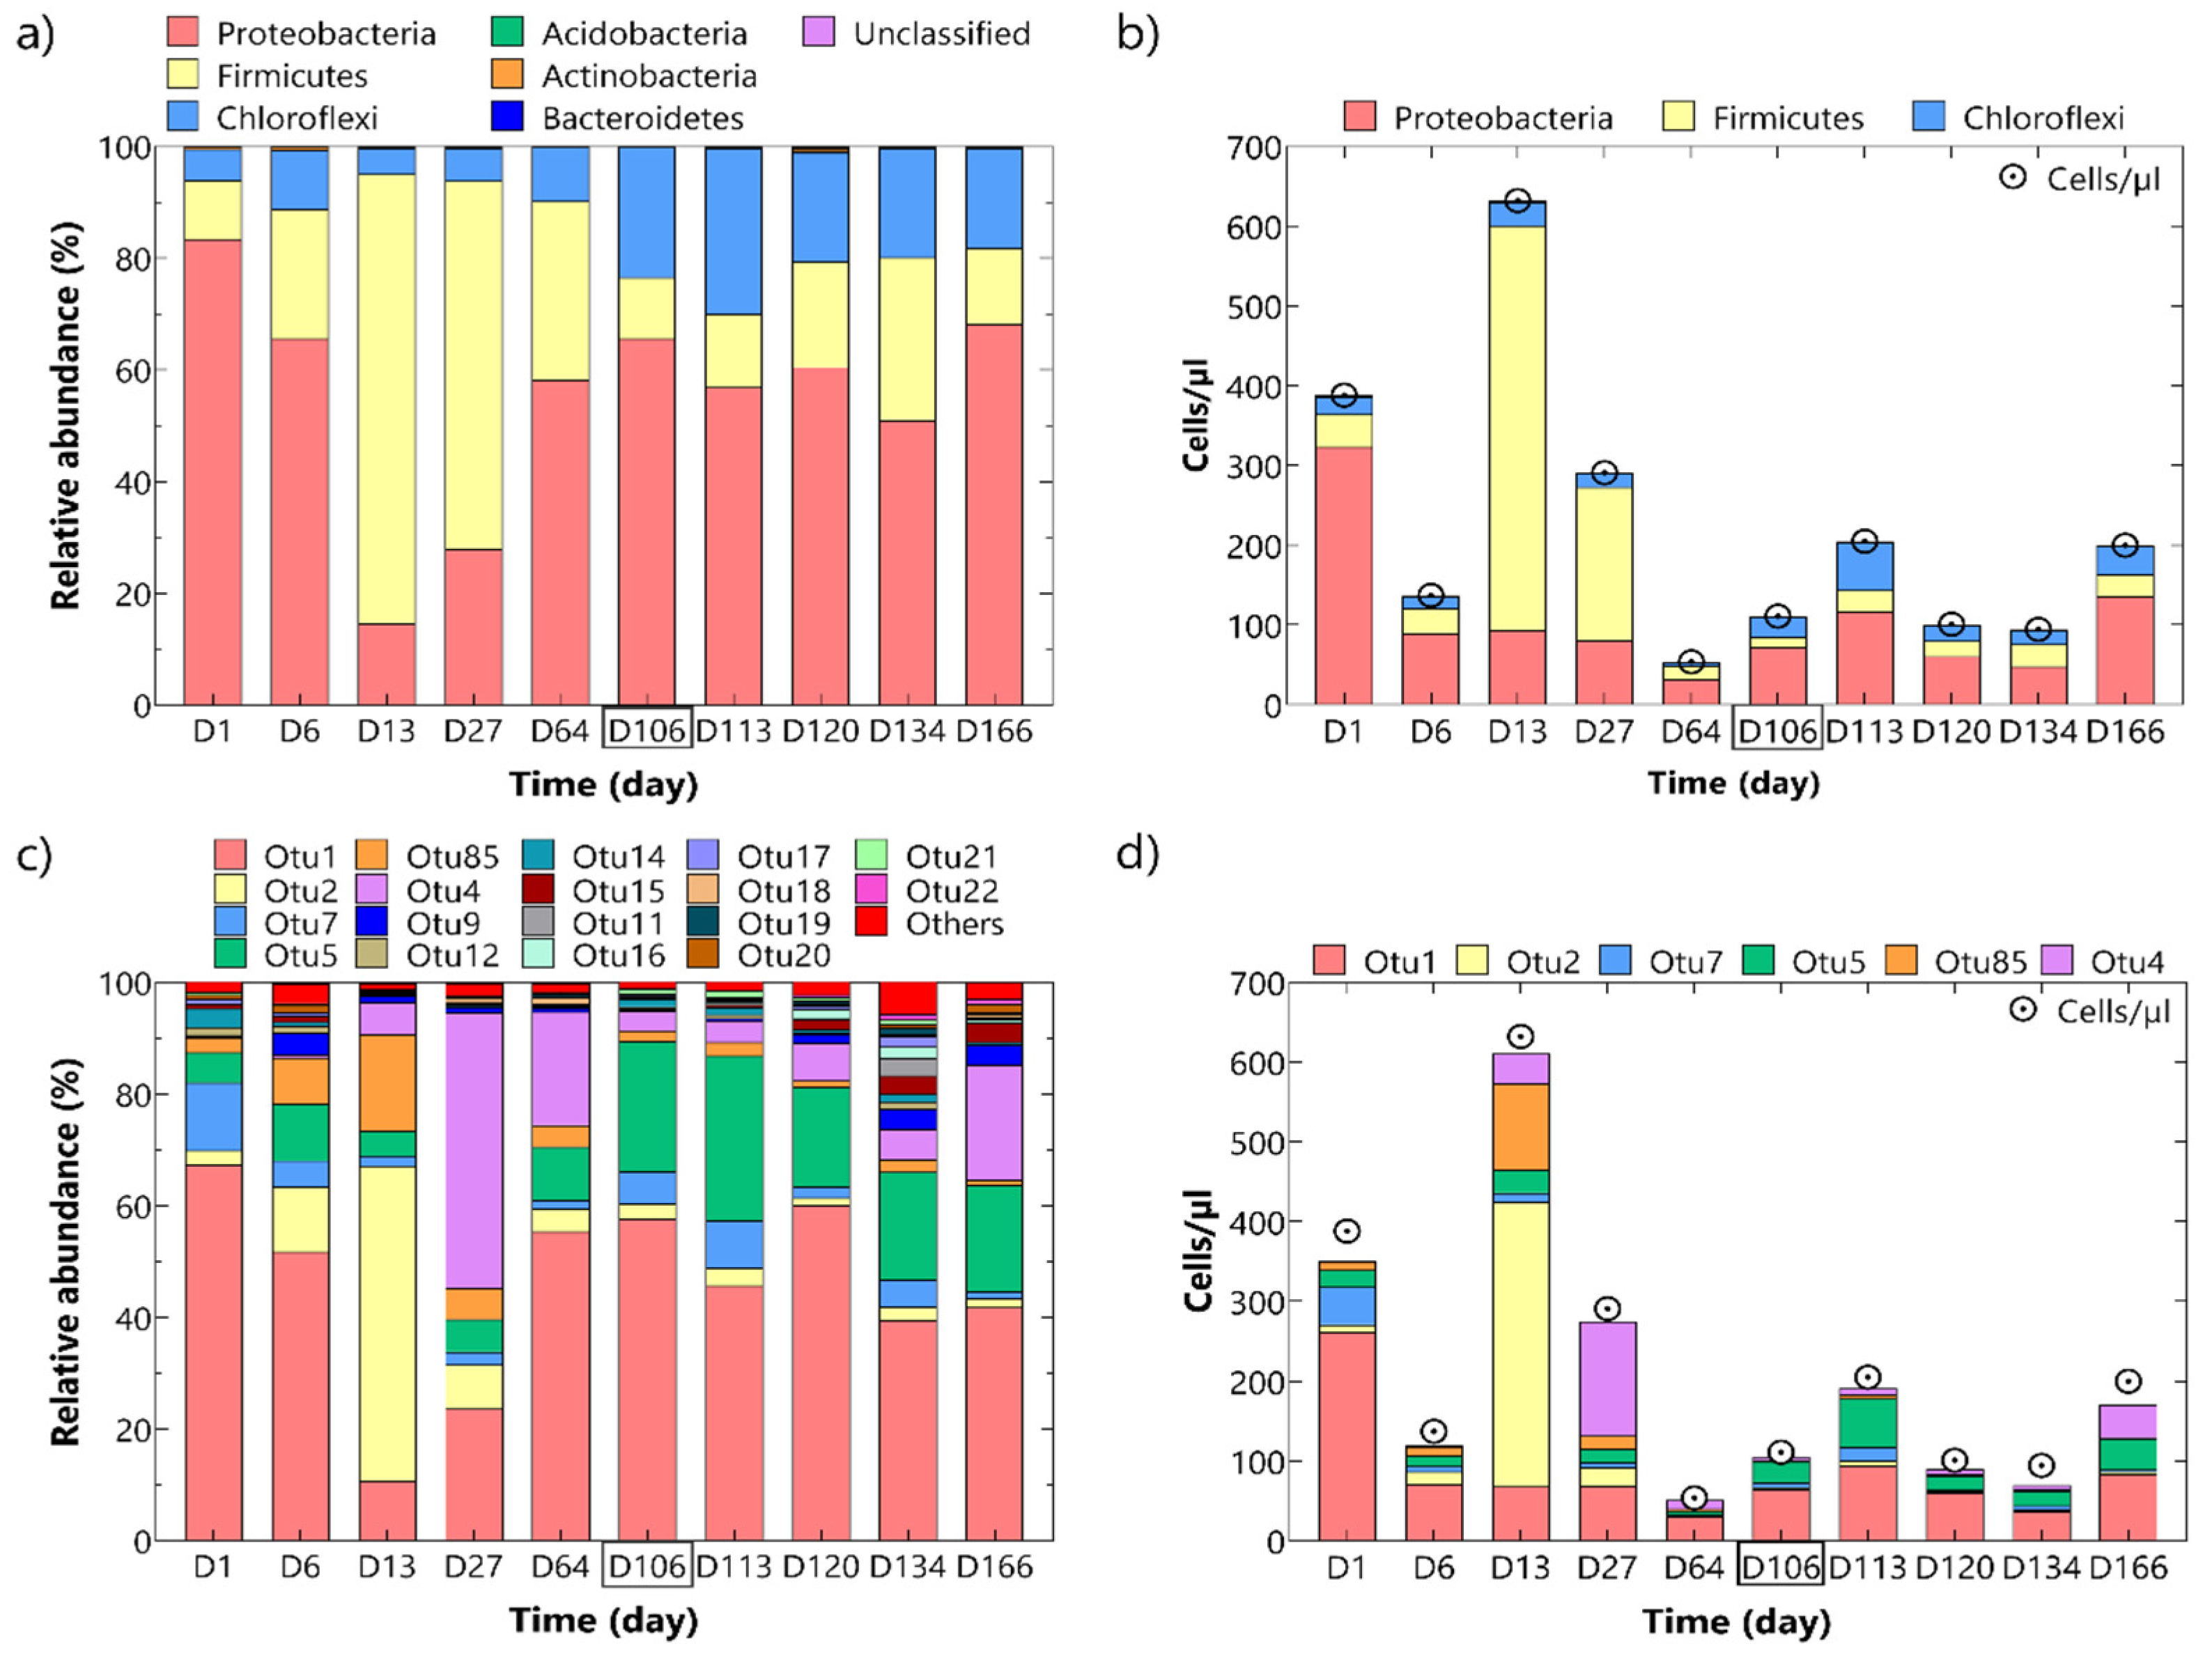
3.3.2. Microbiological Analyses Results

Microbial presence and activity during the in situ test was monitored by flow cytometry (FC) and intracellular ATP measurements, respectively. Overall, the evolution was quite similar for both measurements (Figure 9). The first injection of selenate resulted in an increase in microbial activity and in the total number of cells followed by a decrease in both cell number (FC data) and microbial activity (ATP measurements) after 13 days (i.e., when Se was depleted). An increase in cell number and microbial activity was again observed after the injection with 60 µM selenate, although to a lesser extent. In addition, after a small decrease at day 120, microbial activity increased again until the end of the in situ test (Figure 7 and Figure 9). The limited availability of an easily accessible carbon source can explain the observed higher increase in microbial activity compared to the total cell count.
Taxonomical characterization indicated the presence of three dominant phyla in the interval solutions: Proteobacteria, Firmicutes, and Chloroflexi (Figure 10). Relative abundance of the different phyla suggests that Proteobacteria decreased for 13 days after injection, after which a re-increase was observed. Firmicutes behaved in the opposite way. However, absolute abundances based on flow cytometry calculated according to Props et al. [55] indicate that after a decrease in the first 6 days after the first injection, Proteobacteria remained rather constant throughout the in situ test (Figure 10). On the other hand, on day 13 after injection with 5 µM selenate (i.e., when selenate was depleted), a clear growth of Firmicutes was observed, and their abundance decreased again gradually afterwards. No increase of this phylum was observed after injection with 60 µM selenate (Figure 10).
The abundance of the Proteobacteria could mainly be attributed to one OTU, i.e., OTU1, which represents a member of the genus Pseudomonas (Figure 10, Table S1 in Supplementary Materials). In addition, OTU2 and OTU85, both representing members of the sulfate reducing genus Desulfosporosinus (phylum Firmicutes), showed an actual growth between day 6 and day 13 after the injection (Figure 10, Table S1 in Supplementary Materials). Growth was also observed for OTU4, probably a member of the Peptococcaceae family (phylum Firmicutes). The abundance of OTU4 further increased up to 27 days after the injection (Figure 10, Table S1 in Supplementary Materials). Afterwards, samples were again mainly dominated by OTU1 (Figure 10, Table S1 in Supplementary Materials). Much less variation was observed after the injection with 60 µM selenate (Figure 10). The abundance of OTU4 slightly decreased from day 113 (i.e., day 7 after the second injection) up to day 134 and doubled again afterwards. The absolute abundance of OTU5, a member of the Anaerolineaceae family (phylum Chloroflexi, Table S1 in Supplementary Materials), was doubled in the sample taken on day 113, compared to the sample taken at the start of the second injection, i.e., day 106 (Figure 10). Finally, the abundance of OTU4, increased at the end of the injection test with 60 µM selenate (Figure 10).

3.3.3. Modeling Results

Figure 11 compares the measured concentrations of Se(VI) and total selenium in the second in situ injection test with the modeled concentrations considering diffusion as either Br anion or deuterated water (HDO) based on previous diffusion tests undertaken in Interval 1 and Interval 2 of the BN experiment [34].
The results show that the measured concentrations of Se(VI) decreased at a faster rate than the model representing Br anion diffusion (Figure 11). Compared to the model for deuterated water diffusion, the higher measured Se(VI) concentration in the first few samples could be explained by pore exclusion affecting the Se(VI) anions. However, the sample collected after 60 days had a similar (but slightly lower) concentration than that modeled based on diffusion of deuterated water.
Figure 12 presents the results of the reactive transport model (in PHREEQC), where the reduction of Se(VI) to Se(IV) is represented as a first order kinetic reaction and where the diffusion of the Se(VI) and Se(IV) species is represented by the diffusion of Br. By varying the rate constant for the Se(VI) reduction reaction a satisfactory fit of the modeled Se(VI) concentration to the experimental data was obtained for a rate constant of 0.01 day−1 (or 1.157 × 10⁻⁷ s−1), equivalent to a reaction half-life of around 60 days. This first order rate constant was the same as that used to model Se(VI) reduction kinetics in the biotic batch experiment (Section 3.2.2).
Se(IV) was not detected in the samples taken from the interval solution, although it was detected in the biotic batch experiments. To investigate Se(IV) behavior in the in situ experiment, the reactive transport model included Se(IV) sorption using the 2-site Langmuir isotherm model, in the first instance with parameter values obtained by Frasca et al. [18]. Figure 12 illustrates how sorption lowered the aqueous Se(IV) concentration to low concentrations, close to the Se(IV) detection limit (0.013 µM) (red curve). The modeled amount of sorbed Se(IV) (green curve) expressed as an equivalent concentration in the borehole fluid attained 19.5 µM after 60 days, whereas the modeled aqueous Se(IV) increased to a concentration of just 0.37 µM at 60 days. While this modeled aqueous Se(IV) concentration (red curve) was still higher than the level of detection, it should be noted that the 2-site Langmuir isotherm model with parameter values from Frasca et al. [18] underestimated the Rd of Se(IV) in the batch tests (Section 3.1.2 and Section 3.2.2). A model of the in situ experiment parameterized with the modified 2-site Langmuir isotherm (Table 3) that represents the sorption of Se(IV) apparent in the abiotic batch experiments was found to lower the aqueous concentration to 0.23 µM at 60 days. Further uncertainty concerns the number of sorption sites present on the surface of the borehole at the interface with the borehole fluid. In the model presented in Figure 12, it was assumed that half of the sites present in the first 5 mm of clay rapidly attained equilibrium with the fluid and were not limited by diffusion. Variant models showed, however, the sensitivity of the results for a number of sorption sites. In a model where no sites were able to equilibrate directly with the borehole fluid, diffusion limits equilibration of the sorption and a high aqueous Se(IV) concentration of 10 µM was calculated to occur after 30 days, which slowly declined as the Se(IV) diffused into the clay. In a third model variant where 99% of the sites in the first cell representing the clay were considered to equilibrate, the aqueous Se(IV) concentration after 60 days was lowered to 0.12 µM.
Overall, the extent of Se(IV) sorption in the in situ BN experiment was much higher than in the batch experiments. Several hypotheses can be envisaged to explain this difference, especially more reducing conditions (lower Eh value and also a larger redox buffer capacity) prevailing in the in situ BN experiment than in the laboratory tests, but perhaps also a higher accessibility of the sorption sites in the decompacted skin of the borehole disturbed zone compared to on the piece of clay used in the batch tests, and/or a lower fluid/rock ratio in the borehole.

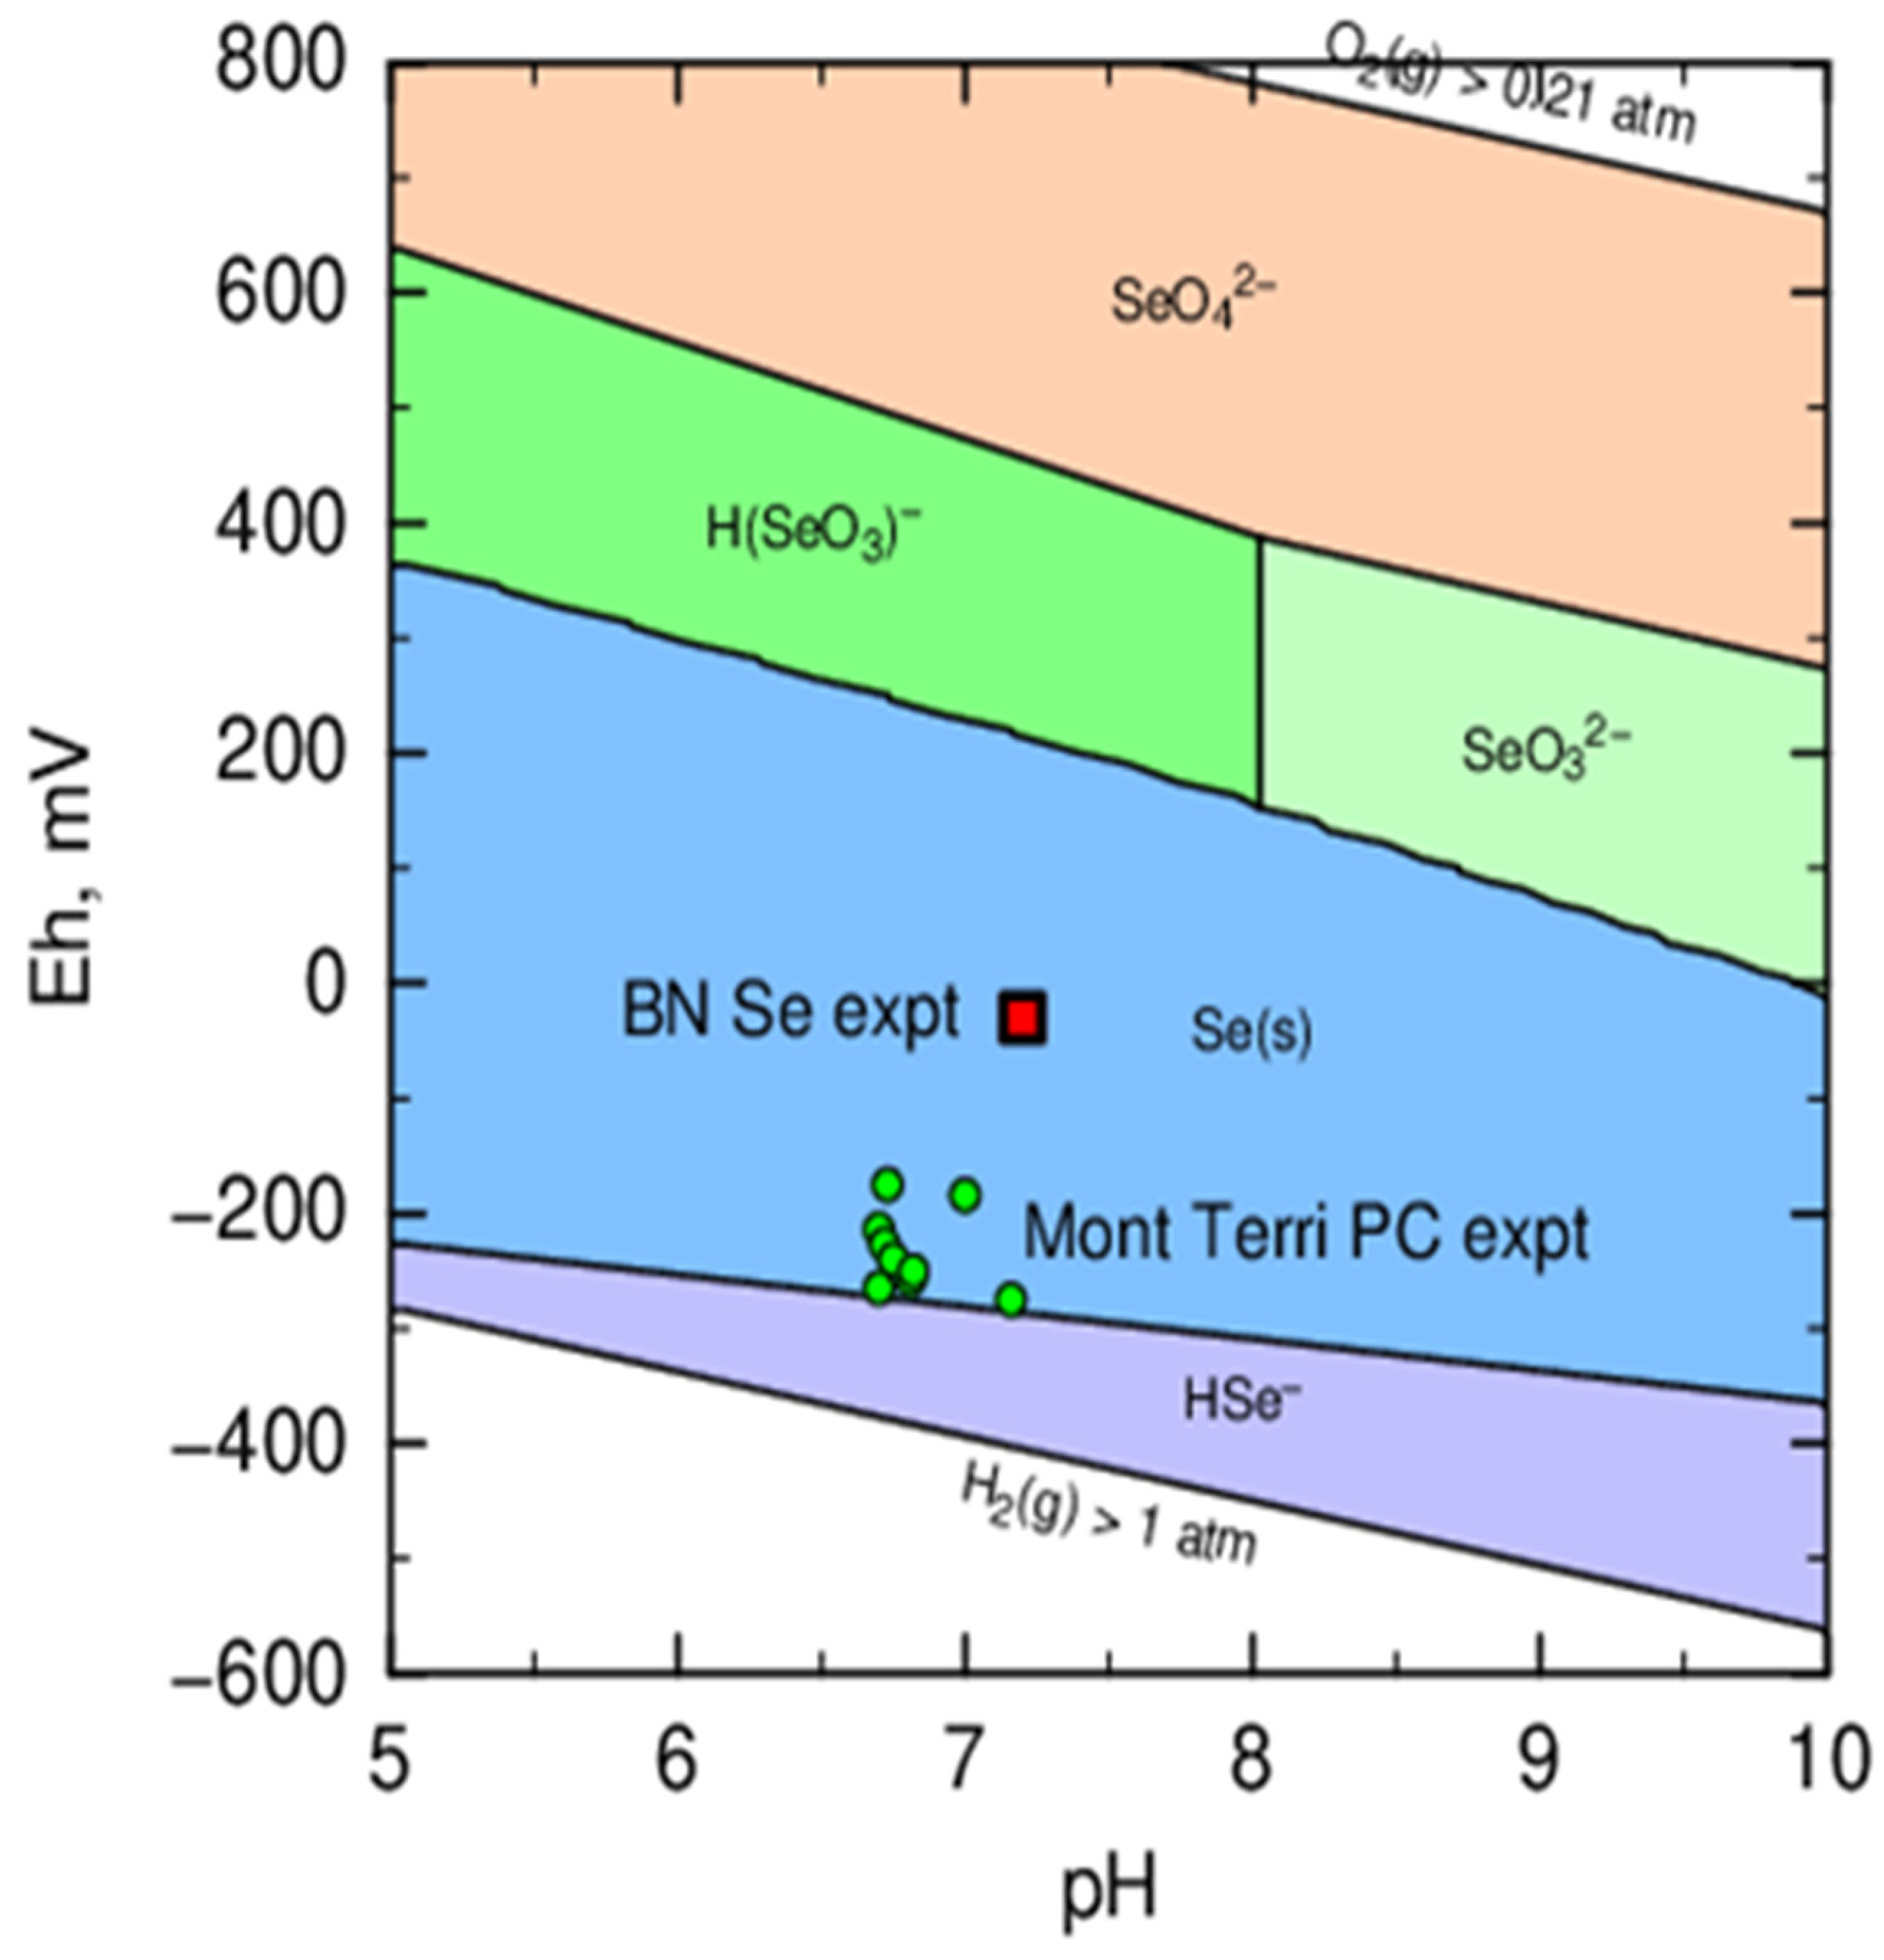
3.4. Selenium Speciation Modeling

Additional speciation modeling results are presented here to aid the interpretation of the lab and in situ experiments. Figure 13 presents a Pourbaix diagram to illustrate the variation in the speciation of selenium under the conditions of the in situ Se injection experiment and more reducing Eh conditions measured in the Mont Terri pore water chemistry (PC) experiment [56]. The diagram shows the stability of Se(VI) (SeO42−) under oxidizing conditions (Eh > +480 mV at pH 7) and the stability of Se(IV) (HSeO3, SeO32−) under less oxidizing conditions (Eh +480 mV to +230 mV at pH 7). Elemental Se(0) is stable under more reducing conditions, including the conditions of the BN in situ test and the PC experiment. For the upper (Eh) boundary of the Se(0)s field (at pH 7 and at Eh higher than around +100 mV), Se(0)s is in equilibrium with Se(IV) aqueous species (HSeO3) and the steady-state Se(IV) concentration is expected to increase with increasing Eh (Figure S4, Supplementary Materials).

4. Discussion

4.1. Abiotic Se Reactivity

Under abiotic conditions, the Se(VI) concentrations in solution remained stable, indicating that selenate did not react significantly with, or sorb significantly onto, Opalinus Clay minerals or stainless steel filters in the abiotic batch tests. Although previous studies showed that Se(VI) can sorb weakly onto aluminum and iron oxides [13,25,27], and clay minerals such as kaolinite, illite, and smectites (montmorillonite) [8,25], selenate adsorption strongly decreases with increasing solution pH. Indeed, the non-specific electrostatic adsorption of Se(VI) onto Al oxides and Fe oxides decreases significantly at pH above 7 and 5 respectively, i.e., above their point of zero charge (pzc) when the number of positively charged protonated sites present at their surface strongly decreases [13,25]. Moreover, sorption on kaolinite and illite does not significantly occur, or is very low, at neutral pH, and the same can be seen for sorption of Se(VI) on soils [8,25]. The batch tests were performed at near neutral pH (i.e., pH of interval solutions between 7 and 8), which explains why a weak sorption of Se(VI) was not observed.
In contrast to Se(VI), a clear decrease in selenite concentration was observed in the presence of Opalinus Clay at a rate of 0.05 to 0.1 µM day−1 in the abiotic batch tests. When clay and a stainless steel filter were present, Se precipitates were found on the filter surface. On the other hand, no loss of Se(IV) or precipitation of Se on the filter surface was observed when only stainless steel was present. These results indicate that clay is required for the sorption of selenite. Selenite is known to sorb, or to precipitate, on clays both through a direct adsorption on clay mineral edges (formation of inner-sphere complexes with aluminol and silanol groups located on the edges [22,23]) and through a mechanism of adsorption followed by reduction by, e.g., Fe(II) minerals and precipitation of poorly soluble reduced selenium species [16,17,20,21,22]. The latter process would explain the likely reduced Se species found on the filter surface by SEM–EDX in the abiotic tests with selenite, clay, and filter.
Compared to the study of Frasca et al. [18], in which sorption of Se(IV) on Opalinus Clay powder was investigated [18], the sorption of Se(IV) observed in our batch tests (in both abiotic and biotic conditions) was rather slow, though the overall extent of sorption was higher (i.e., lower steady state concentration). The slower overall sorption process can be attributed to the low initial reactive surface area and the slow disintegration of the clay piece in the solution. Differences in the extent of the sorption may be due to differences in the water to clay ratio, but also in the content of Fe(II) minerals in the Opalinus Clay samples used in the present study and by Frasca et al. [18]. Indeed, based on mineralogical and geochemical data from Pearson et al. [36], the content of Fe(II) minerals such as pyrite and siderite can vary considerably within the Opalinus Clay from the Mont Terri Rock Laboratory. As these minerals are generally considered as the main contributors to Se(IV) sorption, variations in their content would indeed lead to variations in sorption. Furthermore, speciation modeling undertaken in the present study indicates that where Se(IV) concentration is controlled by the formation of Se(0), the steady-state Se(IV) aqueous concentration is strongly sensitive to Eh (Figure S4, Supplementary Materials). In the previous study by Frasca et al. [18], Eh varied between 246 and 305 mV in the batch experiments to study sorption of Se(IV) onto Opalinus Clay. The enhanced sorption apparent in the present study could thus also reflect generally more reducing conditions in the abiotic batch tests, compared to those of Frasca et al. [18], thereby decreasing the concentration of Se(IV) in equilibrium with Se(0).

4.2. Microbially Mediated Se Reactivity

In the presence of an active microbial community originating from the BN borehole, both selenate and selenite were removed from the batch test solutions when Opalinus Clay (and stainless steel filter) were added as well. Note that concentrations used in our experiments were shown not to be toxic for the microbial community of the BN borehole water in previous tests (data not shown), so respiratory reduction of Se oxyanions can be assumed.
The observed decrease in selenate concentration can be completely explained by microbial selenate reduction, as no abiotic reactions or sorption were observed in the abiotic experiments. The present study thus shows that Se(VI) remains non-reactive in an abiotic, reducing environment in the presence of clay and requires microbial catalysis to transform into thermodynamically stable Se species of lower oxidation state, in the first instance to selenite. Part of the produced selenite will be sorbed onto the solid phases (clay and/or stainless steel filter), and the remainder accumulates in the solution until reaching its solubility limit and/or is reduced further, either abiotically or by microorganisms.
In the batch tests with selenite, Se(IV) concentration decreased 2 to 5 times more rapidly under biotic conditions compared to abiotic conditions, though the evolution of the total Se concentration was comparable. The latter can be explained by a slow disintegration of the clay piece and/or formation of colloidal Se(0). Subsampling of this suspension without filtration (or centrifugation) resulted in samples containing some of the dispersed solid phases. This caused some overestimation of the total Se content present in solution. Based on the evolution of the selenite concentration, however, microbial activity enhances the overall decrease in selenite concentration due to a combination of abiotic sorption phenomena and microbial selenite reduction. The final reduced Se species would likely either be Se(0), as has been observed previously in biotic batch tests [57,58,59], or Se(0) and/or Se(-II) from abiotic processes [16,17]. Indeed, speciation modeling indicates that Se(0) could precipitate at Eh below +230 mV at pH 7.
For both Se(IV) and Se(VI) under biotic test conditions, the presence of stainless steel combined with Opalinus Clay seems to enhance the loss of dissolved selenium species from the solution. This may be explained by the additional surface available to sorb Se reduction end products by the presence of other microbial species in the stainless steel filter samples compared to the clay samples, or by an effect on the Eh. Given the strong dependence of Se(0) solubility and thus the steady-state Se(IV) aqueous concentration on Eh (Figure S4, Supplementary Materials), it is indeed possible that significant variations in the Se(IV) concentration could result from variations in Eh between the batch experiments. These Eh variations could be caused by the presence or absence of stainless steel or clay.
Without Opalinus Clay, only small changes in the Se concentration occur under biotic test conditions, compared to the observed decrease in Se(VI) or Se(IV) concentrations in the presence of clay. This suggests that the Opalinus Clay provides additional electron donors for Se reduction. Based on the present knowledge regarding Se reducing microorganisms, organics (e.g., acetate, lactate) are the most frequently reported electron donors [28]. According to previous studies made on clay aqueous extracts [60,61], the low molecular weight organic fraction found in Opalinus Clay pore water contains variable concentrations of acetate, formate, and other organic compounds, which could have leached from the Opalinus Clay into the batch test solution and may indeed have served as electron donors. However, we cannot rule out that inorganic compounds such as H2 (e.g., formed during anaerobic steel corrosion or as a fermentation product) were used as (additional) electron donors.

4.3. In Situ Fate of Se(VI)

Injection of selenate in the BN borehole will result in diffusion of selenate through the clay pore space, but this diffusion will be affected by pore exclusion phenomena related to the ionic radii and charge. Speciation calculations of the injected Se in the borehole water (not presented) indicate that around 75% of the Se(VI) would be present as the divalent species SeO42−, with the remainder present as uncharged ion pair species CaSeO4 and MgSeO4. The diffusion of these three Se(VI) species will be dependent on their ionic radii and charge. Divalent SeO42−, being subject to a greater anion exclusion from the electrical double layer of clay minerals than the monovalent Br anion used as tracer, is expected to diffuse more slowly, analogous to the relative diffusion of sulfate and chloride measured in Opalinus Clay from the Benken borehole [62]. However, the aqueous Se(VI) present as uncharged ion pairs should not be subject to anion exclusion, although their diffusion relative to that of water may be slowed as a result of their large radii (i.e., steric hindrance in the smallest constricted pores). Diffusion studies of a wide range of anions and cations in the Mont Terri diffusion and retention (DR) experiment [32] conclude that diffusion of Se(VI) was slower than that of Br or I, approximately proportional to the ratio of their diffusion coefficients in water [63]. Overall, the diffusion of Se(VI) is expected to be similar to or slower than that of the Br tracer tests undertaken. In both injection tests of BN, however, the Se(VI) concentration decreased faster than that of the Br tracer and was even similar to the diffusion of (deuterated) water. Based on the abiotic batch tests, no sorption of Se(VI) was expected either on the stainless steel components of the experiment or on the clay itself. On the other hand, the biotic batch tests showed the potential of the microbial community in Interval 3 to reduce selenium oxyanions. Microbial selenate reduction could thus explain the observed faster decrease in selenate concentration.
The PHREEQC model shows that the evolution of the selenate and total Se concentration can indeed be fitted well when considering both diffusion of Se(VI) (using the pore diffusion coefficient (Dp) obtained for Br) in combination with a reduction of Se(VI), using a reaction rate constant, which was the same for the in situ test and the biotic batch tests. This indicates that the biotic batch tests provided a good laboratory model of the ongoing in situ processes.
In contrast to the batch tests, total Se concentrations were consistent with the selenate concentrations, and selenite was never detected in the sampled interval solutions. This can be attributed to the sorption of produced Se(IV) onto the clay surrounding the borehole, similar to what was observed in the abiotic batch tests. The extent of Se(IV) sorption in the in situ BN experiment is much higher than in the batch experiments, probably as a consequence of more reducing conditions prevailing in the borehole. This would be in line with the observed preservation of selenite in the O2 perturbed outer zone of a Callovo–Oxfordian Clay core during a diffusion experiment, while reduction of selenite was observed deeper in the clay core [19]. Additionally, a higher accessibility of the sorption sites in the decompacted skin of the BdZ (borehole disturbed zone) compared to on the piece of clay used in the batch tests and/or the lower in situ fluid/rock ratio may also contribute to the higher sorption observed in situ. Furthermore, based on the biotic batch tests, an additional microbial reduction of Se(IV) is expected. Speciation modeling indicates that Se(0) would be in equilibrium with aqueous Se(IV), and the steady-state Se(IV) concentration increases with increasing Eh. At the pH and Eh conditions of the in situ tests, Se(0) would be stable and the steady-state Se(IV) concentration would be several orders of magnitude below its detection limit of 0.013 µM. Thus, Se(IV) sorption, Se(0) precipitation, and microbial selenite reduction have likely all contributed to the disappearance of selenite from the borehole water.
The results of the BN injection tests with selenate show some differences to previously obtained results from the DR in situ experiment at the Mont Terri Rock Laboratory [32]. In the DR experiment, selenate was injected in a borehole at an initial concentration of 96 µM, which is comparable to the second injection of 60 µM Se(VI) in the BN experiment. On the other hand, the DR experiment had a much greater ratio of circulating water to borehole surface area than the BN experiment, and thus diffusion of the anionic tracers was rather limited. Over the course of 288 days, the slow decrease in the selenate concentration in the DR experiment was largely similar to non-reactive anions, although it appears that the Se concentration decreased slightly more in comparison to the Br or I tracers at the end of the experiment. Differences in behavior of selenate in the DR and BN in situ tests could be attributed (in part) to a difference in the microbial community present in the DR borehole compared to the BN borehole. In particular, the BN interval used for the Se studies has been stimulated previously by injection of nitrate.
Microbiological analyses indicate that the microbial community in the BN borehole was affected by injection of Se. The cell count and microbial activity both increased while Se was present and decreased again when Se was depleted. Overall, the microbial community is dominated by only a few OTUs, similar to what has been observed previously in boreholes in the Opalinus Clay [34,64].
Based on the taxonomical characterization of the most important OTUs and the literature available, a hypothesis regarding their contribution to the overall chemical evolution can be made. Certain dominant OTUs present during Se injection are members of the Anaerolineaceae family, which are often isolated from oil and hydrocarbon (e.g., toluene) contaminated environments [65,66,67]. However, their ecology and physiology remain largely unknown, as only a limited number of isolates have been characterized. Known members have a fermentative metabolism, utilizing carbohydrates and proteinaceous carbon sources under anaerobic conditions [68,69]. The second injection with 60 µM selenate seems to have resulted in a higher abundance of Anaerolineaceae compared to their presence after injection of only 5 µM selenate. Putatively, this may be linked with the higher TOC concentration at the beginning of the second injection with 60 µM selenate. Furthermore, the presence of Pseudomonas as one of the dominant OTUs in the BN borehole is not surprising, since it was one of the dominant species present during and after previous injection tests with nitrate in the BN experiment [34]. The abundance of Pseudomonas decreased in the first week after the first injection of 5 µM Se(VI), though it remained stable afterwards, at rather high amounts. Members of this genus have been found in microbial aggregates, able to reduce selenium oxyanions in anaerobic granular sludge [70]. In addition, Pseudomonas has been suggested to ferment organic macromolecules and to release small organic acids and H2 [64]. Finally, three OTUs belonging to the Peptococcaceae family (OTU2, OTU4, and OTU85) were found abundantly during the Se injection tests as well. Members of the Peptococcaceae family have been reported with the ability to reduce Se [71,72], and as such they could also have performed Se reduction in the BN borehole. Overall, the presence of fermenting species during the in situ test with Se in the BN borehole suggests that such species could have fermented organic macromolecules in the borehole water or clay into more easily bioavailable carbon species such as acetate, as was found 13 days after the first injection with 5 µM Se(VI). Such carbon species could then be used as electron donors by other microorganisms, such as the sulfate and selenate reducing members of the Peptococcaceae family (as the phylum Firmicutes).

5. Conclusions

Geological disposal of HLW and ILW in deep clay formations will ultimately lead to the dissolution and slow leaching of soluble radionuclides such as 79Se, a redox sensitive radionuclide, which is expected to leach at least partially as Se oxyanions. Although part of the leached selenium could sorb on corrosion products of the steel canisters [7], the remainder will reach the surrounding clay host rock. The reducing environment in this clay host rock and the possible microbial presence might however change its speciation and thus also its transport behavior. A good understanding of the retention and reactivity of Se species under such environmental conditions and in the presence of microorganisms is therefore required and was the focus of this study.
Both lab and in situ tests were conducted, studying abiotic and biotic Se reactivity in clay water with or without Opalinus Clay and stainless steel. The pH and Eh conditions were as close as possible to unperturbed Opalinus Clay conditions (i.e., pH 7–8 and anoxic environment). Abiotically, Se(VI) remained stable in clay water with/without clay or stainless steel, i.e., no decrease in concentration of Se(VI) or total Se was observed. On the other hand, aqueous Se(IV) concentrations decreased in the batch tests with Opalinus Clay, though not with stainless steel alone. In the tests with selenite, precipitation of more reduced Se species on the solid phase was observed by SEM–EDX, though only when Opalinus Clay was present. The differences in the rate and extent of the sorption of Se(IV) observed in the present study compared to previous sorption experiments seem to be linked to the reactive surface area of the clay, to the mineralogical content, and to differences in Eh.
When a microbial community is present, with the ability to reduce Se species, both selenate and selenite were reduced, and a more extensive Se reduction and/or retention was observed in case clay and/or stainless steel filters were present (in situ or in batch tests). In the batch tests, microbial reduction of Se(VI) to Se(IV) was observed, resulting in some (intermediate) accumulation of Se(IV) in the solution. This was not observed in situ, where the decrease in Se(VI) was not accompanied by an increase in Se(IV) in the interval solution. Based on the observed selenite sorption onto the solid phases in the batch tests, the lack of Se(IV) in the in situ solution is most likely linked to more sorption of Se(IV) on the in situ clay surface and/or further reduction of Se(IV) to precipitating Se species such as elemental Se(0). Overall however, the biotic batch tests provided a good laboratory model of the ongoing in situ processes.
The present study thus suggests that in the absence of an active Se reducing microbial community, selenate leaching from radioactive waste into the surrounding clay would not be retained by sorption. In that case, non-reactive transport of Se(VI) through the clay is expected to be the main migration process. Although it remains uncertain whether microorganisms can be active in and around a repository (i.e., high pH, high ionic strength, and limited free space and water), microbial activity cannot be ruled out, especially in the excavation disturbed zone of the host rock surrounding the disposal facility. With a microbial community with Se reducing ability (locally) present, both diffusion and microbial Se(VI) reduction can be expected. Moreover, microbial reduction of Se oxyanions can occur in situ without addition of easily biodegradable nutrients and electron donors, i.e., the clay itself provides the electron donor for Se reduction. If microorganisms would be active in the clay surrounding a disposal facility, microbial reduction of Se oxyanions could thus contribute to the overall retention of Se, thereby slowing down the migration of Se out of the near field of the repository.
Future research is necessary to study the impact of high concentrations of nitrate leaching from bituminized waste on the fate of Se(VI) in a clayey host rock, both in the presence and absence of microorganisms. In addition, the speciation of Se sorbed onto the clay needs to be investigated, to further clarify the ongoing (microbial) reactions. The nature of electron donors present in Opalinus Clay and responsible for microbial Se reduction remains also to be studied along with the impact of organic electron donors from the waste and H2 produced by anaerobic corrosion of metals and radiolysis.

Supplementary Materials

The following are available online at https://www.mdpi.com/article/10.3390/min11070757/s1, Figure S1: Rarefaction curves for the Illumina® 16S rDNA gene amplicon sequencing data showing for each sample the number of OTUs as a function of the number of reads. Figure S2: PHREEQC radial diffusion model fitted to bromide and deuterium diffusion tests in Interval 1 and Interval 2 of the BN experiment assuming a porosity of 0.17 for both tracer species (data from [34]). Figure S3: Overview of the SEM–EDX images and data of stainless steel and clay samples from the abiotic batch tests. The test codes are indicated on the top of each page and correspond to Table 2. Figure S4: Modeled solubility of Se(0)s in equilibrium with Se(IV) as a function of Eh, at pH 7. Table S1: Taxonomical classification of all OTUs with a relative abundance >1% in the water after the injections with selenate in Interval 3. Identity is 100% unless stated otherwise (between parentheses). OTU dataset: The datasets generated and analyzed during the current study are available in the NCBI Sequence Read Archive (SRA) repository (PRJNA717984).

Author Contributions

Conceptualization, N.B., K.H., A.A., P.D.C., C.W. and E.V.; Data curation, N.B., J.S.S., K.M. and K.H.; Formal analysis, N.B., K.M. and K.H.; Investigation, N.B., K.M. and K.H.; Methodology, N.B., K.M. and K.H.; Project administration, N.B.; Software, J.S.S.; Supervision, N.B., A.A., P.D.C., M.S., C.W. and E.V.; Validation, N.B., J.S.S., K.M. and K.H.; Visualization, N.B., J.S.S., K.M. and K.H.; Writing—original draft, N.B., J.S.S., K.M. and K.H.; Writing—review and editing, N.B., J.S.S., K.M., K.H., A.A., P.D.C., M.S., C.W. and E.V. All authors have read and agreed to the published version of the manuscript.

Funding

This research was performed within the framework of the BN experiment, which is funded by Andra, FANC, IRSN, and SCK CEN. No external funding was received from outside the Mont Terri Consortium.

Data Availability Statement

The chemical data used in this study are available from the authors upon request. Data from DNA-based analyses can be found online in the NCBI Sequence Read Archive (SRA) repository (PRJNA717984).

Acknowledgments

This work was undertaken in close cooperation with Swisstopo, the operator of the Rock Laboratory and the management team at the Mont Terri project. Financial support was provided by the Mont Terri Consortium. The technical assistance of Steven Smets, Veerle Van Gompel, and Wim Verwimp (SCK CEN) is greatly appreciated, as is the help in the conceptualization and interpretation of the work by Hugo Moors, Mohamed Mysara, Carla Smolders, and Natalie Leys (SCK CEN). Finally, we thank the team from the radiochemical analysis (RCA) unit at SCK CEN, and Kristof Tirez and Filip Beutels (VITO) for performing the chemical analyses.

Conflicts of Interest

The authors, members of the Mont Terri partner organizations funding the Consortium, or of a contracted organization, declare no conflict of interest.

References

  1. Jörg, G.; Bühnemann, R.; Hollas, S.; Kivel, N.; Kossert, K.; Van Winckel, S.; Gostomski, C.L. Preparation of radiochemically pure (79)Se and highly precise determination of its half-life. Appl. Radiat. Isot. 2010, 68, 2339–2351. [Google Scholar] [CrossRef] [PubMed]
  2. Marivoet, J.; Weetjens, E. Impact of advanced fuel cycles on geological disposal. Mater. Res. Soc. Symp. Proc. 2009, 1193, 117. [Google Scholar] [CrossRef]
  3. De Cannière, P.; Maes, A.; Williams, S.; Bruggeman, C.; Beauwens, T.; Maes, N.; Cowper, M. Behaviour of Selenium in Boom Clay; External Report SCK CEN-ER-120; SCK CEN: Mol, Belgium, 2010; p. 328. [Google Scholar]
  4. Weetjens, E. Safety Assessment Calculations for Geological Disposal of Eurobitum Bituminised Waste in Boom Clay; Restricted Contract Report SCK CEN-R-5887; SCK CEN: Mol, Belgium, 2015; p. 83. [Google Scholar]
  5. Andra. Safety Options Report—Post-Closure Part; Report nr CG-TE-D-NTE-AMOA-SR2-0000-15-0062; Andra: Paris, France, 2016; p. 466. [Google Scholar]
  6. Bingham, P.A.; Connelly, A.J.; Cassingham, N.J.; Hyatt, N.C. Oxidation state and local environment of selenium in alkali borosilicate glasses for radioactive waste immobilisation. J. Non-Cryst. Solids 2011, 357, 2726–2734. [Google Scholar] [CrossRef]
  7. Goberna-Ferrón, S.; Asta, M.P.; Zareeipolgardani, B.; Bureau, S.; Findling, N.; Simonelli, L.; Greneche, J.-M.; Charlet, L.; Fernández-Martínez, A. Influence of Silica Coatings on Magnetite-Catalyzed Selenium Reduction. Environ. Sci. Technol. 2021, 55, 3021–3031. [Google Scholar] [CrossRef] [PubMed]
  8. Bar-Yosef, B.; Meek, D. Selenium sorption by kaolinite and montmorillonite. Soil Sci. 1987, 144, 11–19. [Google Scholar] [CrossRef]
  9. Masscheleyn, P.H.; Delaune, R.D.; Patrick, W.H., Jr. Transformations of selenium as affected by sediment oxidation-reduction potential and pH. Environ. Sci. Technol. 1990, 24, 91–96. [Google Scholar] [CrossRef]
  10. Elrashidi, M.A.; Adriano, D.C.; Workman, S.M.; Lindsay, W.L. Chemical equilibria of selenium in soils: A theoretical development. Soil Sci. 1987, 144, 141–152. [Google Scholar] [CrossRef]
  11. Krivovichev, V.; Charykova, M.; Vishnevsky, A. The Thermodynamics of Selenium Minerals in Near-Surface Environments. Minerals 2017, 7, 188. [Google Scholar] [CrossRef] [Green Version]
  12. Charykova, M.V.; Krivovichev, V.G. Mineral systems and the thermodynamics of selenites and selenates in the oxidation zone of sulfide ores—A review. Mineral. Petrol. 2017, 111, 121–134. [Google Scholar] [CrossRef]
  13. Su, C.; Suarez, D.L. Selenate and selenite sorption on iron oxides an infrared and electrophoretic study. Soil Sci. Soc. Am. J. 2000, 64, 101–111. [Google Scholar] [CrossRef]
  14. Missana, T.; Alonso, U.; García-Gutiérrez, M. Experimental study and modelling of selenite sorption onto illite and smectite clays. J. Colloid Interface Sci. 2009, 334, 132–138. [Google Scholar] [CrossRef]
  15. Rovira, M.; Giménez, J.; Martínez, M.; Martínez-Lladó, X.; de Pablo, J.; Martí, V.; Duro, L. Sorption of selenium(IV) and selenium(VI) onto natural iron oxides: Goethite and hematite. J. Hazard. Mater. 2008, 150, 279–284. [Google Scholar] [CrossRef]
  16. Breynaert, E.; Scheinost, A.C.; Dom, D.; Rossberg, A.; Vancluysen, J.; Gobechiya, E.; Kirschhock, C.E.A.; Maes, A. Reduction of Se(IV) in Boom Clay: XAS solid phase speciation. Environ. Sci. Technol. 2010, 44, 6649–6655. [Google Scholar] [CrossRef]
  17. Hoving, A.L.; Münch, M.A.; Bruggeman, C.; Banerjee, D.; Behrends, T. Kinetics of selenite interactions with Boom Clay: Adsorption–reduction interplay. Geol. Soc. Lond. Spec. Publ. 2019, 482, 225–239. [Google Scholar] [CrossRef]
  18. Frasca, B.; Savoye, S.; Wittebroodt, C.; Leupin, O.; Michelot, J.-L. Comparative study of Se oxyanions retention on three argillaceous rocks: Upper Toarcian (Tournemire, France), Black Shales (Tournemire, France) and Opalinus Clay (Mont Terri, Switzerland). J. Environ. Radioact. 2014, 127, 133–140. [Google Scholar] [CrossRef]
  19. Savoye, S.; Schlegel, M.L.; Frasca, B. Mobility of selenium oxyanions in clay-rich media: A combined batch and diffusion experiments and synchrotron-based spectroscopic investigation. Appl. Geochem. 2021, 128, 104932. [Google Scholar] [CrossRef]
  20. Scheinost, A.C.; Kirsch, R.; Banerjee, D.; Fernandez-Martinez, A.; Zaenker, H.; Funke, H.; Charlet, L. X-ray absorption and photoelectron spectroscopy investigation of selenite reduction by FeII-bearing minerals. J. Contam. Hydrol. 2008, 102, 228–245. [Google Scholar] [CrossRef]
  21. Kang, M.; Chen, F.; Wu, S.; Yang, Y.; Bruggeman, C.; Charlet, L. Effect of pH on aqueous Se (IV) reduction by pyrite. Environ. Sci. Technol. 2011, 45, 2704–2710. [Google Scholar] [CrossRef] [PubMed]
  22. Bruggeman, C.; Maes, A.; Vancluysen, J.; Vandemussele, P. Selenite reduction in Boom clay: Effect of FeS2, clay minerals and dissolved organic matter. Environ. Pollut. 2005, 137, 209–221. [Google Scholar] [CrossRef] [PubMed]
  23. Peak, D.; Saha, U.K.; Huang, P.M. Selenite adsorption mechanisms on pure and coated montmorillonite: An EXAFS and XANES spectroscopic study. Soil Sci. Soc. Am. J. 2006, 70, 192–203. [Google Scholar] [CrossRef]
  24. Beauwens, T.; De Cannière, P.; Moors, H.; Wang, L.; Maes, N. Studying the migration behaviour of selenate in Boom Clay by electromigration. Eng. Geol. 2005, 77, 285–293. [Google Scholar] [CrossRef]
  25. Goldberg, S. Modeling selenate adsorption behavior on oxides, clay minerals, and soils using the triple layer model. Soil Sci. 2014, 179, 568–576. [Google Scholar] [CrossRef]
  26. Balistrieri, L.S.; Chao, T.T. Selenium adsorption by goethite. Soil Sci. Soc. Am. J. 1987, 51, 1145–1151. [Google Scholar] [CrossRef]
  27. Duc, M.; Lefèvre, G.; Fedoroff, M.; Jeanjean, J.; Rouchaud, J.C.; Monteil-Rivera, F.; Dumonceau, J.; Milonjic, S. Sorption of selenium anionic species on apatites and iron oxides from aqueous solutions. J. Environ. Radioact. 2003, 70, 61–72. [Google Scholar] [CrossRef]
  28. Staicu, L.C.; Barton, L.L. Selenium respiration in anaerobic bacteria: Does energy generation pay off? J. Inorg. Biochem. 2021, 222, 111509. [Google Scholar] [CrossRef] [PubMed]
  29. Stadtman, T.C. Biosynthesis and function of selenocysteine-containing enzymes. J. Biol. Chem. 1991, 266, 16257–16260. [Google Scholar] [CrossRef]
  30. Heider, J.; Böck, A. Selenium metabolism in micro-organisms. Adv. Microb. Physiol. 1993, 35, 71–109. [Google Scholar] [CrossRef]
  31. Eswayah, A.S.; Smith, T.J.; Gardiner, P.H.E. Microbial transformations of selenium species of relevance to bioremediation. Appl. Environ. Microbiol. 2016, 82, 4848–4859. [Google Scholar] [CrossRef] [PubMed] [Green Version]
  32. Gimmi, T.; Leupin, O.X.; Eikenberg, J.; Glaus, M.A.; Van Loon, L.R.; Waber, H.N.; Wersin, P.; Wang, H.A.O.; Grolimund, D.; Borca, C.N.; et al. Anisotropic diffusion at the field scale in a 4-year multi-tracer diffusion and retention experiment—I: Insights from the experimental data. Geochim. Cosmochim. Acta 2014, 125, 373–393. [Google Scholar] [CrossRef]
  33. Descostes, M.; Blin, V.; Bazer-Bachi, F.; Meier, P.; Grenut, B.; Radwan, J.; Schlegel, M.L.; Buschaert, S.; Coelho, D.; Tevissen, E. Diffusion of anionic species in Callovo-Oxfordian argillites and Oxfordian limestones (Meuse/Haute–Marne, France). Appl. Geochem. 2008, 23, 655–677. [Google Scholar] [CrossRef]
  34. Bleyen, N.; Smets, S.; Small, J.; Moors, H.; Leys, N.; Albrecht, A.; De Cannière, P.; Schwyn, B.; Wittebroodt, C.; Valcke, E. Impact of the electron donor on in situ microbial nitrate reduction in Opalinus Clay: Results from the Mont Terri rock laboratory (Switzerland). Swiss J. Geosci. 2017, 110, 355–374. [Google Scholar] [CrossRef] [Green Version]
  35. Bossart, P.; Bernier, F.; Birkholzer, J.; Bruggeman, C.; Connolli, P.; Dewonck, S.; Fukaya, M.; Herfort, M.; Jensen, M.; Matray, J.-M.; et al. Geologic setting and overview of key experiments in the Mont Terri rock laboratory. Swiss J. Geosci. 2017, 110, 3–22. [Google Scholar] [CrossRef] [Green Version]
  36. Pearson, F.J.; Arcos, D.; Bath, A.; Boisson, J.Y.; Fernández, A.M.; Gabler, H.E.; Gaucher, E.; Gautschi, A.; Griffault, L.; Hernán, P.; et al. Mont Terri Project—Geochemistry of Water in the Opalinus Clay Formation at the Mont Terri Rock Laboratory; Geology Series No. 5; Federal Office for Water and Geology: Bern, Switzerland, 2003; p. 321. [Google Scholar]
  37. Bleyen, N.; Albrecht, A.; De Cannière, P.; Wittebroodt, C.; Valcke, E. Non-destructive on-line and long-term monitoring of in situ nitrate and nitrite reactivity in a clay environment at increasing turbidity. Appl. Geochem. 2019, 100, 131–142. [Google Scholar] [CrossRef]
  38. Martínez-Bravo, Y.; Roig-Navarro, A.F.; López, F.J.; Hernández, F. Multielemental determination of arsenic, selenium and chromium(VI) species in water by high-performance liquid chromatography–inductively coupled plasma mass spectrometry. J. Chromatogr. A 2001, 926, 265–274. [Google Scholar] [CrossRef]
  39. Walkinson, J.H. Fluorometric determination of selenium in biological material with 2,3-diaminonaphthalene. Anal. Chem. 1966, 38, 92–97. [Google Scholar] [CrossRef] [PubMed]
  40. Props, R.; Monsieurs, P.; Mysara, M.; Clement, L.; Boon, N. Measuring the biodiversity of microbial communities by flow cytometry. Methods Ecol. Evol. 2016, 7, 1376–1385. [Google Scholar] [CrossRef]
  41. Mysara, M.; Njima, M.; Leys, N.; Raes, J.; Monsieurs, P. From reads to operational taxonomic units: An ensemble processing pipeline for MiSeq amplicon sequencing data. Gigascience 2017, 6, 1. [Google Scholar] [CrossRef] [Green Version]
  42. Bankevich, A.; Nurk, S.; Antipov, D.; Gurevich, A.A.; Dvorkin, M.; Kulikov, A.S.; Lesin, V.M.; Nikolenko, S.I.; Pham, S.; Prjibelski, A.D.; et al. SPAdes: A new genome assembly algorithm and its applications to single-cell sequencing. J. Comput. Biol. 2012, 19, 455–477. [Google Scholar] [CrossRef] [Green Version]
  43. Mysara, M.; Leys, N.; Raes, J.; Monsieurs, P. IPED: A highly efficient denoising tool for Illumina MiSeq Paired-end 16S rRNA gene amplicon sequencing data. BMC Bioinform. 2016, 17, 1–11. [Google Scholar] [CrossRef] [Green Version]
  44. Mysara, M.; Saeys, Y.; Leys, N.; Raes, J.; Monsieurs, P. CATCh, an ensemble classifier for chimera detection in 16S rRNA sequencing studies. Appl. Environ. Microbiol. 2015, 81, 1573–1584. [Google Scholar] [CrossRef] [PubMed] [Green Version]
  45. Edgar, R.C. UPARSE: Highly accurate OTU sequences from microbial amplicon reads. Nat. Methods 2013, 10, 996–998. [Google Scholar] [CrossRef]
  46. Parkhurst, D.L.; Appelo, C.A.J. Description of input and examples for PHREEQC version 3—A computer program for speciation, batch-reaction, one-dimensional transport, and inverse geochemical calculations. In U.S. Geological Survey Techniques and Methods; U.S. Geological Survey: Reston, VA, USA, 2013; p. 497, Book 6, Chapter A43. [Google Scholar]
  47. Giffaut, E.; Grive, M.; Blanc, P.; Vieillard, P.; Colas, E.; Gailhanou, H.; Gaboreau, S.; Marty, N.; Made, B.; Duro, L. Andra thermodynamic database for performance assessment: ThermoChimie. Appl. Geochem. 2014, 49, 225–236. [Google Scholar] [CrossRef]
  48. Olin, A.; Nolang, B.; Osadchii, E.G.; Ohman, L.O.; Rosen, E. Chemical Thermodynamics of Selenium; NEA North Holland Elsevier Science Publishers B.V.: Amsterdam, The Netherlands, 2015; Volume 7, p. 893. [Google Scholar]
  49. Kinniburgh, D.; Cooper, D. PhreePlot: Creating Graphical Output with PHREEQC. 2011. Available online: http://www.phreeplot.org (accessed on 24 June 2020).
  50. Appelo, C.A.J.; Wersin, P. Multicomponent diffusion modeling in clay systems with application to the diffusion of tritium, iodide, and sodium in Opalinus Clay. Environ. Sci. Technol. 2007, 41, 5002–5007. [Google Scholar] [CrossRef]
  51. Tournassat, C.; Alt-Epping, P.; Gaucher, E.C.; Gimmi, T.; Leupin, O.X.; Wersin, P. Biogeochemical processes in a clay formation in situ experiment: Part F–Reactive transport modelling. Appl. Geochem. 2011, 26, 1009–1022. [Google Scholar] [CrossRef] [Green Version]
  52. Mijnendonckx, K.; Van Gompel, A.; Coninx, I.; Bleyen, N.; Leys, N. Water-soluble bitumen degradation products can fuel nitrate reduction from non-radioactive bituminized waste. Appl. Geochem. 2020, 114, 104525. [Google Scholar] [CrossRef]
  53. Bleyen, N.; Hendrix, K.; Moors, H.; Durce, D.; Vasile, M.; Valcke, E. Biodegradability of dissolved organic matter in Boom Clay pore water under nitrate-reducing conditions: Effect of additional C and P sources. Appl. Geochem. 2018, 92, 45–58. [Google Scholar] [CrossRef]
  54. Mariën, A.; Bleyen, N.; Aerts, S.; Valcke, E. The study of abiotic reduction of nitrate and nitrite in Boom Clay. Phys. Chem. Earth 2011, 36, 1639–1647. [Google Scholar] [CrossRef]
  55. Props, R.; Kerckhof, F.-M.; Rubbens, P.; De Vrieze, J.; Hernandez Sanabria, E.; Waegeman, W.; Monsieurs, P.; Hammes, F.; Boon, N. Absolute quantification of microbial taxon abundances. ISME J. 2017, 11, 584–587. [Google Scholar] [CrossRef] [PubMed] [Green Version]
  56. Wersin, P.; Leupin, O.; Mettler, S.; Gaucher, E.C.; Mäder, U.; De Cannière, P.; Vinsot, A.; Gäbler, H.; Kunimaro, T.; Kiho, K. Biogeochemical processes in a clay formation in situ experiment: Part A—Overview, experimental design and water data of an experiment in the Opalinus Clay at the Mont Terri Underground Research Laboratory, Switzerland. Appl. Geochem. 2011, 26, 931–953. [Google Scholar] [CrossRef]
  57. Steinberg, N.A.; Oremland, R.S. Dissimilatory selenate reduction potentials in a diversity of sediment types. Appl. Environ. Microbiol. 1990, 56, 3550–3557. [Google Scholar] [CrossRef] [Green Version]
  58. Oremland, R.S.; Herbel, M.J.; Blum, J.S.; Langley, S.; Beveridge, T.J.; Ajayan, P.M.; Sutto, T.; Ellis, A.V.; Curran, S. Structural and spectral features of selenium nanospheres produced by Se-respiring bacteria. Appl. Environ. Microbiol. 2004, 70, 52–60. [Google Scholar] [CrossRef] [PubMed] [Green Version]
  59. Avendaño, R.; Chaves, N.; Fuentes, P.; Sánchez, E.; Jiménez, J.I.; Chavarría, M. Production of selenium nanoparticles in Pseudomonas putida KT2440. Sci. Rep. 2016, 6, 37155. [Google Scholar] [CrossRef] [Green Version]
  60. Courdouan, A.; Christl, I.; Meylan, S.; Wersin, P.; Kretzschmar, R. Characterization of dissolved organic matter in anoxic rock extracts and in situ pore water of the Opalinus Clay. Appl. Geochem. 2007, 22, 2926–2939. [Google Scholar] [CrossRef]
  61. Eichinger, F.; Lorenz, G.; Eichinger, L. WS-H Experiment: Water Sampling from Borehole BWS-H2—Report on Physical-Chemical and Isotopic Analyses; Mont Terri Technical Note TN 2010-49; Swisstopo: Wabern, Switzerland, 2011; p. 24. [Google Scholar]
  62. Van Loon, L.R.; Leupin, O.X.; Cloet, V. The diffusion of SO42− in Opalinus Clay: Measurements of effective diffusion coefficients and evaluation of their importance in view of microbial mediated reactions in the near field of radioactive waste repositories. Appl. Geochem. 2018, 95, 19–24. [Google Scholar] [CrossRef]
  63. Li, Y.-H.; Gregory, S. Diffusion of ions in sea water and in deep-sea sediments. Geochim. Cosmochim. Acta 1974, 38, 703–714. [Google Scholar] [CrossRef]
  64. Bagnoud, A.; de Bruijn, I.; Andersson, A.F.; Diomidis, N.; Leupin, O.X.; Schwyn, B.; Bernier-Latmani, R. A minimalistic microbial food web in an excavated deep subsurface clay rock. FEMS Microbiol. Ecol. 2016, 92. [Google Scholar] [CrossRef] [Green Version]
  65. Ficker, M.; Krastel, K.; Orlicky, S.; Edwards, E. Molecular characterization of a toluene-degrading methanogenic consortium. Appl. Environ. Microbiol. 1999, 65, 5576–5585. [Google Scholar] [CrossRef] [PubMed] [Green Version]
  66. Liang, B.; Wang, L.Y.; Mbadinga, S.M.; Liu, J.F.; Yang, S.Z.; Gu, J.D.; Mu, B.Z. Anaerolineaceae and Methanosaeta turned to be the dominant microorganisms in alkanes-dependent methanogenic culture after long-term of incubation. AMB Express 2015, 5, 117. [Google Scholar] [CrossRef] [PubMed] [Green Version]
  67. McIlroy, S.J.; Kirkegaard, R.H.; Dueholm, M.S.; Fernando, E.; Karst, S.M.; Albertsen, M.; Nielsen, P.H. Culture-independent analyses reveal novel Anaerolineaceae as abundant primary fermenters in anaerobic digesters treating waste activated sludge. Front. Microbiol. 2017, 8. [Google Scholar] [CrossRef] [PubMed]
  68. Sun, L.; Toyonaga, M.; Ohashi, A.; Matsuura, N.; Tourlousse, D.M.; Meng, X.-Y.; Tamaki, H.; Hanada, S.; Cruz, R.; Yamaguchi, T.; et al. Isolation and characterization of Flexilinea flocculi gen. nov., sp. nov., a filamentous, anaerobic bacterium belonging to the class Anaerolineae in the phylum Chloroflexi. Int. J. Syst. Evol. 2016, 66, 988–996. [Google Scholar] [CrossRef]
  69. Yamada, T.; Sekiguchi, Y. Cultivation of uncultured Chloroflexi subphyla: Significance and ecophysiology of formerly uncultured Chloroflexi ‘subphylum I’ with natural and biotechnological relevance. Microbes Environ. 2009, 24, 205–216. [Google Scholar] [CrossRef] [PubMed] [Green Version]
  70. Gonzalez-Gil, G.; Lens, P.N.L.; Saikaly, P.E. Selenite reduction by anaerobic microbial aggregates: Microbial community structure, and proteins associated to the produced selenium spheres. Front. Microbiol. 2016, 7, 571. [Google Scholar] [CrossRef] [PubMed] [Green Version]
  71. Stolz, J.F.; Basu, P.; Santini, J.M.; Oremland, R.S. Arsenic and selenium in microbial metabolism. Annu. Rev. Microbiol. 2006, 60, 107–130. [Google Scholar] [CrossRef] [PubMed] [Green Version]
  72. Knotek-Smith, H.M.; Crawford, D.L.; Möller, G.; Henson, R.A. Microbial studies of a selenium-contaminated mine site and potential for on-site remediation. J. Ind. Microbiol. Biotechnol. 2006, 33, 897–913. [Google Scholar] [CrossRef] [PubMed]
Figure 1. Intracellular ATP measurements for samples in the presence of (a) Se(VI) or (b) Se(IV) during the abiotic test. Details of the test conditions can be found in the legend and in Table 2.
Minerals 11 00757 g001
Figure 2. Abiotic test results for Se(VI) (left) and Se(IV) (right) reactivity in the presence of Opalinus Clay (C) and/or stainless steel filter (F). Details of the test conditions can be found in the legend and in Table 2. The error bars represent the measurement uncertainty (95% confidence).
Minerals 11 00757 g002
Figure 3. SEM–EDX images of the stainless steel filter surface of batch test Ab_Se(IV)-CF_a. EDX spot analyses were performed on distinct deposits. For EDX analysis, elements Bi, Br, Dy, I, Re, Sb, Sr, Te, Ti, V and W were disabled. The scale bar is shown in the bottom left corner of each SEM image.
Minerals 11 00757 g003
Figure 4. Se(IV) sorption coefficients (Rd) calculated with Equation (1) for the abiotic batch experiments Ab_Se(IV)-C_a (yellow) and Ab_Se(IV)-CF_a (green) (details on test conditions in Table 2) compared to Rd measurements from Frasca et al. [18] for Se(IV) sorption onto Opalinus Clay with initial concentration of 100 µM (black full line). The dashed lines represent the Rd calculated for the abiotic batch experiments from the 2-site Langmuir isotherm of [18] (Equations (1) and (2); Table 3) for equilibrium aqueous concentrations of 5.6 µM and 3.8 µM Se(IV), which encompass the range of concentrations measured in the batch experiments Ab_Se(IV)-C_a and Ab_Se(IV)-C_b after 70 days. Note, the Rd calculated from the Se(IV) concentration of Ab_Se(IV)-CF_a at 70 days is 1085 mL g−1 and plots outside the scale of the figure.
Minerals 11 00757 g004
Figure 5. Intracellular ATP measurements for samples in the presence of (a) Na2SeO4 or (b) Na2SeO3 during the biotic test. Details on the test conditions can be found in the legend and in Table 2.
Minerals 11 00757 g005
Figure 6. Biotic test results for Se(VI) (left) and Se(IV) (right) reactivity in the presence of Opalinus Clay (C) and/or stainless steel filter (F). Details on the test conditions can be found in the legend and in Table 2. The error bars represent the measurement uncertainty (95% confidence).
Minerals 11 00757 g006
Figure 7. Measured aqueous Se(VI) (blue squares), Se(IV) (red triangles), and total aqueous Se (black circles) concentrations in batch experiment Bio_Se(VI)-CF-a (more details in Table 2), compared to two PHREEQC models representing first order reduction of Se(VI) and sorption of Se(IV). Model 1 (full lines) includes the 2-site Langmuir isotherm of Frasca et al. [18], while in model 2 (dashed lines) the isotherm has been adjusted to represent the Rd values for Se(IV) sorption obtained from the abiotic batch experiments. The two green curves represent the sorbed concentration of Se(IV) according to Equation (2).
Minerals 11 00757 g007
Figure 8. Evolution of the concentrations of Se(VI) (selenate) and total Se, the main components of the borehole pore water, organic and inorganic C, and pH and Eh as a function of time for both in situ injection tests, as shown at the top. The X-axis shows the entire experimental time frame, encompassing both injection tests with Se(VI). The experimental Se data were split in two graphs, one for each injection test, in order to visualize the ~12 times higher initial Se(VI) concentration of the second injection test. The error bars represent the measurement uncertainty (95% confidence). The combined uncertainty on the pH and Eh is 0.06 pH units and 32 mV, respectively (95% confidence interval), taking into account the measurement uncertainty observed immediately after calibration and the bias observed after ~1 year [37]. The star at ~132 days indicates an electrical power failure, resulting in a temporary lack of water circulation and online analysis.
Minerals 11 00757 g008
Figure 9. Intracellular ATP measurements (green) representative of microbial activity and total cell concentration based on flow cytometry (red) during the in situ test. ATP measurements are plotted on the left Y-axis, while flow cytometry results are plotted on the right Y-axis. The time of the second injection is indicated with an arrow.
Minerals 11 00757 g009
Figure 10. Relative (a,c) and absolute (b,d) abundance of the most dominant phyla (a,b), and OTUs (c,d) present in the borehole water after injection with 5 µM followed by an injection with 60 µM selenate. The time of the second injection is highlighted with a rectangle in the X axis (D106).
Minerals 11 00757 g010
Figure 11. Measured concentrations (symbols) of Se(VI) and total Se in water samples after injection of the BN borehole with 60 µM Se(VI) compared to the modeled diffusion of Se(VI), using the pore diffusion coefficients of either Br (green line) or deuterated water (HDO; blue line) to represent the diffusion of Se(VI) anions. Note that only the time after the second injection with selenate is shown.
Minerals 11 00757 g011
Figure 12. Measured concentrations of Se(VI) and total Se in water samples from the 60 µM Se(VI) in situ injection test (symbols) compared to the modeled concentrations in the circulating fluid in the BN borehole (lines). To model the Se(VI) concentration (blue line), diffusion as defined by Br diffusion and the reduction reaction of Se(VI) to Se(IV) defined by a first order reaction with a rate constant 0.01 days−1 is considered. Se(IV) is also subjected to diffusion as represented by Br diffusion and to sorption onto Opalinus Clay as described by a 2-site Langmuir isotherm [18] (Equation (2)). Aqueous Se(IV) in the circulating borehole fluid is indicated by the red line, while the concentration of Se(IV) that is sorbed onto Opalinus Clay is indicated by the green line represented as an equivalent concentration in the borehole fluid. The total Se concentrations calculated by the model are indicated by the dashed black line. Note that only the time after the second injection with selenate is shown.
Minerals 11 00757 g012
Figure 13. Pourbaix diagram showing the stability of Se aqueous species and more reduced Se species compared to the in situ steady state Eh and pH conditions of the BN Se injection test (red square) and measurements from the Mont Terri Pore water Chemistry (PC) experiment (green circles) [55]. Calculated for a total Se concentration of 50 µM using PHREEPLOT [49] with the Thermochimie database [47].
Minerals 11 00757 g013
Table 1. Chemical composition of the artificial pore water (APW; target composition [34]) used to saturate the intervals and of sampled solutions from Interval 1 and 3 (one sample each) used for the batch tests (Section 2.2). The measurement uncertainty (95% confidence) on the concentrations is 4–5% ([SO42−]), 5.5% ([NO3], 6% ([Cl]), 10% ([Na+], [K+], [Mg2+], [Ca2+], [Sr2+], [CH3COO], and TIC), 15% ([NO2], [total dissolved Fe]) and 30% (TOC) (95% confidence), while the uncertainty on the pH is estimated to be 0.1 pH unit (95% confidence).
Chemical SpeciesConcentration (mM)
APWInterval 1Interval 3
Na+162181177
K+1.11.21.3
Mg2+8.69.7110.2
Ca2+12.611.710.9
Sr2+0.380.320.32
Total dissolved Fe0.0160.0015
Cl181202197
SO42−12.311.911.7
NO30.040.06
NO2<0.1<0.1
CH3COO<0.02<0.02
TIC2.80.532.2
TOC<0.83<0.83
pH7.87.7n.a. 1
—: component not added to APW composition (thus initially absent); 1 n.a.: not analyzed.
Table 2. Overview of the test conditions studied in the batch tests with Se species. Duplicates were prepared for each condition and were labeled with ‘a’ and ‘b’.
Test CodeClay (g)Stainless Steel (mm × mm) 1Na2HPO4 (mM)Abiotic/Biotic
Tests with 50 µM selenate
Ab_Se(VI)abiotic
Ab_Se(VI)-C0.1 gabiotic
Ab_Se(VI)-F5 × 5abiotic
Ab_Se(VI)-CF0.1 g5 × 5abiotic
Bio_Se(VI)-C0.1 gbiotic
Bio_Se(VI)-CF0.1 g5 × 5biotic
Bio_Se(VI)-P0.1biotic
Tests with 10 µM selenite
Ab_Se(IV)abiotic
Ab_Se(IV)-C0.1 gabiotic
Ab_Se(IV)-F5 × 5abiotic
Ab_Se(IV)-CF0.1 g5 × 5abiotic
Bio_Se(IV)-C0.1 gbiotic
Bio_Se(IV)-CF0.1 g5 × 5biotic
Bio_Se(IV)-P0.1biotic
1 Thickness of the stainless steel filter = 1 mm; meaning of the test codes: Ab: abiotic; Bio: biotic; C: clay; F: filter; CF: clay and filter; P: addition of phosphate; —: component not added to the batch tests.
Table 3. Langmuir isotherm parameters from Frasca et al. [18] used in the Se(IV) sorption model for Opalinus Clay. These parameter values are used in Equation (2) to represent Se(IV) sorption using a 2-site Langmuir isotherm. KL is the sorption potential and Smax is the sorption capacity of each site.
Sorption SiteKL (L mol−1)Smax (mol kg−1)
Site 12.1 × 1051.7 × 10−3
Site 21.9 × 1071.4 × 10−5
Site 1 fitted (†)7.5 × 1047.5 × 10−3
(†) ‘Site 1 fitted’ refers to parameters fitted to represent the enhanced sorption observed in the abiotic batch experiments.
Publisher’s Note: MDPI stays neutral with regard to jurisdictional claims in published maps and institutional affiliations.

