Article

Differentiation of Trace Metal Contamination Level between Different Urban Functional Zones in Permafrost Affected Soils (the Example of Several Cities in the Yamal Region, Russian Arctic)

1
Department of Applied Ecology, Saint Petersburg State University, 16 Line 29 Vasilyevskiy Island, 199178 Saint-Petersburg, Russia
2
Arctic Research Center of the Yamal-Nenets Autonomous District, 73, Respubliki St., 629008 Salekhard, Russia
3
Institute of Environmental Engineering, University of Zielona Góra, 15, Prof. Z. Szafrana St., 65-516 Zielona Góra, Poland
4
All Russian Institute for Agricultural Microbiology, 196608 Saint-Petersburg, Russia
*
Author to whom correspondence should be addressed.
Minerals 2021, 11(7), 668; https://doi.org/10.3390/min11070668
Submission received: 25 May 2021 / Revised: 18 June 2021 / Accepted: 19 June 2021 / Published: 23 June 2021

Abstract

:
Dynamically developing urbanization causes a number of environmental effects, including those related to the chemical transformation of soils. Relatively less information about the urban areas of the Arctic and Subarctic zones, constructed mostly on permafrost and intensively populated areas can be found. By the example of the analysis of basic soil properties and concentrations of trace metals in the soils of the cities of Salekhard, Urengoy, Nadym, Novy Urengoy and Gaz Sale (the Yamalo-Nenets Autonomous District), as well as various functional zones within the cities, the relationship between the age of the cities, the level of anthropogenic pressure and the type of parent materials and the character of accumulation of metals in the soil profile of urban soils have been described. The direct correlation was found between the content of Pb, Cr, Ni, As and soil sorption characteristics. In young cities built on sandy sediments, there is less accumulation of heavy metals in the topsoil horizons. Relatively higher concentrations of Cu and Cd were noted in soils of industrialized cities, regardless of functional zones. The higher content of Cr, Ni, Cu, Zn, As and Pb has been registered in older zones also frequently used for residential purposes. The calculated values of the PI index for some functional zones of young cities show the medium and high content of heavy metals. The analysis of Igeo and PLI indices shows a large diversity both in relation to individual cities and their functional zones. Soil quality, in spite of the high level of anthropogenic load, was assessed as mostly satisfactory.

1. Introduction

Urbanization and urban sprawl has to a large extent a demographic background—modern cities accept a constantly growing number of inhabitants—constituting already 55.3%, and in 2050, possibly 68.4% of the total world population [1]. Strong urbanization processes will be noted in previously sparsely populated and urbanized areas. It should be expected that they will proceed very intensively in areas of key importance to the economies of individual countries. Such areas are strongly related to the presence of raw materials and dynamically developing industry.
Climatic conditions, the isolation of settlements from each other, and transport inaccessibility cause a high degree of urbanization of the Arctic regions. According to various estimates, more than 85% of the population of the Russian Arctic lives in cities. This is the highest rate of urbanization in all of Russia [2]. Large settlements in the Arctic regions were formed as a result of the industrial development of the north. The effective mining of natural resources was impossible without the logistics and transport chain, the basis of which are large settlements. In the Yamal-Nenets Autonomous District, the largest settlements are inextricably linked to industrial production [3]. The first attempts to apply scientifically based methods of complex development and management of the Arctic territories began during the period of mass industrial activity in the oil and gas fields of Western Siberia. As a result, it was considered optimal to create cities of different categories: large, medium or small, depending on the specific needs of the region. As a result, in the period from 1960 to 1990 there were created 6 cities and 14 small settlements, which were focused on the search and extraction of hydrocarbon raw materials. At present about 75% of the population of the Yamal region lives in these towns [4,5].
Most of the Arctic cities were formed relatively recently. The oldest city in which our study was conducted is Salekhard, it has an ancient history and was founded in 1595 and received city status in 1938. The ages of the rest of the cities we studied do not exceed 45 years, for example, Gaz Sale was formed as a municipality only in 2004 [4].
The understanding of the conceptual role of the Arctic territories and the elaboration of projects for the development of the North as a special space for state development are widely associated with the works of academicians Agranat [6] and Slavin [7]. Currently, the development of the Arctic regions is being raised more and more frequently. The Russian Federation has adopted at the governmental level the program "Social-economic development of the Arctic zone of the Russian Federation for the period until 2025," which provides for the development of the northern regions in various directions, from mining to agriculture [8].
It is reasonable to assume that such global projects will necessarily lead to population growth and density in the Arctic regions and, as a consequence, to the increase and development of cities in the Arctic and Subarctic zones. However, intensive urban growth carries with it adverse environmental effects on the fragile Arctic ecosystem.
The environmental problems of cities and their impact on the global ecosystem are well studied and unquestioned [9,10]. Urban development, and the resulting point-in-time extreme anthropogenic impact on ecosystems, has been well studied in the examples of the largest cities and their agglomerations in Europe, China, Latin America and India [11,12,13,14]. The development of urban infrastructure cardinally transforms landscapes and changes the temperature regime due to the concentration of industrial enterprises and vehicles. This leads to the formation of so-called “heat islands” which are one of the causes of climate change at the global and local levels [9,10].
Urban areas located in the Arctic and Subarctic zones require special management in terms of their impact on the environment. Built mostly on permafrost, large populated settlements may become one of the causes of the acceleration of permafrost melting, which has enormous impacts. One of the effects of thawing permafrost is a massive increase in the emission of greenhouse gases such as CO2 or methane into the atmosphere [15,16]. Since more than 60% of Russia’s territory is located in the permafrost zone, questions of controlling the anthropogenic load on Arctic territories will always remain relevant [17,18].
Dynamically developing urbanization causes a number of environmental effects, including those related to the transformation of soils. The pace of land development is proportional to the scale of these transformations [19,20]. The soil cover of the northern regions is highly vulnerable to anthropogenic impact. Soil formation in the Arctic is complicated due to extreme climatic conditions and the prevalence of low temperatures. However, it is the analysis of the soil cover that may be the key to assessing the degree of anthropogenic impact on Arctic ecosystems. Additionally, all areas with poorly developed soil cover (poorly developed soils) are susceptible to their devastation as a result of investment processes [21]. The mechanical transformations of these soils lead to the shortening of the soil profiles and the exposure of the bedrock level [22]. This enables other manifestations of soil degradation, including chemical ones, with a direct threat to the lower parts of the soil profile and geological layers [22,23]. Accumulation of trace metals in urban soils is an unavoidable effect of excessive anthropogenic pressure on ecosystems [24,25].
Since the adverse environmental impact of the urban ecosystem of the Yamal region is associated not only with traditional factors such as emissions from industrial plants and motor vehicles, but also active extraction of natural resources (gas, oil, chromite ores), it is extremely important to understand the degree of anthropogenic load which falls not only on natural ecosystems, but also on urbanized areas [26,27,28]. Thus, the goal of our work is to assess the content of trace metals in the soils of Arctic cities and their functional zones (Salekhard, Nadym, Urengoy, Gaz Sale and Novy Urengoy) with different histories of anthropogenic load and different soil-forming bedrock.

2. Materials and Methods

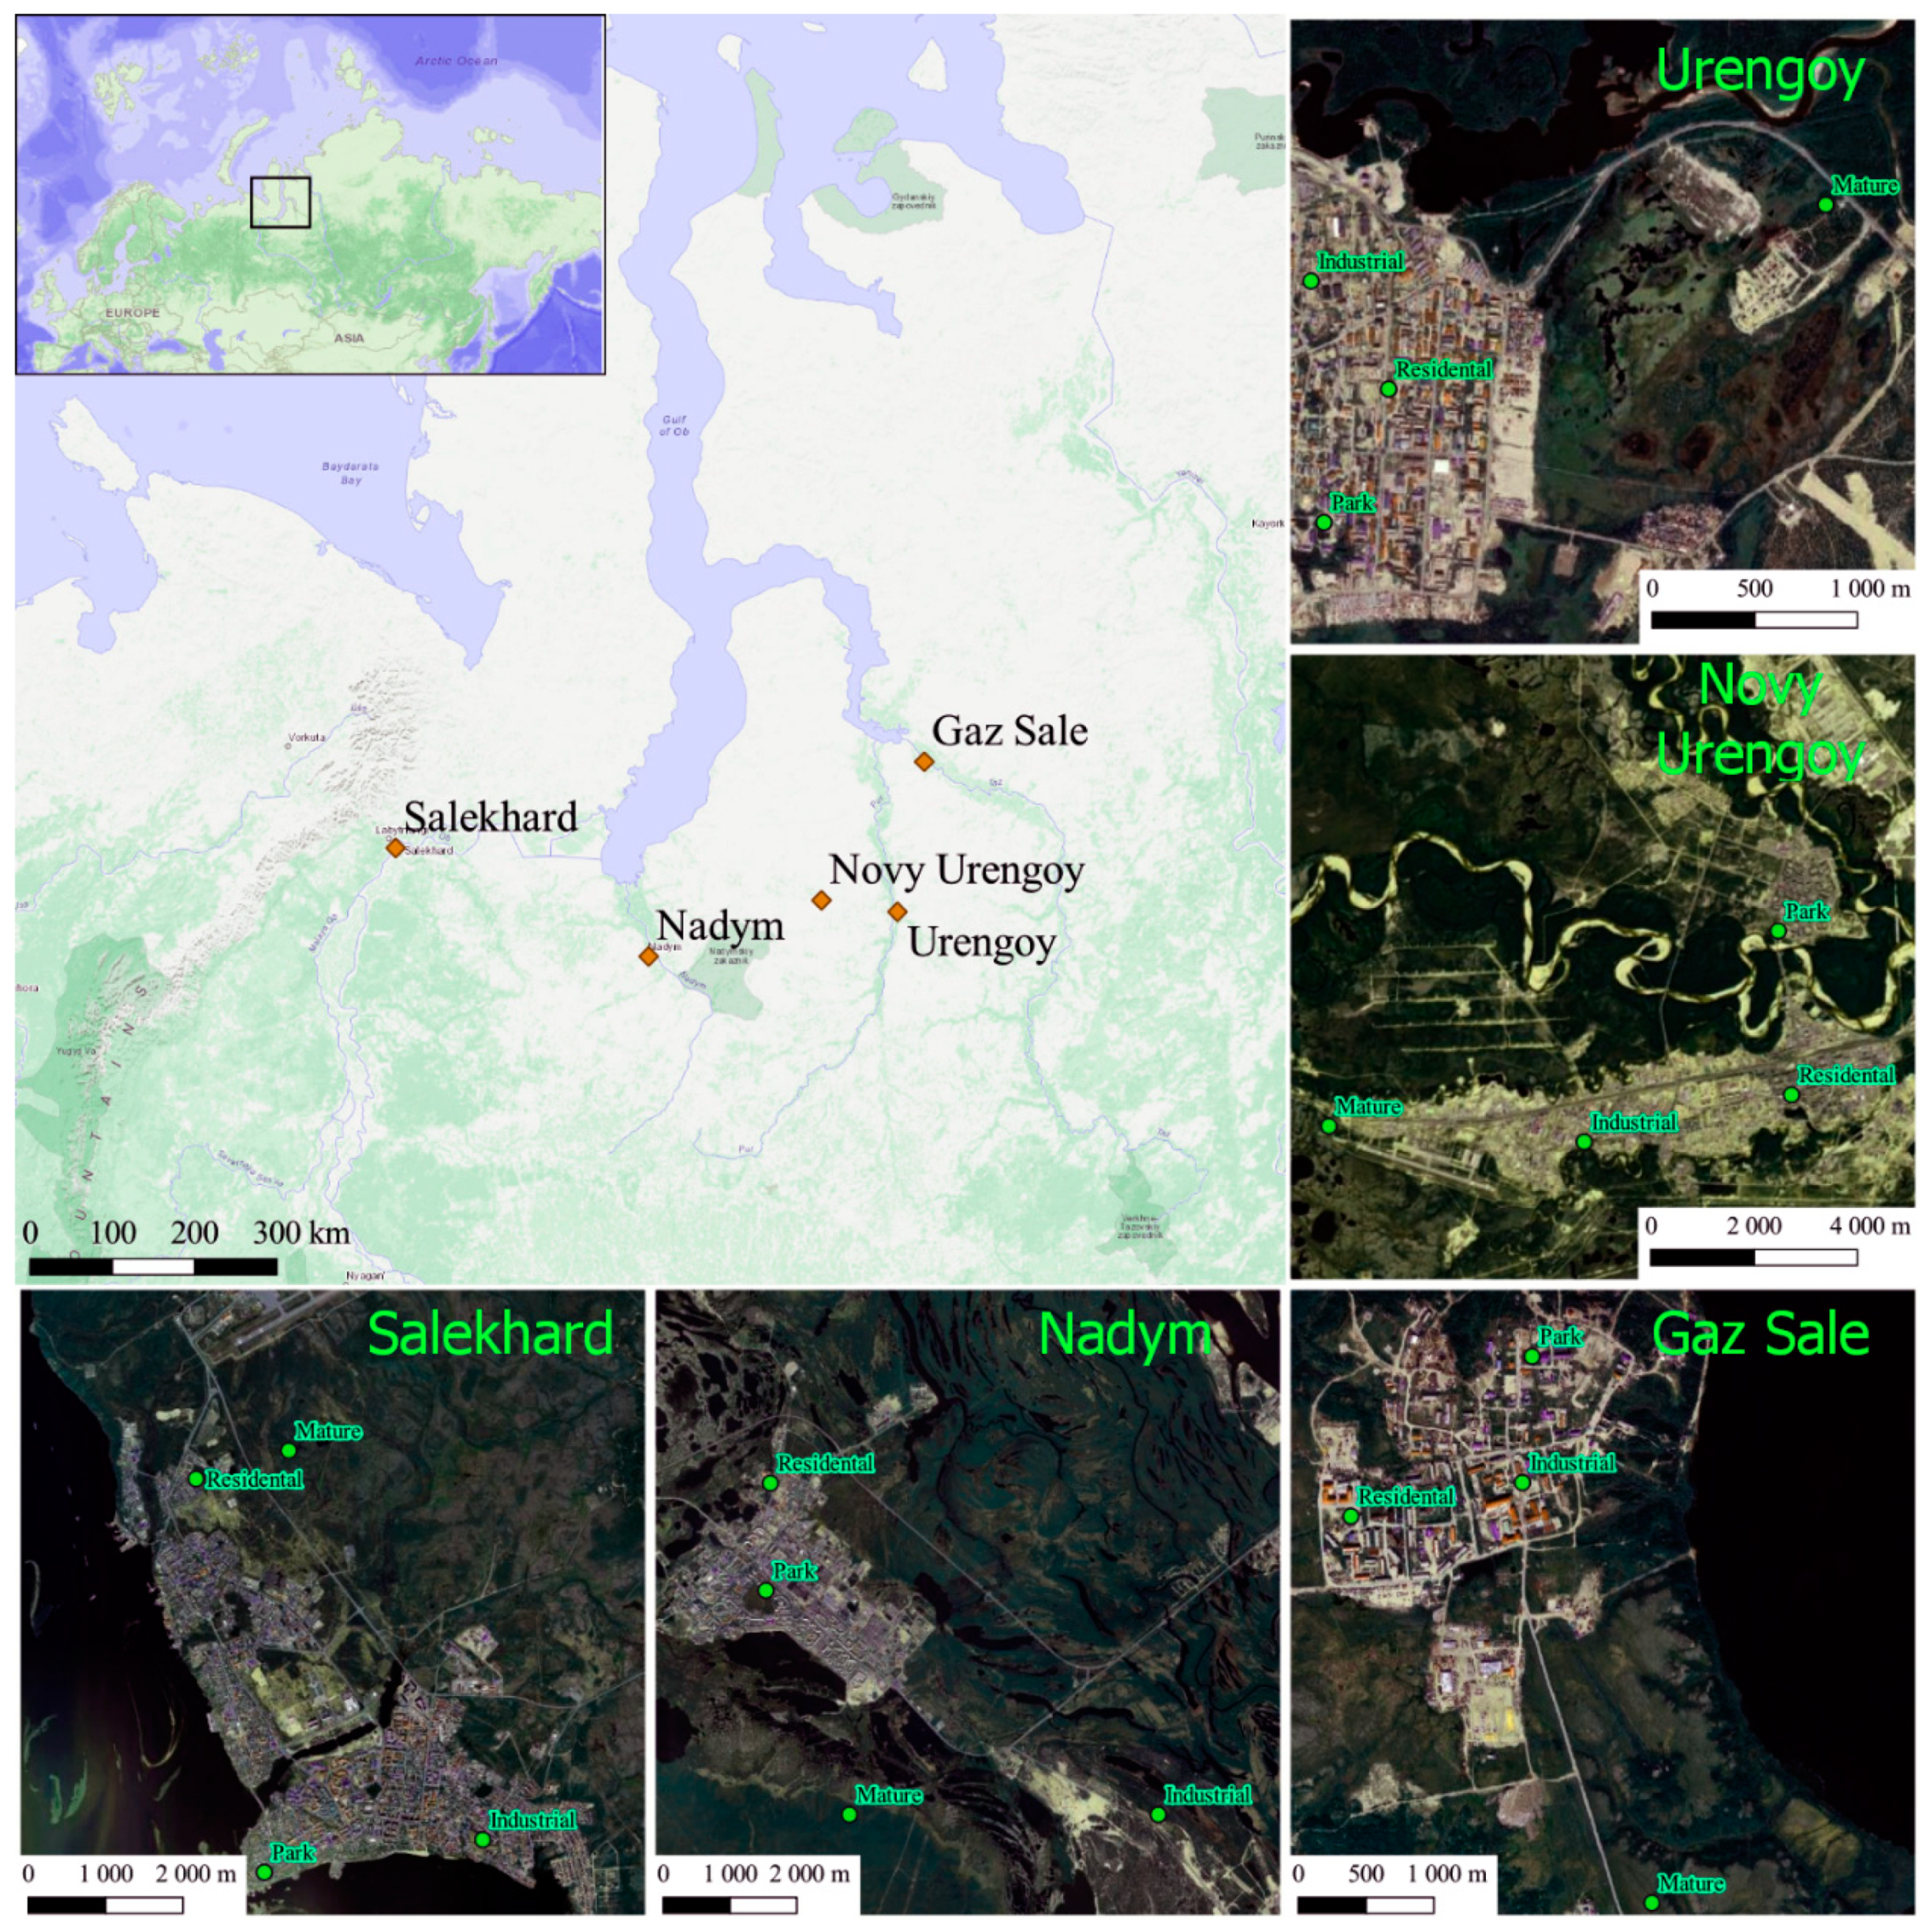
2.1. Site Locations and Their Anthropogenic Load

The study focused on topsoil horizons for differentiation of basic soil properties and content of trace elements between several large settlements in the Arctic region (Figure 1). A comparison was also made between the different functional zones of the northern cities. Soil samples were taken in five major towns of the Yamal-Nenets Autonomous District, namely:
Salekhard—settlement foundation ~1595, town status 1938, total area 84.5 km2, population 51 thous. (2020), capital city of the Yamalo-Nenets Autonomous Okrug, chromite deposits, oil and gas industry;
Nadym—settlement foundation ~1597, town status 1972, total area 99.8 km2, population 45 thous. (2020), oil and gas industry;
Novy Urengoy—construction of a research station 1966, town status 1980, total area 111 km2, population 118 thous. (2020), oil and gas industry;
Gaz Sale—settlement, from 2025 will be included in Tazovskiy municipal area, total area 0.03 km2, population 1721 (2019), oil and gas industry;
Urengoy—construction of the geological station 1966, town status 1979, total area 2.8 km2, population 10 thous. (2020), oil and gas industry.
Anthropogenic load of cities in the Yamal region is associated not only with traditional factors for urbanized areas, such as emissions from industrial plants and vehicles, burning of fossil fuels, degradation of green spaces and many others. The world’s largest chromite deposit is located near the towns of Labytnangi and Salekhard. It is mined using the open-pit method and the ore is transported to processing plants [26,27]. Additionally on the Yamal Peninsula is one of Russia’s largest natural gas and oil production and transportation facilities. Of course, all of these processes lead to the inflow of trace metals into the environment, surface waters, and soils [28,29]. Young and small cities such as Gaz Sale and Nadym are vulnerable to emissions from local sources of emissions (e.g., combined heat and power plants) and vehicles [30].

2.2. Sampling Strategy

The sampling strategy was based on searching for different functional zones within several cities of the Yamal region and collecting samples from topsoil (0–20) horizons. Soil samples were taken in the industrial, residential, and park zones of Salekhard, Novy Uregnoi, Gaz Sale, Nadym, and Urengoi. Background (mature stand) samples were also collected from outside the territories of the above-mentioned cities (Table 1). Within each functional zone, samples were taken from individual sites typical for a given form of use, in three replicates. A total of 60 soil samples were taken.
In the studied areas, soil pits were also made, exposing the soil profile to the permafrost level or to the subcutaneous waters. The described limiting elements of the soil profiles from below were located not deeper than 100 cm below the ground level (Figure 2). According to the International Soil Classification System [31], the studied soils belong to the taxonomic sections of Podzols, Technosols, and Cryosols.

2.3. Chemical Analyses and Data Processing

Soil samples were transported to the laboratory of the Department of Applied Ecology, St. Petersburg University. The samples were air dried, grounded and passed through a 2 mm sieve. The pH values of soil solution were measured by the using a pH-meter-millivoltmeter pH-150MA (Belarus). Soil solution was prepared in the ratio of 1:2.5 with water or 1M CaCl2 (for mineral soils the optimal soil weight for solution preparation is 8 g) [32]. Basal soil respiration was evaluated by measuring CO2 in Sodium Hydroxide. Incubation of CO2 was conducted for 10 days in plastic sealed containers [33].
The total carbon and nitrogen contents were evaluated using a CHN analyzer (Leco CHN-628; Leco Corporation, St. Joseph, MI, USA).
The content of trace metals was determined following to the standard ISO 11047-1998 “Soil Quality-Determination of Cadmium (Cd), Cobalt (Co), Copper (Cu), Lead (Pb), Manganese (Mg), Nickel (Ni) and Zinc (Zn) in Aqua Regia Extracts of Soil—Flame and Electrothermal Atomic Absorption Spectrometric” method with an atomic absorption spectrophotometer Kvant 2M (Moscow, Russia) [34].
The Geoaccumulation Index (Igeo) allows us to classify seven levels of soil contamination, from Practically unpolluted (Igeo ≤ 0) to Extremely polluted (Igeo > 5) [35,36]. The generic calculation formula is as follows:
Igeo = log 2 [ C n 1.5   B n ]
where, Cn—the measured concentration of the element in soil; Bn—the geochemical background value.
One more index that assists in evaluating what heavy metal contributes the most to soil contamination is the Single Pollution Index (PI) [36]. The basic formula is as follows:
P I = C n G B
where, Cn—the content of heavy metal in soil; GB—values of the geochemical background.
Single Pollution Index is used to calculate complex indices, which allow you to estimate the total degree of pollution. One of such indices is Pollution Load Index (PLI), it is calculated as a geometric average of PI values [36,37]. The basic formula for calculating this complex index is as follows:
P L I = P I 1 × P I 2 × P I 3 × P I n n
where, n—the number of analyzed metals; PI—calculated values for the Single Pollution Index.
As the geochemical background concentrations (in accordance with formulas (1) and (2)) of metals, averaged geochemical concentrations published by Chernova and Beketskaya (2011) [38] and soils of the island of Belyi published by Moskovchenko et al. (2019) [39] were used. According to these sources, background concentrations of trace metals in pristine soils are as follows: Cu—9; Pb—15; Zn—32; Ni—13; Cd—0.0071 mg × kg−1 [38,39].
All applied indices have their own evaluation scales (Table 2), which allows a qualitative assessment of soil contamination by trace metals.

2.4. Variance Analysis and Data Visualization

Statistical analysis of the data was performed using multivariate analysis of variance (MANOVA) in the Statistica v12.0 software package (Statsoft, Tulsa, OK, USA). Data visualization was performed using QGIS 3.16 and GraphPad Prizm 9.0.0.

3. Results and discussion

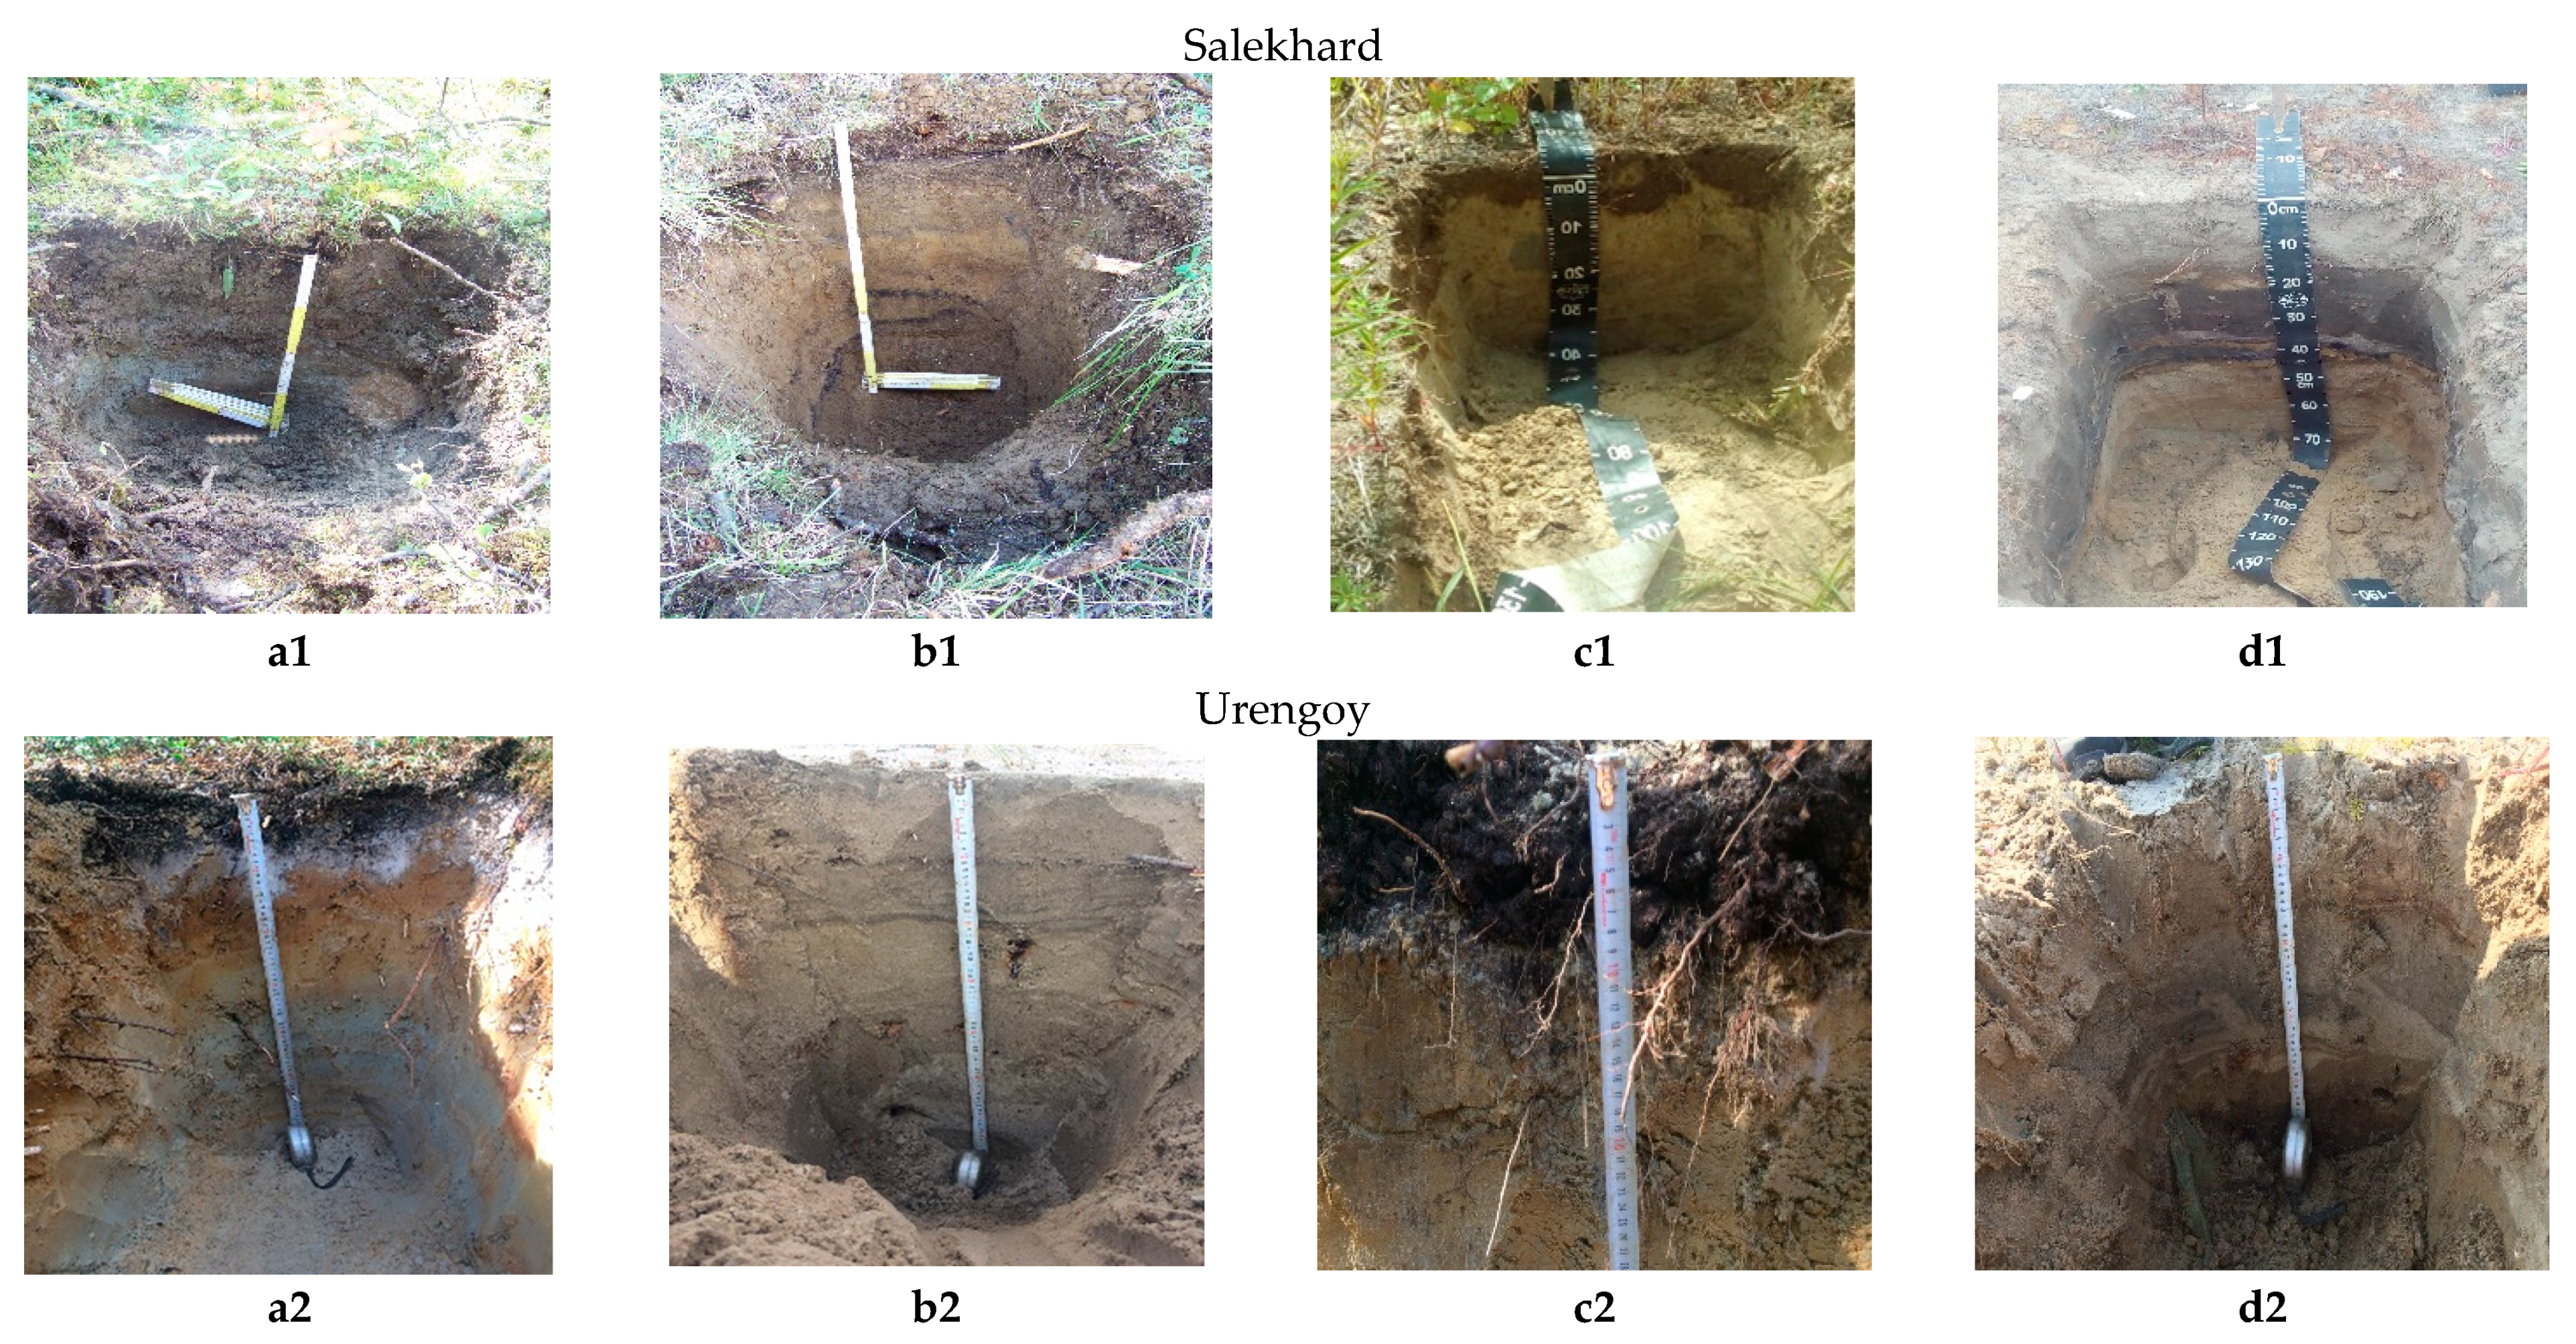
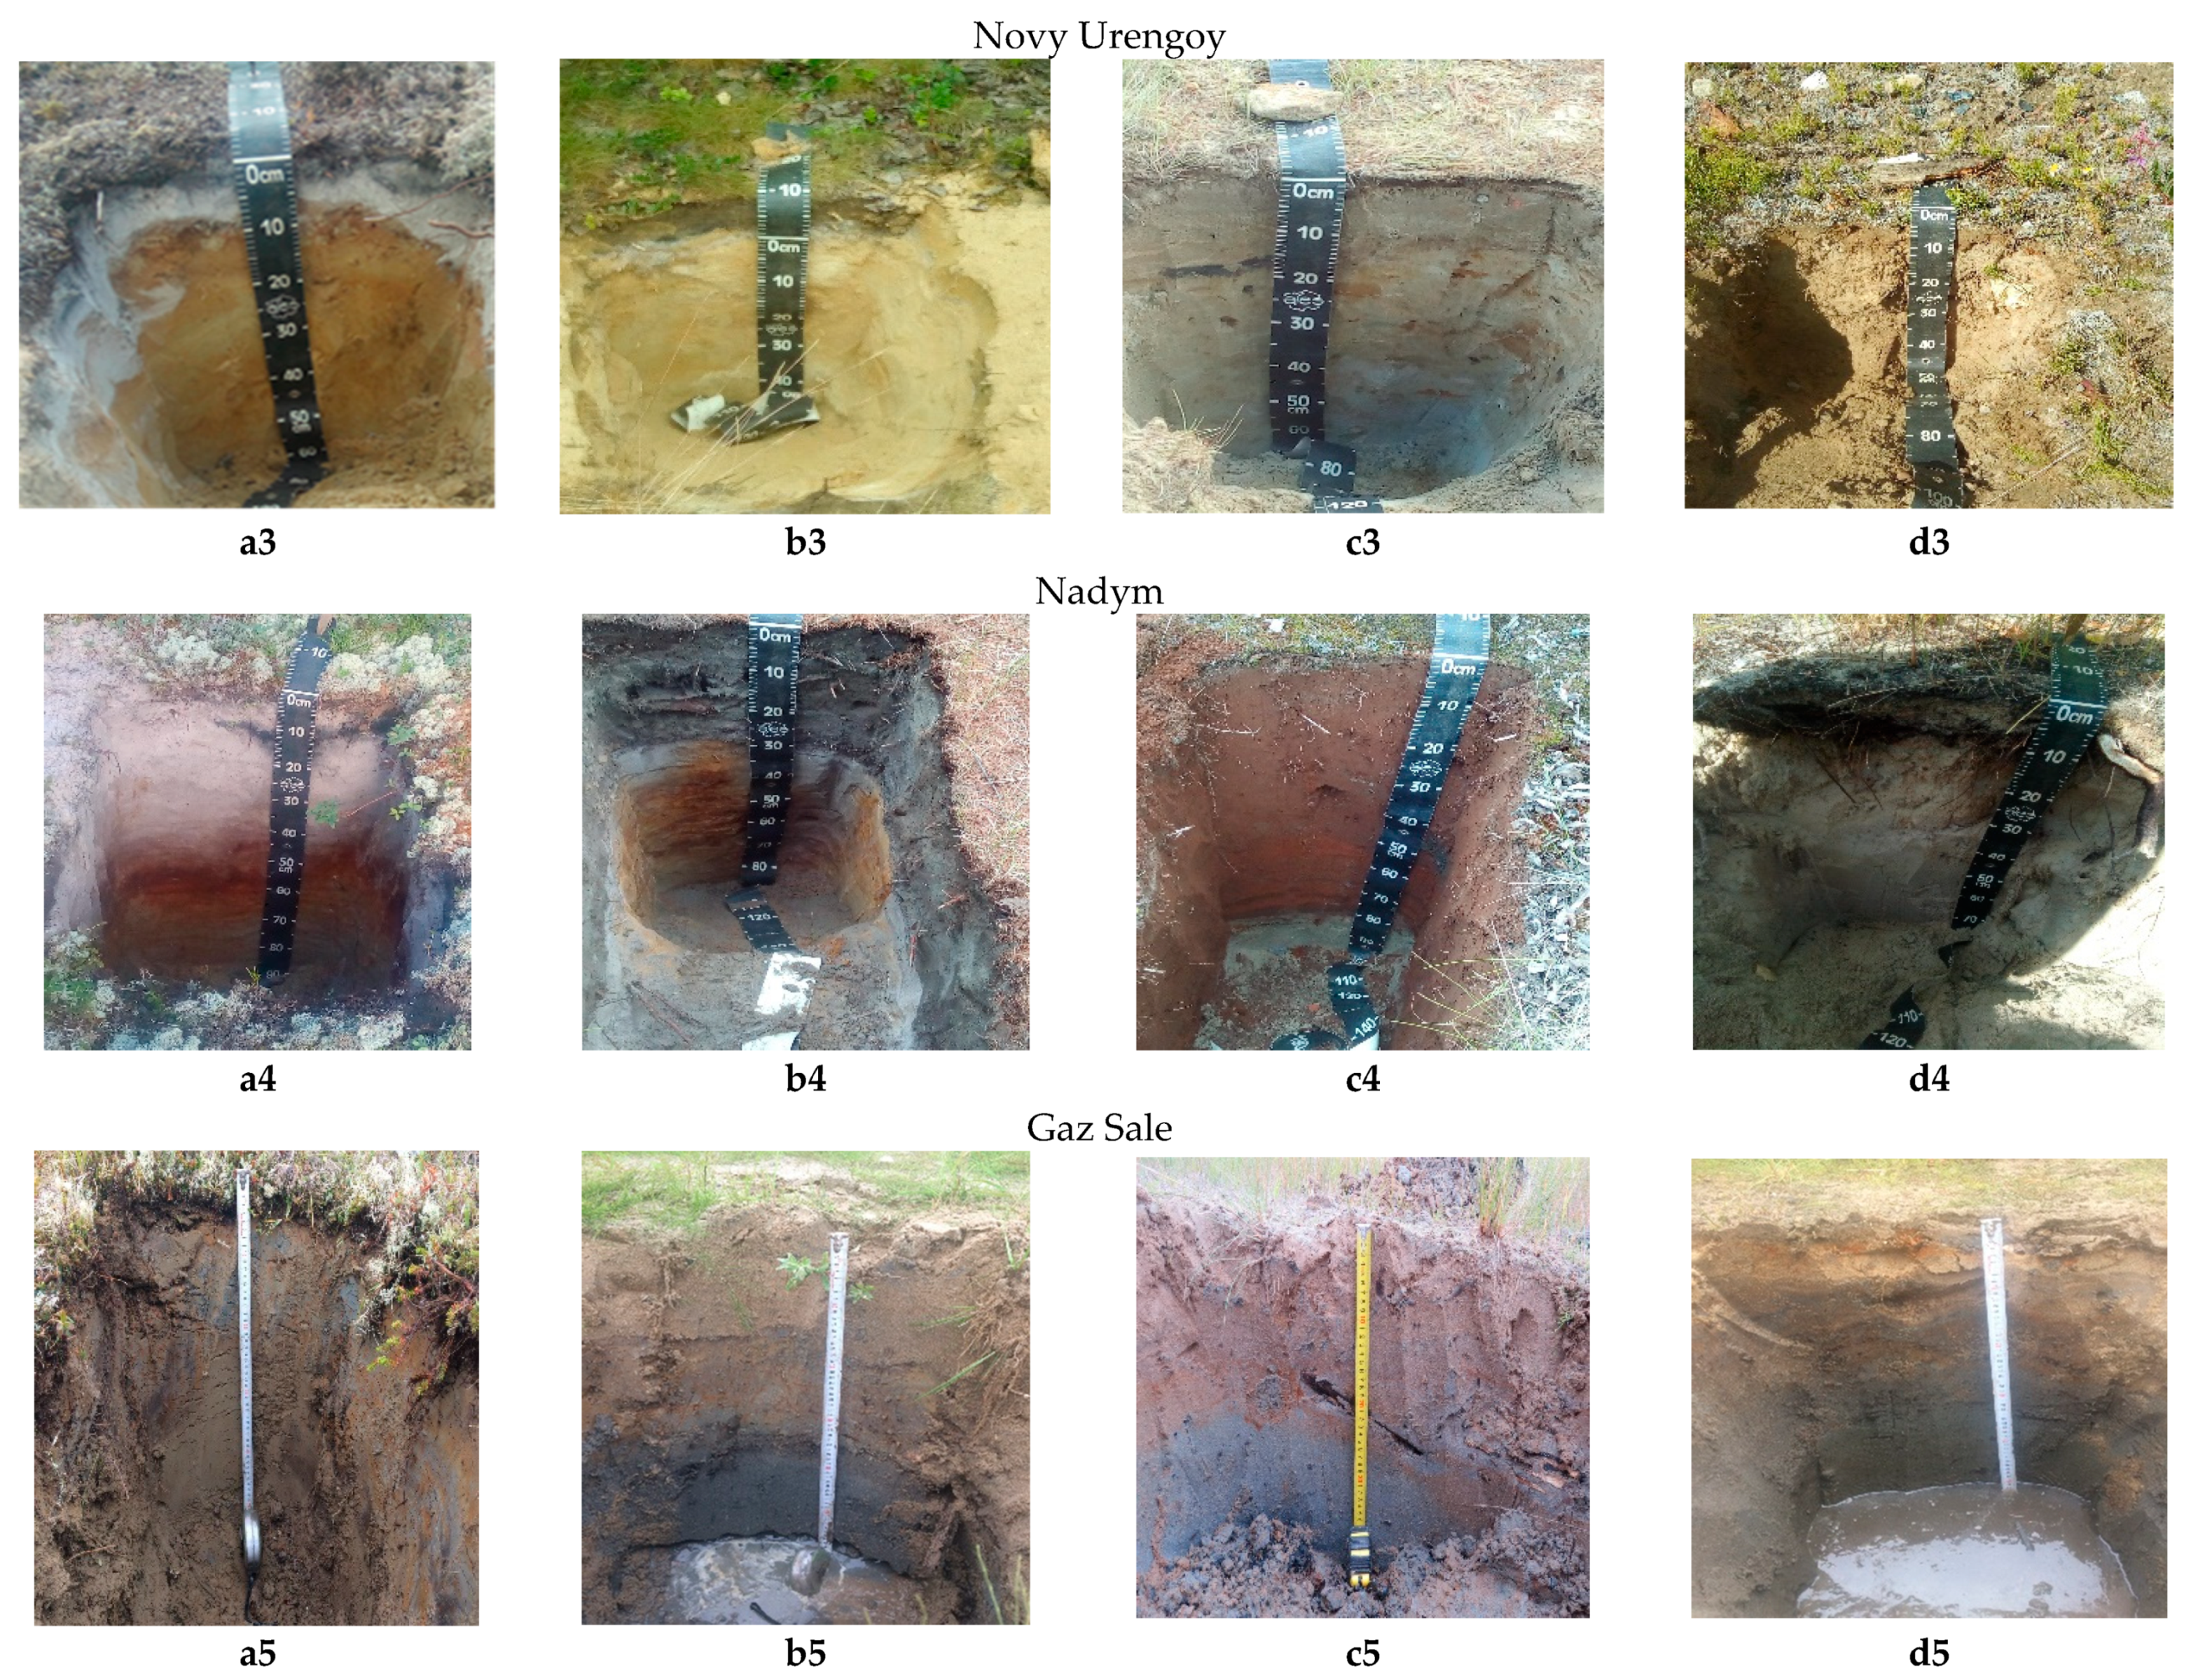
3.1. Bedrock Material

The investigated urban areas are located on modern alluvial floodplain and lake-alluvial sediments. The city of Salekhard and its vicinity are characterized by bedrock of predominantly clay and loamy structure. Urengoy, Nadym, Novy Urengoy and Gaz Sale are located on Quaternary sediments of predominantly sandy composition [40,41] (Figure 2). The particle size distribution of soils in the Yamal region is highly differentiated. In the vicinity of Salekhard, the clay content reaches 28% [42]. In the pristine soils of Belyi Island the content of the clay fraction does not reach 5%, the largest percentage is the sand fraction, its content can reach 78% [43]. In the topsoil horizons in the cities of Gaz-Sale and Urengoy, the content of clay particles does not exceed 12%, the largest proportion in the fine soil is taken by sand particles, and their content can reach 87%.
The bedrock of the soil, located close to the ground surface, largely determines the possibility of implementing municipal and industrial investments [21]. It also influences the behavior of chemical substances from atmospheric emissions [22,44]. Compact clay material with the ability to swell and shrink is defective from the point of view of construction activities as some green areas as well [45]. This favors its removal from the investment area or mixing with skeletal materials, e.g., gravel and construction rubble. Sandy soils are usually treated differently, being easy to build. Nevertheless, they are characterized by high water permeability. As a result, they show a much deeper deposition of pollutants in the soil profile compared to the finer materials [46]. Regardless of texture, soils are affected to varying degrees by the deposition of anthropogenic materials, including construction and municipal waste [47,48,49].

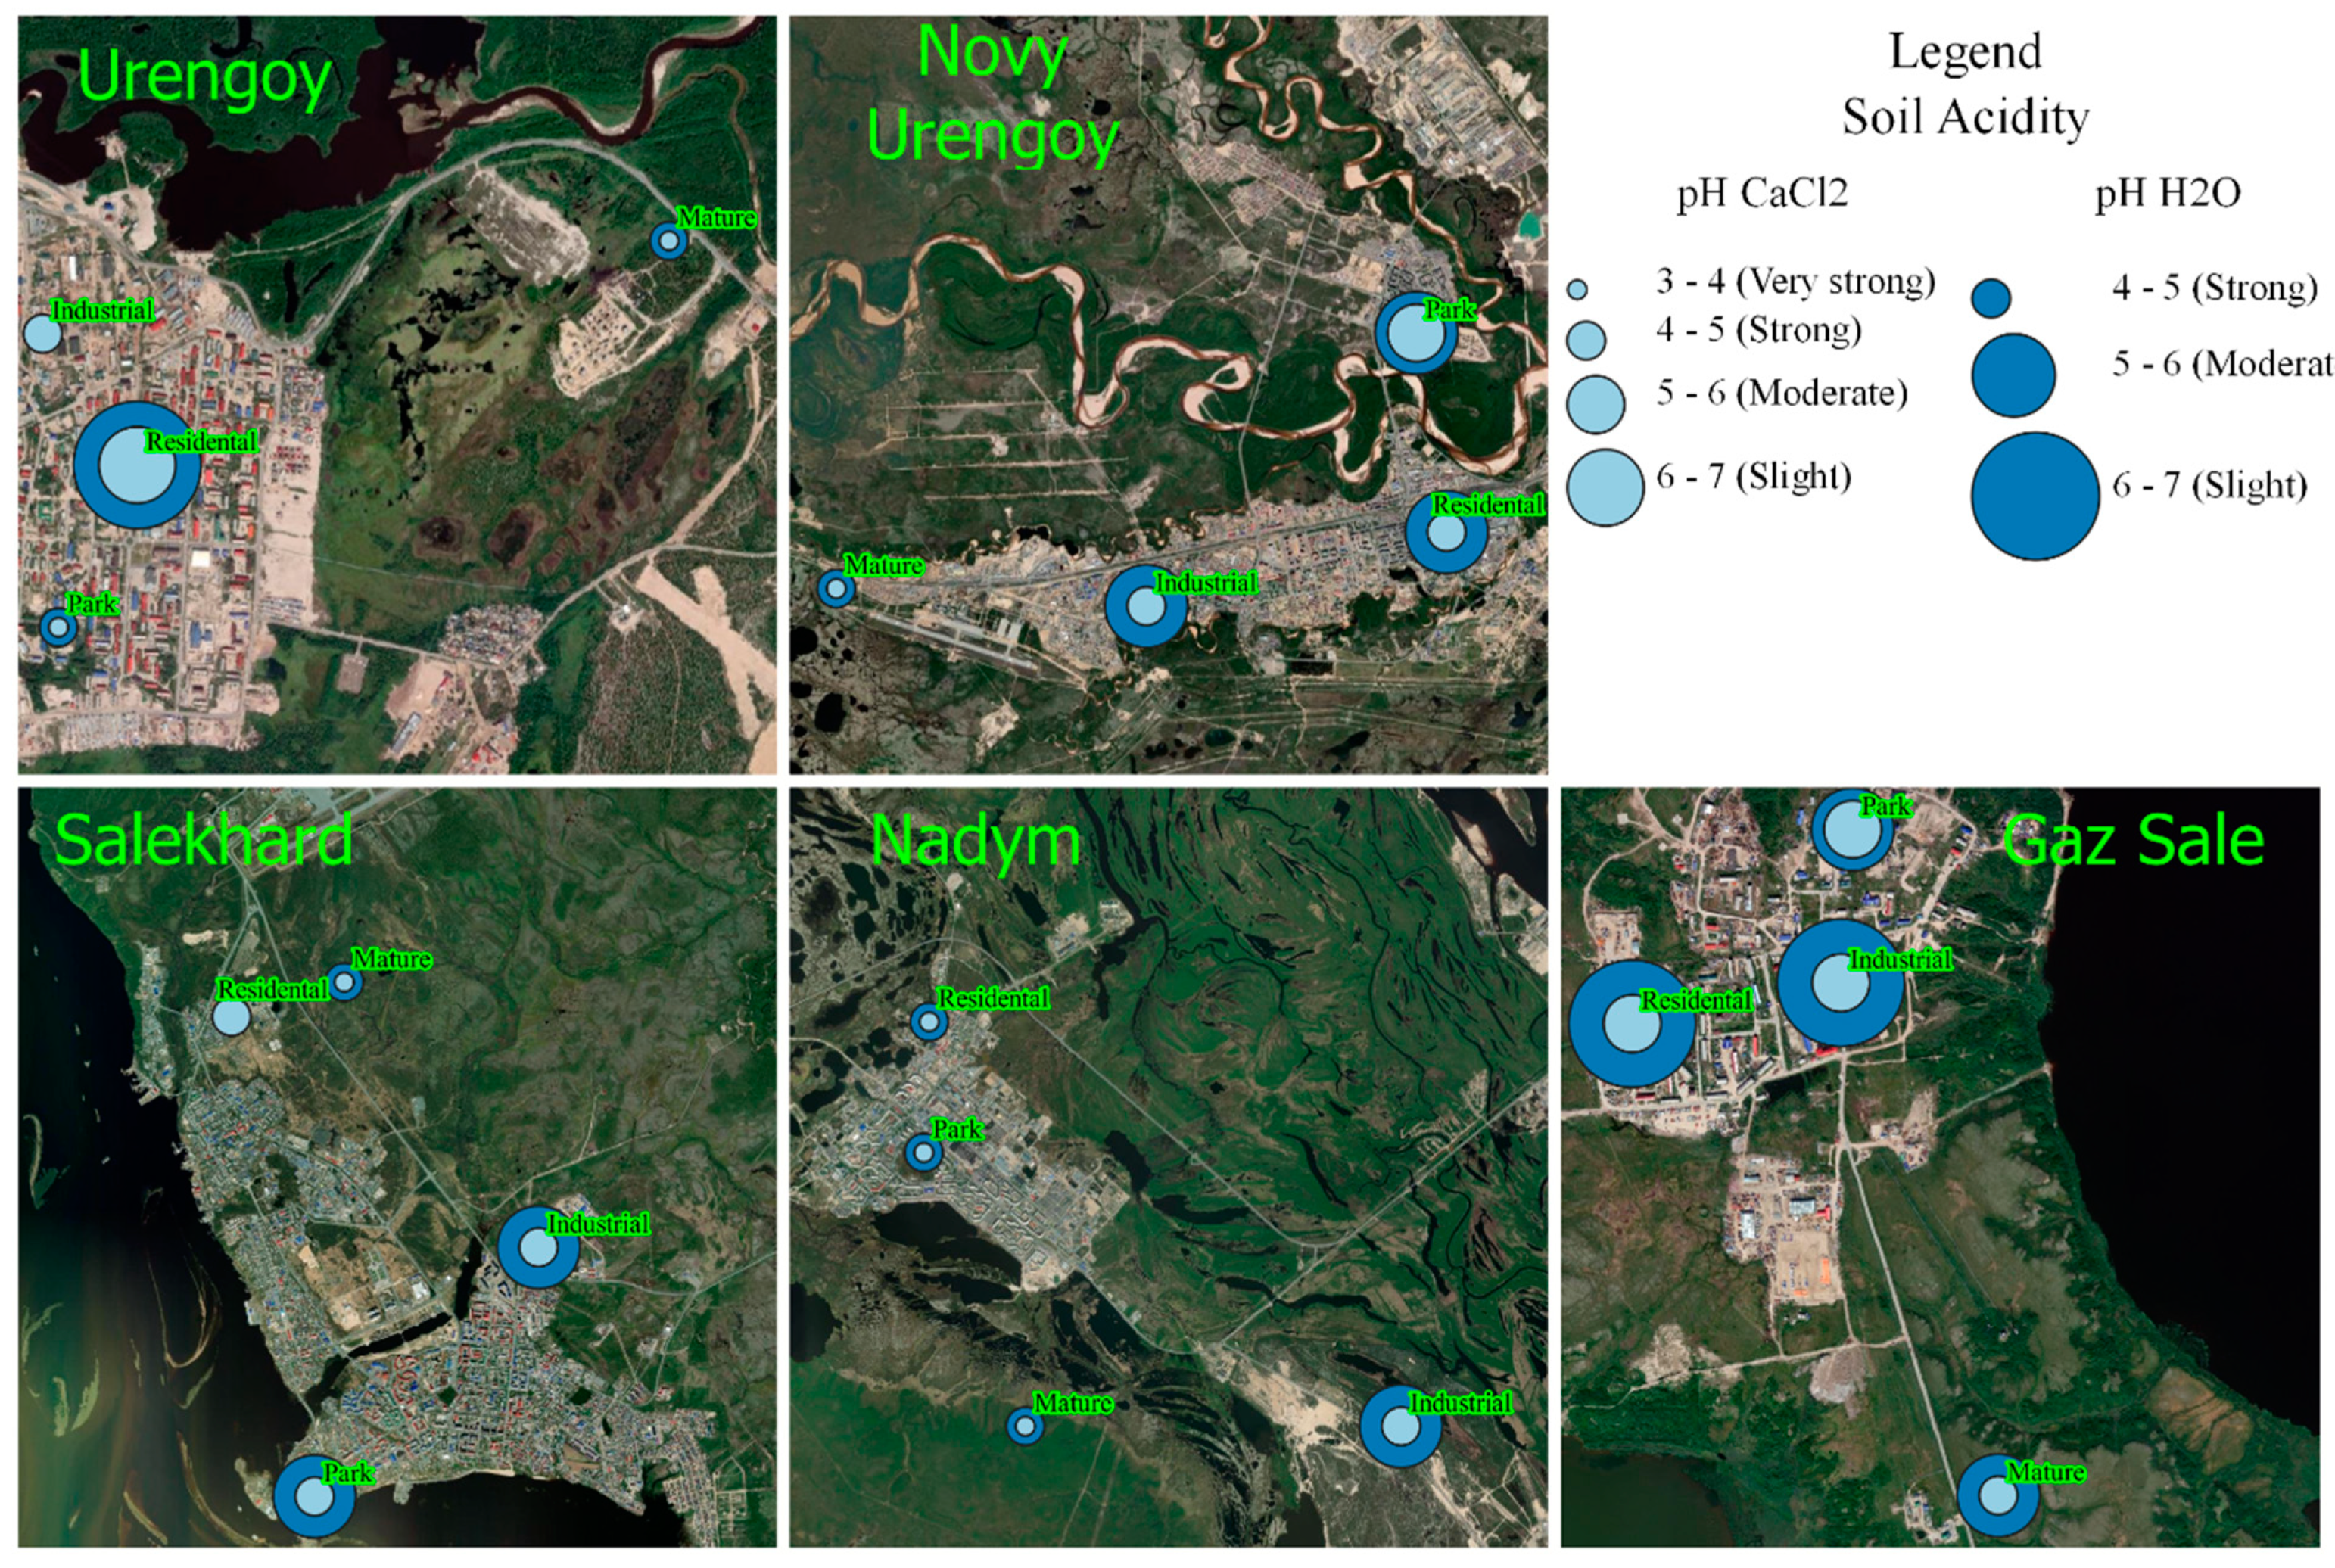
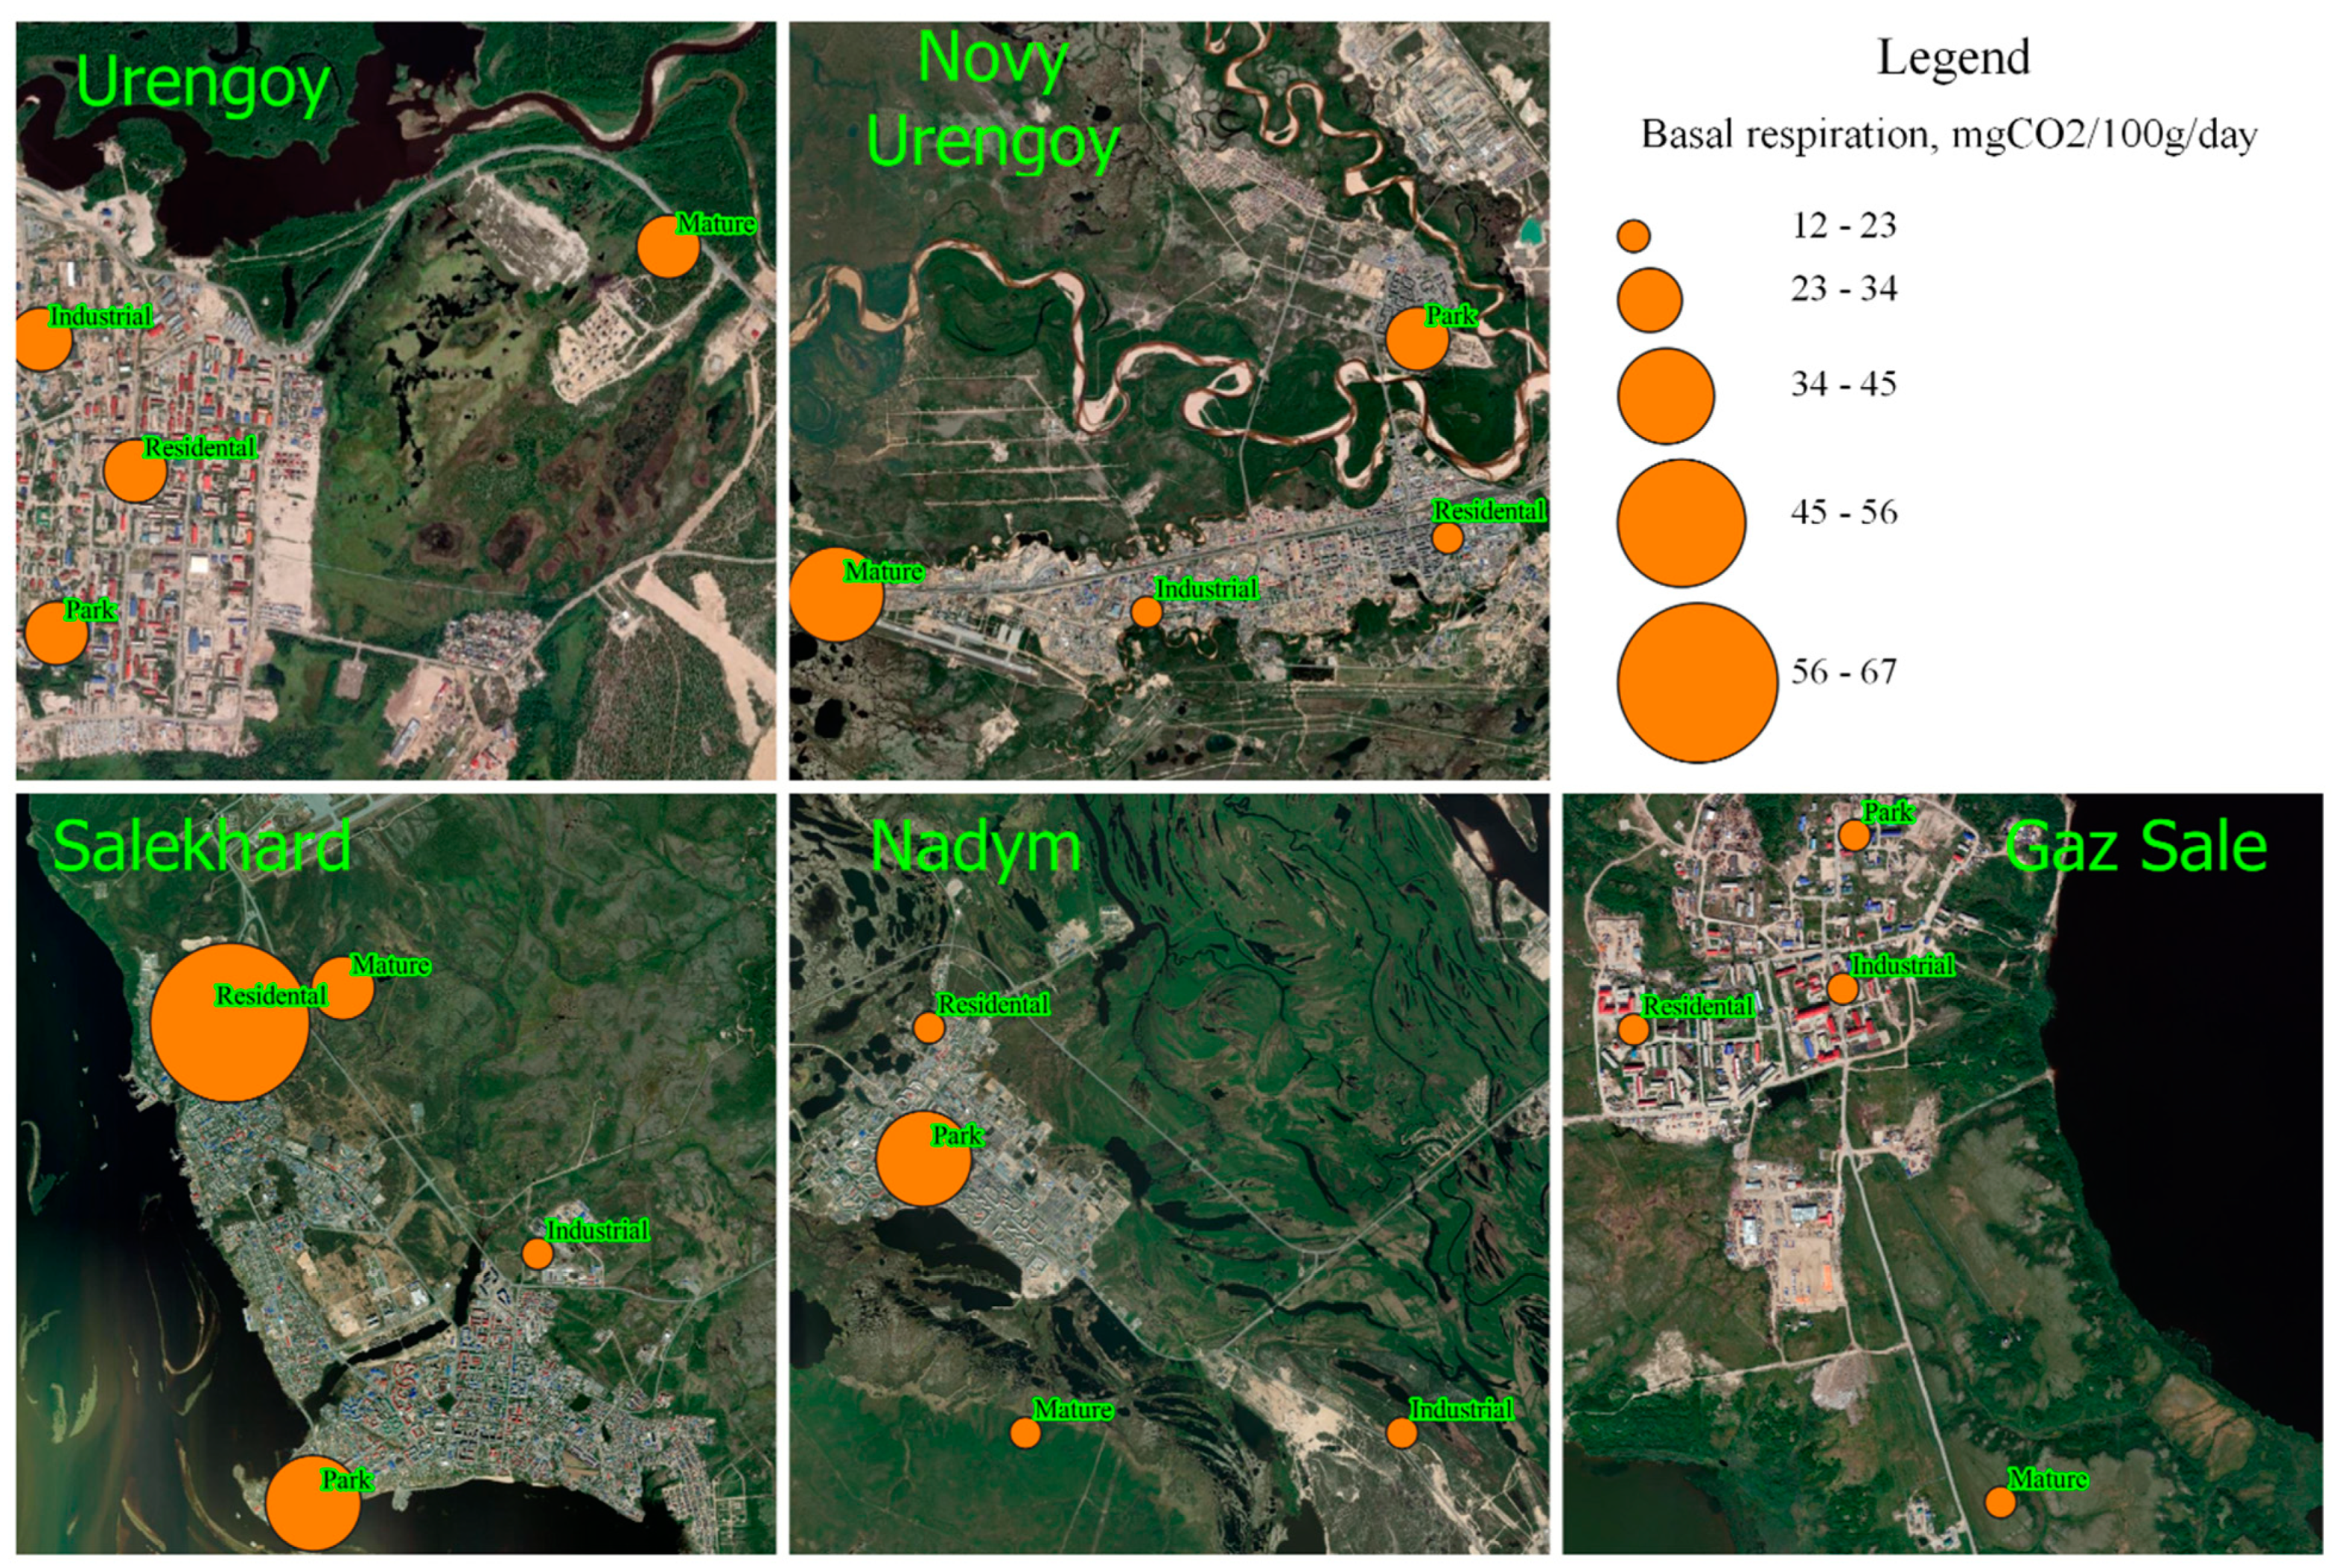
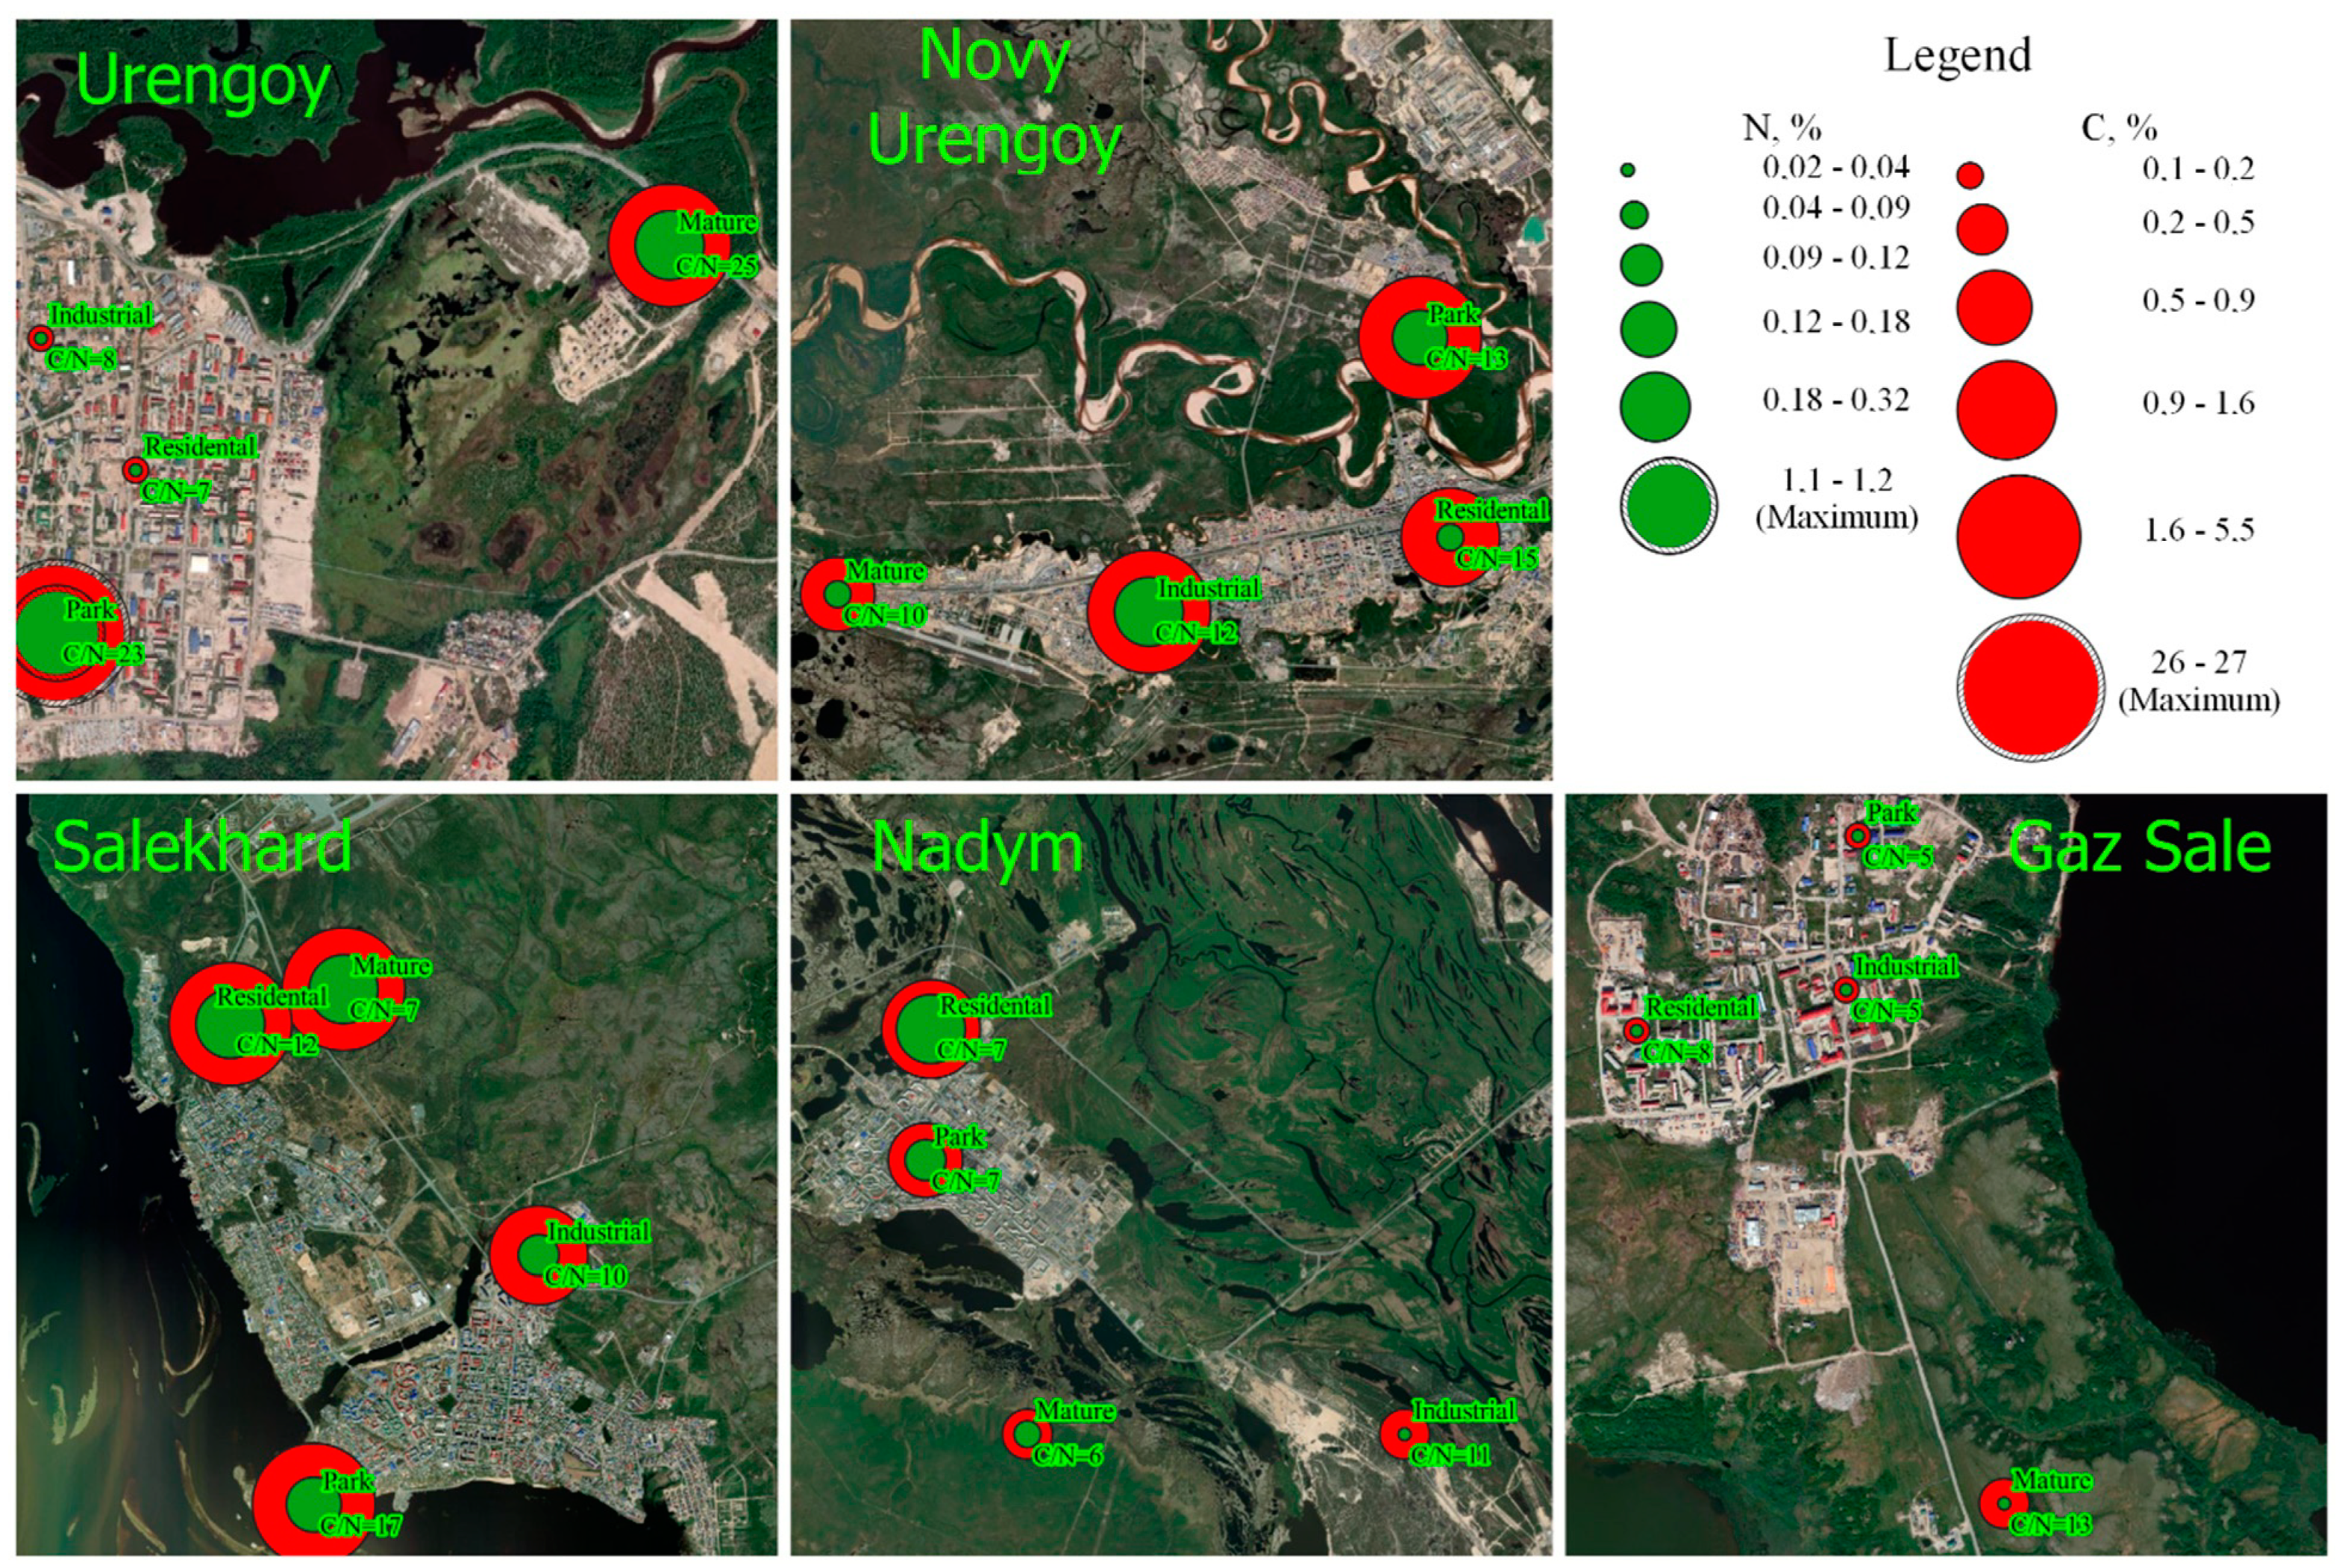
3.2. Main Soil Properties

The analysis of the reaction of the soil solution showed that all of the studied soils are characterized as acidic (pH < 7). There are strong differences between the cities and between the functional zones within the cities (Figure 3).
The soils of the Yamal region are predominantly acidic (pH < 7) [50,51,52,53,54]. For natural Al-Fe humus soils, high acidity is determined by the processes of formation and transposition of humus, aluminum and iron compounds [55]. According to the data given above (Figure 3), it can be seen that in all the studied cities the lowest values of pH are in the functional zone with the lowest anthropogenic load (mature) pH values mainly pH H2O < 5, pH CaCl2 < 4. Within cities, pH values are somewhat higher, especially in residential and industrial areas. Particularly highlighted values of pH in the anthropogenic functional zones of the city of Gaz Sale, here pH is characterized as slightly acidic, may indicate the presence of anthropogenic alkalization of the soil, which is typical for cities with strong industrial development and high traffic load [56,57].
The level of soil basal respiration is highly variable between cities and their functional zones (Figure 4).
In most cases, the maximum level of biological activity is recorded in park and mature areas. Since outside the city and in its green areas the processes of accumulation of soil organic matter occur most actively, it causes a high level of carbon dioxide emissions by soil microorganisms. Nevertheless, the maximum level of carbon dioxide emissions was recorded in the residential area of Salekhard. The minimum values are recorded in the city of Gaz Sale for all its functional areas.
To understand the degree of degradation of soil organic matter and the rate of its mineralization, it is essential to know the ratio of total organic carbon to total nitrogen (C/N). With a permanent source of organic matter, high values indicate good preservation of organic material [58].
At a high rate of mineralization of organic matter for the zone of permafrost spreading, the C/N ratio is usually less than 12, the moderate rate of mineralization corresponds to values of 13–25, at higher values the degree of mineralization is characterized as low [59,60]. For urban and anthropogenically transformed soils, where the processes of fresh organic matter input are highly limited and the soil–plant chain is disrupted, the C/N ratio can fluctuate greatly [61]. Additionally, high values of the C/N ratio may be associated with the presence of aromatic hydrocarbons and petroleum products in anthropogenically disturbed soils [62].
According to our results (Figure 5), we can see that the level of carbon, nitrogen and their ratios are highly variable. For the city of Salekhard, as the largest of the studied cities, the high level of carbon content is associated rather with the accumulation in the surface soil horizons of various oil products for residential and industrial zones.
In the park functional zone of the city, the C/N ratio is 17, which indicates a low rate of mineralization of organic matter and a lack of nitrogen in the soil profile (as leaf litter is removed and it is not retained on the soil surface). In the mature zone, on the contrary, the C/N ratio is 7, there is no deficiency of nitrogen, as the processes of accumulation of organic matter is not disturbed by anthropogenic influences.

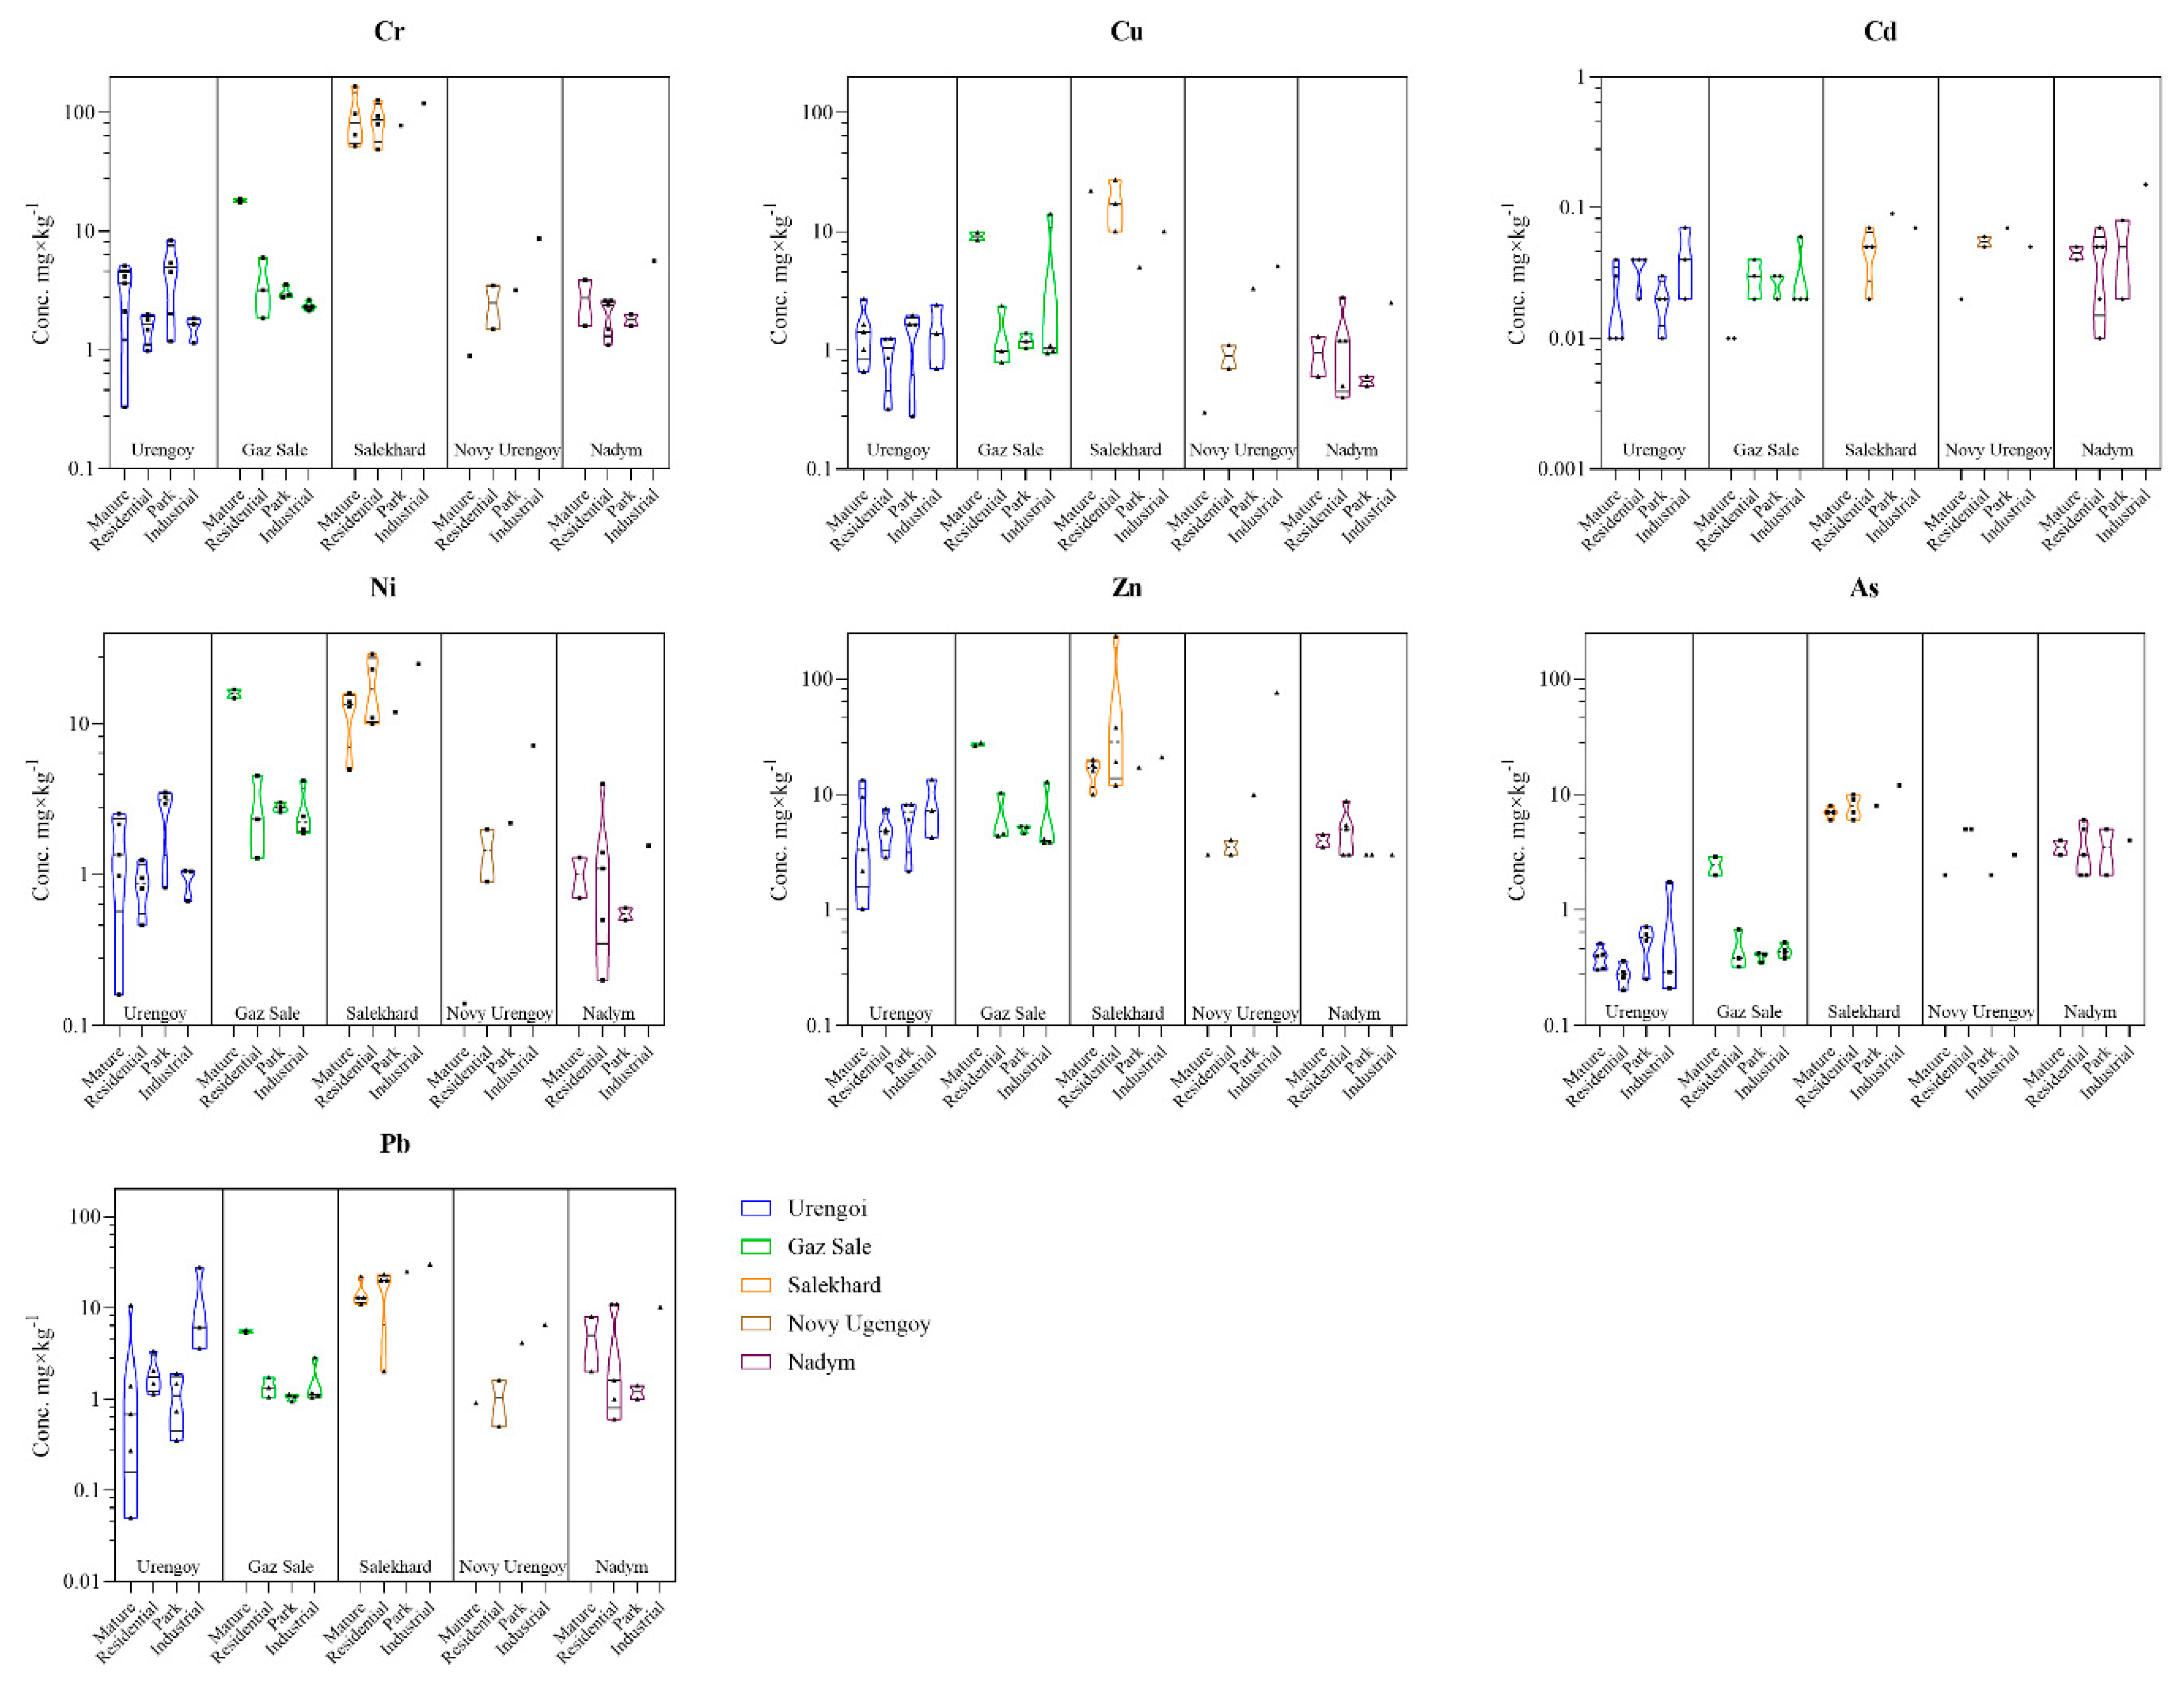
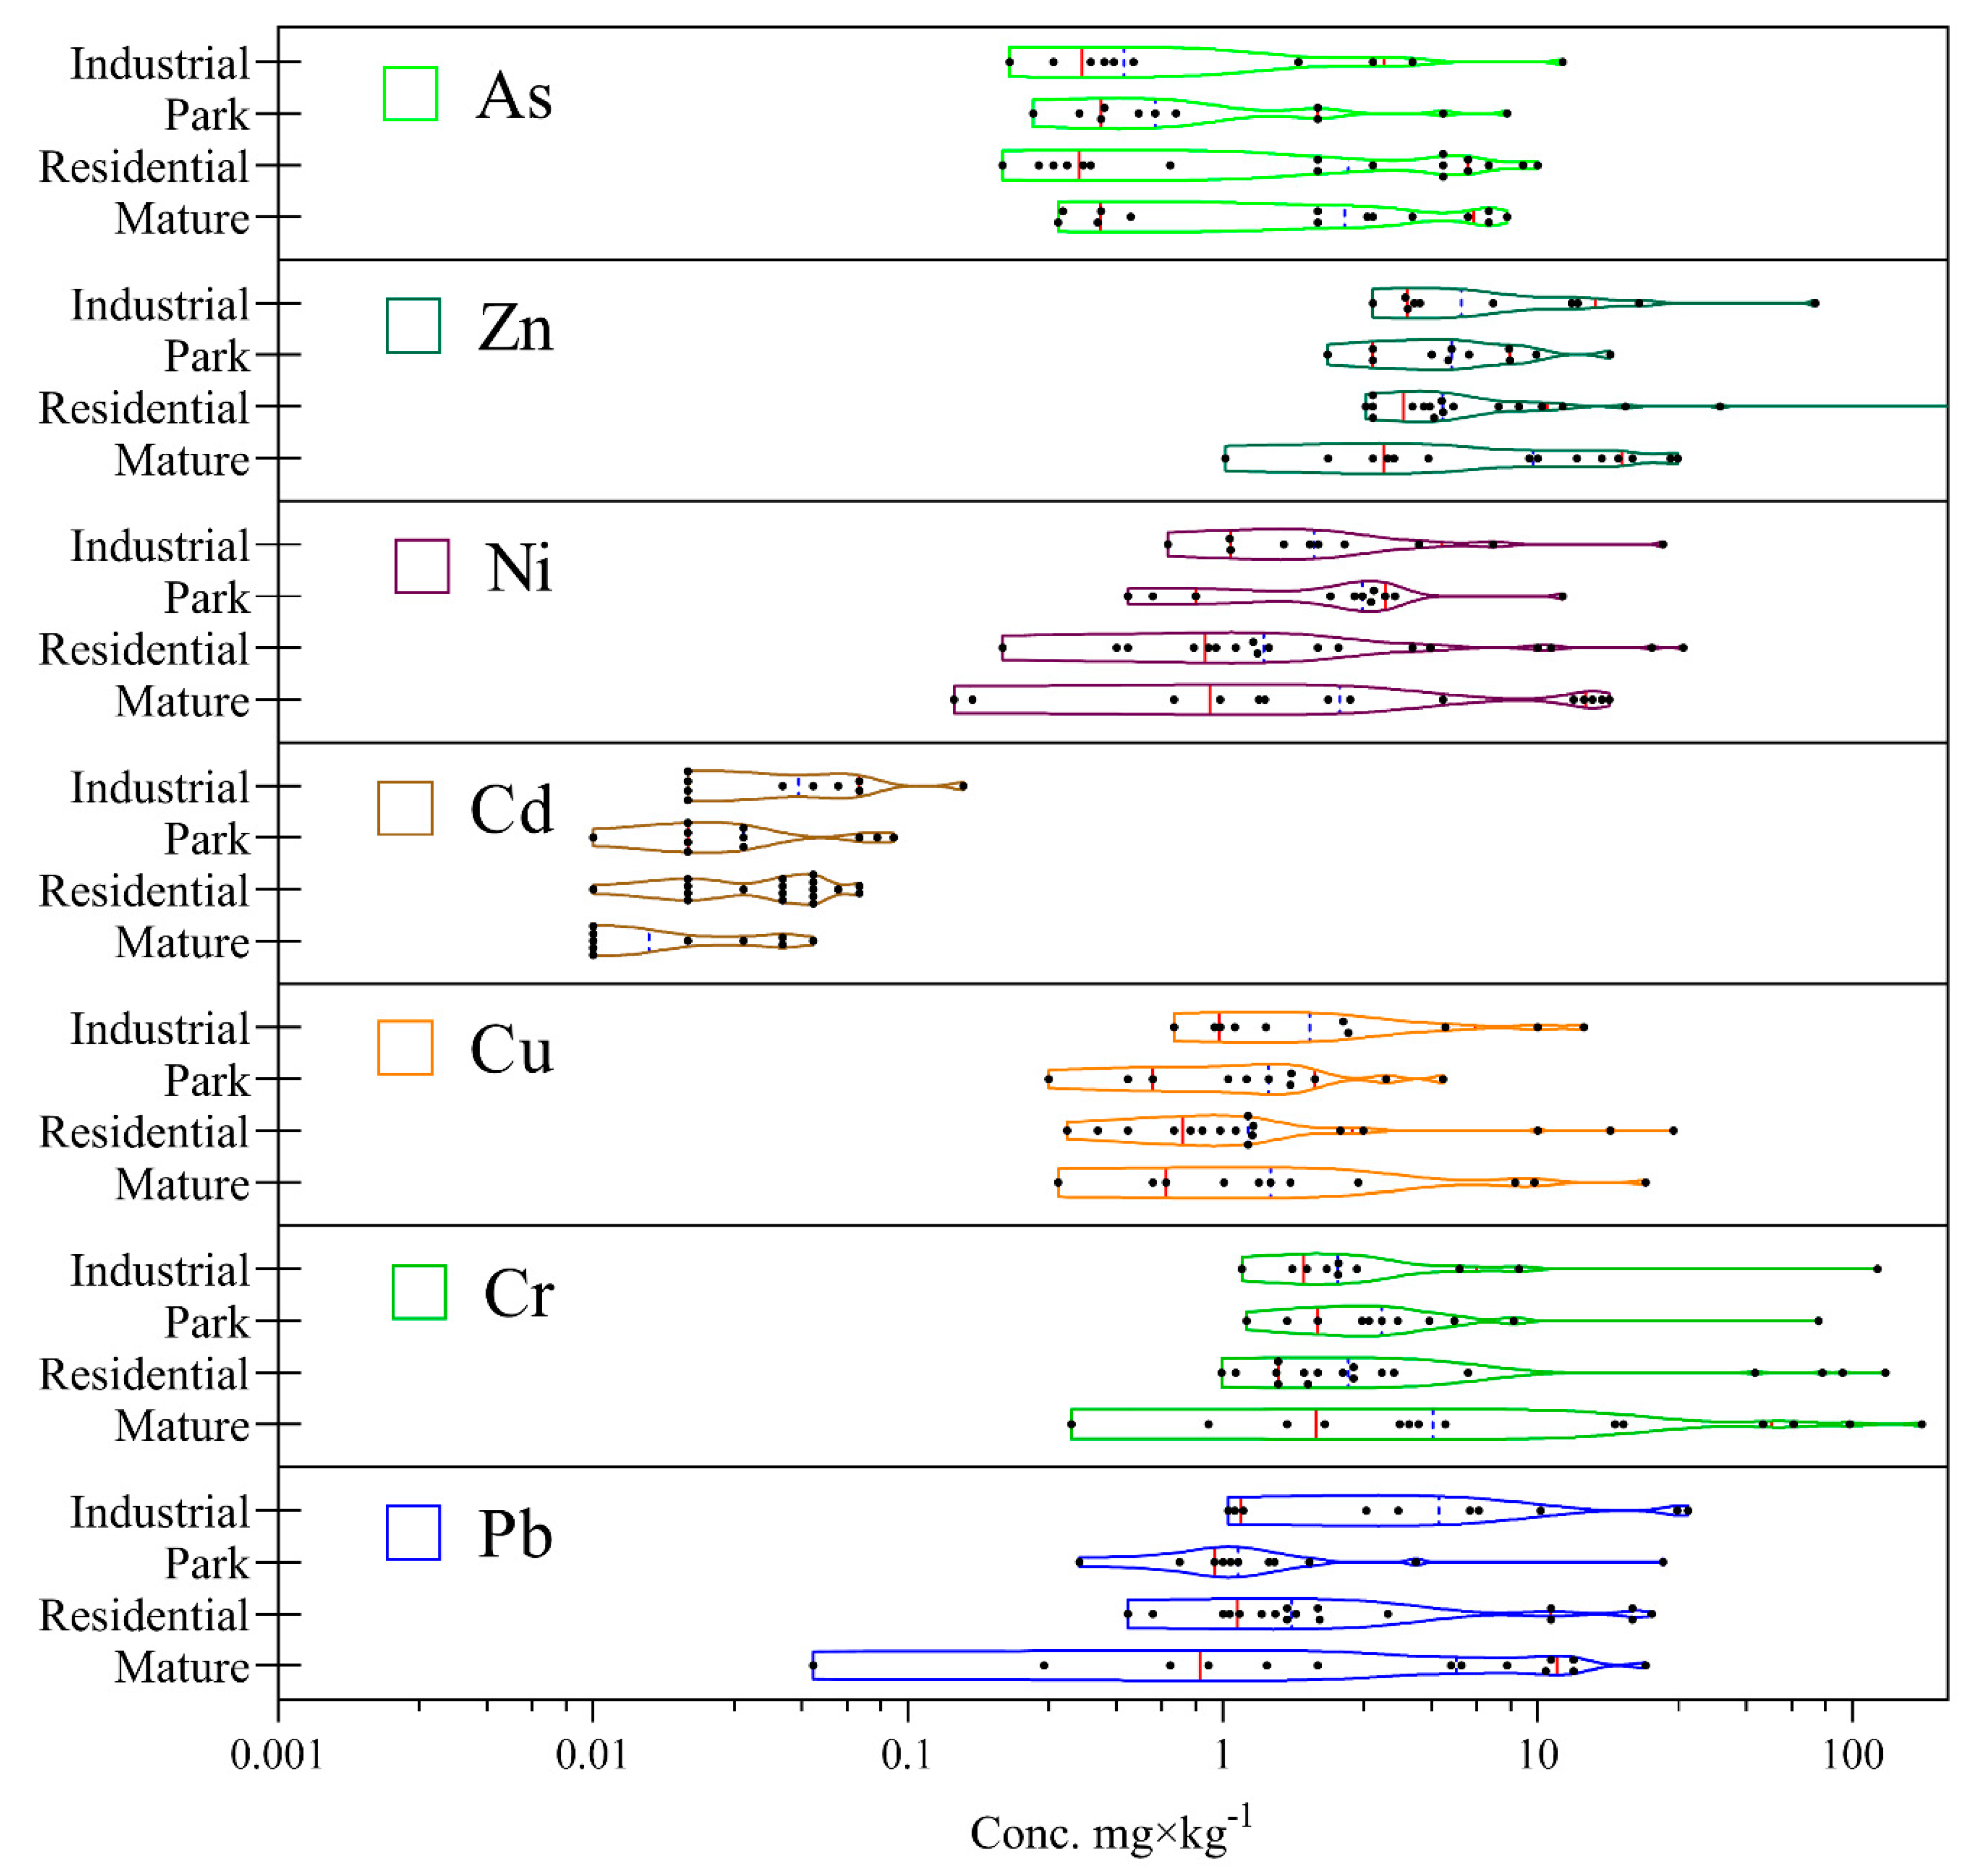
3.3. Trace Metals Content

The soil cover, due to its sorption capacity, accumulates various chemical compounds from artifacts of anthropogenic impact [63,64]. Soils may accumulate various chemical compounds over time and act as geosphere-anthroposphere indicators of changes in environmental properties [65]. Soil absorption capacity depends on many factors, such as local features of soil-forming processes, the enrichment of the surface horizons with organic matter, as well as their particle size distribution [66,67,68,69]. It is known that soils of heavy (with a predominance of clay particles in the fine-grained soil) particle size distribution have a higher sorption capacity [70,71,72].
The accumulation of trace metals in the soil profile is one of many negative environmental factors of anthropogenic impact on ecosystems [24,73,74]. The harmful effects of trace metals on human health and their effects on plant productivity are well understood, and some heavy metals also have carcinogenic and mutagenic effects [75,76]. Trace metals are satellites of industrial production processes, combustion of fossil fuels in the engines of motor vehicles and from various fuel and energy enterprises [65,77,78].
The level of soil contamination by trace metals in various urban functional zones is an indicator of excessive anthropogenic impact both in the past and at the present time [79]. The results obtained in the process of our investigation reflect not only the results of the anthropogenic pressure stretched over time on urban ecosystems, but also confirm the working hypothesis about the differences in the sorption capacities of soils of fundamentally different particle size distribution. Under conditions of climate homogeneity in the studied area, the processes of soil formation (and as a consequence, the sorption capacity of soils to accumulate trace metals) are mainly determined by lithogenic conditions, landscape features [80], and the time factor of anthropogenic pressure. Urban conditions in any part of the world can hardly be called homogeneous in terms of micro-landscape diversity. Differences are visible even at the level of functional zones, if the park area represents landscapes close to natural (but still modified in the process of urban development), the residential and industrial areas represent a completely transformed landscape, subjected to constant anthropogenic load.
As can be seen in Figure 6, among all the cities we investigated, the content of trace metals in the soils of Salekhard stands out, and in all the studied functional zones. Compared to other cities, the content of Cr, Cu, Ni, Zn and As is higher in Salekhard soils. Differentiation of metal concentrations in the functional zones of Salekhard is marked by high concentrations of Cu in the residential zone, Cd in the park zone, a very high (>120 mg × kg−1) concentration of Zn in the residential zone and an increased concentration of As in the industrial zone. For other cities, the highest levels of metal content were recorded mainly in industrial and residential areas. The highest Cd concentrations were found in the industrial areas of Nadym, Urengoy and Gaz Sale. A similar situation was observed for Cu concentrations, with the highest values observed in industrial and residential zones.
Particular attention should be paid to the high values of metal concentrations in the mature areas. In Gaz Sale, the maximum concentrations of Cr, Ni, Cu, Zn, As and Pb are registered exactly in the mature zones, such a situation may be due to both the past raw anthropogenic impact, and the peculiarities of the selected location for sampling. Samples were taken close to a major road, and metals could get into the soil with runoff from the roadway.
To understand the variability in metal content within each functional zone (not including cities), violin diagrams of the content of each studied element within each studied zone were plotted (Figure 7). It is well seen that the concentration of trace metals mainly ranges from 0.1 to 10 mg × kg−1 (except for Cd). The peak values occur in the soils of the functional zones of Salekhard (Figure 6). Thus, the variation in metal concentrations between the functional zones of the young cities (Urengoy, Nadym, Gaz Sale, Novy Urengoy) is not so pronounced.
We analyzed the literature for studies on the content of metals in natural and anthropogenically loaded soils in the Yamal region. Analysis of trace metal content in soils according to literature sources (Table 3) shows a high differentiation of concentrations both within individual cities and between urbanized and pristine areas. The largest differences for undisturbed areas are reflected in the work [50,81], concentrations of Pb, Cr, As and Zn vary greatly within a single zone of the Gydan Peninsula [82] recorded strong differences in Pb and Cu content in the Kharsaim city. In most other sources, metal concentrations do not widely differ within the same study area.
Compared with the data obtained in our study, the greatest differences are noted in the concentrations of As, especially with the results obtained for the city of Salekhard. For the soils of Novy Urengoy, our data are very different from those previously published, our recorded Zn content in the industrial zone more than two times higher than the published values for urban soils. Cr and Ni concentrations also strongly differ by more than twice. Combining the literature and our data we can say that our recorded concentrations of trace metals in urban soils are predominantly higher compared to those previously published, especially differing concentrations of their industrial and residential functional zones we studied.

3.4. Multivariate Analysis of Variance and Correlation Analysis

To support the working hypothesis of the difference between the cities in the context of metal content, a statistical backtracking of the resulting concentration data set was performed. A multivariate analysis of variance (MANOVA) was conducted, and the following factors were taken as factors: city, functional zones within cities, and the cross-influence of these factors. As a result (Table 4), the city factor was found to be significant (p < 0.0001), and consequently the influence of the particle size distribution and duration of anthropogenic pressure on the concentration of metals in the surface horizon of urban soils.
A more detailed analysis for each metal (Table 5) revealed differences (p < 0.01) between concentrations by city in concentrations of Pb, Cr, Ni, and As.
The correlation analysis revealed the relationship of concentrations of some metals with the main soil properties. As can be seen in Table 6, the content of Pb, Cr, Ni and As is in direct correlation with the content of nitrogen and carbon in the soil profile; although the correlation coefficient in most cases does not exceed 0.6 this relationship is recognized as significant. Additionally, most trace metals are inversely related to pH values, but the highest and significant correlation coefficients with pH values were found for As.

3.5. Qualitative Assessment of Soil Contamination by Trace Metals

Qualitative assessment of soil contamination in the Arctic cities showed strong differences between the cities studied.
Among all the metals studied, Cd pollution was found to be the most significant for almost all cities and their functional zones according to Igeo index calculations (Table 7). The soils of Salekhard were found to be the most contaminated with Pb, Cr, Cd and As. For Pb and As, the character of contamination of all functional zones is assessed as moderately polluted for Cr and Cd the character of pollution is assessed as moderately to highly polluted.
For other cities, point pollution in different functional zones was detected: Gaz Sale, mature zone—Cr—unpolluted to moderately polluted; Nadym, residential, park and industrial zones—Pb and As—unpolluted to moderately polluted. Additionally, in Novy Urengoy, the pollution by Zn and As in industrial and residential zones is estimated as unpolluted to moderately polluted.
Application of the pollution index mainly showed results identical to the Igeo index, the soils of Salekhard city and its functional zones were recognized as the most polluted. The character of soil contamination in most cases is assessed as strong. The maximum values are revealed for Cr in all functional zones of the city of Salekhard, the nature of the occultation is assessed as very strong.
Application of the Pollution Load Index (PLI) showed (Table 8) that soils in all functional zones of the city of Salekhard, mature zone of Gaz Sale and the industrial zone of Novy Urengoy are rated as deterioration of soil quality.

4. Conclusions

Although the traditional understanding of soil formation according to states of Dokuchaev and his followers is the equality of soil-forming factors, among which climate is a key determinant, in the Arctic under homogeneous humid climate conditions more attention should be paid to the lithogenic diversity and its influence on the soil cover. The investigation of soil urban ecosystems is largely complicated by a complex system of anthropogenic transformations of local landscapes in the territory of a single city. Thus, although the studied soils are in autonomous conditions at the level of the region, anthropogenic transformations of the city make it impossible to recognize them as truly autonomous. It is necessary to speak about heteronomous urban conditions of soil formation in humid climatic settings. Therefore, soil formation in urban ecosystems will be less diverse as compared to pristine areas. Taking into account similar climatic conditions and based mainly on the difference in the lithogenic structure of the bedrock and the time factor of anthropogenic impact, our study shows the relationship between these factors and the nature of accumulation of trace metals in the soils we investigated.
The city of Salekhard, whose territory is predominantly located on clay alluvial deposits, and which has a long history of anthropogenic pressure is logically characterized by a high content of trace metals in the topsoil. The absorption capacity of clay minerals backed up by a long-term anthropogenic load explains the high content of metals in the soils of Salekhard in all the studied functional urban zones.
Younger cities located on sandy textured parent materials are characterized by a lower degree of soil contamination with heavy metals. Evidently the lower sorption capacity of sandy soils can be offset by extreme levels of anthropogenic load, this is clearly seen in the content of metals in industrial areas. Local maximum content of Cu is observed in the industrial zone of Gaz Sale and Novy Urengoy, the highest Cd concentration is recorded in the soils of the industrial zone of Nadym, the concentration of Ni in the industrial zone of Novy Urengoy is also the highest. However, these local maximums in some cases are quantitatively lower compared to all studied functional zones of Salekhard.
The situation described above also found validation in the statistical analysis of the dataset. Significant statistical differences were found between the soils of different cities (p < 0.0001), but not the functional zones within the city. The cross-influence of the city and functional zone was also found to be not significant.
Qualitative assessment of the pollution level is consistent with the situation described above; the application of various soil quality indices showed that the soils of Salekhard city are under significant anthropogenic pressure. While, for the other studied cities the level of soil contamination is characterized as minor (except for Cd contamination, it was found for almost all the functional zones of all the studied cities). Additionally, according to the calculated value of the index PI for some functional zones of the young cities’ pollution of As is at medium and high levels. Particular attention should be paid to the vicinity of Gaz Sale city, here, according to PI index calculations, the character of Pb, As and Cr pollution is qualified as high, probably it is connected with the sampling place, which is 150 m from the road, and there is a migration of these elements with emissions from motor vehicles.

Author Contributions

T.N.—writing and laboratory research, E.A.—data curation, funding, field research, methodology, visualization, writing, E.M.—conceptualization, A.P.—soil survey, J.K.—formal analysis, writing, supervision, validation, A.G.—formal analysis, funding, writing, supervision. All authors have read and agreed to the published version of the manuscript.

Funding

This research was supported by Russian Foundation for Basic Research, 19-416-890002 (RFBR-Yamal), 19-05-50107 (RFBR) and by the Ministry of Science and Higher Education of the Republic of Poland, Project number 507-07-02-01.

Data Availability Statement

The data that support the findings of this study are available from the corresponding author, upon reasonable request.

Acknowledgments

Some of the laboratory work was performed in the Research Park of St. Petersburg State University’s Chemical Analysis and Materials Research Center Resource Centers. Field work was assisted by Department of Science and Innovation of Yamal-Nenets Autonomous District, Russia.

Conflicts of Interest

The authors declare no conflict of interest.

References

  1. The United Nations. The World’s Cities in 2018. Department of Economic and Social Affairs, Population Division, World Urban. Prospect; The United Nations: New York, NY, USA, 2018; pp. 1–34. [Google Scholar]
  2. Zamyatina, N.; Goncharov, R. Arctic urbanization: Tesilience in a condition of permanent instability—The case of Russian Arctic cities. In Resilience and Urban Disasters; Edward Elgar Publishing: Northampton, MA, USA, 2019. [Google Scholar]
  3. Moskalenko, N. Anthropogenic Changes of Ecosystems in the West-Siberian Gas Province; RAS Siberian Branch: Earth’s Cryosphere Institute Press: Novosibirsk, Russia, 2005; p. 357. ISBN 5-85941-131-6. (In Russian) [Google Scholar]
  4. Alekseev, V. Istoriia Iamala. Hist. Yamal 2010, 1, 420. (In Russian) [Google Scholar]
  5. Detter, G.F. Models for development of resources and territories of the Yamal-Nenets Autonomous District 1. Arkhangelsk Russ. 2017, 26, 89. [Google Scholar] [CrossRef]
  6. Agranat, G. Regional Problems of Research and Development of the North. Soviet Geogr. 1974, 15, 95–109. (In Russian) [Google Scholar] [CrossRef]
  7. Slavin, S.; Severa, O. The Development of the North; Moscow: Moscow, Russia, 1975; 198p. (In Russian) [Google Scholar]
  8. Maximova, D. Sustainable Development of the Russian Arctic Zone: Challenges & Opportunities. Arctic Yearbook 2018. 2018. Available online: https://arcticyearbook.com/images/yearbook/2018/Scholarly_Papers/21_AY2018_Maximova.pdf (accessed on 24 May 2021).
  9. Hardoy, J.E.; Mitlin, D.; Satterthwaite, D. Environmental Problems in an Urbanizing World: Finding Solutions in Cities in Africa, Asia and Latin America; Routledge: London, UK, 2019. [Google Scholar]
  10. Grimm, N.B.; Faeth, S.H.; Golubiewski, N.E.; Redman, C.L.; Wu, J.; Bai, X.; Briggs, J.M. Global change and the ecology of cities. Science 2008, 319, 756–760. [Google Scholar] [CrossRef] [PubMed] [Green Version]
  11. Wu, J.; Xiang, W.-N.; Zhao, J. Urban ecology in China: Historical developments and future directions. Landsc. Urban Plan. 2014, 125, 222–233. [Google Scholar] [CrossRef]
  12. Sukopp, H. Urban Ecology—Scientific and Practical Aspects; Springer: Berlin, Germany, 1998; pp. 3–16. [Google Scholar] [CrossRef]
  13. Charzyński, P.; Hulisz, P.; Bednarek, R.M. Technogenic Soils of Poland; Polish Society of Soil Science Torun: Torun, Poland, 2013. [Google Scholar]
  14. Vasenev, V.; Dovletyarova, E.; Cheng, Z.; Prokof’eva, T.V.; Morel, J.L.; Ananyeva, N.D. Urbanization: Challenge and Opportunity for Soil Functions and Ecosystem Services. In Proceedings of the 9th SUITMA Congress, Moscow, Russia, 7–22 May 2018. [Google Scholar]
  15. Dutta, K.; Schuur, E.; Neff, J.; Zimov, S. Potential carbon release from permafrost soils of Northeastern Siberia. Glob. Chang. Biol. 2006, 12, 2336–2351. [Google Scholar] [CrossRef]
  16. Vasiliev, A.A.; Drozdov, D.S.; Gravis, A.G.; Malkova, G.V.; Nyland, K.E.; Streletskiy, D.A. Permafrost degradation in the western Russian arctic. Environ. Res. Lett. 2020, 15, 045001. [Google Scholar] [CrossRef]
  17. Stolbovoi, V.; Savin, I.; Sheremet, B.; Kolesnikova, L.; Gradusov, B.; Rojkov, V.; Shishov, L.; Sizov, V. Land Resources of Russia; National Snow and Ice Data Center: Boulder, CO, USA, 2002. [Google Scholar]
  18. Zubrzycki, S.; Kutzbach, L.; Pfeiffer, E.-M. Permafrost-affected soils and their carbon pools with a focus on the Russian Arctic. Solid Earth 2014, 5, 595–609. [Google Scholar] [CrossRef] [Green Version]
  19. Greinert, A. Functions of Soils in the Urban Environment. Soils within Cities. Global Approaches to their Sustainable Management; Schweizerbat Science Publishers: Stuttgart, Germany, 2017; pp. 43–52. [Google Scholar]
  20. Greinert, A. The heterogeneity of urban soils in the light of their properties. J. Soils Sediments 2015, 15, 1725–1737. [Google Scholar] [CrossRef] [Green Version]
  21. Kostecki, J.; Greinert, A.; Wasylewicz, R.; Adam, R.; Garbera, B.; Knap, P.; Ostapkowicz, M.; Stanisławiak, B. Spatial distribution of heavy metals in the topsoil on roundabouts in Zielona Góra, Poland. Environ. Prot. Nat. Resour. 2015, 26, 1–8. [Google Scholar] [CrossRef] [Green Version]
  22. Greinert, A. Studies of Soils in the Zielona Góra Urban Area; Oficyna Wydawnicza Uniwersytetu Zielonogórskiego: Zielona Góra, Poland, 2003; p. 168. (In Polish) [Google Scholar]
  23. Greinert, A.; Kostecki, J. Anthropogenic materials as bedrock of Urban Technosols. In Proceedings of the International Congress on Soils of Urban, Industrial, Traffic, Mining and Military Areas, Moscow, Russia, 21–26 May 2017; pp. 11–20. [Google Scholar]
  24. Dube, A.; Zbytniewski, R.; Kowalkowski, T.; Cukrowska, E.; Buszewski, B. Adsorption and migration of heavy metals in soil. Pol. J. Environ. Stud. 2001, 10, 1–10. [Google Scholar]
  25. Yu, S.; Li, X.D. Distribution, availability, and sources of trace metals in different particle size fractions of urban soils in Hong Kong: Implications for assessing the risk to human health. Environ. Pollut. 2011, 159, 1317–1326. [Google Scholar]
  26. Ji, X.; Abakumov, E.; Polyakov, V. Assessments of pollution status and human health risk of heavy metals in permafrost-affected soils and lichens: A case-study in Yamal Peninsula, Russia Arctic. Hum. Ecol. Risk Assess. 2019, 25, 2142–2159. [Google Scholar] [CrossRef]
  27. Perevozchikov, B.; Kenig, V.; Lukin, A.; Ovechkin, A. Chromites of the Rai-Iz Massif in the polar urals (Russia). Geol. Ore Depos. 2005, 47, 206–222. [Google Scholar]
  28. Gordeev, V. Pollution of the Arctic. Reg. Environ. Chang. 2002, 3, 88–98. [Google Scholar] [CrossRef]
  29. Sidorchuk, A.; Grigorev, V. Soil erosion on the Yamal Peninsula (Russian Arctic) due to gas field exploitation. Adv. GeoEcology 1998, 31, 805–812. [Google Scholar]
  30. Newman, P. The environmental impact of cities. Environ. Urban. 2006, 18, 275–295. [Google Scholar] [CrossRef]
  31. FAO. World Reference Base for Soil Resources 2014. International Soil Classification System for Naming Soils and Creating Legends for Soil Maps; World Soil Resources Report; FAO Publications: Rome, Italy, 2014; Volume 106, p. 106. [Google Scholar]
  32. Black, C.A.; Evans, D.; White, J. Methods of Soil Analysis: Chemical and Microbiological Properties; American Society of Agronomy, Madison Inc.: Madison, WI, USA, 1965. [Google Scholar]
  33. Jenkinson, D.S.; Powlson, D.S. The effects of biocidal treatments on metabolism in soil—V: A method for measuring soil biomass. Soil Biol. Biochem. 1976, 8, 209–213. [Google Scholar] [CrossRef]
  34. ISO. Soil Quality–Determination of Cadmium, Chromium, Cobalt, Copper, Lead, Nickel and Zinc in Aqua Regia Extracts of Soil-Flame and Electrothermal Atomic Absorption Spectrometric Methods; German Institute for Standardization: Berlin, Germany, 1998. [Google Scholar]
  35. Jiang, F.; Ren, B.; Hursthouse, A.; Deng, R.; Wang, Z. Distribution, source identification, and ecological-health risks of potentially toxic elements (PTEs) in soil of thallium mine area (southwestern Guizhou, China). Environ. Sci. Pollut. Res. 2019, 26, 16556–16567. [Google Scholar] [CrossRef] [PubMed] [Green Version]
  36. Kowalska, J.B.; Mazurek, R.; Gąsiorek, M.; Zaleski, T. Pollution indices as useful tools for the comprehensive evaluation of the degree of soil contamination—A review. Environ. Geochem. Health 2018, 40, 2395–2420. [Google Scholar] [CrossRef] [Green Version]
  37. Varol, M. Assessment of heavy metal contamination in sediments of the Tigris River (Turkey) using pollution indices and multivariate statistical techniques. J. Hazard. Mater. 2011, 195, 355–364. [Google Scholar] [CrossRef]
  38. Chernova, O.; Beketskaya, O. Permissible and background concentrations of pollutants in environmental regulation (heavy metals and other chemical elements). Eurasian Soil Sci. 2011, 44, 1008–1017. [Google Scholar] [CrossRef]
  39. Moskovchenko, D.; Shamilishvilly, G.; Abakumov, E. Soil Biogeochemical Features of Nadym-Purovskiy Province (Western Siberia), Russia. Ecol. Balk. 2019, 11, 113–126. [Google Scholar]
  40. Gerasimova, A.S.; Polyakov, S.S.; Sergiev, V.I.; Trofimov, V.T. Engineering-Geological Map of the West Siberian Lowland; Nedra: Moscow, Russia, 1968. [Google Scholar]
  41. Arkhipov, S.; Isayeva, L.; Bespaly, V.; Glushkova, O. Glaciation of Siberia and north-east USSR. Quat. Sci. Rev. 1986, 5, 463–474. [Google Scholar] [CrossRef]
  42. Alekseev, I.; Abakumov, E. Permafrost-affected former agricultural soils of the Salekhard city (Central part of Yamal region). Czech Polar Rep. 2018, 8, 119–131. [Google Scholar] [CrossRef]
  43. Moskovchenko, D.; Kurchatova, A.; Fefilov, N.; Yurtaev, A. Concentrations of trace elements and iron in the Arctic soils of Belyi Island (the Kara Sea, Russia): Patterns of variation across landscapes. Environ. Monit. Assess. 2017, 189, 210. [Google Scholar] [CrossRef] [PubMed]
  44. Czarnowska, K. Total content of heavy metals in parent rocks as reference background levels of soils. Soil Sci. Annu. 1996, 47, 43–50. [Google Scholar]
  45. Jim, C.Y. Soil characteristics and management in an urban park in Hong Kong. Environ. Manag. 1998, 22, 683–695. [Google Scholar] [CrossRef] [PubMed]
  46. Hulisz, P.; Charzyński, P.; Greinert, A. Urban soil resources of medium-sized cities in Poland: A comparative case study of Toruń and Zielona Góra. J. Soils Sediments 2018, 18, 358–372. [Google Scholar] [CrossRef] [Green Version]
  47. Huot, H.; Simonnot, M.-O.; Marion, P.; Yvon, J.; De Donato, P.; Morel, J.-L. Characteristics and potential pedogenetic processes of a Technosol developing on iron industry deposits. J. Soils Sediments 2013, 13, 555–568. [Google Scholar] [CrossRef] [Green Version]
  48. Nehls, T.; Rokia, S.; Mekiffer, B.; Schwartz, C.; Wessolek, G. Contribution of bricks to urban soil properties. J. Soils Sediments 2013, 13, 575–584. [Google Scholar] [CrossRef]
  49. Huot, H.; Simonnot, M.-O.; Morel, J.L. Pedogenetic trends in soils formed in technogenic parent materials. Soil Sci. 2015, 180, 182–192. [Google Scholar] [CrossRef] [Green Version]
  50. Ji, X.; Abakumov, E.; Antcibor, I.; Tomashunas, V.; Knoblauch, C.; Zubzycki, S.; Pfeiffer, E.-M. Influence of anthropogenic activities on metals in arctic permafrost: A characterization of benchmark soils on the Yamal and Gydan peninsulas in Russia. Arch. Environ. Contam. Toxicol. 2019, 76, 540–553. [Google Scholar] [CrossRef] [PubMed]
  51. Alekseev, I.; Shamilishvilly, G.; Abakumov, E. Content of trace elements in selected permafrost-affected soils of Yamal region with different functional load. Polarforschung 2019, 88, 125–133. [Google Scholar]
  52. Alekseev, I.; Abakumov, E.; Petrova, A.; Vorona-Slivinskaya, L. Evaluation of the Ecotoxicological State of Selected Soils from Urban Environments of Russian Arctic with the Aim to Substantiate Reclamation and Restoration Strategies. In Proceedings of the MATEC Web of Conferences, St. Petersburg, Russia, 20–22 December 2018; p. 04001. [Google Scholar]
  53. Loiko, S.; Raudina, T.; Lim, A.; Kuzmina, D.; Kulizhskiy, S.; Pokrovsky, O. Microtopography controls of carbon and related elements distribution in the west siberian frozen bogs. Geosciences 2019, 9, 291. [Google Scholar] [CrossRef] [Green Version]
  54. Matyshak, G.V.; Goncharova, O.Y.; Moskalenko, N.G.; Walker, D.A.; Epstein, H.E.; Shur, Y. Contrasting Soil Thermal Regimes in the Forest-Tundra Transition Near Nadym, West Siberia, Russia. Permafr. Periglac. Process. 2017, 28, 108–118. [Google Scholar] [CrossRef]
  55. Vasil’evskaya, V. Soil Formation in the Western Siberian Tundras; USSR: Moscow, Russia, 1980. (In Russian) [Google Scholar]
  56. Polyakov, V.; Kozlov, A.; Suleymanov, A.; Abakumov, E. Soil pollution status of urban soils in St. Petersburg city, North-west of Russia. Soil Water Res. 2021. [Google Scholar] [CrossRef]
  57. Radomskaya, V.; Borodina, N. Assessment of anthropogenic contamination in an urban territory by the example of Blagoveshchensk city. Геoэкoлoгия. Инженерная геoлoгия. Гидрoгеoлoгия. Геoкриoлoгия 2019, 6, 79–93. (In Russian) [Google Scholar] [CrossRef] [Green Version]
  58. Strauss, J.; Schirrmeister, L.; Mangelsdorf, K.; Eichhorn, L.; Wetterich, S.; Herzschuh, U. Organic-matter quality of deep permafrost carbon–a study from Arctic Siberia. Biogeosciences 2015, 12, 2227–2245. [Google Scholar] [CrossRef] [Green Version]
  59. Walthert, L.; Zimmermann, S.; Blaser, P.; Luster, J.; Lüscher, P. Waldb öden der Schweiz, Band 1, Grundlagen und Region Jura; Swiss Federal Research Institute: Davos, Switzerland, 2004; p. 76. [Google Scholar]
  60. Vasil’chuk, Y.K.; Belik, A.D.; Vasil’chuk, A.C.; Budancteva, N.A.; Vasil’chuk, J.Y.; Ginzburg, A.P.; Bludushkina, L.B. Variations of the composition of pahs and the ratio of carbon and nitrogen in the soils of Batagaika thermoerosive carter in Northern Yakutia. Арктика и Антарктика 2020, 3, 100–114. (In Russian) [Google Scholar] [CrossRef]
  61. Gorbov, S.; Bezuglova, O. Specific features of organic matter in urban soils of Rostov-on-Don. Eurasian Soil Sci. 2014, 47, 792–800. [Google Scholar] [CrossRef]
  62. Lorenz, K.; Kandeler, E. Biochemical characterization of urban soil profiles from Stuttgart, Germany. Soil Biol. Biochem. 2005, 37, 1373–1385. [Google Scholar] [CrossRef]
  63. Sverdrup, L.E.; Nielsen, T.; Krogh, P.H. Soil ecotoxicity of polycyclic aromatic hydrocarbons in relation to soil sorption, lipophilicity, and water solubility. Environ. Sci. Technol. 2002, 36, 2429–2435. [Google Scholar] [CrossRef]
  64. Christensen, T.H. Cadmium soil sorption at low concentrations: VIII. Correlation with soil parameters. Water Air Soil Pollut. 1989, 44, 71–82. [Google Scholar] [CrossRef]
  65. Timofeev, I.; Kosheleva, N.; Kasimov, N. Contamination of soils by potentially toxic elements in the impact zone of tungsten-molybdenum ore mine in the Baikal region: A survey and risk assessment. Sci. Total Environ. 2018, 642, 63–76. [Google Scholar] [CrossRef]
  66. Targulian, V.O.; Goryachkin, S.V. Soil memory: Types of record, carriers, hierarchy and diversity. Rev. Mex. Cienc. Geológicas 2004, 21, 1–8. [Google Scholar]
  67. Krauss, M.; Wilcke, W. Sorption strength of persistent organic pollutants in particle-size fractions of urban soils. Soil Sci. Soc. Am. J. 2002, 66, 430–437. [Google Scholar] [CrossRef]
  68. Merdy, P.; Gharbi, L.T.; Lucas, Y. Pb, Cu and Cr interactions with soil: Sorption experiments and modelling. Colloids Surf. A Physicochem. Eng. Asp. 2009, 347, 192–199. [Google Scholar] [CrossRef]
  69. Pignatello, J.J. Sorption dynamics of organic compounds in soils and sediments. React. Mov. Org. Chem. Soils 1989, 22, 45–80. [Google Scholar]
  70. Gupta, S.K.; Chen, K.Y. Partitioning of trace metals in selective chemical fractions of nearshore sediments. Environ. Lett. 1975, 10, 129–158. [Google Scholar] [CrossRef]
  71. Lavado, R.; Rodriguez, M.; Scheiner, J.; Taboada, M.; Rubio, G.; Alvarez, R.; Alconada, M.; Zubillaga, M. Heavy metals in soils of Argentina: Comparison between urban and agricultural soils. Commun. Soil Sci. Plant Anal. 1998, 29, 1913–1917. [Google Scholar] [CrossRef]
  72. Markiewicz-Patkowska, J.; Hursthouse, A.; Przybyla-Kij, H. The interaction of heavy metals with urban soils: Sorption behaviour of Cd, Cu, Cr, Pb and Zn with a typical mixed brownfield deposit. Environ. Int. 2005, 31, 513–521. [Google Scholar] [CrossRef]
  73. Ross, S.M. Toxic Metals in Soil-Plant Systems; Wiley and Sons: New York, NY, USA, 1994. [Google Scholar]
  74. Yang, Q.; Li, Z.; Lu, X.; Duan, Q.; Huang, L.; Bi, J. A review of soil heavy metal pollution from industrial and agricultural regions in China: Pollution and risk assessment. Sci. Total Environ. 2018, 642, 690–700. [Google Scholar] [CrossRef] [PubMed]
  75. Chary, N.S.; Kamala, C.; Raj, D.S.S. Assessing risk of heavy metals from consuming food grown on sewage irrigated soils and food chain transfer. Ecotoxicol. Environ. Saf. 2008, 69, 513–524. [Google Scholar] [CrossRef] [PubMed]
  76. Sharma, R.K.; Agrawal, M. Biological effects of heavy metals: An overview. J. Environ. Biol. 2005, 26, 301–313. [Google Scholar]
  77. Mohammed, A.S.; Kapri, A.; Goel, R. Heavy Metal Pollution: Source, Impact, and Remedies; Springer: Berlin, Germany, 2011; pp. 1–28. [Google Scholar]
  78. Duruibe, J.O.; Ogwuegbu, M.; Egwurugwu, J. Heavy metal pollution and human biotoxic effects. Int. J. Phys. Sci. 2007, 2, 112–118. [Google Scholar]
  79. Karim, Z.; Qureshi, B.A.; Mumtaz, M.; Qureshi, S. Heavy metal content in urban soils as an indicator of anthropogenic and natural influences on landscape of Karachi—A multivariate spatio-temporal analysis. Ecol. Indic. 2014, 42, 20–31. [Google Scholar] [CrossRef]
  80. Sokolov, I. Theoretical Problems of Genetic Pedology; Gumanitarnye Nauki: Novosibirsk, Russia, 2004. (In Russian) [Google Scholar]
  81. Galasso, J.L.; Siegel, F.R.; Kravitz, J.H. Heavy metals in eight 1965 cores from the Novaya Zemlya Trough, Kara Sea, Russian Arctic. Mar. Pollut. Bull. 2000, 40, 839–852. [Google Scholar] [CrossRef]
  82. Alekseev, I.; Abakumov, E.; Shamilishvili, G. Heavy Metals in Urban Soils of the Yamal Region. In Proceedings of the International Conference on Landscape Architecture to Support City Sustainable Development, Moscow, Russia, 12–14 September 2016; pp. 51–56. [Google Scholar]
  83. Zhurba, O.; Rukavishnikov, V.; Merinov, A.; Alekseyenko, A. The content of petroleum products, benzo (a) pyrene and heavy metals in soils of yamalnenets autonomous district and heavy metals in the hair of children. Gig. Sanit. 2016, 95, 521–524. [Google Scholar] [CrossRef]
  84. Sviridenko, S.P.; Pieterskih, A.S. Soil cover ecological condition on the yanao priuralsky area territory. Bull. KrasSAU 2012, 4, 67–79. [Google Scholar]
  85. Kukushkin, S.Y.; Opekunova, M.G.; Opekunov, A.Y.; Arestova, I.Y. Heavy metals in soils of the Nadym-Pur-Taz region. In Proceedings of the International Scientific-Practical Conference Dedicated to the 85th Anniversary of the Belarusian State University Department of Soil Science and the 80th anniversary of Doctor of Geographical Sciences, Minsk, Belarus, 20–23 September 2018; pp. 258–262. [Google Scholar]
Figure 1. Location of studied cities and sampling locations in functional zones (black box—location of YANAO).
Minerals 11 00668 g001
Figure 2. Soil diversity in the study cities and functional zones (a1a5—mature; b1b5—residential; c1c5—park; d1d5—industrial).
Minerals 11 00668 g002aMinerals 11 00668 g002b
Figure 3. Soil pH values in different functional zones of the studied cities.
Minerals 11 00668 g003
Figure 4. Level of soil basal respiration in the studied soils.
Minerals 11 00668 g004
Figure 5. Contents of total organic carbon (TOC), total nitrogen (TN), and C/N ratio values for the studied soils.
Minerals 11 00668 g005
Figure 6. Content of trace metals in topsoil (0–20 cm) of Arctic cities and their functional zones.
Minerals 11 00668 g006
Figure 7. Variation of trace metals concentrations within functional zones.
Minerals 11 00668 g007
Table 1. Regional settings, site descriptions and soil names for study area.
CityFunctional
Zone
NESite DescriptionSoil Name [31]
UrengoyMature65.97277878.420278Tundra, 300 m from the roadHistic Podzol
Residential65.96472278.373333City, central part, near with school, residential courtyard, interquarter passageUrbic Technosol
Park65.95888978.366389Park, near church, square, parking, hospital Urbic Technosol
Industrial65.96944478.365Old repair base, many hangars, construction debris, former storage facilities, destroyed foundation Urbic Technosol
Gaz SaleMature67.34833379.016389Tundra, 150 m from the road Histic Cryosol
Industrial67.36111178.990556Repair and storage base, on the watershed. Urbic Technosol
Park67.36638979.006111Park, square, next to the monument, near natural forests Urbic Technosol
Industrial67.36222279.005278In a residential yard, near wasteland, houses, road Urbic Technosol
SalekhardMature66.57238966.59875Tundra, vicinities of SalekhardHistic Podzol
Park66.52361166.59166Angalskiy cape Urbic Technosol
Industrial66.51805566.65583Central park Urbic Technosol
Residential66.56911166.57180Sandlot Urbic Technosol
Novy UrengoyMature66.07744476.47794Mature tundra, pinus foreststandPodzol
Park66.11094476.671917Northern part of cityAndic Podzol
Residential66.11094476.671917Greening zone in residential block Urbic Technosol
Industrial66.07469476.587306On the way to new airport Urbic Technosol
NadymMature65.50388972.648972Pine tundra stand on the way to airport Histic Cryosol
Park65.53394472.521972Kozlova park (larch plantation) Histic Cryosol
Industrial65.50388972.548972M-Video block Urbic Technosol
Residential65.54833372.523389Topchevo residential block Urbic Technosol
Table 2. Interpretation values and classes of used indexes [35,36,37].
IgeoPIPLI
ValueSoil QualityValueSoil PollutionValuePollution Status
Igeo < 0UnpollutedPI < 1Absent<1Denote perfection
0 ≤ Igeo ≤ 1Unpolluted to moderately polluted1 < PI < 2Low1Only baseline
levels of pollution
1 ≤ Igeo ≤ 2Moderately polluted2 < PI < 3Moderate>1Deterioration
of soil quality
2 ≤ Igeo ≤ 3Moderately to highly polluted3 < PI < 5Strong
3 ≤ Igeo ≤ 4Highly pollutedPI > 5Very strong
4 ≤ Igeo ≤ 5Highly to extremely high polluted
Igeo > 5Extremely high polluted
Table 3. Content of trace metals in pristine and anthropogenically loaded soils of the Yamal region, mg × kg−1.
LocationPbCrCuAsNiZnCdReferences
Pristine soils
Beliy Island5-4.77-10.9713.520.13[50]
0.523.52.9--20.90.8[39]
Gydan Peninsula14.85--18.2-92.450.07[50]
5.96--3.18-31.060.12
4.14--0.74-36.430.1
Vicinities
of Yar-Sale village
1.53.12--4-[83]
The Floodplain of the River Poluy1520.16.7-17.816.20.52[84]
Anthropogenic affected and urban soils
Kharsaim36-112.6--0.39[82]
2.3-1.60.8--0.10
Aksarka4.0-3.82.1--0.14
10-5.52.4--0.20
Salekhard8.9-7.12.9--0.25
6.2-6.33.0--0.27
Kharp7.9-732.7--0.24
4.2-741.4--0.10
Labytnangi9.1-9.02.8--0.26
6.2-6.22.4--0.14
9.5-9.53.1--0.16
Yar-Sale village1.51.72.1--3.7-[83]
1.82.12.8--32-
1.81.02.4--3.1-
1.81.22.4--2.2-
1.73.22.4--4.6-
1.32.82.0--4.2-
1.62.22.1--7.2-
Novy Urengoy10189-1332-[85]
Table 4. MANOVA multivariate tests of significance.
EffectdfFp
City286.46<0.0001
Functional zone211.270.22
City × functional zone841.260.10
significant values are highlighted.
Table 5. MANOVA univariate results for each dependent variable.
EffectdfPbCrCuCd
FpFpFpFp
City44.430.0111.44<0.00011.550.210.860.50
Functional zone30.350.790.510.680.550.651.340.28
City × functional zone120.221.000.280.990.590.840.230.99
EffectdfNiZnAs
FpFpFp
City46.040.0010.480.754.030.01
Functional zone30.770.520.680.571.190.33
City × functional zone120.830.620.860.600.390.96
significant values are highlighted.
Table 6. Spearman rank order correlations.
CNpH H2OpHCaCl2BRPbCrCuCdNiZnAs
C1.000.97−0.42−0.460.060.450.370.190.220.300.440.61
N 1.00−0.47−0.510.070.430.390.150.190.310.420.62
pH H2O 1.000.97−0.15−0.20−0.210.100.23−0.07−0.13−0.42
pH CaCl2 1.00−0.10−0.25−0.260.070.17−0.12−0.17−0.47
BR 1.000.060.010.12−0.02−0.070.14−0.02
Pb 1.000.570.410.230.560.750.54
Cr 1.000.42−0.080.920.770.62
Cu 1.000.200.500.580.21
Cd 1.00−0.12−0.030.15
Ni 1.000.850.55
Zn 1.000.47
As 1.00
highlighted correlations are significant at p < 0.05.
Table 7. Values of the index of geoaccumulation (Igeo) for the studied cities and their functional zones.
CityFunctional ZoneIgeo
PbCrCuCdNiZnAs
Gaz-SaleMature−0.41.0−1.3−1.1−0.7−0.7−0.1
Industrial−1.4−1.9−0.62.4−2.5−1.8−2.8
Park−3.0−1.7−4.31.4−3.1−3.2−2.9
Residential−2.8−2.3−4.71.0−4.2−3.3−3.1
NadumMature−1.9−1.2−5.12.2−4.2−3.3−0.1
Industrial0.4−0.7−3.13.8−4.0−3.90.3
Park−2.9−2.5−5.40.9−5.3−3.90.7
Residential0.6−1.8−4.12.7−4.1−3.0−0.7
Novy UrengoyMature−3.1−3.3−6.10.9−7.4−3.9−0.7
Industrial−0.20.0−2.12.2−1.80.8−0.1
Park−0.9−1.5−2.72.7−3.5−2.1−0.7
Residential−2.2−1.4−4.32.5−3.6−3.40.7
SalekhardMature1.62.90.1−1.4−0.9−1.31.2
Industrial2.03.7−1.12.70.0−1.11.9
Park1.73.1−2.13.1−1.0−1.41.3
Residential1.43.80.42.20.2−0.21.5
UrengoyMature0.5−0.8−3.01.8−3.5−1.7−3.4
Industrial−0.3−2.4−3.91.8−4.5−2.6−3.9
Park−4.4−0.1−3.71.2−2.9−2.4−2.5
Residential−1.2−2.3−4.11.9−4.9−2.5−3.4
highlighted Igeo coefficient values indicating the presence of contamination.
Table 8. Values of pollution index (PI) and complex pollution index (PLI) in investigated cities and their functional zones.
CityFunctional ZonePIPLI
PbCrCuCdNiZnAsValuePollution Status
Gaz-SaleMature1.142.930.600.700.910.911.371.07DSQ
Industrial0.570.390.998.030.260.440.210.64DP
Park0.190.460.074.080.170.160.200.28DP
Residential0.210.310.063.100.080.160.180.22DP
NadumMature0.400.650.047.040.080.161.430.39DP
Industrial2.040.940.1821.130.100.101.900.75DP
Park0.200.270.042.820.040.102.380.24DP
Residential2.200.430.099.860.090.190.950.53DP
Novy UrengoyMature0.180.150.022.820.010.100.950.15DP
Industrial1.301.450.367.040.442.621.431.34DSQ
Park0.820.530.239.860.130.340.950.64DP
Residential0.320.580.088.450.120.142.380.47DP
SalekhardMature4.4010.831.560.560.800.623.331.83DSQ
Industrial6.0020.000.719.861.530.725.713.41DSQ
Park5.0013.000.3512.680.740.593.812.42DSQ
Residential4.0021.171.917.041.781.314.293.80DSQ
UrengoyMature2.120.850.195.350.130.460.140.55DP
Industrial1.220.280.105.070.060.250.100.31DP
Park0.071.400.123.520.200.280.260.35DP
Residential0.670.300.095.770.050.260.140.29DP
DP—denote perfection; DSQ—deterioration of soil quality; highlighted indices values indicating the presence of contamination.
Publisher’s Note: MDPI stays neutral with regard to jurisdictional claims in published maps and institutional affiliations.

