Article

The Recovery and Concentration of Spodumene Using Dense Media Separation

by
Charlotte E. Gibson
1,*,
Massoud Aghamirian
2,
Tassos Grammatikopoulos
2,
Darren L. Smith
3 and
Lindsay Bottomer
4
1
Department of Mining, Queen’s University, 99 University Ave., Kingston, ON K7L 3N6, Canada
2
SGS Canada Inc., 185 Concession St., Lakefield, ON K0L 2H0, Canada
3
Patriot Battery Metals Inc., Suite 500, 666 Burrard St., Vancouver, BC V6C 3P6, Canada
4
Far Resources Ltd., 580 Hornby St. #510, Vancouver, BC V3C 3B6, Canada
*
Author to whom correspondence should be addressed.
Minerals 2021, 11(6), 649; https://doi.org/10.3390/min11060649
Submission received: 14 May 2021 / Revised: 7 June 2021 / Accepted: 11 June 2021 / Published: 18 June 2021

Abstract

:
In coming years, global lithium production is expected to increase as the result of widespread electric vehicle adoption. To meet the expected increase in demand, lithium must be sourced from both brine and hard-rock deposits. Heavy liquid separation (HLS) and dense media separation (DMS) tests were conducted on the pegmatites from Hidden Lake, NWT, Canada to demonstrate the potential role of this technology in the concentration of spodumene (LiAlSi2O6) from hard-rock sources. A continuously operated DMS circuit test, conducted on +840 µm material, produced a concentrate grading 6.11% Li2O with ~50% lithium recovery. The circuit rejected 50% of the original mass to tailings, with only 8% lithium losses. Sensitivity analysis showed that minor changes (+/−0.05) in the DMS-specific gravity cut point resulted in significant changes to the mass rejected and to the concentrate grade produced; this may limit the feasibility and operability of the downstream grinding and flotation circuits. The results demonstrate the potential for DMS in the concentration of spodumene from the Hidden Lake pegmatites, and by extension, the potential for DMS in the concentration of spodumene from other hard-rock occurrences.

1. Introduction

As many countries move to reduce carbon dioxide emissions and curb dependence on fossil fuels, the production of electric vehicles continues to reach new highs. The battery is a critical component of electric vehicle technology; battery weight, reliability and longevity are very important to the widespread adoption of electric cars. As the lightest alkali metal, lithium (Li) has a high electrochemical potential, making it an ideal material for rechargeable batteries. Consequently, global lithium production has increased rapidly—doubling over the past five years. In 2015, just 30% of the total lithium produced was used in batteries; today, the majority (>70%) of lithium produced goes directly to battery applications [1,2,3,4,5,6,7,8,9,10,11,12,13].
Lithium occurs in three different deposit types: hard-rock pegmatite deposits, brine lake deposits containing lithium chloride, and lithium-rich sediments such as hectorite clays. To date, all of the lithium produced has originated from hard-rock and brine lake deposits [1,2,3,4,5,6,7,8,9,10,11,12]; sediment hosted/clay deposits were only recently identified as potential economic sources of lithium and are yet to be commercially developed [14].
It is cheaper to produce lithium from brine lake deposits compared with hard-rock deposits and until recently, most of the lithium produced came from brines [15]. However, as demand spiked over the past several years, lithium production from hard-rock deposits also increased. In 2020, over half the global lithium supply came from hard-rock deposits (5 operations in Australia, 1 in China). The remainder came from brine operations in Chile (2 operations), Argentina (2 operations), United States (1), and China (2 operations) [1]. While brine deposits are less expensive to operate, recent studies show that they have a significant impact on the environment. The process of lithium extraction from brines requires half a million liters of water to be evaporated per tonne of lithium carbonate produced—water consumption two orders of magnitude higher than the processing of hard-rock deposits [16,17]. Several companies are developing more environmentally compliant processes to extract lithium from brines. However, these processes have yet to be employed at an industrial scale [18].
Researchers believe that global lithium reserves are sufficient to meet future demand; however, this depends on supply from both brine and hard-rock deposits [18,19]. Approximately 2.5% of total global lithium reserves are in Canada, contained almost entirely in hard-rock occurrences in Quebec, Manitoba, and the Northwest Territories [12]. In 2020, the Canadian and American governments announced a joint action plan to improve the security of critical metals, including lithium [20]. Canada’s ability to secure a competitive, domestic supply of lithium depends on the development its hard-rock resources; to move forward, projects must be economic, fully abide by environmental regulations, most importantly, be accepted by local communities. This paper focuses on technical means of improving efficiency and reducing energy consumption in the concentration lithium-bearing minerals from Canadian hard-rock deposits.

The Beneficiation of Hard-Rock Deposits Using Dense Media Separation

There are nine lithium-bearing minerals considered to be economically favourable for recovery. Of these, spodumene (LiAlSi2O6) is the most significant, occurring with other silicate gangue minerals such as feldspars, micas, and quartz [13,14,21,22].
Reviews by Gibson et al. [21] and, more recently, by Tadesse et al. [13] detail the different separation techniques used to concentrate spodumene from associated gangue minerals. In general, spodumene separation is a multistage process, complicated by similarities in the physicochemical properties of the ore and gangue minerals. Spodumene beneficiation flowsheets can include a combination of dense media separation (DMS), magnetic separation, de-sliming, magnetic separation, and flotation, depending on the mineralogy of the deposit. DMS is commonly used as a preconcentration stage, intended to reject gangue minerals prior to further concentration by flotation.
While numerous studies have been conducted on aspects of spodumene flotation systems [23,24,25,26,27,28], there are limited studies detailing spodumene concentration by DMS. DMS is a process that separates materials of different densities using a media with a known specific gravity (S.G.), greater than that of water (hence the name “heavy” or “dense” media), to produce a float and sink product; the process is effective for a feed size ranging from 500 to 850 µm [13,29].
An important parameter in DMS is the concentration criterion (Equation (1)). The concentration criterion, derived from Newton’s Law, is a unitless measure of the separability of two particles with different specific gravities in a viscous fluid. The higher the concentration criterion, the more effective the separation of heavy particles from the light particles [29].
C o n c e n t r a t i o n   C r i t e r i o n ,   C C = S . G .   h e a v y S . G .   f l u i d S . G .   l i g h t S . G .   f l u i d
Equation (1) shows that the higher the specific gravity of the fluid in which the separation occurs, the higher the concentration criteria, and the more efficient the separation of the two particles. Similarly, the gap in specific gravity between the heavy and the light particles plays an important role in separation efficiency—operation of dense media circuits tends to be more efficient when there is a large difference between the S.G. value of the heavy and light minerals [30]. Further, like all mineral separation techniques, DMS efficiency is influenced by mineral liberation and association.
Tadesse et al. [13] outlined three major challenges associated with the dense media separation of spodumene: (1) marginal differences in the S.G. of spodumene compared with different silicate gangue minerals; (2) the mineralogical transformation of spodumene to micas and clays with lower specific gravity, and; (3) the tendency of spodumene to fracture into acicular particles which are more likely to report to the float fraction.
This paper aims to demonstrate the potential role of DMS in the concentration of spodumene from hard-rock ores, through studying its applicability to the Hidden Lake pegmatites from Northwest Territories, Canada. We aim to demonstrate both the benefits and challenges of this processing technique and highlight important flowsheet design considerations.

2. Materials and Methods

2.1. The Hidden Lake Pegmatites

The spodumene pegmatite occurrences at Hidden Lake are situated 45 km east-northeast of Yellowknife in the Northwest Territories of Canada (Figure 1).
The mineral rights to the occurrences are held under a Joint Venture between Far Resources Ltd. and Patriot Battery Metals Inc., at a 60% and 40% interest, respectively. The lithium-bearing pegmatite dykes at Hidden Lake are part of the larger Yellowknife Pegmatite District, which have been described as one of the largest lithium resources, mainly as spodumene, in Canada [31].

2.2. Mineralogy and Head Assays

2.2.1. Sample Preparation

Four composite samples (Sample 1, Sample 2, Sample 3, and Sample 4) were collected from the Hidden Lake pegmatites. The samples were first crushed to 3 inches (7.62 cm). The 2 kg charges were riffle split from each sample and reduced to a P80 of 425 μm for the mineralogical analyses. Each sample was then screened and re-combined into four size fractions, based on the weight (%) distribution: +425 μm, −425/+250 μm, −250/+106 μm, and −106 μm for the mineralogical work. Once the mineralogical analysis was completed, it was decided that the samples could be treated as a single composite for the DMS and HLS and were combined in equal ratio (1:1:1:1).
The composite sample was crushed to −1/2″ and a 9 kg subsample taken. This 9 kg subsample was further crushed to −1/4″, and subsamples of the −1/4″ material submitted for elemental and X-ray diffraction (XRD) analyses. A second 4 kg subsample of the −1/4″ material was screened on an 840 µm (20 mesh) screen to prepare feed for heavy liquid separation (HLS) test. The remaining sample (approximately 400 kg) was used in DMS testing.

2.2.2. Elemental Analysis

The composition of samples and separation products was determined by whole-rock analysis using X-Ray Fluorescence (XRF) for major elements and peroxide fusion with Inductively Coupled Plasma Emission Spectrometry (ICP-OES) finish for lithium. For whole-rock analysis, samples were prepared by borate fusion; 0.2–0.5 g of pulverized sample was mixed with lithium tetraborate/lithium metaborate, and fused to form a homogenous glass disk. The glass disk was then analyzed by X-Ray Fluorescence using a Bruker XRF Tiger Series 1 instrument (Bruker, Billerica, MA, USA). For lithium analysis, 0.1 g of pulverized sample was fused with sodium peroxide in a zirconium crucible. The resultant cake was then digested in hydrochloric acid and analyzed on an Agilent 725 ICP-OES instrument (Agilent, Santa Clara, CA, USA).

2.2.3. QEMSCAN Operational Modes and Quality Control

QEMSCAN analysis was conducted at the Advanced Mineralogy Facility at SGS Canada, in Lakefield, ON, Canada. QEMSCAN is an EVO 430 automated scanning electron microscope, equipped with four light element energy dispersive X-ray spectrometers and iDiscover software capable of processing the data and images. QEMSCAN operates with a 25 kV accelerating voltage and a 5 nA beam current. The QEMSCAN measures, and the iDiscover software processes data from every pixel across a sample, with a measurement resolution defined based on the scope of the analysis. The software assigns each pixel a mineral name based on 1000 counts of energy dispersive X-ray spectral data and backscatter electron intensities. If the minerals or constituent phases comprising the sample are compositionally distinct, QEMSCAN is capable of reliably discriminating and quantifying them. The mode of the QEMSCAN analysis used for this project was the Particle Mineral Analysis (PMA). A predefined number of particles were mapped at a point of 3 to 8 μm pixel size to spatially resolve and describe mineral grain textures and associations. The PMA mode scans the polished section and provides a statistically robust population of mineral identifications based on the X-ray chemistry of minerals. Light elements such as lithium, boron, carbon, beryllium, oxygen, and hydrogen cannot be discriminated by the QEMSCAN analysis. Thus, the identification of spodumene was based on the aluminum–silica ratios since lithium cannot be detected with conventional instruments.
The liberation and association characteristics of spodumene are given for each sample. For the purposes of this analysis, particle liberation is defined based on 2D particle area percent. Particles are classified in the following groups (in descending order) based on mineral-of-interest area percent: free (≥95% of the total particle area) and liberated (≥80%). The non-liberated grains have been classified according to association characteristics, where binary association groups refer to particle area percent greater than or equal to 95% of the two minerals or mineral groups. The complex groups refer to particles with ternary, quaternary, and greater mineral associations including the mineral of interest.

2.2.4. X-ray Diffraction

Quantitative X-ray diffraction (XRD) by Rietveld Refinement was conducted using a Bruker AXS D8 Advance Diffractometer (cobalt radiation, 35 kV, 40 mA). Results were interpreted using PDF2/PDF4 powder diffraction databases issues by the International Center for Diffraction Data (ICDD) with DiffracPlus Eva and Topas software version 4.2 (Karlsruhe, Germany). Mineral detection limits ranged from 0.5–2%, depending on the crystallinity.

2.3. Heavy Liquid Separation (HLS)

Heavy liquid separation (HLS) is a laboratory test used to assess whether a heterogenous material, such as an ore, is amenable to separation using DMS techniques. It is conducted using a small sample and, if successful, can justify expenditure on a larger dense media separation test. Further, heavy liquid test results help determine the optimal specific gravity set point in dense media separation [29].
In this study, HLS testing was conducted using methylene iodide (density of 3.32 g/cm3) diluted with acetone. The test was conducted with heavy liquid densities ranging from 2.60 to 3.10 g/cm3 in increments of 0.10 g/cm3, according to the flowsheet shown in Figure 2.
The test was initiated with approximately 2 kg of +840 µm feed material at the highest liquid density (3.00 g/cm3), using a separatory funnel to facilitate separation of heavy material from light material, if required. Next, the heavy liquid was further diluted with acetone to achieve a lower liquid density (i.e., 3.00 g/cm3) and the float material from the previous stage was tested again at the lower density. This procedure continued for all densities in the series, beginning at the highest density (3.10 g/cm3) and ending at the lowest density (2.60 g/cm3). The density of the heavy liquid was measured before and after each test to ensure the target was maintained. All test products were washed with acetone to dissolve residual methylene iodide and then dried. The final sink (6 total) and float (1) products were weighed and subsamples were obtained for analysis by XRF and AA.

2.4. Dense Media Separation

The specific gravity of spodumene is approximately 3.15, allowing it to be separated from other silicate minerals (i.e., quartz and feldspar, S.G. 2.5 and 2.6, respectively) by dense media separation. If spodumene is sufficiently liberated at a coarse particle size, DMS can produce a high-grade mineral concentrate and operate as the sole concentration stage. However, most ores require grinding to finer particle sizes to achieve acceptable liberation. Here, DMS can be used as pre-concentration stage to recover coarse grains of liberated spodumene at a coarse size, and thus reduce the overall mass processed in the grinding and flotation circuits.
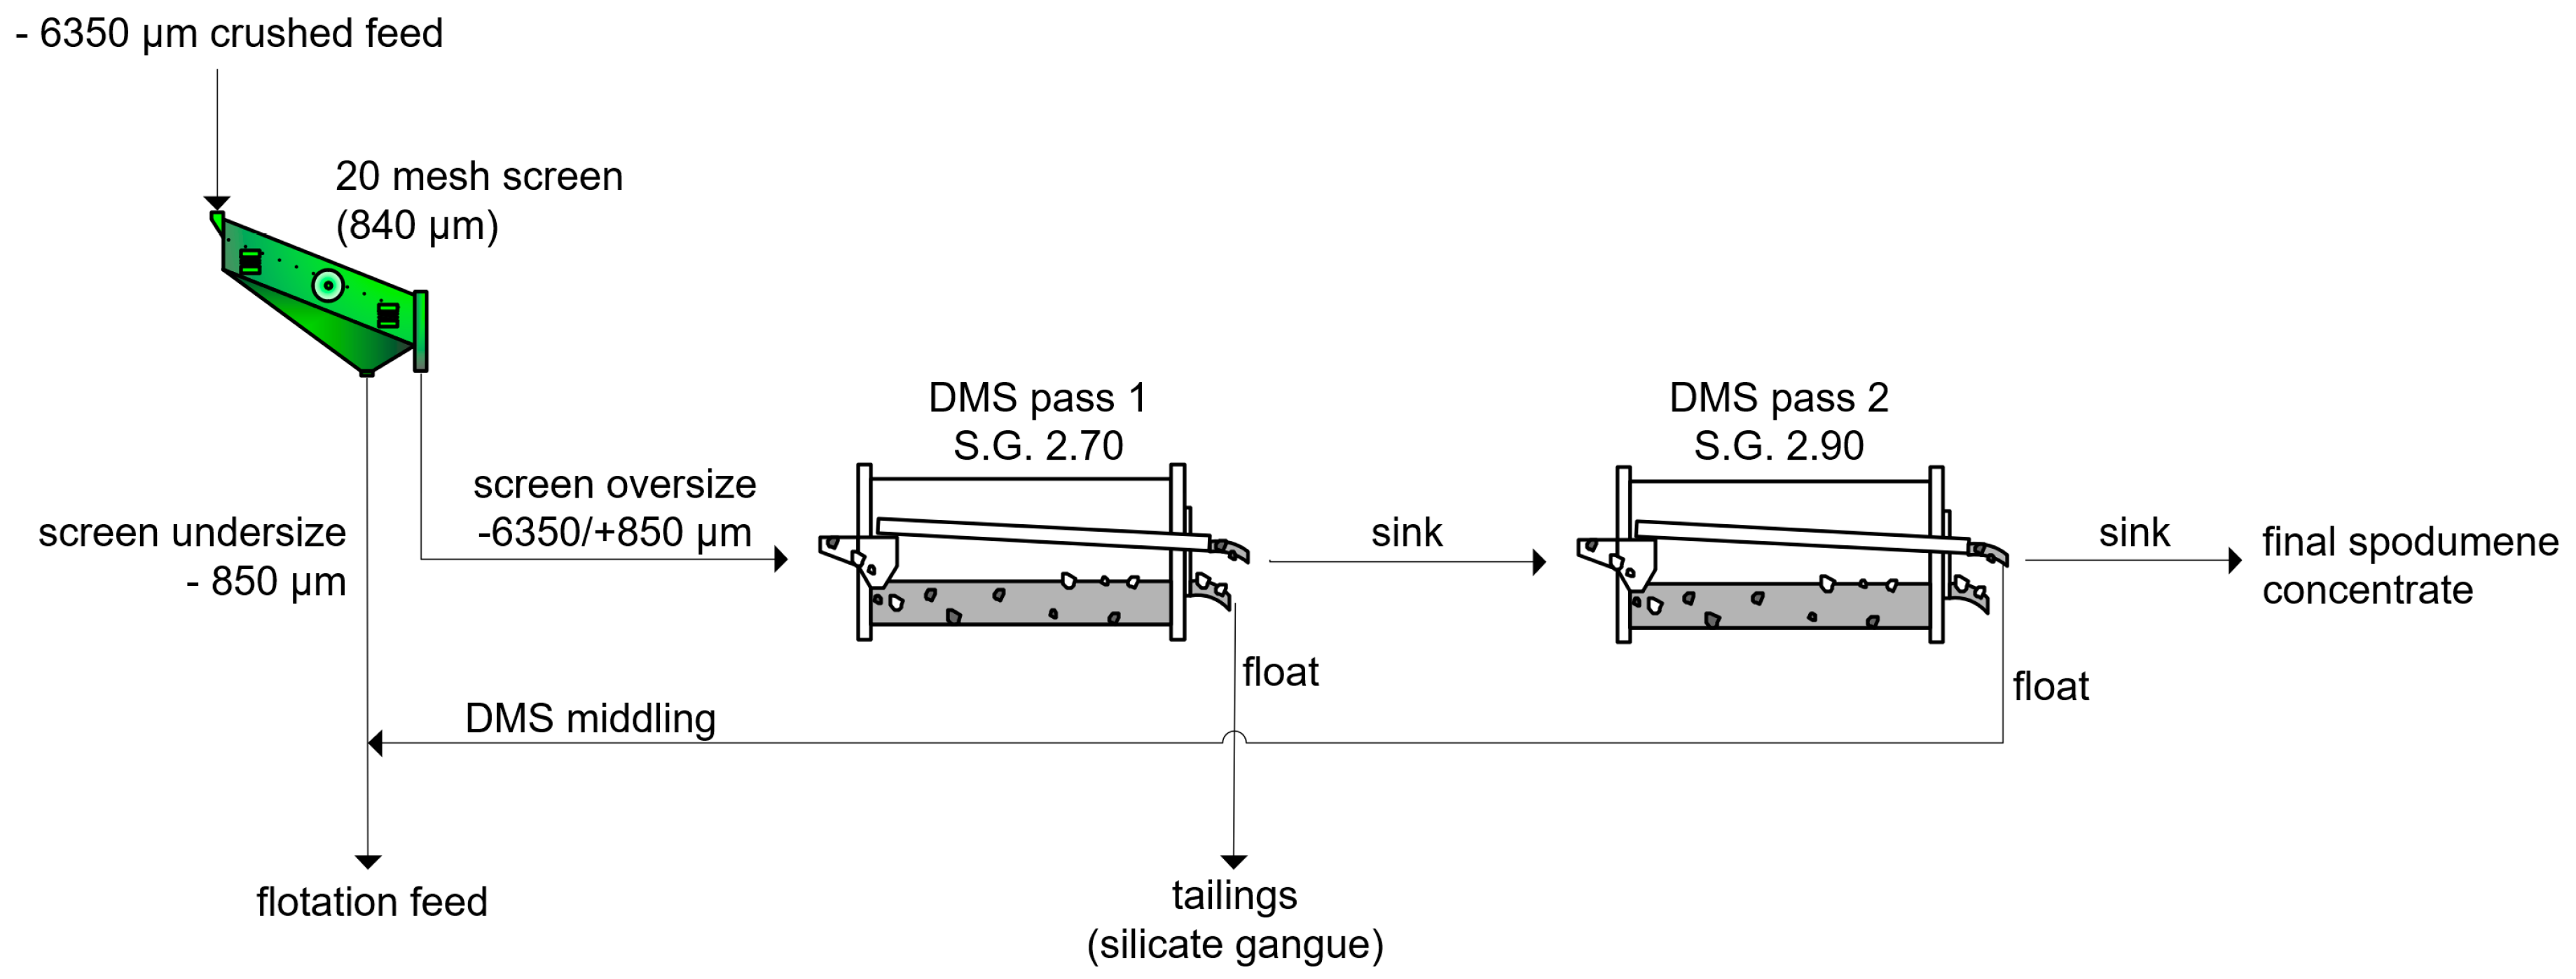
Dense media separation testing was conducted on a 400 kg sample of the Head Composite Sample at SGS in Lakefield, ON, Canada. The test was operated continuously and consisted of screening the sample on a 20 mesh (840 µm) screen to produce oversize (+840 µm) and undersize (−840 µm) material. The oversize material was passed through two dense media separation cyclones using a mixture of ferrosilicon and magnetite as dense media. The specific gravity cut point of the first DMS stage (DMS Pass 1) was 2.70. The float product formed the final silicate tailings product. The sink fraction from DMS Pass 1 formed to feed to the second DMS stage (DMS Pass 2), conducted at a specific gravity cut point of 2.90. The float product from DMS Pass 2 was combined with the screen undersize and referred to as flotation feed. The sink product from DMS Pass 2 formed the final spodumene concentrate. The specific gravity cut points were selected based on the results obtained in heavy liquid separation testing; the details of cut point selection will be discussed in subsequent sections. After testing, the screen undersize, the DMS Pass 2 float, and the DMS Pass 2 sink products were filtered, dried, weighed and representative subsamples were collected for analysis by XRF and AA. The DMS Pass 1 float sample (i.e., silicate tailings) was subsampled periodically throughout operation; the subsamples were combined, filtered, dried and subsamples for analysis by XRF and AA.

3. Results and Discussion

3.1. Mineralogy

The geochemical analyses including major elements, lithium (Li), and rubidium (Rb) of the four head samples are shown in Table 1. All four samples were similar in composition.
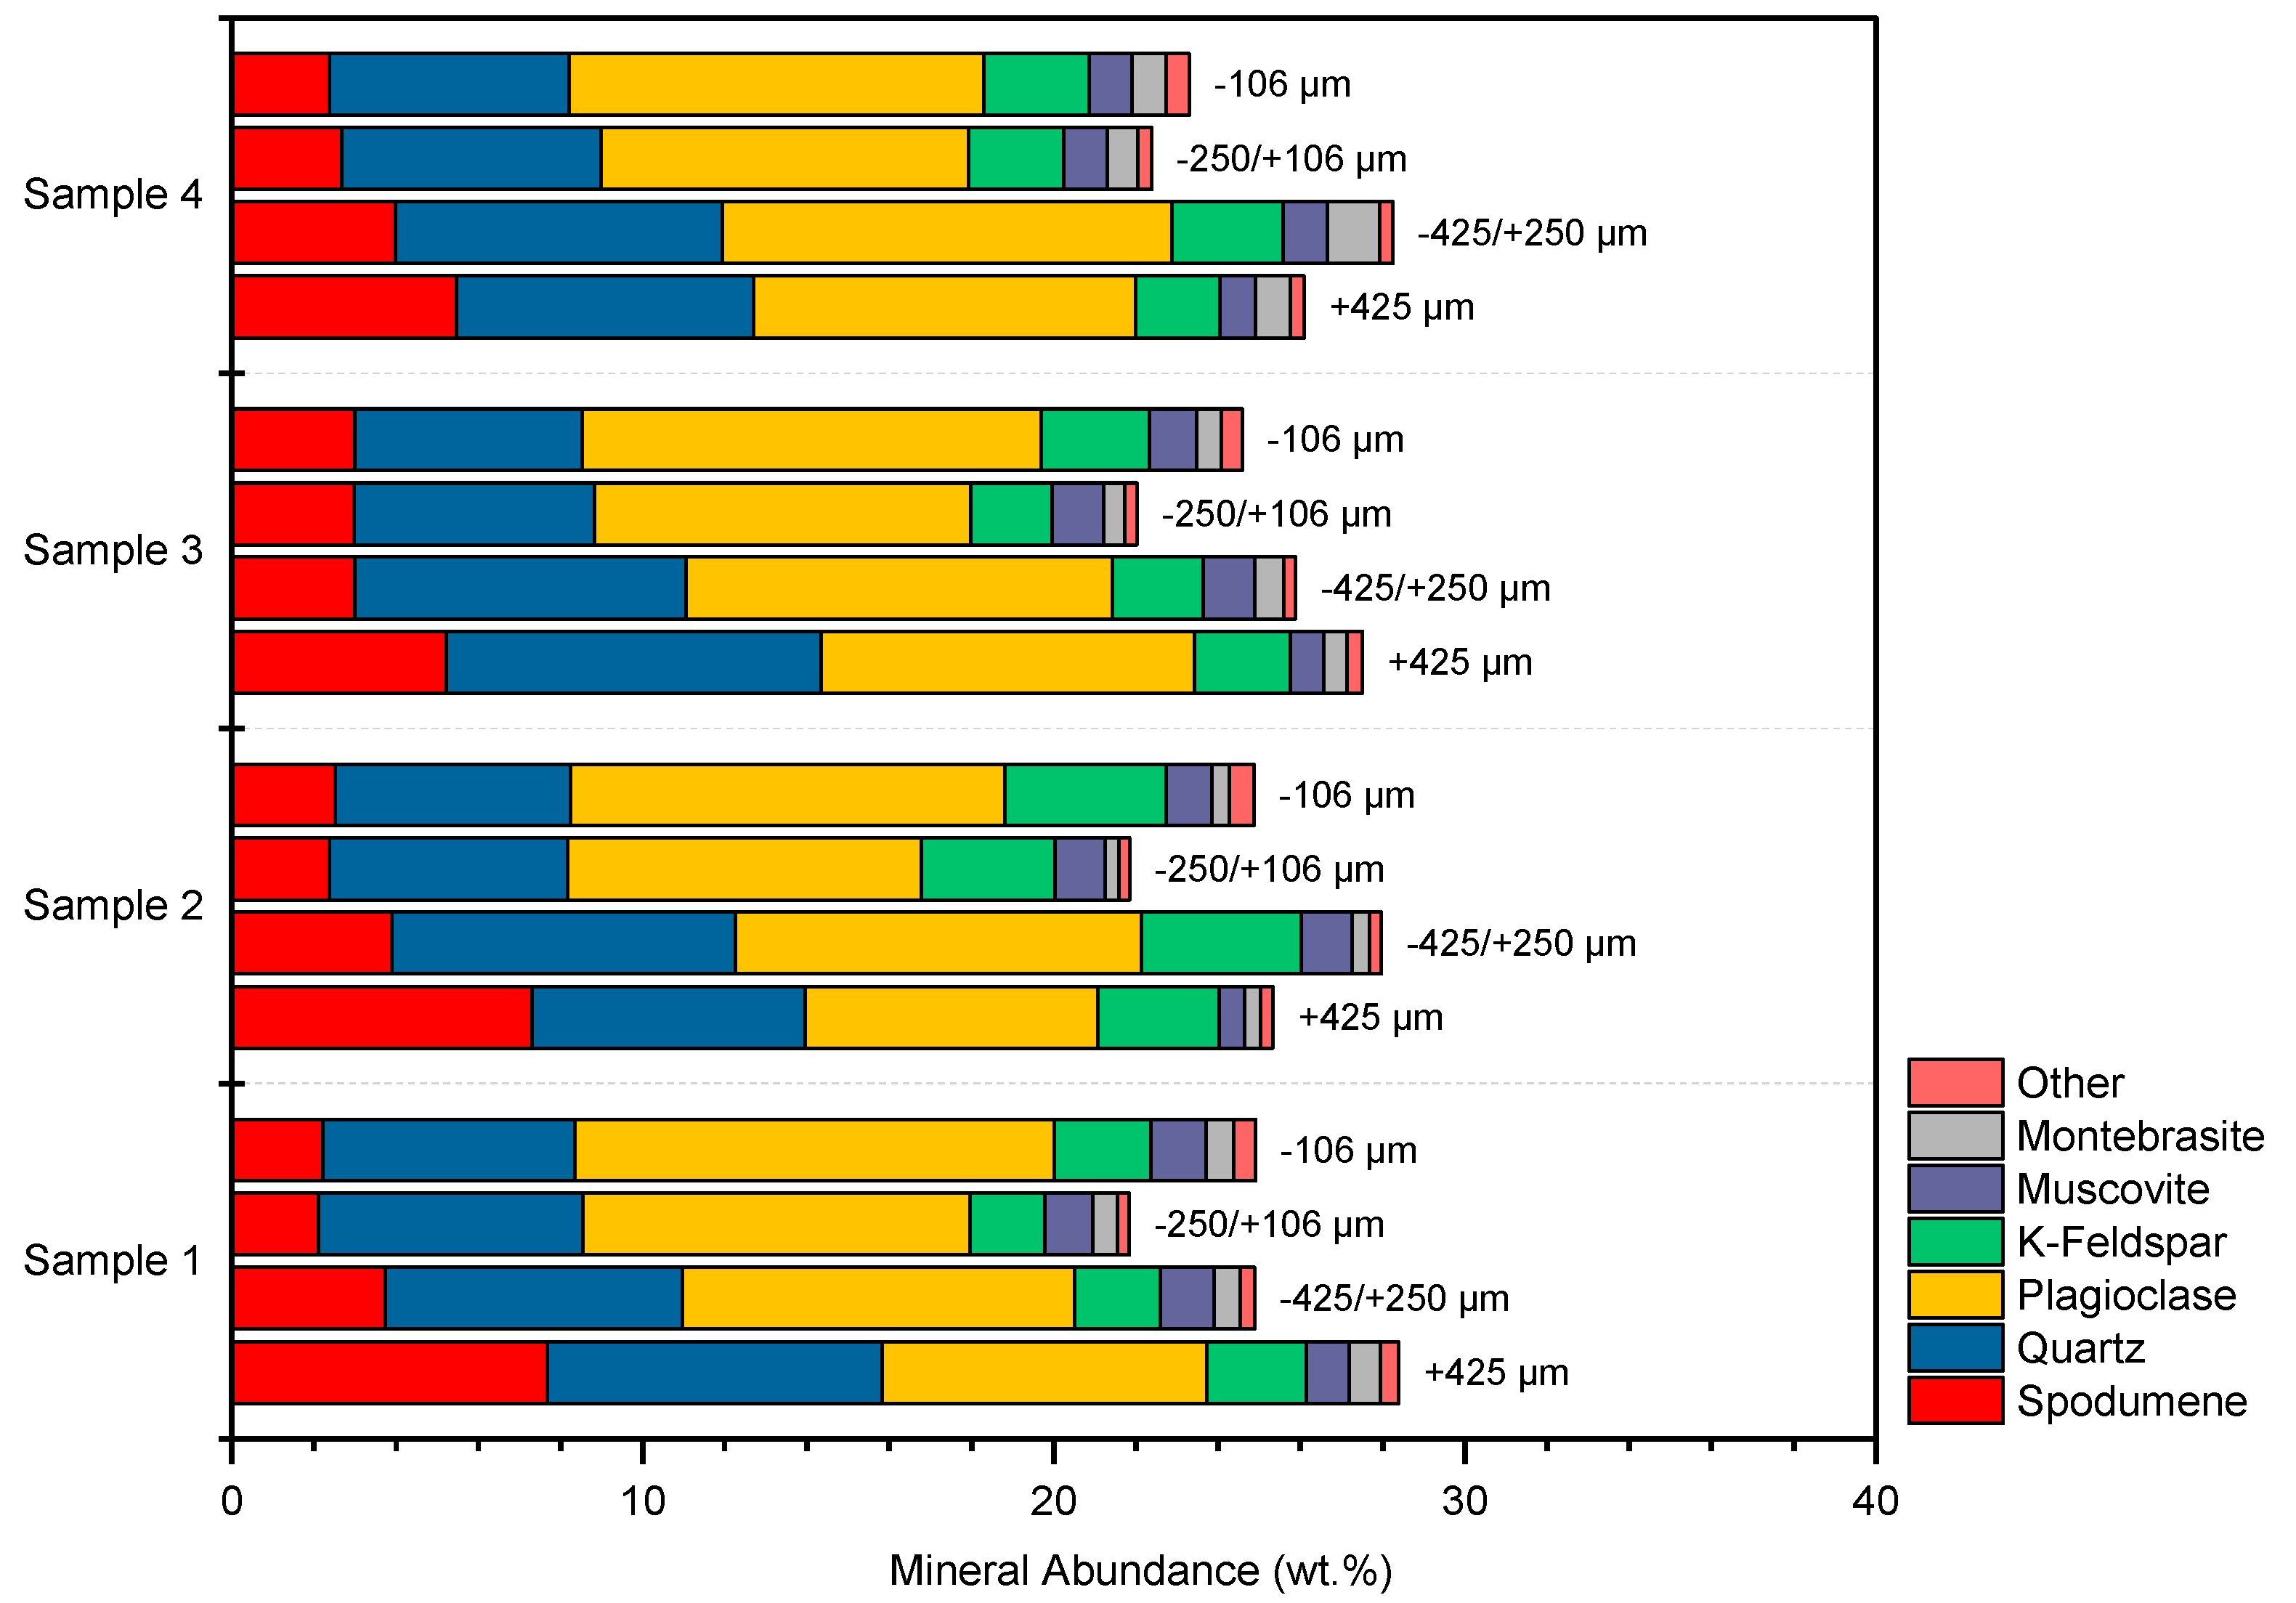
Table 2 shows the modal mineralogy of the head samples, as determined by QEMSCAN. The spodumene (LiAlSi2O6) grade (wt. %) was similar for all the four samples, ranging between 14.2% and 16.1%. Quartz (SiO2), plagioclase (albite: NaAlSi3O8), and muscovite [KAl2(AlSi3O10)(OH)2] showed very little variation among the samples. The grade of K-feldspars (KAlSi3O8) ranged from 8.7% to 9.7%, with the exception of Sample 3, which was 14.0% K-feldspar. Montebrasite [LiAl(PO4)(OH,F)] content of the samples varied from 1.5% to 3.69%.
Figure 3 illustrates the mineral distribution by size fraction, where the mineral grade is a function of the weight percent mass distribution among the fractions. For all samples, spodumene preferentially deported to the +425 μm size fraction, compared with finer fractions. Montebrasite and gangue minerals (quartz, feldspars, muscovite) were uniformly distributed across all size fractions. Further analysis showed that spodumene grain size (D50) ranged from 152 to 201 μm—coarser than the average grain size of other minerals.
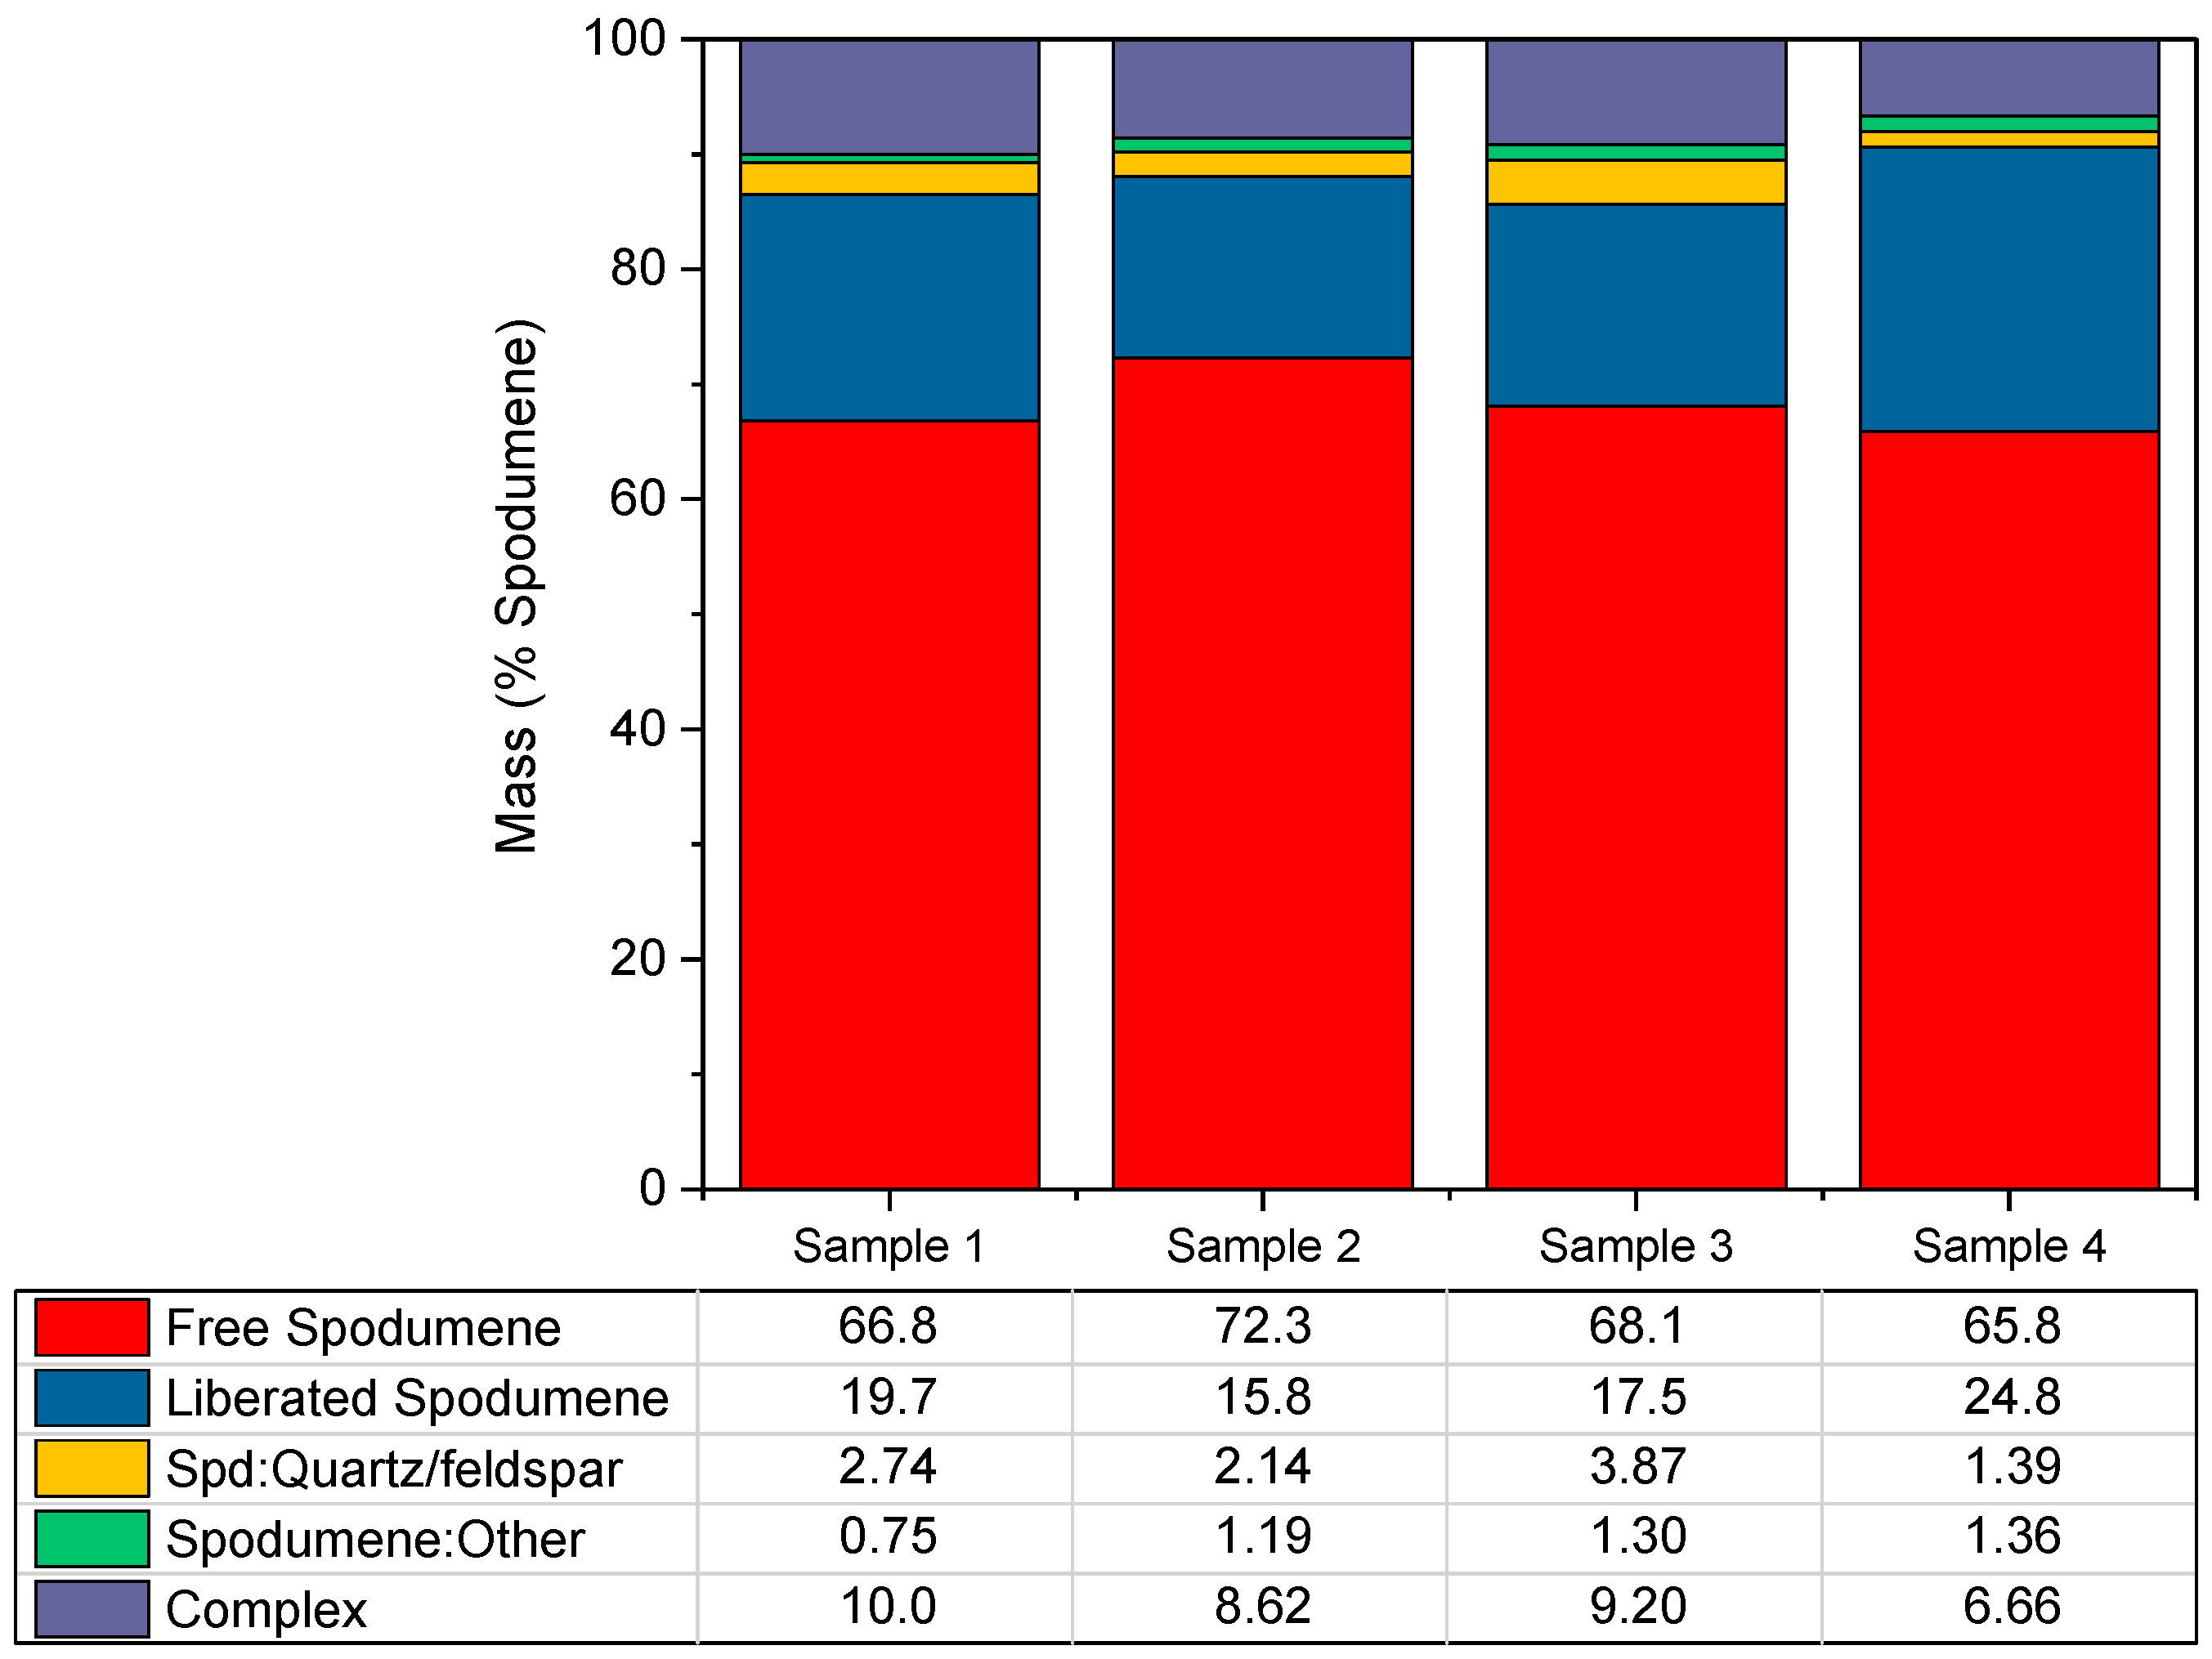
Figure 4 illustrates the liberation and association profile of spodumene at a P80 of 425 µm. Free and liberated spodumene ranged from 86% (Sample 3) to 91% (Sample 4). The remainder of the spodumene occurred as complex particles 7% in Sample 4 to 10% in Sample 1, quartz/feldspars (1.4% to 3.9%), and other minerals (<1.5%).
The disproportionate occurrence of spodumene in the +425 μm size fraction, the presence of coarse spodumene grains, and the degree of liberation at a P80 of 425 μm suggested that gravity separation techniques may be a suitable means of recovering and concentrating spodumene from associated gangue minerals. The liberation and association data are also critical to understanding flotation behavior and interpreting flotation test results (outside the scope of the present study).
The four head samples were combined to produce a Head Composite sample for heavy liquid and dense media separation testing. Table 3 reports geochemical analyses including major elements, lithium (Li), and loss on ignition for the combined Head Composite sample.

3.2. Heavy Liquid Separation

Heavy liquid separation testing was performed on the Head Composite sample to evaluate the effectiveness of gravity separation techniques, specifically DMS. Table 4 summarizes the abundance of each mineral in the Head Composite sample, the average specific gravity of each mineral, and the concentration criterion (CC; calculated using equation 1, where spodumene is the heavy mineral), in water and in a heavy liquid with a specific gravity of 2.5 (i.e., an arbitrary value higher than water but lower than the S.G. of most gangue minerals in the system).
In water, the concentration criterion value for the separation of spodumene from other silicate minerals ranged from 1.18 (for muscovite) to 1.38 (for K-feldspar). It is generally accepted that gravity separation techniques are effective when the concentration criterion is greater than 2.5 [32]; indicating that spodumene and associated gangue minerals cannot be easily separated from each other in water even if minerals are perfectly liberated. However, raising the specific gravity of the liquid increases the concentration criterion for all of the silicate gangue minerals in the system. For example, when a heavy liquid (S.G. 2.5) was used, the concentration criterion between spodumene and various gangue minerals ranged from 2.00 to 11.8, suggesting that spodumene can be easily separated from albite (CC = 5.20), quartz (CC = 4.26), and K-feldspar (CC = 11.8); the separation of spodumene from muscovite may be less efficient due to its lower concentration criterion value (i.e., <2.5). We note that the concentration criterion calculation considers an idealized environment where minerals are perfectly liberated from one another and the S.G. of the heavy liquid can be precisely controlled. In real ore systems, neither of these points is true, and some degree of imperfect separation is expected, regardless of the calculated CC values for each mineral.
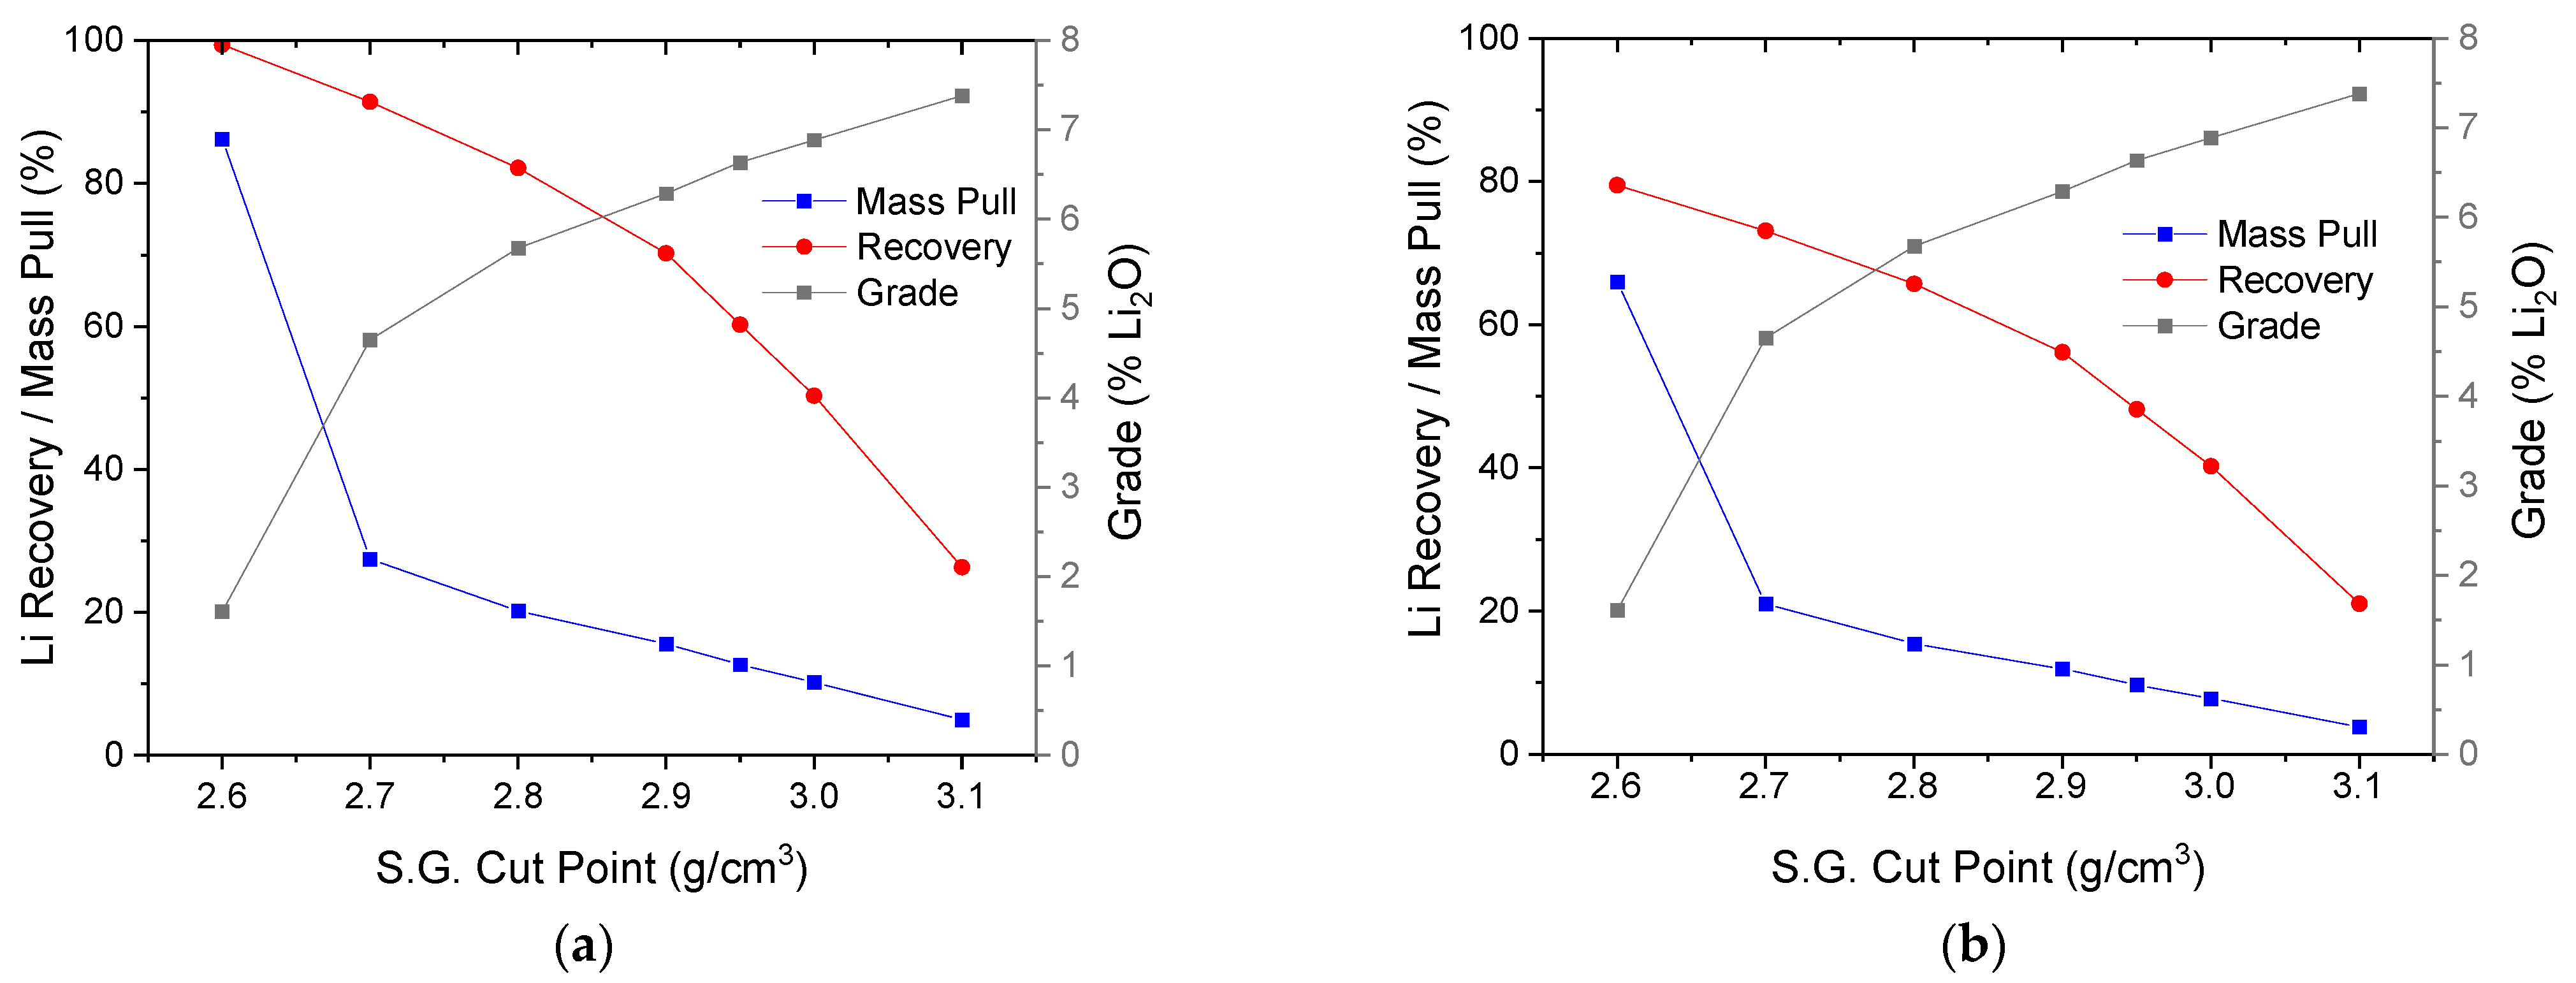
To prepare for testing, a 2.66 kg subsample of the Head Composite material was screened on a 20 mesh (840 µm) screen to remove undersize material: 23.5% of the mass, containing 20% of the lithium, reported to the −840 µm fraction and the remaining 76.5% (2.03 kg containing 80%) was subjected to heavy liquid testing. Figure 5 shows the results of heavy liquid testing. The plot on the left (a) shows the lithium and mass recovery to the sink fraction based on the feed to the heavy liquid test (‘stage recovery’), while the plot on the right (b) shows the lithium and mass recovery to the sink fraction based on the whole feed (‘global recovery’, i.e., including the −840 µm that was not subjected to heavy liquid separation testing. Therefore, the global recovery is lower than stage recovery).
Figure 5 demonstrates the grade–recovery relationship as a function of the specific gravity cut point. When the cut point of the heavy media dropped, the concentrate grade dropped as gangue and middlings particles reported to the sink fraction, diluting the concentrate. A significant change in grade and mass recovery occurred between a cut point of 2.60 and 2.70, attributed to the recovery of quartz (SG = 2.65) and albite (SG = 2.63) to the sink fraction when the specific gravity of the fluid fell below the specific gravity of the mineral. Aramante et al. [33] performed HLS testing on a spodumene-bearing ore with similar mineralogy to the Hidden Lake pegmatites. In this study, the researchers obtained a sink product grade of 5.17% Li2O with 61% Li recovery at an S.G. cut point of 2.70 on a −2360/+2000 µm feed. These results are in line with those presented in Figure 5; the comparatively improved grade–recovery performance in HLS testing of Hidden Lake material can likely be attributed to a finer feed particle size distribution.
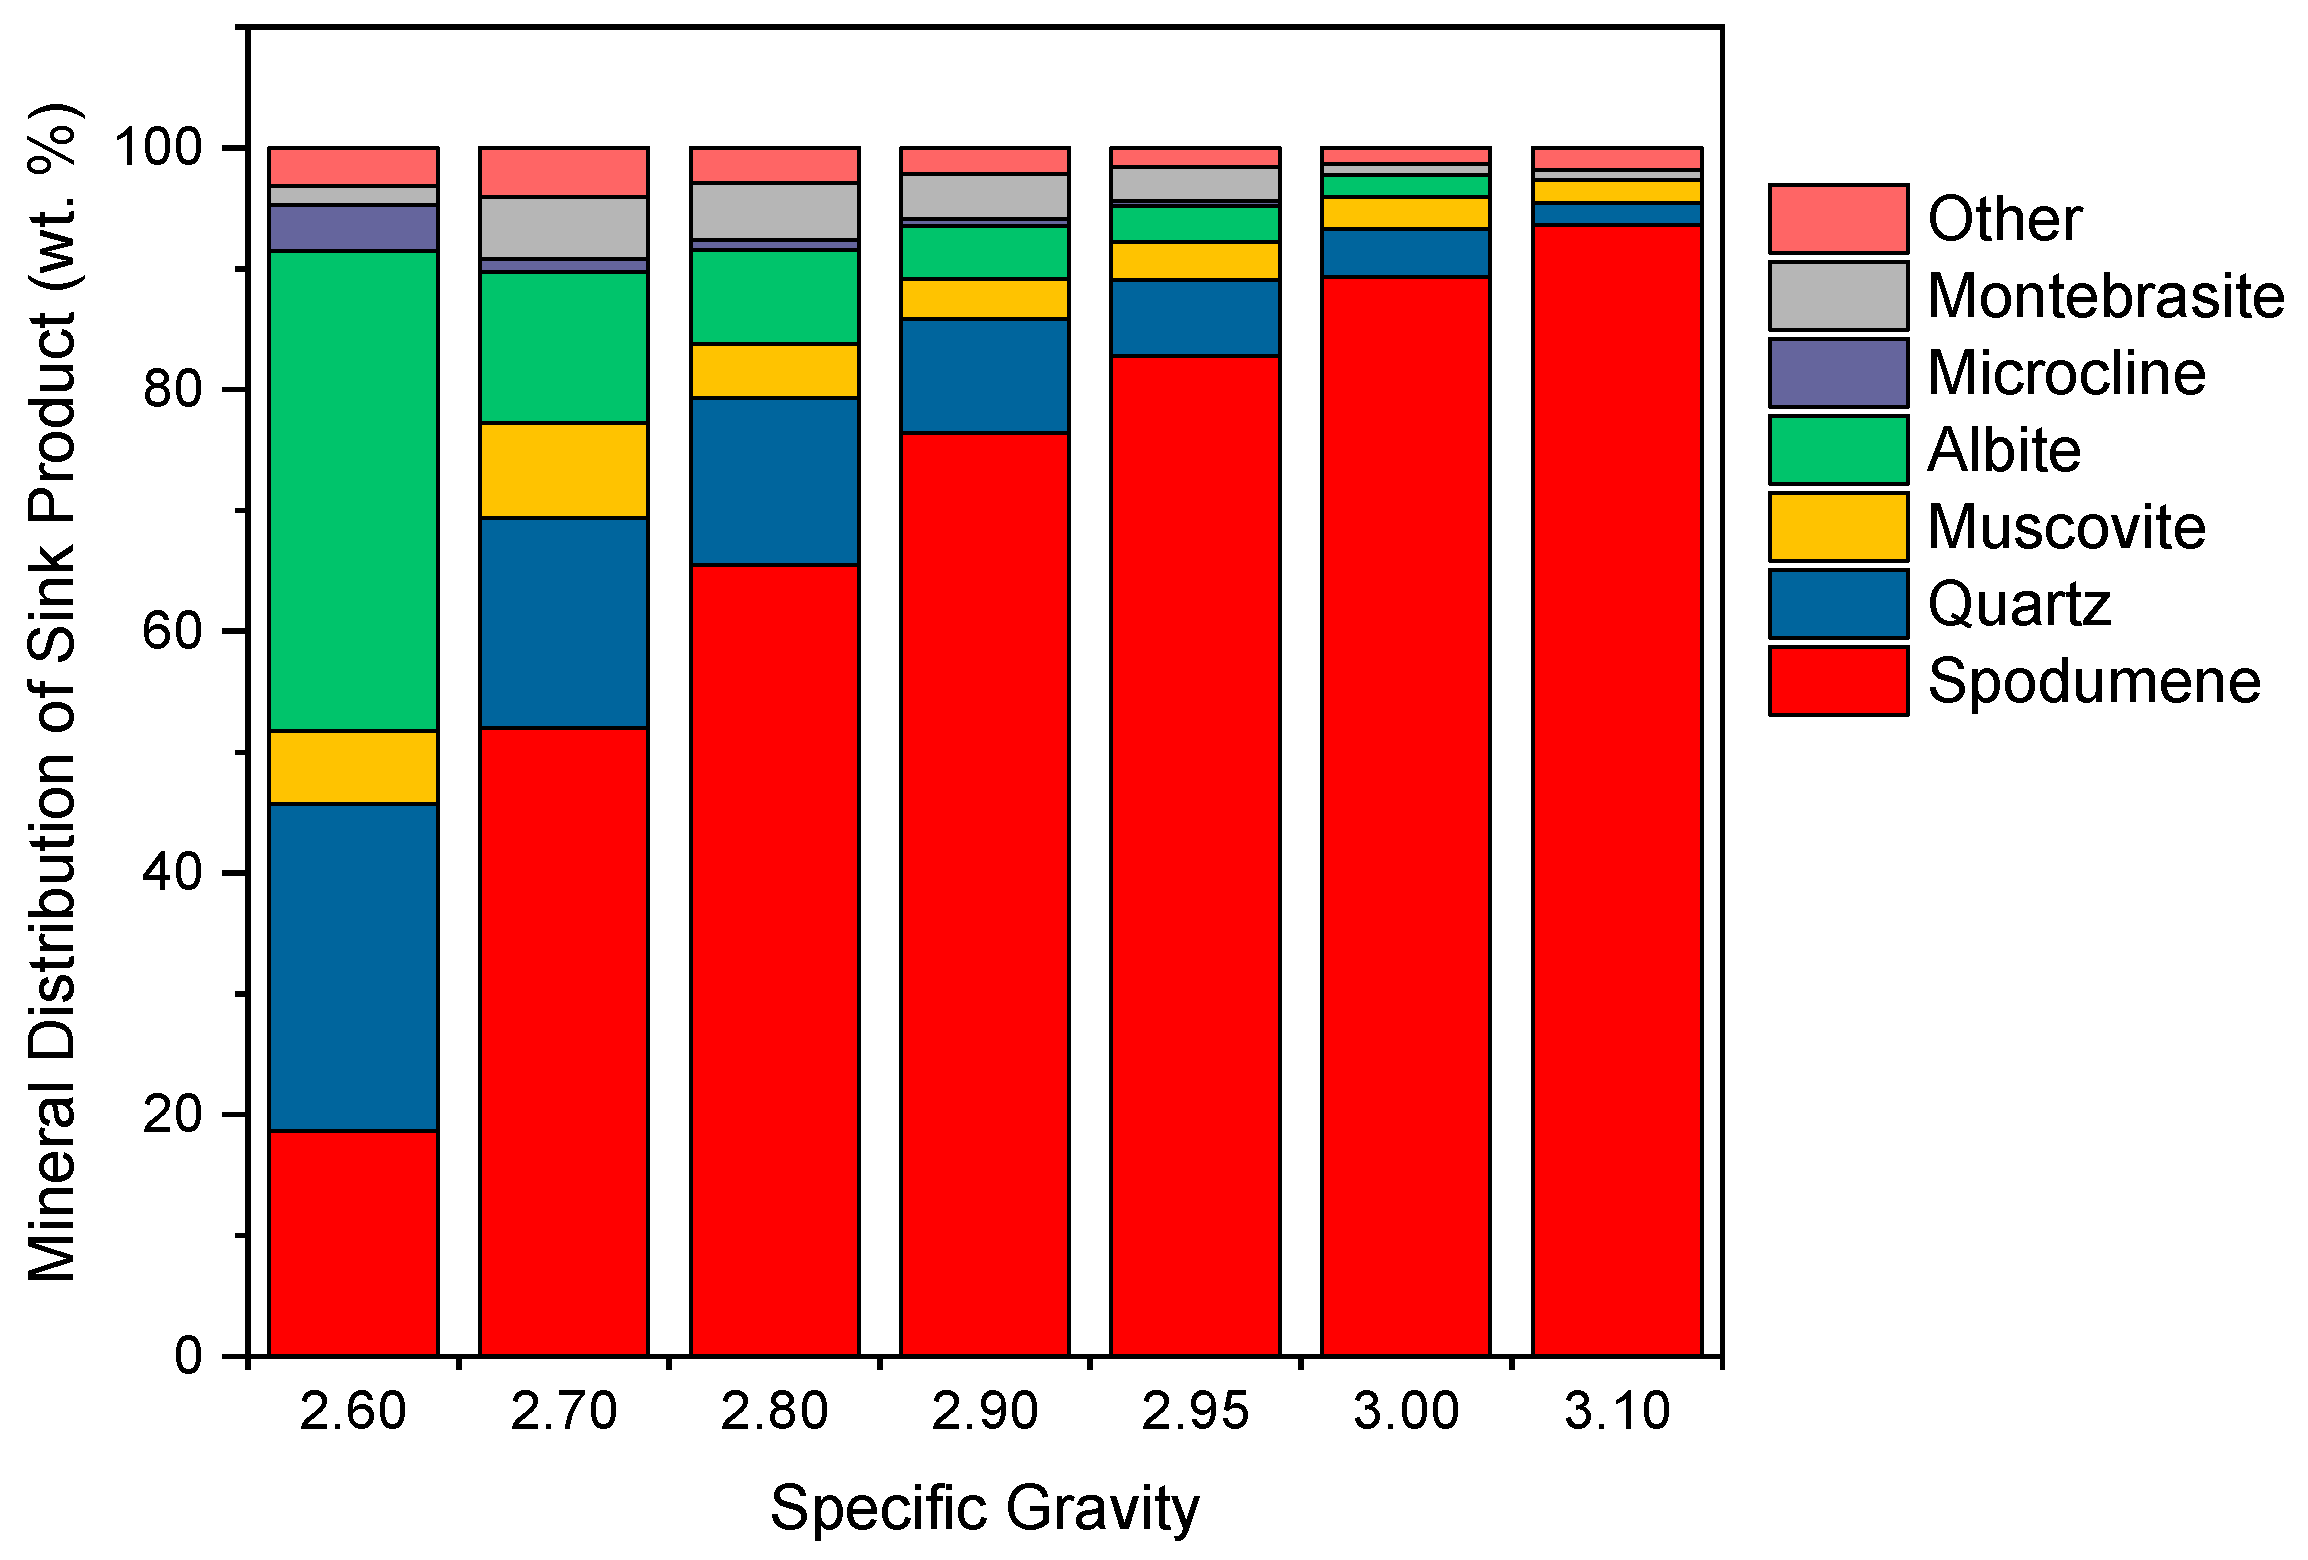
The products from heavy liquid testing were analyzed by quantitative XRD to construct a mineral balance. Figure 6 shows the mineral distribution in the sink fraction at each specific gravity cut point.
XRD results confirmed that the increase in mass to the sink product and decrease in sink grade (% Li2O) at S.G. 2.60 resulted from more silicate gangue minerals reporting to the sink fraction, specifically quartz and albite. As was expected, the sink product at the highest specific gravity tests (3.10) had the highest lithium grade (7.33% Li2O or ~94% spodumene).
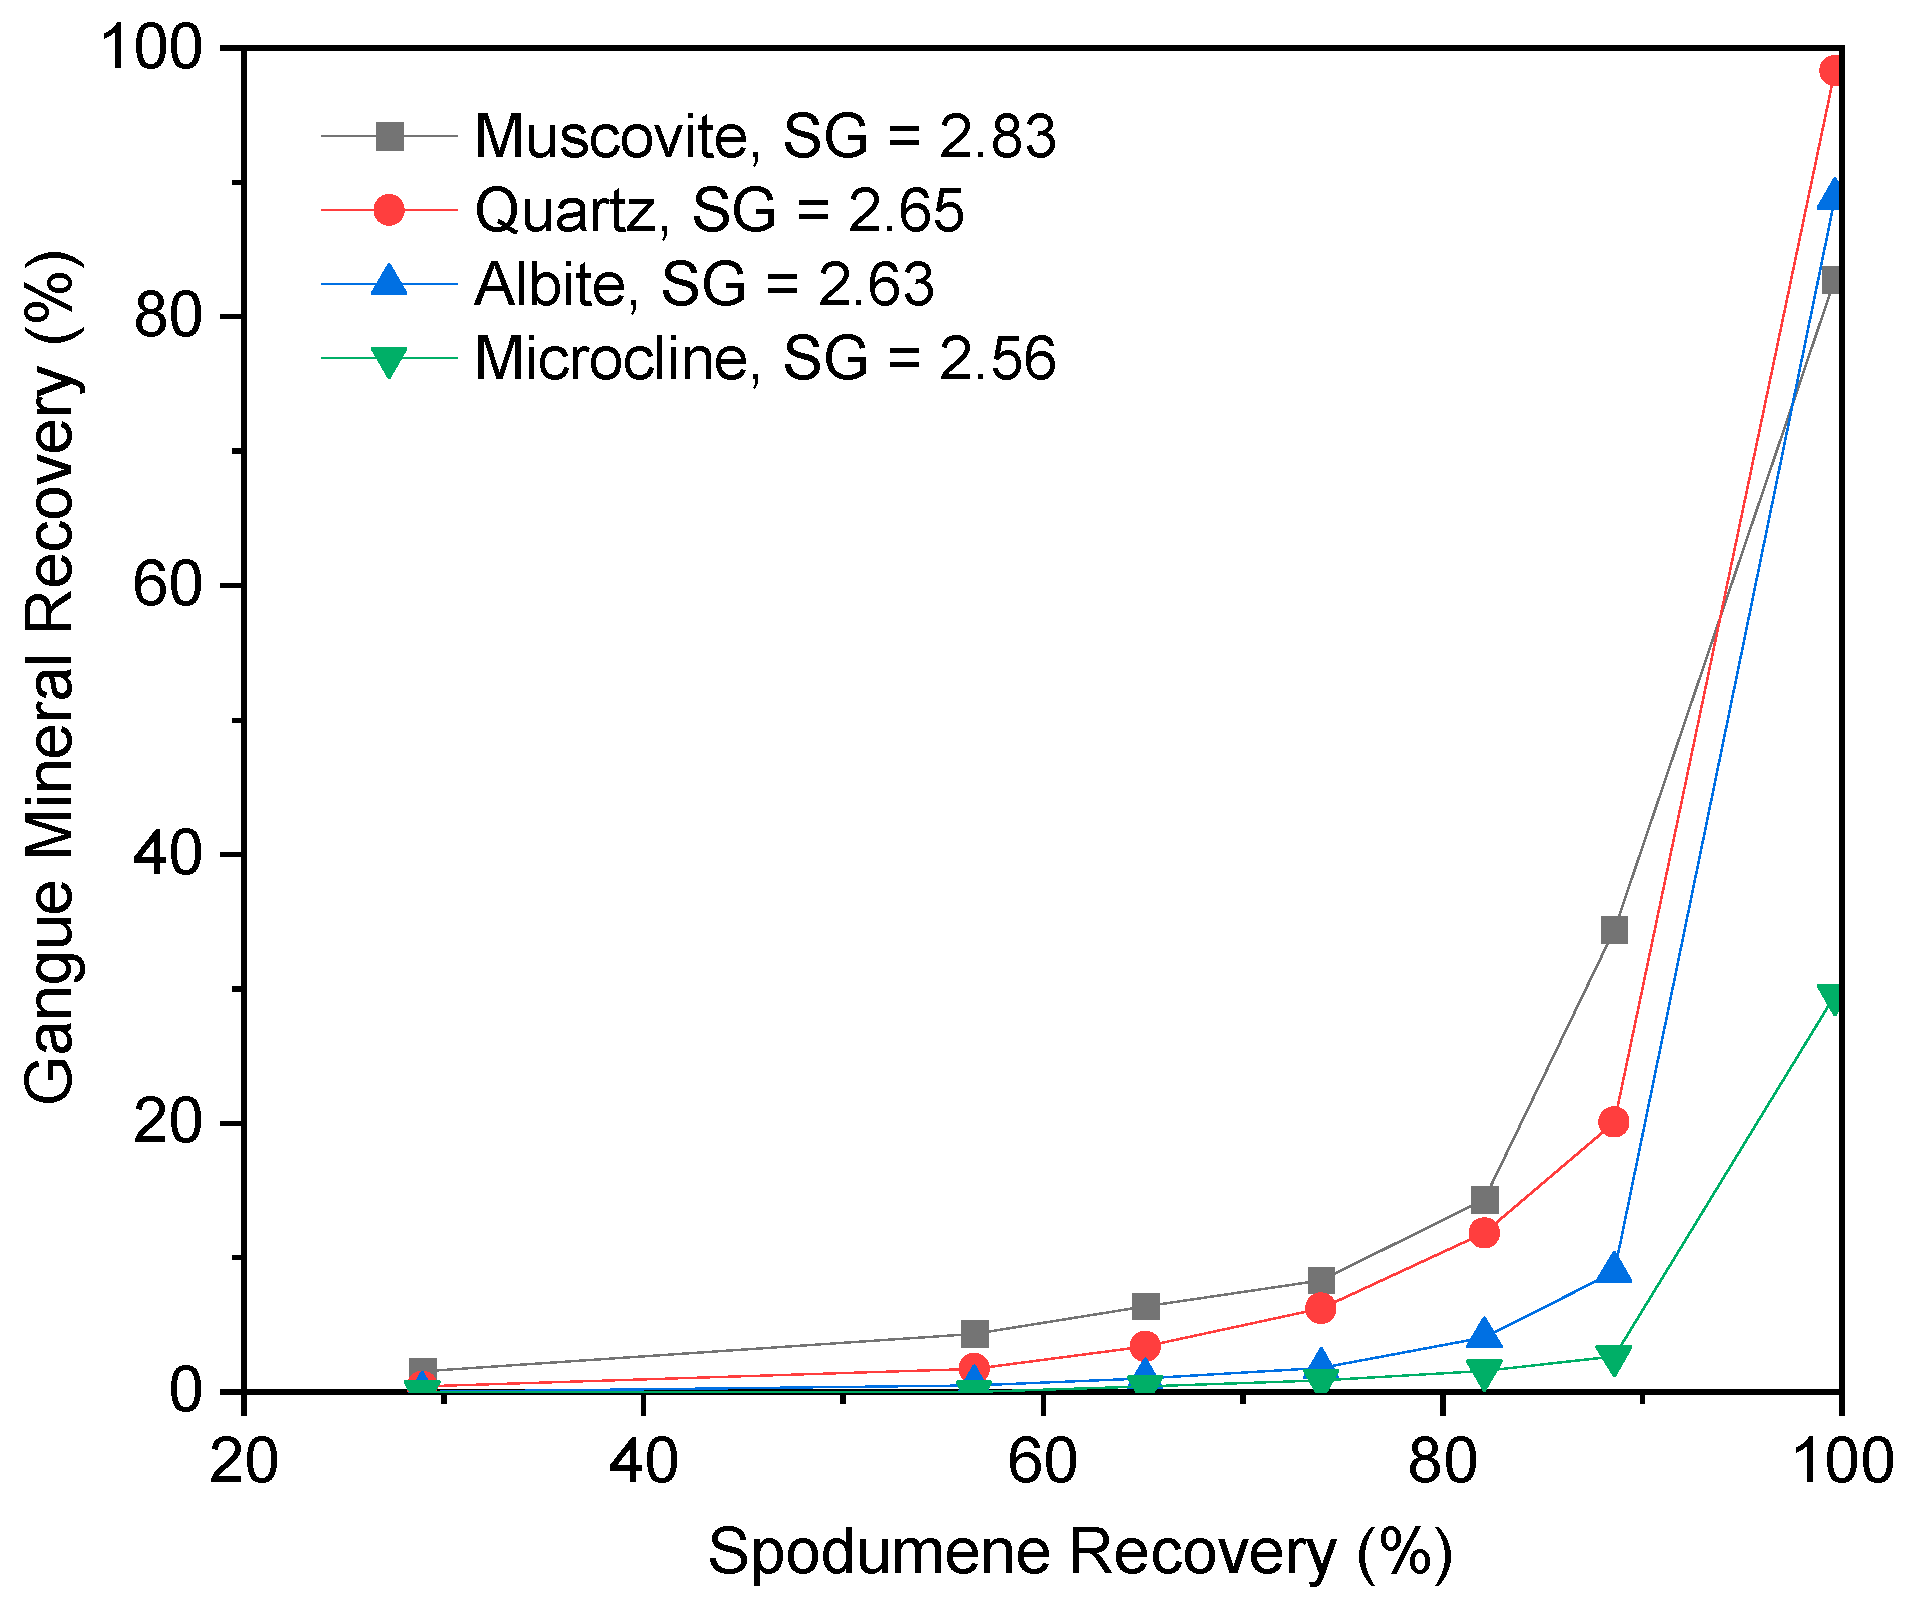
Figure 7 illustrates the recovery of silicate gangue minerals as a function of spodumene recovery, showing the selective separation of spodumene from muscovite, quartz, albite, and microcline. Selectivity (i.e., the preferential recovery of spodumene over gangue minerals) was a function of the gangue mineral-specific gravity (and by extension, the concentration criterion) and was as follows (in descending order): microcline > albite > quartz > muscovite.
In Figure 7, the closer the curve is to the x-axis, the better the selectivity. Even in the case of spodumene-muscovite separation—where the calculated concentration criterion suggested that efficient separation may be difficult—selectivity was high. For spodumene recovery values below ~85%, corresponding gangue mineral recovery was less than 15%. As lithium recovery increased beyond 85%, gangue mineral recovery increased significantly, particularly for minerals with higher specific gravity (quartz and muscovite). These results demonstrate the potential for DMS to be used as a pre-concentration stage, despite literature reports of the challenges associated with separating minerals with similar densities [13].
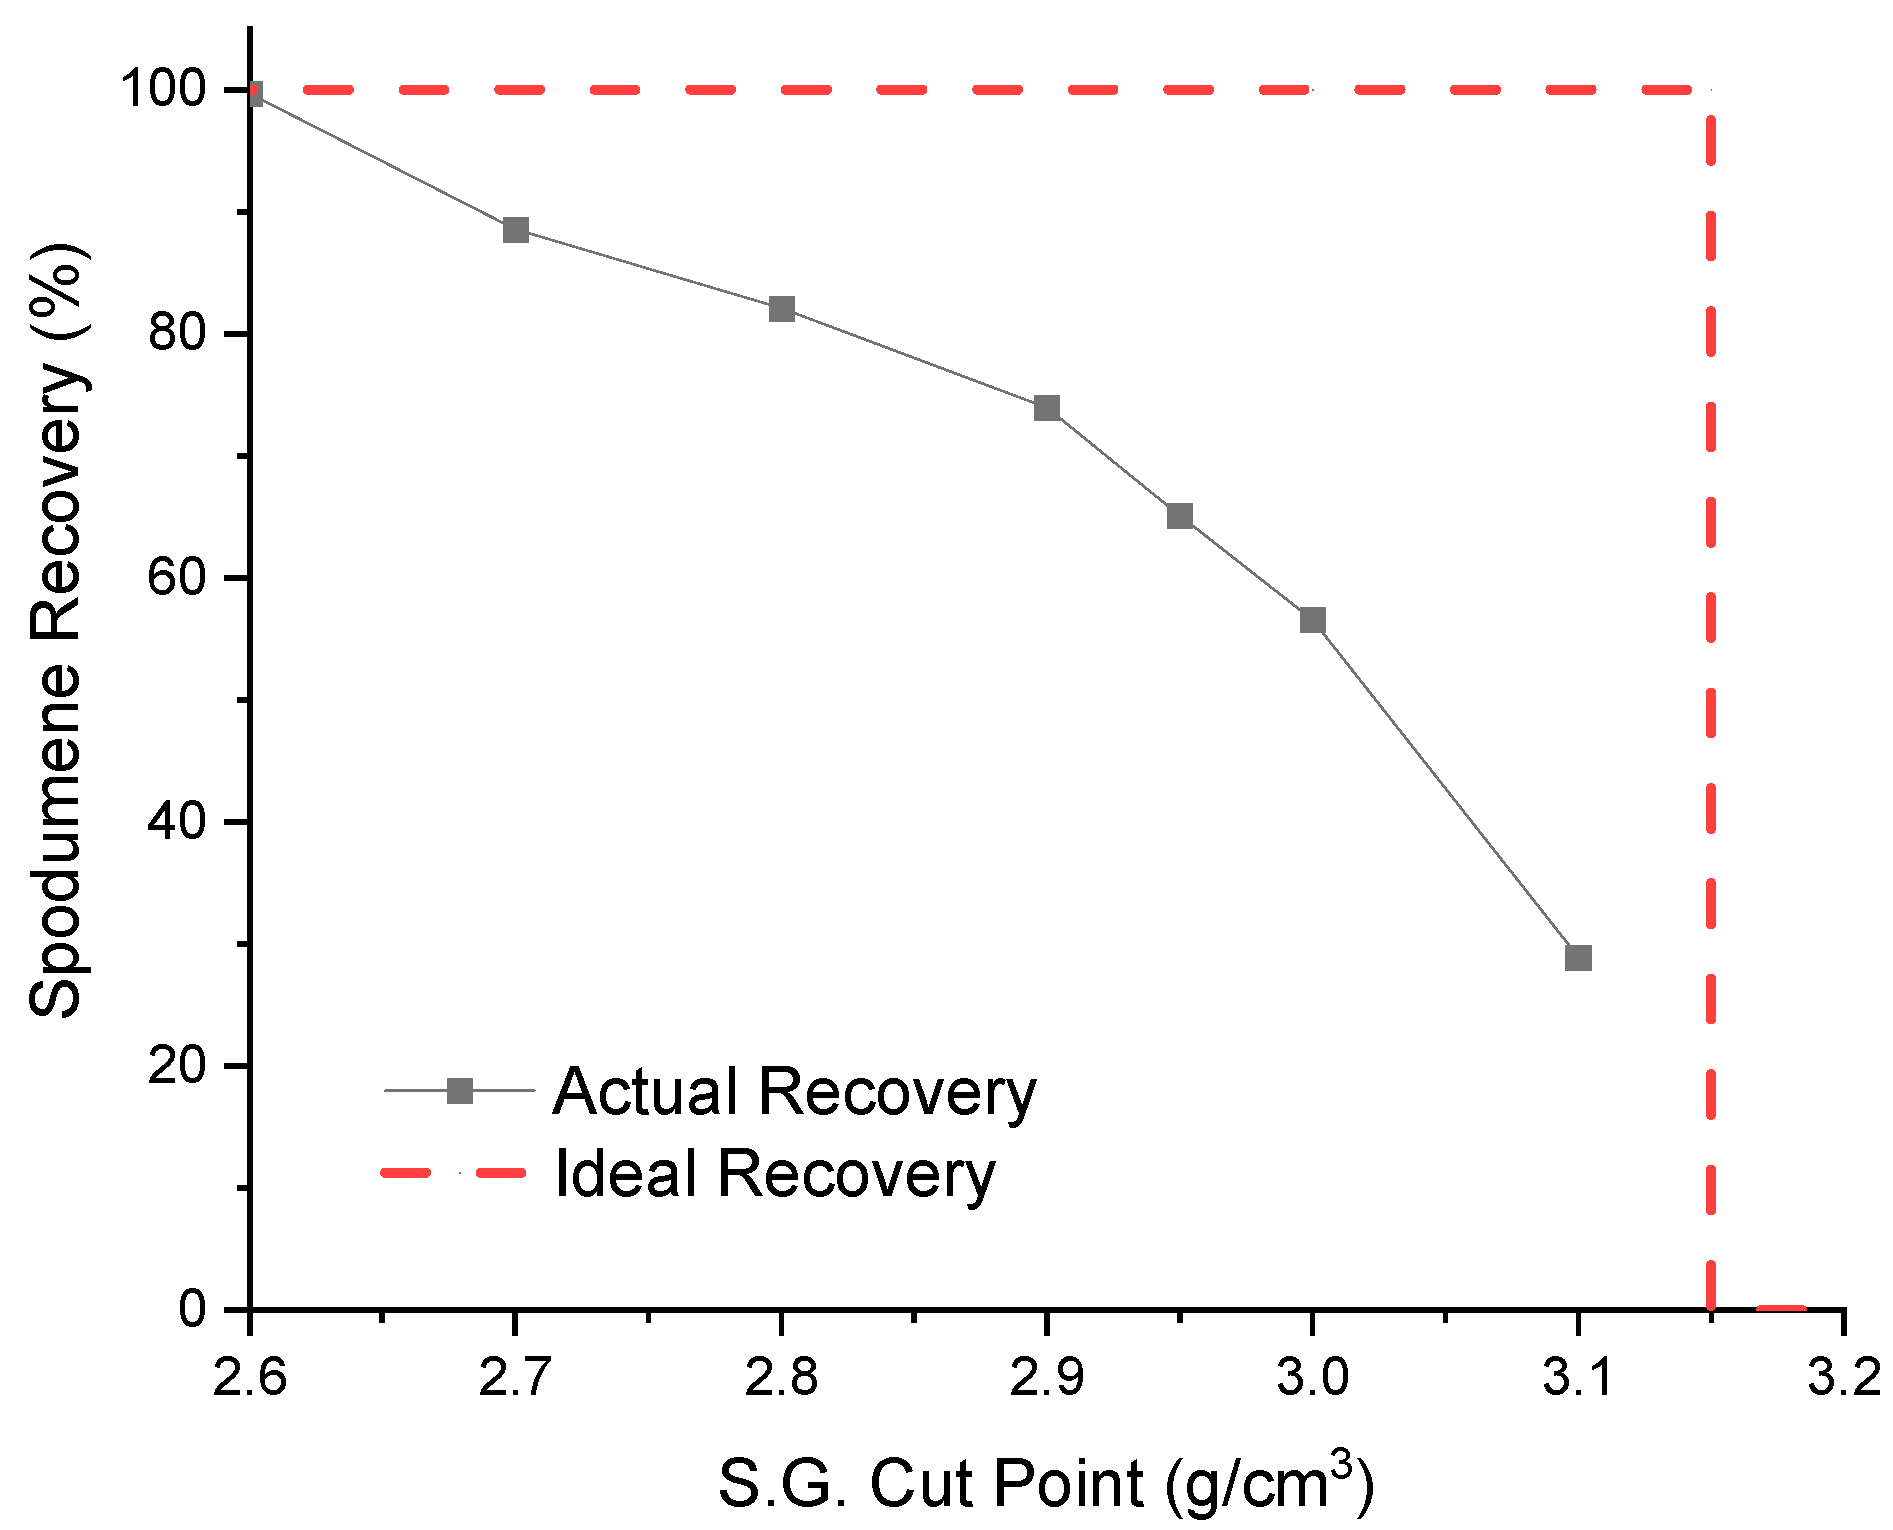
The “sharpness” at which spodumene is separated from gangue minerals is an important parameter in beneficiation flowsheet design, and in assessing the performance of heavy liquid separation or the applicability of dense media separation. Ideally, the recovery of the mineral of interest to the sink product is complete (100%) when the heavy liquid density is less than the density of the mineral. As the density of the heavy liquid surpasses the density of the mineral, the recovery should theoretically drop to nil. If plotted, the ideal recovery of a mineral versus S.G. cut point forms a vertical line at the S.G. of the mineral, like the red line pictured in Figure 8.
In real ore systems, ideal separation is impossible due to imperfect mineral liberation. Therefore, the actual separation curve will deviate from the ideal—this deviation was observed in the behavior of the Head Composite during heavy liquid separation testing (black line, Figure 8). Deviation from the ideal complicates the selection of an S.G. cut point for dense media circuit operation as there will be a tradeoff between product grade and recovery.
The minimum spodumene concentrate grade required for downstream processing depends on the end-use of the lithium and downstream processing techniques, varying from approximately 6.0% Li2O to 7.5% Li2O [30,34]. Because the sharpness of separation deviates from the ideal case, a recovery loss must be incurred to produce a final concentrate that meets grade specifications. Figure 5 shows that a cut point of 2.90 produced a concentrate grading 6.29% Li2O; beyond this cut point, the grade increased and lithium recovery decreased. At S.G. 2.90, global lithium recovery to the sink product was 56.2% in 11.9% of the global mass (i.e., considers that 23.5% of the mass reported to the −840 µm fraction and was not subject to heavy liquid testing). While these results are positive in terms of concentrate grade, the lithium recovery was low compared to typical expected values for hard-rock processing by other separation techniques, such as flotation [27]. During HLS testing, the S.G. cut point that produces a high-grade, high-recovery sink product is a good indicator of the degree of spodumene liberation; i.e., the lower the S.G. cut point at which a high-grade, high-recovery concentrate can be produced, the better the spodumene liberation.
Examining Figure 5 at a cut point of S.G. 2.70, global lithium recovery to the sink product was high (>90% based on HLS feed). While the concentrate grade produced at this cut point (4.65% Li2O) did not meet minimum specifications, there was still significant mass rejection; nearly 80% of the global mass reported to the float fraction. The HLS results suggested that a multi-stage DMS circuit would be an effective way to recover and upgrade spodumene from the Hidden Lake pegmatites; using an initial DMS stage aimed at rejecting mass and silicate minerals (to improve flotation performance) while maintaining high lithium recovery, followed by a second DMS stage to produce a concentrate that meets minimum grade specifications.

3.3. Dense Media Separation Testing

Using the results of heavy liquid separation, a DMS continuous test was designed and conducted according to the flowsheet shown in Figure 9.
Figure 10 compares the results of the DMS with those of the HLS testing. The DMS test successfully produced a final spodumene concentrate (i.e., sink product at S.G. 2.90) grading 6.11% Li2O; similar to that produced in HLS.
Lithium recovery to the spodumene concentrate was 6.7 percentage points lower in DMS compared with HLS (49% vs. 56% recovery), attributed to process scale-up; HLS is a simulated environment that is easily controlled, whereas DMS is operated continuously, using solid particulate matter to control fluid-specific gravity. In particular, control of the dense media set point is difficult at scale; minor fluctuations in the media density tend to occur, resulting in changes in mass distribution to each of the products. The magnitude of these changes is a function of the mineralogy of ore. The closer the specific gravities of the ore and gangue minerals, and the more middlings particles with intermediate densities, the more sensitive the process will be to changes in dense media-specific gravity.
The results showed higher-grade and lithium distribution to the DMS middlings fraction (i.e., the float product at S.G. 2.90), with only a minor increase in lithium reporting to the silicate final tailings. As expected, DMS operation was slightly less efficient than heavy liquid separation. However, lithium units lost during DMS may still be recovered by flotation, should it be implemented to treat the DMS middlings and −840 µm fraction.

3.4. Effect of the S.G. Cut Point in DMS Operation

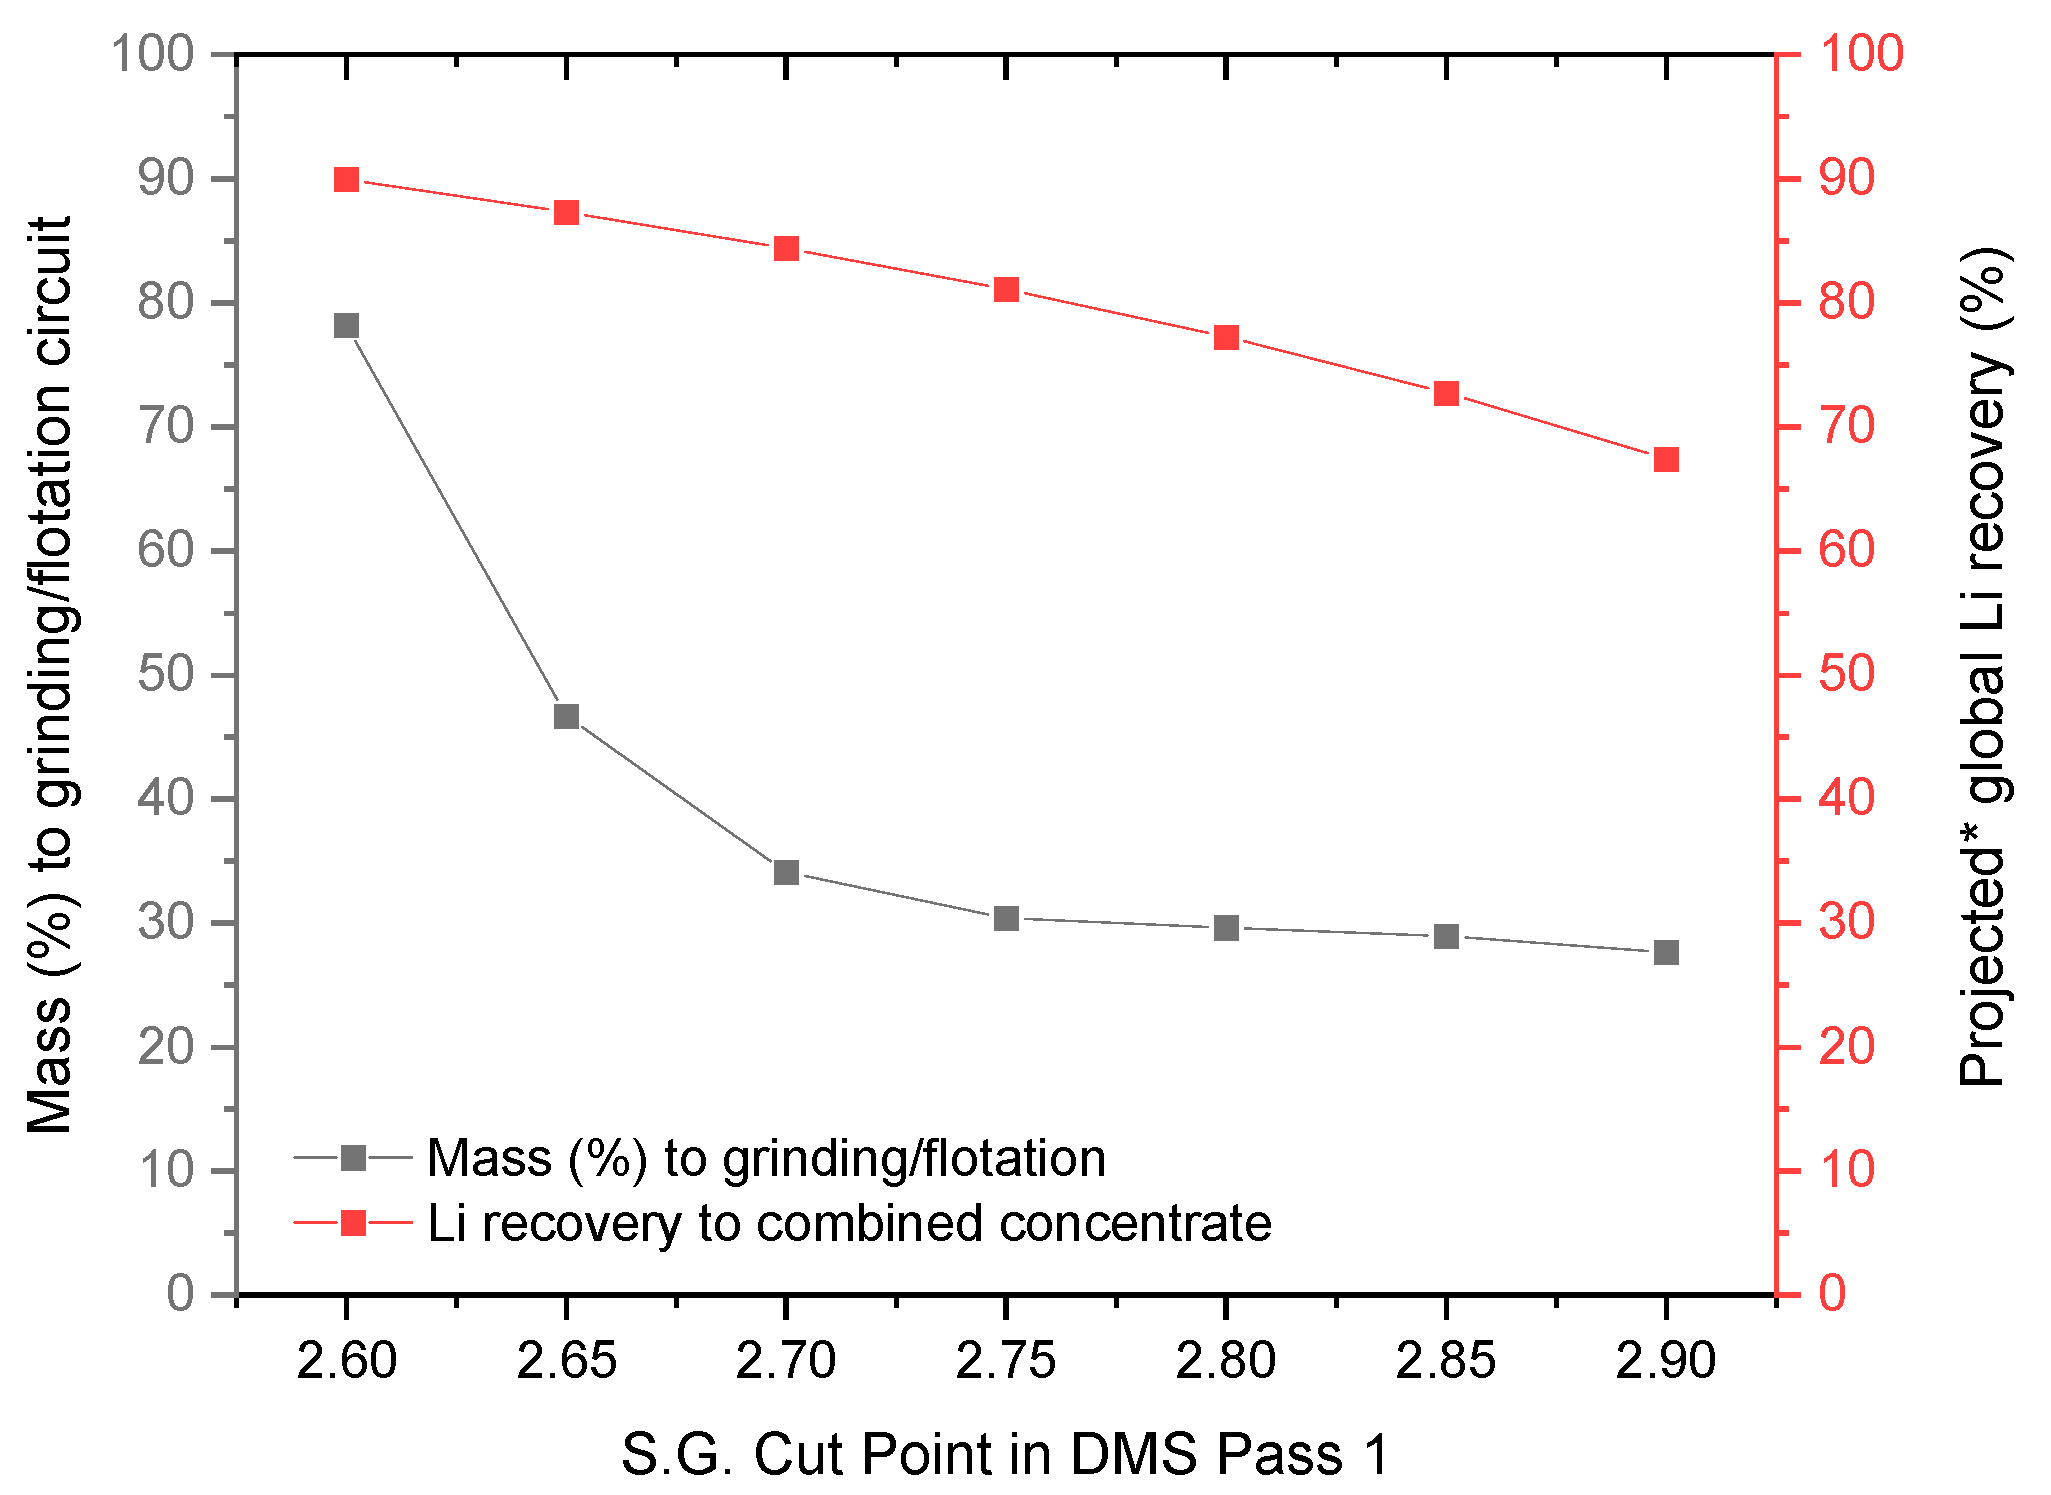
A sensitivity analysis (based interpolation of the heavy liquid separation results) was used to quantify the effect of changes in dense media S.G. cut point on overall process performance. First, the specific gravity cut point of DMS Pass 1 was increased from 2.60 to 2.90 in increments of 0.05. It was assumed that the S.G. cut point of DMS Pass 2 remained constant at 2.90 (meaning that the grade of the sink fraction was constant at ~6.3% Li2O), and that all DMS middlings and −840 µm material could be subjected to flotation with an expected lithium (stage) recovery of 80% and concentrate grade of ~6.4% Li2O; grade and recovery values were selected based on typical flotation test results for Hidden Lake material (the details of flotation testing will be discussed in a subsequent paper, currently under preparation).
We acknowledge that flotation performance would likely vary with changes in feed composition. However, this variation would not materially change the conclusions drawn from the analysis, and thus was assumed to be constant for the sake of discussion. Likewise, the values of the flotation grade and recovery selected will not affect the trends observed in the analysis. The results of the first sensitivity analysis (Figure 11) showed that changes in the operation of the first DMS stage (i.e., fluctuations in specific gravity cut point) influenced recovery relatively equally with each incremental change in specific gravity.
Since the first DMS stage directly controls the mass and lithium reporting to the final tailings, the lower the S.G. cut point, the less mass (and therefore, less lithium) reported to the tailings. However, more mass was retained in the middlings fraction and sent to the flotation circuit, along with the −840 µm material. Figure 11 shows that at a specific gravity less than 2.70, the relationship between lithium recovery and mass diverges—minor incremental gains in recovery corresponded to a significant increase in the mass reporting to grinding and flotation. A drop in S.G. cut point (whether by design or due to operational variation) of 0.1 from 2.70 to 2.60 caused the mass flow to the grinding/flotation circuit to increase by 44% percentage points (from 34% to 78%).
From a process design perspective, the implementation of DMS as a pre-concentration stage ahead of flotation presents an opportunity. The size of the equipment required would be nearly cut in half, reducing capital costs. Grinding costs and energy consumption would also be significantly reduced. However, from an operational perspective, the sensitivity of the process to minor changes in specific gravity can be challenging and requires tight control of media density. Without control of the specific gravity of the dense media, the variability in mass reporting to downstream processes will be unmanageable. Constant changes in mill throughput will make grinding circuit optimization nearly impossible and without achieving the target grind size, flotation performance will suffer significantly. This may require that the DMS and flotation circuits be “decoupled” from each other with buffer capacity included in the process design.
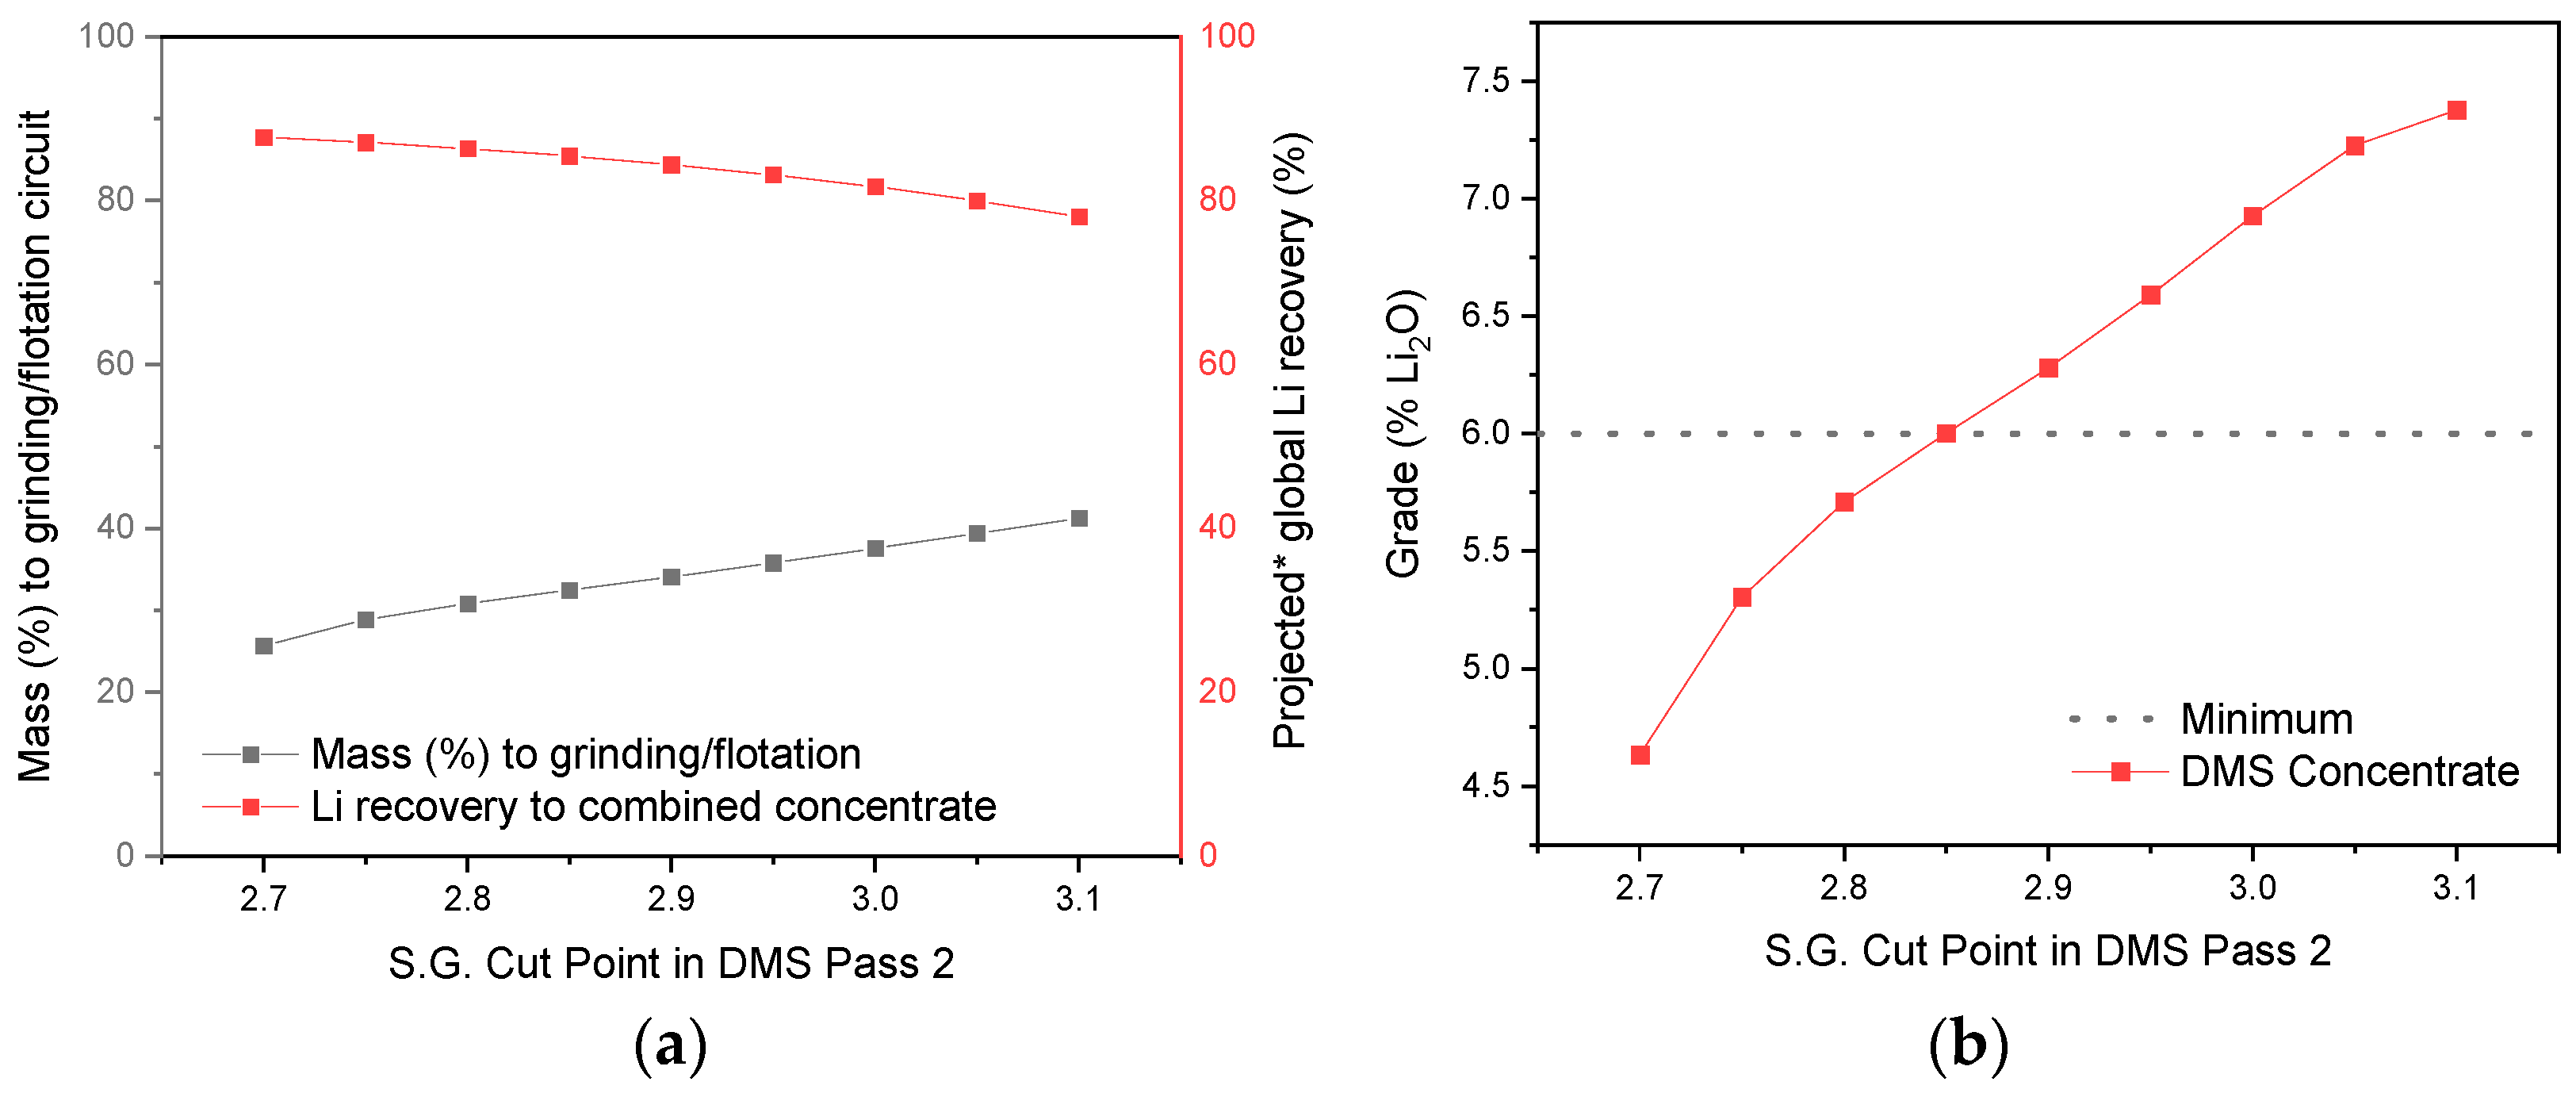
A second sensitivity analysis was conducted to assess the effect of changes in the S.G. cut point in the second stage of DMS (DMS Pass 2) on the process performance. The specific gravity cut point of DMS Pass 2 was increased from 2.70 to 3.10 in increments of 0.05. It was assumed that the S.G. cut point of DMS Pass 1 remained constant at 2.70, and that again, all DMS middlings and −840 µm material could be subjected to flotation with an expected lithium (stage) recovery of 80% and concentrate grade of ~6.4% Li2O. Figure 12 shows the effect of S.G. cut point in DMS Pass 2 on lithium recovery and mass flow to the grinding/flotation stage (left); and the effect of S.G. cut point on the DMS final concentrate grade (right).
In the second stage of DMS, changes in specific gravity cut point showed limited variability in the mass reporting to downstream processes, as this was largely a function DMS Pass 1 (as discussed above, drastic mass recovery changes occurred when the S.G. dropped below 2.70 in DMS Pass 1). However, DMS Pass 2 controlled the grade of the final DMS concentrate. Figure 12 shows that when DMS Pass 2 was operated below an S.G. cut point 2.85 (very close to the operational cut point of 2.90), the DMS concentrate failed to meet minimum concentrate grade specifications (approximately 6.0% Li2O), indicated by the dashed horizontal line. Therefore, although there was limited impact on mass distribution (assumed steady operation of DMS Pass 1), the concentrate grade was highly sensitive to minor variation in dense media-specific gravity in DMS Pass 2. In practice, it is possible that variations in the cut points of both DMS Pass 1 and 2 may occur. These would result in changes in the mass reporting to the grinding circuit and the DMS concentrate grade. Further, due to the general heterogeneity of ores, changes in the modal mineralogy of the feed to the DMS circuit would also be expected to cause changes to the mass distribution through the DMS circuit.

4. Summary and Conclusions

Dense media separation was shown as an effective means to separate spodumene from associated gangue minerals from the Hidden Lake pegmatites in NWT, Canada, despite similarities in mineral-specific gravities. Even for minerals with a relatively low concentration criterion, such as muscovite mica, HLS results and subsequent DMS testing showed the selective recovery of spodumene over other silicate minerals. A two-stage, continuously operated dense media separation test conducted on +840 µm material produced a concentrate grading 6.11% Li2O with ~50% lithium recovery; 50% of the original mass was rejected to the DMS tailings with only 8% of the lithium. The remaining mass (“DMS middlings”) was combined with the −840 µm fraction to form flotation circuit feed; a paper discussing the details of flotation testing in under preparation. These results illustrate the benefit of dense media separation in spodumene beneficiation circuits, including the opportunity to reject a significant quantity of mass prior to grinding, reducing the required capital and operating expenditures of the grinding and flotation circuits.
Sensitivity analysis of the specific gravity cut point in the dense media circuit showed minor changes (+/−0.05) in the specific gravity of the dense media resulted in significant changes to the mass rejected by DMS and to the grade of the DMS concentrate. The downstream effect of these changes, particularly in mass flow to the grinding circuit, may limit process feasibility and operability. To mitigate these effects, several things might be considered in process design: (1) a robust process control system that closely monitors and adjusts the specific gravity of the dense media, as required; (2) decoupling of the density media and grinding/flotation circuits (i.e., inclusion of buffer capacity in the process design); (3) ore sorting/blending systems that classify feed to the DMS circuit based on its modal mineralogy and expected behavior in DMS to minimize the need for frequent changes in media density; and (4) elimination of flotation circuits, towards a DMS-only flowsheet (as long as the process produces a concentrate of sufficient grade and the reduced risk and costs with this flowsheet option offset reduced lithium recoveries). This may include the implementation of a magnetic separation circuit on the crushed feed to remove well-liberated, magnetic mineral particles that may tend to report to the sink fraction in dense media separation.
Overall, the results of this study demonstrate the importance of dense media separation in the concentration of spodumene from the Hidden Lake occurrence, and by extension, the potential importance to the concentration of lithium from other hard-rock deposits. It is hoped that careful consideration of the benefits of this separation technique—and its operational challenges—will assist to develop beneficiation processes that use as little energy and water as possible and yield maximum lithium recoveries.

Author Contributions

Conceptualization, M.A.; methodology; T.G., M.A., D.L.S., L.B.; validation, M.A., T.G.; formal analysis, C.E.G., T.G., M.A., writing—original draft preparation, C.E.G.; writing—review and editing, C.E.G., T.G., M.A., D.L.S., L.B.; supervision, D.L.S., L.B., project administration, M.A., T.G.; funding acquisition, D.L.S., L.B. All authors have read and agreed to the published version of the manuscript.

Funding

This work was funded by Patriot Battery Metals Inc. and Far Resources as a part of the process development program for the pegmatites from Hidden Lake, NWT. Personnel from Far Resources and Gaia Metals Corp. (L. Bottomer and D. Smith, respectively) were involved in various aspects of program design and program management. They were not directly involved in the collection, analysis, and interpretation of data.

Data Availability Statement

The data presented in this study are available on request from authors L. Bottomer and D. Smith. The data are not publicly available due to the terms of the project.

Acknowledgments

We would like to acknowledge Far Resources and Patriot Battery Metals Inc. for their input and support of the laboratory test work and for permission to share results. We would also like to acknowledge SGS Canada (Lakefield) for their ongoing support of this research.

Conflicts of Interest

The authors declare no conflict of interest.

References

  1. Jaskula, B. Lithium Statistics and Information; United States Geological Survey: Reston, VA, USA, 2021; p. 2. Available online: https://pubs.usgs.gov/periodicals/mcs2021/mcs2021-lithium.pdf (accessed on 16 February 2021).
  2. Jaskula, B. Lithium Statistics and Information; United States Geological Survey: Reston, VA, USA, 2020; p. 2. Available online: https://pubs.usgs.gov/periodicals/mcs2020/mcs2020-lithium.pdf (accessed on 16 February 2021).
  3. Jaskula, B. Lithium Statistics and Information; United States Geological Survey: Reston, VA, USA, 2019; p. 2. Available online: https://prd-wret.s3-us-west-2.amazonaws.com/assets/palladium/production/atoms/files/mcs-2019-lithi.pdf (accessed on 16 February 2021).
  4. Jaskula, B. Lithium Statistics and Information; United States Geological Survey: Reston, VA, USA, 2018; p. 2. Available online: https://s3-us-west-2.amazonaws.com/prd-wret/assets/palladium/production/mineral-pubs/lithium/mcs-2018-lithi.pdf (accessed on 16 February 2021).
  5. Jaskula, B. Lithium Statistics and Information; United States Geological Survey: Reston, VA, USA, 2017; p. 2. Available online: https://s3-us-west-2.amazonaws.com/prd-wret/assets/palladium/production/mineral-pubs/lithium/mcs-2017-lithi.pdf (accessed on 16 February 2021).
  6. Jaskula, B. Lithium Statistics and Information; United States Geological Survey: Reston, VA, USA, 2016; p. 2. Available online: https://s3-us-west-2.amazonaws.com/prd-wret/assets/palladium/production/mineral-pubs/lithium/mcs-2016-lithi.pdf (accessed on 16 February 2021).
  7. Jaskula, B. Lithium Statistics and Information; United States Geological Survey: Reston, VA, USA, 2015; p. 2. Available online: https://s3-us-west-2.amazonaws.com/prd-wret/assets/palladium/production/mineral-pubs/lithium/mcs-2015-lithi.pdf (accessed on 16 February 2021).
  8. Jaskula, B. Lithium Statistics and Information; United States Geological Survey: Reston, VA, USA, 2014; p. 2. Available online: https://s3-us-west-2.amazonaws.com/prd-wret/assets/palladium/production/mineral-pubs/lithium/mcs-2014-lithi.pdf (accessed on 16 February 2021).
  9. Jaskula, B. Lithium Statistics and Information; United States Geological Survey: Reston, VA, USA, 2013; p. 2. Available online: https://s3-us-west-2.amazonaws.com/prd-wret/assets/palladium/production/mineral-pubs/lithium/mcs-2013-lithi.pdf (accessed on 16 February 2021).
  10. Jaskula, B. Lithium Statistics and Information; United States Geological Survey: Reston, VA, USA, 2012; p. 2. Available online: https://s3-us-west-2.amazonaws.com/prd-wret/assets/palladium/production/mineral-pubs/lithium/mcs-2012-lithi.pdf (accessed on 16 February 2021).
  11. Jaskula, B. Lithium Statistics and Information; United States Geological Survey: Reston, VA, USA, 2011; p. 2. Available online: https://s3-us-west-2.amazonaws.com/prd-wret/assets/palladium/production/mineral-pubs/lithium/mcs-2011-lithi.pdf (accessed on 16 February 2021).
  12. Jaskula, B. Lithium Statistics and Information; United States Geological Survey: Reston, VA, USA, 2010; p. 2. Available online: https://s3-us-west-2.amazonaws.com/prd-wret/assets/palladium/production/mineral-pubs/lithium/mcs-2010-lithi.pdf (accessed on 16 February 2021).
  13. Tadesse, B.; Makuei, F.; Albijanic, B.; Dyer, L. The beneficiation of lithium minerals from hard rock ores: A review. Miner. Eng. 2019, 131, 170–184. [Google Scholar] [CrossRef]
  14. Bowell, R.J.; Lagos, L.; de los Hoyos, C.R.; Declercq, J. Classification and Characteristics of Natural Lithium Resources. Elements 2020, 16, 259–264. [Google Scholar] [CrossRef]
  15. Flexer, V.; Baspineiro, C.F.; Galli, C.I. Lithium recovery from brines: A vital raw material for green energies with a potential environmental impact in its mining and processing. Sci. Total Environ. 2018, 639, 1188–1204. [Google Scholar] [CrossRef] [PubMed]
  16. Tscherning, R.; Chapman, B. Navigating the emerging lithium rush: Lithium extraction from brines for clean-tech battery storage technologies. J. Energy Nat. Resour. Law 2021, 39, 13–42. [Google Scholar] [CrossRef]
  17. Liu, W.; Agusdinata, D.B. Interdependencies of lithium mining and communities sustainability in Salar de Atacama, Chile. J. Clean. Prod. 2020, 260, 120838. [Google Scholar] [CrossRef]
  18. Mohr, S.H.; Mudd, G.M.; Giurco, D. Lithium Resources and Production: Critical Assessment and Global Projections. Minerals 2012, 2, 65–84. [Google Scholar] [CrossRef]
  19. Ambrose, H.; Kendall, A. Understanding the future of lithium: Part 1, resource model. J. Ind. Ecol. 2019, 24, 80–89. [Google Scholar] [CrossRef]
  20. NRCan, Canada and U.S. Finalize Joint Action Plan on Critical Minerals Collaboration; Natural Resources Canada: Ottawa, ON, Canada, 2020. [Google Scholar]
  21. Gibson, C.E.; Aghamirian, M.; Grammatikopoulos, T. A review: The beneficiation of lithium minerals from hard rock deposits. Min. Eng. 2017, 69, 18–27. [Google Scholar]
  22. Çetinkaya, Z.; Bayat, O. Upgrading low-rank coals (Çan, Çanakkale/Turkey) by float-sink separation in dense media. Energy Sources Part A Recovery Util. Environ. Eff. 2019, 42, 113–120. [Google Scholar] [CrossRef]
  23. Filippov, L.; Farrokhpay, S.; Lyo, L.; Filippova, I. Spodumene Flotation Mechanism. Minerals 2019, 9, 372. [Google Scholar] [CrossRef] [Green Version]
  24. Liu, W.; Zhang, S.; Wang, W.; Zhang, J.; Yan, W.; Deng, J.; Feng, Q.; Huang, Y. The effects of Ca(II) and Mg(II) ions on the flotation of spodumene using NaOL. Miner. Eng. 2015, 79, 40–46. [Google Scholar] [CrossRef]
  25. Moon, K.S.; Fuerstenau, D.W. Surface crystal chemistry in selective flotation of spodumene (LiAl[SiO3]2) from other aluminosilicates. Int. J. Miner. Process. 2003, 72, 11–24. [Google Scholar] [CrossRef]
  26. Shu, K.; Xu, L.; Wu, H.; Tang, Z.; Luo, L.; Yang, J.; Xu, Y.; Feng, B. Selective flotation separation of spodumene from feldspar using sodium alginate as an organic depressant. Sep. Purif. Technol. 2020, 248, 117122. [Google Scholar] [CrossRef]
  27. Xie, R.; Zhu, Y.; Liu, J.; Li, Y.; Wang, X.; Shumin, Z. Research Status of Spodumene Flotation: A Review. Miner. Process. Extr. Metall. Rev. 2020, 42, 321–334. [Google Scholar] [CrossRef]
  28. Zhu, G.; Zhao, Y.; Zheng, X.; Wang, Y.; Zheng, H.; Lu, D. Surface features and flotation behaviors of spodumene as influenced by acid and alkali treatments. Appl. Surf. Sci. 2020, 507, 145058. [Google Scholar] [CrossRef]
  29. Legault-Seguin, E.; Mohns, C.; Rylatt, M. Dense Media Separation—An effective and robust pre-concentration technology. In Proceedings of the 48th Annual Canadian Minerals Processors Operators Conference, Ottawa, ON, Canada, 19–21 January 2016; pp. 381–400. [Google Scholar]
  30. Redeker, I.H. Flotation of feldspar, spodumene, quartz and mica from pegmatites in North Carolina, USA. In Proceedings of the 13th Canadian Mineral Processors Annual Meeting, Ottawa, ON, Canada, 20 January 1981. [Google Scholar]
  31. Far Resources. Hidden Lake Lithium Project, Northwest Territories. Available online: https://farresources.com/hidden-lake-lithium/ (accessed on 16 February 2021).
  32. Wills, B.A.; Finch, J.A. Wills’ Mineral Processing Technology: An Introduction to the Practical Aspects of Ore Treatment and Mineral Recovery, 8th ed.; Butterworth-Heinemann: Oxford, UK, 2016; ISSN 02678179. [Google Scholar]
  33. Amarante, M.M.; de Sousa, A.B.; Leite, M.M. Processing a spodumene ore to obtain lithium concentrates for addition to glass and ceramic bodies. Miner. Eng. 1999, 12, 433–436. [Google Scholar] [CrossRef]
  34. Rockwood Lithium. Spodumene Concentrate SC6.5. 2015. Available online: https://www.albemarle-lithium.com/pdf/402203.pdf/ (accessed on 18 March 2020).
Figure 1. Location of the Hidden Lake lithium deposit in Northwest Territories, Canada.
Minerals 11 00649 g001
Figure 2. Heavy liquid separation testing procedure.
Minerals 11 00649 g002
Figure 3. Mineral abundance (wt. %) by size fraction.
Minerals 11 00649 g003
Figure 4. Summary of spodumene liberation and association profile (mass% calculated for the head samples) at a P80 of 425 μm.
Minerals 11 00649 g004
Figure 5. Heavy liquid testing cumulative sink results—(a) stage recovery and mass pull and (b) global recovery and mass pull.
Minerals 11 00649 g005
Figure 6. Heavy mineral distribution (wt. %) of sink fraction for different S.G. cut points.
Minerals 11 00649 g006
Figure 7. Heavy mineral distribution (wt. %) of sink fraction for different S.G. cut points.
Minerals 11 00649 g007
Figure 8. Ideal and actual spodumene separation as a function of specific gravity cut point in heavy liquid separation.
Minerals 11 00649 g008
Figure 9. DMS circuit flowhseet.
Minerals 11 00649 g009
Figure 10. Comparison of heavy liquid separation and dense media separation results.
Minerals 11 00649 g010
Figure 11. The effect of S.G. cut point in DMS Pass 1 on mass recovery and global lithium recovery (combined DMS and flotation).
Minerals 11 00649 g011
Figure 12. The effect of changes in the specific gravity cut point of DMS Pass 2 on (a) mass recovery and global lithium recovery, and (b) DMS concentrate grade.
Minerals 11 00649 g012
Table 1. Head analysis.
Element (wt.%)LiLi2OAlCaFeKMgNaPRbSi
Sample 10.621.338.840.190.251.710.043.350.590.0834.0
Sample 20.631.368.830.150.272.290.023.100.390.0934.1
Sample 30.601.298.830.200.251.670.033.410.610.0834.0
Sample 40.631.368.890.210.231.840.043.330.800.1033.7
Table 2. Modal mineralogy (wt. %)—sample determined by QEMSCAN.
SampleSample 1Sample 2Sample 3Sample 4
Spodumene15.816.114.214.5
Quartz27.926.528.527.3
Plagioclase38.536.239.839.3
K-Feldspar8.6614.09.169.66
Muscovite4.864.204.484.03
Biotite0.020.030.010.01
Clays1.090.910.931.07
Apatite0.280.260.340.30
Montebrasite2.681.542.363.69
Other0.200.270.220.17
Total100100100100
Table 3. Head analysis of HLS composite.
Element/Oxide, %LiLi2OSiO2Al2O3Fe2O3MgOCaONa2OK2OP2O5MnOLOISum
Head Composite0.641.3872.516.70.230.040.264.182.411.400.020.8298.6
Table 4. Summary of mineral abundance in the composite head sample; specific gravity; and concentration criterion (CC) in water and heavy liquid.
Mineral NameMineral FormulaAbundance (wt. %)Specific
Gravity (S.G.)
Average S.G.CC * in
Water
S.G. = 1.0
CC * in
Heavy Liquid S.G. = 2.5
SpodumeneLiAlSi2O616.93.1–3.23.151.001.00
MontebrasiteLiAl(PO4)(OH)1.402.98–3.043.011.071.27
Albite (plagioclase)Na(AlSi3O8)38.62.6–2.652.631.325.20
QuartzSiO223.82.65–2.662.651.304.26
Microcline (k-feldspar)K(AlSi3O8)11.02.54–2.572.561.3811.8
MuscoviteKAl2(AlSi3O10)(OH)26.282.77–2.882.831.182.00
Other-2.81----
* Concentration Criterion.
Publisher’s Note: MDPI stays neutral with regard to jurisdictional claims in published maps and institutional affiliations.