1. Introduction
In industrial manufacturing, steel is an indispensable raw material. Steel production is used to measure the national strength and industrial level of a country [
1,
2]. Steel production demand has increased rapidly and steadily around the world. However, the highest-quality iron ore resources have been exploited, and reserves are insufficient. Refractory low-grade and fine particle iron ores have gradually become the main raw materials for the steel industry [
3,
4]. These refractory iron ores pose considerable challenges for conventional beneficiation methods [
5,
6,
7,
8,
9].
Hematite (α-Fe
2O
3) is one of the most common refractory low-grade iron ores, and is widely distributed in various rocks. Due to its low grade, hematite is not considered in the steel industry without preliminary beneficiation. Many researchers have focused on the separation of hematite from gangue minerals using the froth flotation process [
10,
11,
12,
13], the reverse anionic flotation of quartz [
14,
15,
16], and the magnetic separation [
17,
18,
19]. After extensive theoretical and engineering exploration, magnetization roasting followed by low-intensity magnetic separation has been found to be an effective method to recover iron minerals by phase transformation of α- Fe
2O
3 to γ- Fe
2O
3 or Fe
3O
4, achieving magnetic separation from the gangue mineral.
Many laboratory and pilot-scale studies of iron ore magnetization roasting have been conducted, mainly focusing on hematite. Yu et al. [
20] studied the beneficiation of Donganshan hematite ore fines using magnetization roasting and magnetic separation. The Fe content of the iron ore sample was 34.6 wt% and the main phase structures were hematite (Fe
2O
3) and quartz (SiO
2). Under the condition of a roasting temperature of 800 ℃ for 8 min, the hematite was almost completely converted into magnetite, and a higher iron grade (65.4 wt%) of magnetic concentrate was achieved with iron recovery of 92.7%. Tang et al. [
21] recycled iron tailings through magnetization roasting and separation. The iron grade of the concentrate reached 65.91% with a recovery rate of 94.60%. A pilot-scale experiment of the recovery iron ore tailings from Jiuquan Iron and Steel Corporation was conducted by Sun et al. [
22] using pre-concentration and suspension magnetization roasting followed by magnetic separation and flotation. The main iron phase was hematite. With the roasting temperature of 530 ℃, the iron grade of obtained iron concentrate was 58.67%, and the iron recovery was 57.82%. Weakly magnetic hematite and siderite were converted to strongly magnetic magnetite with an average magnetic conversion rate of 81.71%. A semi-industrial-scale experiment for magnetization roasting was also conducted to treat red mud with a high Fe
2O
3 content to recycle iron [
23]. After roasting, the hematite and goethite phases were transformed into Fe
3O
4 (A), Fe
3O
4 (B), and γ-Fe
2O
3 phases. Therefore, for the beneficiation of refractory iron ores, magnetization roasting has also been proven to be a reasonable and feasible method [
24].
Hematite and magnetite are the main concomitant minerals of iron ores [
25]. In the past ten years, our team has focused on the magnetization roasting process for iron ores, such as hematite, limonite, and siderite [
26,
27,
28]. It was found that the original magnetite in iron ore composed mainly of hematite can improve the separation index after magnetization roasting. The iron grade and recovery of roasted products increased obviously compared with only hematite in a semi-industrial-scale experiment on refractory hematite from Anshan. After the magnetization roasting process, the original hematite particles became porous after reduction to magnetite, and fresh magnetite nuclei formed preferentially at the edges of the original hematite particles [
29]. Using high-resolution scanning electron microscopy, Chen et al. [
30] found that microstructures of cellular porous and dendritic porous magnetite formed by hematite reduction. Strezov et al. [
31], using laser light scattering apparatus, found that some cracks initiated on the surface of goethite particles with crack propagation from the surface down to 20% of the particle diameter. However, the macroscopic separation index and the microcosmic mechanism of the original magnetite optimizing the iron ore reduction effect in the magnetization roasting process were not specifically discussed by the researchers.
In this research, the improvement and reaction mechanism of original magnetite in the iron ore reduction reaction in the magnetization roasting process were explored with ore fines and lump ores. The ore fines, with different magnetite contents, were used for magnetization roasting experiments to evaluate unit mass magnetic moment, separation index, and magnetism conversion rate at different roasting temperatures, roasting times, CO ratios, and gas flows. The iron phase compositions and phase transformation were applied to confirm the magnetization roasting effect. Under the optimum roasting conditions, the iron grade and recovery of roasted samples confirmed the correlation of the separation index with the original magnetite content difference. Innovatively, the lump ores were placed on a thermal platform microscope. Real-time, in situ, and continuous images of the magnetization roasting process were recorded by LSCM with confocal technology and 3D morphologic technology for the first time. The transformation of hematite to magnetite and the microcrack evolution process presented the active sites for the reduction reactions. The microcrack evolution enables the direct reaction mechanism of the original magnetite, improving the iron ore reduction reaction in the magnetization roasting process.
2. Materials and Methods
2.1. Materials
All iron ore samples used in this research were obtained from raw materials from the Qidashan dressing plant located in Liaoning Province, China. To determine the element composition of the iron ore sample, chemical multi-element analysis was conducted and the results are displayed in
Table 1. The total iron content was 30.64% and the SiO
2 content was 58.73%. The content of other components, such as Al
2O
3, CaO, MgO, etc., was less than 10.63%.
X-ray diffraction (XRD) results and phase analysis were used to indentify the primary minerals, as shown in
Figure 1. The primary minerals were hematite (18.74 wt%) and magnetite (19.7 wt%). Quartz (56.35 wt%) was the main gangue mineral. The iron phase composition of the iron ore sample is presented in
Table 2. The sum of Fe in hematite and magnetite was 88.42% of the total iron. The iron ore samples showed the mineral intergrowth of hematite and magnetite, with simple gangue, which were suitable for analyzing the mechanism of original magnetite improving the iron ore reduction reaction in the magnetization roasting process.
In this research, two types of samples (ore fines and lump ore) were prepared. The ore was crushed to −2 mm by a roll crushing mill (XPSF Φ400 × 250), and then ground to ore fines (−0.074 mm) by a ball mill (XMQ Φ240 × 90). The ore fines were recombined with different magnetite ratios for single-factor experiments to explore the effect of the original magnetite improving the iron ore separation index. Low-intensity magnetic separation (H = 100 kA/m, Φ240 × 120) (−0.074 mm) was carried out for ore fines. The iron ore fines were separated into the concentrate and the tailing. The tailing was named sample A. Sample B was a blend of the concentrate and the tailing in ratio of 1:20. Sample C was a blend of the concentrate and the tailing in ratio of 1:10. Sample D was a blend of the concentrate and the tailing in ratio of 1:7.
The chemical multi-element analysis of sample A, B, C and D is provided in
Table 3. The total iron contents were 14.70%, 16.91%, 18.93% and 21.12%, respectively. The iron phase compositions of sample A, B, C and D are presented in
Table 4. The Fe in magnetite was 2.13%, 18.41%, 29.71% and 39.31%, respectively. Therefore, the ratios of Fe in magnetite and hematite in sample A, B, C and D were about 0.1:4, 1:4, 2:4 and 3:4, respectively, which formed the original magnetite with different distributions of ore fine samples.
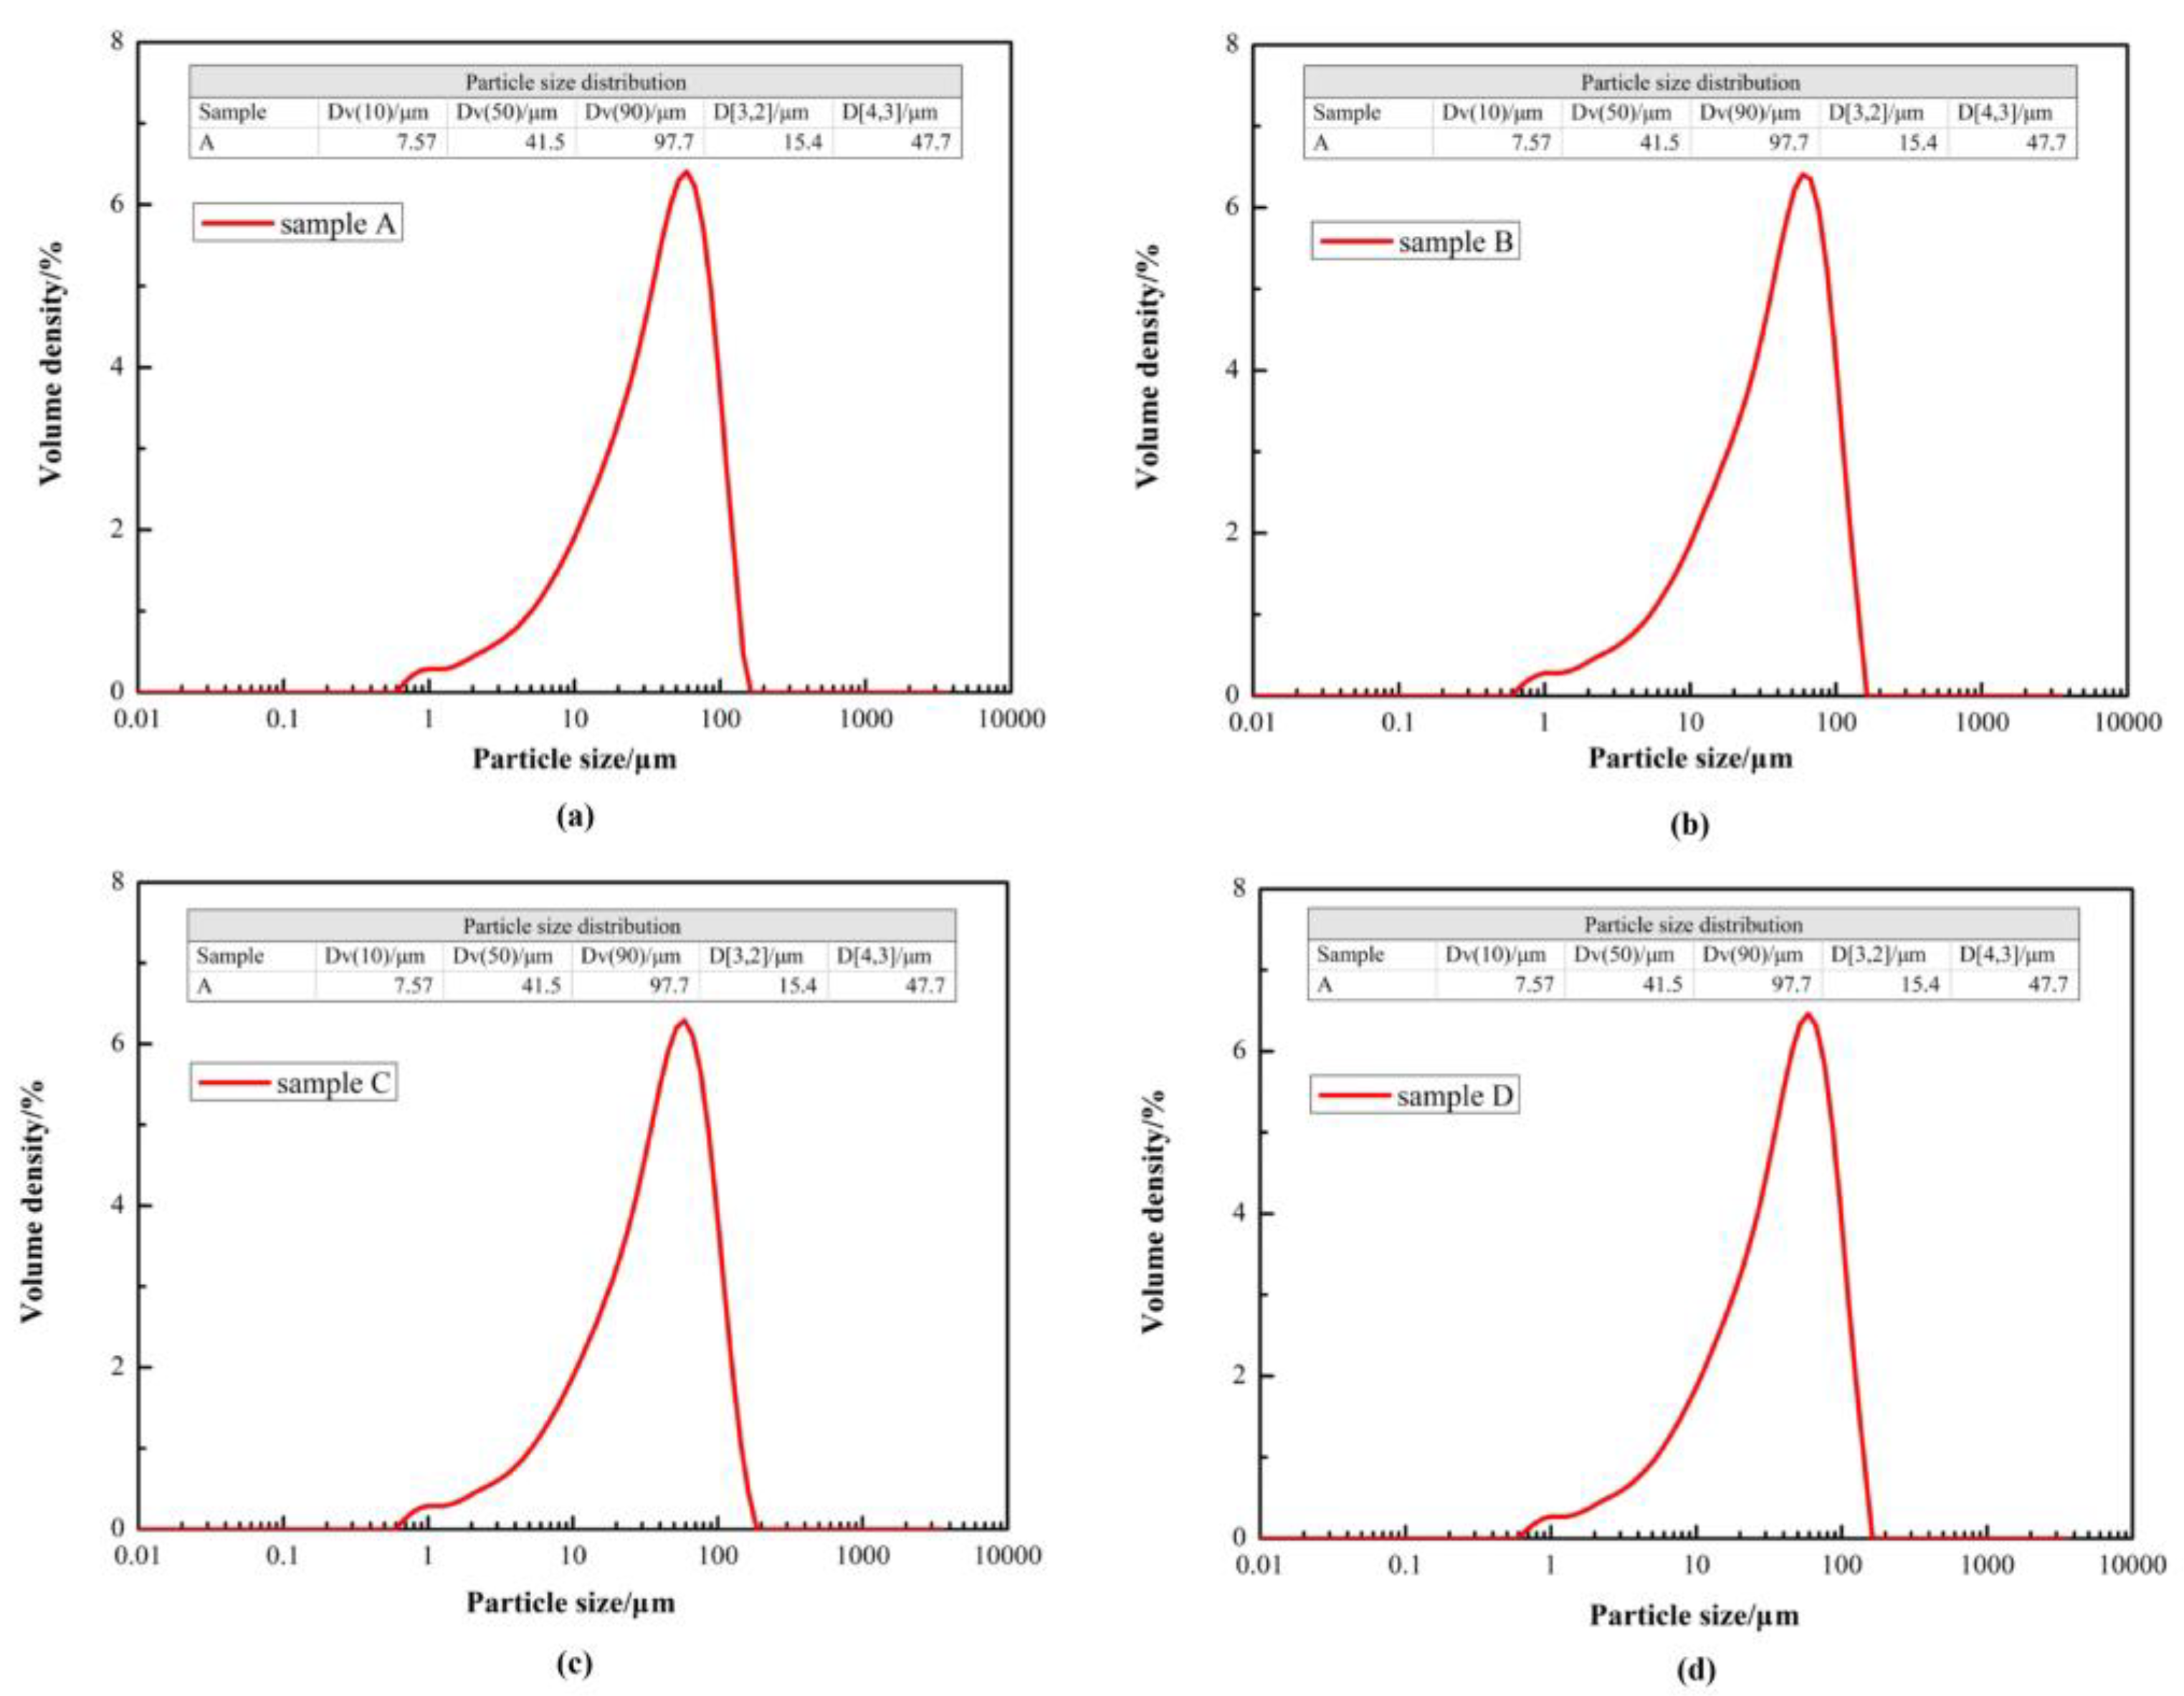
To determine the effect of particle size distribution, sample A, B, C and D were analyzed by a laser particle size analyzer (Malvern Mastersizer 2000), and the particle size distribution curve of sample A, B, C and D are shown in
Figure 2. The mean Dv(50) was 41.43 μm, and the standard deviation was less than ±3.46% between sample A, B, C and D. It was confirmed that there was little difference in the particle size distribution between sample A to D, which was beneficial to compare the effect of original magnetite on improving the iron ore reduction reaction.
The lump ores were derived from the same iron ore sample to decrease experimental error. The iron ore was cut by a cutting machine. After coarse grinding by a polishing machine, the lump ores with a plate thickness of 1 mm and an area of 5 mm × 5 mm met the requirements due to the limited room of the thermal platform microscope (Shanghaihuitong, XPL1400). CO (99.9%) and CO2 (99.9%) as the reductive agent and inert atmosphere were provided by Jinzhou-Quanfu Gas Co., Ltd., Jinzhou, China.
2.2. Experimental Methods
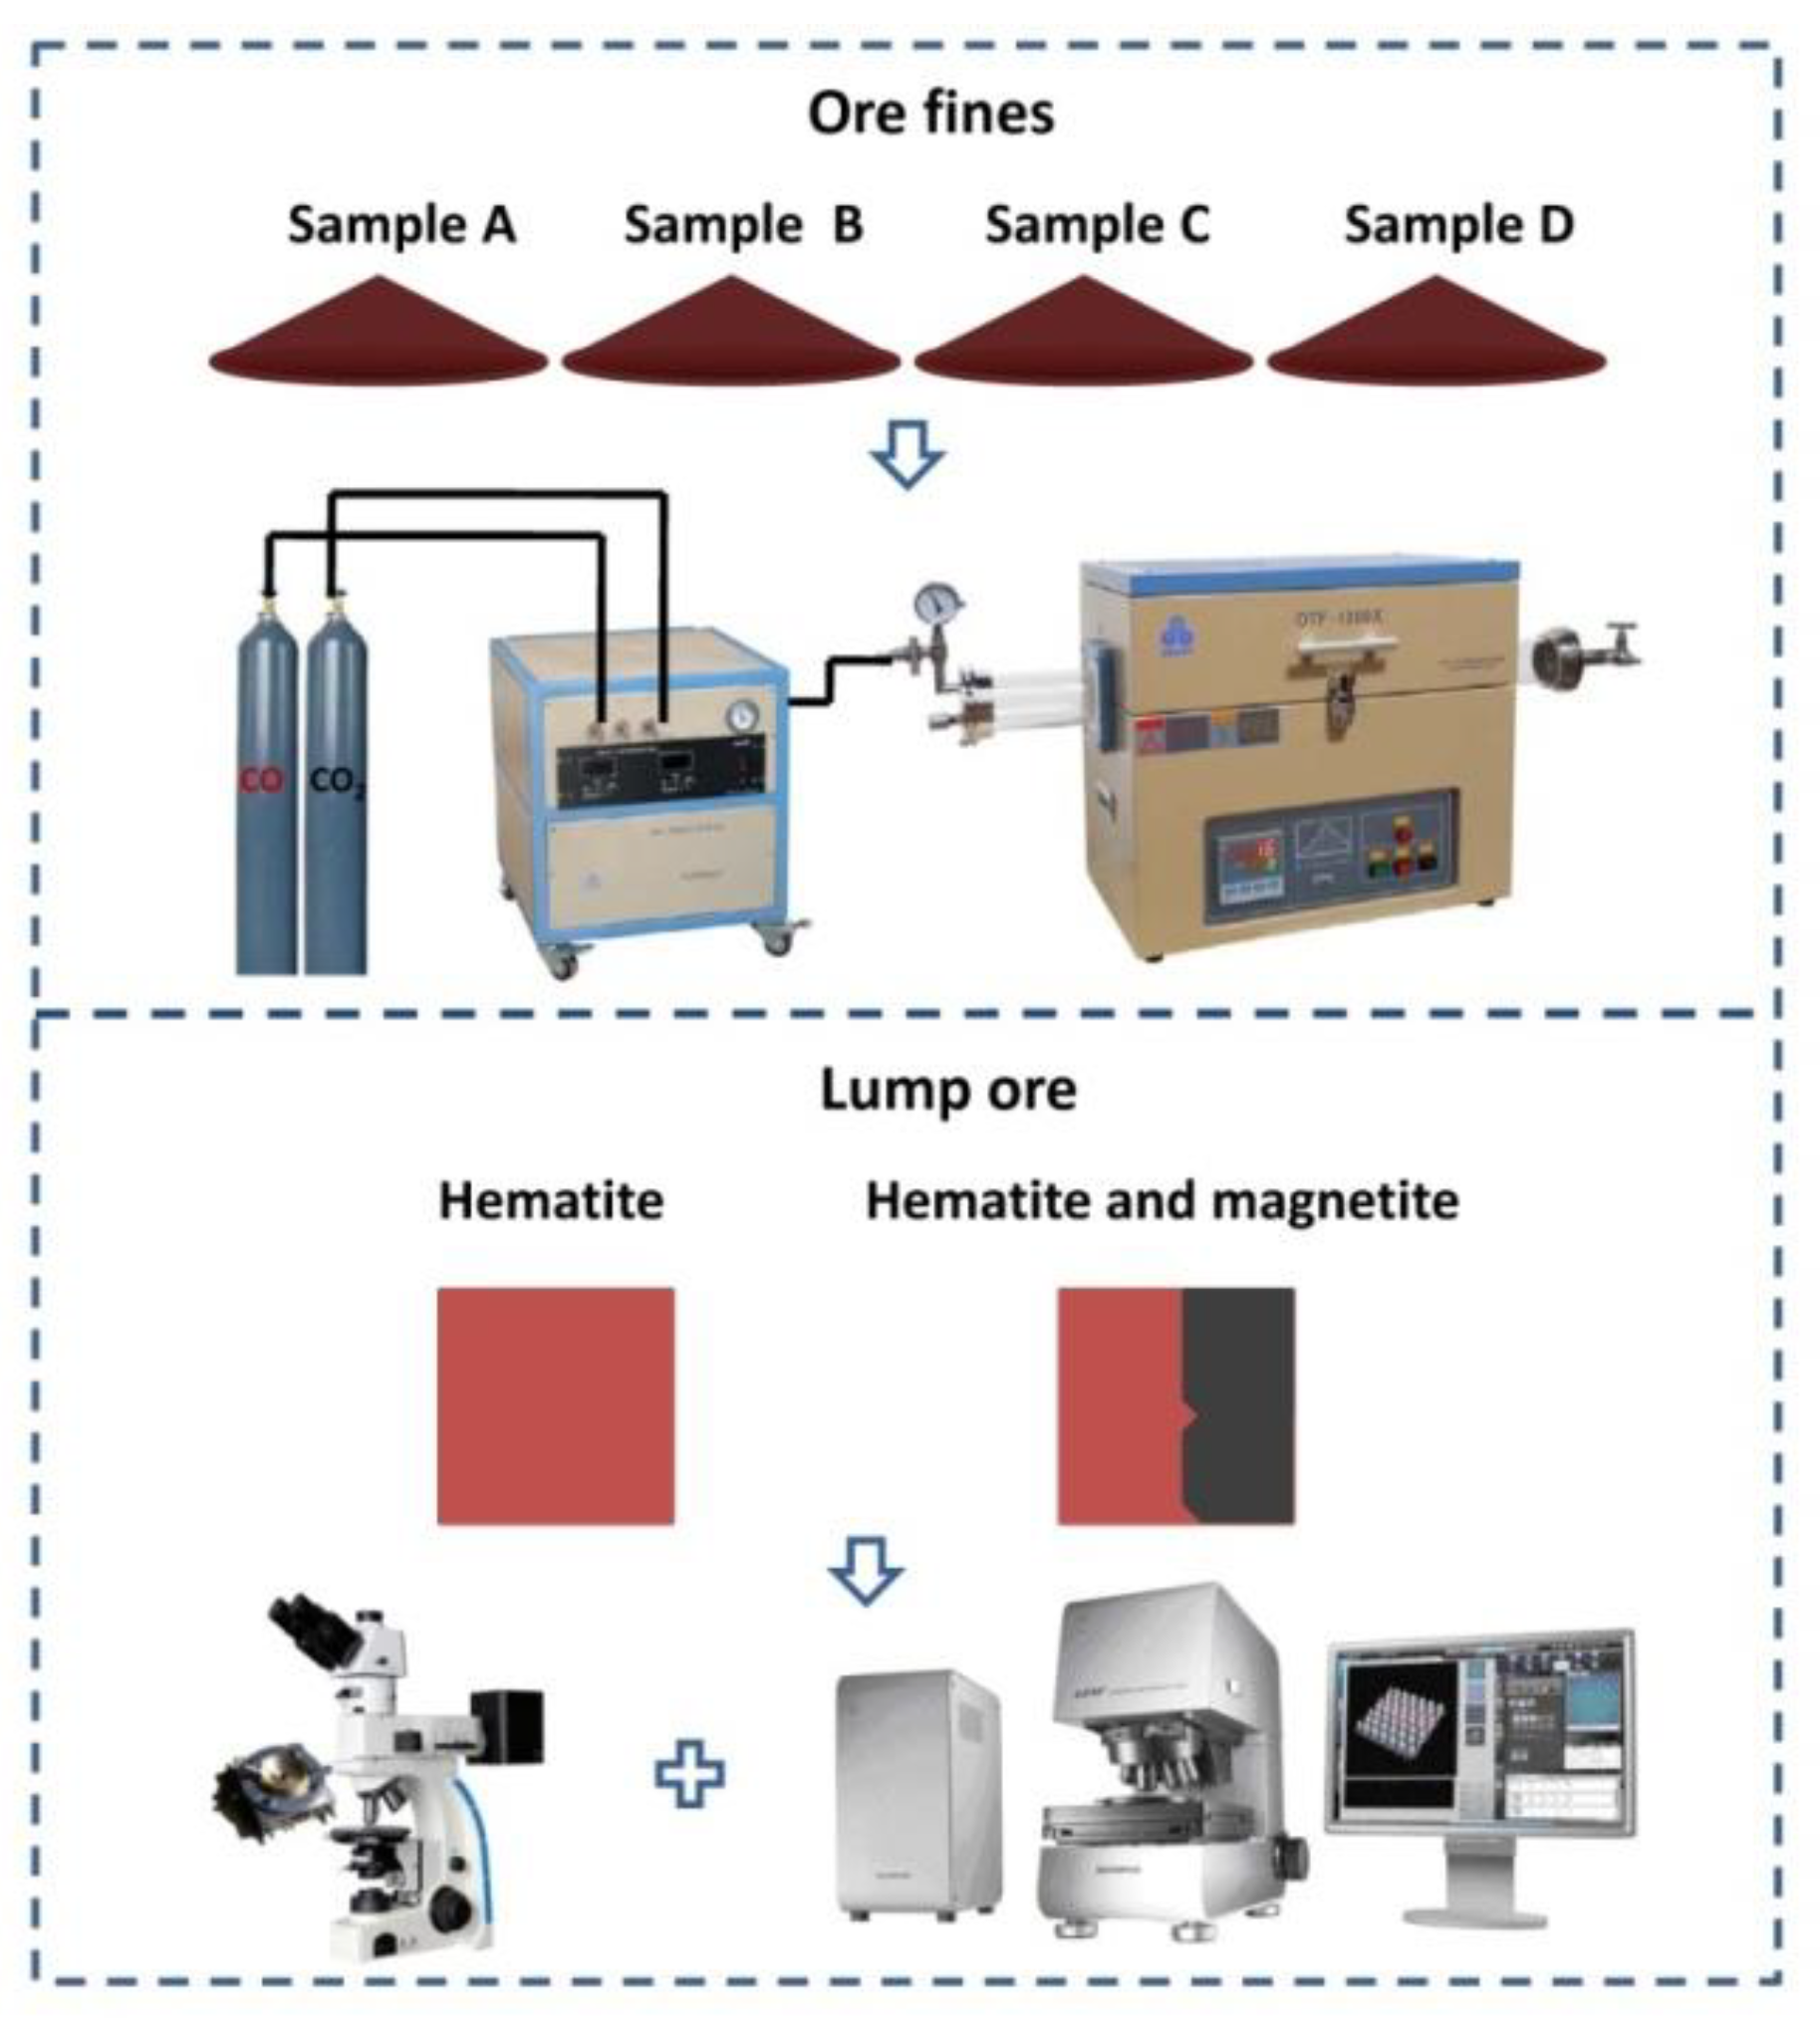
The experimental process is illustrated in
Figure 3. The ore fines of sample A to D were used as raw materials for magnetization roasting and low-intensity magnetic separation. The magnetization roasting system was composed of a roasting furnace (OTF-1200X, HFKJ Ltd.) and a gas control system. To ensure the Fe masses were equal for each sample, the ore fine masses of sample A, B, C and D were 20.00 g, 17.39 g, 15.53 g and 13.92 g, respectively.
Firstly, the center of the furnace tube was heated to a predetermined roasting temperature (i.e., 500, 520, 540, 560, 580 or 600 °C) under CO2 as the inert atmosphere. Secondly, the ore fine sample was placed quickly in the center of the furnace tube. The magnetization roasting system held the roasting temperature for the designated roasting time. CO, as a reductive agent, was combined with CO2 in the designated ratio and aerated as the designated flow. Thirdly, the cooling stage was executed under a CO2 atmosphere, and the furnace tube was cooled to room temperature. Finally, the roasted product was removed from the furnace tube.
The polished surface of lump ores (5 mm × 5 mm) was placed upward on the thermal platform. A temperature controller (AI-708P) and water-circulating pump were used in conjunction with a thermal platform microscope. The thermal platform was placed in the field of the microscope to find the correct magnification. Then, the reductive gas was aerated, and the temperature controller was started for magnetization roasting. The images of the magnetization roasting process were captured and recorded by automatic image processing software. Additionally, an LSCM (OLS 4000, Olympus Corporation, Tokyo, Japan) was used to analyze the surface morphology characteristics in the magnetization roasting images using confocal technology and 3D morphologic technology to ensure the images were authentic and vivid.
2.3. Measurements
After magnetization roasting, the magnetic concentrate was obtained by a magnetic separation tube (XCSG/CRS Φ50 mm, SDKS) with a magnetic field of 125 kA/m for 4 min. The iron grade of magnetic concentrate and tailing was tested. The iron recovery was calculated. To accurately describe the effect of the original magnetite during the magnetization roasting process, the magnetism conversion rate was introduced as the evaluation index. The equation for magnetism conversion rate is shown in Equation (1).
where
is the magnetism conversion rate (%),
is the content of Fe in the magnetic roasted product (%),
is the content of Fe in magnetic ore fine (%),
is the total iron content of ore fine (%),
is the content of Fe in silicate of ore fine (%) and
is the loss coefficient, which is calculated by Equation (2).
where
is the total iron content of roasted product (%).
XRD (X Pertpro, PANalytical B.V.) with Cu Kα radiation was conducted to identify the crystallographic structure of samples with a 2θ range of 10 to 85°. The magnetization curves of the roasted products were measured by a vibrating sample magnetometer (VSM) (JDAW-2000C&D, YP Magnetic Technology corporation, Changchun, China).
2.4. Thermodynamic Analysis
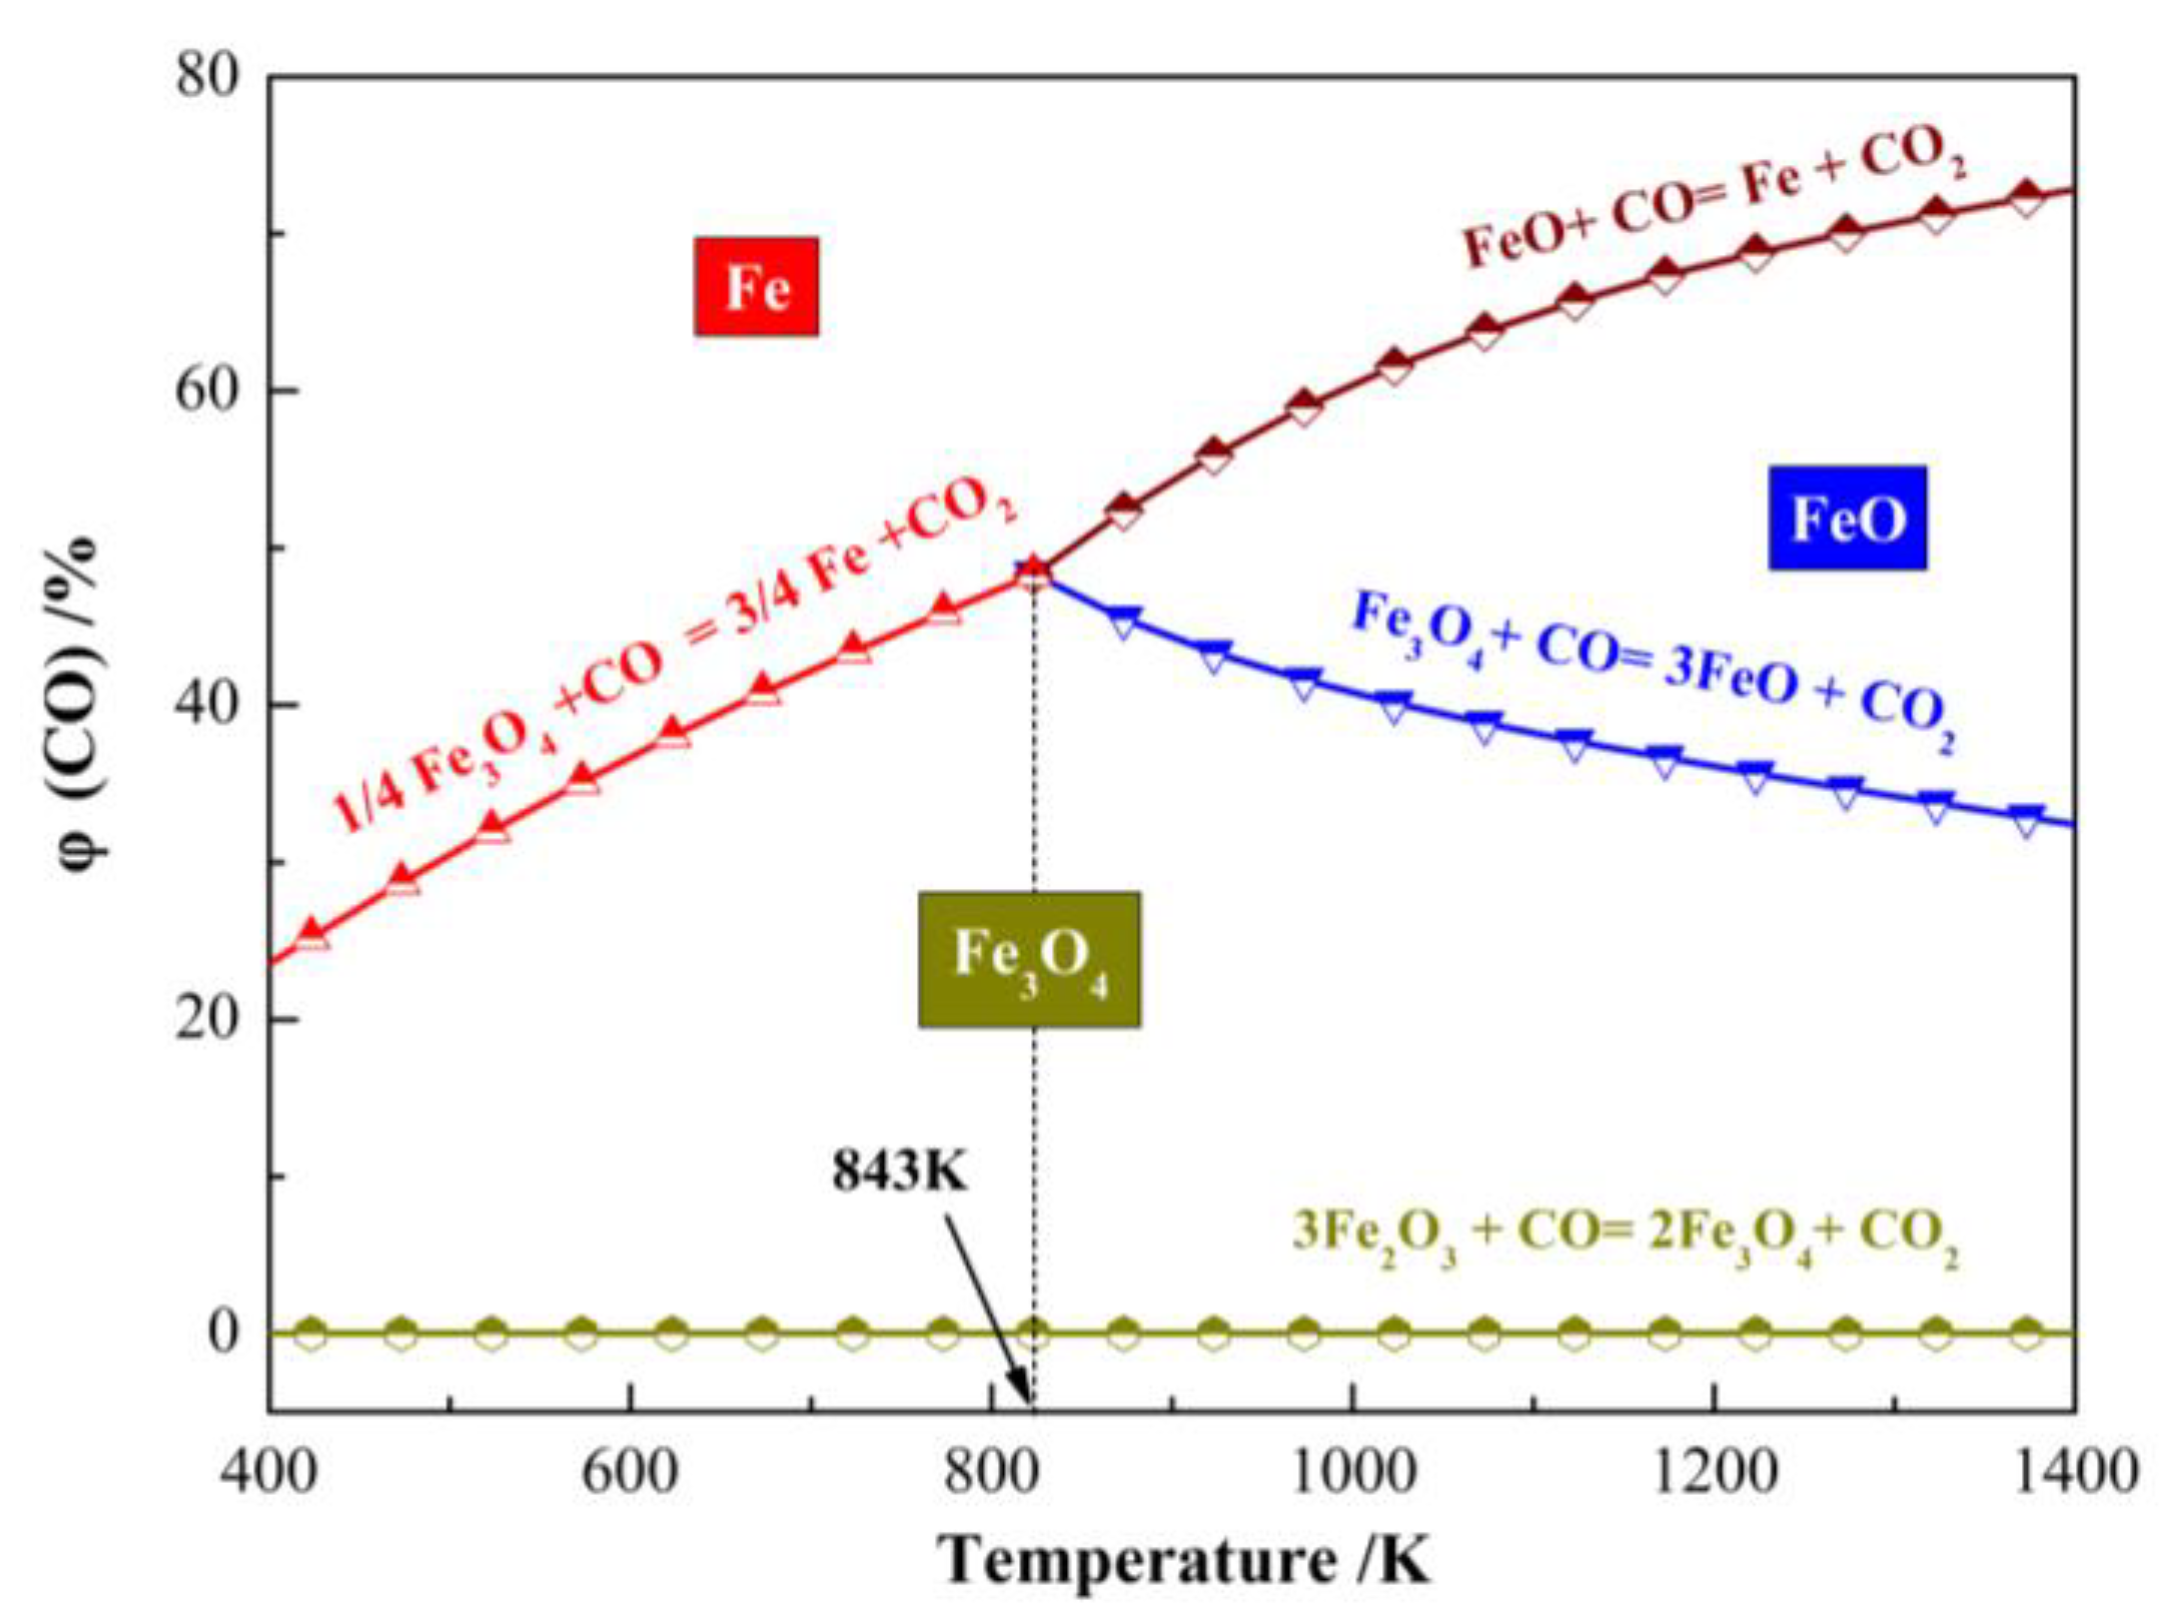
Under the reductive atmosphere of CO, the reaction equilibrium diagram between iron oxide and CO is shown in
Figure 4. From the temperature of 400 K to 1400 K and the CO volume fraction of 0% to 80%, the final forms of Fe were Fe
3O
4, FeO and Fe. During the magnetization roasting process, hematite should be transformed to magnetite completely, which would improve the quality of roasted products. With the increase in the CO volume fraction, the curve entered the Fe and FeO region completely, which indicated that Fe
3O
4 was converted to Fe or FeO. Therefore, the roasting temperature was set to 500–640 °C preliminarily, and the CO volume fraction was set to 10–30% preliminarily.
3. Results
3.1. The Effects of Magnetization Roasting Conditions on Sample A, B, C and D
3.1.1. Effect of Roasting Temperature
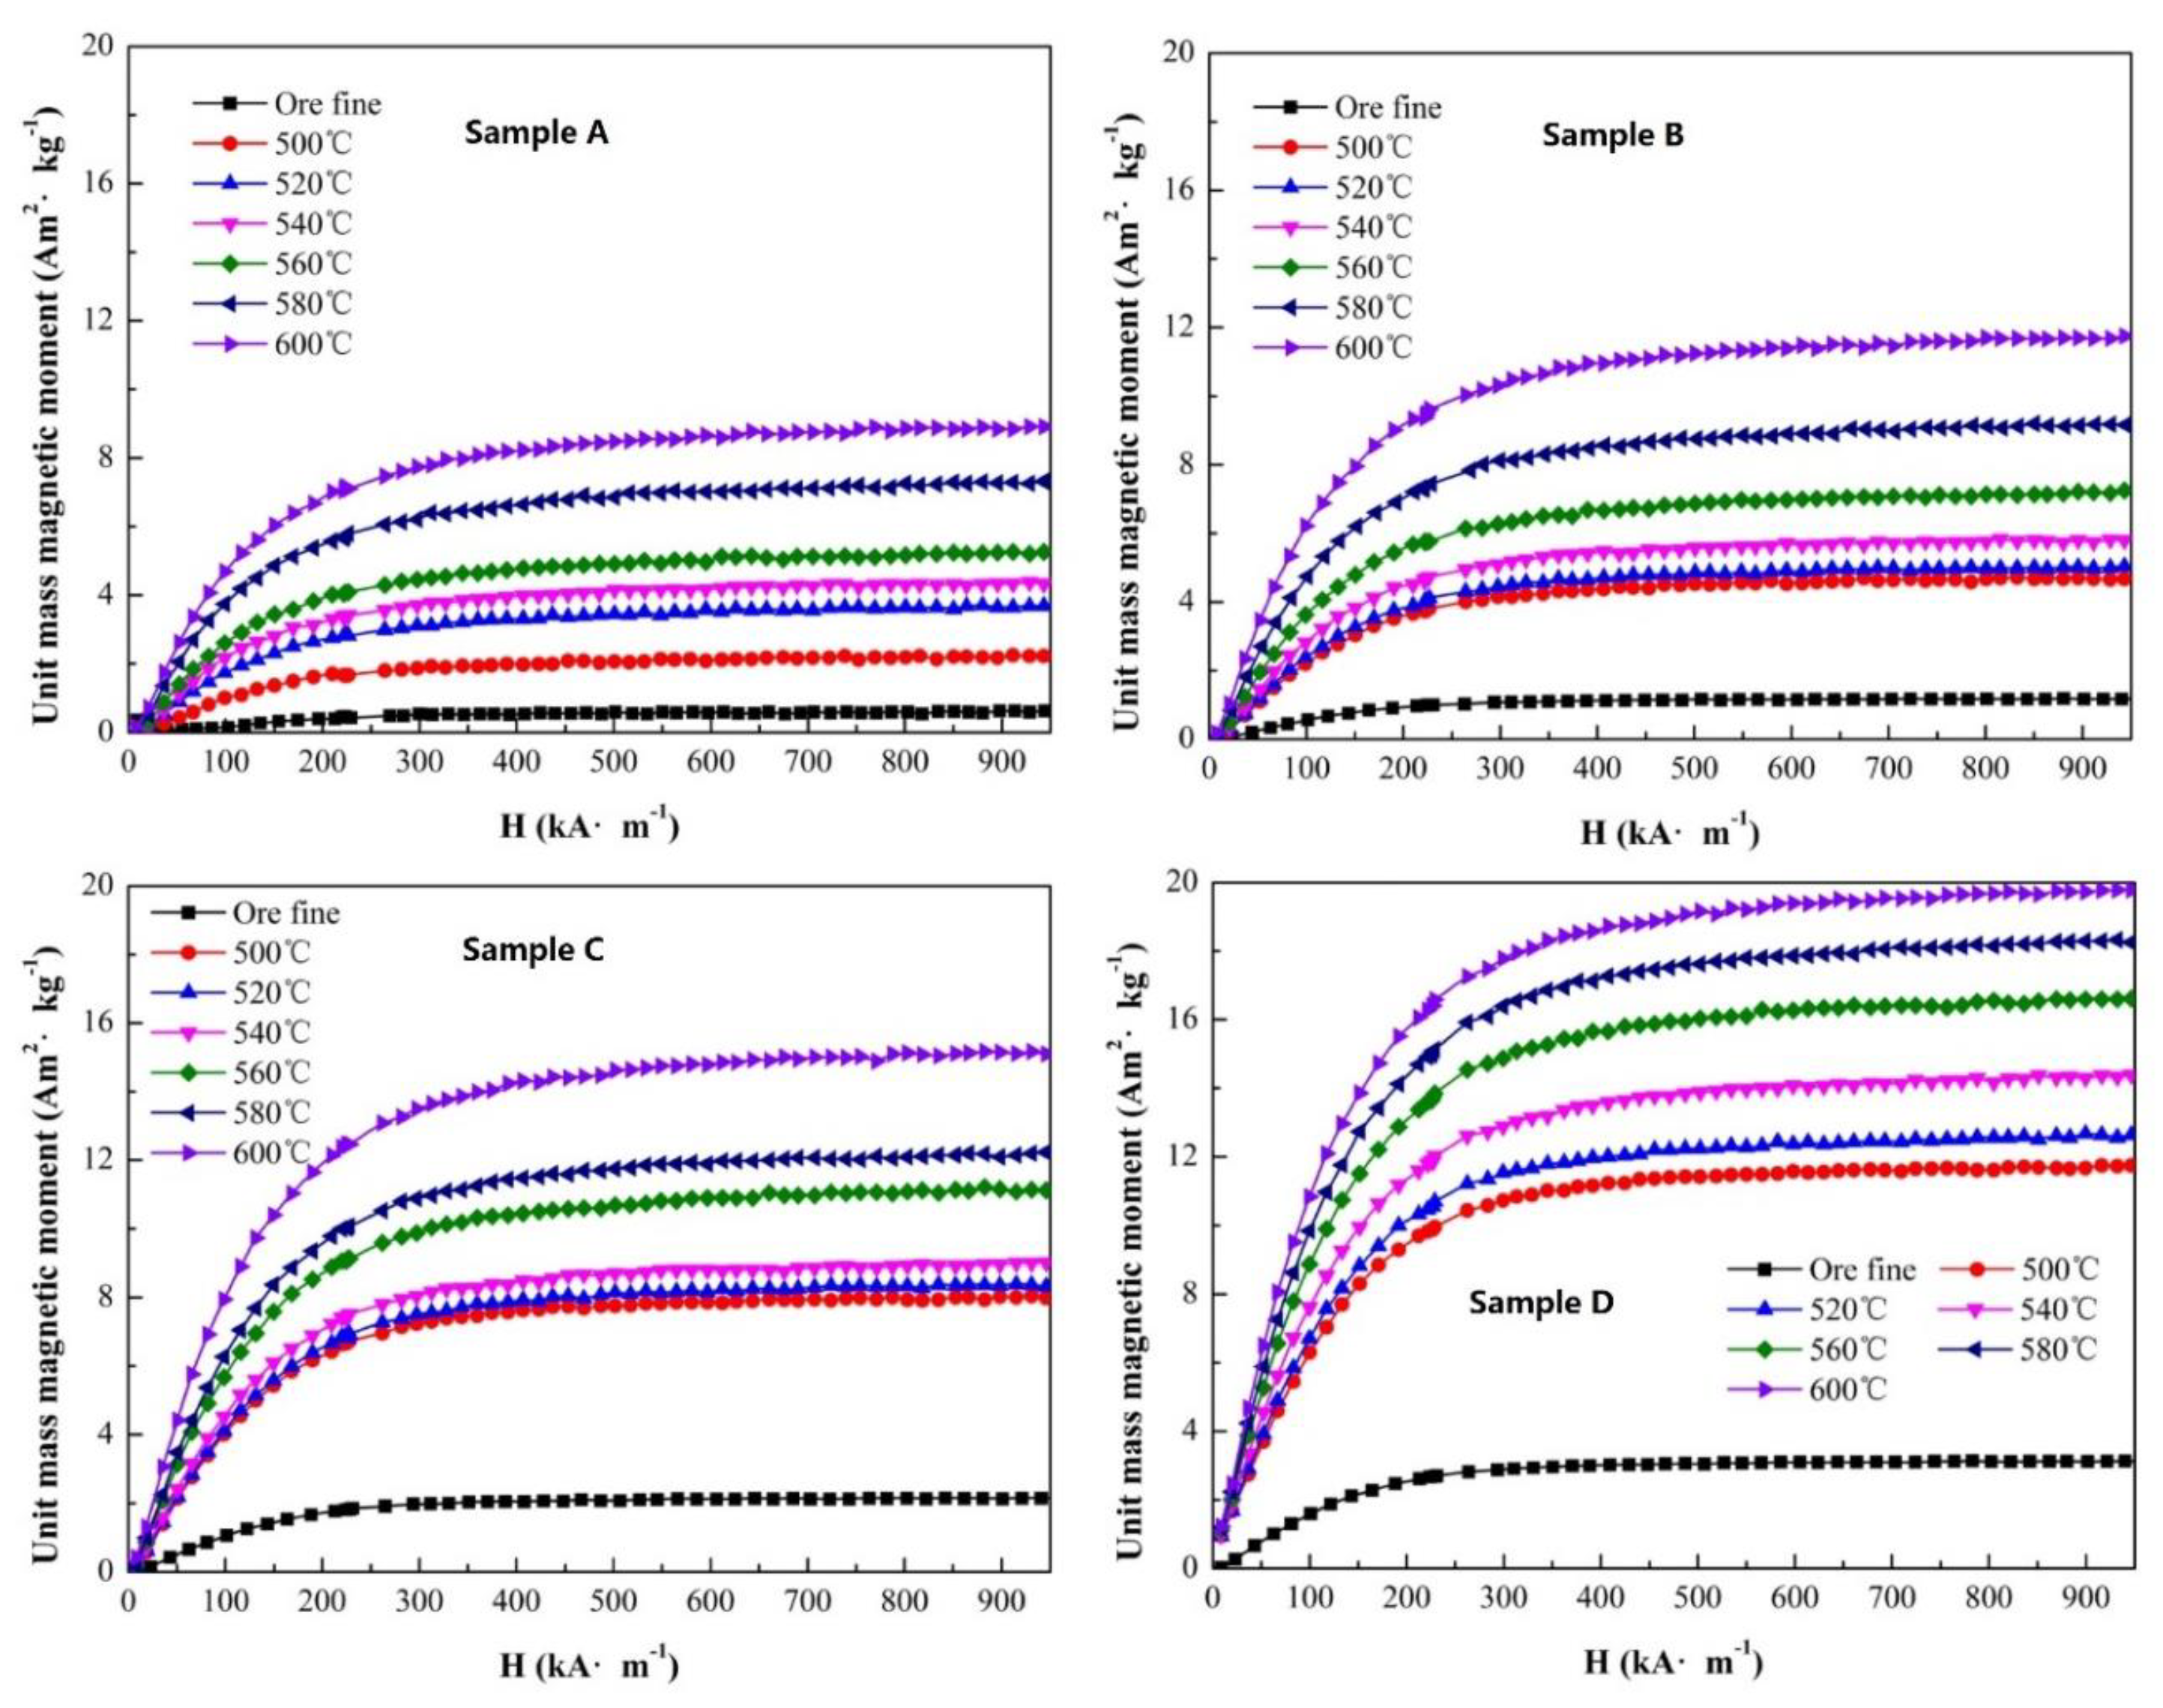
The magnetization properties have a direct relationship with the magnetite content in a sample. Under an external magnetic field, the sample exhibited magnetic characteristics, and the trend of the unit mass magnetic moment curve presented the relationship between the magnetization property and the field intensity. To analyze the effect of roasting temperature, the other conditions of the single-factor experiment were roasting time of 5 min, gas flow of 500 mL/min and CO ratio of 30%. The curves of the unit mass magnetic moment of sample A to D are presented in
Figure 5.
The original unit mass magnetic moments of sample A to D were 0.56, 1.19, 2.14 and 3.14 Am
2/kg, respectively, which increased with an increase in the original magnetite content in samples. As shown in
Figure 5, the unit mass magnetic moment of each sample increased after magnetization roasting. Meanwhile, with an increase in roasting temperature, the unit mass magnetic moment increased obviously. The magnetization curve demonstrated a stable trend of magnetic saturation. For sample A, after roasting at a temperature of 600 °C, the unit mass magnetic moment changed from 0.56 to 8.96 Am
2/kg, and the increment in the unit mass magnetic moment was 8.40 Am
2/kg. The maximum value of the unit mass magnetic moment was 11.74, 15.21 and 19.83 Am
2/kg at an external magnetic field of 950 kA/m for sample B to D. It was confirmed that major weakly magnetic Fe
2O
3 transformed to Fe
3O
4 with a large unit mass magnetic moment. The increment in the unit mass magnetic moment was 10.55 Am
2/kg for sample B, 13.07 Am
2/kg for sample C and 16.69 Am
2/kg for sample D with roasting at a temperature of 600 °C, although the Fe masses of each sample were equal. However, the increments in the unit mass magnetic moment of sample A to D were not uniform. Therefore, the original magnetite content of iron ore can affect the magnetization property after the magnetization roasting process obviously.
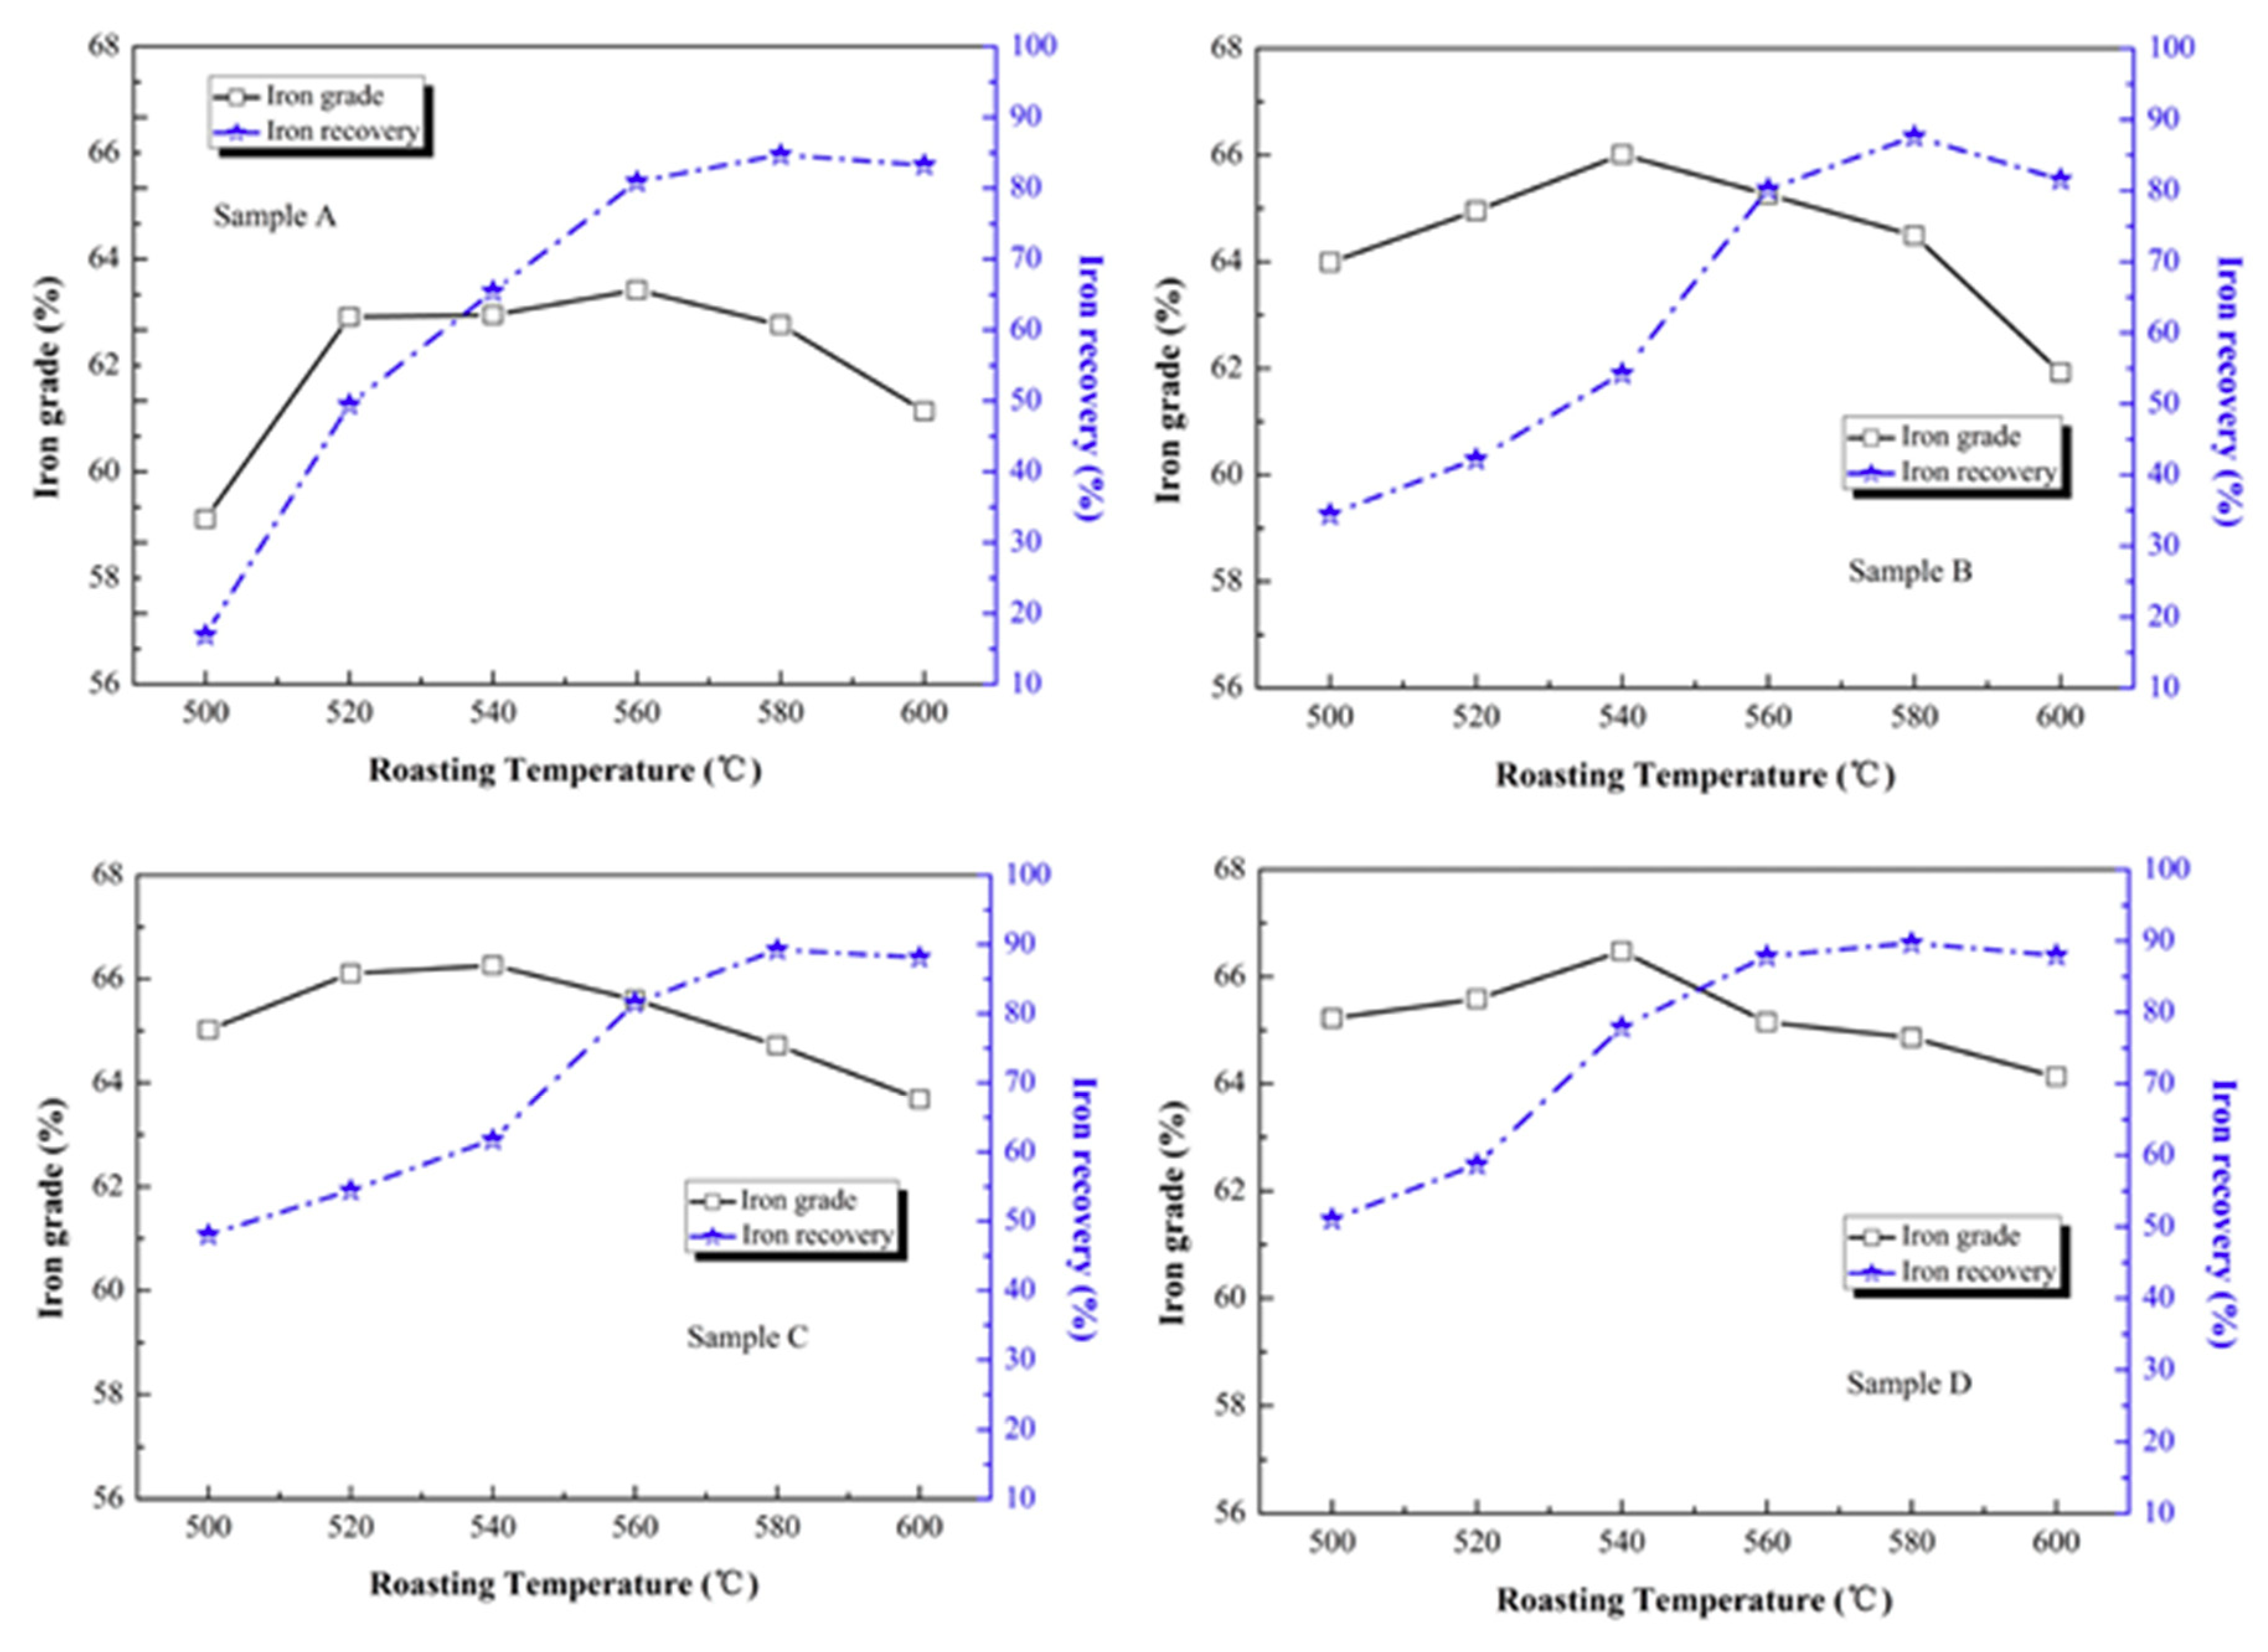
If the roasting temperature is low, the reduction efficiency will be limited, and the separation index of iron mineral and gangue mineral will be unsatisfactory. However, a higher roasting temperature will lead to the excessive reduction of iron oxide to FeO [
32]. The effects of roasting temperature on magnetic separation for sample A to D are presented in
Figure 6. The iron grade is the ratio of Fe mass to magnetic separation concentrate mass. The iron recovery is the ratio of Fe mass in magnetic separation concentrate mass to Fe mass in raw ore.
As shown in
Figure 6, sample A had a stable iron grade of 62–63% from 520 to 580 °C. The iron grade of sample B to D showed a unimodal form with a roasting temperature of 500 to 600 °C. For sample B to D, the maximum values of iron grade appeared at a roasting temperature of 540 °C, which were 66.01%, 66.26% and 66.47%, respectively. A higher original magnetite content had a more obvious effect on the iron grade of roasted samples after low-intensity magnetic separation. The iron recovery of sample A to D increased steadily with a roasting temperature of 500 to 600 °C. The max values of iron recovery appeared at a roasting temperature of 580 °C. The maximum values of iron recovery were 84.72%, 87.60%, 89.22% and 89.67% for sample A to D, respectively, and the maximum values of iron recovery also increased with the original magnetite content of ore fine, which also confirmed that a higher original magnetite content improved the iron phase transformation to Fe
3O
4 and increased the separation index. According to thermodynamic analysis, the iron oxide may be reduced to FeO or metallic Fe with higher roasting temperature. FeO and metallic Fe had strong reducibility. The gangue minerals can easily combine with them to form pumice. The pumice has poor magnetic response, so iron recovery will decline in the magnetic separation concentrate [
33].
3.1.2. Effect of Roasting Time
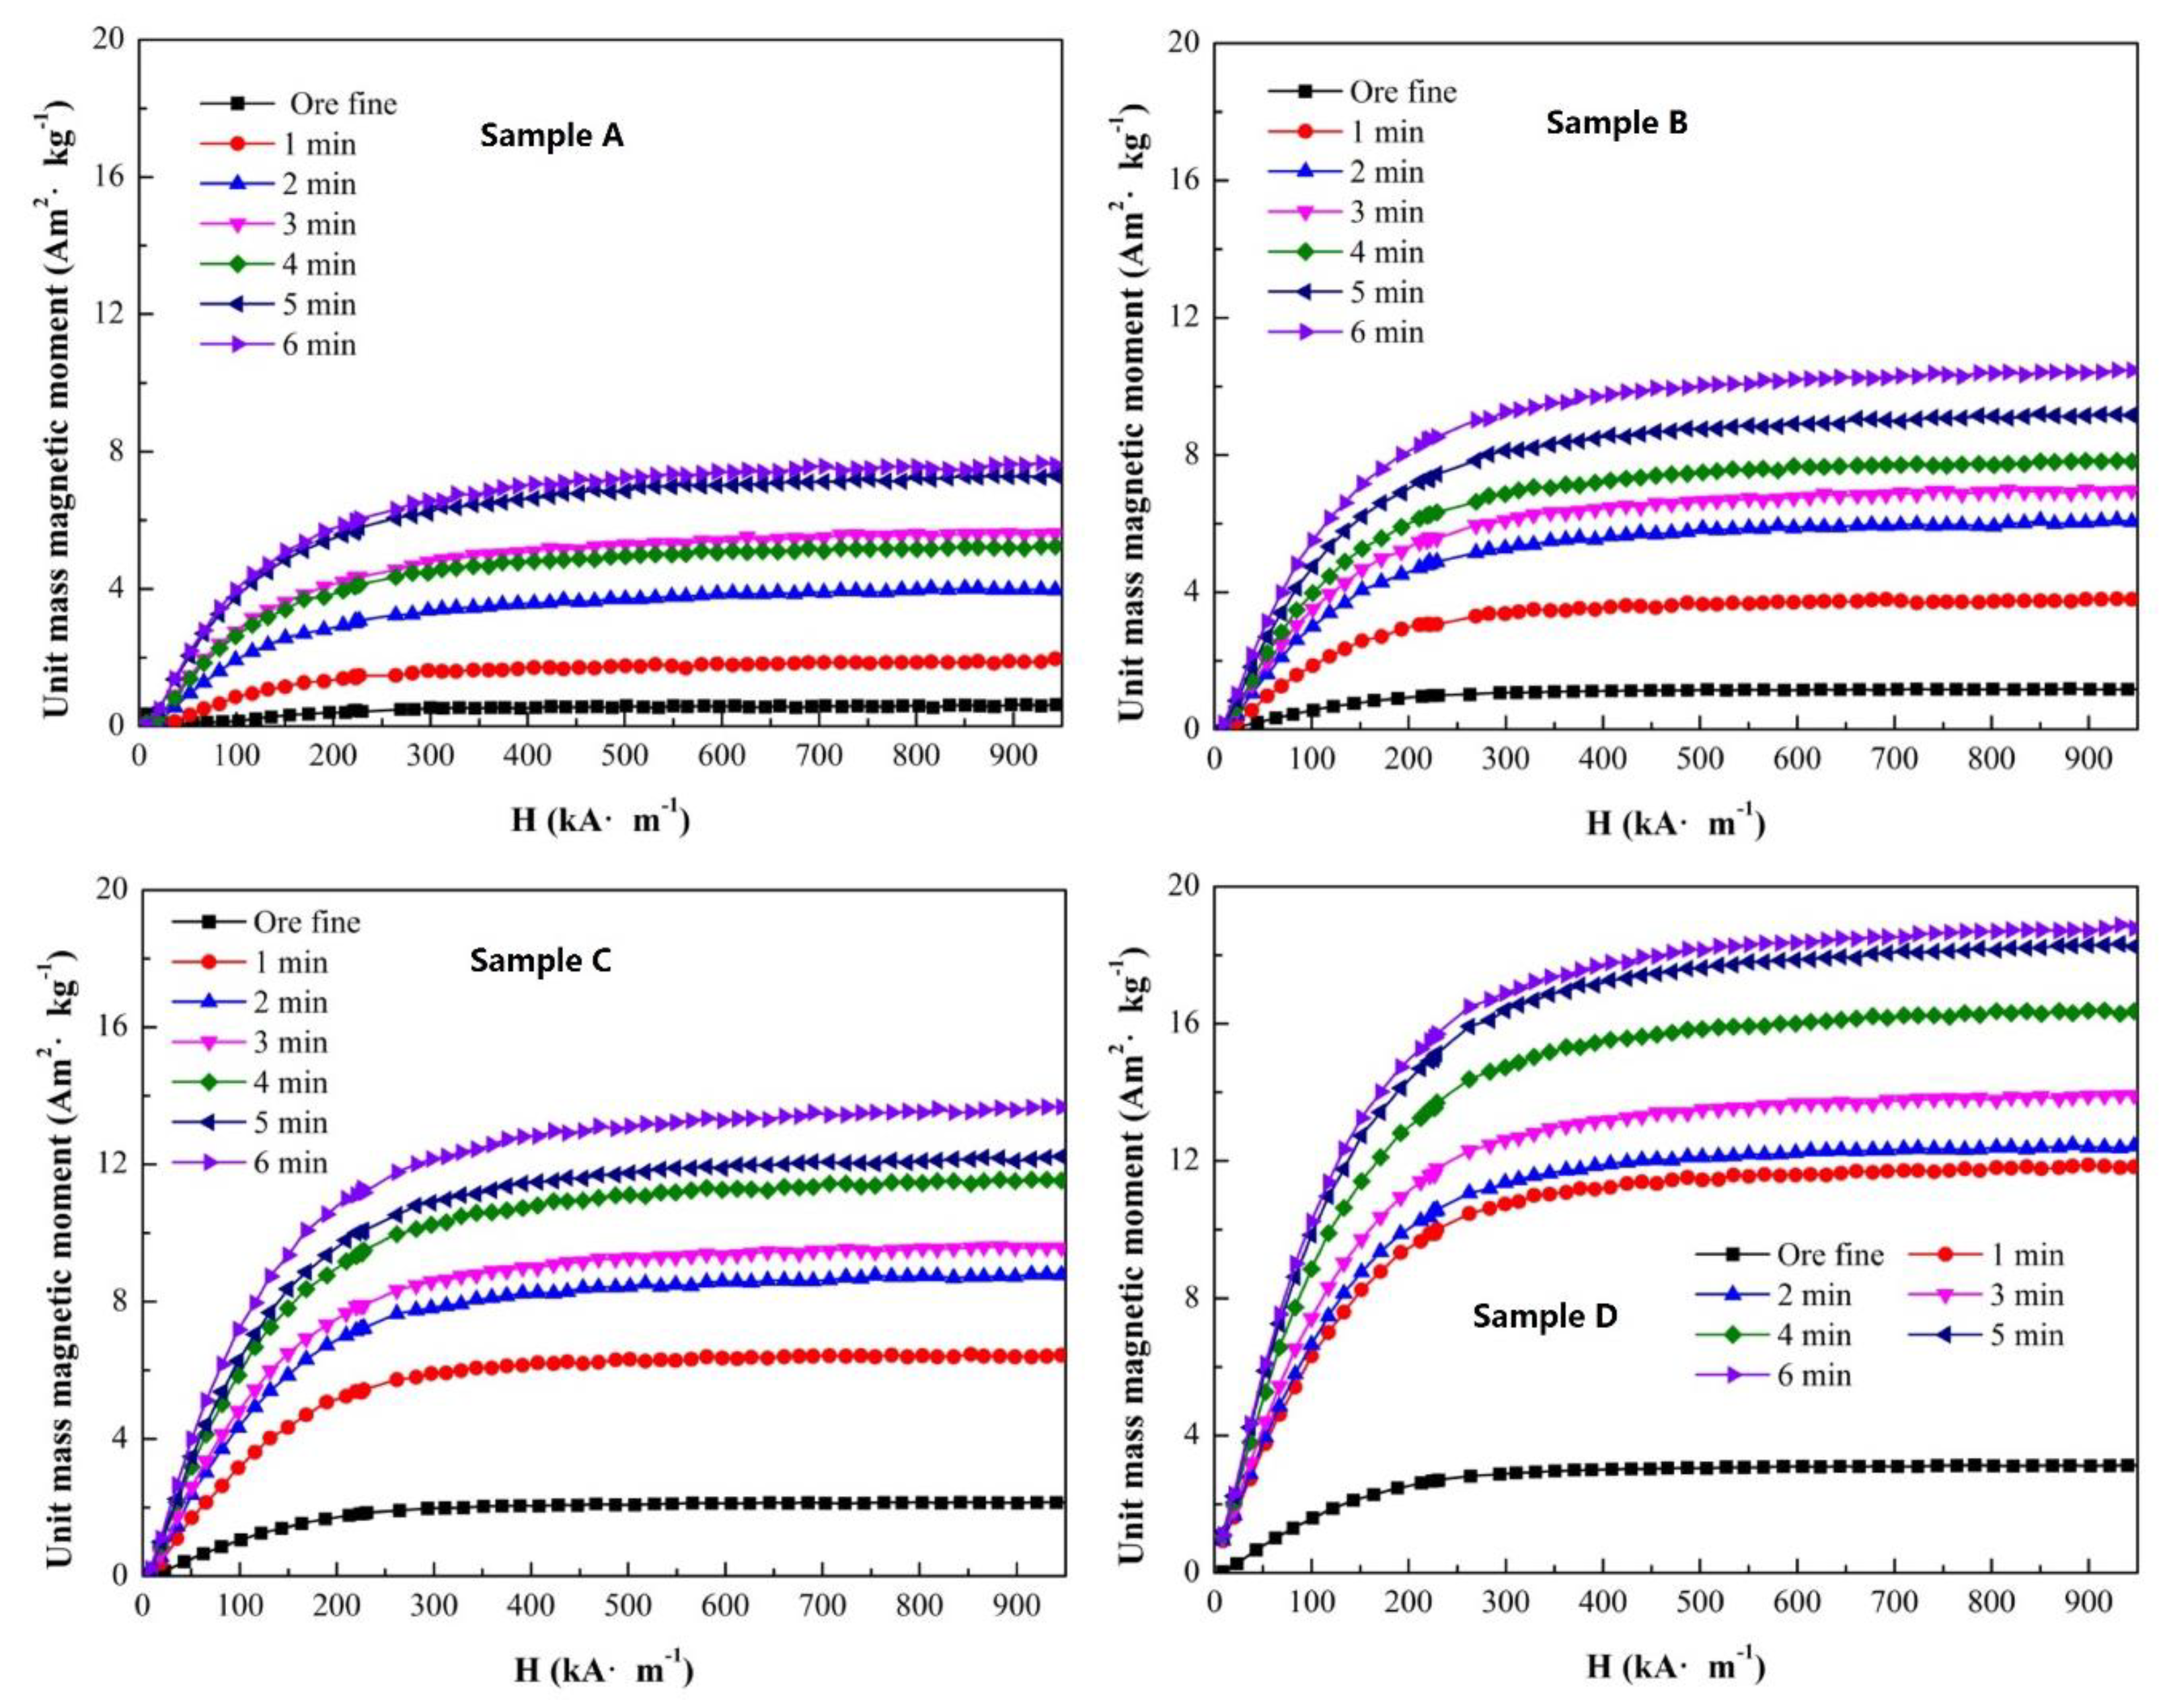
According to the comprehensive analysis of iron grade and iron recovery with different roasting temperatures in a single-factor experiment, the other experiment condition changed to roasting temperature of 580 °C, gas flow of 500 mL/min and CO ratio of 30% with different roasting times. The curves of unit mass magnetic moments of sample A to D are presented in
Figure 7.
The unit mass magnetic moment of each sample was strengthened with an increase in roasting time. Meanwhile, the unit mass magnetic moment of sample A to D was strengthened under the same roasting time. The effect of original magnetite content was also examined in the single-factor experiment of roasting time. The trends of the unit mass magnetic moment curves with different roasting times were similar to
Figure 5. The maximum values of unit mass magnetic moment were 7.66, 10.50, 13.67 and 18.87 Am
2/kg at an external magnetic field of 950 kA/m for sample A to D, respectively. The increment in unit mass magnetic moment was 7.10 Am
2/kg for sample A, 9.31 Am
2/kg for sample B, 11.53 Am
2/kg for sample C, and 15.73 Am
2/kg for sample D with roasting time of 6 min. Although the Fe masses of each sample were equal, the increments in unit mass magnetic moment of sample A to D were also not uniform. The increments in unit mass magnetic moment were less than those with a roasting temperature of 600 °C. It was confirmed that roasting temperature had a major effect on the magnetization property of magnetization roasted products.
During the magnetization roasting process, the roasting time plays an important role in heat and mass transfer. If the roasting time is short, the heat and mass transfer will be inefficient, which has a negative impact on the reduction reaction and magnetization process. If the roasting time is too long, the iron ore will lead to excessive reduction, which is consistent with the dissatisfactory reduction process with the higher roasting temperature. Adjusting the roasting time to a suitable range can be conducive to the reduction and magnetization process [
34,
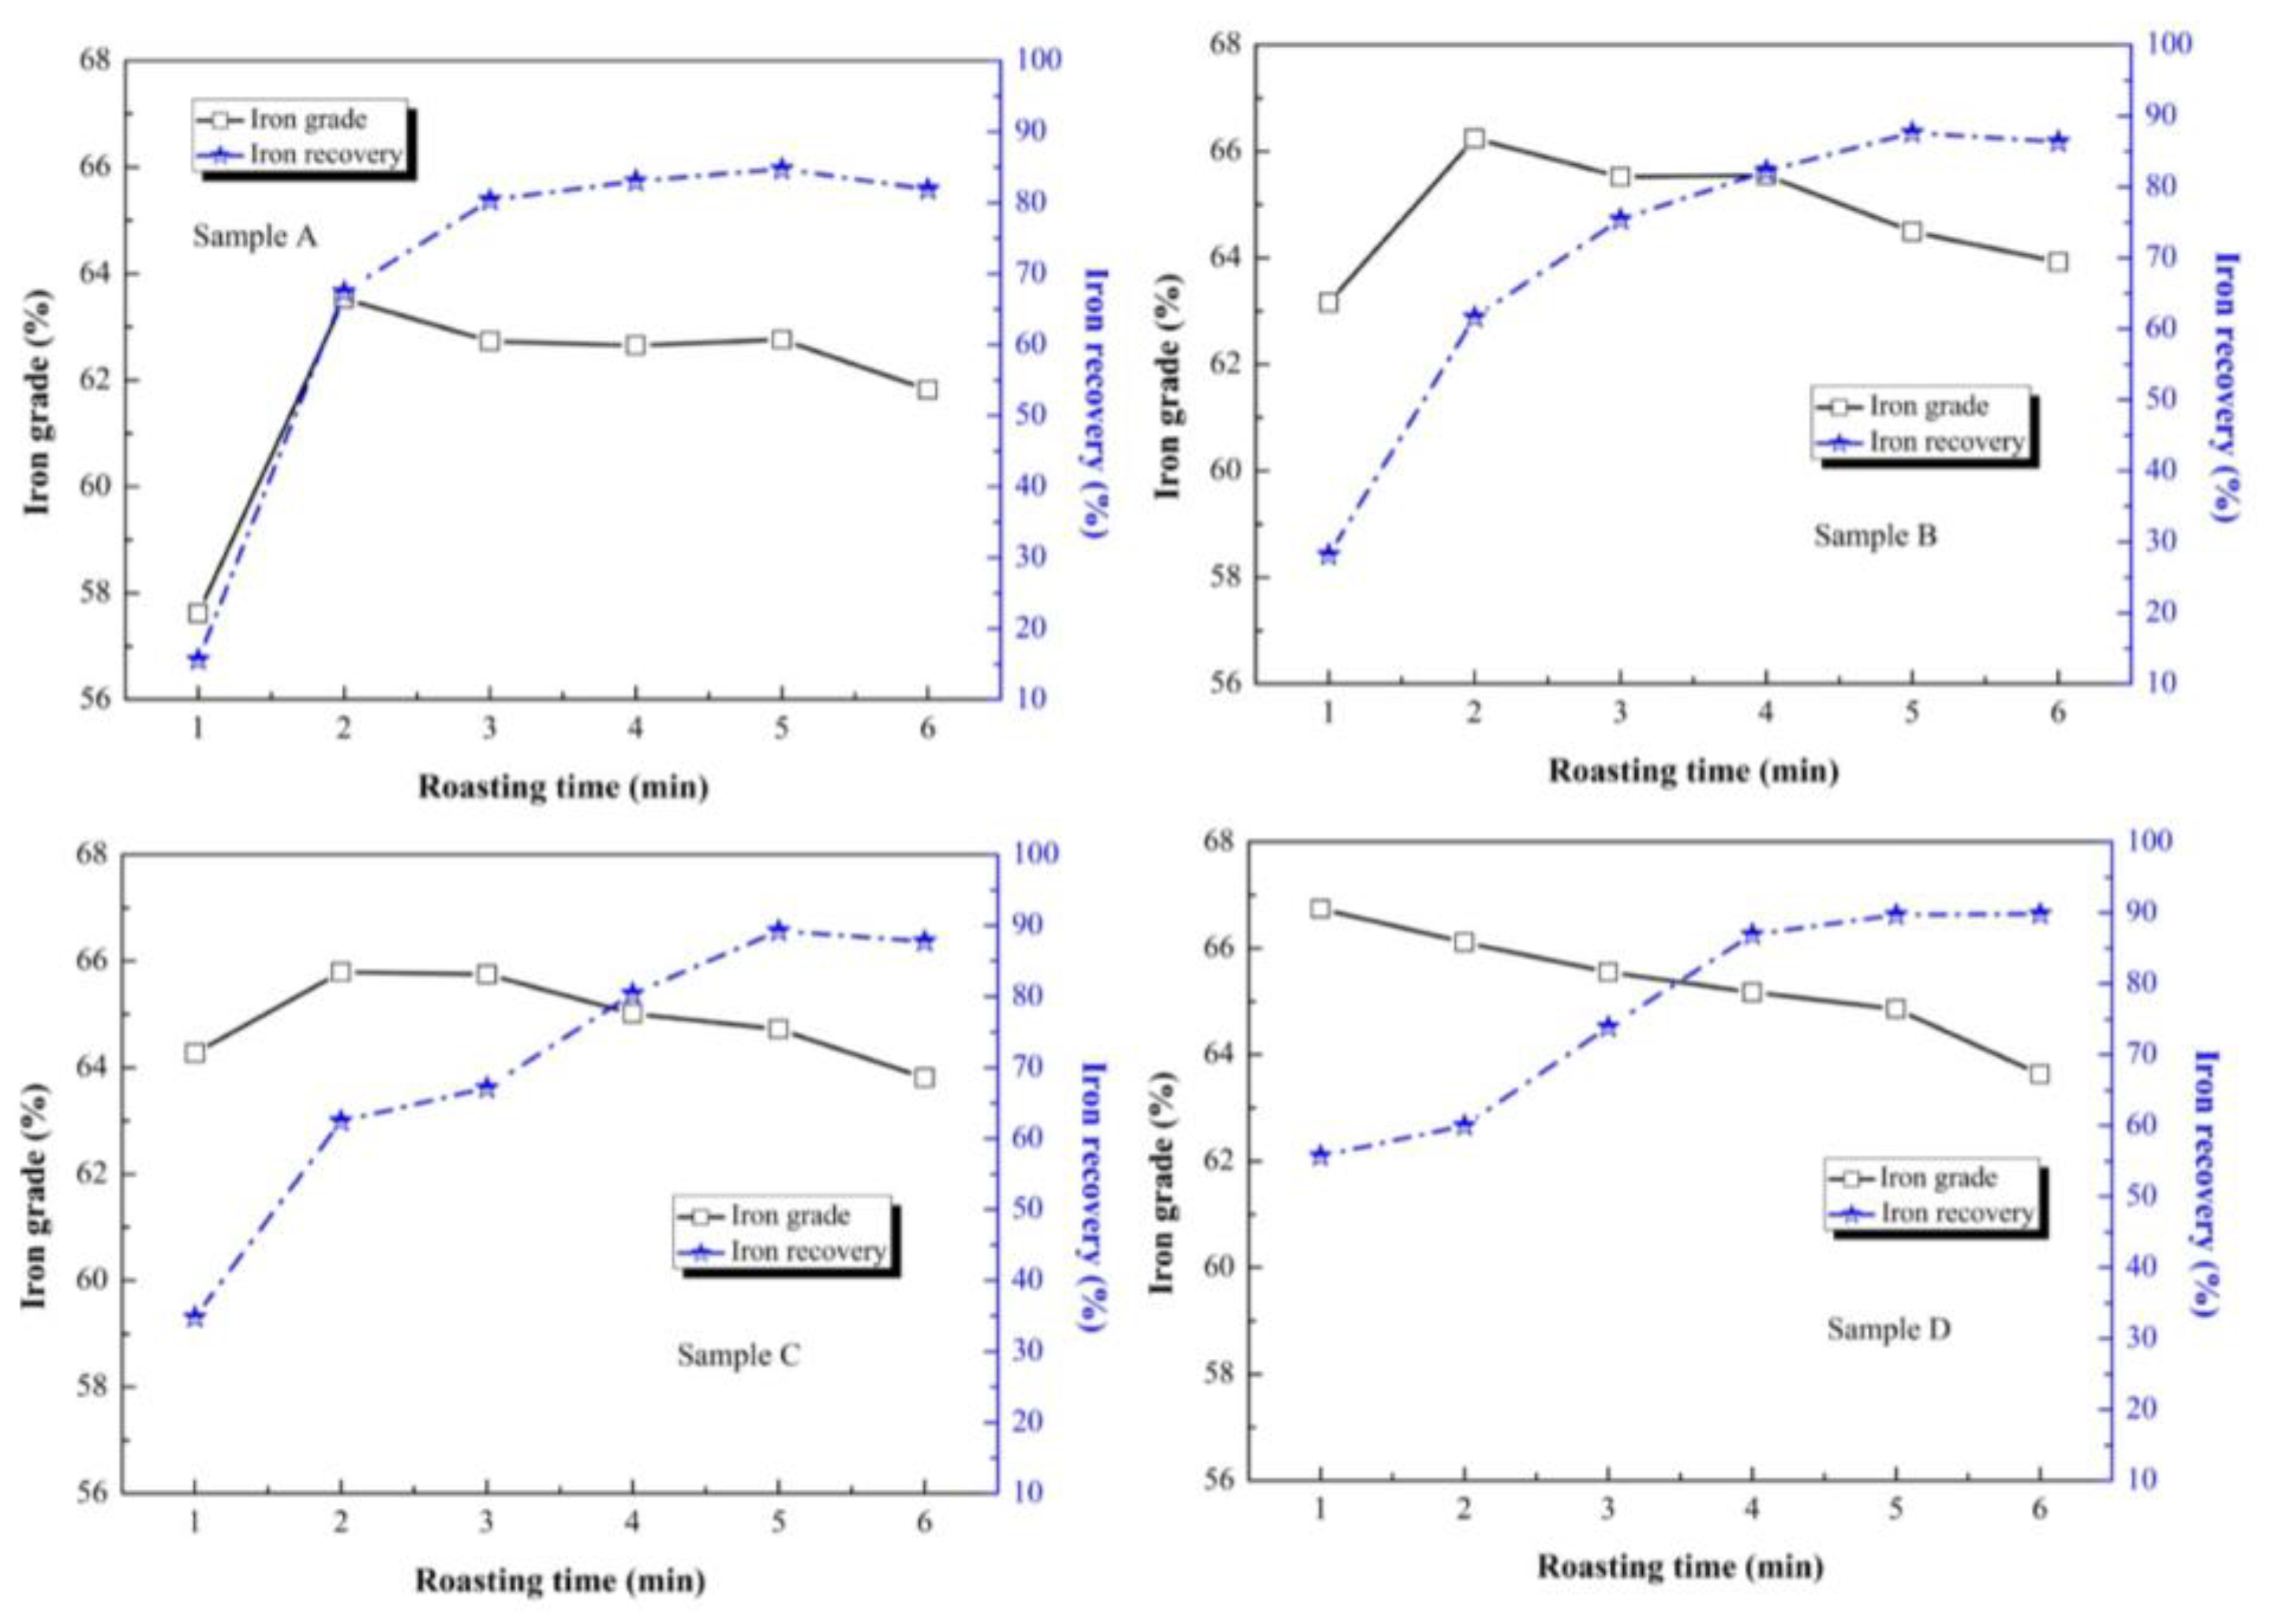
35]. To optimize the roasting time, a series of roasting and separation experiments were designed with different roasting times. The effects of roasting time on magnetic separation for sample A to D are presented in
Figure 8. As shown in
Figure 8, the iron grade of sample A to C increased and then declined during a roasting time of 1–6 min, and the peak value of iron grade appeared at a roasting time of 2 min. The maximum values of iron grade of sample A to C were 63.53%, 66.24% and 65.79%, respectively. The single-factor experiment of roasting time showed that a roasting time of 1–2 min could transform hematite to magnetite effectively. With the increase in original magnetite in each sample, the appropriate roasting time was reduced. The iron grade difference value of roasting time from 1 min to 2 min decreased to 5.91%, 3.08% and 1.52% in sample A to C. In sample D, the iron grade declined with an increase in roasting time, and the maximum value of iron grade was 66.74%. It was confirmed that if the original magnetite content is higher, the Fe
3O
4 transformation rate is also higher. This was dissimilar to the iron grade, as the iron recovery increased with an increase in roasting time in all the samples. The maximum values of iron recovery stabilized at a roasting time of 5 min, which were 84.72%, 87.61%, 89.22% and 89.67%, respectively. Therefore, the maximum level of transformation to Fe
3O
4 appeared at a roasting time of 5 min.
3.1.3. Effect of CO Ratio
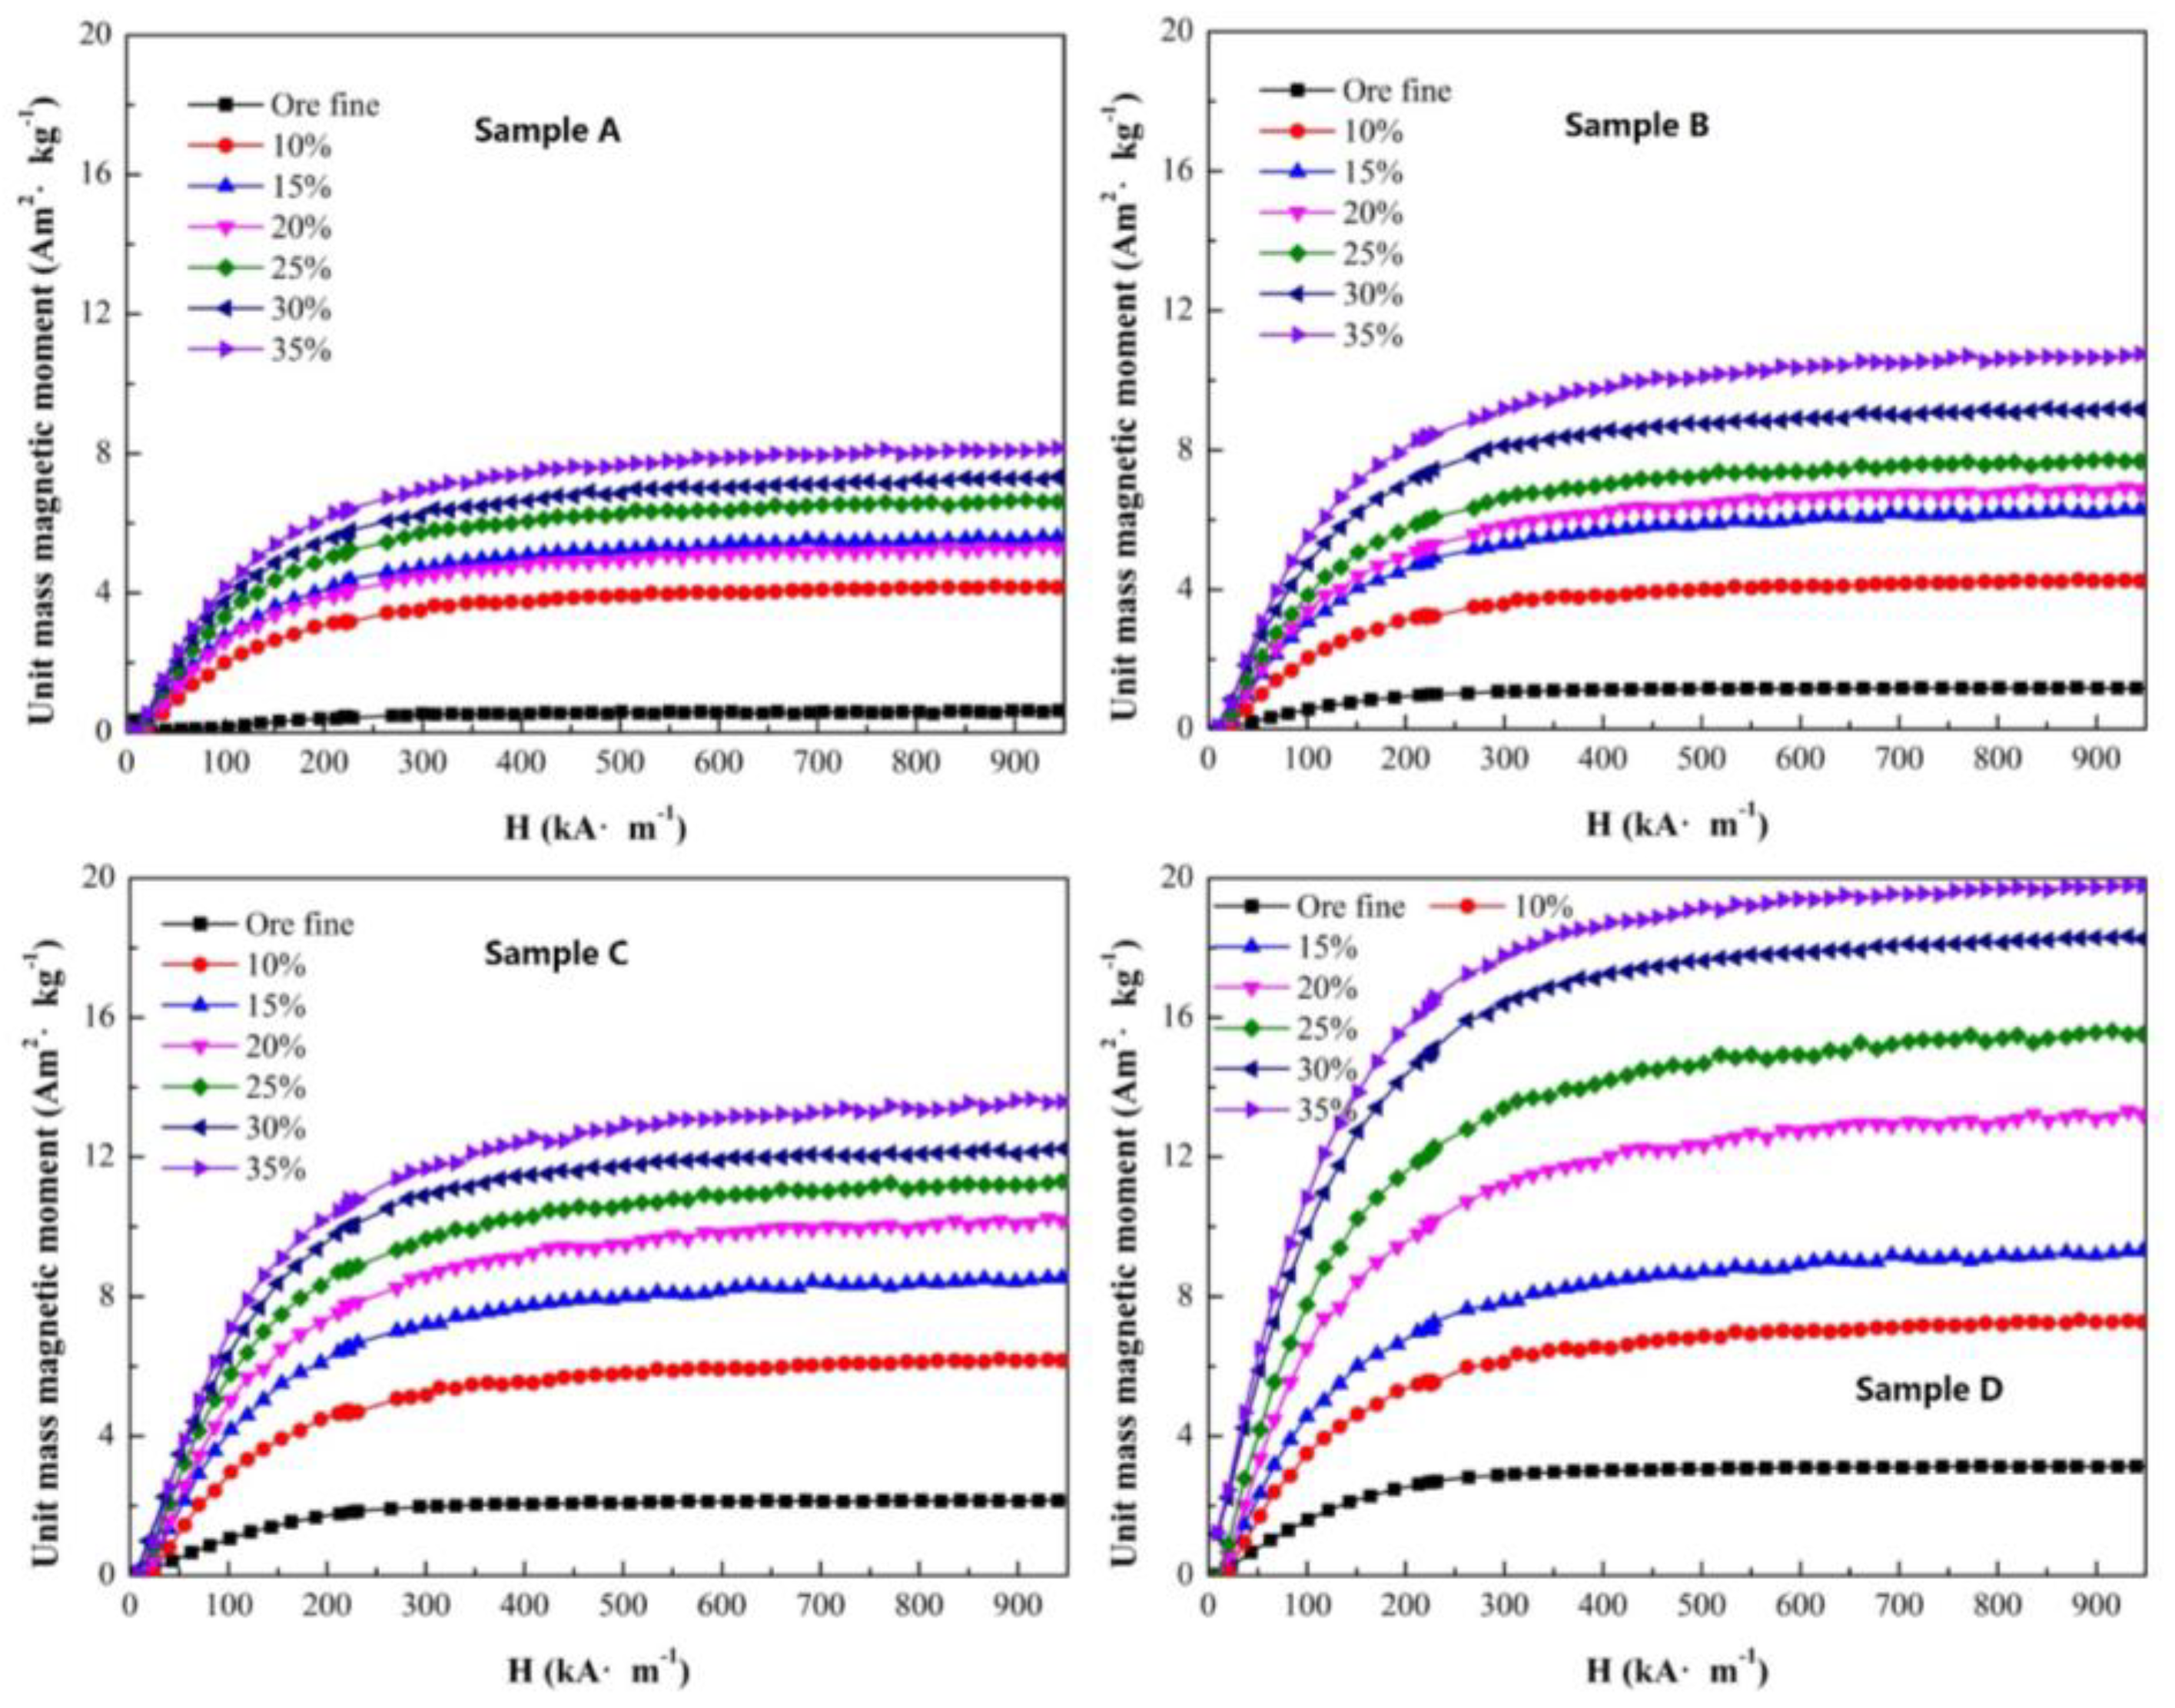
In addition to the condition of roasting temperature and roasting time, the CO ratio is also a crucial factor in the magnetization roasting process. Insufficient CO impedes hematite transformation to magnetite. According to thermodynamic analysis, excessive CO can cause magnetite transformation to FeO, or even Fe. Under the experimental conditions of a roasting temperature of 580 °C, roasting time of 5 min and gas flow of 500 mL/min, the magnetization roasting performances with different CO ratios were determined and are shown in
Figure 9. With an increase in the CO ratio, the unit mass magnetic moment increased obviously. For sample A, after roasting with a CO ratio of 35%, the unit mass magnetic moment changed from 0.56 to 8.18 Am
2/kg, and the increment in unit mass magnetic moment was 7.62 Am
2/kg. The increment in unit mass magnetic moment was 9.29 Am
2/kg for sample B, 11.44 Am
2/kg for sample C and 16.69 Am
2/kg for sample D with a CO ratio of 35%. The increments in unit mass magnetic moment of sample A to D were also not uniform. It was also found that the original magnetite content of a sample can affect the magnetization property when roasting with different CO ratios.
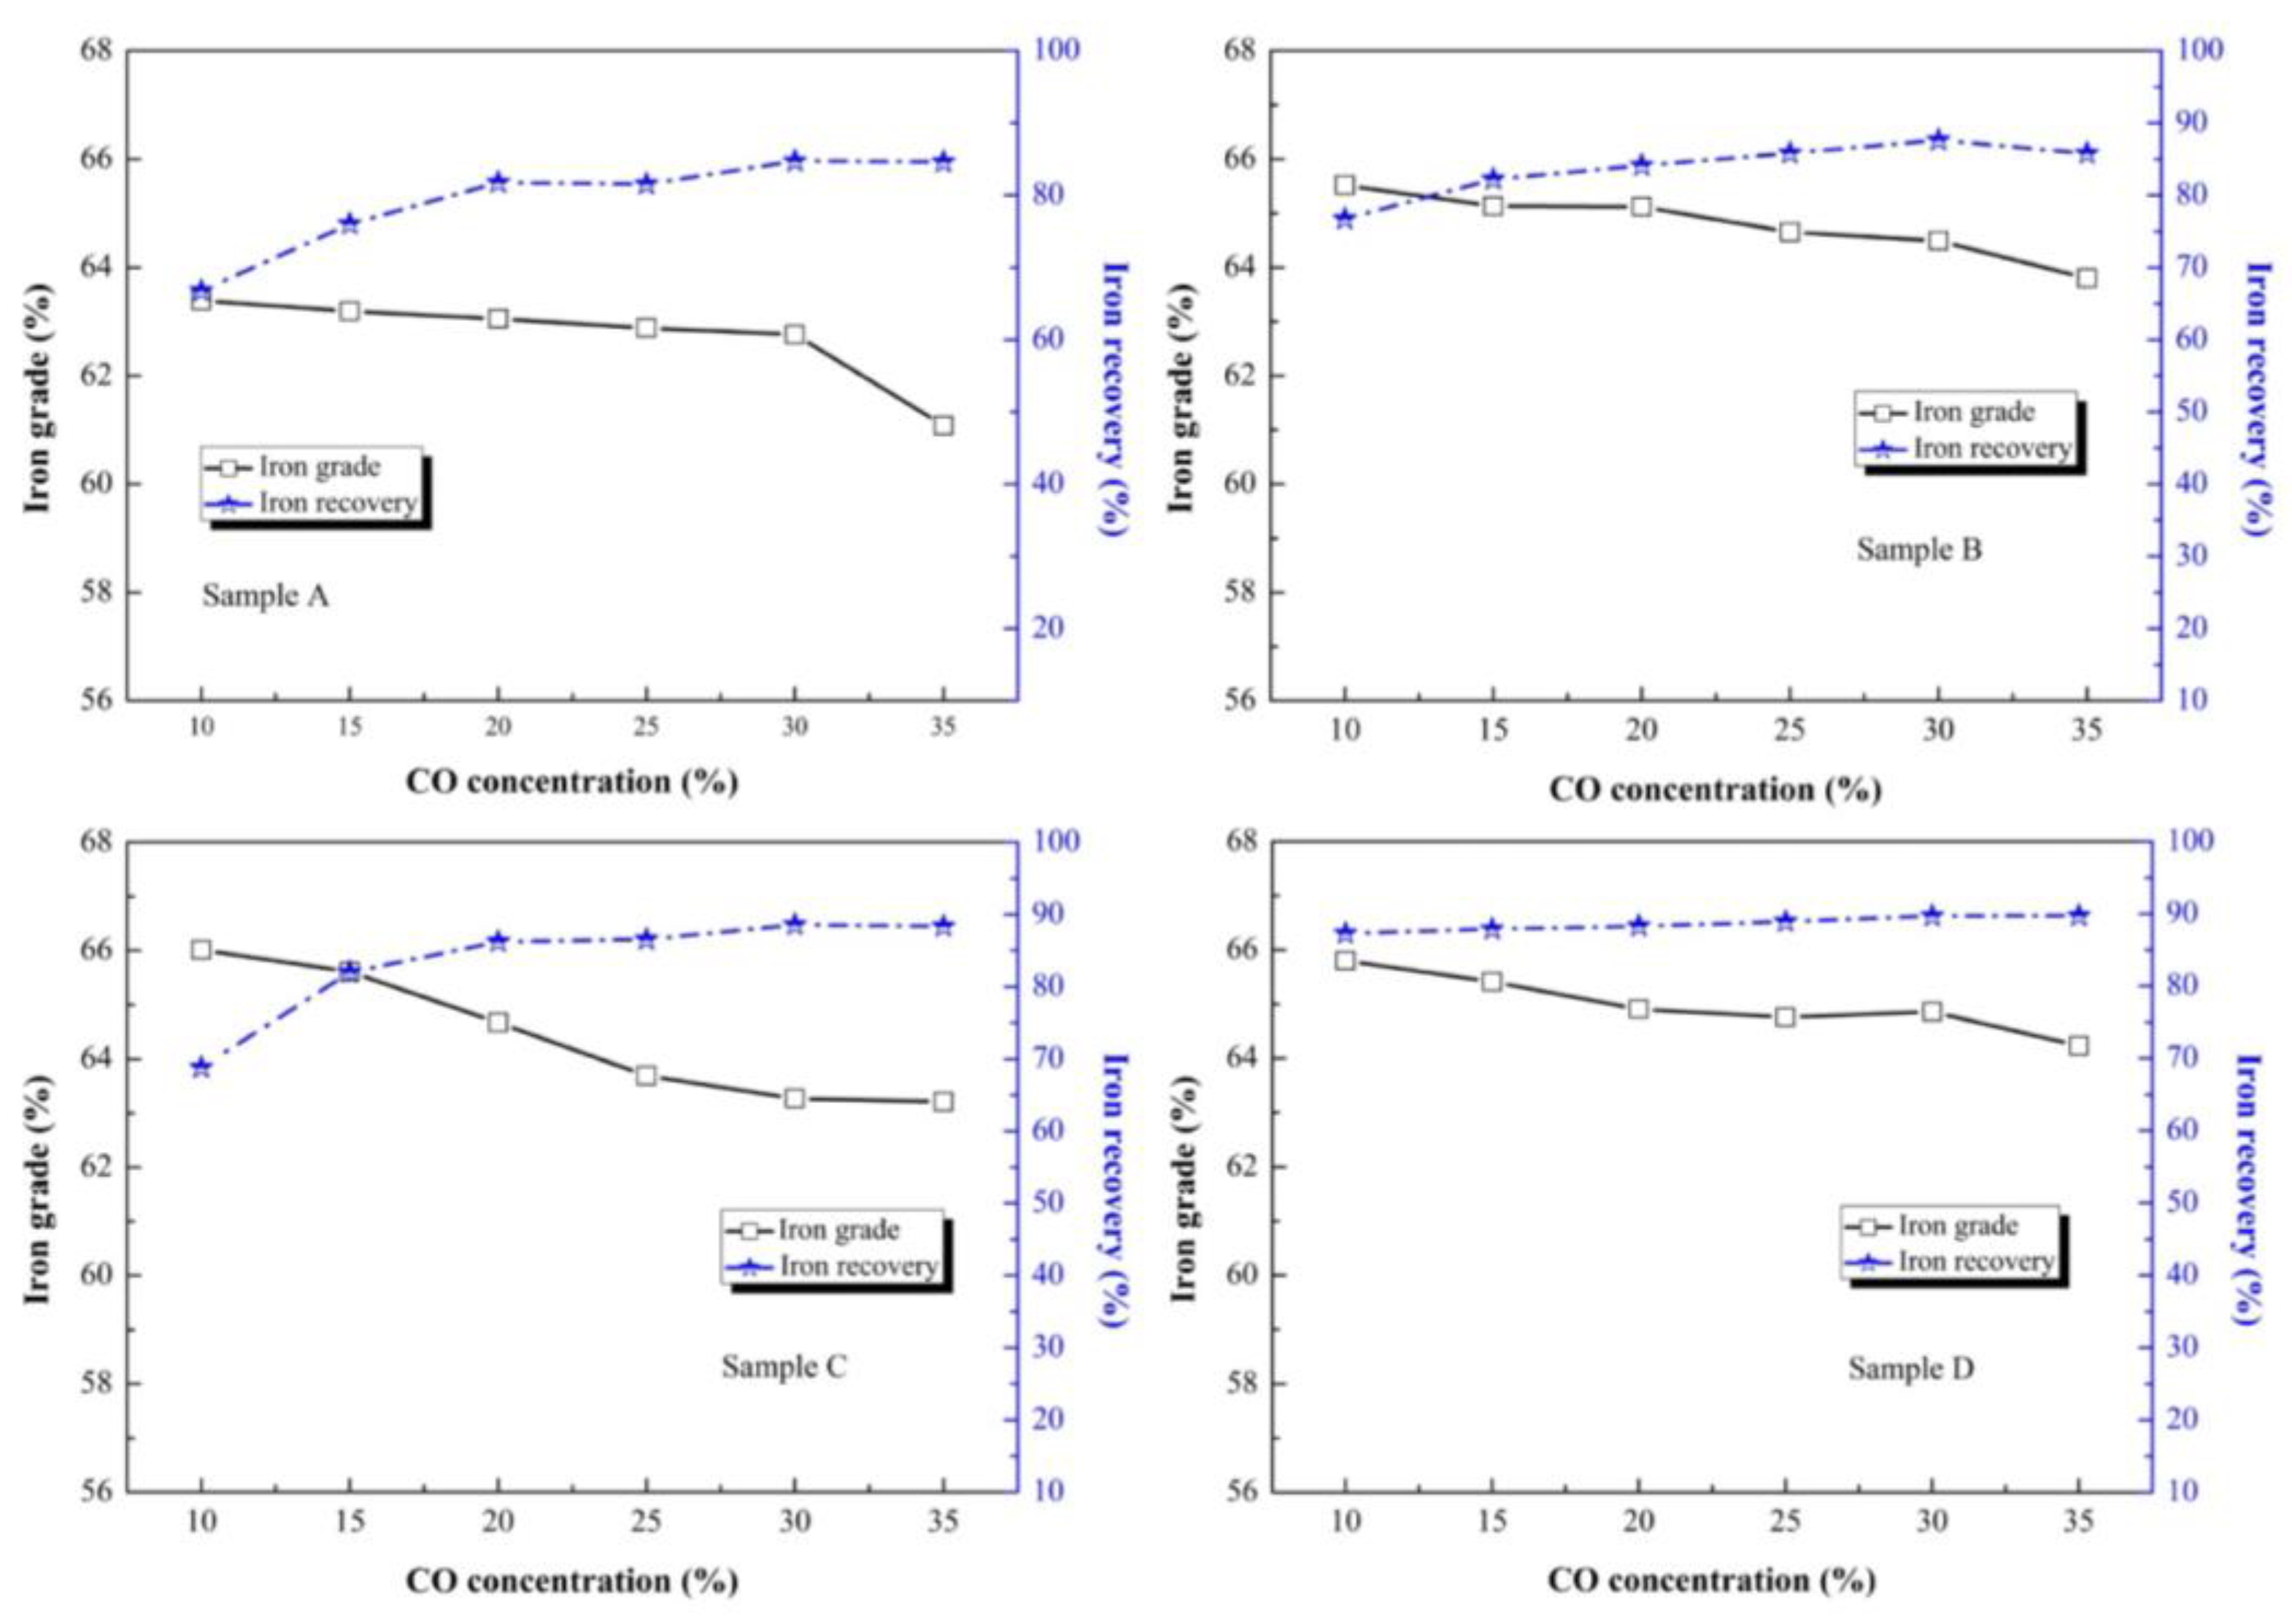
To determine the optimum CO ratio of the injection gas, a series of roasting experiments were designed with different CO ratios. As shown in
Figure 10, the iron grade of all the samples declined with an increase in CO ratio. The maximum values of iron grade of all the samples were 63.39%, 65.52%, 66.01% and 64.86%, respectively. When the content of original magnetite increased, the iron grade with a 35% CO ratio stabilized at 61.08% (sample A), 63.8% (sample B), 63.21% (sample C) and 64.23% (sample D). In agreement with the effect of roasting temperature and roasting time, the iron recovery increased continuously and stably when the CO ratio increased from 10% to 35%. Under the appropriate CO ratio of 30%, the iron recovery was 84.70% (sample A), 87.60% (sample B), 88.55% (sample C) and 89.68% (sample D). The increase in CO ratio increases the sufficient contact chance of the gas phase and solid phase, which accelerates the reduction of hematite to magnetite and optimizes the separation effect of magnetic concentrate [
22]. The superfluous CO, as a reductive gas, had a negative impact on magnetic separation, which caused the over-reduction of magnetite to weakly magnetic ferrous oxide. Meanwhile, the superfluous CO also caused reductive gas waste.
3.1.4. Effect of Gas Flow
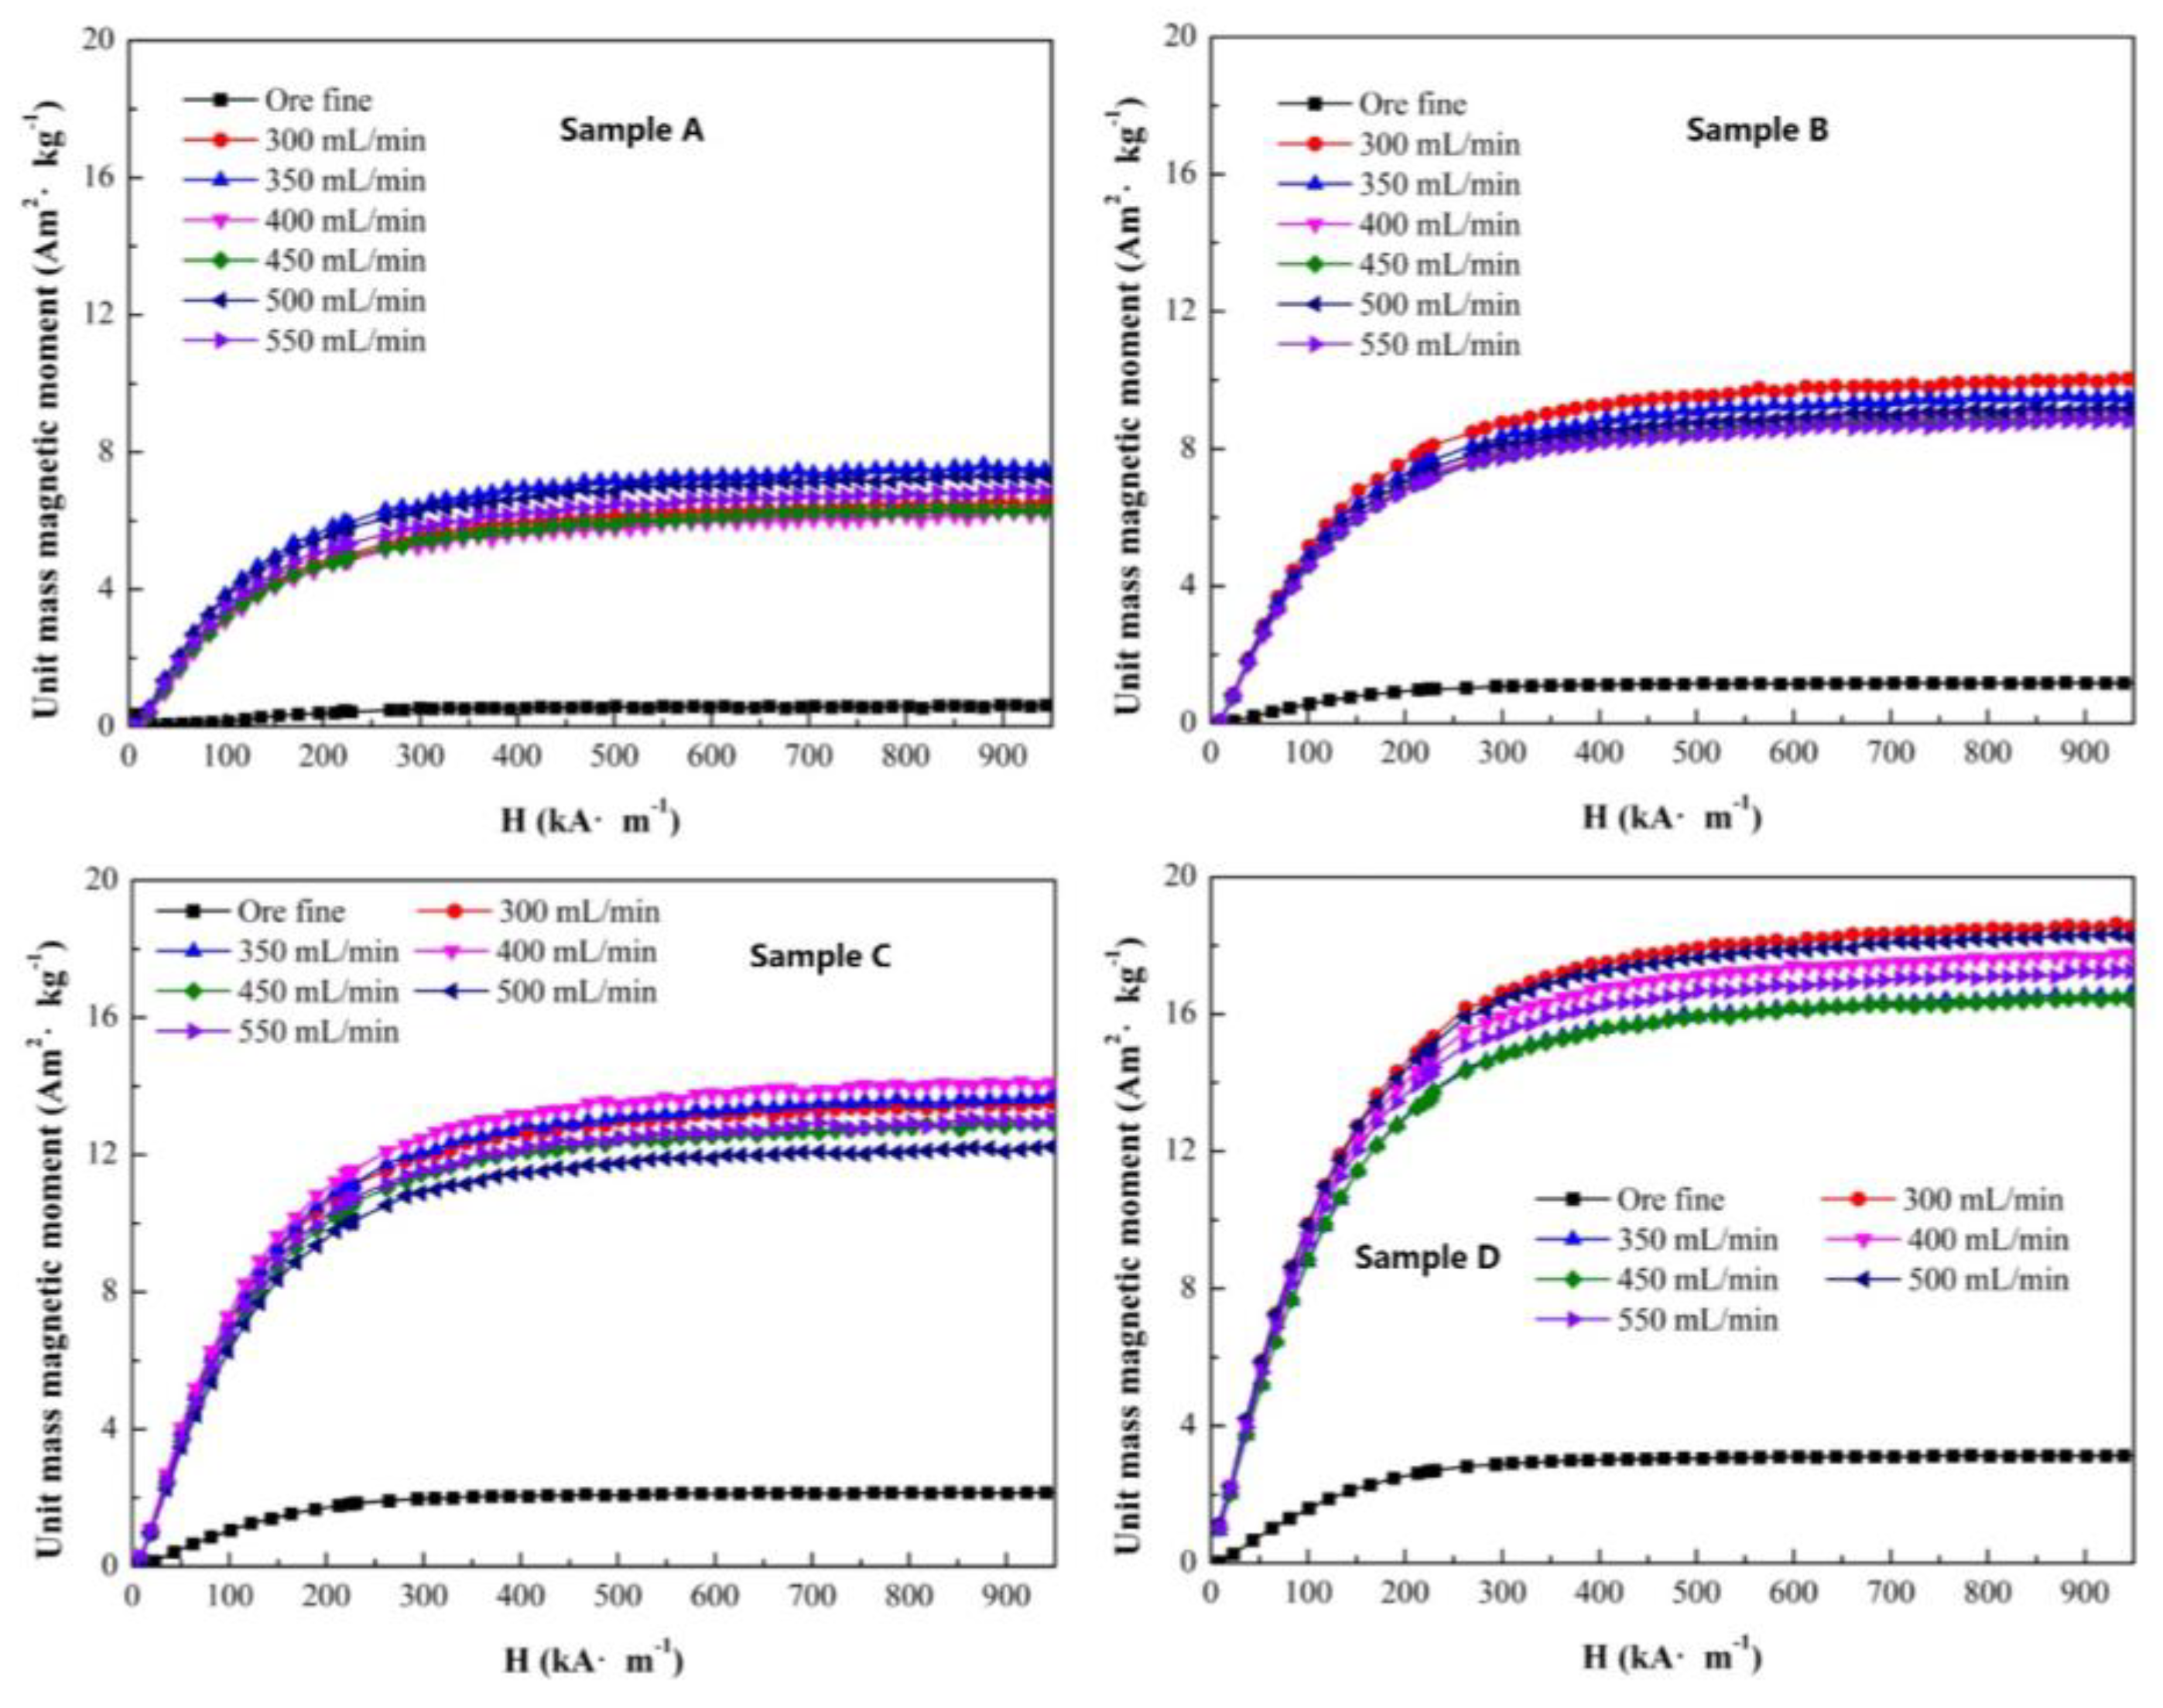
All the samples were roasted under the conditions of a roasting temperature of 580 °C, roasting time of 5 min and appropriate CO ratio of 35%. The unit mass magnetic moments of sample A to D with gas flow are presented in
Figure 11. For each sample, the unit mass magnetic moment stabilized within a certain range. The maximum unit mass magnetic moments were obtained with a gas flow of 350 mL (sample A), 300 mL (sample B), 400 mL (sample C) and 300 mL (sample D), not the highest gas flow. Therefore, for magnetization roasting, the reductive gas ratio and flow needed to cooperate and interact to produce the ideal reduction reaction result. As the original magnetite increased from 18.41% to 39.31%, the unit mass magnetic moment presented a stepped increase.
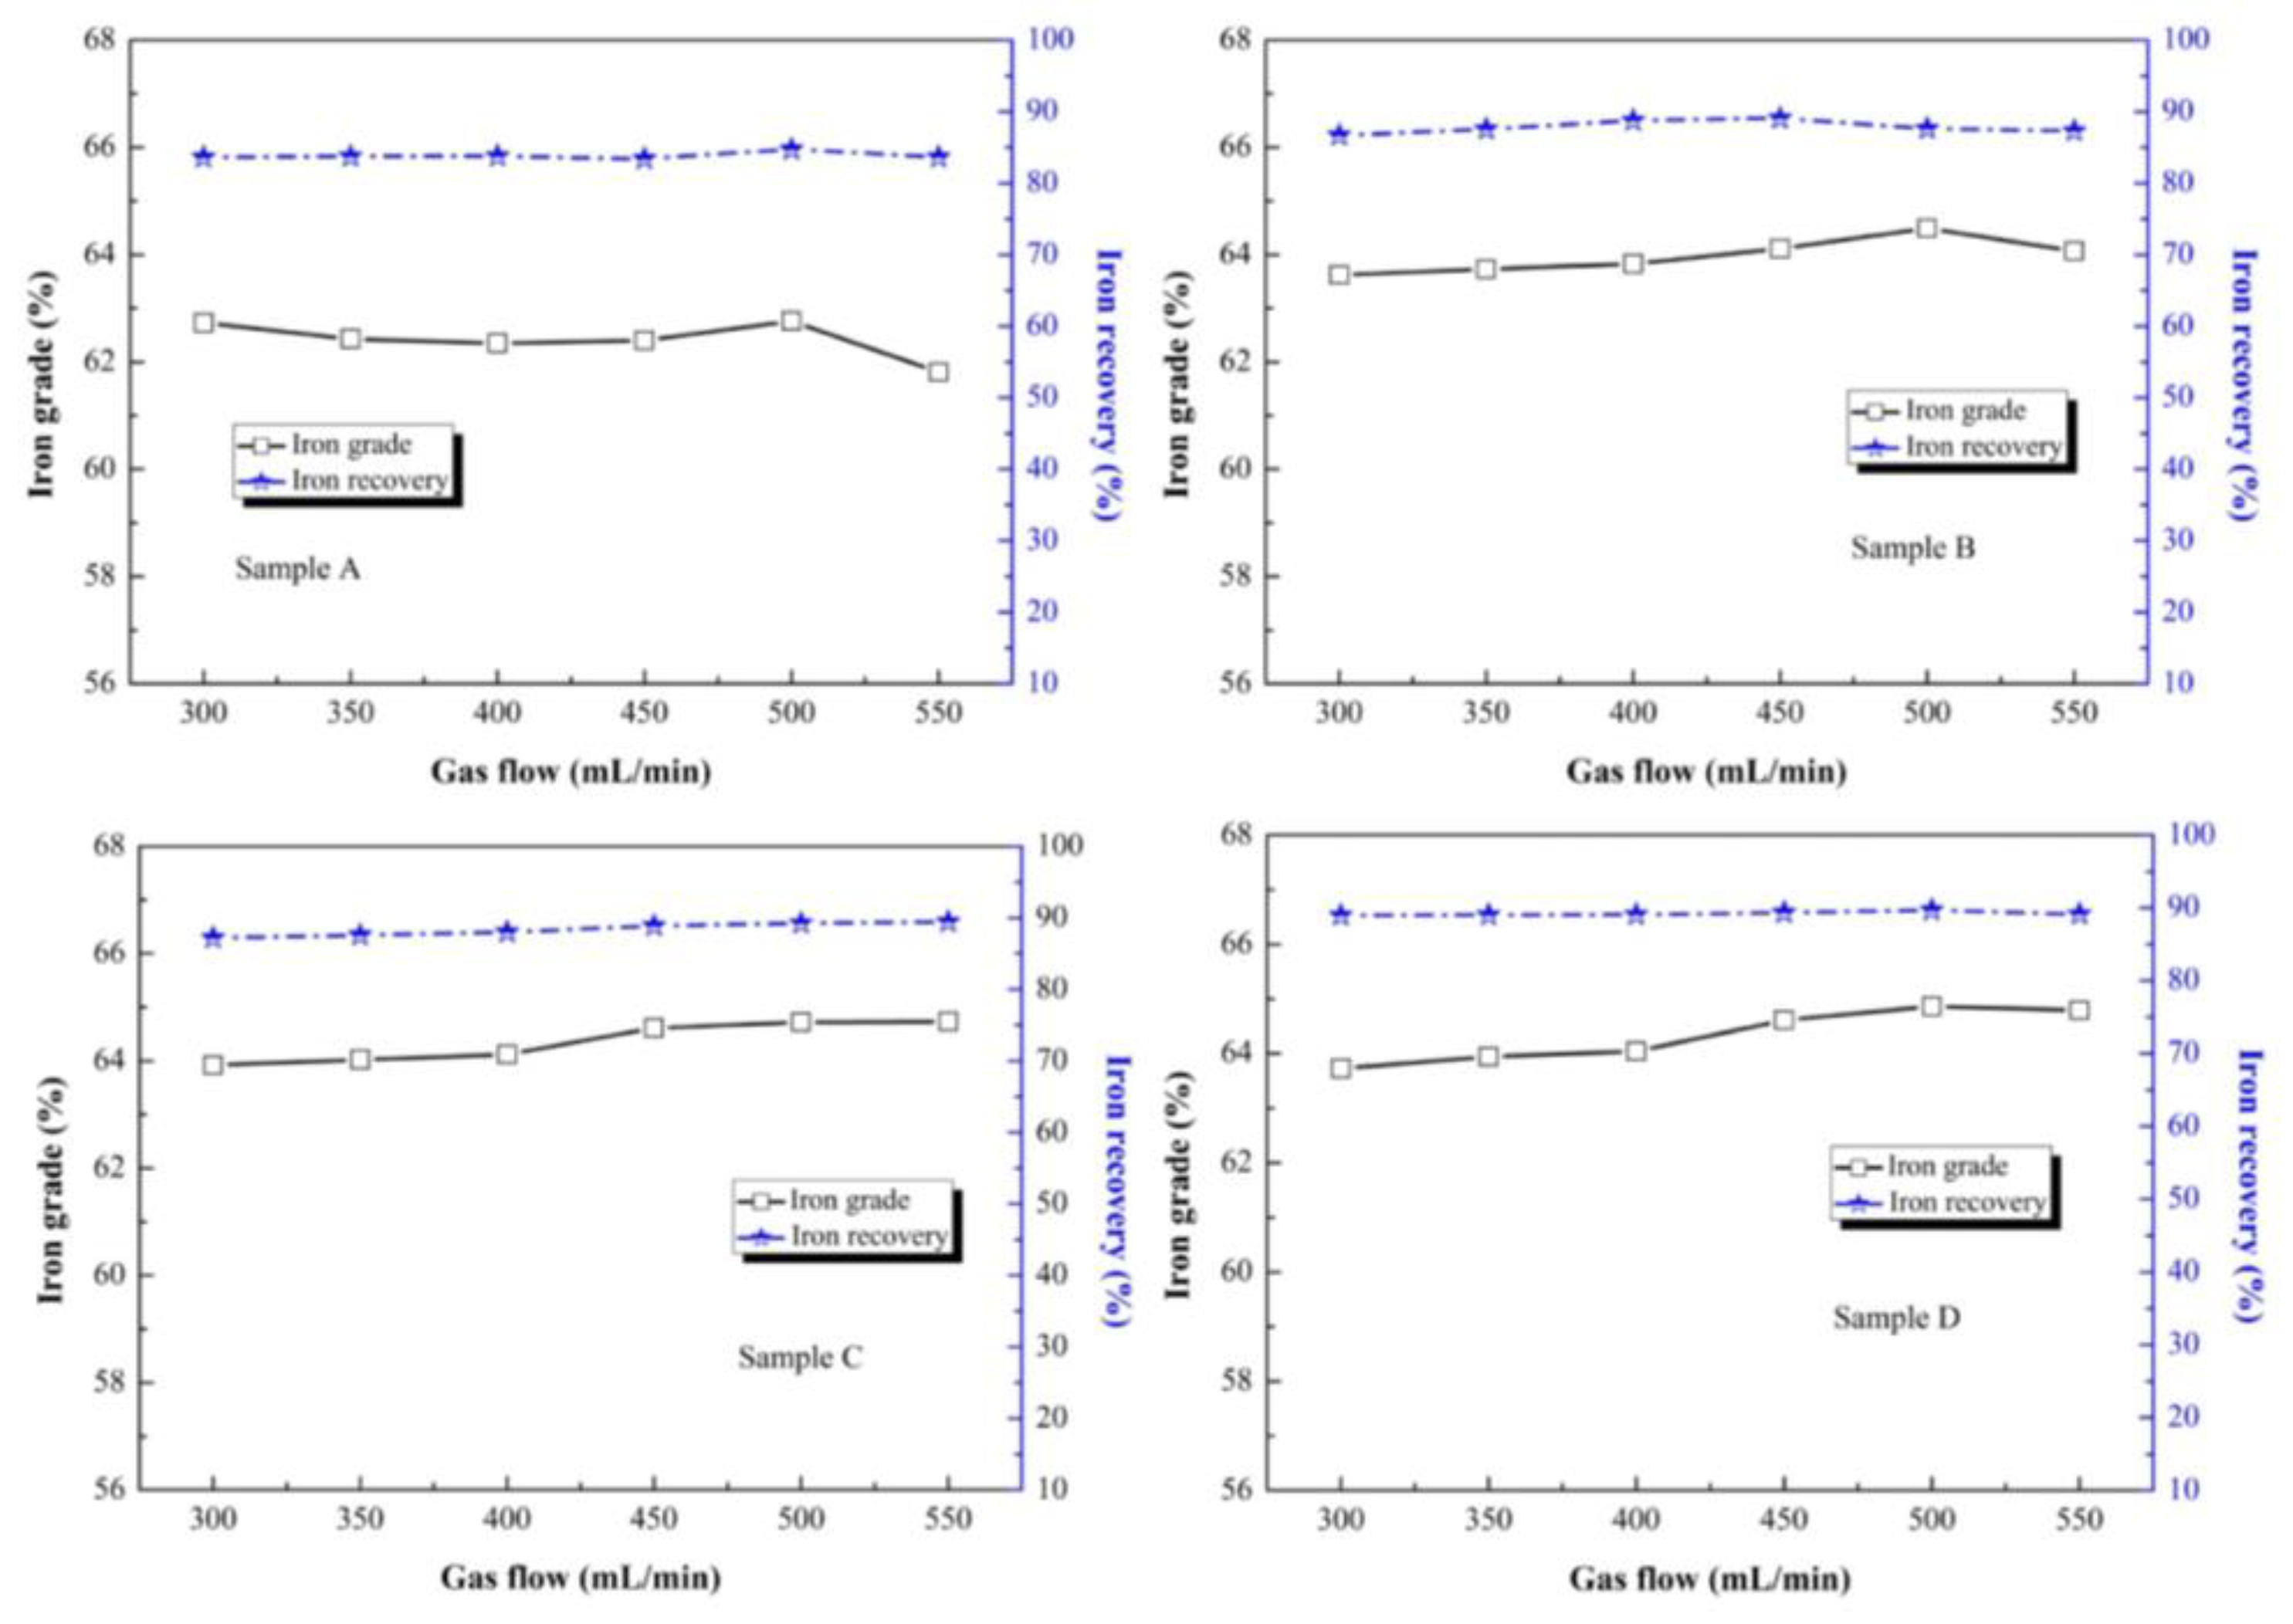
The different gas flows had a slight effect on iron grade and iron recovery of sample A to D, as shown in
Figure 12. For sample A and B, the iron grade fluctuated with a gas flow of 500 mL/min, then the iron grade declined at a gas flow of 550 mL/min. For sample C and D, the iron grade increased with a gas flow of 300 to 500 mL/min. Additionally, the iron recovery of all the samples stabilized at about 66%. Compared with roasting temperature, roasting time and CO ratio, the gas flow had the least effect on the magnetization roasting and separation index.
3.2. The Iron Phase Compositions after Magnetization Roasting
According to the single-factor experiments in
Section 3.1, the optimum magnetization roasting conditions were roasting temperature of 580 °C, roasting time of 5 min, gas flow of 500 mL/min and CO ratio of 30%, and all the samples obtained an outstanding separation index through magnetic separation. With the optimum roasting conditions, the determined iron phase compositions of sample A to D are presented in
Table 5, which can be used to analyze the transformation results from hematite to magnetite.
After magnetization roasting, the Fe in sample A to D was mainly present in the form of magnetite. For sample A, the content of Fe in magnetite increased to 11.82%, which increased 11.51% units after roasting. Similarly, after magnetization roasting, the content of Fe in magnetite increased to 14.88% (sample B), 16.69% (sample C) and 18.76% (sample D), and the content of Fe in magnetite grew in step with the original magnetite content. On the contrary, for sample A, the content of Fe in hematite declined to 1.20%, which decreased 11.02% units after roasting. The increased contents of Fe in magnetite were 11.51% units (sample A), 11.78% units (sample B), 11.14% units (sample C) and 10.67% units (sample D), 11% units approximately. The increased contents of Fe in magnetite did not present a stable escalating trend with the increase in original magnetite. Therefore, the results also need further verification by magnetization roasting experiments, the separation index and magnetism conversion of sample A to D. Compared with the content of Fe in magnetite, the content of Fe in hematite declined to 0.21% (sample B), 0.37% (sample C) and 0.46% (sample D) after roasting. The content of Fe in carbonate of all the samples increased slightly. Additionally, the content of Fe in sulfide and silicate of all the samples declined slightly, because ignition loss and thermal decomposition occurred in all the samples simultaneously. The change in iron phase composition after roasting provided direct evidence of magnetization transformation.
3.3. The Phase Transformations of Magnetization Roasted Products
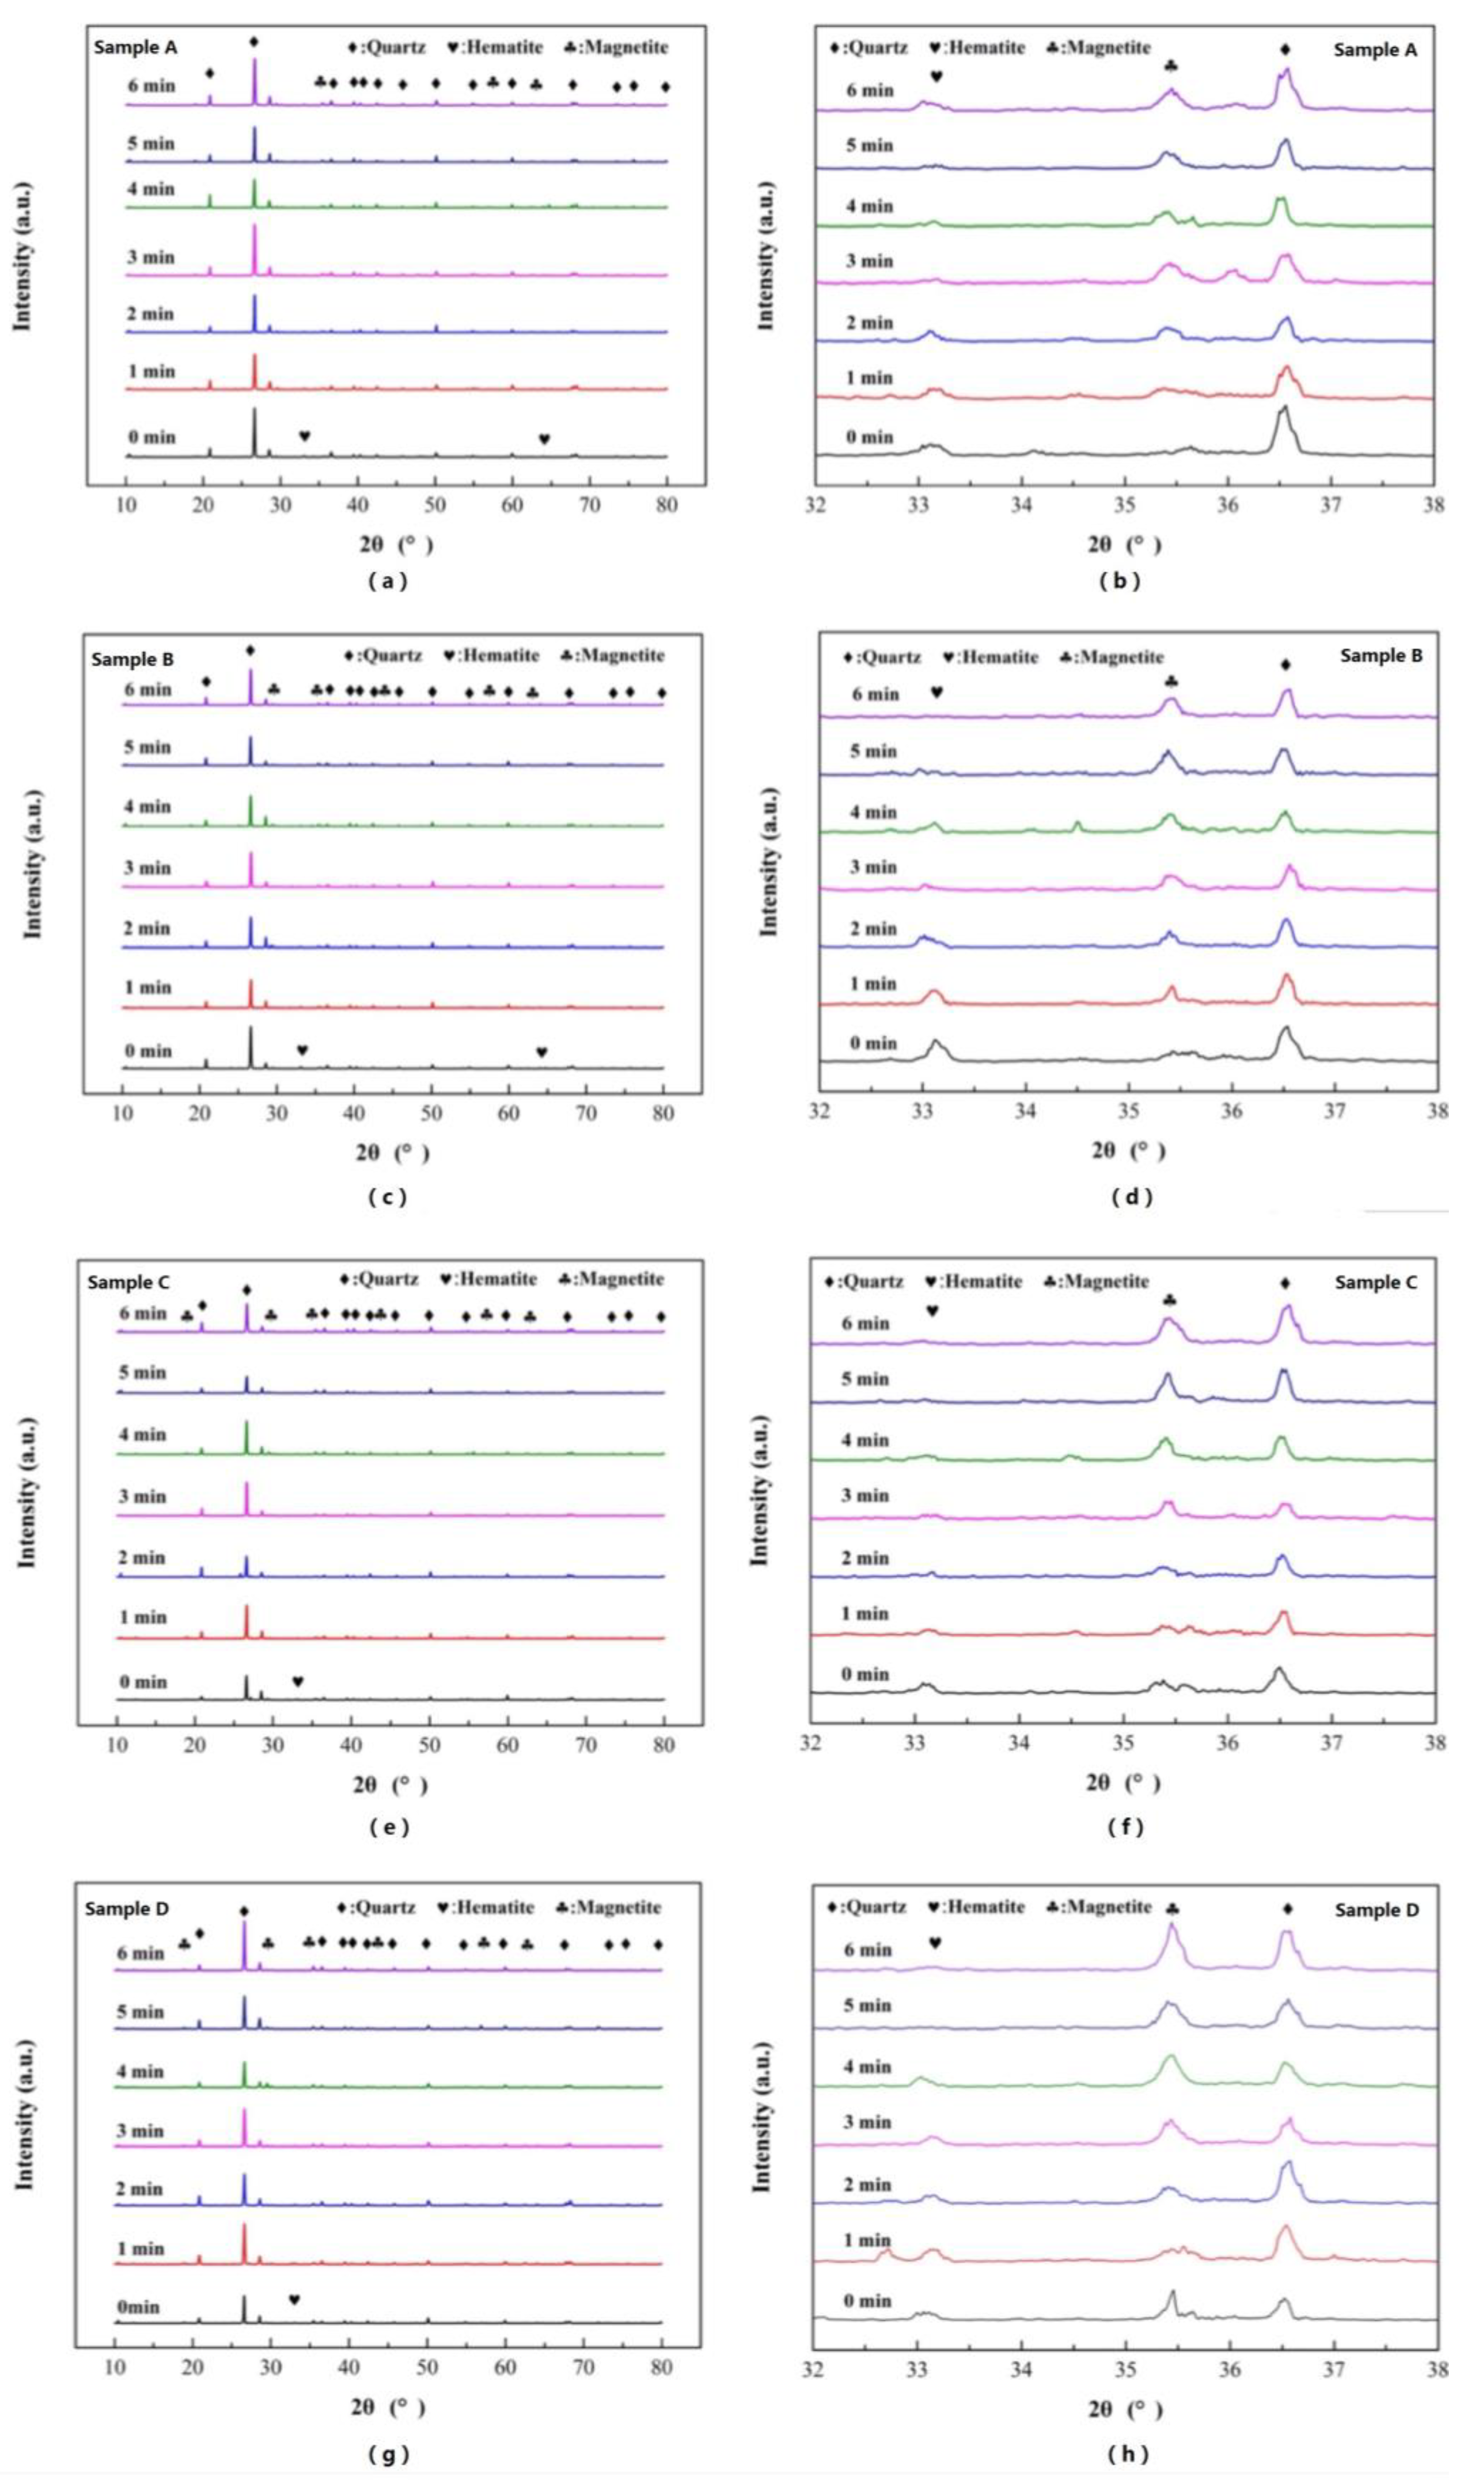
The phase transformation results of roasted samples are presented comprehensively, and XRD analysis was used to analyze the roasted products under different roasting times. The diffraction peaks of hematite, magnetite and quartz are presented in the XRD patterns of
Figure 13a,c,e,g.
Due to the progressive increase in original magnetite content, some diffraction peaks of hematite were observed in sample A and sample B. For all the samples, the XRD pattern presented the dynamic phase transformation process during magnetization roasting. The hematite transformed to magnetite gradually with a roasting time from 1 min to 6 min, which confirmed the reduction reactions of thermodynamic analysis. After 6 min of magnetization roasting, the number of diffraction peaks of magnetite increased with an increase in original magnetite content, which also agreed with the results of iron phase compositions of sample A to D. The 2θ range of 32° to 38° was selected to amplify and explore the iron phase transformations visually. As shown in
Figure 13b,d,f,h, the diffraction peaks at 35.5° were strengthened gradually during the roasting time from 1 min to 6 min, which presented the magnetite. Meanwhile, the diffraction peaks at 32.2° were weakened gradually during the roasting time from 1 min to 6 min, which presented the hematite.
3.4. The Original Magnetite Effect of Reduction Reaction under Optimum Roasting Conditions
Under the optimum roasting conditions listed in
Section 3.1, the difference in original magnetite content could affect the separation index and magnetism conversion rate of sample A to D. The separation indexes of sample A to D are presented in
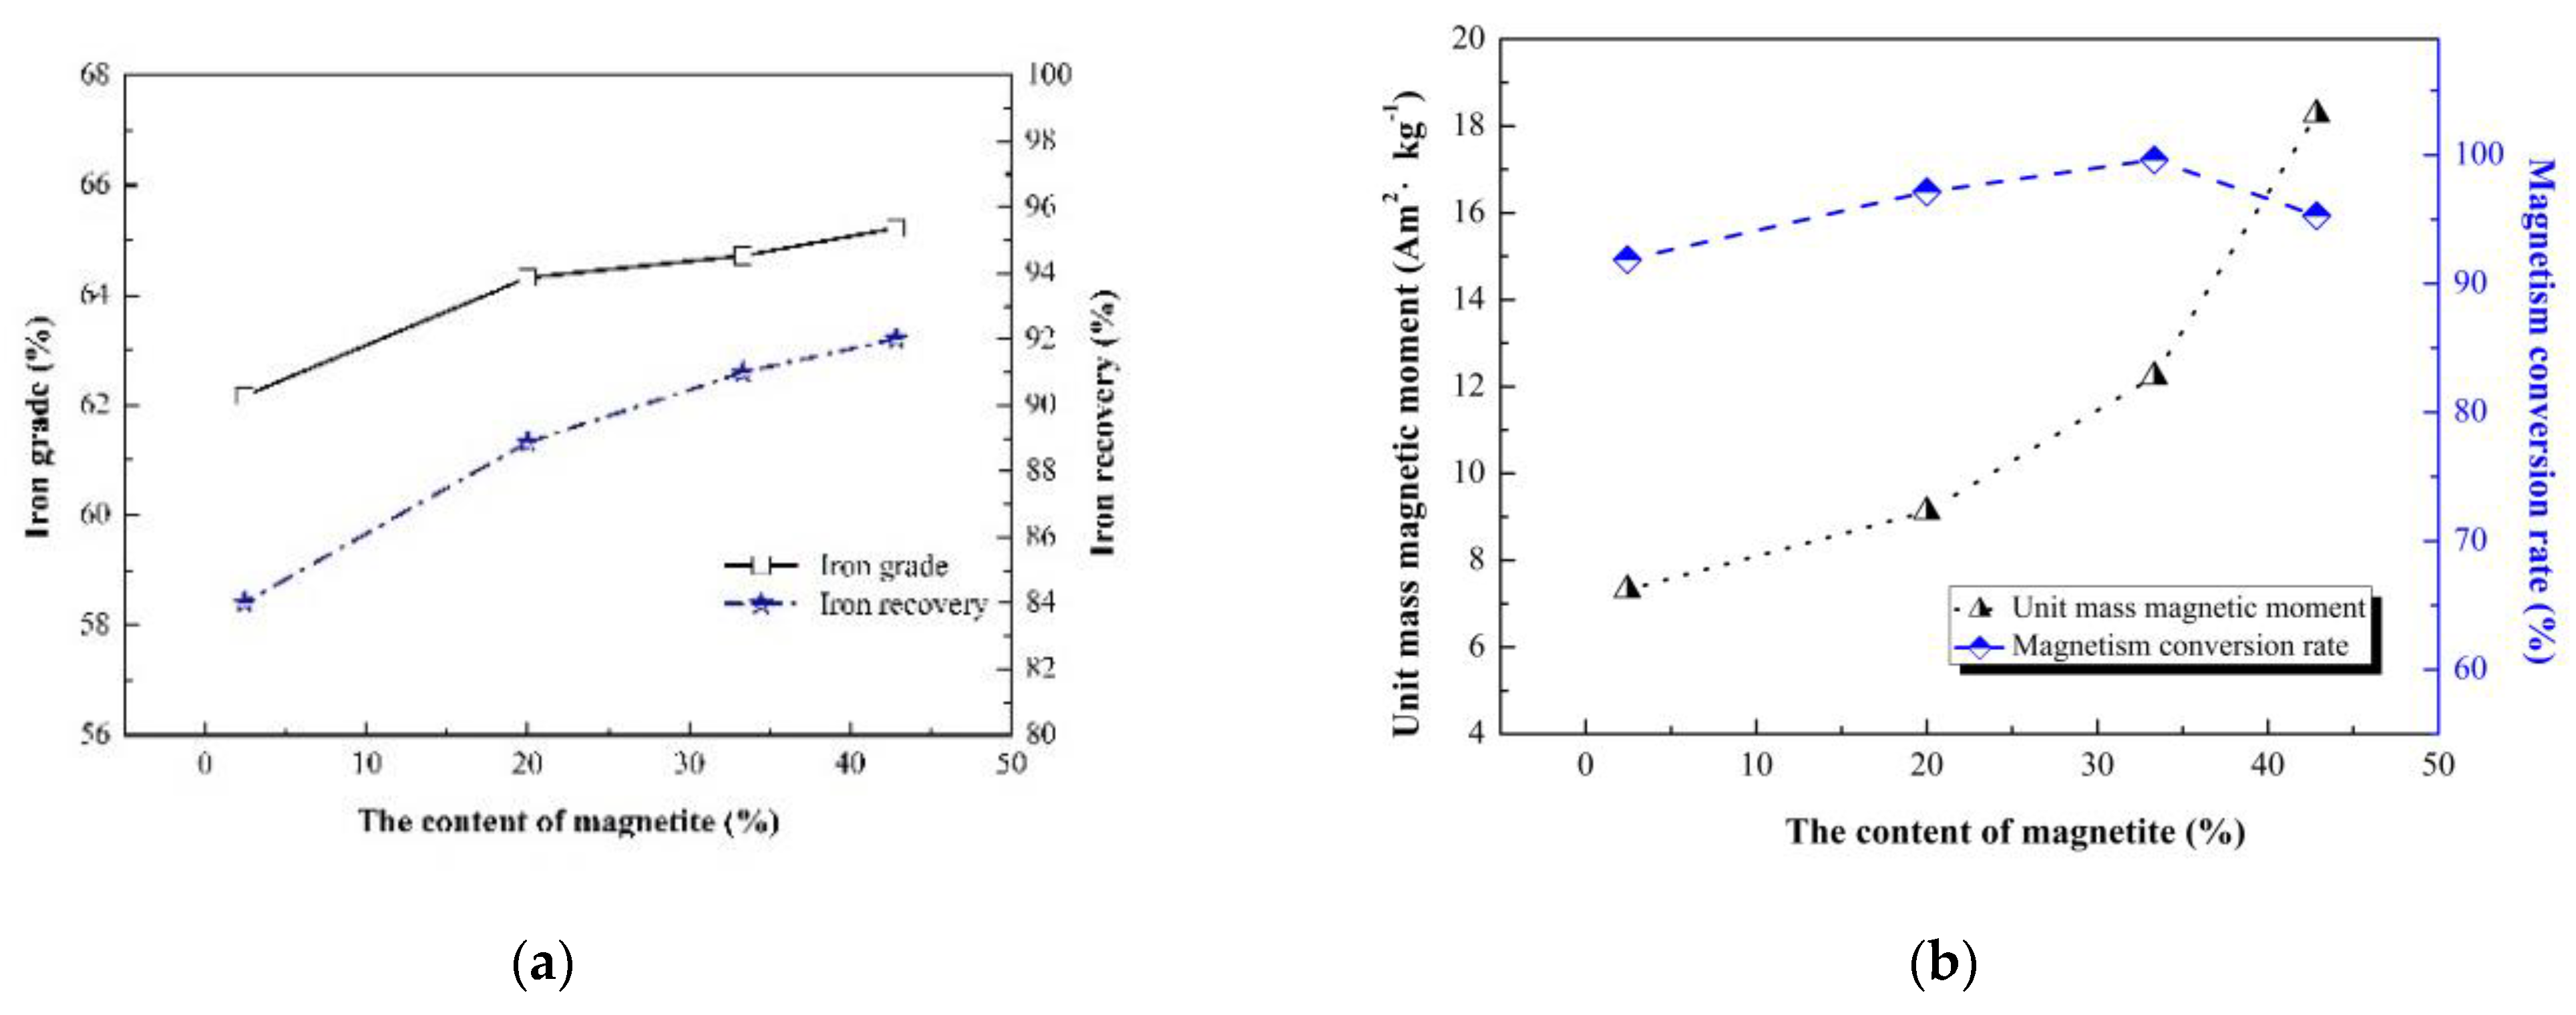
Figure 14a, and the iron grade and iron recovery of sample A to D showed a single growth trend. With magnetization roasting at the optimum conditions, the iron grade increased from 62.17% to 65.22%, and the iron recovery increased from 84.02% to 92.02% after separation, when the original magnetite content of ore fines increased from 2.13% to 39.31%, although the Fe masses of each sample were equal. Therefore, the separation index had direct correlation with the difference in original magnetite of sample A to D. Higher original magnetite content could promote phase transformation hematite and optimize the separation index. The magnetism conversion rate and the unit mass magnetic moment are presented in
Figure 14b. With the equal Fe masses of sample A to D, the unit mass magnetic moment grew steadily, and the increase rate was not linear. Higher original magnetite content resulted in an increase in unit mass magnetic moment. In sample D, the unit mass magnetic moment could reach 18.27 Am
2·kg
−1. The increase in unit mass magnetic moment was in favor of the separation index.
The overall trend of magnetism conversion rate was an increase with an increase in original magnetite content. The magnetism conversion rates of sample A to D were analyzed with the iron phase. When the content of Fe in original magnetite increased from 0.31% (sample A) to 5.55% (sample C), the magnetism conversion rate rose gradually. According to XRD analysis, the transformation from hematite to magnetite happened gradually, which could also provide magnetite crystal nuclei as the initial points for hematite reduction reactions. The initial points also promoted the hematite reduction reaction process. When the content of Fe in the original magnetite was 8.09% (sample D), the hematite transformation rate was quick, which caused a small quantity of hematite to become encased in the newly formed magnetite. Therefore, the magnetism conversion rate of sample D presented a slight decline compared with sample C. The magnetism conversion rate and the unit mass magnetic moment should be considered synthetically, and an appropriate magnetism conversion rate appeared at a content of Fe in original magnetite of 5.55%. Therefore, when some original magnetite existed in iron ore (mainly hematite), only the separation index could not be used to evaluate the effect of the magnetization roasting process. To determine the effect of the magnetization roasting process reasonably, the magnetism conversion rate should also be considered in the suitable magnetization roasting conditions.
3.5. The Interfacial Behavior of the Magnetite and Hematite Intergrowth
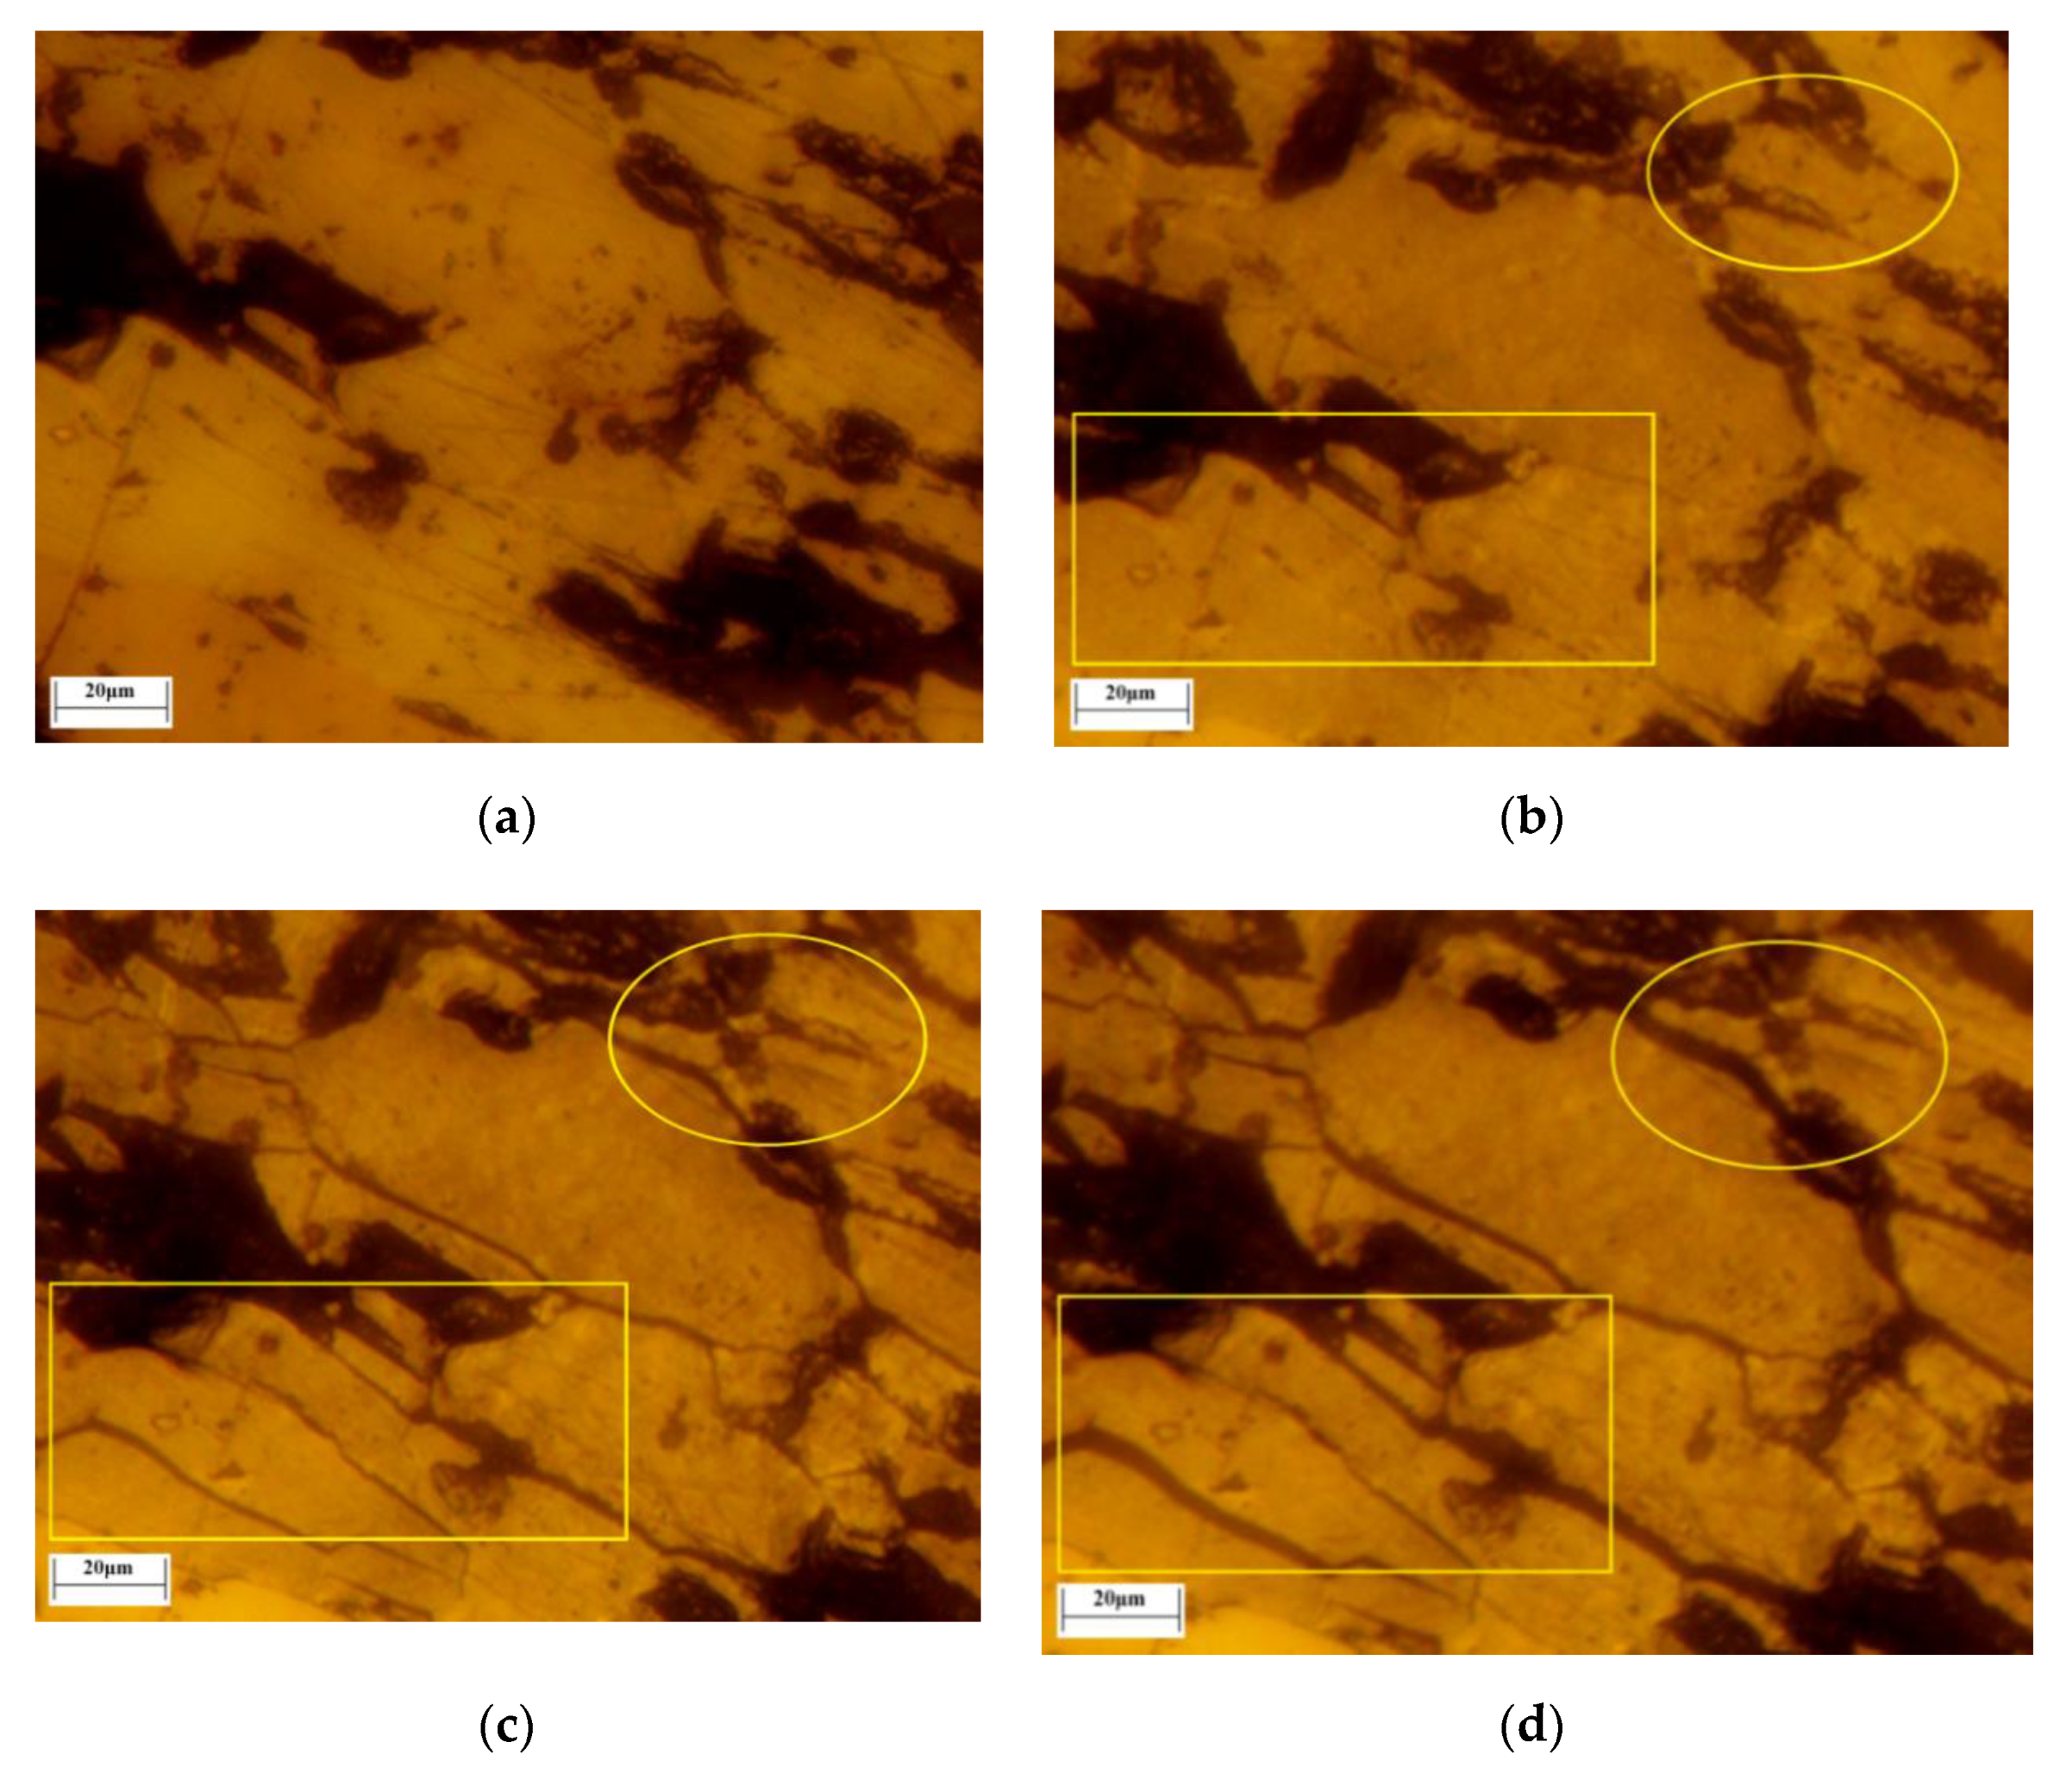
In this study, the transformation of hematite to magnetite and the microcrack evolution process were captured continuously and recorded in situ by LSCM with confocal technology and 3D morphologic technology for the first time. The pores and cracks of lump ore produced by roasting were identified by the color depth of images. The lump ore (5 mm × 5 mm) included two forms of single hematite and magnetite and hematite intergrowth. The transformation images of the magnetization roasting process of single hematite are shown in
Figure 15, which were obtained with a roasting temperature of 500 ℃, gas flow of 30 mL/min and CO ratio of 50%.
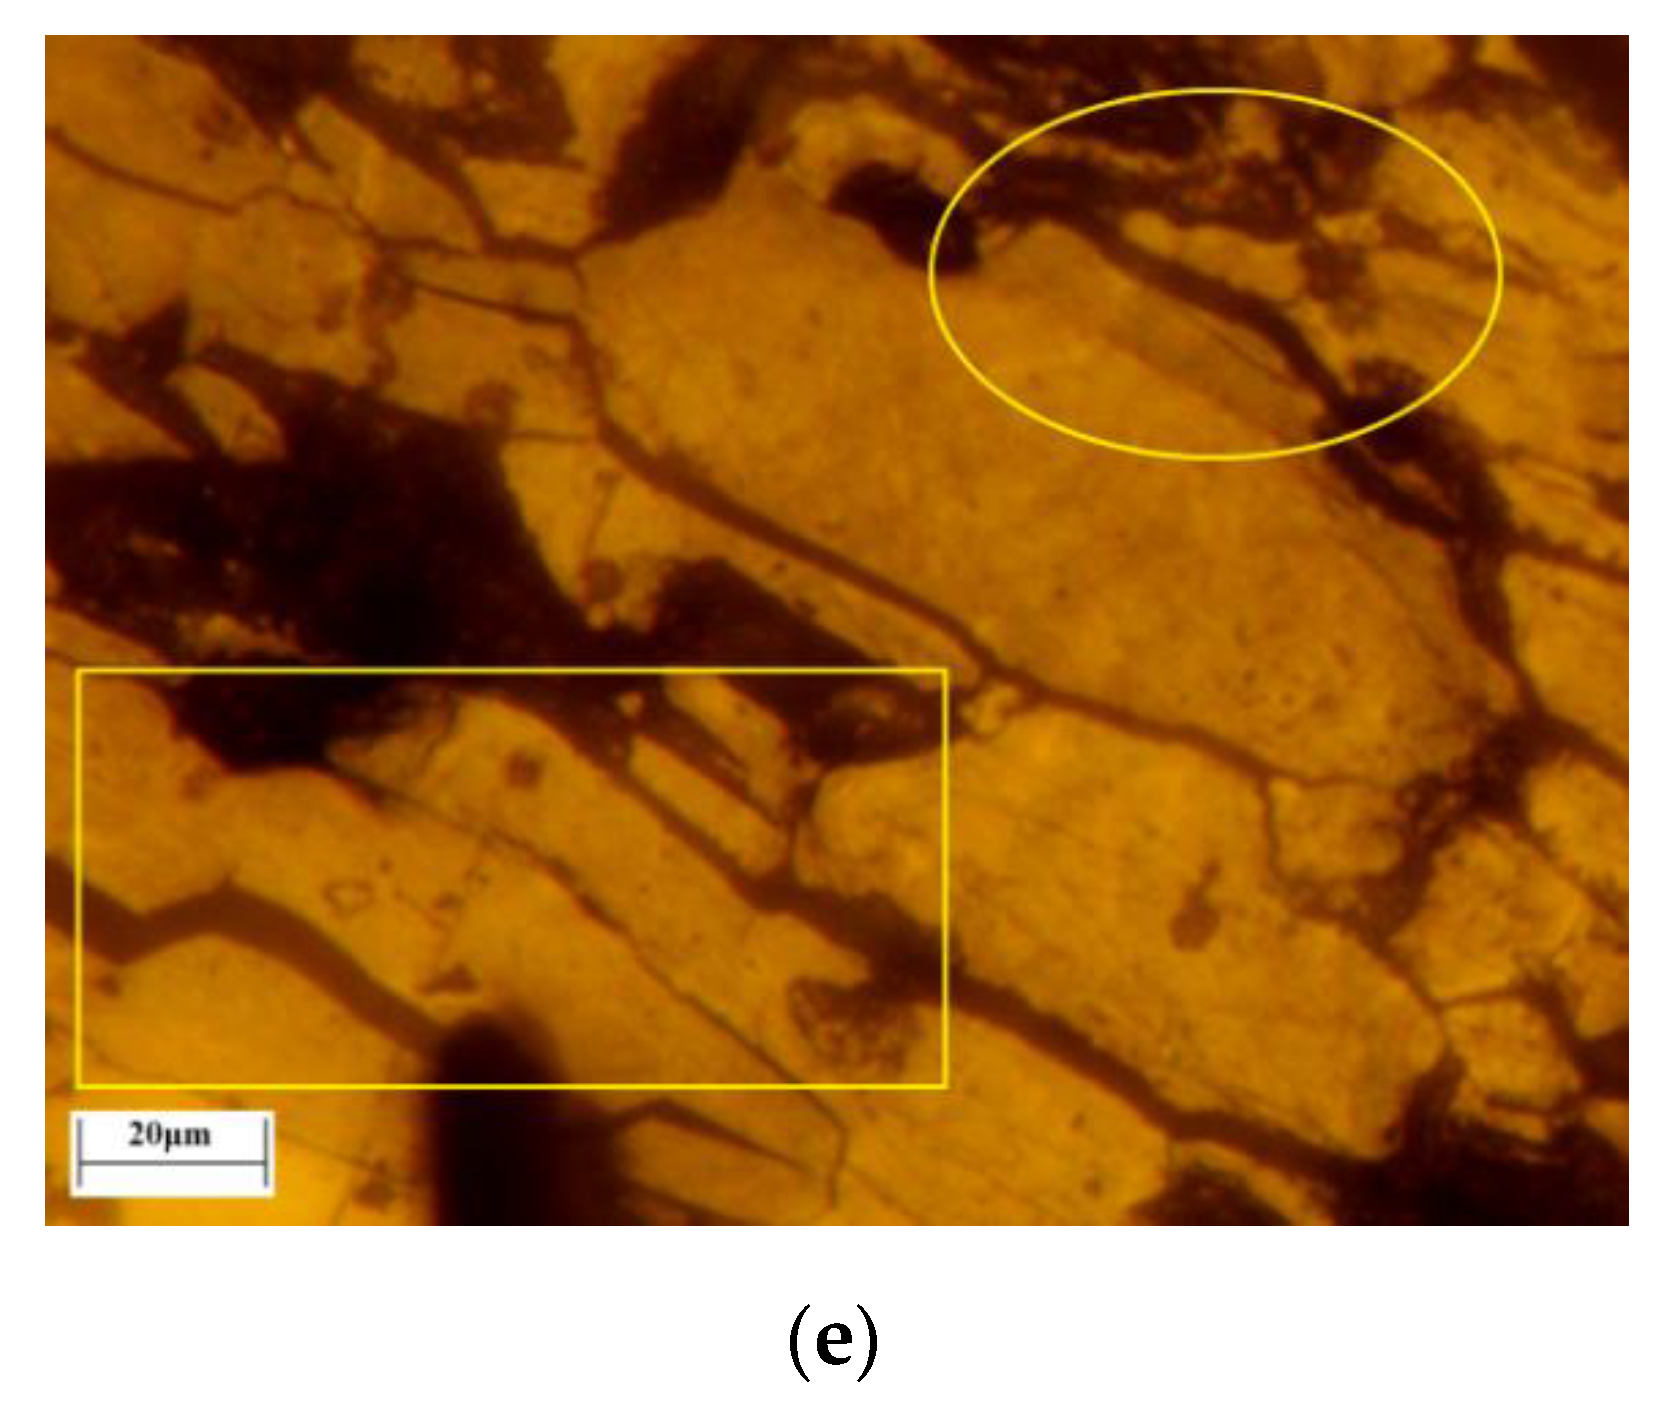
Before magnetization roasting, the surface of the lump ore was relatively flat, and a small number of pores existed. When the roasting temperature rose to 500 °C, the roasting process began with the injection of reductive gas. When the roasting time reached 64 s, the surface color of the lump ore with single hematite changed. The transformation of hematite to magnetite occurred, and some microcracks appeared in the lower left corner of the lump ore. The microcrack evolution process was present during the roasting time of 64 s to 326 s, as shown in
Figure 15b–e. The major microcracks were formed around existing pores by protogenesis or produced by roasting, and the microcrack evolution is labeled in
Figure 15. When the roasting time reached 206 s, new microcracks were extended further. The transformation of hematite to magnetite developed from the surface to inside the lump ore. When the roasting time reached 326 s, the microcracks were further extended to inside the lump ore.
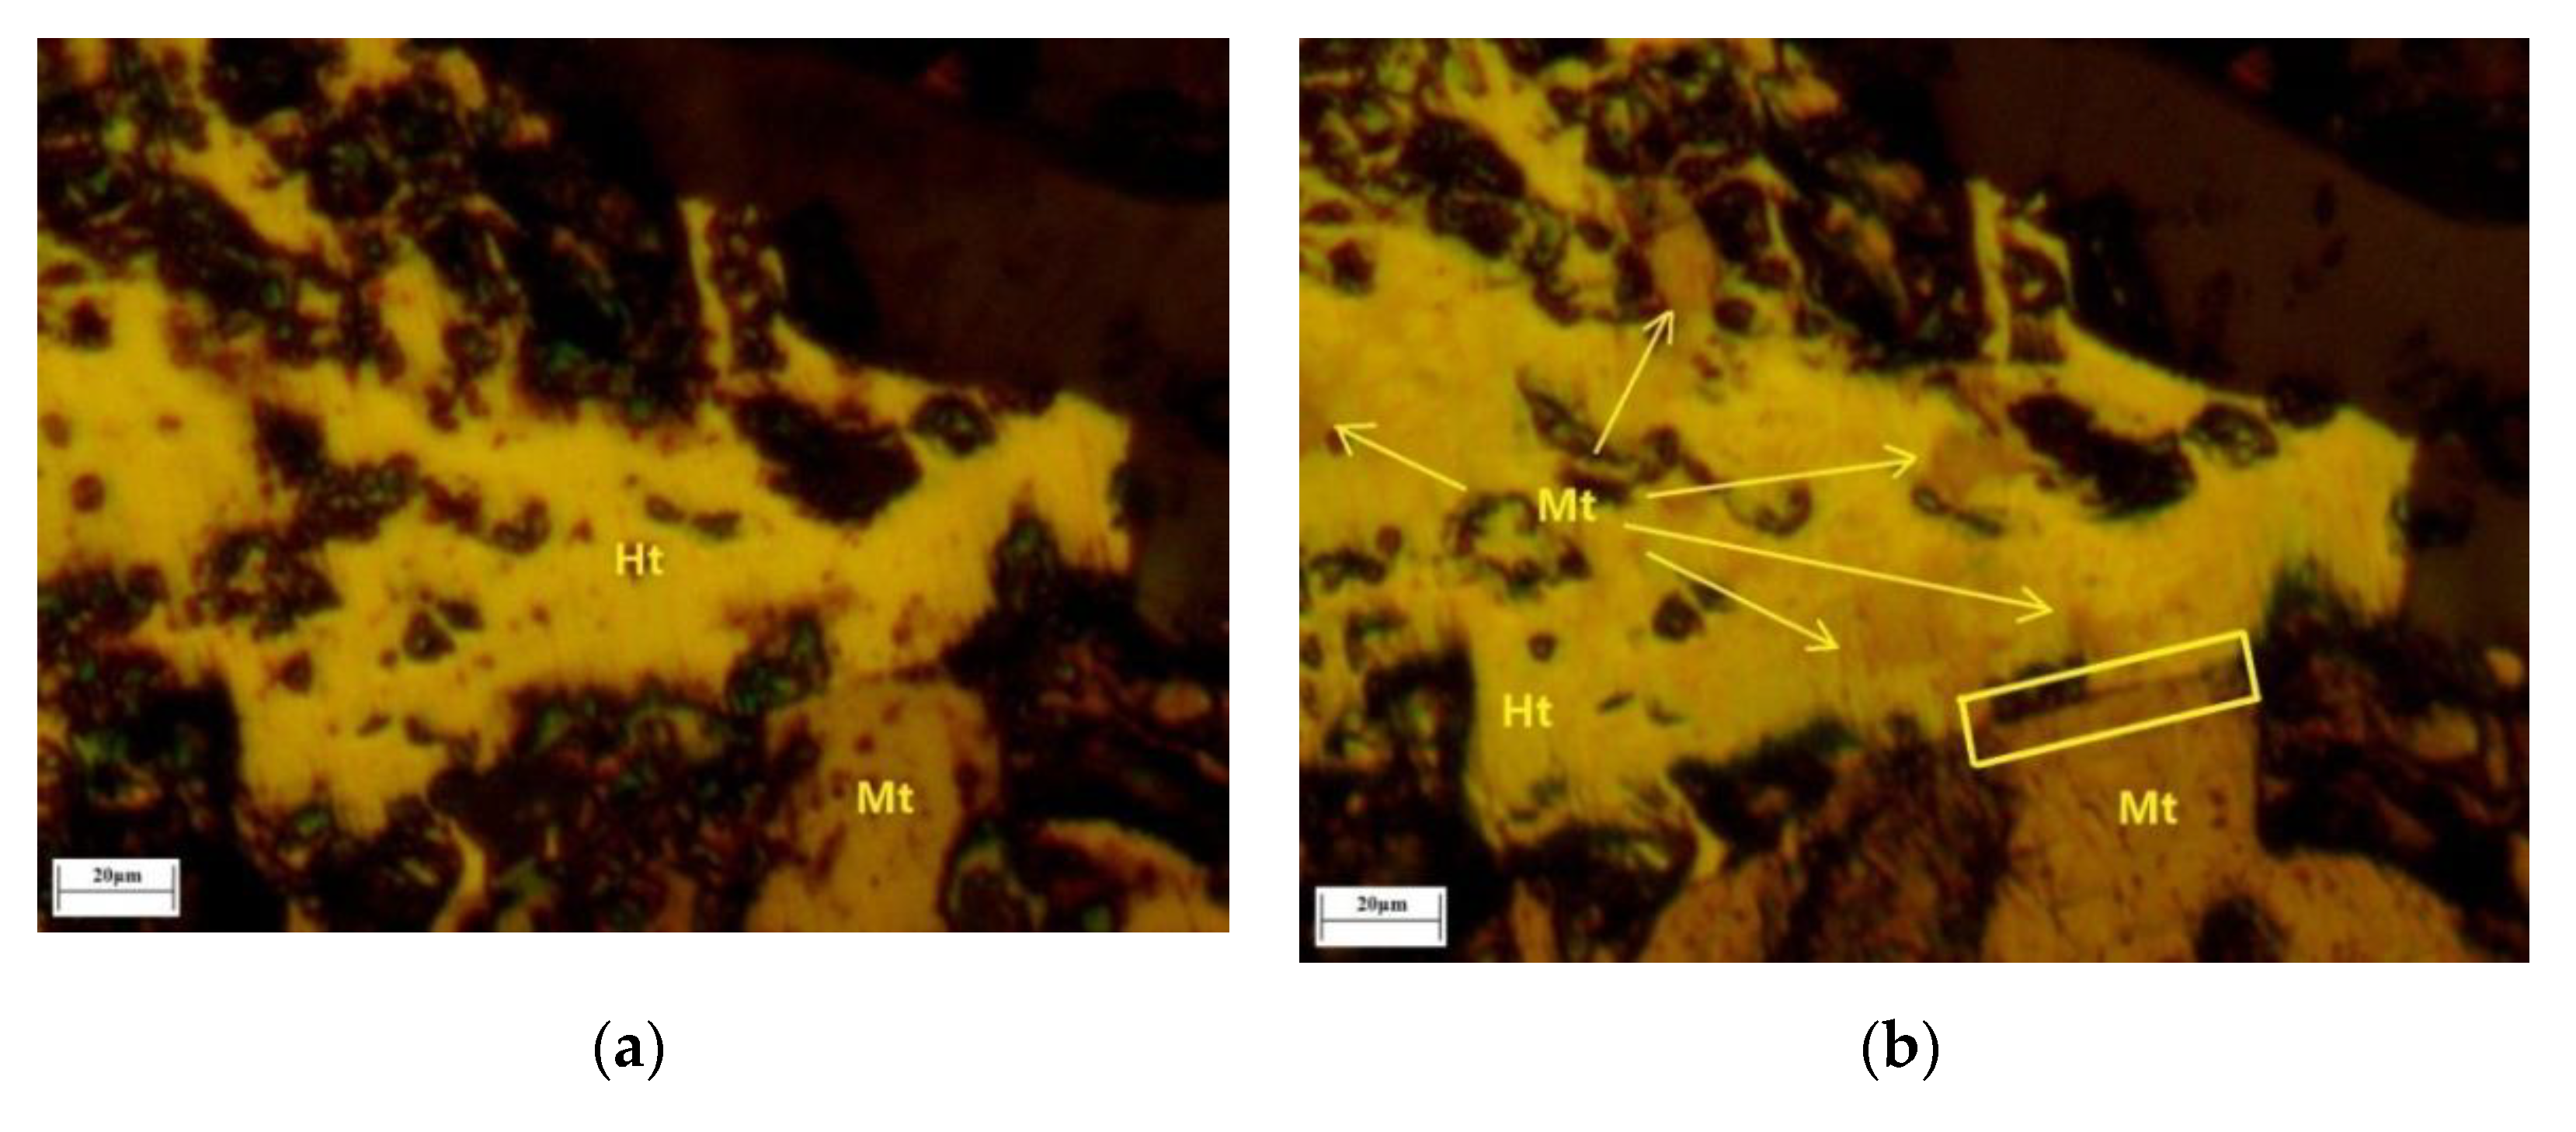
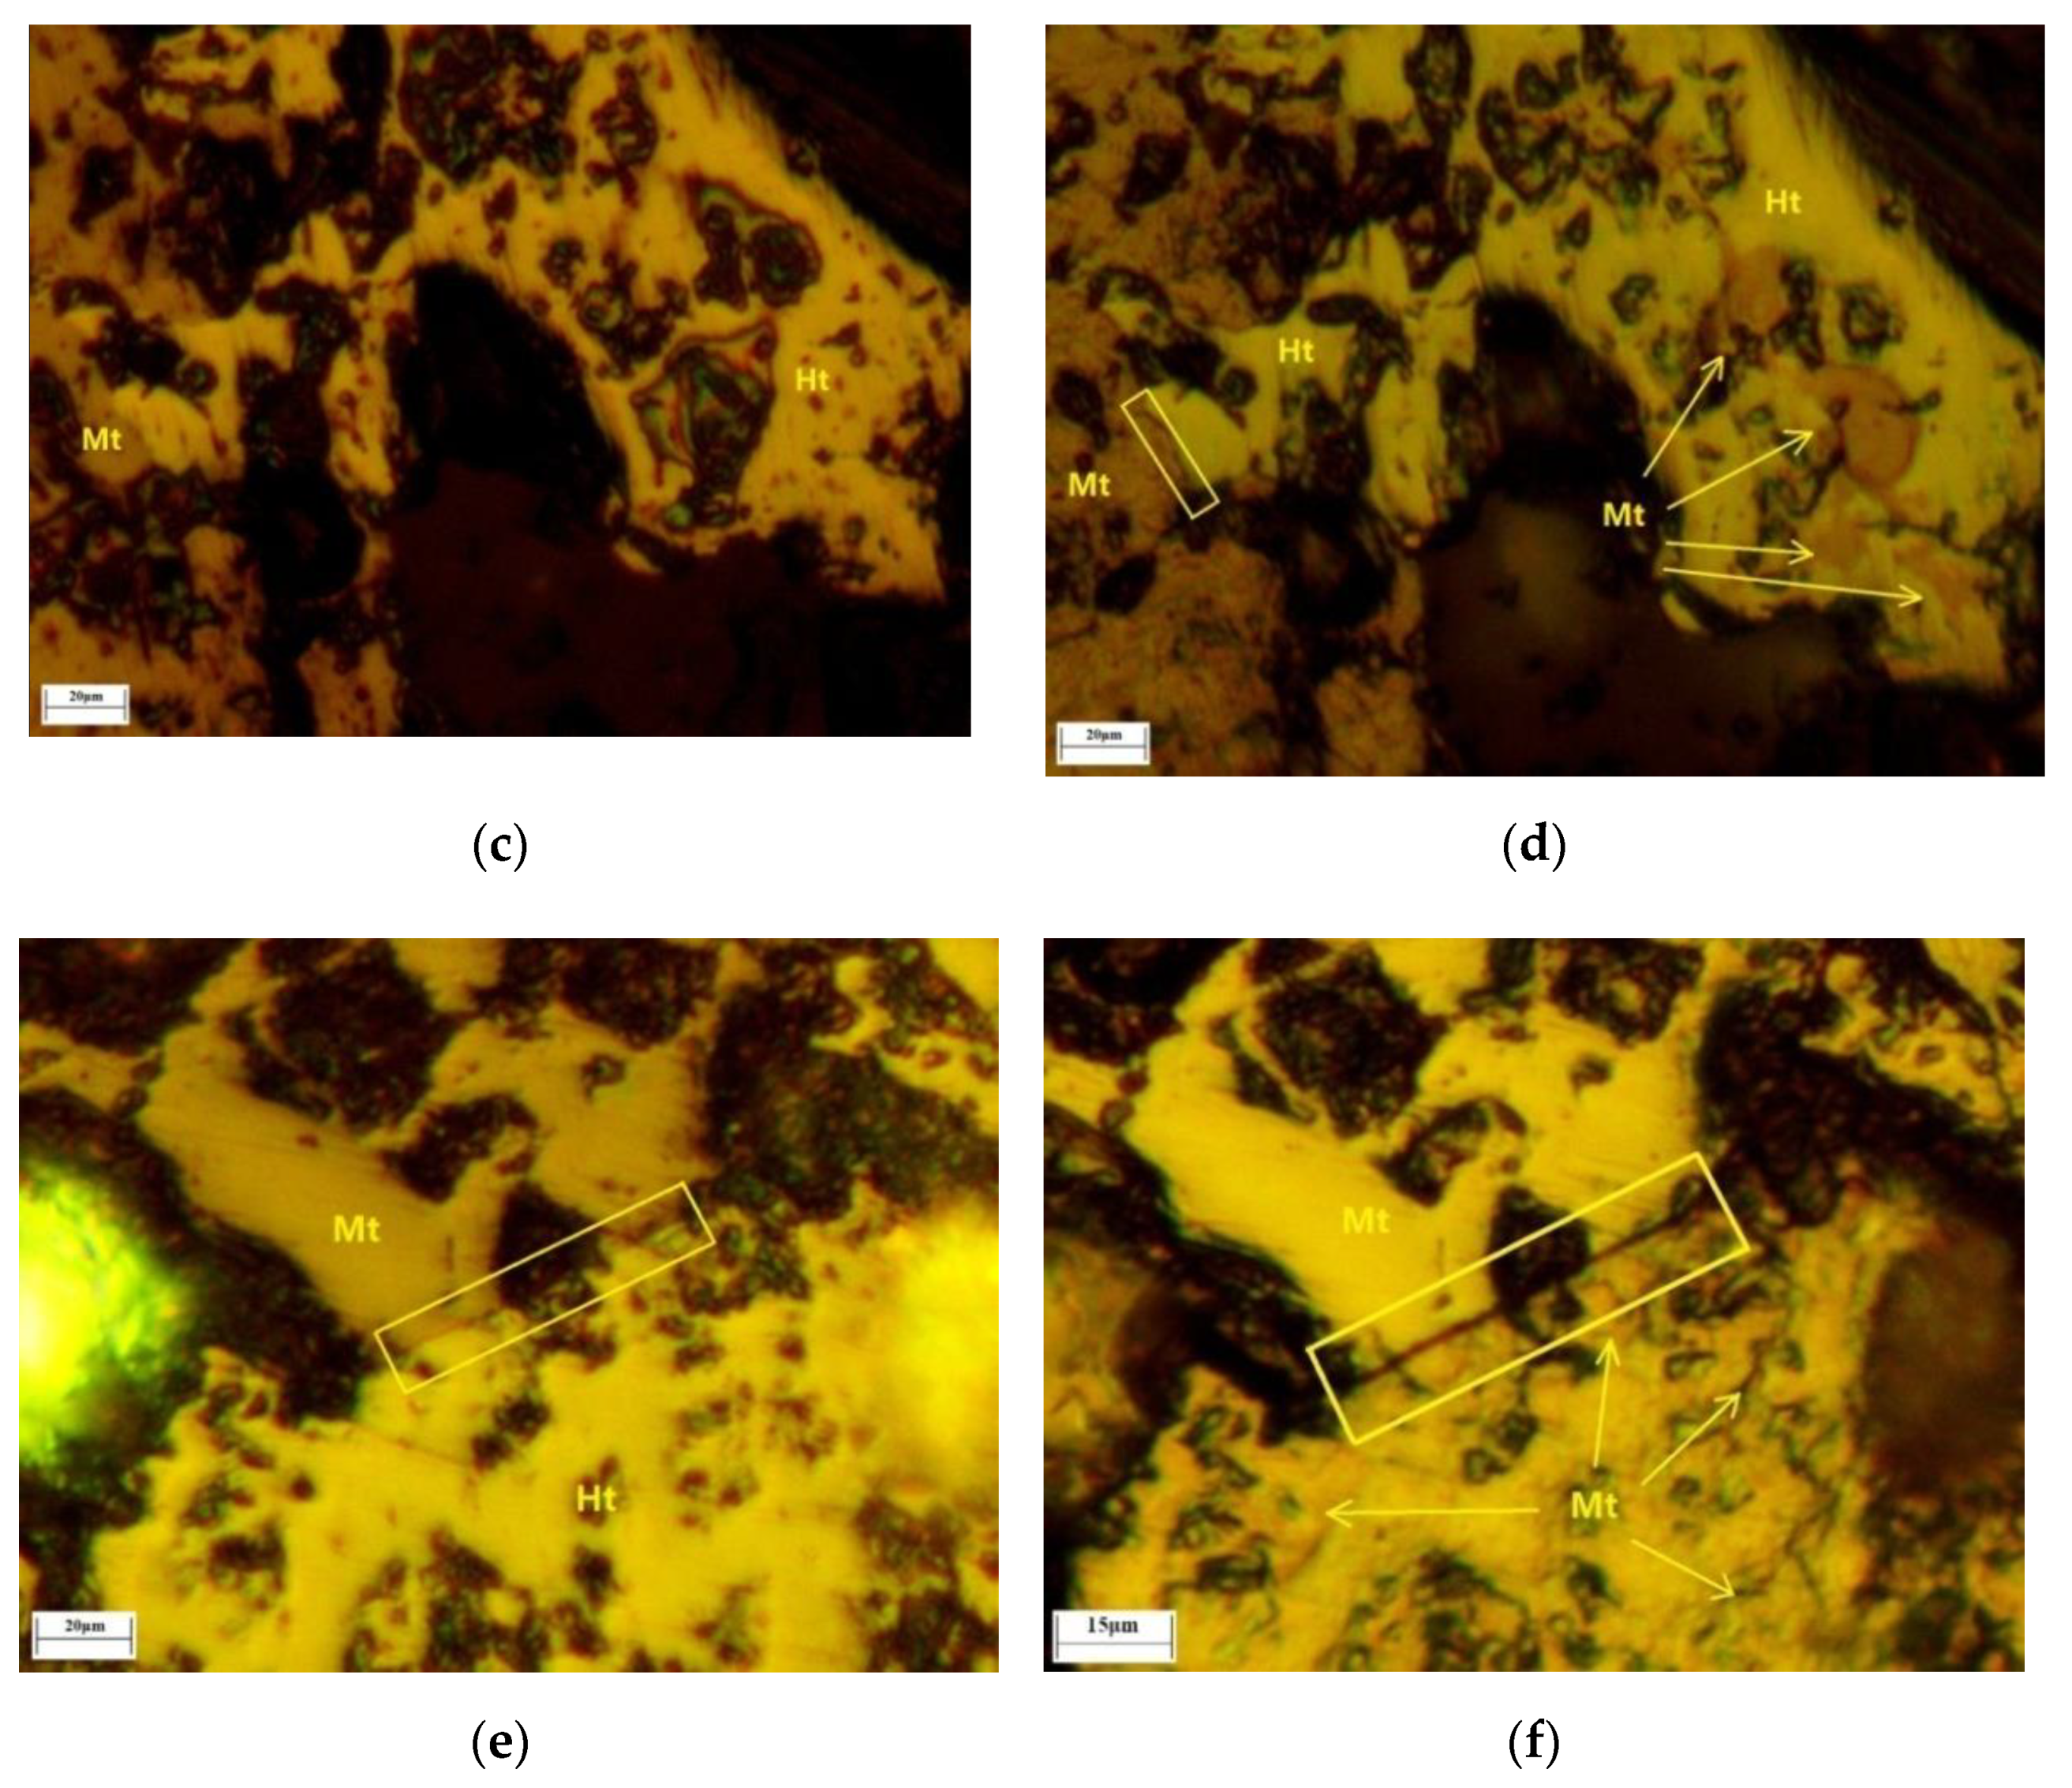
Firstly, after roasting, the phase transformation was distinguished by the color change of the lump ore surface according to the color contrast of
Figure 16a,c,e and
Figure 16b,d,f. As shown in
Figure 16b,d,f, the location of hematite transformation to magnetite mainly appeared at the naturally uneven areas and protogenetic pore edges. As the naturally uneven areas and protogenetic pore edges could meet reductive gas first, they had a greater probability to become the active sites of the original reduction reaction. Secondly, some of the microcrack evolution began from the edges of magnetite and hematite. From the beginning of mineralization, the tightness of magnetite and hematite was different compared to that of a single mineral. The slight microcracks also provided the original reduction reaction sites. Additionally, these microcracks evolved into the major microcracks gradually, which accelerated the reduction reaction further. This was the most important reason for original magnetite improving the iron ore reduction reaction, which was observed by in situ and continuous image capture and confocal technology and 3D morphologic technology images of magnetite and hematite intergrowth for the first time.
The schematic diagram of mechanism analysis is presented in
Figure 17. For single hematite, after cutting, the reduction reaction occurred at the surface layer of the lump ore. Then, the some microcracks evolved from the surface layer to the inside. For the magnetite and hematite intergrowth, some microcracks evolved from the surface layer and the edges of magnetite and hematite gradually, and further reduction reactions were produced inside the lump ore. Therefore, the microcrack evolution had a direct connection with the efficient improvement during the ore reduction process.

