Article

Reclaiming Open Coal Spoils by Mixed Woodland: Varteg (Wales), 10 Year Results

1
Department of Social Sciences, Oxford Brookes University, Oxford OX3 0BP, UK
2
Cradle for Nature (NGO), Witney OX29 8HT, UK
3
School of Architecture Built and Natural Environments, University of Wales Trinity St David, Swansea SA1 8AL, UK
4
Department of Geography, College of Arts & Sciences, University of Cincinnati, Cincinnati, OH 45221, USA
5
Faculty of Forestry, University of Forestry, Kliment Ohridski Street 10, 1756 Sofia, Bulgaria
6
Department of Hydrology, Czech Technical University in Prague, 16629 Prague, Czech Republic
7
Arctium Ltd., Haywards Heath RH16 1UA, UK
*
Author to whom correspondence should be addressed.
Minerals 2021, 11(6), 624; https://doi.org/10.3390/min11060624
Submission received: 7 May 2021 / Revised: 24 May 2021 / Accepted: 4 June 2021 / Published: 11 June 2021
(This article belongs to the Special Issue Biological Reclamation and Bio-Remediation of Former Mine Sites)

Abstract

:
Many reclaimed opencast coal-lands in Wales are now seriously degraded. This study explores the 10-year growth of native trees planted on compacted coal spoil. It compares the relative benefits of planting with spent mushroom compost (SMC) or well-rotted farmyard manure (FYM), both with and without supplementary fertilizer. Four main tree species—Common Alder, Oak, Scots Pine and Silver Birch—are considered. The survival of SMC-planted trees (77%) was significantly higher than for FYM-planted (72%). In Year 10, SMC-planted trees were significantly taller than those planted with FYM (4.75 vs. 4.57 m, respectively). Similarly, basal diameter (measured above the root collar) was larger among the SMC-planted trees. Discriminant analysis showed that the key discriminating variable between SMC-planted and FYM-planted trees was the type of fertilizer applied during planting. Adding slow-release fertilizer (SRF) and SRF plus superphosphate (SRF + P2O5) was beneficial to FYM-planted trees. Fertilizer supplements often favor the growth of FYM-planted trees in the early years, but later SMC-planted trees take the lead. The only species that benefited long term from FYM or fertilizer supplements was Alder. Overall, SMC-planted trees perform better than FYM-planted trees, but some of the difference can be mitigated by supplementary fertilization. Overall, SMC-planted trees perform better than FYM-planted trees.

1. Introduction

Reclamation of post-mining landscapes is a highly challenging task because there is no unique reclamation planning scheme for such landscapes [1]. Many former opencast coal-lands in Wales, while officially counted as “reclaimed”, are now seriously degraded [2,3,4,5]. Similar examples can be found globally because different approaches for the reclamation of opencast mine sites have been proposed and realized [1]. Unfortunately, because UK official statistics do not recognize “failed land reclamation” as an investment category, it is difficult to obtain official funding for remedial work, even in the vicinity of special sites such as Blaenavon’s UNESCO World Heritage Industrial Landscape [6,7]. However, communities have an incentive to rehabilitate their habitat and thus engage in activities such as planting local community woodlands [8].
This project aims to facilitate this process and to address a particular feature of community-based forestation, which is that, although tree-planting activities may be funded, this is rarely the case for long-term care and maintenance. Consequently, what may be done during planting is of particular importance. This study reports one set of ten-year results which concerns the relative benefits of two commonly used, low-cost, planting media, spent mushroom compost (SMC) and well-rotted farmyard manure (FYM), sourced from a local upland sheep farm. Adding compost to mine spoils is thought to improve soil aggregate stability, so reducing compaction and increasing soil permeability; it may help moderate pH, boost plant available nitrogen (N) and phosphorus (P) and also soil microbial populations so accelerating the reactivation of biogeochemical recycling, hence the growth of plants [9]. More generally, organic composts may serve four functions in the soil [8]. First, they add organic materials that contribute to soil structure and structural stability that feed the associated growth of soil organisms. Second, organic materials increase the water holding capacity of the soil. Third, they add soil nutrients and reduce the need for chemical supplements. Fourth, they inoculate the soil with mainly beneficial macro- and micro-organisms, although weeds, pests and pathogens may also be introduced. This research explores the interactions of two commonly used planting composts, SMC and FYM, with different initial applications of fertilizer and four native tree species. This report addresses the question: does the addition on planting of SMC or FYM affect, significantly, the long-term growth and survival of trees in a mixed planting of two-year whips grown from root trainer plugs?
This study extends previous experimentation on the same test site (Varteg), which also compared two types of planting media: SMC and composted municipal green waste (MGW) [10]. It also builds on results from studies that evaluated the effects of combining different initial fertilizer additives and SMC on the 10-year survival and growth of six tree species in a mixed planting, which is located nearby on the same former opencast coal-land at Varteg, SE Wales [11]. The article describes the 10-year results from six test plots planted a few tens of meters south of those described previously (Figure 1 and Figure 2). The main difference is that these plots are located, not on the upper convexity, but on the steep, up to 35-degree, main slope of the same opencast coal-mine spoil embankment. Thus, unlike the test plots described previously, which were situated on rain-fed water-shedding sites, these test plots also receive surface and near-surface runoff from upslope, with the possible addition of seepage from groundwater; there is a spring-line at the slope foot. Otherwise, the plantings are the same, using the same trench planting method and a similar mix of tree species. As before, they were planted as two-year whips from root trainer plugs [11,12].
Again, as before [11], the aim was to create a self-sustaining mixed woodland using native tree species. This planting employed a matrix of Alder, a relatively short-lived, nitrogen-fixing, “nursemaid” species, known for rapid initial growth [13]. Alder is tolerant of water-logged conditions and is commonly used in land reclamation contexts. These saplings were purchased as native “Common Alder” (Alnus glutinosa (L.) Gaertn) but proved to include some other Alder species, notably, A. incana.
Prior to industrialization, the site for this study was Upland Oak woodland. Hence, Oak has been inter-planted among the Alders as a legacy crop. Once again, although purchased as “Welsh (Durmast) Oak”, this proved to include a range of types on the spectrum between Welsh Oak and English Oak (Quercus petraea (Matt.) Liebl., Quercus robur L. and hybrids). The planting mix was supplemented with Scots Pine (Pinus sylvestris, L.), which has been shown to benefit from being interplanted with Alder on mine spoils [14], and Silver Birch (Betula pendula, Roth) [11]. All are UK native species that are both common in the local environment and recommended for land reclamation [15,16]. Among the attributes guiding species selection, Common Alder fixes N, grows rapidly and thrives in the wet conditions of the water-retaining planting trenches [11]; Silver Birch and Scots Pine are capable primary colonizers of poor quality, rocky, upland soils; and Oak is hardy and long lived but grows best in the shelter of other trees [17,18].

2. Materials and Methods

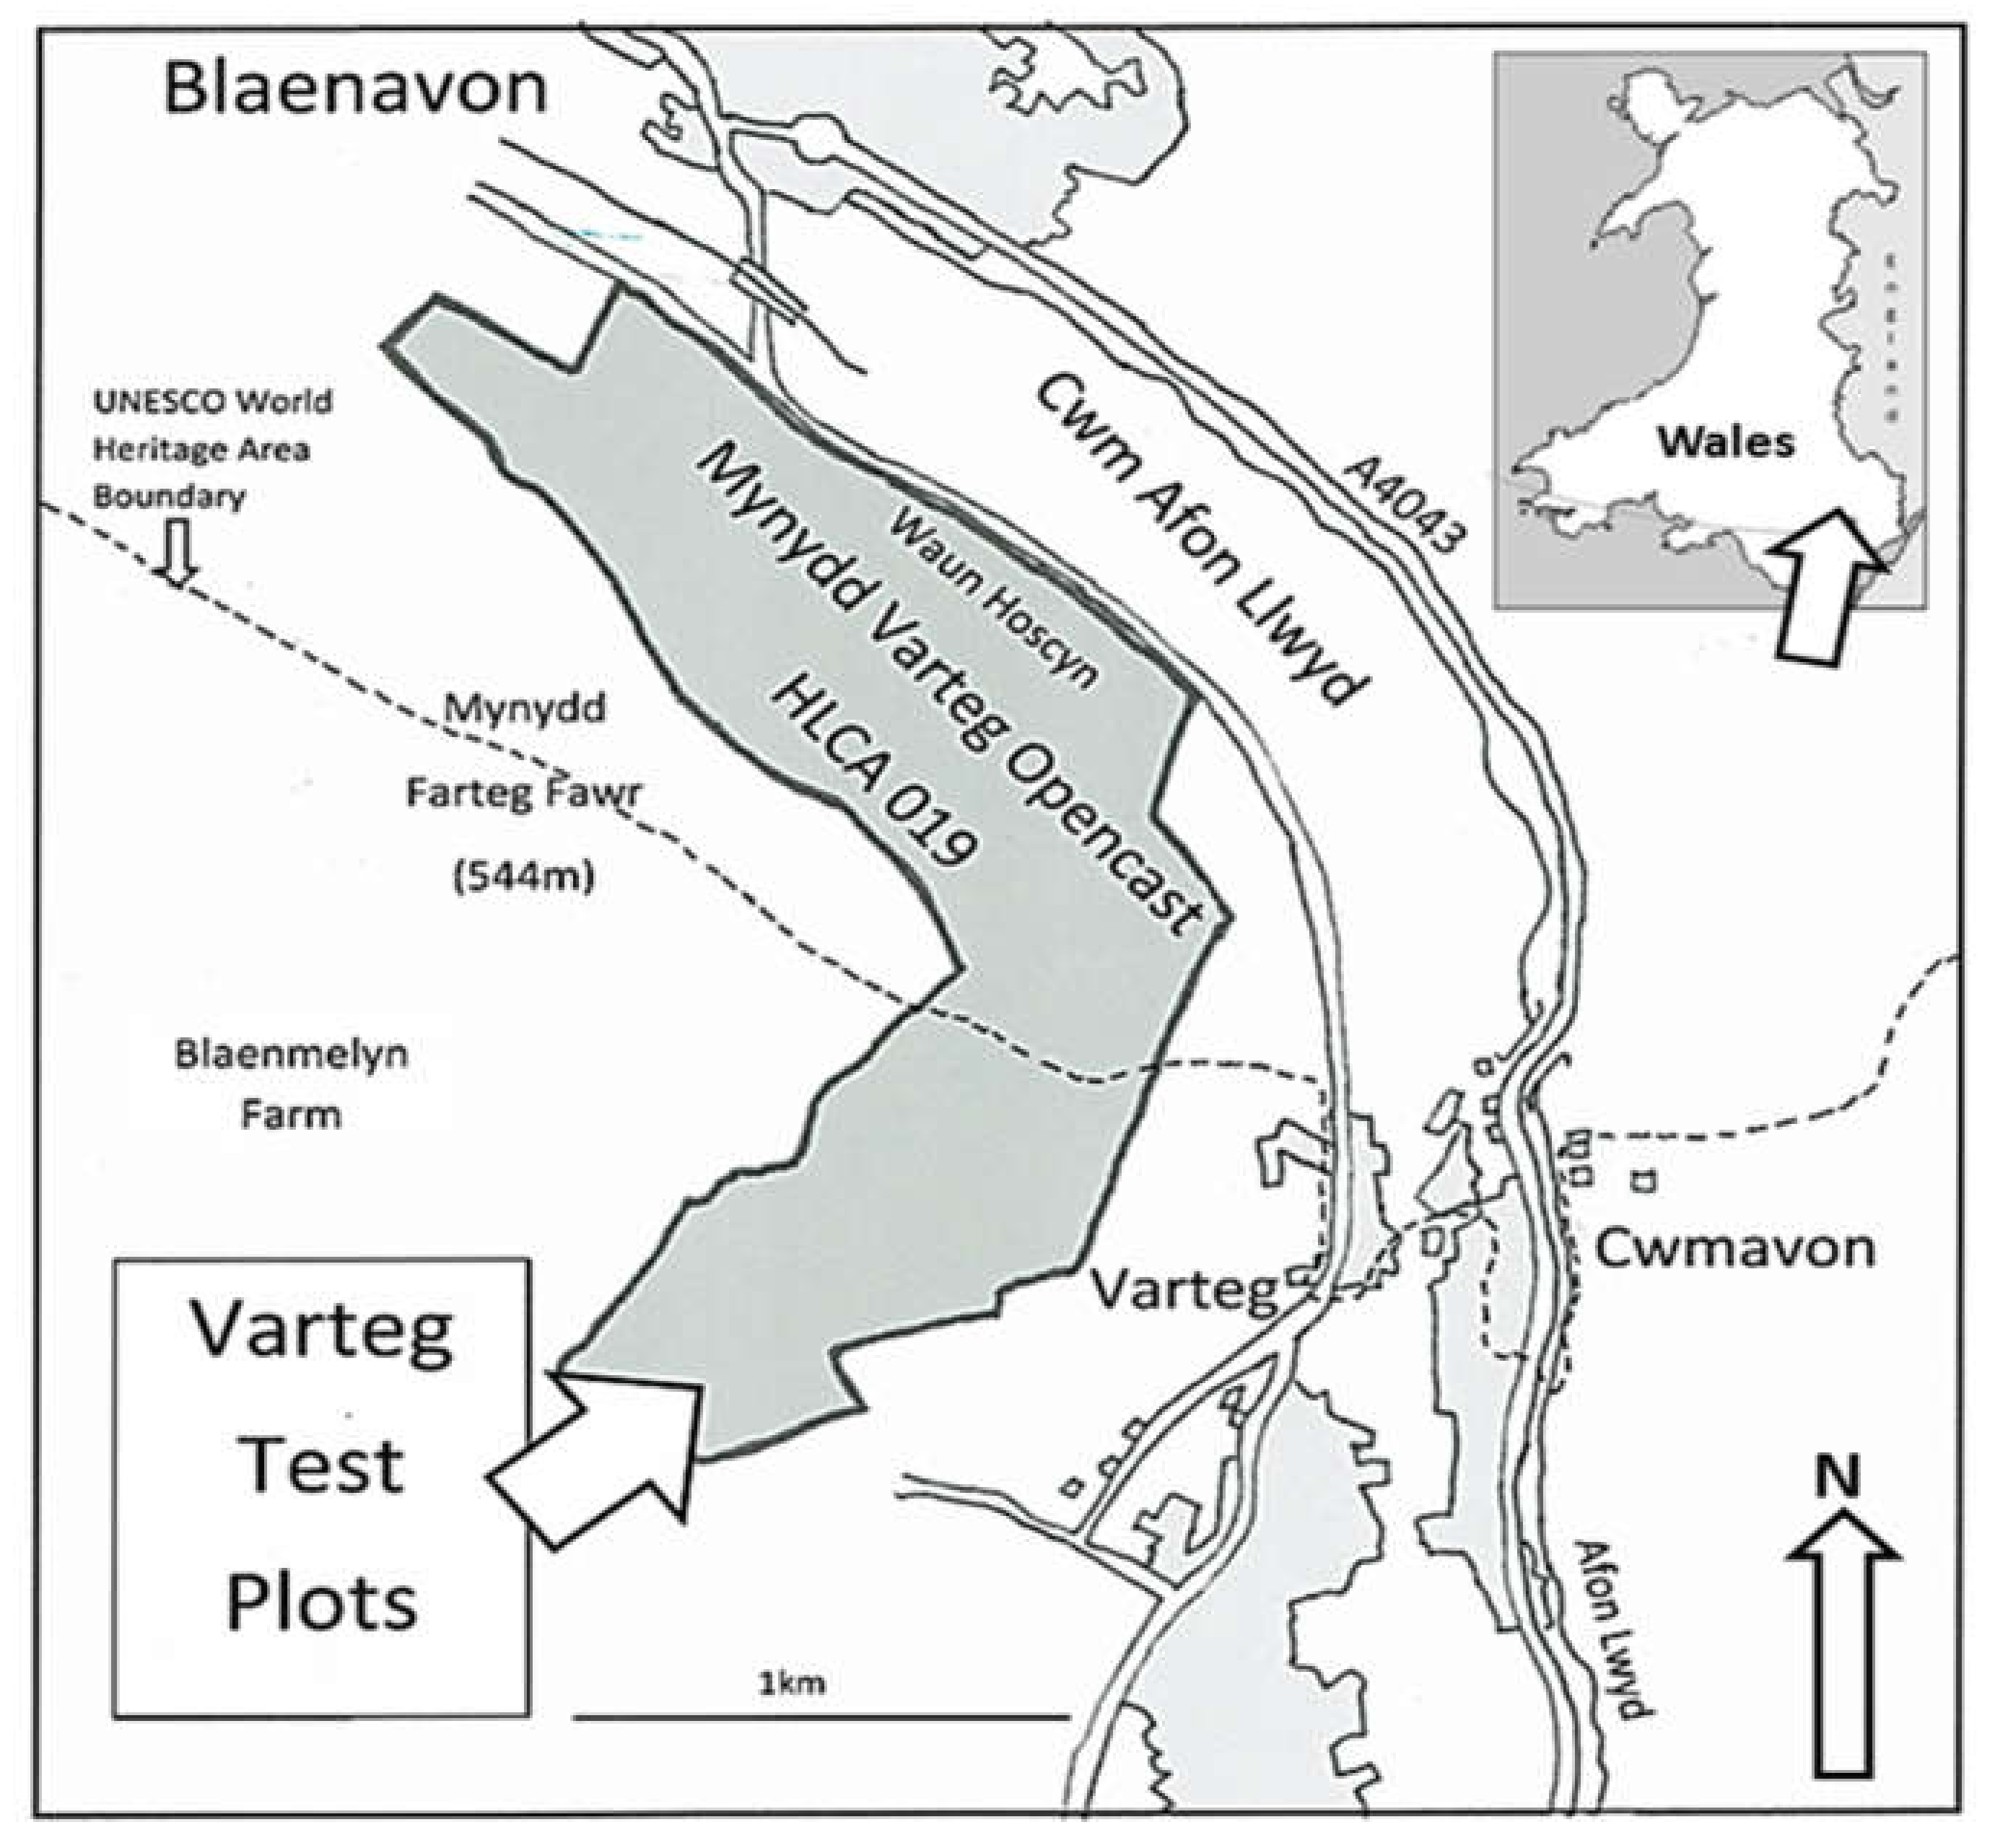
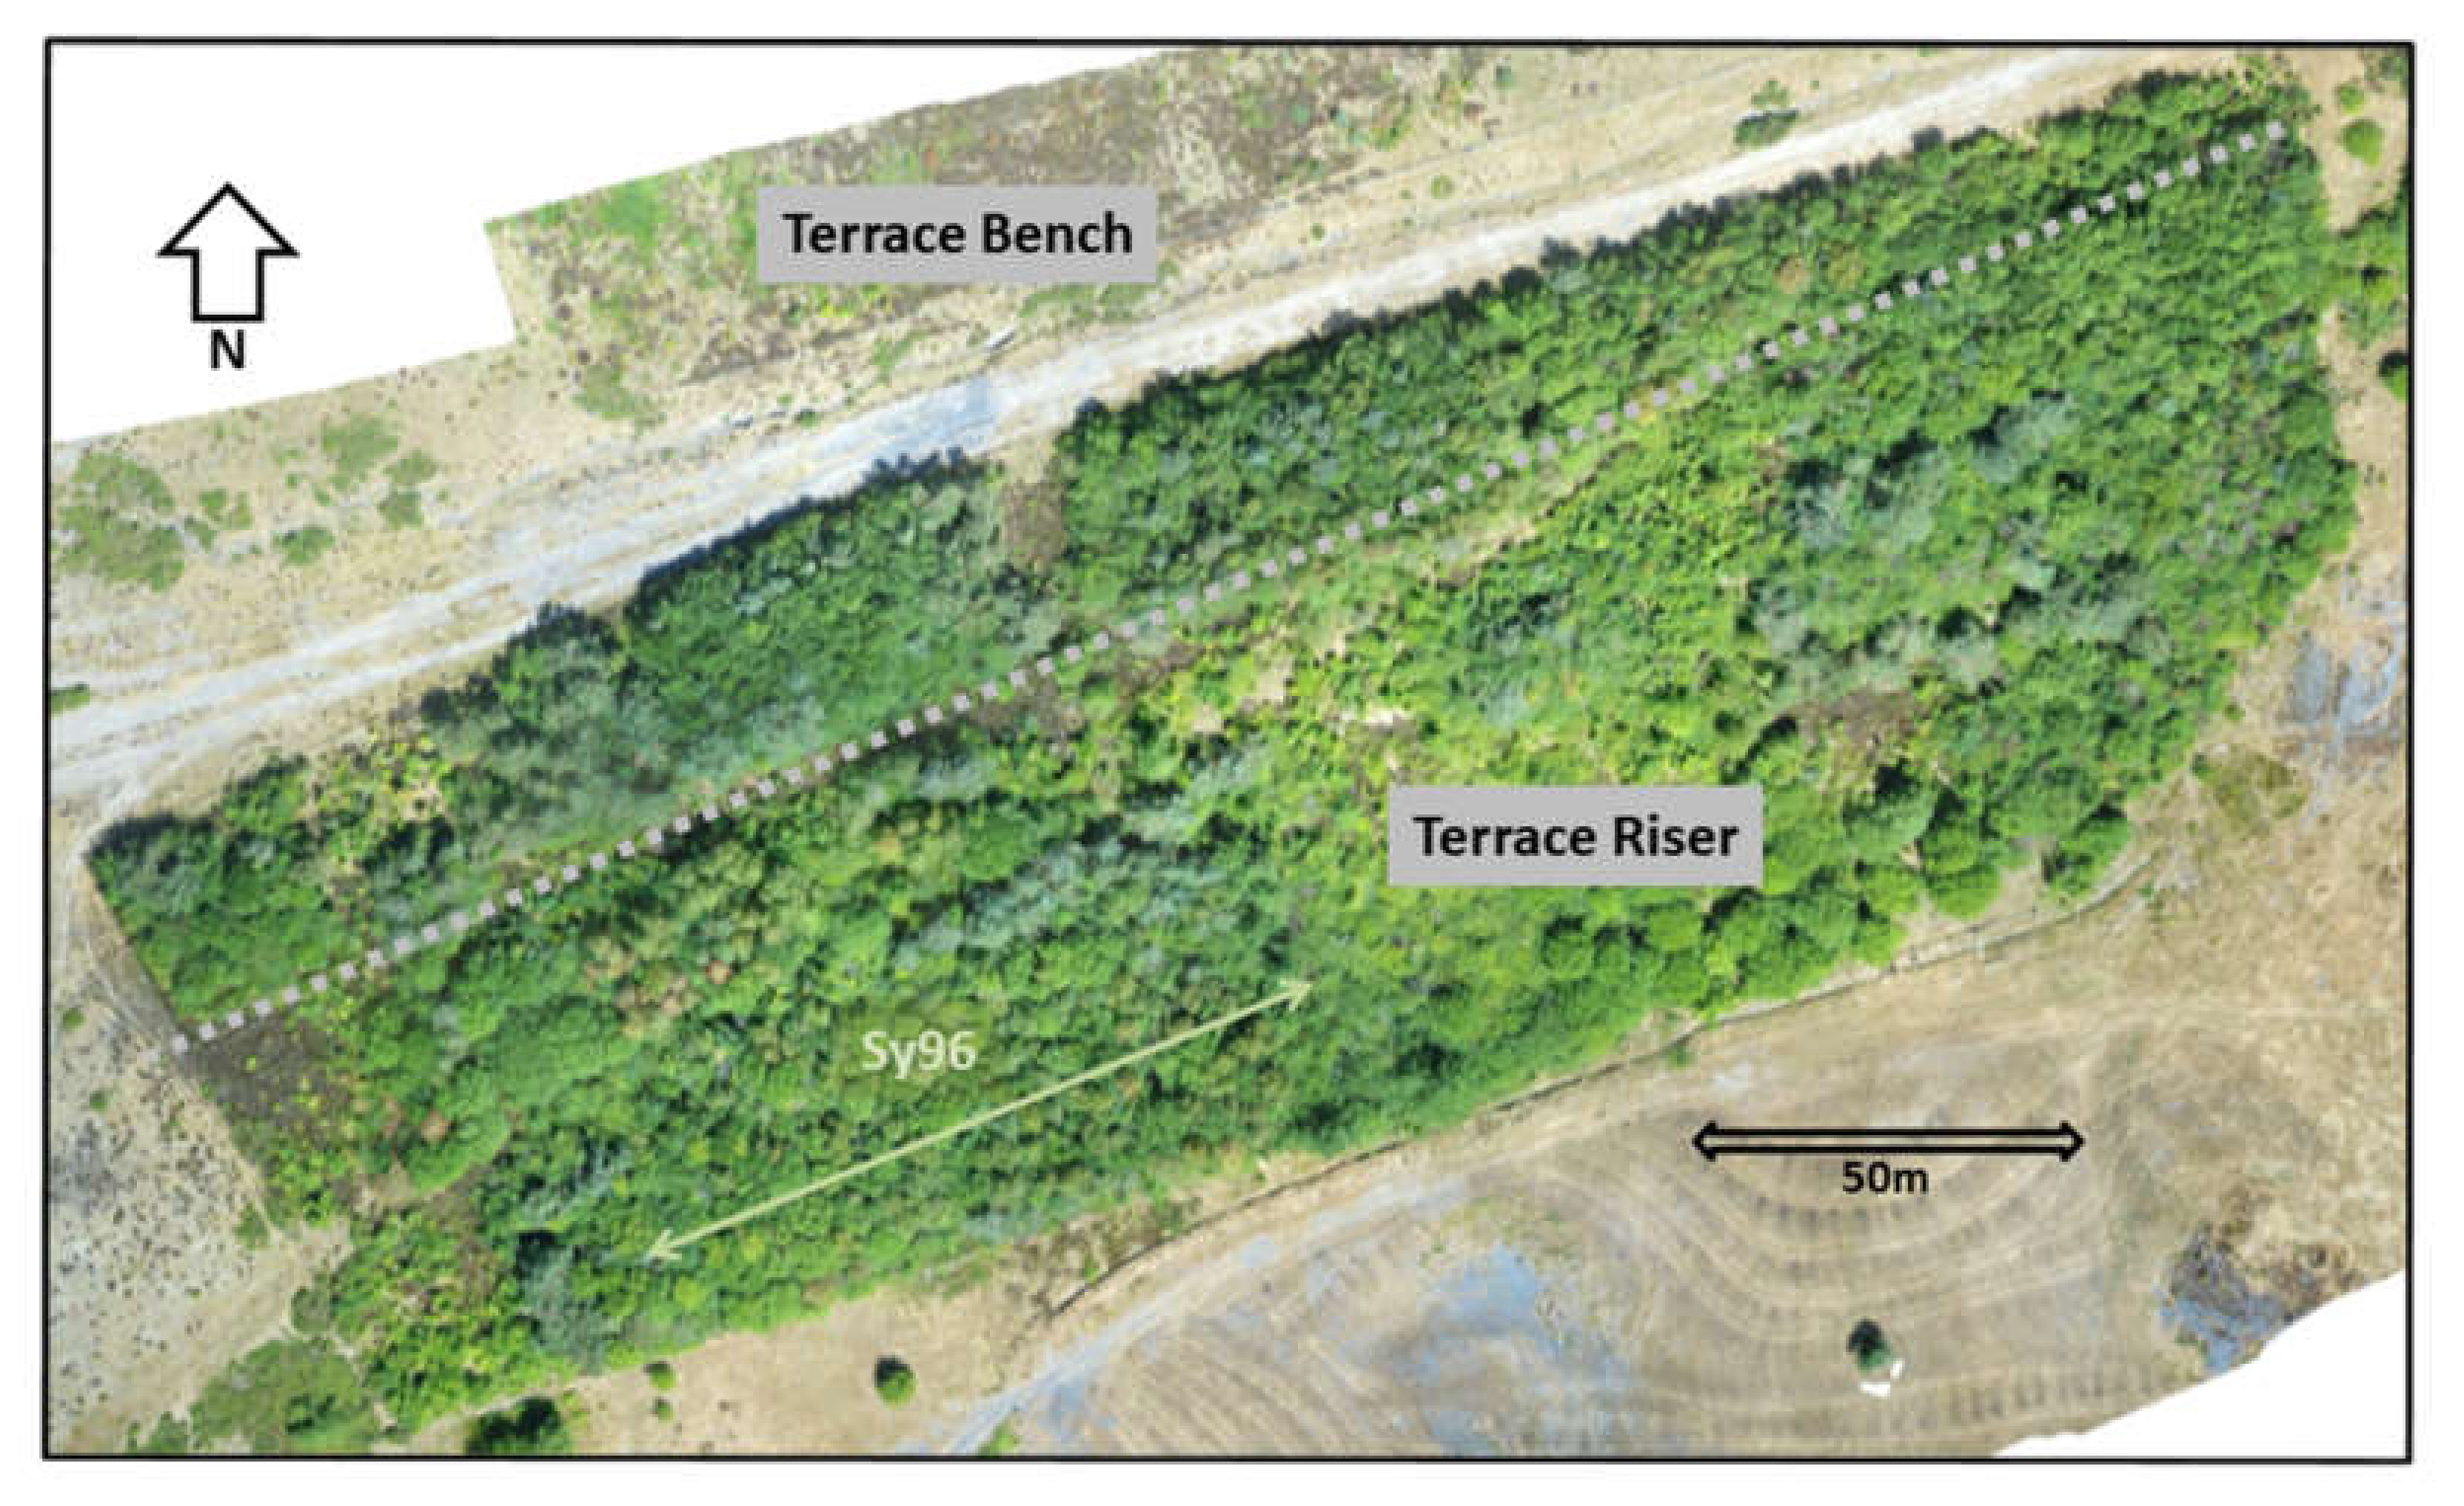
2.1. Test Site Description

These Varteg test plots, “Sy96”, lie between 354 and 383 m above mean sea level on the face of an embankment created from surface-mine overburden during the 1963 reclamation of the southern Varteg Hill Extension of the Mynydd Varteg Opencast Mine (51°44′40–43″ N 03°04′38–48″ W). At the slope foot, this opencast waste overlies pre-existing deep-mine coal spoils and former pasture. The site forms part of a south-east-facing slope above Cwm-ffrwyd on the western flank of Cwm Afon Llwyd, Torfaen, SE Wales (Figure 1 and Figure 2). It lies close to the southern edge of the “UNESCO Blaenavon Industrial Landscape World Heritage area” and within “HLCA 019 Mynydd Varteg Opencast” in the larger “Blaenavon Landscape of Outstanding Historic Interest” (Figure 1) [19].
At Varteg, rainfall is around 1543 mm·yr−1, and mean monthly air temperatures range from 2.5 to 15 °C [20]. Evaporation, approximately 472 mm·yr−1, occurs over rough grazing land. Natural soils remain at field capacity for 285–325 days each year but, commonly, there is a severe summer soil moisture deficit, which is much longer on the former opencast site where soil water-holding capacities are very low due to soil compaction [21].
Before planting, the area was unfenced grazed grassland, with many lichens and bryophytes, and conformed to National Vegetation Classification Category U4: Grassland (Festuca ovina, L., Agrostis capillaris, L., Galium saxatile, L.) [22]. During reclamation and circa 1963, the terrace riser suffered gully erosion, which carved shallow channels that became armored with sandstone and ironstone cobbles and, later, over-grown by grass. These persist as soil pipes and percolines within the terrace riser slope and, locally, affect tree growth. Elsewhere on older sections of the former Waun Hoscyn-Mynydd Varteg opencast site, these soil pipes have expanded and, causing overlying turf to collapse into the void, become exposed as new surface gully channels [23].
Prior to forestation, the soil was a thin (5–8 cm) organic (1.5–4.1% Total carbon (C)) layer of moderate pH (5.7) overlying severely compacted (1.6–1.8 g cm3), impermeable, weathered mine spoils with abundant cobbles of sandstone and coal shale below. At 50–70 cm depth, this gives way to unweathered, clay-veneered, mine-stone cobbles with bridged voids [24,25].
Table 1 displays the changes in soil chemistry before and after forestation. The increased biomass of the trees has drawn down levels of soil nitrate, total sulfur (S), and soil organic carbon. However, there is an increase in sulfate S, perhaps due to microbial action in the main rhizosphere, and P, perhaps also iron (Fe), at the soil surface, which may be linked to decreased grass cover or tree leaf fall. Nutrient levels remain near or below minimum soil fertility target values.

2.2. Test Site Preparation

A previous report from the Varteg compared the effects on tree growth and survival of using slow-release fertilizer (SRF) tablets at different doses with that of using no fertilizer [11]. However, all of these trees were planted using approximately 1 kg per stem of SMC as a planting medium. Later research has shown that using a planting medium based on composted MGW (domestic and garden) affected long-term survival rates but not tree growth nor metal loadings in leaves and soils [10,27]. This study compares the effect of using two different initial planting media on tree survival and growth in the first decade after planting; it compares the effects of planting with ca. 1 kg of SMC and planting with ca. 1 kg of a locally sourced compost of well-rotted FYM.
As before [11], these Sy96 test plantings were set into parallel contour trenches, >0.5 m wide by >0.5 m deep, that were back filled with the inverted soil profile. Trench planting had proved more effective for tree growth than other methods trialed on site, at least during the first decade after planting [12]. The approach fosters better root penetration, aeration, drainage, and soil water storage [25]. A high planting density of 10,000 stems per hectare was employed to stimulate rapid canopy closure. This was achieved by Year 5.
Unlike the terrace crest and terrace bench plots studied by this team [11,12,25], the Sy96 test plots are relatively sheltered from the persistent westerly and south-westerly winds experienced on the exposed upper surfaces of this mine terrace. Further, these mid-slope plots receive moisture from upslope both as surface or near-surface runoff and as through-flow from fissures in the compacted minespoils. When the slope was cut into during the creation of the Sy96 test plots, the trenches overflowed with bright red, ferruginous waters. Presumably, these waters had been trapped in an aquifer perched above the older land surface that lies beneath the tipped opencast spoils. After the first flush, this water began to run clear. Cwm Afon Llwyd has a long history of similar ferruginous mine drainage events and red springs are not uncommon locally [28]. In the years immediately after planting, the planting trenches became choked with Juncus sp. reeds but, later, as the trees grew larger, they dried out and the reeds disappeared. After a decade, the outflow had resolved into a small number of slope-foot seeps. It is likely that these early additional inputs of water fostered tree survival, especially amongst Alders and possibly also subsequent growth, especially on the lower slope.
The Sy96 trees were planted out as six mixed species blocks of around 400 trees each. ln three test plots, SMC was used as the planting medium and, in another three, FYM. Additionally, each test plot was given one of three paired fertilizer treatments [10]. The first, control planting, used no fertilizer, just the SMC or FYM planting medium. The second pair received on planting an application of slow-release fertilizer (SRF), which provides NPK 15:9:9 + 3MgO as two-year slow-release tablets (30 g per stem), as recommended by the manufacturer [11]. The third planting treatment, which differs from that used by Haigh et al. [11], received the same dose of SRF supplemented with superphosphate (P2O5), applied at a rate of 7.5 g per stem.

2.3. Planting Compost: SMC (Spent Mushroom Compost) and FYM (Well-Rotted Sheep Farmyard Manure Compost)

Table 2 describes the chemical properties of the SMC and FYM used in the Varteg planting.
Initially, it was considered that the choice of planting medium, the <1 kg handful of organic matter, added to each stem during planting would not have any great influence on tree survival or growth. Later work, which compared SMC and composted municipal green waste, showed that this was a real possibility [10]. Across the Varteg site, most test plots, including most of those discussed previously [11,12,29], were planted out with SMC that was provided by the Garden Festival of Wales (Ebbw Vale’s land reclamation team) [30]. The FYM was supplied by an upland sheep farm in the local area.
The UK’s SMC is a waste product of mushroom cultivation, which mainly involves Agaricus bisporus. Approximately 5 kg of SMC is produced for every 1 kg of mushrooms, which implies an annual production of about 500,000 t. Of this, about 68% is used in agriculture or landscaping, 21% is spread as a soil improver, 11% is sold through garden stores and a small amount goes to landfill [31]. SMC is used to encourage plant growth on soils that are low in organic matter and that tend to acidity; the UK’s SMC has a neutral pH: 6.5–7.0. SMC is reputed to improve soil moisture availability and soil structure, and benefit root development. In a nutrient-deficient soil, it adds significant amounts of N 1.3–4.2%, perhaps a third as nitrate, P (0.1–0.4%), potassium (K) (0.5–1.8%) and magnesium (Mg) (0.2–0.4%). SMC also adds a range of trace elements [32].
In Ireland, the loading of K and P was found to vary considerably in different batches of SMC [33] whereas the benefits of SMC’s useful amount of Mg can be mitigated by high levels of manganese (Mn) and, here, Varteg’s mine spoils already contain >1500 mg Mn kg−1 (1.5%) [34]. In Ireland, SMC application to 1 m2 plots of grass significantly increased plant available soil P, K and Mg, especially at higher application rates, whereas greenhouse pot studies found that it also increased soil exchangeable potassium (EC), pH and bioproductivity [35,36]. However, the benefits of raised EC and pH from SMC application can be reduced quickly by leaching; SMC may not greatly benefit the growth of Quercus sp. [37]. SMC is recommended for poor soils and considered more effective than some artificial fertilizers because of its C:N ratio (<20:1). This is caused by the fungal decomposition of its original cellulose and lignin and helps combat soil nitrogen deficiency [38].
SMC is created from the composted and sterilized post-production remains of mushroom mycelia, wheat straw, poultry manure and calcareous materials from the bed on which the mushrooms are grown [39]. Consequently, its organic matter content is high, usually circa 66%. Ideally, processing ensures that SMC is free of weed seeds, pests and pathogens and also reduces ammonia (NH3) to levels ~2500 mg·kg−1. Potentially, SMC may contain antibiotic contaminants from UK mushroom production including Prochloraz (Sporgon 50 WP) and Carbendazim (Bavistin) [40]. Typically, SMC is linked to increases in the richness of soil bacteria and fungi [39], but it is also used in the remediation of contamination by antibiotics and metals [36,41,42]. Agaricus bisporus SMC substrates often contain enzymes that have beneficial effects on zinc (Zn) toxicity, the degradation of chlorophenols, polycyclic aromatic hydrocarbons (PaHs) and aromatic monomers, the inhibition of nitrification and the treatment of hazardous wastes. Hence, SMC is widely used in the remediation of soils contaminated by mining [43].
Today there is significant emphasis on organic farming and the recycling of waste, such as municipal green waste, whose use as a planting medium was explored elsewhere on the Varteg site [10], or, more dangerously, sewage sludge, as used locally on the land of the former Maes Gwyn open-cast mine [44,45]. Around 5% of the UK’s sewage sludge is used in land reclamation, which, even when processed thermally to eliminate organic contaminants, may be loaded with metals [46,47]. The disposal of farm yard manure (FYM) is another waste management issue which, while not without its problems, is more acceptable in community contexts. Here, three test plots were planted with ca. 1kg per stem of well-rotted FYM. This FYM contained approximately 25% dry matter with useful amounts of N, P and Mg (Table 3). Table 3 also shows the contribution per stem of the supplementary SRF and SRF plus extra P2O5 treatments. Table 3 confirms that, in the case of total N, K and Mg, FYM compost adds as much or more nutrition to the soil as SRF, although not necessarily in plant available form. It also shows that this FYM is much richer in its nutrient composition than SMC, the exception being plant-available K.
Nevertheless, there are problems associated with the use of FYM. If not sufficiently well rotted, it can cause the depletion of N in the soil. It can also introduce weeds, pests and diseases and, sometimes, antibiotic resistant microorganisms. However, the use of traditional FYM is not regulated in the UK and the Royal Horticultural Society recommends an annual application of 5.4 kg/m2 for domestic gardens. Advantages are that FYM increases soil fertility, especially N, attracts and possibly introduces earthworms, and adds humus [48].
In the mining areas of southern Tunisia, sheep FYM helped increased the phyto-stabilization of metals through adsorption, chelation and by complexing with soil organic matter but did not affect plant growth. [48]. In Hungary, sheep-based FYM was found to increase the yield of grass, which increased further with fertilizer application and water supply, and was most effective when enriched with P [49]. Even so, in Canada, composted sheep FYM had no effect on root development in poplars although it did improve soil water-holding properties [50].
Although the use of SMC and, locally, FYM, as planting media are common, here, the amount applied as a supplement during planting was quite small, 1 kg per stem (circa 103 kg ha−1). Hence, the effects of the application may also be small and become smaller still as the trees grow. Although impacts on initial survival rates could persist, effects on growth would likely be restricted to the first few years after planting. Regardless, it is also possible that these effects could bestow a long-term advantage on treated trees, but it is more likely that long-term impacts would be small. For this reason, the null hypothesis is that the application of a small amount of SMC or FYM on planting, with or without additional fertilizer supplements, makes no significant lasting difference to tree growth and survival in a forest plantation of two-year-whips (40–60 cm height), planted as root trainers.

2.4. Fertilizer Supplements

Ambient nutrient levels on the Varteg site are very low, below the range of field test equipment, so fertilization should positively affect tree survival and growth [51,52,53]. Hence, additional SRF was added during planting with the aim of helping the saplings while they adapted to local conditions. Each stem was provided with one of three treatments: first, as a control, no fertilizer and, second, a recommended dose of SRF [11]. The SRF selected, a standard type much used in forestry planting, provides NPK 15:9:9 + 3 MgO as resin-coated, two-year, slow-release, tablets, applied as 2 tablets per stem (30 g). A third treatment supplemented the SRF with P2O5 to promote root growth because, elsewhere on site, Scots Pine treated with P2O5 had thrived. Superphosphate, which contains about 8% phosphorous (P) in plant-available form, was applied at a rate of 7.5 g per stem (Table 3).

2.5. Data Collection and Statistical Analysis

Data records were collected for each tree in the first, second, third, fifth and tenth years after planting. Records of mortality and each tree’s height (cm) and basal diameter immediately above the root collar (mm) were collected along with DBH (diameter (mm) 1.3 m above the ground), when the tree grew sufficiently tall. Statistical testing employed the null hypotheses that using either SMC or FYM as the initial growing medium made no significant difference to the 1-, 2-, 3-, 5- or 10-year tree survival rate and/or growth of any of the four test species, regardless of whether the growing medium was used alone or in conjunction with SRF or SRF + P2O5. Statistical analysis employed independent sample T-tests to explore the impacts of growing medium on each tree’s dimensions. The Fisher’s Exact test was used to compare nominal data, such as survival, because of its greater accuracy than alternatives such as chi-square. Further analyses deployed nonparametric bivariate correlation (Spearman’s) to explore general trends in the data.
The usual threshold for statistical significance is p < = 0.05, a 1 in <20 probability of being due to chance alone. However, this study involved multiple testing (2 planting media, 3 fertilizer types, 4 tree species, and 5 data records, 120 tests in total). This implies that, on average, 6 tests in each batch of 120 should be positive due to chance alone. Consequently, a lower threshold of significance is necessary to reduce the numbers of “type 1”, “false discovery” errors that could be caused by chance alone. To achieve this, a Bonferroni-style correction factor was applied to reduce the threshold of significance to a level that, nevertheless, does not create “type 2”, “false rejection” errors [54,55,56]. Here, the problem is complicated by the sequential character of the results: same species but different year of growth, in addition to same growing medium but different fertilizer or tree species. Nevertheless, a lower threshold for the confident recognition of “significance” was suggested: p < = 0.0003. Despite this, tests that cross the conventional p = 0.05 threshold were also identified as “possibly significant” because, when viewed in isolation, each one retained its <1 in 20 probability of not being due to chance alone [56].
Finally, discriminant analysis was deployed to guide and structure the analysis by highlighting the power of each variable in reclassifying data into the correct test group, namely, SMC- or FYM-planted trees [54]. Discriminant analysis is a multivariate statistical method often used to detect, screen and rank key variables [56]. Stepwise, it works by reassigning data into predefined groups, using combinations of other variables, which are added to or removed sequentially from a classification function until the change makes no significant difference to its predictive ability [57].
Here, stepwise discriminant analysis was applied to the whole data set in an attempt to reclassify the data into its SMC-planted or FYM-planted categories using combinations of the other variables. The routine reclassified 62.8% of cases correctly using a function based on eight variables. The variable list is dominated by two very strong variables: first, fertilizer and second, tree species. These are supplemented by a combination of smaller growth variables: mainly Height (Years 10, 5, and 1).

2.6. Aspects of Community-Based Restoration

This study also aimed to support community-based voluntary groups making design decisions for projects that seek to restore or “re-wild” degraded (but officially “reclaimed”) opencast coal lands [4]. Several special features affect such plantings. First is that funding is usually sufficient for planting but rarely for professional maintenance. Second is that the planters tend to be called to account by critical bystanders very early, so it is important that the trees planted appear to do well in the first few years. Third is that outcomes are judged by the appearance of the stand as a whole rather than individual species. Fourth is that each planting involves an “ecological” mix of several, supposedly mutually supporting, species, each selected with particular purposes in mind, e.g., nitrogen fixation and shelter, for fast-growing Alder. In these contexts, a monoculture would be considered anathema.
In combination, these considerations suggest the best sequence for reporting results. First, the performance of the whole mixed species stand, the planting’s “public face” is discussed. Second, the effects of the test planting medium are considered. Third, the role of the most powerful discriminant variable, fertilizer, is explored by comparing the differences in those plantings treated with and without supplementary fertilizers and, finally, the role of tree species, which was the second most powerful discriminant variable, is determined through analyses of the impacts of these initial treatments on each of the four different tree species.

3. Results

3.1. Performance of the Whole Stand

Table 3 displays ten-year survival rates (%) and tree growth for the whole (Sy96) stand. In Year 10, for nearly 75% of the planted trees, the mean height approaches 4.7 m, DBH is 46 mm and basal diameter immediately above the root collar is almost 80 mm. By contrast, just upslope, in the very similar trench-planted all-SMC-plantings (which include the same four tree species and 2/3 identical fertilizer supplements), Year 10 survival is 84%, height almost 4 m, DBH 40 mm and basal diameter 75 mm [10].
As a whole, the mean percentage differences between the SMC- and FYM- planted trees are quite small. Table 3, column 8 shows the average ratio between the FYM and SMC-planted trees. The mean across all records is 1.0:1 (S.D. 0.04). This statistic clearly conceals considerable variation across time and measurement type. In only three of the 17 categories are the differences between SMC- and FYM-planted trees not significant. In only five instances do FYM-planted trees lead and four of these concern tree height (Years 5, 3, 2 and1). Mean tree height in Year 10 was 468.63 cm (S.D. 175.65). FYM-planted trees are significantly taller in Years 1–5, but in Year 10, it is SMC-planted trees that are possibly significantly taller.
Tree survival data for the whole stand, in Year 10, is 74.9% (S.D. 4.3). SMC-planted trees however, have significantly higher survival rates than FYM-planted trees in Years 10, 2, 1, and, possibly, Year 5. DBH was recordable in Years 10 and 5. In Year 10, the DBH of the SMC-planted trees was significantly greater but, in Year 5 the FYM-planted trees had greater DBH. Finally, basal diameter, in Year 1 FYM-planted trees, was significantly greater but, thereafter, SMC-planted trees lead, possibly significantly by Year 5, and significantly by Year 10. The pattern suggests that, in the early years, although more SMC-planted trees have better survival, FYM-planted trees grow taller. These two circumstances may not be unrelated; canopy closure occurs here after about 5 years. That apart, survival, height, DBH and basal diameter above the root collar all favor the SMC-planted trees in Year 10.

3.2. Correlations between SMC vs. FYM-Planted Trees and Trees Planted with Different Fertilizer Supplements

Most of this paper focuses on statistically significant differences in tree survival and growth associated with the use of different planting composts, fertilizer supplements and tree species. However, Table 4 is a nonparametric correlation matrix that measures the association between the major variables of record. The matrix is calculated for the whole stand, shaded blue, and the stand subdivided into SMC- and FYM-planted trees, which are shaded mushroom and light-green respectively. It also includes the three fertilizer supplements scored as a simple ordinal scale of 1. no supplementary SRF, 2. SRF and 3. SRF + P2O5.
Table 4 records two-tailed significant (p < 0.0005) correlations for the whole stand, SMC-planted and FYM-planted trees. It confirms close positive associations between both survival and tree height among other dimensions in successive periods of record. In the analyses that follow there often appears to be a relationship between increased survival and reduced tree height but this is not reflected in the correlation statistics. Nonetheless, there are fewer significant correlations between survival and tree dimensions (more white areas in Table 4). Hence, hereafter, the survival data are treated separately.
The simple ordinal scale used in Table 4 to rank the three fertilizer supplements shows increased fertilizer is linked with increased survival, especially for FYM-planted trees. There are only two negative correlations (underlined), both of which affect SMC-planted trees and link increased fertilizer supplements with decreased survival in Year 2 and 1 among the FYM-planted trees.
In the stand as a whole, there are significant positive associations between more fertilizer and tree height in Years 1–10, DBH in Year 5, and basal diameter in Years 1–2. Among SMC-planted trees, significant positive correlations link more fertilizer with height in Years 1–3, DBH in Year 5 and basal diameter in Year 1. By contrast, among FYM-planted trees, positive correlations link fertilizer with basal diameter (Years 3, 2 and 1) but it is negatively correlated with DBH (Year 5).

3.3. Focus on Survival

Table 5 explores the impact on survival of the three initial supplemental fertilizer variants: (1. no supplement, 2. SRF and 3. SRF + P2O5). Each table displays the absolute differences between tree growth and survival on the subplots given different fertilizer supplements on planting. Columns 10 and 11 indicate the statistical significance of any difference between the SMC- and FYM-planted trees and, to aid comparison across several different measures, the ratio between the FYM and SMC mean. Here, the SMC score is always 1 and so ratios greater than 1 show that the response is greater for the FYM trees.
Among those trees planted with no SRF, survival is significantly greater in the SMC- than the FYM-planted trees in every record. When SRF is applied at planting, the differences are smaller and significant only in Years 10, 2 and 1. However, when planted with P2O5, the differences in Years 1–5 are significant but in favor of FYM-planted trees. Clearly, the FYM-planted trees benefit more from the addition of fertilizer supplements—until Year 5. However, the survival ratio favors SMC-planted trees in Year 10 in every case.

3.4. Survival Rates across Different Tree Species

Overall, Alder planted in FYM has the highest survival rate just ahead of Silver Birch planted in SMC. However, Scots Pine planted in FYM with SRF + P2O5 has the worst Year 10 survival rate at (30%), although Oak and Silver Birch also perform poorly in the early years. The mean ratio of FYM/SMC tree survival rates ranges from a high of 1.06:1 in Alder to just 0.62:1 in Scots Pine. The average of the ratios is 0.89:1, which suggests that average survival, standardized by species, is >10% greater in the SMC-plantings. The survival of trees planted in SMC is considerably greater (63%) than FYM for Scots Pine and, as time goes on, for Silver Birch and to some degree for Oak.
As Table 6’s large tracts of amber and white shading emphasize, there are few benefits and many disbenefits to planting with FYM with or without additional fertilizer. Alder survival does benefit from the fertilizer supplements, especially after Year 3, when planted in FYM. In addition, Oak given SRF + P2O5 also does well in Year 3, but less so thereafter. Silver Birch, at best holds its own when treated with SRF + P2O5 and FYM. Nevertheless, there is nothing positive in the results of such treatments, and their result may be catastrophic as with Scots Pine planted with FYM, where survival rates may be as low as 30% of that for trees planted with SMC alone. In just 15 of the 220 cells of Table 7 are the results of planting in FYM and/or using a fertilizer supplement >5% beneficial to the survival of the trees.

3.5. Focus on Growth

Whereas Table 5 explored the differences in the survival data for trees planted with either SMC or FYM and/or one of the additional fertilizer supplements, Table 7, Table 8 and Table 9 do the same for tree growth under each of the fertilizer treatments before moving on to consider differences between tree species responses in Table 10, Table 11, Table 12 and Table 13 (cf. Table 6).
Table 7 compares the growth of SMC- and FYM-planted trees given no additional supplement of fertilizer on planting. Overall, the FYM-planted trees underperform by a ratio of 0.96:1 (S.D. 0.09) (4%). Here, in Year 10, DBH and basal diameter FYM/SMC ratios average 0.95:1 but the height records favor FYM-planted trees in all but Year 10, where it falls to just 0.88:1. Heights are significantly greater among the FYM-planted trees in Years 5, 2 and 1, but by Year 10, it is the SMC-planted trees that are significantly taller (455 vs. 402 cm) and have possibly significantly greater DBH and have greater basal diameters in Year 3. FYM-planted trees are significantly taller in Years 5, 2 and 1. Clearly, in the absence of any fertilizer supplement, SMC-planted trees fare better than FYM-planted except in terms of height. This may be related to slightly lower survival rates and reduced competition between saplings.
Table 8 indicates the differences resulting from the trees being given a supplement of SRF (two-year slow-release fertilizer) on planting. Overall, this shifts the growth data towards FYM and a mean FYM/SMC ratio of 1.03 (S.D. 0.15). Comparing the FYM- and SMC-planted trees given SRF, FYM-planted trees are significantly taller through Year 5 and have a greater basal diameter in Year 1, but SMC-planted trees have significantly greater Year 10 DBH and greater basal diameters in Years 10, 5 and 2. Compared to trees given no SRF, SMC-planted trees have significantly larger DBH and basal diameter in Year 10, whereas FYM-planted trees are significantly bigger in every category except basal diameter in Year 3 in comparison to FYM-planted trees given no SRF. Clearly, FYM-planted trees benefit more from the additional nutrients provided by the fertilizer supplement than SMC-planted trees.
Table 9 explores the impacts of adding a supplement of SRF plus superphosphate (P2O5) on planting. Compared to SMC-planted trees with SRF alone, this approach also shifts the mean FYM/SMC ratio towards the FYM ratio, but much less so than by adding SRF alone. Instead of 1.13:1 the ratio is only 1.04:1. However, the FYM-planted trees given SRF + P2O5 are significantly taller than the equivalent trees planted with SMC in Years 3, 2 and 1, and they also have significantly greater basal diameters in Years 2 and 1. However, SMC-planted trees given SRF plus P2O5 have a possibly significantly greater DBH and basal diameter only in Year 10.
Compared to trees given SRF alone, the FYM-planted trees given SRF + P2O5 have significantly smaller year-10 height (459 vs. 493 cm) but are significantly taller in Years 5, 3 and 2. Basal diameter in years 5, 3 and 2 are also greater. Despite this, these findings suggest that the early advantage given by the additional superphosphate decreases with time. The significant difference in Year-10 DBH that favors the SMC-planted trees may be important because earlier studies at Varteg linked DBH to tree vitality [12].
Table 10, Table 11, Table 12 and Table 13 explore growth by tree species, compost and fertilizer supplement. Together, they complete the disaggregation of the tree growth data.

3.6. Growth across Different Tree Species Comparison of Tree Growth Rates with SMC or FYM Compost by Species and Fertilizer Supplement

Table 10 focuses on Alder, the nursemaid species that provides the matrix of this planting. Once again, the growth-leader “honors” are shared. Among the trees given no-SRF, SMC-planted trees are significantly taller in Year 10, but FYM-planted in Years 5, 2 and possibly 3. Adding SRF on planting results in the SMC-planted Alders being significantly taller than FYM-planted and having greater DBH and basal diameter in Year 10. However, in Year 5, FYM-planted Alders are significantly taller, although SMC-planted trees still have a possibly significantly greater DBH and significantly greater basal diameter. There are no significant differences in Years 1–3. When SRF + P2O5 are applied, once again, SMC-planted Alders are significantly taller and have greater DBH, although only their basal diameter is significantly greater in Year 5. There are also possibly significant differences in favor of the SMC-planted Alders in Years 2 and 1.
Table 11 explores the data for Oak, which is intended to be the legacy crop for the project. Here, by Year 10, there are no significant differences in height. For trees given no SRF, FYM-planted trees had significantly greater basal diameters in Years 10 and 5, possibly DBH in Year 10. SMC-planted trees were possibly significantly taller in Year 3. When the trees were planted with SRF, there were no significant differences after Year 1 when FYM trees were taller and had greater diameter. Where trees were given SRF + P2O5 on planting, a few significant or possibly significant differences appeared in Year 5 and earlier. These favored SMC-planted Oaks in Year 5, SMC-planted height in Year 3 and FYM-planted tree diameter in Year 2. However, there seem to be few benefits to planting Oak with FYM or using fertilizer supplements over simply planting Oak SMC alone. The differences between most treatments are relatively muted.
By contrast, the differences between SMC- and FYM-planted Scots Pine are more categorical (Table 12). In the absence of supplementary fertilizers, SMC-grown trees are more successful, and significantly larger in almost every dimension, than those grown in FYM, although the significance of the difference is lowest in Year 10 (and Year 1). In the absence of SRF, SMC-treated Scots Pine are possibly significantly taller in Years 10 but significantly in Years 5, 3 and 2. They have significantly greater DBH in Years 10 and 5 and basal diameters in Years 1 to 10. SMC-treated Scots Pine given no SRF lead those planted in FYM in every category. However, this is much less the case for Scots Pine given SRF on planting. Now, SMC-planted trees are significantly taller in Year 10 and possibly 5 but FYM-planted Scots Pine are possibly significantly taller in Year 1. SMC-planted Scots Pine still have significantly greater DBH in Year 10 but not Year 5, and possibly significantly greater basal diameter Year 10, significantly in Years 1–3. However, FYM-planted Scots Pine given SRF are possibly taller in Years 5 and 1. Adding SRF + P2O5 on planting reduces the differences between the SMC- and FYM-planted Scots Pine. SMC-planted Scots Pine are possibly significantly taller in Year 5, significantly in Years 2 and 1. They have significantly greater DBH in Year 5 but not 10 and greater basal diameters in Years 2 and 1 only. There are no possibly significant differences that favor FYM-planted Scots Pine and, as established earlier, these trees also have the lowest survival rates on site. After Year 3, SMC-planted Scots Pine given SRF fare slightly better than those given no SRF. In summary, SMC is much better than FYM for Scots Pines, although the difference can be mitigated, somewhat, by the addition of SRF + P2O5.
Silver Birch was not part of the original planting concept, despite being highly recommended for this kind of planting [57], but this tree has assumed greater importance because, in several other, older, Varteg test plots, it has become the highest tree in the canopy. Table 13 also displays a clear-cut outcome, which is that, in the absence of additional fertilizer, Silver Birches planted with SMC compost are significantly larger in every dimension than those planted in FYM in every data record. However, as before, the addition of fertilizer supplements muddies this picture. Initially, the addition of SRF reduces the growth of SMC birch and considerably increases that of FYM birch, which becomes significantly larger in several records. From Year 3 onwards, when the effects of the initial SRF application have faded, SMC trees become larger, usually significantly. The effect of the fertilizer is even greater when SRF + P2O5 is applied. In the first 3 years, this fosters significantly better growth in the Silver Birches planted with FYM. In Year 5, the pattern begins to shift towards the SMC planted trees and the difference in SMC’s favor becomes increasingly significant in Year 10.

3.7. Comparison Using Ratios to SMC with No SRF

The baseline for Table 14 is tree growth after planting with SMC alone. All other treatments are expressed as a ratio to this control, hence, numbers above 1:1, shaded blue, suggest some benefit (above an arbitrary 5% threshold) from a treatment, whereas those unshaded do not, and those shaded amber indicate a disbenefit. This table summarizes the data in Table 9, Table 10, Table 11 and Table 12, and is subdivided by tree species. Its counterpart, which deals with survival, is Table 6. Together, combined as the graphical abstract for this paper, they provide the clearest summary of the results of this study.
In addition, Table 14 suggests that the species most likely to respond to additional fertilizer are Alder and, to a lesser extent, Oak. FYM is best avoided when planting Scots Pine although adding SRF when planting with SMC may be beneficial. Any gains made by planting Silver Birch with FYM are few and short-lived and the result is little better than for SMC-planted trees without fertilizer.
Table 14 shows the ratio between the control of SMC planted trees given no fertilizer supplements (No SRF), and those given other treatments. In practical terms, this addresses the question: is it worth the extra trouble and expense of using locally-sourced FYM, slow-release fertilizer tablets (SRF), or SRF further supplemented with P2O5? Where these differences are >5% positive for the FYM and/or supplement, the cells are shaded blue. Where they are >5% negative, they are shaded amber; the suggestion is that such treatments have a negative impact and should be applied with caution. Table 14 confirms that using FYM and/or fertilizer supplements has growth benefits for Alder, especially when supplemented with SRF + P2O5, at least until Year 10.
Arguably, Oak also benefits, although the results are patchy, particularly in Years 1–3. However, these alternative treatments do not benefit the growth of either Silver Birch or Scots Pine, at least not before Year 10. As in the survival data (Table 6), Alder benefits most overall. However, these growth benefits are most apparent in Years 5, 3 and 2. Year 10 data is dominated by amber and white, meaning that the treatment had small or negative benefits over planting with SMC alone. The conclusion is that there are few growth benefits to planting with FYM and/or SRF, SRF + P2O5 fertilizer supplements unless the planting is to be dominated by Alder.

4. Discussion

Organic composts are recommended for soil regeneration on degraded lands [58]. Larney and Angers also propose that, since “no one solution fits all” ([59] p. 33), research is needed to test as many organic composts and soil contexts as possible. The expectation is that adding compost benefits a planting medium by adding nutrients and organic matter that contribute to soil water storage. It may inoculate the soil with, hopefully beneficial, soil organisms, both macro- and micro-, and also provide food for them. Of course, unlike sterilized municipal green waste (MGW) which benefitted the survival of Silver Birch and European Larch but was a disbenefit to Alder [10], unsterilized FYM may also introduce pathogens and weed species, although few have persisted on site at Varteg. More generally, promoting the soil ecosystem may help in the amelioration of soil pH and neutralization of soil contaminants. Fertilizer supplements contribute further by supplying key elements such as K and P, in addition to other trace elements that are deficient in both this degraded soil and the composts used in planting. Collectively, these factors should help improve and revive the soil ecosystem and, here at Varteg, this is certainly the case [3,6]. This in turn benefits soil structure and porosity. Soils on the former opencast coal lands of Wales are commonly highly compacted [2,4,12,15]. This problem may be mitigated by bioturbation, especially by earthworms, by root penetration, and by the stabilization of soil aggregates through organic by-products [60,61].
At the outset of this study, the end results appeared to be clear. The use of well-rotted local FYM, as part of the planting medium, rather than the more conventionally and commercially available SMC, would lead to better tree survival and development because it added more active organic materials and decomposer micro-organisms to otherwise infertile mine-soils than the relatively sterile SMC. Indeed, this notion appears to be supported by microbiological results from the Varteg. These describe the 20-year changes in soil organic carbon and the soil microflora, and suggest that the microcoenosis is larger in sites treated with organic fertilizer, in this case bonemeal [6], and massively larger in areas where trees had been re-established [3,4]. Formally, the total microflora shows significant positive correlations with time since tree planting, as do the proportions of bacilli, whereas the correlation with ammonifying bacteria is negative.
Previously, it had been shown that using composted municipal green waste (MGW) instead of SMC in tree planting on the Varteg contributed to increased Year 11 tree survival rates but made little significant difference to Year 11 tree height or DBH [10]. These trees were notch-planted (forestry style) rather than planted in 0.5 by 0.5 by 20–30 m water-retaining trenches, so a lack of rooting space and soil moisture issues likely contributed to relatively low survival rates. Here, overall survival was 75%, whereas in the MGW test plots survival was just 53% for trees planted directly into the mine spoils and 59% for those planted with MGW compost. Year 11 tree heights at just 281–293 cm for Alder and Silver Birch, respectively, were also much lower than no-SRF, SMC-planted Year 10 tree height in these trench-planted (Sy96) plots, which averaged 515 cm for Alder and 600 cm for Silver Birch. The reason for this was almost certainly related to the problems of rooting in the compacted mine spoils and to water supply [12]. In a formal trial of three planting methods on another very exposed section of the Varteg site, the 10-Year survival of SMC-planted Alder was still lower; 45% in trench-planted sites containing small 5–10 m long trenches, and 39% where notch planted, although SMC-planted oak did much better at 93% versus 71%. This study also found a systematic decline in the differences between trees planted using different planting methods as time progressed and root systems developed [12].
Again, initially, it was thought that supplementing SMC and FYM plantings with SRF would benefit tree survival and growth. Previously, in Iceland, it had been shown that a close relative to Silver Birch, Downy birch (Betula pubescens Ehrh), survived much better when treated with SRF 94% versus 48% when untreated ([53], p. 94). Previous studies on the upper convexity of the Varteg spoil embankment, involving a similar mix of SMC-planted tree species to the Sy96 plots, found that, among the SMC-trench-planted trees given SRF on planting, only Oak and perhaps, Silver Birch, showed enhanced survival [11]. Overall, the Year 10 mean survival of SRF and no-SRF trees was 83% vs. 85%; this difference was not significant.
The Year 10 tree height, however, was significantly greater among the SRF-treated trees at 421 versus 368 cm. Here, on Varteg Sy96, the SRF-treated trees’ mean height was also significantly greater for trees planted with SRF 498 cm compared to 455 cm for those given no SRF. Similarly, for Year 10 DBH, the mean for trees on the slope-crest plots was 48 mm among SRF-treated trees but just 37 mm for those given no SRF. Here, on Sy96, Year 10 DBH was 57 mm for trees given SRF and 43 mm for those given no SRF, indicating SRF seems to benefit the SMC-planted trees.
Fertilizer supplements benefit FYM-planted trees more than SMC-planted. This may be because FYM is often deficient in K and is known to respond positively to P2O5, provided here as an additional supplement to SRF [49]. Overall, the best (81.6%) and worst (67.9%) Year 10 survival rates were for FYM-planted trees, whereas the best for SMC-planted trees were those given SRF + P2O5, the worst for those given no fertilizer. However, in the slope-crest plantings, the addition of fertilizer supplements to SRF was not considered very beneficial, and adding SRF + P2O5 had negative effects [11]. As Table 5 confirms, in the Sy96 mid-slope plantings, FYM-planted trees with added SRF + P2O5 had significantly better survival rates than those planted with no fertilizer in every data record, and those given SRF alone only in Years 3–10. By contrast, SMC-planted trees with no fertilizer had significantly better survival rates in Years 1, 2 and 5. SMC contains K, albeit in an easily leached, water-soluble, form, but its application is linked to increased N, P and K [62]. Hence, there is less need for additional fertilizer and, of course, the water-retaining planting trenches may help keep leached K close to the tree roots.
Explored by species, Alder survival is, from Year 3–10, significantly better when planted with FYM. Scots Pine’s survival is significantly higher when planted with SMC, as is Silver Birch in Year 10. However, with Oak, SMC-planted trees typically fare better than FYM-planted. The water-loving Alders, like the specimen Goat Willows also planted on site, survive conspicuously better when planted with FYM, whereas the opposite is true of Scots Pine, Silver Birch and, possibly, Oak. If the stand were evenly divided by the four species, SMC-planted trees would survive significantly better than FYM in the overall results (Table 6).
Regarding growth, overall, the stand achieved 2.75 m after 5 years and 4.7 m after 10 years with a survival rate of <75%. This compares with 1.98 m (5 years), 3.99 m after 10 years with an 84% survival rate in the more exposed and less-well-watered conditions in the similar trench-planted, SMC-planted trees in the slope crest plots [11]).
FYM planted trees were significantly taller in Years 2, 3 and 5 but fell behind SMC-planted trees by Year 10, when there were no significant differences in either DBH or basal diameter above the root collar. Previous studies on the Varteg test site that researched the effects of initial fertilization with SRF produced different, statistically validated, but contradictory results about the benefits of fertilizer application in data collected 3, 5 and 10 years after planting, at different stages of forest growth [11,62,63]. Here, Alder’s two-year results indicate a negative impact from SRF fertilization. Year 5 data shows no clear benefits but Year 10 data indicates significant positive benefits. Similarly, Silver Birch results from Years 1–5 show no positive benefits from SRF application but Year 10 data suggests the opposite [11]. Such results have been used to argue the benefits of long-term research involving multiple data collection points {61]. Here, overall, the addition of fertilizer little changed the relative difference in overall performance and commonly the net outcome was negative. This, in some way, echoes previous findings [11]. Nevertheless, both the best (81.6%) and the worst (67.9%) Year 10 survival rates were among trees planted with FYM alone and FYM supplemented with SRF and P2O5, respectively (Table 4).
This outcome is clearly affected by differences between the tree species used in the mix. The most important of these divides the riparian/marshland species, Alder, which responds better to FYM and the more generalist upland species, Silver Birch and Scots Pine, which tend to respond better to SMC.
It is possible that the rich organic mix of the FYM, combined with the water-retaining qualities of the planting trenches, created marsh-like conditions that benefit riparian species. In the first two years after planting, the trenches became colonized by Juncus sp. reeds, which smothered some of the young saplings. Therefore, in Year 10, the survival of Alders planted in SMC was 85–88% of those planted in FYM and in Year 5, 81–86% of the height. As the trees grew larger, their water requirements began to dry out the trenches and in Year 10, SMC-planted Alders were slightly larger (114–102%). By contrast, in species that prefer drier soils, such as Scots Pine, the survival of SMC-planted trees was 163–220% of those planted in FYM by Year 10 and their height was 237–321% greater. These results demonstrate how species selection and site conditions are critical to the selection of a compost planting medium.
The relative impacts of the fertilizer treatments were also different for different tree species, although differences in most dimensions were quite small and, again, often time dependent [11,61].
Alder grows quickly and fixes nitrogen because it carries root nodules that support the nitrogen-fixing bacterium, Frankia alni. Accordingly, it performs well in nutrient-poor substrates although organic compost has been linked to increased survival [9]. In Sy96, Year 10 SMC-planted Alder with no fertilizer and with SRF + P2O5 is significantly taller than FYM-planted trees and has a greater DBH, significantly so for fertilizer-treated trees. Further, until Year 3, the SMC-planted Alders are larger, often possibly significantly, in both height and basal diameter.
If Alder is a short-lived fast growing nursemaid species, Oak is the opposite; it is slow growing and long lived. Here, while SMC-planted Oaks are slightly taller in Year 10, FYM-planted Oaks with no fertilizer are significantly greater in DBH and basal diameter. There are no clear patterns in the other data but, FYM trees possibly have the edge in Years 1–2.
SMC-planted Scots Pine tend to be ahead of FYM-planted, occasionally significantly, in nearly every record throughout the study. Of course, those planted in FYM also have relatively low survival.
Rising above 6 m in SRF-treated plots, Silver Birch is the growth leader in height and SMC treated trees are comprehensively larger, often significantly, in Years 10 and 5. However, apart from the unfertilized plots, FYM-treated trees tend to be larger, usually significantly, in Year 1–3.
Overall, the time-dependent species-specific changes tend to favor SMC-planted trees in the later years and FYM in the first years after planting, although not to the extent found on neighboring Varteg test plots [11].
The way results shift between different periods of record has been much discussed in previous reports from the Varteg. Early results, for example, are influenced by transplantation shock and weather variations in the first years of the plantation and by the lifespan of the two-year slow-release fertilizer, although here as then, the positive effects of this treatment may not emerge until Year 10, which is counterintuitive if not unprecedented [63]. Another influence is canopy closure in or about Year 5, after which growth becomes constrained by competition. Here, as before, it is not unusual for Year 5 and Year 10 data to be very different and for these growth phases to be visible in the data [63].
From a practical perspective, this study produced several results that confounded prior expectations. Reviewing these may be helpful for anyone undertaking similar work. An example is the observation that the appearance of the trees planted on the steep embankment is more impressive than for those planted on the level bench above; in fact, these trees are slightly taller. They benefit from extra shelter from the wind and a better water supply. However, the differences are not as great as they appear. The average Year 10 heights recorded for trees planted at the slope crest are 368–421 cm whereas comparable SMC-planted trees on the steep slope (Varteg Sy96) average 475 cm (cf. 457 cm for FYM-planted) (Table 3). The trees on the steep slope clearly look taller because their green shoots merge into a kind of wall that rises up the whole slope. Nonetheless, if appearances matter, if your community team has a choice, and provided that you are not daunted by the logistic and safety problems of site preparation, especially the hazards of using heavy machinery on steep slopes, then the results of planting on a slope will seem more impressive.
The choice of planting method also makes large, highly visible, long-term differences to both the growth and survival of young trees. Contour trenching (as used here and in orchard planting on steep slopes, yields better results, at least for the first decade, when compared with pit planting (as in gardens and parks) or notch planting (as in commercial forestry) [12].
By comparison, the differences due to compost and fertilizer additives are much less visible, especially in a mixed planting. As in previous studies at Varteg, significant differences in response to the different composts and fertilizer additives are detectable but only by direct measurement. The main exception arises from the strong negative impact of planting Scots Pine with FYM. For the remainder, survival rates are high (ca. 75%) and vary relatively little, particularly for trees planted with SMC.
As the ratio tables demonstrate (Table 6 and Table 13), for the most part, the net positive benefits of planting with SMC, and perhaps SRF, outweigh the additional risk and expense involved in using other treatments. Alder is the main benefactor of being planted with FYM and fertilizer supplements.
However, regardless of the planting method, compost or fertilization strategy employed, the ecological outcome of the planting remains highly positive, both at macro- and micro-scales [3,12,62]. Further, the approach used here could open up new possibilities for re-wilding and creating wildlife corridors along the 100 km tract of opencast coal-lands in South Wales [8].

5. Conclusions

At the former opencast coal land at Varteg, during ten years of evidence, the survival of SMC-planted trees (77%) was significantly higher than for FYM-planted (72%; p < 0.0005).
Simultaneously, SMC-planted trees were taller than FYM-planted in Year 10 (4.75 vs. 4.57 m respectively) but, the FYM-planted trees were growing faster until Year 5. Basal diameters immediately above the root collar also tended to be significantly larger among the SMC-planted trees throughout.
The most important variables dividing the SMC-planted and FYM-planted data were the character of, first, any SRF-based fertilizer supplement given on planting and second, tree species. There was a positive association between the amount of fertilizer applied on planting, survival from Year 3, DBH in Year 5, and basal diameter in Years 2 and 1. Among the SMC-planted trees, fertilizer was negatively associated with survival in Years 2 and 1, but positively with height in Years 3, 2 and 1, DBH in Year 5 and diameter in Years 2 and 1. Thus, in SMC-planted trees fertilizer supplements depleted early survival but encouraged early growth. In the FYM-planted trees, fertilizer correlated positively with survival until Year 3, then negatively in Years 10 and 5. Fertilizer was also positively associated with height in Years 10, 3, 2 and 1, with Year 5 DBH, and with diameter in Years 3, 2 and 1. This shows that FYM had less impact on tree survival and a more lasting positive impact on tree growth.
Comparing survival rates, trees planted with SMC alone fared significantly better than those planted with FYM, and by a factor that increases with time from 10–15%. However, adding SRF during planting shifted the survival balance towards FYM, especially in Years 2 and 1, although this advantage disappeared over time. Adding SRF + P2O5 on planting shifted the balance of survival further toward the FYM-planted trees.
Nonetheless, the only tree species that benefit, long term, from these fertilizer supplements was Alder and possibly Oak. When compared with planting with SMC alone, most survival outcomes for different fertilizer treatments were neutral or negative. The negatives outcomes were most obvious among Scots Pine planted in FYM
Regarding growth, height differences among trees planted with no fertilizer supplement tended to favor FYM-planted trees until Year 5, but SMC-planted by Year 10. Clearly, there were few significant differences in DBH or basal diameter among trees planted with SRF. Despite this, FYM-planted trees had a marked difference in height through Year 5, but SMC-planted trees had greater DBH in Year 10 and diameters from Year 5. Undoubtedly, fertilizer supplements favored the growth of FYM-planted trees in the early years but in later years the balance shifted to SMC-planted trees.
Of the four tree species, Alders, SMC-planted with SRF, were found to perform best, achieving a maximum height of 5.36 m in Year 10. The initially small number of significant differences between SMC- and FYM-planted trees increased as more fertilizer additives were made, and most favored SMC- over FYM- planted trees. Fertilizer supplement benefited both SMC- and FYM-planted Alders over planting in SMC alone in Years 5 to 1. For Alder, adding SRF + P2O5 on planting resulted in taller FYM-planted trees through Year 3 with greater diameters in Years 2 and 1, but SMC-planted trees nonetheless had the greater DBH in Year 10. Oak appeared to benefit from FYM and fertilizer supplements more in years 5 through 10. By contrast, Scots Pine performed poorly compared to trees planted with SMC alone, especially when planted in FYM.
Alders given extra SRF + P2O5 performed better in Years 1 to 3 compared to those given other treatments. Oak trees planted with SMC were slightly larger in Year 10 when given SRF, and to a lesser extent SRF + P2O5. Scots Pine’s growth was better when planted in SMC compost than FYM, although the difference can be reduced by the addition of SRF + P2O5 This, once again, shifted the balance towards FYM-planted trees which were significantly taller in Year 3 and greater in diameter in Years 3 and 2, although SMC-planted trees had the larger DBH in Year 10.
Silver Birches planted with SMC compost were significantly larger than those planted in FYM in every data record. In Years 1 and 2, the addition of SRF reduced the growth of SMC-planted birch while increasing that of FYM birch. From Year 3, SMC trees became larger, usually significantly. Silver Birch planted with FYM, SRF + P2O5 performed relatively well in the first 3 years and when planted in SMC with SRF or SRF + P2O5 after Year 3 but, generally, Silver Birch performed relatively poorly when planted in FYM. Adding SRF + P2O5 may have encouraged better early growth in the FYM-planted Silver Birch, but, by Year 5, the pattern shifted towards the SMC-planted Silver Birch, with the difference becoming significant in Year 10.
Overall, SMC-planted trees performed better than FYM-planted trees; however, some of these differences can be mitigated by the application of fertilizer supplements, which especially benefited Alder. Scots Pine was the species most adversely affected by planting in FYM.

Author Contributions

Conceptualization and methodology: M.H., S.G.-K., H.R., W.P.; different aspects of validation, formal data collection, analysis and investigation: M.H., H.R., M.D., C.B., P.W. F.F., A.F., S.G.-K., G.W., E.Z., B.S., L.H., K.P., S.P., S.S.; writing (first drafts): M.H.; writing (review and editing) J.K., G.W. assisted by M.C.; visualization: graphical abstract J.K., map, photographs and graphs: M.H., G.W. and B.S. This paper is dedicated to the memory of S.G.-K. and K.P. who, sadly, left this world before publication. All authors have read and agreed to the published version of the manuscript.

Funding

This research benefitted from volunteers and grants provided by Earthwatch (Europe) ‘Discovery Weekend’ programme, The Gaia Initiative of the Centre for International Peace Building, The British Council and Chase Chemical Bank.

Institutional Review Board Statement

Not applicable.

Informed Consent Statement

Not applicable.

Data Availability Statement

Not applicable.

Acknowledgments

This project received further support from Chris Bull, who conceived the idea, Pontypool Park Estates, who provided the land, and the Ebbw Vale Garden Festival, which donated the SMC compost.

Conflicts of Interest

The authors declare no conflict of interest.

References

  1. Kuter, N. Reclamation of degraded landscapes due to opencast mining. In Advances in Landscape Architecture; Ozyavuz, M., Ed.; IntechOpen: London, UK, 2013; Chapter 33; Available online: https://www.intechopen.com/books/advances-in-landscape-architecture (accessed on 21 May 2021).
  2. Haigh, M.J. Problems in the reclamation of coal-mine disturbed lands in Wales. Int. J. Surf. Min. Reclam. Environ. 1992, 6, 31–37. [Google Scholar] [CrossRef]
  3. Haigh, M. Chapter 32—Building a “Cradle for Nature”: A paradigm for environmental reconstruction. In Bio-Geotechnologies for Mine Site Rehabilitation; Prasad, M.N.V., de Campos, P.J., Maiti, S.K., Eds.; Elsevier B.V.: Amsterdam, The Netherlands, 2018; pp. 593–616. [Google Scholar]
  4. Monbiot, G. Big Coal’s Big Scam: Scar the Land for Profit and Let Others Pay; The Guardian: London, UK, 2015; p. 35. [Google Scholar]
  5. Walley, C. Carving out a future. In Rural Wales Magazine; CPRW (Campaign for the Protection of Rural Wales): Welshpool, UK, 1994; pp. 22–24. [Google Scholar]
  6. Torfaen County Borough. Blaenavon World Heritage Site Management Plan 2011–2016. 2011. Available online: https://www.visitblaenavon.co.uk/en/Publications/WorldHeritageSite/LookingAfterBlaenavon/BlaenavonWHSDraftManagementPlan(2011).pdf (accessed on 16 May 2020).
  7. Torfaen County Borough. Blaenavon Town Centre Conservation Area Appraisal and Management Plan 2017–2022. 2017. Available online: https://www.torfaen.gov.uk/en/Related-Documents/Planning/Conservation/Blaenavon-Town-Centre-Conservation-Area-Appraisal-and-Management-Plan-2017-2022.pdf (accessed on 16 May 2020).
  8. Haigh, M.; Woodruffe, P.; D’Aucourt, M. A new wildlife corridor for the South Wales Coalfield: Repurposing Wales’ opencast coal-lands. Conserv. Land Manag. 2020, 18, 18–23. [Google Scholar]
  9. Paradelo, R. Utilización de materiales compostados en la rehabilitación potencial de espacios afectados por residuos mineros y suelos de mina. Bol. Geol. Min. 2013, 124, 405–419. Available online: http://citeseerx.ist.psu.edu/viewdoc/download?doi=10.1.1.1079.7243&rep=rep1&type=pdf (accessed on 25 February 2021).
  10. Haigh, M.; Desai, M.; Cullis, M.; D’Aucourt, M.; Sansom, B.; Wilding, G.; Alun, E.; Garate, S.; Hatton, L.; Kilmartin, M.; et al. Composted municipal green waste enhances tree success in opencast coal-land reclamation in Wales. Air Soil Water Res. 2019, 12, 1–10. [Google Scholar] [CrossRef] [Green Version]
  11. Haigh, M.J.; Reed, H.; D’Aucourt, M.; Flege, A.; Cullis, M.; Davis, S.; Farrugia, F.; Gentcheva-Kostadinova, S.; Shelve, E.; Hatton, E.; et al. Effects of initial fertilizer treatment on the 10-year growth of mixed woodland on compacted surface-coal-mine spoils, S. Wales. Land Degrad. Dev. 2018, 29, 3456–3468. [Google Scholar] [CrossRef]
  12. Plamping, K.; Haigh, M.; Reed, H.; Woodruff, P.; Fitzpatrick, S.; Farrugia, F.; D’Aucourt, M.; Flege, A.; Sawyer, S.; Panhuis, W.; et al. Effects of initial planting method on the performance of mixed plantings of alder and oak on compacted opencast coal-spoils, Wales: 10-year results. Int. J. Min. Reclam. Environ. 2017, 31, 286–300. [Google Scholar] [CrossRef]
  13. Claessens, H.; Oosterbaan, A.; Savill, P.; Rondeux, J. A review of the characteristics of black alder (Alnus glutinosa (L.) Gaertn.) and their implications for silvicultural practices. Forestry 2010, 83, 163–175. [Google Scholar] [CrossRef] [Green Version]
  14. Sroka, K.; Chodak, M.; Klimek, B.; Pietrzykowski, M. Effect of black alder (Alnus glutinosa) admixture to Scots pine (Pinus sylvestris) plantations on chemical and microbial properties of sandy mine soils. Appl. Soil Ecol. 2018, 124, 62–68. [Google Scholar] [CrossRef]
  15. Moffat, A.J.; McNeill, J. Reclaiming disturbed land for forestry. For. Comm. Bul. 1994, 110, 46–50. [Google Scholar]
  16. Broad, K.F. Tree Planting on Man-Made Sites in Wales; Forestry Commission: Farnham, UK, 1979. [Google Scholar]
  17. Moffat, A. Native and non-native trees: Why and how to choose. In Practice Guide for Land Regeneration 8; Forestry Commission: Farnham, UK, 2014. Available online: https://www.forestresearch.gov.uk/research/best-practice-guidance-for-land-regeneration (accessed on 5 December 2020).
  18. Pyatt, D.G.; Duncan, R.; Fletcher, J. An Ecological Site Classification for Forestry in Great Britain. For. Comm. Bull. Edinb. UK 2001, 124, 27–53. [Google Scholar]
  19. Countryside Council for Wales and International Council on Monuments and Sites: Register of Landscapes of Outstanding Historic Interest in Wales. Cadw Welsh Historic Monuments, Cardif. 1998. Available online: http://lle.gov.wales/catalogue/item/RegisteredLandscapesOfOutstandingHistoricInterestInWales?lang=en (accessed on 23 November 2020).
  20. Smart, P.; Simpson, A. Varteg Coal Recovery and Reclamation Scheme, Blaenavon, South Wales. In Hydrogeology and Contaminated Land Assessment; Final Interpretive Report; Faber Maunsell AECOM: Birmingham, UK, 2006. [Google Scholar]
  21. Robinson, J. Agricultural Land Classification and Physical Characteristics and Soil Forming Materials Survey: Pwll Du Opencast Coal Site, Blaenavon, Gwent; ADAS Land Management Services: Cardiff, UK, 1989. [Google Scholar]
  22. Rodwell, J. (Ed.) British Plant Communities Volume 3—Grasslands and Montane Communities; Cambridge University Press: Cambridge, UK, 1992. [Google Scholar]
  23. Haigh, M. Slope retreat and gullying on revegetated surface-mine dumps. Waun. Hoscyn. Gwent. Earth Surf. Proc. 1980, 5, 79–82. [Google Scholar]
  24. Haigh, M.; Sansom, B. Soil compaction, runoff and erosion on reclaimed coal-lands (UK). Int. J. Min. Reclam. Environ. 1999, 13, 135–146. [Google Scholar] [CrossRef]
  25. Haigh, M.; Reed, H.; Flege, A.; D’Aucourt, M.; Plamping, K.; Cullis, M.; Woodruffe, P.; Sawyer, S.; Panhuis, W.; Wilding, G.; et al. Effect of planting method on the growth of Alnus glutinosa and Quercus petraea in compacted opencast coal-mine spoils, South Wales. Land Deg. Dev. 2015, 26, 227–236. [Google Scholar] [CrossRef]
  26. Flege, A. Recovering the Surface; Man-Made “Soil” at a Reclaimed Site in the South Wales Coalfield. Ph.D. Thesis, University of Cincinnati, Cincinnati, OH, USA, 2003. Available online: https://www.researchgate.net/publication/36203760_Recovering_the_surface_man_made_soil_at_a_reclaimed_site_in_the_South_Wales_coalfield/ (accessed on 4 May 2019).
  27. Merrington, G.; Fishwick, S.; Barraclough, D.; Morris, J.; Preedy, N.; Boucard, T.; Reeve, M.; Smith, P.; Fang, C. The Development and Use of Soil Quality Indicators for Assessing the Role of Soil in Environmental Interactions; Science Report SC030265; Environment Agency: Bristol, UK, 2006. Available online: https://assets.publishing.service.gov.uk/government/uploads/system/uploads/attachment_data/file/290729/scho0306bkiq-e-e.pdf (accessed on 5 December 2020).
  28. Desai, M. Phytoremediation: A Tool for Restoring Land Degraded Due to Open Cast Coal Mining. Ph.D. Thesis, Oxford Brookes University, Oxford, UK, 2014. Available online: https://ethos.bl.uk/OrderDetails.do?uin=uk.bl.ethos.634790 (accessed on 5 December 2020).
  29. Davies, G.; Butler, D.; Mills, M.; Williams, D. A survey of ferruginous minewater impacts in the Welsh coalfields. Water Environ. J. 1997, 11, 140–146. [Google Scholar] [CrossRef]
  30. Theokas, A.C. Grounds for Review: The Garden Festival in Urban Planning and Design; Liverpool University Press: Liverpool, UK, 2004. [Google Scholar]
  31. Drakes, D.; Briercliffe, T.; Lightfoot-Brown, S.; Arnold, D.; Mackay, N. The Use and Disposal of Growing Media: Report to Summarise Current Practice; ADAS Horticulture: Aylesford, Kent, UK, 2001. Available online: http://www.hse.gov.uk/pesticides/topics/pesticide-approvals/pesticides-registration/data-requirements-handbook/fate/resources/The%20Use%20and%20Disposal%20of%20Growing%20Media%20ADAS.pdf (accessed on 22 May 2019).
  32. Jasińska, A. Spent mushroom compost (SMC)–retrieved added value product closing loop in agricultural production. Acta Agrar. Debr. 2018, 150, 185–202. [Google Scholar] [CrossRef]
  33. Jordan, S.N.; Mullen, G.J.; Murphy, M.C. Composition variability of spent mushroom compost in Ireland. Bioresour. Technol. 2008, 99, 411–418. [Google Scholar] [CrossRef]
  34. Desai, M.; Haigh, M.; Walkington, H. Phytoremediation: Metal decontamination of soils after the sequential forestation of former opencast coal land. Sci. Total Environ. 2019, 656, 670–680. [Google Scholar] [CrossRef] [PubMed]
  35. Mullen, G.J.; McMahon, C.A. The effects of land spreading and soil incorporation of spent mushroom compost on County Monaghan grassland soils. Irish J. Agric. Food Res. 2001, 40, 189–197. [Google Scholar]
  36. Asemoloye, M.D.; Chukwuka, K.S.; Jonathan, S.G. Spent mushroom compost enhances plant response and phytoremediation of heavy metal polluted soil. J. Plant Nutr. Soil Sci. 2020, 183, 492–499. [Google Scholar] [CrossRef]
  37. Li, Q.; Deng, M.; Coombes, A.J. Evaluation of spent mushroom compost as a container medium for production of seedlings of two oak species. Nat. Environ. Pollut. Technol. 2017, 16, 529–534. Available online: http://www.neptjournal.com (accessed on 2 February 2019).
  38. Oei, P.; Zeng, H.; Liao, J.; Dai, J.; Chen, M.; Cheng, Y. The Alternative Uses of Spent Mushroom Compost; Productschap Tuinbouw: Wettenberg, Germany, 2007; Available online: https://edepot.wur.nl/291306 (accessed on 6 December 2020).
  39. Burden, J.L. Environmental Guidelines for Mushroom Producers; Red Tractor Farm Assurance: London, UK, 2016; Available online: https://assurance.redtractor.org.uk/contentfiles/Farmers-5364.pdf (accessed on 6 December 2020).
  40. García-Delgado, C.; D’Annibale, A.; Pesciaroli, L.; Yunta, F.; Crognale, S.; Petruccioli, M.; Eymar, E. Implications of polluted soil biostimulation and bioaugmentation with spent mushroom substrate (Agaricus bisporus) on the microbial community and polycyclic aromatic hydrocarbons biodegradation. Sci. Total Environ. 2014, 508, 20–28. [Google Scholar] [CrossRef] [PubMed]
  41. Corral-Bobadilla, M.; González-Marcos, A.; Vergara-González, E.P.; Alba-Elías, F. Bioremediation of waste water to remove heavy metals using the spent mushroom substrate of Agaricus bisporus. Water 2019, 454, 454. [Google Scholar] [CrossRef] [Green Version]
  42. Zhou, A.; Zhang, Y.; Li, R.; Su, X.; Zhang, L. Adsorptive removal of sulfa antibiotics from water using spent mushroom substrate, an agricultural waste. Desalination Water Treat. 2016, 57, 388–397. [Google Scholar] [CrossRef]
  43. Rinker, D.L. Spent mushroom substrate uses. In Edible and Medicinal Mushrooms: Technology and Applications; Diego, C.L., Giménez, A.P., Eds.; Wiley: Hoboken, NJ, USA, 2017; pp. 427–454. [Google Scholar]
  44. Bending, N.A.D.; Moffat, A.J. Tree performance on minespoils in the South Wales coalfield. J. Appl. Ecol. 1999, 36, 784–797. [Google Scholar] [CrossRef]
  45. Kilbride, C. Application of Sewage Sludge and Composts. Best Practice Forest Research, Best Practice Guidance for Land Regeneration Note 6; The Land Regeneration and Urban Greenspace Research Group: Surrey, UK, 2006. [Google Scholar]
  46. Cieślik, B.M.; Namieśnik, J.; Konieczka, P. Review of sewage sludge management: Standards, regulations and analytical methods. J. Clean Prod. 2015, 90, 1–15. [Google Scholar] [CrossRef]
  47. Gendebien, A.; Carlton-Smith, C.; Izzo, M.; Hall, J.E. UK Sewage Sludge Survey, Environment Agency, Bristol; (Project ID:EAPRJOUT_1053, R&D Technical Report); Environmental Agency: Bristol, UK, 1999. [Google Scholar]
  48. Elouear, Z.; Bouhamed, F.; Boujelben, N.; Bouzid, J. Application of sheep manure and potassium fertilizer to contaminated soil and its effect on zinc, cadmium and lead accumulation by alfalfa plants. Sustain. Environ. Res. 2016, 26, 131–135. [Google Scholar] [CrossRef] [Green Version]
  49. Fernández, D.D.; Csízi, I. The effect of compost made of sheep manure on the first cut of a semi-natural grassland. Acta Agrar. Debr. 2018, 75, 25–29. Available online: https://ojs.lib.unideb.hu/actaagrar/issue/view/97 (accessed on 30 November 2020).
  50. Larcheveque, M.; Desrochers, A.; Larocque, G.R. Comparison of manure compost and mineral fertilizer for hybrid poplar plantation establishment on boreal heavy clay soils. Ann. For. Sci. 2011, 68, 849–860. [Google Scholar] [CrossRef] [Green Version]
  51. Miller, H.G. Forest fertilization: Some guiding concepts. Int. J. For. Res. 1981, 54, 157–167. [Google Scholar] [CrossRef]
  52. Komlenović, N. Primjena gnojiva s produljenim djelovanjem u proizvodnji sadnica primorskih borova (Application of slow-release fertilizers in production of Mediterranean pine seedlings). Šumarski List. 1997, 121, 19–27. [Google Scholar]
  53. O’Skarsson, H.; Sigurgeirsson, A.; Raulund-Rasmussen, K. Survival, growth, and nutrition of tree seedlings fertilized at planting on Andisol soils in Iceland: Six-Year results. For. Ecol. Manag. 2006, 229, 88–97. [Google Scholar] [CrossRef]
  54. McDonald, J. Handbook of Biological Statistics; Sparky House Publishing: Baltimore, MD, USA, 2009; pp. 6–59. [Google Scholar]
  55. Perneger, T.V. What’s wrong with Bonferroni adjustments. Br. Med. J. 1998, 316, 1236–1238. [Google Scholar] [CrossRef] [PubMed]
  56. Moran, M.D. Arguments for rejecting the sequential Bonferroni in ecological studies. Oikos 2003, 100, 403–405. [Google Scholar] [CrossRef]
  57. Klecka, W.R. Discriminant Analysis; SAGE: Newbury Park, CA, USA, 1980. [Google Scholar]
  58. Renou, F.; Scallan, U.; Keane, M.; Farell, E.P. Early performance of native birch (Betula spp.) planted on cutaway peatlands: InXuence of species, stock types and seedlings size. Eur. J. For. Res. 2007. [Google Scholar] [CrossRef]
  59. Larney, F.J.; Angers, D.A. The role of organic amendments in soil reclamation: A review. Can. J. Soil Sci. 2012, 92, 19–38. [Google Scholar] [CrossRef]
  60. Scullion, J.; Malik, A. Earthworm activity affecting organic matter, aggregation and microbial activity in soils restored after opencast mining for coal. Soil Biol. Biochem. 2000, 32, 119–126. [Google Scholar] [CrossRef]
  61. Tomlin, A.D.; Shipitalo, M.J.; Edwards, W.M.; Protz, R. Earthworms and their influence on soil structure and infiltration. In Earthworm Ecology and Biogeography in North America; Hendricks, P.F., Ed.; CRC Press: Boca Raton, FL, USA, 1995; pp. 159–184. [Google Scholar]
  62. Haigh, M.; Woodruffe, P.; D’Aucourt, M.; Alun, E.; Wilding, G.; Fitzpatrick, S.; Filcheva, E.; Noustorova, M. Successful ecological regeneration of opencast coal mine spoils through forestation: From cradle to grove. Minerals 2020, 10, 461. [Google Scholar] [CrossRef]
  63. Filcheva, E.; Hristova, M.; Haigh, M.; Malcheva, B.; Noustorova, M. Soil organic matter and microbiological activity in technosols of Wales. Catena 2021, 201. [Google Scholar] [CrossRef]
Figure 1. Location of the Varteg test plots, south of the UNESCO Blaenavon Industrial Landscape World Heritage Area, SE Wales.
Minerals 11 00624 g001
Figure 2. Orthophotomosaic of part of Varteg test plot area (Ben Sansom, July 2018).
Minerals 11 00624 g002
Table 1. Before and after planting: soil chemistry and target values [25,26].
Soil Chemistry: (Minimum Target Values in mg·kg−1)Before Forestation (Grazed Grass Turf)Change after Forestation (Under Small Trees)Mean Change (mg·kg−1)
Depth (cm):0–1010–2020–300–1010–2020–300–30 cm
Nitrogen (forest: 1000; pasture: 3000)300010001000−10000+10000
Nitrate N (‘Low’ is <10 mg/kg−1)5.55.98.8−0.5−1.2−2.5−1.4
Available Phosphorous (forest: 50,000; pasture: 150,000)0.93.54.8+2.3−1.4−1.4−0.2
Exchangeable Potassium (EC) (‘Very low’ is <75.0 mg·kg−1)776264−1+1+1+0.3
Total Sulfur (5000)1532.1997.9883.1−353.6−227.0−207.4−262.7
Sulfate S (2000)14.712.618.8−2.2+12.4+0.3+3.5
Soil Organic Matter70,00029,00040,000−31,000−3000−6000−13,333
Total Carbon94,00038,00051,000−40,000−10,000−3000−17,667
Organic Carbon (Forest: 22,000; pasture: 19,000)41,00017,00024,000−12,000−2000−4000−6000
Iron (Fe)22,00029,00033,000+5000+5000−4000+0.667
Table 2. Chemical composition of planting media, fertilizer supplements and soil.
Planting MediumVarteg SoilSpent Mushroom Compost (SMC)Sheep Farmyard Manure
(FYM)
Slow-Release Fertlizer + P2O5(SFR)
Chemistrymg·kg−1mg·kg−1per stem (mg)mg·kg−1per stem (mg)mg·kg−1per stem (mg)per stem (mg)
Total N1000–3000240024006000–70006000–7000150,00045004500
N as NO35.5–8.88080n.a.n.a.65,00019501950
N as NH4n.a.n.a.n.a.n.a.n.a.85,00025502550
Total P as P20562–776006001600–20001600–200090,000270010,200
Available P0.9–4.8360360550–660550–66067,00020102010
Total K as K20n.a.310031003000–40003000–400090,00027002700
Available K62–77280028002700–36002700–360090,00027002700
Mg as MgO29–6640040080080030,000900900
Table 3. Survival and tree growth for the whole (Sy96) stand (blue) and also SMC (mushroom) vs. FYM (green). The numbers are the correlation coefficient (bold where significant).
Measure and Year of Record (Yr.)Whole StandSpent Mushroom Compost (SMC)Sheep Farmyard Manure
(FYM)
Comparing
SMC and FYM
Population (n: 2878)MeanStd. Dev.MeanStd. Dev.MeanStd. Dev.Ratio FYM/SMCSig. Dif. p =
Alive (%) Yr. 100.75 0.77 0.72 0.94<0.0005
Alive (%) Yr. 50.79 0.81 0.78 0.960.010
Alive (%) Yr. 30.85 0.85 0.85 1.00ns
Alive (%) Yr. 20.91 0.94 0.89 0.95<0.0005
Alive (%) Yr. 10.95 0.98 0.91 0.93<0.0005
Measure and Year (Yr.) of RecordWhole Stand SMC (Spent Mushroom CompostFYM (Sheep Farmyard Manure)Comparing SMC and FYMMeasure and Year (Yr.) of RecordWhole StandSMC (Spent Mushroom CompostFYM (Sheep Farmyard
Manure)
Population (n: 2878)MeanStd. Dev.MeanStd. Dev.Population (n: 2878)MeanStd. Dev.Mean
Height (cm) Yr. 10468.65175.65474.99172.20456.85161.410.960.018
Height (cm) Yr. 5257.78106.72242.06110.21271.72101.551.12<0.0005
Height (cm) Yr. 3120.5360.30116.8561.99124.4258.231.06<0.0005
Height (cm) Yr. 271.1838.3866.8740.7176.0534.961.14<0.0005
Height (cm) Yr. 145.0717.2242.2422.5748.3520.741.14<0.0005
DBH (mm) Yr. 1045.3624.3948.0228.2442.0417.990.88<0.0005
DBH (mm) Yr. 520.7513.8520.5112.9820.9414.521.020.032
Diam.(mm) Yr. 1079.7440.2282.6744.8875.9532.910.92<0.0005
Diam. (mm) Yr. 542.5723.2143.6425.8241.6020.520.950.032
Diam. (mm) Yr. 319.6711.5719.6711.8719.6611.261.00ns
Diam. (mm) Yr. 211.706.4411.876.6611.516.170.97ns
Diam. (mm) Yr. 18.553.1348.373.238.762.981.05<0.0005
Table 4. Two-tailed significant (p < 0.0005) correlations for the whole stand, SMC- stand and FYM-stand (H: cm; planted trees. Diam.: Basal diameter above the root collar mm, DBH mm).
FertilizerAlive Yr. 10Alive Yr. 5Alive Yr. 3Alive Yr. 2Alive Yr. 1H Yr. 10H Yr. 5H Yr. 3H Yr. 2H Yr. 1DBH Yr. 10DBH Yr. 5Diam. Yr. 10Diam. Yr. 5Diam. Yr. 3Diam. Yr. 2Diam. Yr. 1
All
Fertilizer 0.050.090.08 0.010.060.070.120.140.07 0.15 0.110.13
Alive Yr. 100.05 0.850.720.500.37 0.160.190.250.19 0.11 0.170.210.270.23
H Yr. 100.06 0.660.590.540.560.820.480.800.530.400.330.32
DBH Yr. 100.01 0.070.820.620.590.540.54 0.560.910.610.480.430.40
Diam. Yr. 10 0.800.590.580.520.530.910.53 0.620.510.440.42
SMC
Fertilizer 0.01−0.10−0.19 0.070.110.09 0.15 0.10
Alive Yr. 10 0.850.770.470.29 0.170.330.31 0.110.130.260.26
H Yr. 10 0.08 0.730.660.620.640.830.490.760.490.360.320.25
DBH Yr. 100.15 0.490.820.810.720.510.58 0.540.820.690.640.51
Diam. Yr. 10 0.760.590.630.580.620.940.54 0.610.520.440.41
FYM
Fertilizer 0.110.180.150.070.100.09 0.190.210.08 0.15 0.220.220.17
Alive Yr. 100.11 0.850.670.520.430.050.240.240.20 0.14 0.230.270.280.20
H Yr. 100.09 0.610.500.390.390.800.520.900.590.470.350.46
DBH Yr. 10 0.800.680.560.490.42 0.570.850.610.480.440.42
Diam. Yr. 10 0.900.640.540.460.400.850.54 0.640.500.440.44
Table 5. Survival of SMC- and FYM-stands with fertilizer supplement variants (i.e., SMC-planted and FYM-planted trees) given no SRF, SRF or SRF + P2O5.
AliveSMC MeanS.DSig Dif SRFSig Dif vs. SRF + P2O5FYM MeanS.D.Sig Dif vs. N0 SRFSig Dif. vs. SRF + P2O5No SRF Ratio FYM/SMCSig Dif No-SRF SMC vs. FYM
No SRF
Yr. 100.790.41.nsns0.670.470.016<0.00050.85<0.0005
Yr. 50.830.380.023ns0.710.46ns<0.00050.86<0.0005
Yr. 30.860.340.012ns0.800.40ns0.0010.930.010
Yr. 20.970.18ns<0.0050.880.33<0.0005<0.00050.91<0.0005
Yr. 11.00 <ns<0.0050.900.30<0.0005<0.00050.90<0.0005
SRF
Yr. 100.770.42nsns0.710.46ns0.00050.920.021
Yr. 50.770.420.0230.0030.750.430.06<0.00050.97ns
Yr. 30.810.400.0120.0010.830.38<0.0005<0.00051.02ns
Yr. 20.940.23ns0.0110.860.350.0400.00050.92<0.0005
Yr. 110<ns<0.00050.880.33<0.0005<0.00050.88<0.0005
SRF + P2O5
Yr. 100.770.420.016ns0.800.400.0216<0.00050.92ns
Yr. 50.830.42ns0.0030.900.01ns<0.00051.08<0.0005
Yr. 30.870.40ns0.0010.940.24ns<0.00051.08<0.0005
Yr. 20.910.29<0.0050.0110.940.24<0.0005<0.00051.030.032
Yr. 1930.25<0.0005<0.0005980.14<0.0005<0.00051.05<0.0005
Table 6. Survival by species, compost and fertilizer supplement (blue shading indicates <5% benefit from fertilizer strategy, amber >5% disbenefit).
CompostSMCFYMSMCFYMSMCFYMRATIO to SMC–no SRF
FertilizerNo SRFNo SRFSRFSRFSRF + P2O5SRF + P2O5FYMSMCFYMSMCFYM
Alder (n =)204193135207221223No SRFSRFSRFSRF + P2O5SRF + P2O5
Alive Yr. 100.740.870.760.860.790.900.951.031.161.071.22
Alive Yr. 50.800.900.760.880.860.951.180.951.101.081.19
Alive Yr. 30.860.940.810.880.940.971.130.941.021.091.13
Alive Yr. 20.970.950.970.900.950.981.091.000.930.981.01
Alive Yr. 110.960.970.920.960.990.980.970.920.960.99
Oak. (n =)14660728286112
Alive Yr. 100.740.670.750.630.750.670.411.010.851.010.91
Alive Yr. 50.770.770.750.660.790.880.910.970.861.031.14
Alive Yr. 30.780.830.780.730.890.941.001.000.941.141.21
Alive Yr. 20.950.870.920.800.910.911.060.970.840.960.96
Alive Yr. 11.000.970.920.830.910.940.920.920.830.910.94
Scots Pine (n=)147751718714130
Alive Yr. 100.780.400.670.410.660.300.510.860.530.850.38
Alive Yr. 50.860.400.720.480.660.330.510.840.560.770.38
Alive Yr. 30.880.560.720.480.700.400.470.820.550.800.45
Alive Yr. 20.960.560.880.480.790.440.640.920.500.820.46
Alive Yr. 11.000.681.000.590.830.890.581.000.590.830.89
Silver birch (n=)130365255220220165
Alive Yr. 100.920.630.840.700.840.820.680.910.910.910.89
Alive Yr. 50.920.660.860.770.900.940.720.930.980.981.02
Alive Yr. 30.960.770.880.950.910.970.800.920.950.951.01
Alive Yr. 21.000.900.980.980.931.000.900.980.930.931.00
Alive Yr. 11.000.901.000.980.931.000.901.000.930.931.00
Table 7. Comparison of SMC- and FYM-planted trees given no additional fertilizer (no SRF). (Nb: Yr.: Year of record; height (cm); DBH (mm); Diam. Diameter above the root collar (mm), Sig. significant difference p =; leader in SMC or FYM categories emboldened).
No SRF MetricSMC MeanS.D.Sig. Dif. SRFSig Dif. vs. SRF + P2O5FYM MeanS.D.Sig. Dif. vs. SRFSig. Dif. vs. SRF + P2O5No-SRF Ratio FYM/SMCNo-SRF Sig. Dif. SMC vs. FYM
Height Yr. 10454.72165.77<nsns402.03164.360.010<0.00050.88<0.0005
Height Yr. 5239.36103.32ns0.002268.1289.40ns<0.00051.12<0.0005
Height Yr. 3111.8259.91ns0.004111.5355.12nsns1.00ns
Height Yr. 262.7239.64nsNs < 0.000568.0932.83ns0.0121.090.012
Height Yr. 140.2622.33ns0.00244.5917.560.002<0.00051.11<0.0005
DBH Yr. 1042.6121.780.0005Ns41.1016.64nsns0.96ns
DBH
Yr. 5
17.5912.17<0.0005ns17.8410.56nsns1.01ns
Diam. Yr. 1075.4644.17<0.0005ns74.8631.84<0.0005ns0.99ns
Diam. Yr. 543.3027.74<nsns41.5720.080.007ns0.96ns
Diam. Yr. 320.3911.83nsns16.8810.500.002<0.00050.83<0.0005
Diam. Yr. 211.756.56ns<ns10.285.75<0.0005<0.00050.87<ns
Diam. Yr. 18.033.20ns<0.00058.102.900.012ns1.01ns
Table 8. Comparison of SMC- and FYM-planted trees given additional SRF (Nb: height (H): cm; DBH: mm, Diam: (diameter above root collar): mm, ns: differences not significant).
SRFSMC MeanS.D.Sig. Dif. No SRFSig Dif. SRF Plus P2O5FYM MeanS.D.Sig. Dif. No SRFSig Dif. SRF Plus P2O5Ratio SMC/FYMSig. Dif. SMC vs. FYM
H
Yr. 10
497.63185.30<ns<0.0005493.06158.44<0.00050.0240.99ns
H
Yr. 5
230.58114.00ns<0.0005271.71104.97<0.0005ns1.18<0.0005
H
Yr. 3
115.3360.58nsns127.257.79<0.0005<0.00111.100.002
H
Yr. 2
64.4440.28ns<0.000578.135.60<0.00050.0071.21<0.0005
H
Yr. 1
42.4523.94nsns52.6923.840.0010.0021.24<0.0005
DBH Yr.
10
57.3831.52<0.0005<0.000545.3219.170.005<0.00050.79<0.0005
DBH
Yr. 5
23.3513.24<0.0005ns22.7111.06<0.0005ns0.97ns
Diam. Yr. 1097.3150.10<0.0005<0.000580.0432.78<0.00050.0010.82<0.0005
Diam
Yr. 5
43.8724.47<nsns40.5619.55<0.0005ns0.92<0.0005
Diam. Yr.
3
18.9111.93nsn20.0710.860.1830.0011.06Ns
Diam. Yr.
2
11.846.51nsns11.376.56<0.0005<0.00050.96Ns
Diam. Yr.
1
8.253.08ns0.0029.162.95<0.0005ns1.11<0.0005
Table 9. Comparison of SMC- and FYM-planted trees given additional two-year slow-release fertilizer tablets plus superphosphate (SRF + P2O5) (Nb: height (H): cm; DBH: mm, Diam: (diameter above root collar): mm, ratio FYM/SMC, ns: differences not significant).
SRF + P2O5SMC MeanS.D.Sig. Dif. No SRFSig Dif. SRF Plus P2O5FYM MeanS.D.Sig. Dif. No SRFSig Dif. SRF Plus P2O5Ratio SMC/FYMSig. Dif. SMC vs. FYM
H Yr. 10473.36163.470.008s0.028459.15205.790.010<0.00050.97ns
H
Yr. 5
264.55111.42ns<0.0005275.31109.16ns0.0261.04ns
H
Yr. 3
122.9764.72nsns137.0559.33ns0.0101.11<0.005
H
Yr. 2
73.6041.44ns 84.3234.78ns0.0071.15<0.005
H
Yr. 1
44.0921.210.002ns48.4019.910.0020.0021.100.001
DBH
Yr. 10
44.2628.31ns<0.00538.9117.72ns<0.00050.880.004
DBH
Yr. 5
21.49012.96nsns22.5219.68nsns1.05ns
Diam.
Yr. 10
76.07036.663<0.0005<0.00571.8134.25<0.00050.0010.94ns
Diam.
Yr. 5
43.7824.950.007ns42.7021.860.007ns0.98ns
Diam.
Yr. 3
19.66011.830.002ns22.6111.790.0020.0011.15<0.0005
Diam.
Yr. 2
12.026.91<0.0005ns13.335.830<0.0005<0.00051.110.002
Diam.
Yr. 1
8.833.380.0120.0029.192.980.012ns1.04ns
Table 10. Comparison of Alder growth with SMC or FYM planting compost and fertilizer. (Nb: height (H) cm; DBH: mm, Diam. (diameter above root collar): mm, ratio FYM/SMC, ns: differences not significant).
ALDERNo SRFSRFSRF + P2O5
SMC (n = 204)FYM (n = 184)No SRFSMC (n = 189)FYM (n = 132)SRFSMC (n = 196)FYM (n = 218)SRF + P2O5
Metric–YearMean (Std. Dev.)Mean (Std. Dev).Sig. Dif.Mean (Std. Dev.)Mean (Std. Dev.)Sig. Dif.Mean (Std. Dev.)Mean (Std. Dev.)Sig. Dif
H.
Yr. 10
514.68 (139.87)451.58 (149.11)<0.0005535.37 (132.74)526.38 (117.90)ns536.47 (127.90)484.92 (149.24)0.001
Diam.
Yr. 10
81.11 (45.31)85.61 (29.77) 105.84 (37.13)84.09 (24.44)<0.000581.64 (27.09)79.95 (24.74)ns
DBH
Yr. 10
46.37 (18.10)45.92 (14.62) 62.95
(40.56)
47.90
(16.65)
<0.000548.55
(17.02)
41.62 (13.91)<0.0005
H.
Yr. 5
307.15 (90.47)339.48 (61.17)<0.0005334.56 (76.37)341.93
(69.36)
ns354.69
(83.83)
337.39 (77.36)ns
Diam.
Yr. 5
59.49 (30.65)61.71 (15.49) 71.72
(27.74)
56.91
(14.81)
<0.000567.54
(21.87)
58.59
(16.10)
0.001
DBH
Yr. 5
25.09 (12.36)27.20
(9.32)
33.55
(13.36)
29.86 (10.15)0.02132.83 (10.52)29.83 (23.02)ns
H.
Yr. 3
154.93 (61.25)157.15 (47.34) 176.14 (54.05)171.78 (43.77)ns176.12 (54.92)167.84 (49.43)ns
Diam.
Yr. 3
28.88 (12.81)28.01
(9.16)
32.94
(12.87)
30.91
(8.90)
ns29.94 (12.02)30.91
(9.86)
ns
H.
Yr. 2
86.09 (43.70)96.66 (56.93)0.04697.57 (43.53)99.03 (31.15)ns107.82 (37.72)99.95 (30.86)0.022
Diam.
Yr. 2
16.39 (19.39)16.56 (12.01) 20.46
(23.29)
16.90
(6.60)
ns18.16
(7.34)
16.76
(5.50)
0.030
H.
Yr. 1
46.14 (19.09)43.62 (15.99) 49.49
(20.17)
47.35 (16.45) 50.54 (18.99)45.61 (16.99)0.006
Diam.
Yr. 1
8.80
(3.63)
10.02
(3.27)
0.00110.26
(3.88)
10.47
(3.41)
ns11.16
(3.62)
10.42
(3.25)
ns
Table 11. Comparison of Oak with SMC- or FYM-planting compost and fertilizer. (Nb: height (H) cm; DBH: mm, Diam. (diameter above root collar): mm; ratio FYM/SMC; ns: differences not significant).
OAKNo SRFSRFSRF + P2O5
SMC (n = 204)FYM (n = 184)No SRFSMC (n = 189)FYM (n = 132)SRFSMC (n = 196)FYM (n = 218)SRF + P2O5
Metric–YearMean (Std. Dev.)Mean (Std. Dev).Sig. Dif.Mean (Std. Dev.)Mean (Std. Dev.)Sig. Dif.Mean (Std. Dev.)Mean (Std. Dev.)Sig. Dif
H.
Yr. 10
339.56
(110.90)
314.00
(36.77)
323.95
(131.90)
313.27
(119.45)
308.19
(117.59)
338.95
(169.92)
Diam.
Yr. 10
34.57
(14.78)
53.81
(18.00)
<0.000540.41
(21.46)
37.23
(17.15)
35.93
(19.48)
37.18
(18.62)
DBH
Yr. 10
21.82
(9.74)
28.05
(9.67)
0.01624.63
(12.84)
21.65
(11.22)
19.94
(10.65)
22.67
(15.51)
H.
Yr. 5
139.58
(58.03)
147.40
(50.68)
110.48
(68.60)
132.74
(67.76)
145.86
(70.79)
113.72
(53.95)
0.011
Diam.
Yr. 5
13.31
(6.04)
20.60
(7.91)
<0.000518.04
(12.64)
14.33
(5.88)
19.90
(13.33)
14.79
(6.90)
0.025
DBH
Yr. 5
4.63
(3.60)
4.90
(3.38)
7.00
(3.84)
7.78
(3.80)
8.58
(6.72)
3.93
(2.95)
0.003
H.
Yr. 3
50.22
(21.42)
42.25
(18.31)
0.02644.42
(26.90)
38.63
(20.00)
50.26
(36.64)
38.07
(20.23)
0.010
Diam.
Yr. 3
9.22
(3.31)
8.54
(3.28)
8.25
(3.04)
8.87
(4.26)
8.81
(5.03)
9.26
(7.41)
H.
Yr. 2
28.37
(19.32)
30.32
(19.09)
23.59
(12.46)
24.65
(12.53)
23.78
(12.34)
23.78
(12.34)
Diam.
Yr. 2
6.03
(2.99)
6.08
(2.08)
7.19
(2.92)
5.06
(1.74)
<0.00055.57
(1.88)
6.70
(2.66)
0.003
H.
Yr. 1
20.13
(7.56)
21.66
(11.61)
17.50
(7.16)
23.08
(11.91)
0.00118.04
(7.15)
20.42
(7.96)
Diam.
Yr. 1
5.17
(1.70)
6.59
(2.26)
<0.00055.58
(1.55)
7.09
(1.80)
<0.00055.96
(1.99)
5.96
(1.81)
Table 12. Comparison of Scots Pine with SMC- or FYM-planting compost and fertilizer. (Nb: height (H) cm; DBH: mm, Diam. (diameter above root collar): mm; ratio FYM/SMC; ns: differences not significant).
SCOTS PINENo SRFSRFSRF + P2O5
SMC (n = 204)FYM (n = 184)No SRFSMC (n = 189)FYM (n = 132)SRFSMC (n = 196)FYM (n = 218)SRF + P2O5
Metric–YearMean (Std. Dev.)Mean (Std. Dev).Sig. Dif.Mean (Std. Dev.)Mean (Std. Dev.)Sig. Dif.Mean (Std. Dev.)Mean (Std. Dev.)Sig. Dif
H.
Yr. 10
331.13
(66.57)
237.25
(117.11)
0.019338.12
(85.98)
270.00
(54.34)
<0.0005337.32
(111.79)
321.00
(244.19)
Diam.
Yr. 10
70.87
(26.20)
53.80
(21.11)
0.00176.45
(36.29)
60.25
(27.82)
0.01577.45
(35.93)
56.00
(48.35)
DBH
Yr. 10
37.35
(14.91)
28.30
(13.56)
0.00345.35
(23.20)
33.90
(16.44)
0.00336.07
(18.30)
36.50
(7.12)
H.
Yr. 5
171.25 (56.60)112.13
(38.09)
<0.0005119.28
(34.81)
132.50
(31.33)
0.032157.94
(66.93)
99.75
(39.34)
0.006
Diam. Yr. 547.97
(20.62)
28.13
(13.00)
<0.000533.08
(14.86)2
29.29
(11.89)
36.56
(18.90)
25.25
(13.26)
DBH
Yr. 5
13.78
(7.59)
8.67
(2.78)
<0.000515.45
(8.09)
12.67
(5.24)
13.30
(5.03)
8.00
(0.05)
<0.0005
H.
Yr. 3
86.73
(23.92)
48.00
(15.87)
<0.000561.47
(23.18)
59.21
(17.89)
75.29
(27.34)
76.00
(63.62)
Diam.
Yr. 3
22.25
(9.15)
9.77
(3.56)
<0.000515.59
(5.92)
12.71
(3.93)
0.00120.21
(7.38)
15.00
(12.16)
H.
Yr. 2
45.73
(18.80)
33.70
(6.14)
<0.000533.21
(18.39)
33.36
(15.07)
44.94
(18.84)
37.00
(1.10)
<0.0005
Diam.
Yr. 2
13.33
(5.18)
8.40
(5.86)
<0.000510.54
(4.26)
6.79
(3.38)
<0.000511.22
(4.26)
7.50
(1.64)
0.001
H.
Yr. 1
30.42
(8.37)
27.53
(9.59)
ns26.19
(9.41)
29.53
10.62)
0.03534.54
(6.42)
26.43
(4.77)
<0.0005
Diam.
Yr. 1
9.47
(2.76)
6.53
(1.16)
<0.00058.55
(1.80)
6.47
(1.90)
<0.00059.31
(2.42)
6.43
(0.93)
<0.0005
Table 13. Comparison of Silver Birch with SMC- or FYM-planting compost and fertilizer. (Nb: height (H) cm; DBH: mm, Diam. (diameter above root collar): mm; ratio FYM/SMC; ns: differences not significant).
SILVER BIRCHNo SRFSRFSRF + P2O5
SMC (n = 204)FYM (n = 184)No SRFSMC (n = 189)FYM (n = 132)SRFSMC (n = 196)FYM (n = 218)SRF + P2O5
Metric–YearMean (Std. Dev.)Mean (Std. Dev).Sig. Dif.Mean (Std. Dev.)Mean (Std. Dev.)Sig. Dif.Mean (Std. Dev.)Mean (Std. Dev.)Sig. Dif
H.
Yr. 10
600.33
(145.18)
400.29
(163.76)
<0.0005610.54
(163.33)
591.32
(113.64)
557.73
(131.15)
491.06
(258.37)
0.023
Diam.
Yr. 10
109.50
(43.42)
73.54
(32.95)
<0.0005118.58
(51.82)
94.45
(31.96)
<0.000588.35
(38.73)
77.11
(40.86)
0.027
DBH
Yr. 10
60.46
(22.14)
41.65
(17.38)
<0.000568.26
(25.84)
51.61
(18.09)
<0.000553.74
(37.50)
42.17
(20.62)
0.007
H.
Yr. 5
303.55
(63.20)
254.20
(64.87)
<0.0005282.45
(80.11)
276.03
(76.53)
284.45
(72.39)
265.26
(81.84)
Diam.
Yr. 5
42.00
(17.52)
34.11
(14.32)
<0.000544.24
(16.72)
34.36
(12.254)
<0.000535.65
(15.22)
33.77
(15.01)
DBH
Yr. 5
17.80
(10.85)
13.24
(6.68)
<0.000521.03
(10.46)
17.13
(6.24)
<0.000516.95
(9.90)
15.79
(8.13)
H.
Yr. 3
130.21
(46.49)
102.71
(39.70)
<0.0005131.05
(40.13)
127.27
(32.81)
125.68
(43.62)
136.97
(28.48)
0.004
Diam.
Yr. 3
16.33
(6.51)
12.09
(6.04)
<0.000516.33
(9.15)
15.22
(5.20)
14.08
(5.89)
16.97
(5.31)
<0.0005
H.
Yr. 2
81.60
(29.72)
62.73
(25.41)
<0.000575.38
(30.09)
84.14
(20.47)
<0.000577.35
(24.81)
84.66
(18.55)
0.002
Diam.
Yr. 2
10.88
(3.93)
7.97
(3.51)
<0.000510.29
(4.14)
9.30
(3.76)
0.0089.22
(3.19)
10.90
(3.38)
<0.0005
H.
Yr. 1
65.20
(21.59)
51.93
(14.56)
<0.000556.14
(23.64)
72.17
(16.63)
<0.000557.97
(18.05)
63.03
(13.06)
0.003
Diam.
Yr. 1
8.40
(2.05)
7.47
(2.32)
<0.00057.78
(2.82)
9.26
(2.30)
<0.00057.76
(2.31)
8.85
(1.80)
<0.0005
Table 14. FYM/SMC ratio with SMC no SRF. This shows differences in growth between planting with SMC alone and planting with FYM and/or fertilizer supplements. (Amber indicates that the differences are >5% negative and blue >5% positive).
Yr Ratio SMC No SRF to FYM No SRFRatio SMC No SRF to SMC SRFRatio SMC No SRF to FYM SRFRatio SMC No SRF to SMC SRF + PRatio SMC No SRF to FYM SRF + P
Alder10Height (cm)0.881.041.021.040.94
Diam. (mm)1.061.001.041.010.99
DBH (mm)0.991.361.031.050.90
5Height (cm)1.111.091.111.151.10
Diam. (mm)1.041.210.961.140.98
DBH (mm)1.081.341.191.311.19
3Height (cm)1.011.141.111.141.08
Diam. (mm)0.971.141.071.041.07
2Height (cm)1.121.131.151.251.16
Diam. (mm)1.011.251.031.111.02
1Height (cm)0.951.071.031.100.99
Diam. (mm)1.141.171.191.271.18
Oak10Height (cm)0.920.950.920.911.00
Diam. (mm)1.561.171.081.041.08
DBH (mm)1.291.130.990.911.04
5Height (cm)1.060.790.951.040.81
Diam. (mm)1.551.361.081.501.11
DBH (mm)1.061.511.681.850.85
3Height (cm)0.840.880.771.000.76
Diam. (mm)0.930.890.960.961.00
2Height (cm)1.070.830.870.840.00
Diam. (mm)1.011.190.840.921.11
1Height (cm)1.080.871.150.901.01
Diam. (mm)1.271.081.371.151.15
Scots Pine10Height (cm)0.721.020.821.020.97
Diam. (mm)0.761.080.851.090.79
DBH (mm)0.761.210.910.970.98
5Height (cm)0.650.700.770.920.58
Diam. (mm)0.590.690.610.760.53
DBH (mm)0.631.120.920.970.58
3Height (cm)0.550.710.680.870.88
Diam. (mm)0.440.700.570.910.67
2Height (cm)0.740.730.730.980.81
Diam. (mm)0.630.790.510.840.56
1Height (cm)0.900.860.971.140.87
Diam. (mm)0.690.900.680.980.68
Silver Birch10Height (cm)0.671.020.980.930.82
Diam. (mm)0.671.080.860.810.70
DBH (mm)0.691.130.850.890.70
5Height (cm)0.840.930.910.940.87
Diam. (mm)0.811.050.820.850.80
DBH (mm)0.741.180.960.950.89
3Height (cm)0.791.010.980.971.05
Diam. (mm)0.741.000.930.861.04
2Height (cm)0.770.921.030.951.04
Diam. (mm)0.730.950.850.851.00
1Height (cm)0.800.861.110.890.97
Diam. (mm)0.890.931.100.921.05
Publisher’s Note: MDPI stays neutral with regard to jurisdictional claims in published maps and institutional affiliations.

