Article

The Relationship between Natural Pyrite and Impurity Element Semiconductor Properties: A Case Study of Vein Pyrite from the Zaozigou Gold Deposit in China

1
School of Earth Sciences and Resources, China University of Geosciences, Beijing 100083, China
2
Shandong Earthquake Agency, Jinan 250014, China
*
Author to whom correspondence should be addressed.
Minerals 2021, 11(6), 596; https://doi.org/10.3390/min11060596
Submission received: 28 April 2021 / Revised: 29 May 2021 / Accepted: 31 May 2021 / Published: 1 June 2021

Abstract

:
Pyrite is a common sulfide mineral in gold deposits, and its unique thermoelectricity has received extensive attention in the field of gold exploration. However, there is still a lack of detailed research and direct evidence about how impurity elements affect mineral semiconductor properties. In this paper, combined with first-principles calculations, laser ablation inductively coupled plasma mass spectrometry (LA-ICP-MS) mapping technology and in situ Seebeck coefficient scanning probe technology were used to study the law of changing semiconductor properties in pyrite containing impurity elements such as As, Co, Ni, and Cu. The results showed that pyrite containing arsenic is a P-type semiconductor, and pyrites containing Ni, Co, Cu, and other elements are N-type semiconductors. When P-type pyrites containing As were supplemented with Ni, Cu, and other elements, the semiconductor type changed to N-type. However, Co addition did not change the semiconductor type of arsenic-rich pyrite. Pyrite formed under different temperature conditions tended to be enriched with different combinations of impurity elements, leading to the relative accumulation of P-type or N-type pyrites.

1. Introduction

Pyrite (FeS2) is a semiconducting mineral that is widely distributed in the interior of the earth [1,2,3,4]. In recent years, thermoelectric properties and their changes have been extensively studied [5,6,7,8,9,10,11,12,13]. According to semiconductor theory, pyrite can be divided into two types, namely P-type semiconductors and N-type semiconductors, based on the type of carriers (including holes and electrons, where holes represent positive charges and electrons represent negative charges) and their conductivity types. When the carrier is a hole, the material is called a P-type semiconductor. When the carrier is an electron, the material is called an N-type semiconductor. In all respects, the concentration or number of carriers and the carrier mobility significantly affect the pyrite conductivity type and conductivity value. This characteristic can be proven based on the Seebeck coefficient. The Seebeck coefficient refers to the semiconductor mineral under the condition of temperature differences. The nonequilibrium carrier formed by temperature differences diffuses from the high temperature to the low temperature, resulting in the formation of an electrical field in the semiconductor and creating the thermoelectromotive force (E). When the temperature difference is fixed, E attains an equilibrium value. The thermoelectric coefficient is the thermoelectric power per unit of temperature difference [14].
Thermoelectric properties of pyrite in gold deposits are related to the spatial distribution and formation temperature of pyrite: the pyrite formed at lower temperatures or the upper part of the ore body is mostly P-type; the pyrite formed under high-temperature conditions or the lower part of the ore body is mostly N-type. According to this correlation, many scholars have achieved good prospecting results in the exploration of gold deposits, especially in the deep prospecting and prediction [5,6,14,15,16].
Since the type and carrier concentration in a natural semiconductor mineral is mainly affected by the impurity element type and content contained in the crystals [17], most natural pyrites may contain a variety of impurity elements due to crystals originating from fluids. Such crystals include As, Co, Ni, and Cu, as well as Pb, Zn, Sb, Te, etc. Clearly, these impurity elements may strongly affect the semiconductor properties of pyrite [13]. After studying the relationship between the semiconductor properties of natural pyrite and impurity elements, previous researchers [18,19,20] have generally concluded that As can strongly affect the thermal conductivity type of pyrite, inducing a P-type semiconductor.
However, it is still not clear how the thermoelectric properties of pyrite change upon the combination with other impurity elements (such as Co, Ni, Cu, etc.). Although some studies [18,19,21,22] have been conducted to consider a single impurity element variable regarding the semiconductor properties of pyrite based on experimental synthesis and simulation calculations, refined research of natural pyrite samples on this topic still needs to be improved.
In this paper, through an in situ laser ablation inductively coupled plasma mass spectrometry (LA-ICP-MS) composition test of pyrite and an in situ micro-area Seebeck coefficient test, two sets of relevant data concerning isotopic trace elements and the Seebeck coefficient of pyrite were obtained. Likewise, the relationship between the thermoelectric properties of pyrite and impurity elements composition was further discussed. This is the first study on the relationship between the thermoelectric properties of natural pyrite and impurity elements on a small scale(μm). Additionally, based on the first-principles simulation calculation method, the influences of several impurity elements, As, Co, Ni, and Cu, on pyrite electronic structures and conductivity types were analyzed. In summary, according to the abovementioned measured-data analysis and simulation–calculation structure, evidence regarding the influence of trace elements on the thermoelectric properties of natural pyrite was obtained, and the law of the trace-element influence on the thermoelectric properties of natural pyrite was discussed. Based on this study, the relationship among the thermoelectric properties, impurity elements, and forming temperature of pyrite was discussed.

2. Experimental and Calculation Methods

2.1. Sample Preparation

The sample was obtained from the Zaozigou gold deposit in Gansu Province, China; it was vein-like pyrite that developed in the surrounding rock fissures of the Zaozigou gold deposit. Quartz crystals were observed on both sides of the sample. The thickness of the sample was approximately 500–800 μm along the growth direction. The sample was sliced and polished to the vein wall perpendicularly and along the growth direction to clearly demonstrate that pyrite has the characteristics of sequential growth in multiple stages (Figure 1). According to previous research results [23], 0 μm is the starting point of pyrite vein growth, and 630 μm is the endpoint.

2.2. In Situ Seebeck Coefficient Measurement

The Seebeck coefficient measurements of pyrite veinlets were carried out under a potential Seebeck microscope (PSM-II) at the Hangzhou Innovation Institute, Beihang University (China). This instrument was jointly developed by the German Aerospace Center and Panco of Germany; it can measure the spatial distribution of the Seebeck coefficient in a sample and is usually used to check the uniformity of semiconductor materials [24,25,26]. In this study, the instrument was applied to the measurement of natural pyrite veins to observe the in situ Seebeck coefficient changes on the growth profile of pyrite veins (Figure 1).
The PSM-II test was carried out at room temperature. After confirming the test area, the instrument automatically performed a point-by-point test. The time during which each test probe was in contact with the sample surface was approximately 4 s. The measurement accuracy of the potential signal of this instrument is 100 nV, and the measurement error of the Seebeck coefficient is less than 3%. In this measurement, the distance between each measurement point was set to 10 μm, and the temperature difference programmed for each measurement was 17 K.

2.3. LA-ICP-MS Mapping

Laser ablation inductively coupled plasma mass spectrometry (LA-ICP-MS) mapping was performed using a 193 nm ArF excimer laser (Photon Machines Analyte 193) equipped with an Agilent 7900 quadrupole inductively coupled mass spectrometer at the Mineral Microanalysis Laboratory of the Ore Deposit and Exploration Centre, Hefei University of Technology (Hefei, China).
The methodology is described in detail in [27] and is briefly introduced below. The sample was ablated in an atmosphere of ultrahigh purity He, which was used as a carrier gas (0.9 L/min), and the resulting aerosol was mixed with Ar (0.87 L/min) prior to introduction into the mass spectrometer. Ablation was performed with an energy density of 3 J/cm2 and a laser-pulse frequency of 8 Hz. The laser spot size ranged from 20 to 30 μm, depending on the size of the pyrite grains. During mapping, the following isotopes were monitored: 34S, 51V, 53Cr, 55Mn, 57Fe, 59Co, 60Ni, 65Cu, 66Zn, 75As, 95Mo, 107Ag, 118Sn, 121Sb, 197Au, 205Tl, 208Pb, and 209Bi.
LA-ICP-MS mapping for trace elements is an effective technique for visualizing trace element distributions and relative concentrations within individual minerals [28,29,30]. Trace element mapping was performed by ablating multiple parallel lines arranged in a grid across the sample surface. The laser spot size was modified to match the distance between adjacent lines based on the desired sensitivities of the elements of interest and the spatial resolution. The laser beam scan speed for each line was equal to the beam size per second. LA-ICP-MS trace element maps were generated over a period of 1.5 to 2 h to keep the sensitivity of the instrument drift to a minimum. Trace element spot analyses and maps obtained by LA-ICP-MS were processed using in-house IOLITE [31] and LIMS [27] reduction software. Analyses of the pyrite were calibrated using NIST610 glass and a MASS-1 [32] synthetic sulfide reference material. In addition, the total Fe concentrations obtained previously by electron probe microanalysis (EPMA) were used as the internal standard.

2.4. First-Principles Calculation

The purpose of the first-principles calculation method is to understand the multiatomic system as a multielectron system composed of electrons and nuclei (atomic entities), calculate the molecular structure and molecular (or ionic) energy according to the basic principles of quantum mechanics, and describe the interactions between atoms. Such a description of the atomic interactions is then used to obtain the structural information of the material and the electrical properties related to the electronic structure. First-principles calculations have been widely used in theoretical research on thermoelectric materials [33]. According to the calculation results, the semiconductor properties of a mineral containing different impurity elements can be easily determined.
These calculations were performed using the program Quantum Espresso [34]. The Perdew−Burke−Ernzerhof (PBE) exchange-correlation method [35] was employed. The ultrasoft pseudopotential plane wave function [36] was used to describe the multielectron systems. These pseudopotential files were from the Quantum Espresso pseudopotential library. The plane wave cut-off energy and charge density cut-off energy of pyrite used in this calculation were 50 Ry and 500 Ry, respectively. The convergence tolerances for the geometric optimization calculations were set to the maximum force of 10−4 Ry/a.u. A Monkhorst–Pack k-point sampling density of 2 × 4 × 4 was used when optimizing the cell [37], and this density was 5 × 9 × 9 when calculating the density of states (DOS).

3. Results

3.1. Distribution of Pyrite Seebeck Coefficients

The pyrite Seebeck coefficient in situ micro-zone measurement included a total of 64 sampling points (Table 1). Of these sampling points, 28 points showed N-type characteristics, for which the Seebeck coefficients varied from –47.45 to –0.60 μV/K, and the average value was –10.53 μV/K. Conversely, 36 points presented P-type characteristics, for which the Seebeck coefficients varied from 0.38~151.39 μV/K, and the average value was 30.01 μV/K. Compared to the Seebeck coefficient values of N-type pyrite, the Seebeck coefficient values of P-type pyrite exhibited more fluctuations.
According to the semiconducting properties of pyrite, in accordance with the growth sequence of the pyrite veinlet growth profile, pyrite could be clearly divided into four zones, named Py1, Py2, Py3, and Py4 (Figure 2). Among them, the pyrite in Py1 was mostly P-type, the absolute value of the corresponding Seebeck coefficient was small, and the range of coefficient variation was −4.77~12.39 μV/K. The thermoelectric properties of pyrite in Py2 varied greatly, with P-type and N-type properties appearing alternately, so that the absolute value of the corresponding Seebeck coefficient was also larger, showing a coefficient range of −47.45~151.39 μV/K. All pyrites in Py3 were N-type, the absolute value of the corresponding Seebeck coefficient was small, and the coefficient variation range was –10.52~−4.05 μV/K. The pyrite in Py4 was mostly P-type, and the corresponding Seebeck coefficient varied from −9.08 to 66.87 μV/K, the values of which were smaller than those of the P-type pyrite in Py2.

3.2. Impurity Distributions in Pyrite

A 1322 × 646 μm rectangular area was selected on the pyrite vein sample as the analysis area for LA-ICP-MS mapping. Impurity element concentration data on the Seebeck coefficient analysis profile line within this area was collected (Figure 3) to study the relationships between the impurity elements in the pyrite lattice and the Seebeck coefficients. Before determining the type of impurity elements to analyze, impurity elements with large ion radii were excluded because of the uncertainty regarding whether they could enter the pyrite lattice (such as Pb, Sb, Tl, etc.). The impurity elements (such as Mn, Zn, Mo, etc.) that appeared in only certain positions were also excluded. Finally, As, Co, Ni, and Cu were identified as the research objects. On the profile line, the concentration range of the As element was 943~25,376 ppm, with an average of 11,351 ppm; the concentration range of the Co element was 1.1~279 ppm, with an average of 85 ppm; the concentration range of the Ni element was 16~2128 ppm, with an average of 302 ppm; the concentration range of the Cu element was 13~71 ppm, with an average of 29 ppm.
According to the changes in impurity element compositions, the inside of pyrite veins could also be clearly divided into four bands. The spatial distribution positions of such changes were the same as those of the Seebeck coefficient. Therefore, we adopted a unified naming convention, Py1, Py2, Py3, and Py4 (Figure 3).
According to the growth sequence of pyrite veins, the impurity elements showed zonal changes (Figure 3). The impurity element combination of Py1 veins was mainly enriched with Co, As, and Cu. The combination of impurity elements in the Py2 vein was mainly abundant in As and Ni. Compared with Py1, the As concentration was higher in the Py2 vein. It is worth noting that narrow high-concentration bands of Ni appeared in Py2, as well as local high-concentration bands of Co. The concentration of impurity elements in Py3 was very low. The impurity element combination of the Py4 vein consisted mainly of As, Cu, Ni, and Co.

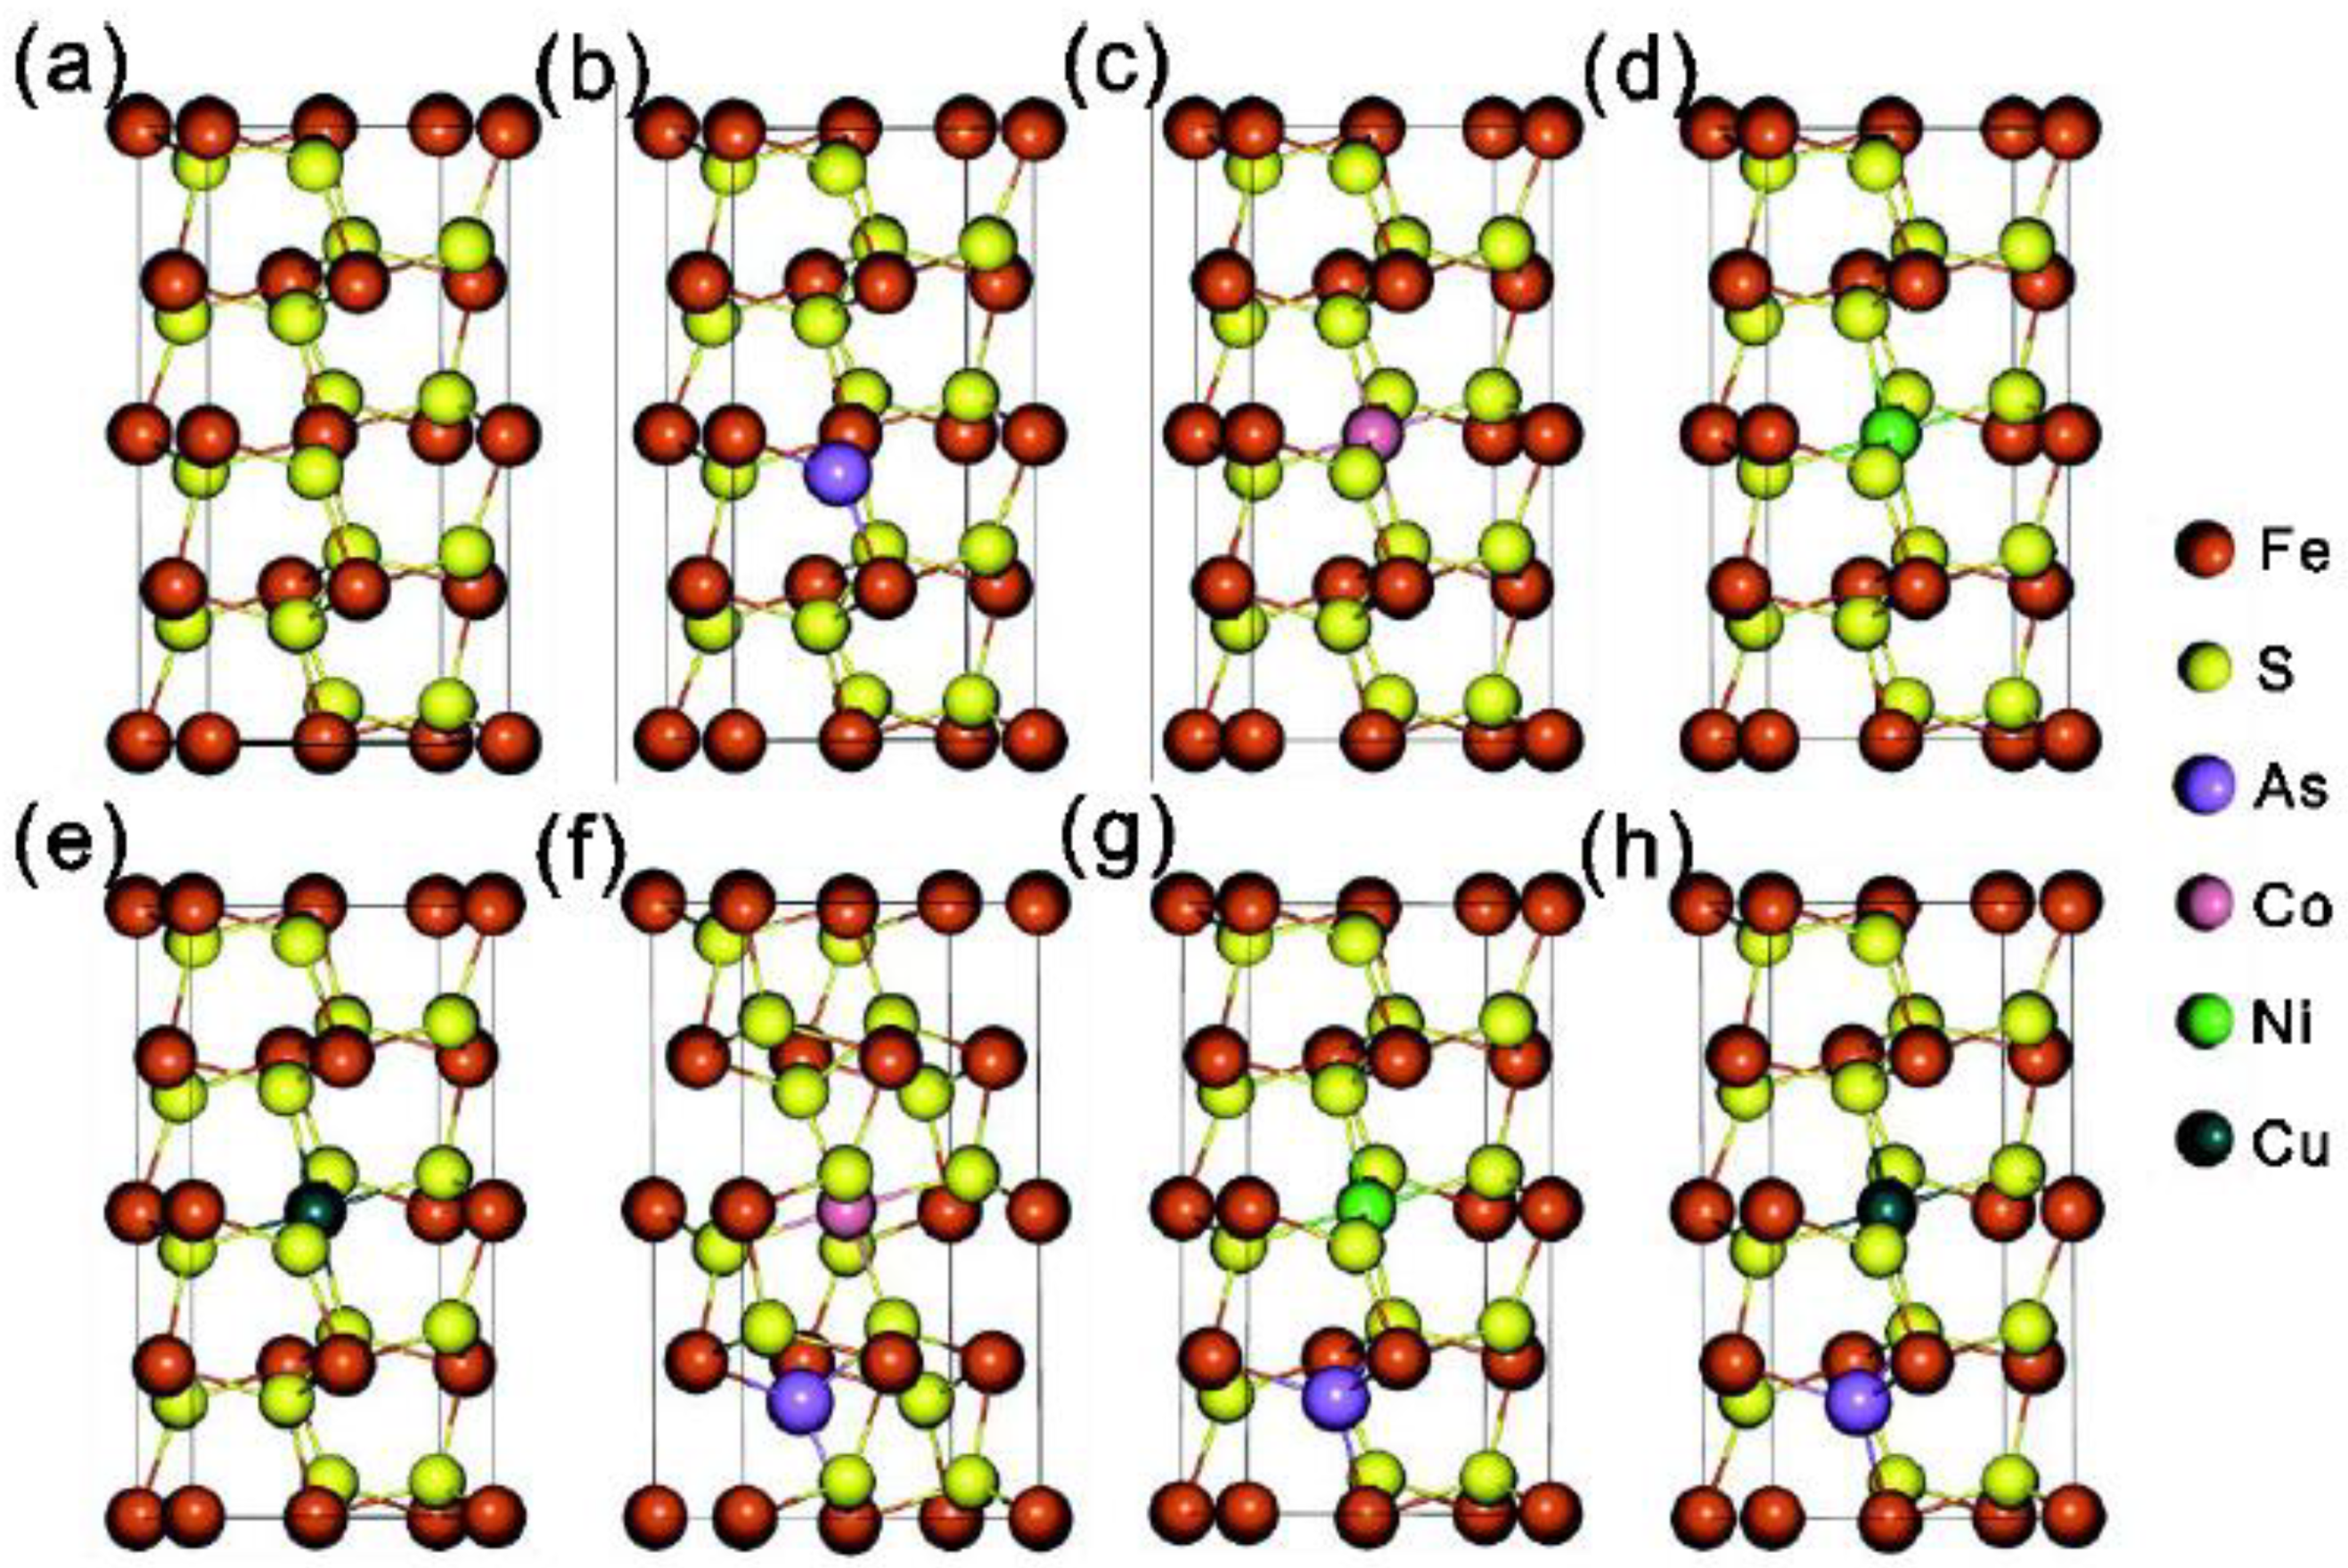
3.3. Calculation of The Crystal Structures and Electronic Structures of Pyrite under Different Doping Conditions

Pyrite has a cubic crystal structure and belongs to the equiaxed crystal system, the space group of which is Pa3 with a NaCl-type extensional structure. Each unit cell contains 12 atoms, and two S atoms form a dumbbell-shaped parasulfur S2. The center of the S2 pair is located in the Cl position in a NaCl-type structure, and a Fe atom is located in the Na position. To study the influence of different trace elements on the semiconductor properties of pyrite, 2 × 1 × 1 supercells of pyrite were constructed (Figure 4) and doped with a cobalt atom, a nickel atom, and a copper atom near the middle of each supercell to replace the iron atom. An arsenic atom was also doped in the place of the sulfur atom. A cobalt atom, a nickel atom, a copper atom, and an arsenic atom were also simultaneously incorporated into the pyrite supercell.
The pure pyrite primitive cell constant calculated in this study was 5.407 Å, and the primitive cell volume was 158.077 Å3. This calculation result was in good agreement with other experimental and calculation results. The unit cell volumes of pyrite doped with different elements are shown in Table 2. The results showed that after impurity elements were incorporated into the pyrite unit cells, all of the unit cells expanded. The degrees of expansion were Cu > As > Ni > Co for the supercells containing only a single impurity atom. For the supercells containing two impurity atoms at the same time, the degree of swelling was significantly greater than that of the corresponding case with a single impurity atom.
The electronic structure of the pyrite cell doped with impurity elements was calculated. Figure 5 shows the total density of state values under different doping systems. The Fermi level was set as the zero-energy point. The calculation results showed that the Fermi levels of pure pyrite, arsenic-containing pyrite, and pyrite containing equimolar concentrations of cobalt and arsenic were located at the valence band maximum. Therefore, holes were the main type of carrier in these systems, and the corresponding semiconductor properties were P-type. After Ni and Cu were added to pyrite and introduced defect states into the pyrite bandgap, the Fermi level was close to the conduction band, and its main type of carrier was free electrons, which tended to be N-type in the semiconductor state.
In the Seebeck effect, the thermoelectric potential is directly proportional to the derivative of the density of states (DOS) [38]. Therefore, the larger the derivative of the DOS is, the greater the thermoelectric potential is, leading to a larger Seebeck coefficient. The derivative of DOS in the valence band of P-type doped pyrite was clearly greater than that in N-type doped pyrite, indicating that the absolute value of the Seebeck coefficient in P-type pyrite was greater than that in N-type pyrite.

4. Discussion

4.1. Effect of Impurity Elements on the Semiconductor Properties of Pyrite

Isomorphic substitution in the mineral lattice occurs due to the substitution of impurity element atoms with similar radii and charges for the main constituent elements in the mineral. In pyrites, As, Co, Ni, and Cu are impurity elements, of which Co2+, Ni2+, and Cu2+ are used to replace Fe2+ in the pyrite lattice, and the sulfur in S22− is substituted for As [13]. After adding these impurity elements into the pyrite crystal lattice, the unit cell expands and significantly affects the electronic structure, thereby changing the main carrier types, carrier mobilities, and thermoelectric properties of pyrite.

4.1.1. As

There have been many studies on the semiconductor properties of arsenic-containing pyrite. Pridmore and Shuey [9] believed that As is an electron-acceptor impurity in pyrite, and pyrite with a higher As content shows P-type semiconductor features. Lehner, Savage, and Ayers [19] conducted measurements, mainly by laboratory-based means, to determine that the carriers of pyrite doped with As are made up of holes and tended to show P-type holes. Savage, Stefan, and Lehner [20] used the Hall effect analysis technique to measure the carrier properties of 25 natural pyrite particles from different regions and found that the carriers in pyrite with As as the main impurity element mainly included holes, consistent with the properties of P-type semiconductors.
In this study, the high-value As area and the P-type pyrite area showed good agreement (Figure 2 and Figure 3). The absolute value of the Seebeck coefficient of pyrite corresponding to the low-value As area was very small and close to zero. This interpretation could also be verified by the calculation results (Figure 5). The addition of As mainly induced the valence band electronic state for the pyrite crystals, and the Fermi level was still at the top of the valence band. Based on this property, we could determine that the main carrier type of arsenic-containing pyrite was holes, which are indicative of a P-type semiconductor.
The measured results and calculated results both showed that after adding As into the pyrite lattice to replace S, the Seebeck coefficient was mostly positive, and its absolute value was large. The main carrier type in pyrite was holes, so pyrite containing arsenic should be a P-type semiconductor.

4.1.2. Cu, Co, and Ni

Previous studies on the effects of Ni and Co on the semiconductor properties of pyrite have mainly focused on laboratory testing and theoretical calculations [18,19,21,22], and there are few reports about the semiconductor properties of copper-bearing pyrite. Previous studies have shown that Ni and Co are pyrite donor impurities, and their addition induces a tendency of the pyrite carriers to be electron-based and N-type. Xue, Li, Sun, Zhang, and Zhang [14] used probability statistics on the semiconductor properties of pyrite particles in different ore bodies of gold mines to conclude that N-type pyrites containing Ni and Co are closely related.
Based on the samples in this study, it can be noted that although the content of As in Py2 remained high, the Seebeck coefficient of pyrite fluctuated which mainly corresponded to the changes in the concentrations of Ni and Co (Figure 2 and Figure 3). It can be inferred that the addition of Ni and Co elements played a significant role in the pyrite showing N-type properties. Moreover, the calculation results showed that the Fermi energy levels of pyrites containing Ni and Co elements were far from the top of the valence band, indicating that the main carrier types of Ni-containing pyrite and Co-containing pyrite were electrons, showing N-type properties.
In addition, because the Cu atomic radius and properties are close to Fe, Cu atoms can be added to the pyrite lattice in the form of isomorphism [4,13]. The results of the first-principles calculations showed that the addition of Cu to pyrite could cause the pyrite to be N-type. In the samples in this study, the Cu element contents in the four bands of pyrite changed relatively smoothly, making the Seebeck coefficient of the pyrite in the sample smaller as a whole.
Both the actual measurement results and the calculation results confirmed that the substitution of Fe elements with Ni, Co, and Cu could significantly reduce the Seebeck coefficient of pyrite, which could even become negative. The main carrier type in such pyrite materials was electrons; thus, the pyrites containing the abovementioned impurity elements are N-type semiconductors.

4.1.3. As Mixed with Co, Ni, and Cu

To investigate the changes in the thermoelectric properties of pyrite upon simultaneous addition of the impurity elements As, Co, and Ni, the electronic structures of pyrite were also calculated after adding As and Co, As and Ni, and As and Cu at the same molar concentration. According to the calculation results (Figure 5), the Fermi level of pyrite containing Co and As was located at the top of the valence band, and its main carrier type was holes, which tend to indicate P-type properties. The Fermi level of pyrite containing Ni and As and that of pyrite containing Cu and As were each close to the conduction band. The main carrier type in these materials was electrons, which tend to indicate N-type properties.
Therefore, according to first-principles calculation results, the addition of Ni or Cu could change the main carrier type of arsenic pyrite from holes to electrons and change its semiconductor type from P-type to N-type. However, the addition of Co could not change the main carrier type of arsenic pyrite, where the main carrier type was still holes and the material was a P-type semiconductor.

4.2. The Thermoelectric Properties and Formation Temperature of Pyrite

In reality, it is practically inevitable that natural pyrite contains impurity elements [4,13]. During the crystallization process of pyrite, various impurity elements, for example, Co, Ni, As, Se, Cu, Zn, Te, Tl, Sb, and other elements, may enter the crystal lattice of pyrite through isomorphic substitution at different concentrations [3,39,40,41,42,43,44,45,46]. Moreover, pyrite formed under different temperature conditions often contains different combinations of trace elements. Previous studies have shown that, compared with pyrite formed in a low-temperature environment, pyrite formed in a high-temperature hydrothermal environment contains more Co, Ni, Cu, Te, and Se, but less As, Zn, Tl, and Sb [3,45,47,48,49].
As a kind of natural semiconductor mineral that is widely distributed within the earth, natural pyrite generally has a thermoelectric effect [5,6,14,15,16]. The thermoelectric properties of pyrite are affected by various impurity elements contained in it. For example, pyrites containing As, Se, and Te are mostly P-type [20,22], while pyrites containing Co, Ni, and Cu are mostly N-type [14,18,19,21,22]. Additionally, various impurity elements contained in pyrite may affect each other. For example, when As enters the pyrite lattice alone, the pyrite is P-type, but when Ni or Cu and As enter the pyrite lattice at the same time, the pyrite changes to N-type. Therefore, the impurity elements contained in pyrite are controlled by formation temperature, and they determine the thermoelectric type of pyrite; that is, pyrite particles formed under different formation temperatures tend to exhibit the same type of semiconductor properties.

5. Conclusions

The type and concentration of impurity trace elements contained in pyrite can significantly affect its semiconductor properties. Moreover, when impurity elements such as As, Ni, and Co enter pyrite at the same time, such elements have a superimposed influence on the pyrite semiconductor properties. Specifically, pyrite containing arsenic is a P-type semiconductor. Pyrites containing Ni, Co, Cu, and other elements are N-type semiconductors. The addition of Ni, Co, Cu, and other elements to P-type pyrites containing As, Ni, and Cu may change the semiconductor properties of the original pyrite to N-type, while the addition of Co cannot change the semiconducting nature of the arsenic-containing pyrite.
Pyrite formed under different temperature conditions tends to be enriched with different combinations of impurity elements, leading to the relative accumulation of P-type or N-type pyrites.

Author Contributions

Data curation, B.D.; investigation, K.X.; resources, C.L.; software, Z.Z.; writing—original draft, S.W.; writing—review & editing, J.S. All authors have read and agreed to the published version of the manuscript.

Funding

This research was funded by Open Foundation of the United Laboratory of High-Pressure Physics and Earthquake Science, grant number 2019HPPES03.

Institutional Review Board Statement

Not applicable.

Informed Consent Statement

Not applicable.

Data Availability Statement

The data presented in this study are available.

Acknowledgments

The research reported in this paper was funded by Open Foundation of the United Laboratory of High-Pressure Physics and Earthquake Science (No.2019HPPES03). We greatly thank anonymous reviewers and editors for the constructive comments that helped to improve this paper.

Conflicts of Interest

The authors declare no conflict of interest.

References

  1. Barrie, C.D.; Boyce, A.J.; Boyle, A.P.; Williams, P.J.; Blake, K.; Ogawara, T.; Akai, J.; Prior, D.J. Growth controls in colloform pyrite. Am. Miner. 2009, 94, 415–429. [Google Scholar] [CrossRef]
  2. Da Costa, G.; Hofmann, A.; Agangi, A. A revised classification scheme of pyrite in the Witwatersrand Basin and application to placer gold deposits. Earth-Sci. Rev. 2020, 201, 103064. [Google Scholar] [CrossRef]
  3. Keith, M.; Smith, D.J.; Jenkin, G.R.; Holwell, D.A.; Dye, M.D. A review of Te and Se systematics in hydrothermal pyrite from precious metal deposits: Insights into ore-forming processes. Ore Geol. Rev. 2018, 96, 269–282. [Google Scholar] [CrossRef]
  4. Steadman, J.A.; Large, R.R.; Olin, P.H.; Danyushevsky, L.V.; Meffre, S.; Huston, D.; Fabris, A.; Lisitsin, V.; Wells, T. Pyrite trace element behavior in magmatic-hydrothermal environments: An LA-ICPMS imaging study. Ore Geol. Rev. 2021, 128, 103878. [Google Scholar] [CrossRef]
  5. Alam, M.; Li, S.-R.; Santosh, M.; Shah, A.; Yuan, M.-W.; Khan, H.; Qureshi, J.A.; Zeng, Y.-J. Morphological, thermoelectrical, geochemical and isotopic anatomy of auriferous pyrite from the Bagrote valley placer deposits, North Pakistan: Implications for ore genesis and gold exploration. Ore Geol. Rev. 2019, 112, 103008. [Google Scholar] [CrossRef]
  6. Li, C.-L.; Li, L.; Yuan, M.-W.; Alam, M.; Li, S.-R.; Santosh, M.; Deng, C.-Z.; Liu, H.; Xu, G.-Z. Study on pyrite thermoelectricity, ore-forming fluids and H-O-Rb-Sr isotopes of the Yongxin gold deposit, Central Asian Orogenic Belt: Implications for ore genesis and exploration. Ore Geol. Rev. 2020, 121, 103568. [Google Scholar] [CrossRef]
  7. Ares, J.; Ferrer, I.; Cuevas, F.; Sánchez, C.; Ferrer, M.I.J. Growth of pyrite thin-films investigated by thermoelectric measurements. Thin Solid Films 2001, 387, 97–99. [Google Scholar] [CrossRef]
  8. Bachhuber, F.; Krach, A.; Furtner, A.; Söhnel, T.; Peter, P.; Rothballer, J.; Weihrich, R. Phase stabilities of pyrite-related MTCh compounds (M=Ni, Pd, Pt; T=Si, Ge, Sn, Pb; Ch=S, Se, Te): A systematic DFT study. J. Solid State Chem. 2015, 226, 29–35. [Google Scholar] [CrossRef]
  9. Pridmore, D.F.; Shuey, R.T. The electrical resistivity of galena, pyrite, and chalcopyrite. Am. Min. 1976, 61, 248–259. [Google Scholar]
  10. Doyle, F.M.; Mirza, A.H. Electrochemical oxidation of pyrite samples with known composition and electrical properties. Electrochem. Proc. 1996, 96, 203–214. [Google Scholar]
  11. Schieck, R.; Hartmann, A.; Fiechter, S.; Knenkamp, R.; Wetzel, H. Electrical properties of natural and synthetic pyrite (FeS2) crystals. J. Mat. Res. 1990, 5, 1567–1572. [Google Scholar] [CrossRef]
  12. Favorov, V.A.; Krasnikov, V.J.; Sychugov, V.S. Variations in semiconductor properties of pyrite and arsenopyrite and their determinants. Int. Geol. Rev. 1974, 16, 385–394. [Google Scholar] [CrossRef]
  13. Abraitis, P.K.; Pattrick, R.A.D.; Vaughan, D.J. Variations in the compositional, textural and electrical properties of natural pyrite: A review. Int. J. Miner. Process. 2004, 74, 41–59. [Google Scholar] [CrossRef]
  14. Xue, J.; Li, S.; Sun, W.; Zhang, Y.; Zhang, X. Characteristics of the genetic mineralogy of pyrite and its significance for prospecting in the Denggezhuang gold deposit, Jiaodong Peninsula, China. Sci. China Earth Sci. 2014, 57, 644–661. [Google Scholar] [CrossRef]
  15. Wang, G.; Feng, Y.; Carranza, E.J.M.; Li, R.; Li, Z.; Feng, Z.; Zhao, X.; Wang, D.; Kong, L.; Jia, W.; et al. Typomorphic characteristics of pyrite: Criteria for 3D exploration targeting in the xishan gold deposit, China. J. Geochem. Explor. 2016, 164, 136–163. [Google Scholar] [CrossRef]
  16. Shen, J.; Li, S.; Ma, G.; Liu, Y.; Yu, H.; Liu, H. Typomorphic characteristics of pyrite from the Linglong gold deposit: Its vertical variation and prospecting significance. Earth Sci. Front. 2013, 20, 55–75. [Google Scholar]
  17. Shuey, R.T. Semiconducting Ore Minerals. In Developments in Economic Geology; Shuey, R.T., Ed.; Elsevier: Amsterdam, The Netherlands, 1975; Volume 4, pp. 304–318. [Google Scholar]
  18. Ferrer, M.I.J.; De La Heras, C.; Sanchez, C. The effect of Ni impurities on some structural properties of pyrite thin films. J. Phys. Condens. Matter 1995, 7, 2115–2121. [Google Scholar] [CrossRef]
  19. Lehner, S.; Savage, K.; Ayers, J. Vapor growth and characterization of pyrite (FeS2) doped with Co, Ni, and As: Variations in semiconducting properties. J. Cryst. Growth 2006, 286, 306–317. [Google Scholar] [CrossRef]
  20. Savage, K.S.; Stefan, D.; Lehner, S.W. Impurities and heterogeneity in pyrite: Influences on electrical properties and oxidation products. Appl. Geochem. 2008, 23, 103–120. [Google Scholar] [CrossRef]
  21. Uhlig, C.; Guenes, E.; Schulze, A.S.; Elm, M.T.; Klar, P.J.; Schlecht, S. Nanoscale FeS2 (Pyrite) as a Sustainable Thermoelectric Material. J. Electron. Mater. 2014, 43, 2362–2370. [Google Scholar] [CrossRef]
  22. Li, Y.-Q.; Chen, J.-H.; Chen, Y.; Guo, J. Density functional theory study of influence of impurity on electronic properties and reactivity of pyrite. Trans. Nonferrous Met. Soc. China 2011, 21, 1887–1895. [Google Scholar] [CrossRef]
  23. Du, B.; Shen, J.; Santosh, M.; Liu, H.; Liu, J.; Wang, Y.; Xu, K. Textural, compositional and isotopic characteristics of pyrite from the Zaozigou gold deposit in West Qinling, China: Implications for gold metallogeny. Ore Geol. Rev. 2020, 130, 103917. [Google Scholar] [CrossRef]
  24. Platzek, D.; Karpinski, G.; Stiewe, C.; Ziolkowski, P.; Drasar, C.; Müller, E. Potential-Seebeck-microprobe (PSM): Measuring the spatial resolution of the Seebeck coefficient and the electric potential. In Proceedings of the ICT 2005, 24th International Conference on Thermoelectrics, Clemson, SC, USA, 19–23 June 2005; pp. 13–16. [Google Scholar]
  25. Nieroda, P.; Leszczyński, J.; Mikuła, A.; Mars, K.; Kruszewski, M.J.; Koleżyński, A. Thermoelectric properties of Cu2S obtained by high temperature synthesis and sintered by IHP method. Ceram. Int. 2020, 46, 25460–25466. [Google Scholar] [CrossRef]
  26. Ayachi, S.; Hernandez, G.C.; Pham, N.H.; Farahi, N.; Müller, E.; De Boor, J. Developing Contacting Solutions for Mg2Si1–xSnx-Based Thermoelectric Generators: Cu and Ni45Cu55 as Potential Contacting Electrodes. ACS Appl. Mater. Interfaces 2019, 11, 40769–40780. [Google Scholar] [CrossRef]
  27. Wang, F.; Ge, G.; Ning, S.; Nie, L.; Zhong, G.; White, N.C. A new approach to LA-ICP-MS mapping and application in geology. Acta Petrol. Sin. 2017, 33, 3422–3436. [Google Scholar]
  28. George, L.L.; Biagioni, C.; D’Orazio, M.; Cook, N.J. Textural and trace element evolution of pyrite during greenschist facies metamorphic recrystallization in the southern Apuan Alps (Tuscany, Italy): Influence on the formation of Tl-rich sulfosalt melt. Ore Geol. Rev. 2018, 102, 59–105. [Google Scholar] [CrossRef]
  29. Agangi, A.; Hofmann, A.; Wohlgemuth-Ueberwasser, C.C. Pyrite Zoning as a Record of Mineralization in the Ventersdorp Contact Reef, Witwatersrand Basin, South Africa. Econ. Geol. 2013, 108, 1243–1272. [Google Scholar] [CrossRef]
  30. Cook, N.; Ciobanu, C.; George, L.; Zhu, Z.-Y.; Wade, B.; Ehrig, K. Trace Element Analysis of Minerals in Magmatic-Hydrothermal Ores by Laser Ablation Inductively-Coupled Plasma Mass Spectrometry: Approaches and Opportunities. Minerals 2016, 6, 111. [Google Scholar] [CrossRef] [Green Version]
  31. Paton, C.; Hellstrom, J.; Paul, B.; Woodhead, J.; Hergt, J. Iolite: Freeware for the visualisation and processing of mass spectrometric data. J. Anal. At. Spectrom. 2011, 26, 2508–2518. [Google Scholar] [CrossRef]
  32. Wilson, S.A.; Ridley, W.I.; Koenig, A.E. Development of sulfide calibration standards for the laser ablation inductively-coupled plasma mass spectrometry technique. J. Anal. At. Spectrom. 2002, 17, 406–409. [Google Scholar] [CrossRef]
  33. Liu, S.; Li, Y.; Shi, Y. First-principles study of sulfur isotope fractionation in pyrite-type disulfides. Am. Miner. 2014, 100, 203–208. [Google Scholar] [CrossRef]
  34. Giannozzi, P.; Baroni, S.; Bonini, N.; Calandra, M.; Car, R.; Cavazzoni, C.; Ceresoli, D.; Chiarotti, G.L.; Cococcioni, M.; Dabo, I.; et al. QUANTUM ESPRESSO: A modular and open-source software project for quantum simulations of materials. J. Phys. Condens. Matter 2009, 21, 395502. [Google Scholar] [CrossRef]
  35. Perdew, J.P.; Chevary, J.A.; Vosko, S.H.; Jackson, K.A.; Pederson, M.R.; Singh, D.J.; Fiolhais, C. Atoms, molecules, solids, and surfaces: Applications of the generalized gradient approximation for exchange and correlation. Phys. Rev. B 1992, 46, 6671–6687. [Google Scholar] [CrossRef]
  36. Vanderbilt, D. Soft self-consistent pseudopotentials in a generalized eigenvalue formalism. Phys. Rev. B 1990, 41, 7892–7895. [Google Scholar] [CrossRef]
  37. Monkhorst, H.J.; Pack, J.D. Special points for Brillouin-zone integrations. Phys. Rev. B 1976, 13, 5188–5192. [Google Scholar] [CrossRef]
  38. Guo, D.; Hu, C.; Xi, Y.; Zhang, K. Strain Effects to Optimize Thermoelectric Properties of Doped Bi2O2Se via Tran–Blaha Modified Becke–Johnson Density Functional Theory. J. Phys. Chem. C 2013, 117, 21597–21602. [Google Scholar] [CrossRef]
  39. Deditius, A.P.; Utsunomiya, S.; Reich, M.; Kesler, S.E.; Ewing, R.C.; Hough, R.; Walshe, J. Trace metal nanoparticles in pyrite. Ore Geol. Rev. 2011, 42, 32–46. [Google Scholar] [CrossRef]
  40. Fleet, M.E.; Chryssoulis, S.L.; Davidson, R.; Weisener, C.G.; Maclean, P.J. Arsenian pyrite from gold deposits: Au and As distribution investigated by SIMS and EMP, and color staining and surface oxidation by XPS and LIMS. Can. Mineral. 1993, 31, 1–17. [Google Scholar]
  41. Huston, D.L.; Sie, S.H.; Suter, G.F.; Cooke, D.R.; Both, R.A. Trace elements in sulfide minerals from eastern Australian volcanic-hosted massive sulfide deposits, Part II.Selenium levels in pyrite: Comparison with d34S values and implications for the source of sulfur in volcanogenic hydrothermal systems. Econ. Geol. 1995, 90, 1167–1196. [Google Scholar] [CrossRef]
  42. Mathieu, L. Detecting magmatic-derived fluids using pyrite chemistry: Example of the Chibougamau area, Abitibi Subprovince, Québec. Ore Geol. Rev. 2019, 114, 103127. [Google Scholar] [CrossRef]
  43. Reich, M.; Simon, A.C.; Deditius, A.; Barra, F.; Chryssoulis, S.; Lagas, G.; Tardani, D.; Knipping, J.; Bilenker, L.; Sánchez-Alfaro, P.; et al. Trace element signature of pyrite from the los colorados iron oxide-apatite (IOA) Deposit, Chile: A missing link between andean ioa and iron oxide copper-gold systems? Econ. Geol. 2016, 111, 743–761. [Google Scholar] [CrossRef] [Green Version]
  44. Steadman, J.A.; Large, R.R.; Meffre, S.; Olin, P.H.; Danyushevsky, L.V.; Gregory, D.D.; Belousov, I.; Lounejeva, E.; Ireland, T.R.; Holden, P. Synsedimentary to Early Diagenetic Gold in Black Shale-Hosted Pyrite Nodules at the Golden Mile Deposit, Kalgoorlie, Western Australia. Econ. Geol. 2015, 110, 1157–1191. [Google Scholar] [CrossRef]
  45. Sykora, S.; Cooke, D.R.; Meffre, S.; Stephanov, A.S.; Gardner, K.; Scott, R.; Selley, D.; Harris, A.C. Evolution of Pyrite Trace Element Compositions from Porphyry-Style and Epithermal Conditions at the Lihir Gold Deposit: Implications for Ore Genesis and Mineral Processing. Econ. Geol. 2018, 113, 193–208. [Google Scholar] [CrossRef]
  46. D’Orazio, M.; Biagioni, C.; Dini, A.; Vezzoni, S. Thallium-rich pyrite ores from the Apuan Alps, Tuscany, Italy:constraints for their origin and environmental concerns. Miner. Deposita 2017, 52, 687–707. [Google Scholar] [CrossRef]
  47. Fleet, M.E.; MacLean, P.J.; Barbier, J. Oscillatory-zoned As-bearing pyrite from strata-bound and stratiform gold deposits: An indicator of ore fluid evolution. Econ. Geol. Monogr. 1989, 6, 356–362. [Google Scholar]
  48. Maslennikov, V.V.; Maslennikova, S.P.; Large, R.; Danyushevsky, L.V. Study of Trace Element Zonation in Vent Chimneys from the Silurian Yaman-Kasy Volcanic-Hosted Massive Sulfide Deposit (Southern Urals, Russia) Using Laser Ablation-Inductively Coupled Plasma Mass Spectrometry (LA-ICPMS). Econ. Geol. 2009, 104, 1111–1141. [Google Scholar] [CrossRef]
  49. Reich, M.; Deditius, A.; Chryssoulis, S.; Li, J.-W.; Ma, C.-Q.; Parada, M.A.; Barra, F.; Mittermayr, F. Pyrite as a record of hydrothermal fluid evolution in a porphyry copper system: A SIMS/EMPA trace element study. Geochim. Cosmochim. Acta 2013, 104, 42–62. [Google Scholar] [CrossRef]
Figure 1. Section of vein-like pyrite along the growth direction: (a) photo of the test sample under a natural-light stereomicroscope; (b) photo of the test sample under a reflective polarizing microscope. Py—pyrite and Q—quartz.
Minerals 11 00596 g001
Figure 2. Distribution of the Seebeck coefficient on the pyrite veinlet growth profile.
Minerals 11 00596 g002
Figure 3. LA-ICP-MS mapping and growth-profile distribution for some impurity elements.
Minerals 11 00596 g003
Figure 4. Super-cell structure diagram of pyrite with different impurity elements. (a) Fe8S16. (b) Fe8S15As1. (c) Fe7Co1S16. (d) Fe7Ni1S16. (e) Fe7Cu1S16. (f) Fe7Co1S15As1. (g) Fe7Ni1S15As1. (h) Fe7Cu1S15As1.
Minerals 11 00596 g004
Figure 5. The total electronic density of states of pyrite under different doping conditions, where the Fermi level is set to zero energy.
Minerals 11 00596 g005
Table 1. Seebeck coefficients of the pyrite veinlet profile.
Distance (μm)Seebeck Coefficients (μV/K)Distance (μm)Seebeck Coefficients (μV/K)
0−0.60320−6.25
100.38330−47.45
200.8234046.22
301.94350127.78
405.55360−11.17
500.65370−8.00
60−1.55380141.19
702.18390−30.63
804.34400151.39
904.5241026.91
1003.6342018.32
1102.7343019.92
1201.3944015.30
1302.2245017.56
14011.61460−10.13
1500.79470−10.52
1602.59480−10.21
1705.41490−4.37
1807.60500−8.67
19011.28510−7.82
2003.26520−6.98
210−4.77530-4.19
22012.39540−5.47
230−2.10550−4.68
240−16.58560−4.05
250−5.41570−4.06
260−10.2858013.03
270142.1259066.87
280−7.4060028.00
290−26.1261029.08
300−23.1462027.25
310−12.2663025.42
Table 2. Unit cell volumes of pyrite in different doping systems.
SpeciesFe8S16Fe7Co1S16Fe7Co1S15As1Fe7Ni1S16Fe8S15As1Fe7Ni1S15As1Fe7Cu1S16Fe7Cu1S15As1
Volume/Å3316.12316.82321.13321.21321.86324.57324.84328.85
Publisher’s Note: MDPI stays neutral with regard to jurisdictional claims in published maps and institutional affiliations.

