Article

Oxidation Roasting of Fine-Grained Carbonaceous Gold Ore: The Effect of Aeration Rate

1
School of Resources Engineering, Xi’an University of Architecture and Technology, Xi’an 710055, China
2
School of Resources and Civil Engineering, Northeastern University, Shenyang 110819, China
*
Author to whom correspondence should be addressed.
Minerals 2021, 11(6), 558; https://doi.org/10.3390/min11060558
Submission received: 21 April 2021 / Revised: 15 May 2021 / Accepted: 21 May 2021 / Published: 24 May 2021
(This article belongs to the Special Issue Hydrometallurgy in Gold Extraction)

Abstract

:
The oxidation roasting of carbon-bearing micro-fine gold can eliminate or weaken the robbing effect of carbonaceous materials and clay, and destroy the encapsulation of micro-fine gold. The micropores produced by gas escaping during the roasting process are conducive to the diffusion of leaching agents, thus enhancing the cyanide leaching of gold. In this paper, the influence of the aeration rate during roasting on the leaching rate of fine-grained carbonaceous gold ore and its mechanism were studied using thermodynamic calculations, crystal structure analysis, surface chemical groups and bonds analysis, microporous structure analysis, and surface morphology detection. Under suitable roasting conditions, the carbonaceous and pyrite in the ore are oxidized, while carbonate minerals such as dolomite and calcite as well as clay minerals are decomposed, and the gold-robbing materials lose their activity. The experimental results have theoretical and practical significance for the popularization and application of oxidation roasting technology of fine carbon-bearing gold ore.

1. Introduction

Gold plays an important role in the world economy, and its production and reserves are some of the important indicators used to measure a country’s financial status [1]. With the continuous development of gold mineral resources, the need for efficient, sustainable, and environmentally friendly means for processing refractory gold resources is posing a major technical challenge to gold-producing companies around the world [2,3]. Shaanxi Province is one of the main gold-producing areas in China, relying on carbon-bearing deposits, which are mainly distributed in the Qinba area. Furthermore, the Sulinggou, Xiajiadian, Wangjiaping, and Jinlongshan gold deposits in the Shangluo area are also carbonaceous deposits bearing micro-fine-grained gold.
There are three main reasons why the ore is difficult to treat: firstly, carbonaceous materials and clay minerals adsorb dissolved gold in the process of cyanide leaching, resulting in gold-robbing. Secondly, gold with a fine grain size is embedded in quartz and other minerals, so that even fine grinding cannot liberate the gold particles to establish contact with the reagent. Thirdly, the carbonaceous materials are intimately associated with reagent consuming gangue minerals [4,5,6].
At present, the main methods used to liberate carbonaceous gold include oxidation roasting, competitive adsorption, bacterial oxidation, and chemical oxidation [6,7,8,9]. Since it is regarded as reliable technology, a mature process, and adaptable, oxidation roasting is one of the most preferred methods for treating carbonaceous gold ores. In oxidation roasting, the carbonaceous substance and sulfide of the ore are oxidized and the gas produced by carbonate decomposition renders the ore loose and porous. It changes the crystal structure of the mineral and reduces the density of the ore, making it conducive to the diffusion of the leaching agent [8,10,11].
Many scholars have studied the chemical composition, structure, and extraction process of gold oxide minerals in detail [10,12,13]. Therefore, the technology for extracting gold after oxidation roasting pretreatment has gradually matured, and the extent of the extraction of gold is usually more than 90%. However, there have been relatively few studies on the composition, properties, and gold extraction process of fine-grained carbonaceous minerals. Due to the fine and disseminated nature of carbonaceous minerals, its intimate coexistence with gangue minerals and the coexistence of crystalline and amorphous carbon, the extraction efficiency of gold from fine carbonaceous gold ores is low, generally less than 60%. Therefore, not only cyanide leaching but also alternatives to cyanide (such as thiourea and thiosulfate) need to be considered. More importantly, the mineral composition and the occurrence of gold throughout the process of oxidative roasting need to be studied.
During the past 30 years, many scholars have studied the leaching of pretreated gold ore in detail and formed a systematic theory and design scheme [9,10,11,12]. However, most of the research objects were sulfide minerals and gossan-type gold deposits. The researchers found that the treatment of oxidized roasted mineral products is more complex because most minerals undergo complex physical and chemical changes [14,15,16]. In production practice, there are still some problems such as over-burning, under-burning, and the low operating efficiency of roasting equipment [17,18]. Based on the analysis of the current development trend of domestic oxidation roasting combined with cyanidation gold extraction, China’s advanced gold industry has seen a rapid development of engineering applications. Therefore, in-depth theoretical analysis of the technical links in the process can provide data for equipment transformation and renewal, so that the technology is more mature and stable in industrial applications, which has theoretical and practical significance for the promotion of raw ore oxidation roasting technology [19,20].
In this study, the mechanism of evolution of the macro structure and micro morphology of various minerals in different stages of oxidation roasting of fine-grained carbonaceous gold ore was systematically studied. The influence of aeration during roasting on the leaching rate of gold from the aspects of the change in phase, crystal structure, and porosity was analyzed by X-ray diffraction (XRD), X-ray photoelectron spectroscopy (XPS), scanning electron microscope-energy dispersive spectrometer (SEM-EDS), Fourier transform infrared spectrometer (FTIR), specific surface area, and porosity analysis.

2. Materials and Methods

2.1. Materials and Reagents

In this study, Sulinggou gold ore was used as the experimental material. A total of 20 tons of ore sample was collected, and about 20 kg of representative lump ore was selected by hand for mineralogical analysis. The rest of the ore sample was crushed, screened, mixed, and split to be used as raw materials for the test. The results of the chemical multi-element analysis of the ore are shown in Table 1.
Table 1 shows that the main value-element in the ore was Au with a content of 5.46 g/t, and Ag also reached the boundary condition for comprehensive recovery. The content of the harmful element carbon was higher, 6.84%; S, As, and Sb contents were lower, at 0.81%, 0.022%, and 0.007%, respectively. The high contents of silicon, calcium, and magnesium indicated that the ore contained a certain amount of quartz, carbonate, and aluminosilicate minerals. The loss on ignition of raw ore was 16.90%, being mostly attributable to carbonates plus inorganic and organic carbon.
In order to determine the occurrence of the value-element gold and harmful element carbon, chemical phase analysis was carried out. The results are shown in Table 2 and Table 3.
Table 2 shows that only 38.27% of the gold was liberated or exposed with the balance being entrained. The content of gold in silicate, carbonate, and hematite limonite was relatively high. The analysis results in Table 3 show that the contents of organic carbon and graphite in the ore were high at 1.33% and 1.50%, respectively. The existence of organic carbon and graphite also negatively impacts on the recovery of gold.

2.2. Methods

2.2.1. Oxidation Roasting Test

Dynamic oxidation roasting was carried out in a small rotary resistance-heated furnace. A 500 g raw ore sample was placed into a small rotary kiln operating at a controlled temperature, rotational speed of 4 rpm, and air injection. After the roasting, the roasted produce was cooled to room temperature, weighed, and the sample prepared. The mass loss was calculated. The calcine grade (β) was calculated from:
β = m 0 m 1 × α
where α is the grade of gold in the raw ore, g/T; β is the grade of gold in calcine, g/t; m0 is the mass of raw ore, g; and m1 is the mass of calcine, g.

2.2.2. Leaching Test

The roasted product after oxidative roasting was milled fine and then put into a leaching tank. The leaching parameters in the leaching process refer to the previous literature [10]. After leaching, the residue was filtered, washed, and dried. Finally, the gold grade of leaching residue was analyzed and the gold leaching rate was calculated.

2.2.3. XRD Analysis

The samples of the original ore and the calcined products obtained from different calcination conditions were analyzed using a D8 Advance X-ray diffractometer (Bruker, Karlsruhe, Germany). The crystal structure parameters of the samples were determined and the samples were analyzed qualitatively and quantitatively. The ground sample (–0.074 mm) was placed into the groove of the glass sample holder, flattened with ground glass, and inserted into the sample table.

2.2.4. SEM-EDS Analysis

In this study, the micro morphology of the reduction material was observed by SEM, and the products under different test conditions were analyzed by SEM and EDS with a quanta650 Model SEM (Thermo Fisher Scientific, Waltham, MA, USA), and the surface of the ore sample was imaged. The samples were evenly placed on conductive double-sided adhesive. After spraying with carbon paint, the morphology of the samples was observed under different magnifications.

2.2.5. Analysis of Specific Surface Area and Pore Structure

The ASAP 2020 automatic rapid specific surface area and porosity analyzer (Mike Instruments Inc., Norcross, GA, USA) was used to investigate the changes in pore structure and specific surface area of calcine under different calcination temperatures, calcination times, and ventilation rates.
Before the test, the samples were vacuum pretreated at 150 °C for 3 h, and then the adsorption capacity of nitrogen under different relative pressures was measured at –195.8 °C with high-purity nitrogen (purity > 99.99%) as the adsorbent. According to the two-constant formulas of BET, the specific surface area of the sample can be obtained by making the BET line diagram in the range of relative pressure, about 0.05 to 0.35.

2.2.6. X-Ray Photoelectron Spectroscopy Analysis

A k-alpha X-ray photoelectron spectroscope (XPS) (Thermoelectric Company, West Chester, PA, USA) was used to analyze the relationship of chemical bonds on the surface of the oxidized calcined product under different roasting conditions.

3. Results and Discussion

3.1. Process Mineralogy of Raw Ore for Oxidation Roasting

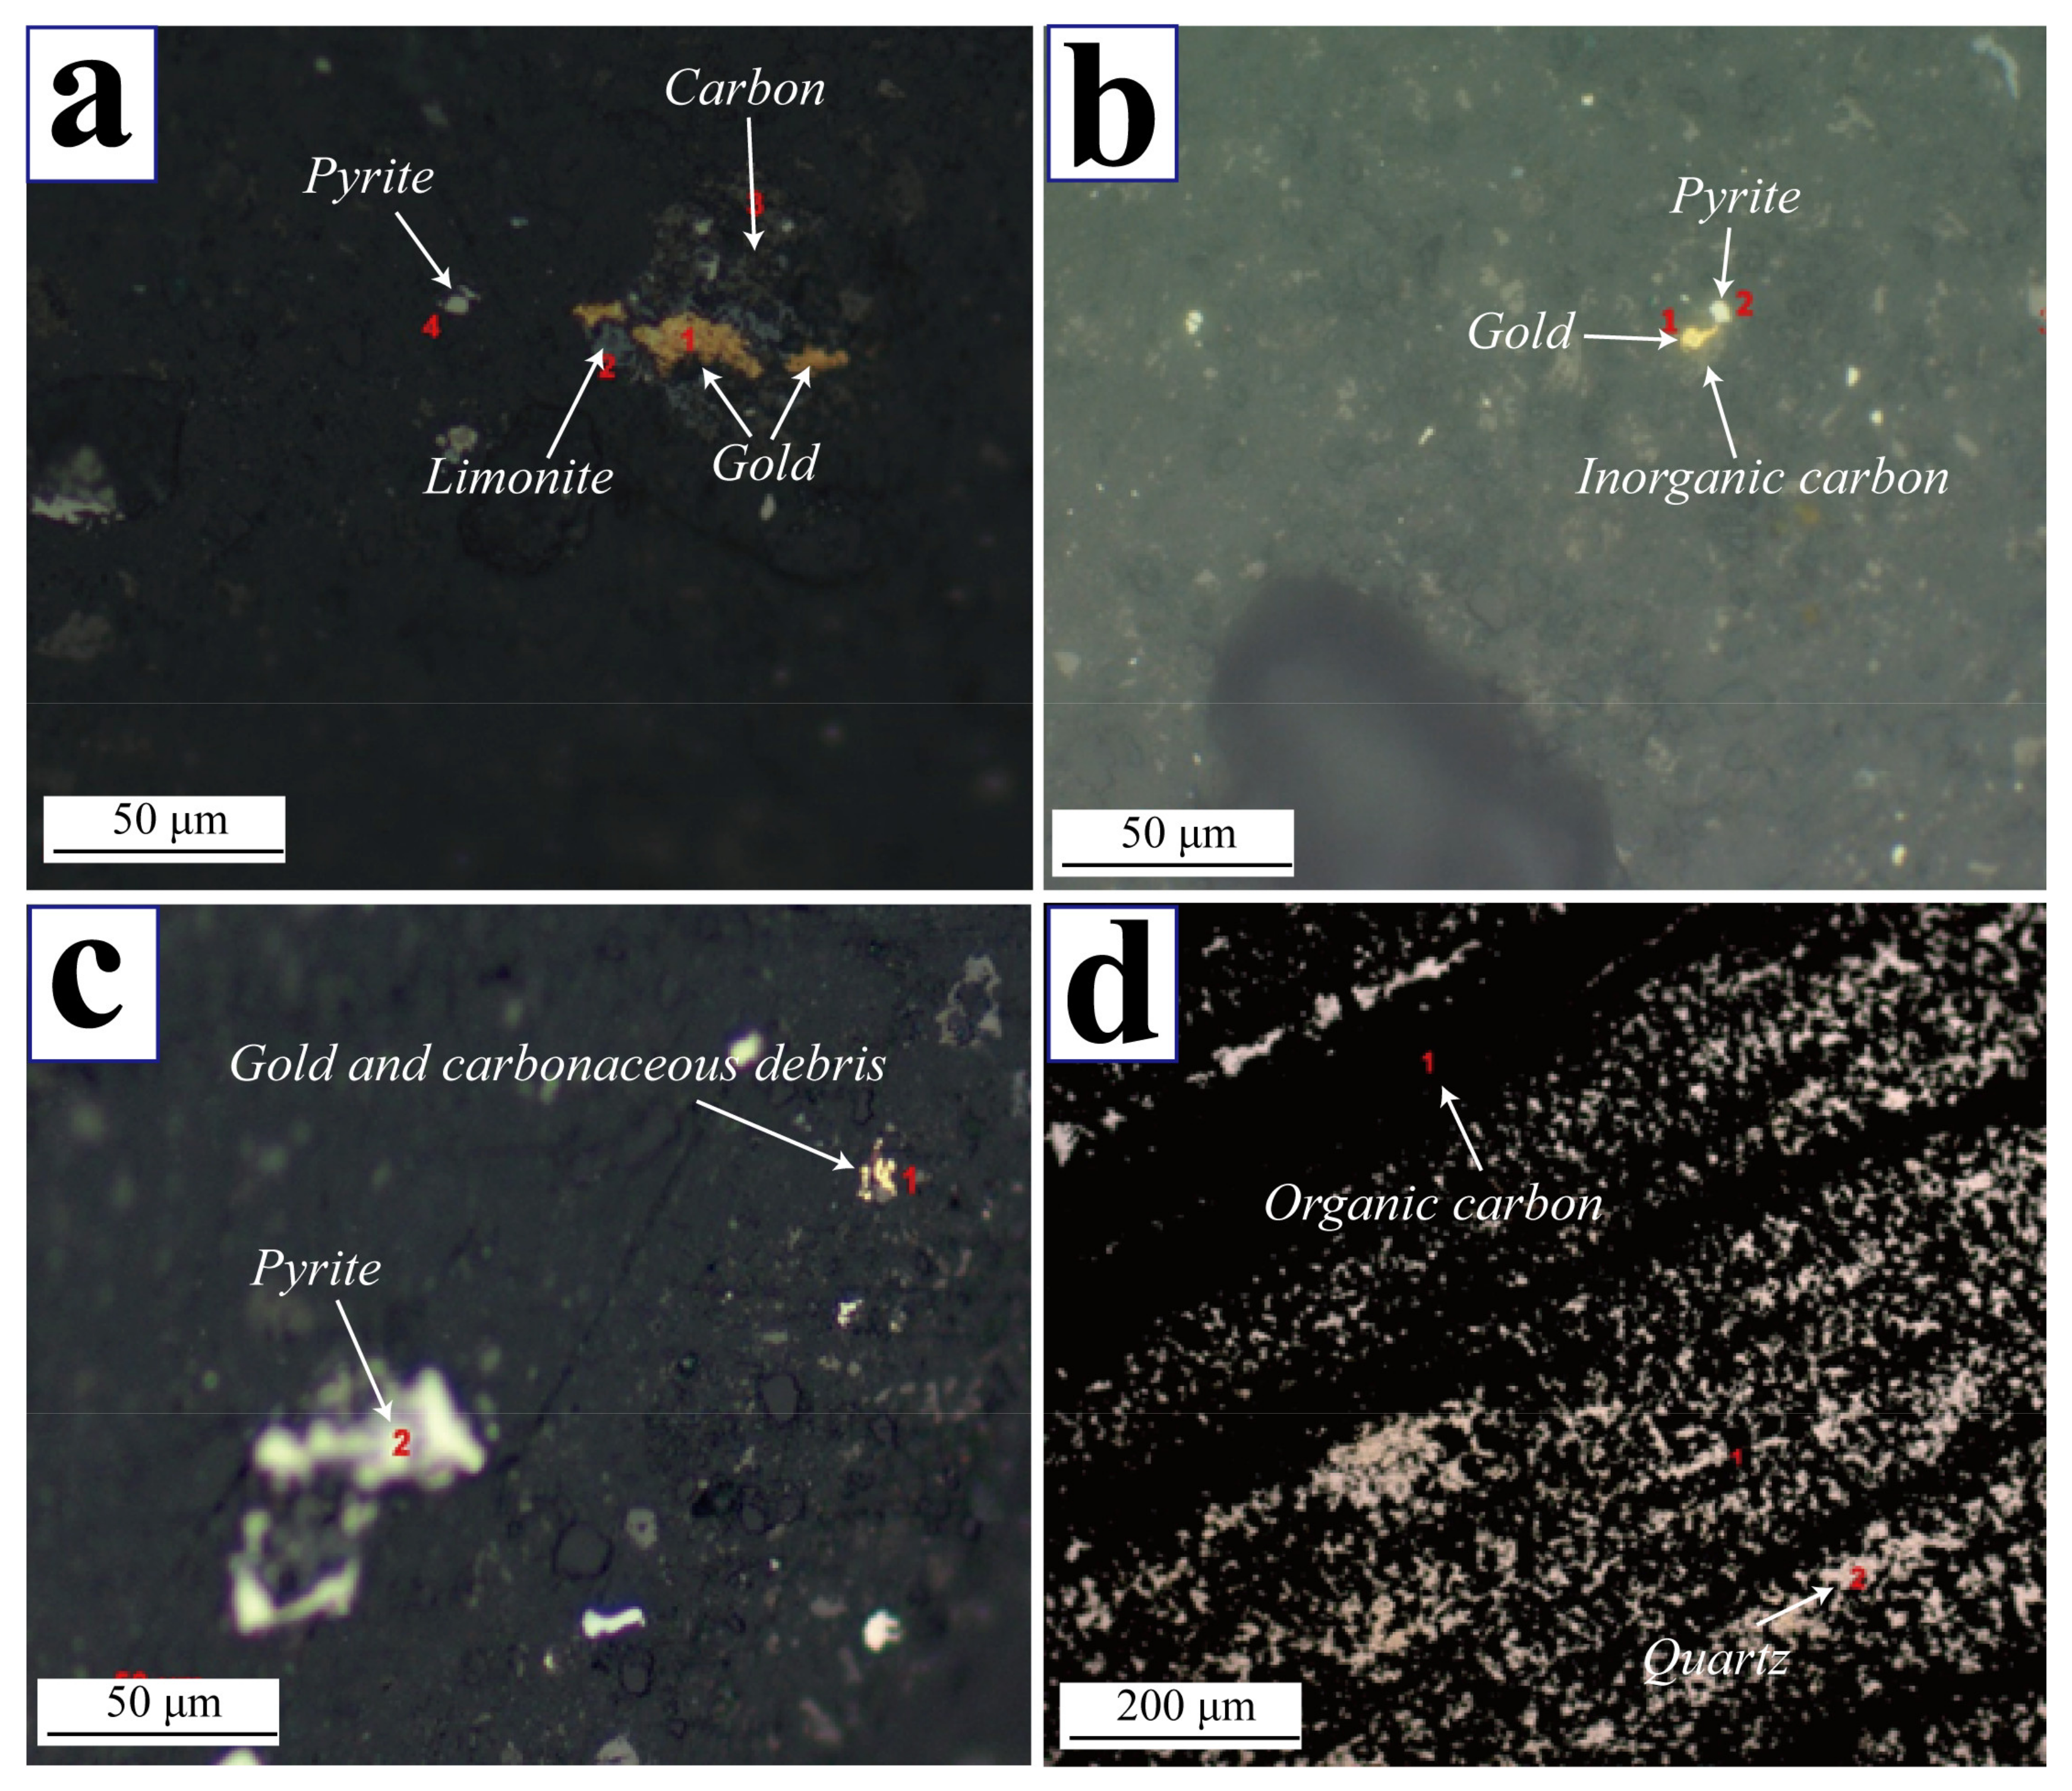
The results of the process mineralogical analysis of the raw ore are shown in Figure 1.
Gold exists in the form of independent mineral natural gold, the shape of which is relatively complex: mainly long angular granular, followed by branching and angular granular, and a small amount of wheat grain and sharp angular granular (Figure 1a–c). The three natural gold grains in the ore are very fine, with diameters of less than 2.5 μm, and occur between quartz grains or wrapped in limonite. Natural gold can be divided into three types: single gold, intergrowth gold, and wrapped gold. Natural gold is mainly wrapped in detritus composed of limonite, carbonaceous material, pyrite, and quartz. Natural gold is associated with fine pyrite and carbonaceous material, accounting for 10.78%, as shown in Figure 1c, of which, the other is associated with carbonaceous and siliceous slate clasts (carbonaceous material and quartz), and the other is associated with carbonaceous and siliceous slate clasts (quartz, limonite, and pyrite).
Carbon (organic carbon and graphite) is one of the most harmful components to the cyanide leaching process. The contents of graphite and organic carbon are 1.50% and 1.33%, respectively. The distribution characteristics of carbonaceous material in the ore are shown in Figure 1d. Amorphous carbon occurs in the form of dust spots or other granules, and is evenly embedded with quartz or laminar, with a particle size of about 10 μM. Graphite or semigraphite is flaked, and the aggregate is heterogeneous granular. There was fine pyrite in the aggregate, displayed in broken stripes. The content of pyrite in the aggregate was about 1 to 3%. The content of single-crystal graphite was about 1 to 3%.

3.2. Effect of Oxidation Roasting Conditions on Leaching Behavior

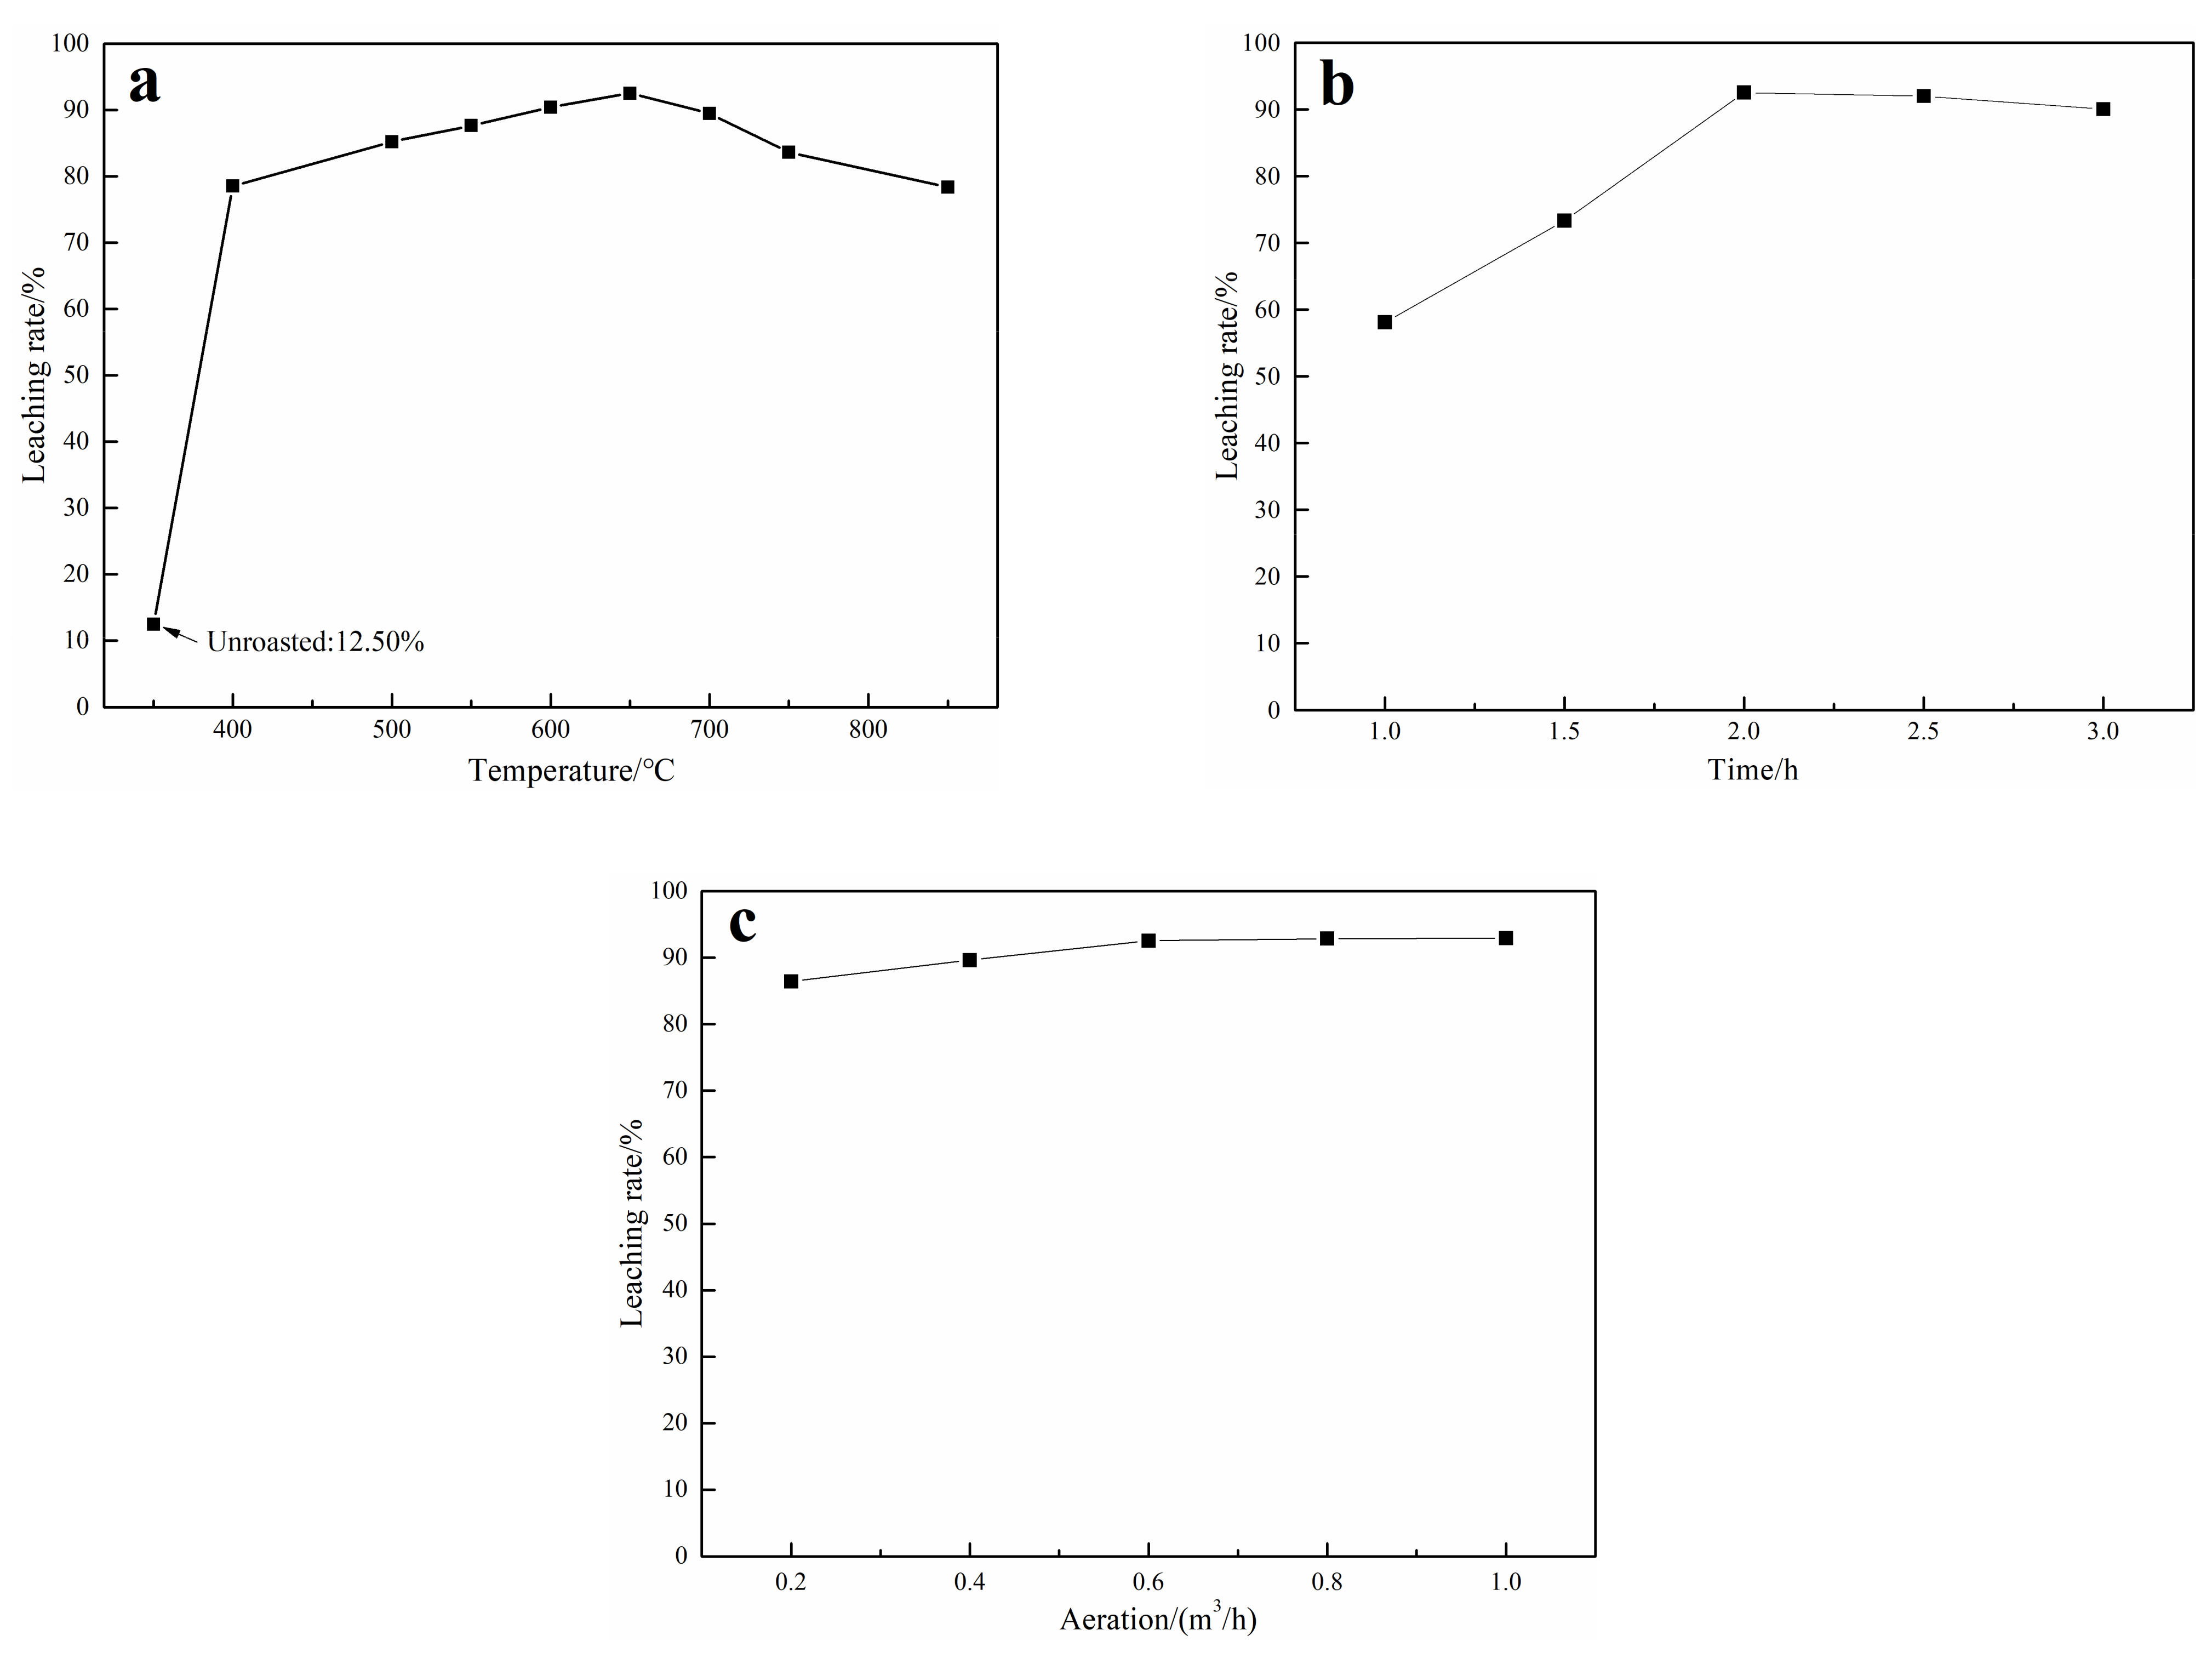
Roasting operation is the most critical part of the process, and the roasting effect directly determines the gold leaching rate. The oxidation roasting process of carbonaceous fine-grained gold ore mainly involves the oxidation of carbonaceous matter and pyrite, as well as the decomposition of carbonate minerals such as dolomite and calcite. The gold leaching rate is used as the measure of the roasting effect. To determine the effect of various roasting parameters on the extraction of fine-grained gold from carbonaceous ore, and to identify the optimum conditions, single-factor tests such as roasting temperature, roasting time, and ventilation rate were carried out. The results are shown in Figure 2.
Roasting temperature is one of the most important factors in the roasting process, as it determines the degree of chemical reaction and phase change between minerals. The effect of roasting temperature on the gold leaching rate was studied under a roasting time of 2.0 h and aeration rate of 0.8 m3/h. The leaching conditions were: grinding to –0.074 mm, of 80% solids, pulp pH value of 11, sodium cyanide dosage of 1000 g/t, and leaching time of 24.0 h. The results are shown in Figure 2a.
Figure 2a shows that the gold leaching rate was only 12.50% when the raw ore was directly cyanide leaching. With the increase in roasting temperature, the leaching rate of gold first increased and then decreased. As the roasting temperature was increased from 450 to 650 °C, the leaching rate of gold increased from 82.33% to 92.55%, which is an increase of 12.50%. However, when the roasting temperature was increased further, the leaching rate of gold gradually decreased. Therefore, the optimum roasting temperature range is 600 to 700 °C.
Roasting time determines the degree of phase change between the minerals in the ore. If the roasting time is too short, the carbon and pyrite in the ore are not completely oxidized, and the gold-robbing effect of carbon remains significant, resulting in a poor gold leaching effect. If the roasting time is too long, energy consumption is high, and sintering easily occurs. Figure 2b depicts the experimental results of the effect of roasting time on gold leaching rate under a roasting temperature of 650 °C and aeration rate of 0.8 m3/h. Figure 2b shows that with an increase in roasting time, the leaching rate of gold first increased and then decreased slightly. As the roasting time was extended from 1.0 to 2.0 h, the leaching rate increased from 58.09% to 92.55%, which is an increase of 59.32%. When the roasting time was extended further to 3.0 h, the gold leaching rate decreased from 92.55% to 90.08%, which is a reduction of 2.67%. Therefore, the optimum roasting time is 1.75 to 2.25 h.
Ventilation is another one of the key factors in roasting. The oxidation of carbonaceous material and pyrite in ore is completed in an aerobic atmosphere. In addition, the increase in airflow through the roasting system is conducive to the decomposition of carbonate minerals in the ore, but if the flow rate is too high, a large amount of heat is lost. The ventilation rates of 0.2, 0.4, 0.6, 0.8, and 1.0 m3/h were selected for the single-factor test using a temperature and residence time of respectively 650 °C and 2.0 h. The effect of aeration on gold leaching rate is shown in Figure 2c. With increasing roasting ventilation, the gold leaching rate showed an increasing trend. When the aeration rate increased from 0.2 to 0.6 m3/h, the gold leaching rate increased from 86.45% to 92.55%, which is an increase of 7.06%. However, when the gas flow rate was increased further, the gold leaching rate remained essentially constant, hence the optimal range of aeration flow rate was 0.4 to 0.8 m3/h.
The practical problems with the oxidation roasting process are often more complex, and many factors need to be borne in mind in the selection of the optimum. According to the results of the single-factor experiments, (a) roasting temperature, (b) roasting time, and (c) roasting ventilation were selected as parameters for the orthogonal experiment. After grinding, the leaching test was conducted to investigate the interaction of various factors affecting the roasting effect. Each factor and level design in the test are shown in Table 4. The results of the orthogonal test are shown in Table 5. From Table 5, the average leaching rate of gold was found to be 90.65%. The average leaching rate of gold from test 4 was the highest, reaching 92.58%, whereas that from test 9 was the lowest, at 87.04%. By comparing the effects of each level of the same factor one by one, the optimal level can be found, and then the range of each level can be calculated. The range can determine the primary and secondary influences of each factor. The range analysis results of gold leaching rate at different levels are shown in Table 6. From Table 6, roasting temperature, roasting time, the interaction between roasting temperature and roasting time, and range of ventilation are 2.15%, 1.33%, 1.38%, and 2.72%, respectively. Therefore, in the range of roasting conditions, aeration rate had the most significant effect on gold leaching rate, followed by roasting temperature, and the interaction between roasting time and roasting temperature, and roasting time had little effect.

3.3. Effect of Calcination Ventilation on Crystal Structure of Minerals

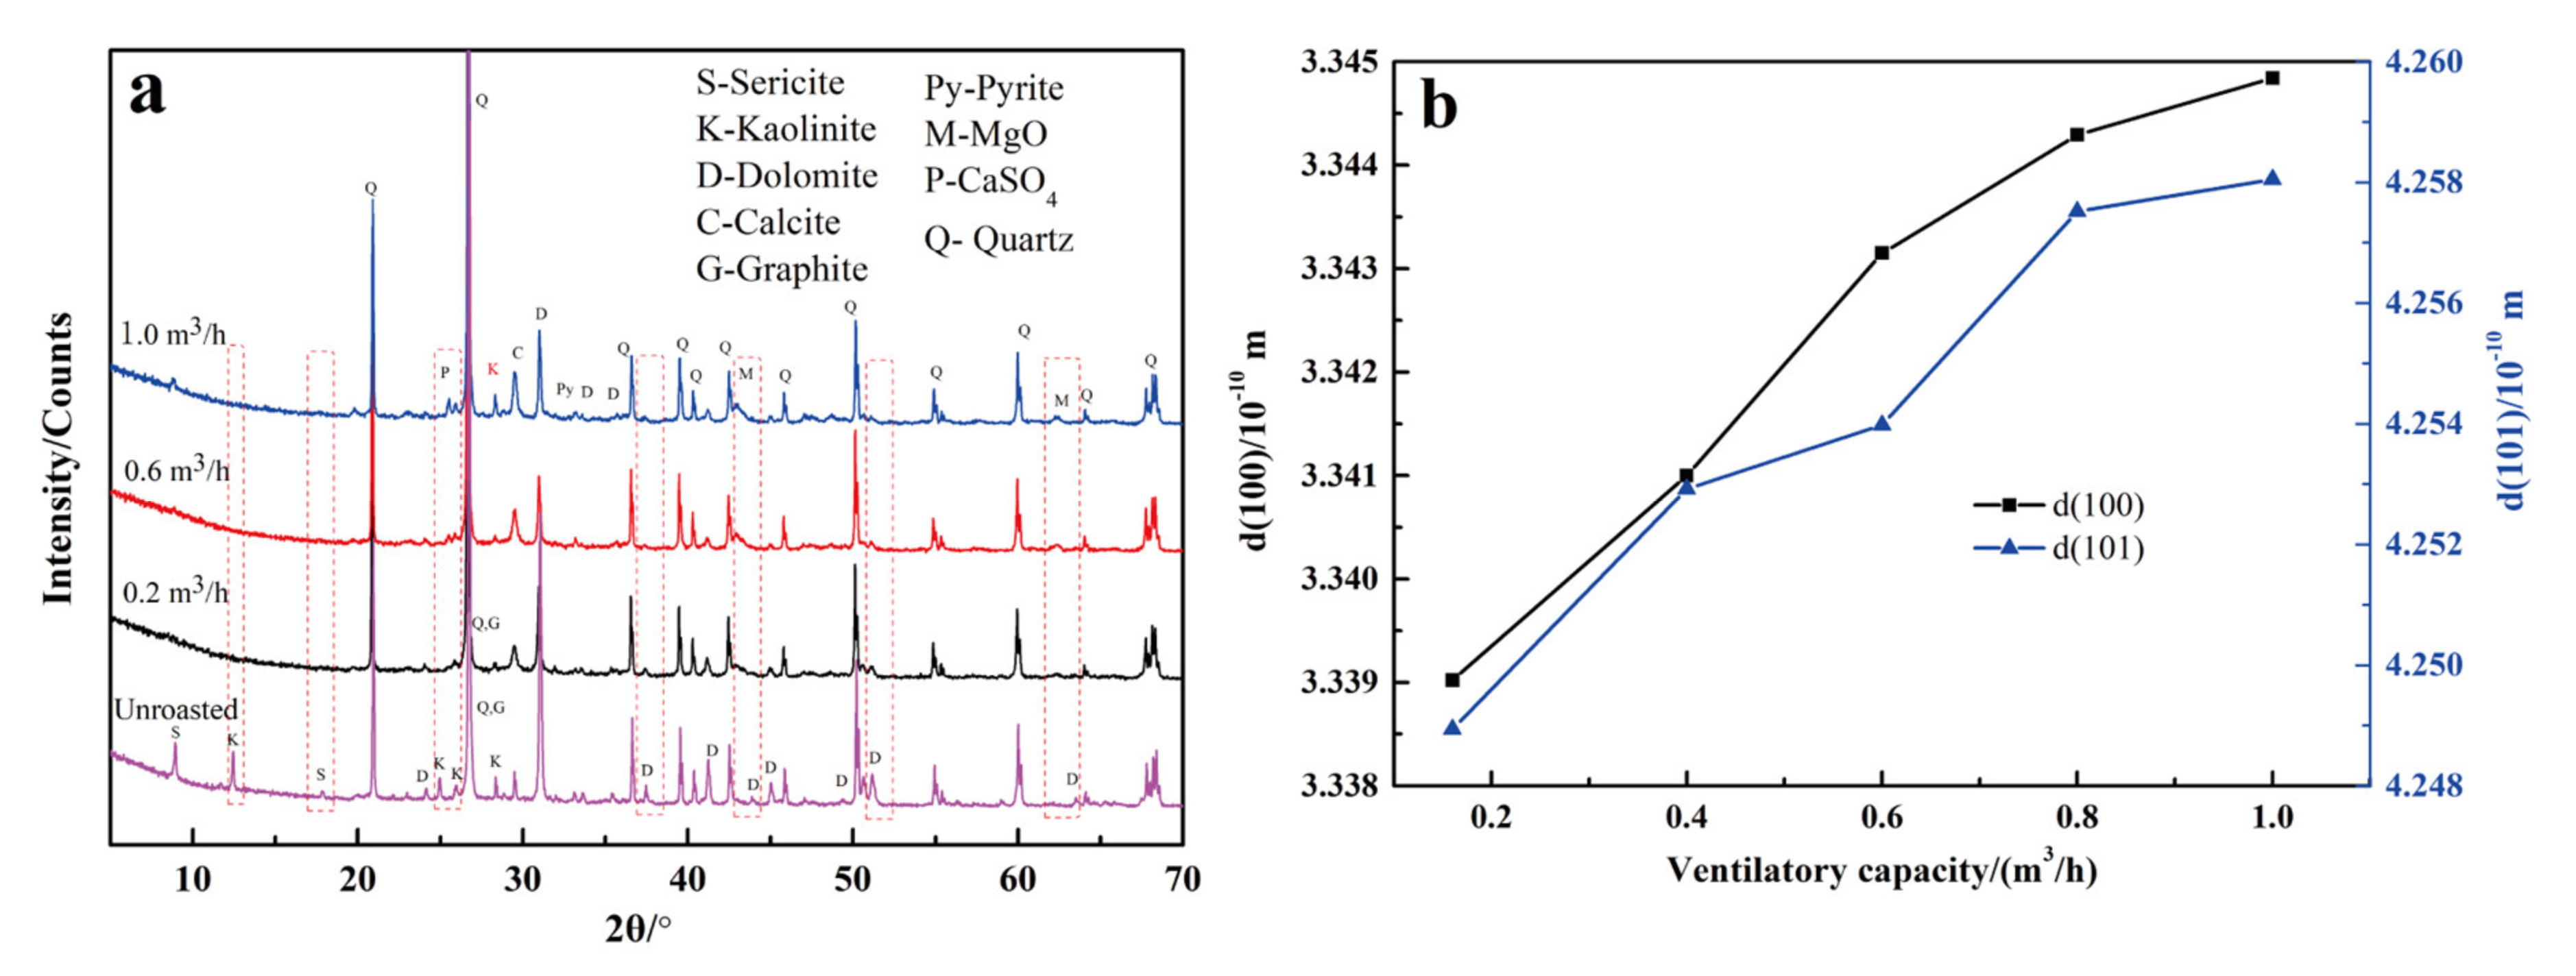
The orthogonal test of oxidation roasting showed that the aeration rate was the most important factor affecting the gold leaching effect. Therefore, the calcined samples under different calcination ventilation conditions (0.2, 0.4, 0.6, 0.8, and 1.0 m3/h) were analyzed, and the phase and crystal structure changes of calcine under different calcination ventilation conditions were investigated. The results are shown in Figure 3.
The characteristic diffraction peaks of sericite (d = 0.996 nm, d = 0.479 nm) disappeared (Figure 3a), those of kaolinite became weak, and those of graphite weakened but still existed when the calcination ventilation was 0.2 m3/h. This indicates that the sericite undergoes the dehydroxylation reaction under the low-ventilation conditions, and the reactions of kaolinite, dolomite, and carbonaceous material are incomplete. When the calcination ventilation increased to 0.6 m3/h, the diffraction peak of graphite disappeared, indicating that the carbon had been completely oxidized. By this time, the characteristic diffraction peak of MgO appeared, indicating that part of the dolomite began to decompose. The characteristic diffraction peak of MgO was more obvious and the characteristic peak of CaSO4 appeared when the ventilation continued to increase.
The diffraction angles of (100) and (101) crystal planes of quartz were 20.90° and 26.69°, respectively, when the calcination ventilation was 0.2 m3/h. When the calcination ventilation was increased to 0.6 m3/h, the diffraction angles of (100) and (101) crystal planes of quartz were 20.88° and 26.66°, respectively. The characteristic diffraction peak of quartz experienced a weak shift, but there was no diffraction peak of quartz, which indicated that the structure of quartz changed only slightly with the increase in ventilation. To further explore the influence of ventilation on the structure of quartz, the D100 and D101 crystal plane spacing values of quartz were analyzed, and the results are shown in Figure 3b. The results showed that the D100 and D101 values of quartz increased from 0.2 to 1.0 m3/h, indicating that the crystal structure of quartz gradually loosened with the increase in calcination ventilation. The reason for this finding may be that the crystal structure of quartz changes slightly during calcination.

3.4. Effect of Roasting Ventilation on Surface Groups of Minerals

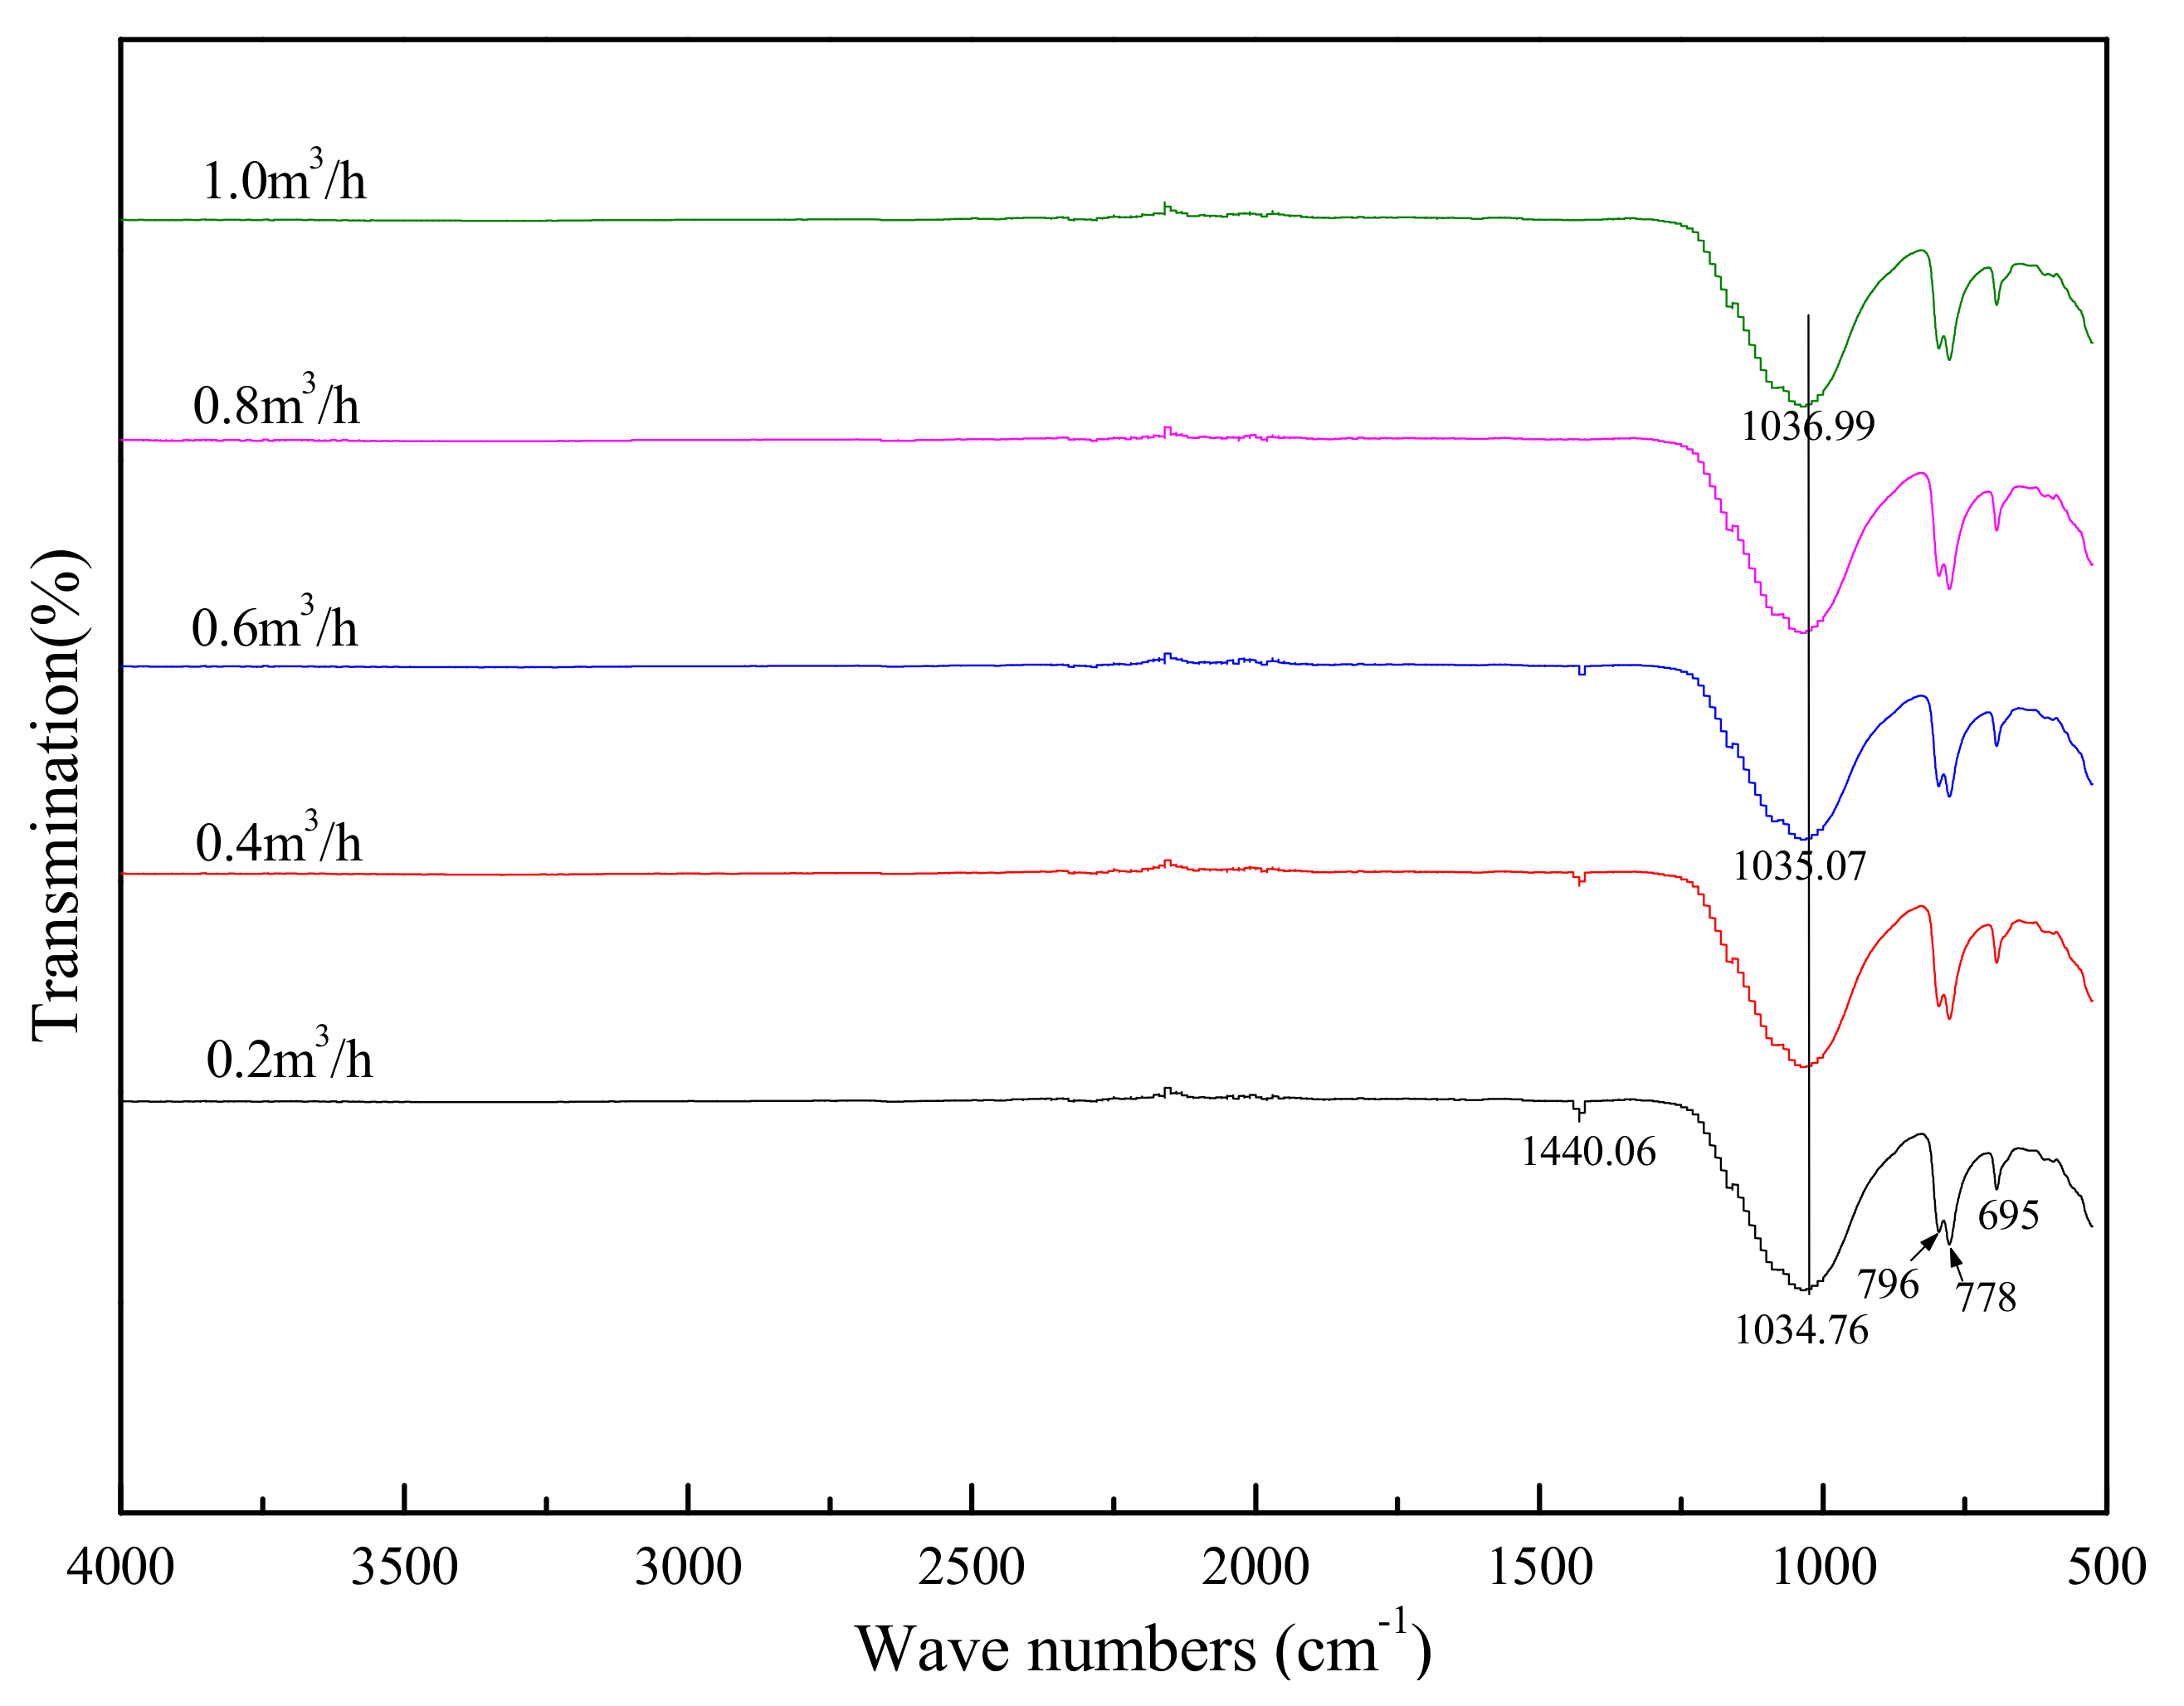
The XRD results showed that the crystal structure of quartz changed with the increase in calcination ventilation. It was difficult to analyze the subtle changes due to the small differences in the XRD characteristic diffraction peaks. FTIR was used to analyze the calcined samples under different aeration rates (0.2, 0.4, 0.6, 0.8, and 1.0 m3/h) to clarify the change rule of the surface groups of the calcined samples under different aeration rates. The results are shown in Figure 4.
The characteristic peak of sericite disappeared at a wave number of 3640 cm−1 under different ventilation conditions, indicating that sericite completed the dehydroxylation reaction, which is consistent with the results of XRD analysis. With the increase in ventilation, the absorption peak of the CO32− group stretching vibration peak at 1440 cm−1 gradually weakened. When the ventilation rate was 0.6 m3/h, the absorption peak disappeared, indicating that carbonate minerals decomposed more, which is consistent with the XRD analysis. The wave number near 1035 cm−1 was caused by the antisymmetric stretching vibration peak of Si–O–Si. With the increase in calcination ventilation, the wave number of the absorption peak increased from 1034.76 to 1036.99 cm−1. The shift in the band to high frequency indicated that the bond length of Si–O shortened and the vibration frequency accelerated, which continuously improved the connection degree of the calcine network, which is consistent with the results of the XRD analysis. Therefore, the gold leaching rate also increases with the increase in the aeration rate.

3.5. Effect of Roasting Ventilation on the Valence Bond of Mineral Surface Elements

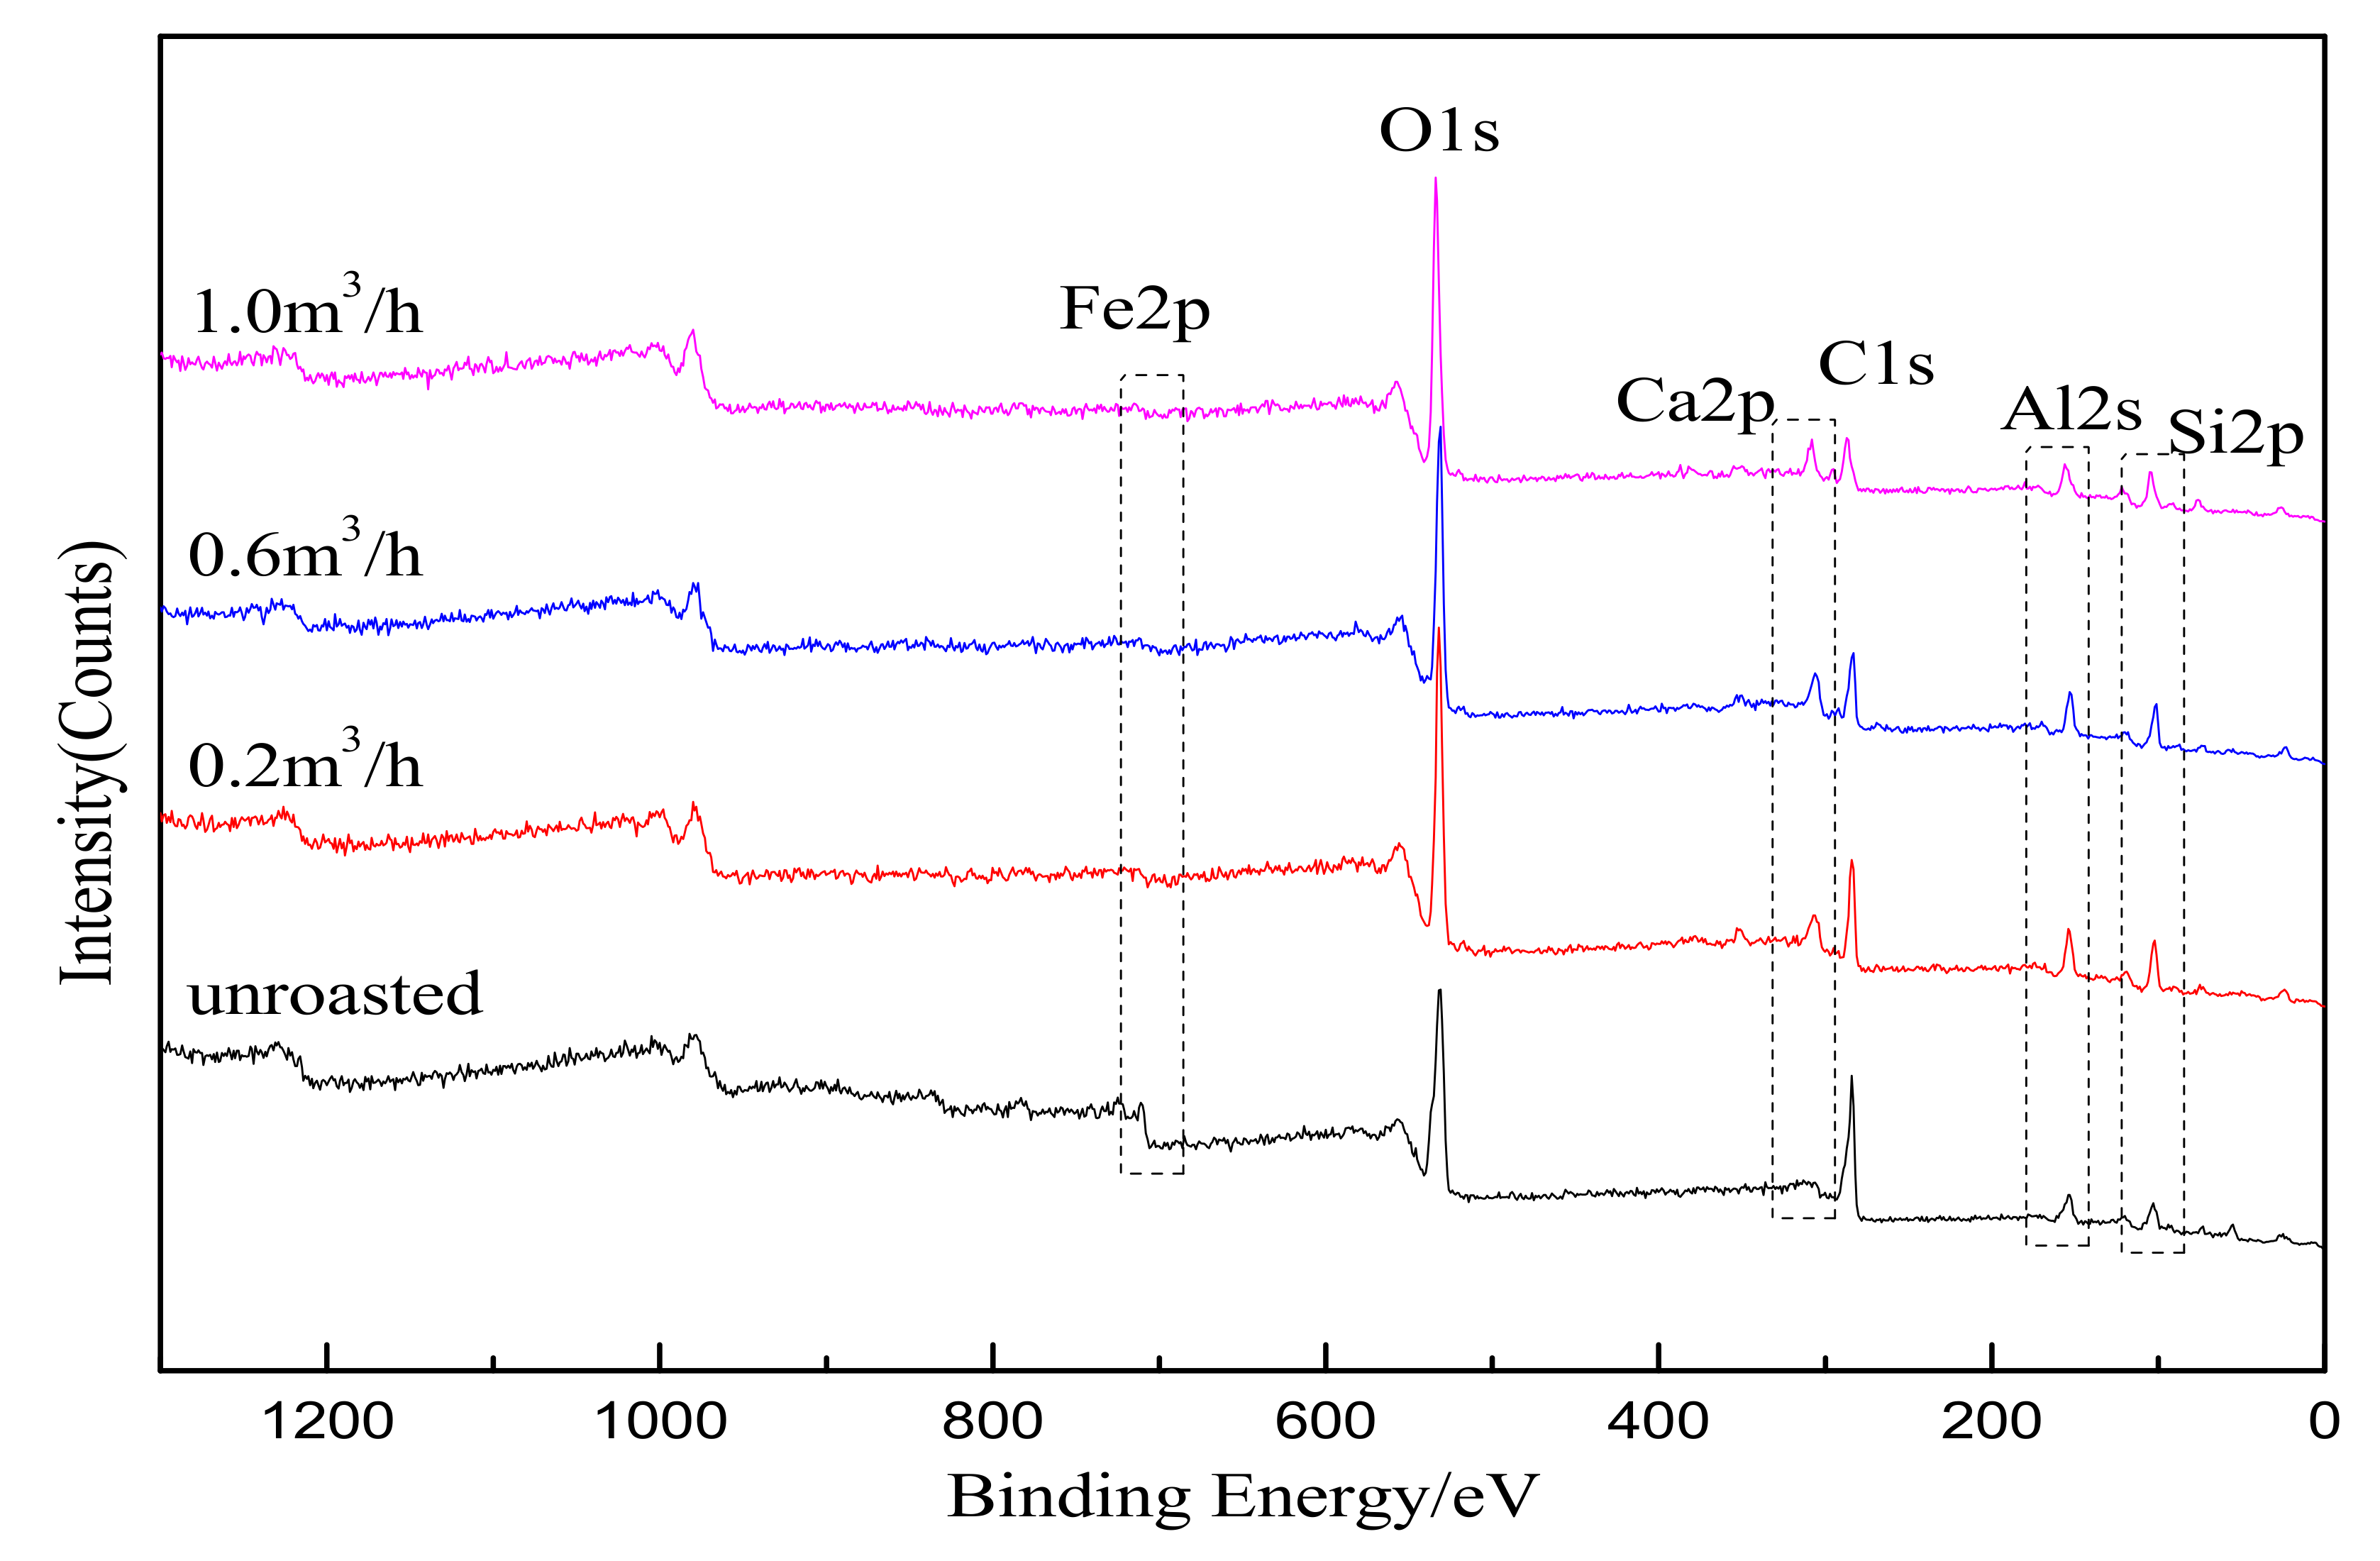
The XPS results of the calcine samples obtained by oxidation roasting of carbonaceous gold ore under different aeration rates are shown in Figure 5.
The main elements in the XPS spectra of carbon-bearing gold deposits obtained by different calcination ventilation are Fe, Al, Ca, Si, O, and C. Among them, C1s was the main C element in the organic compounds contaminated on the sample surface and the C element in the raw ore, whereas O1s was the main O element in the organic compounds contaminated on the sample surface and the O element in the raw ore. To further understand the changes in the elements in carbonaceous gold ore under different roasting ventilation rates, the binding energies of inner layer electrons of the elements on the mineral surface under different roasting ventilation rates were compared. The results are shown in Table 7.
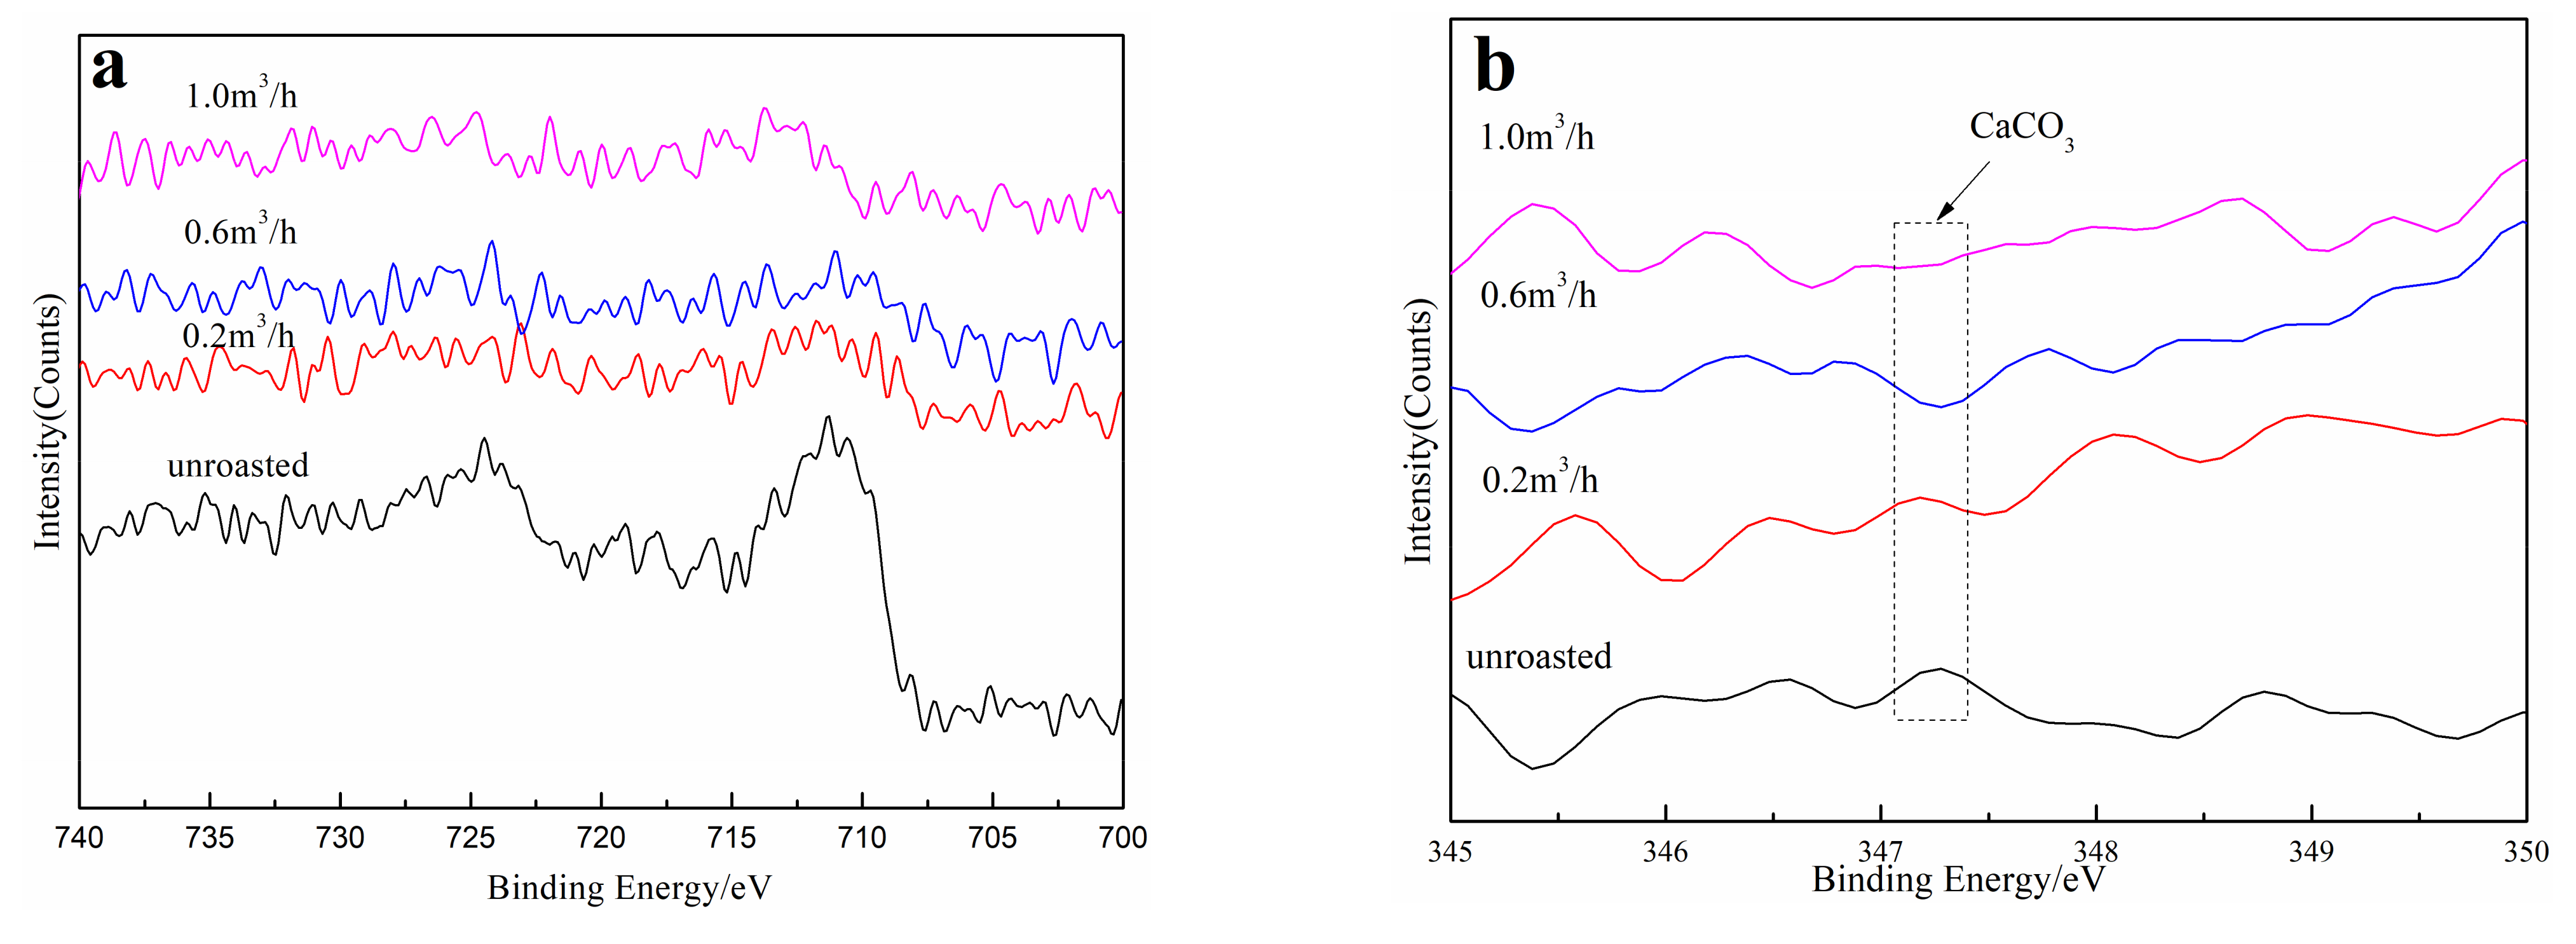
From Table 7, the shift in the amplitude of the characteristic peaks of O, C, Al, and Si in the samples under different ventilation rates was greater than 0.1 eV, indicating that the existing environment and binding morphology of O, C, Al, and Si changed significantly. The binding energies of Fe were 710.62, 712.07, 722.97, and 722.36 eV, respectively, showing that the characteristic peaks of Fe did not shift obviously at 0.2 m3/h calcination ventilation, but when the calcination ventilation rates were 0.2, 0.6, and 1.0 m3/h, new characteristic peaks with binding energies of 712.07, 722.97, and 722.36 eV formed. The binding energies of Ca are 348.08, 348.39, 348.88, and 349.00 eV, respectively. This shows that the characteristic peak of Ca underwent a weak shift with the calcination process under different calcination ventilation rates; that is, the existing state of Ca changed to a certain extent. To further explore the morphological changes in Fe and Ca under different calcination ventilation rates, narrow peak scanning of Fe and Ca was carried out, and the results are shown in Figure 6.
The binding energy of Fe2p is 710.62 eV, which is close to the binding energy of Fe (2p3/2) in FeS2 (710.60 eV) (Figure 6a), indicating that Fe on the surface of raw ore mainly exists in the form of FeS2. When the calcination rates were 0.2, 0.6, and 1.0 m3/h, the binding energies of Fe2p were 712.07, 722.97, and 722.36 eV, respectively. When the ventilation rate was 0.2 m3/h, the binding energy of Fe2p was 712.07 eV, which is close to that of Fe3O4 (2p1/2), indicating that the surface Fe existed in the form of Fe3O4. The binding energy of Fe2p was close to that of Fe2O3 (2p1/2) (724.00 eV) when the ventilation rate was 0.6 and 1.0 m3/h, which indicated that the carbonaceous gold ore was fully roasted, so the Fe element on its surface existed in the form of Fe2O3.
The binding energy (347.30 eV) of Ca (2P3/2) in the unburned samples was similar to that of Ca (347.28 eV) in CaCO3 (Figure 6b), indicating that the Ca on the surface of raw ore existed in the form of CaCO3. The binding energy of Ca (2P3/2) was 347.28 eV at 0.2 m3/h, which means that less decomposition reaction of CaCO3 on the sample surface occurred. The binding energy of Ca (2p3/2) changed to 348.05 and 348.11 eV when the calcination ventilation reached 0.6 and 1.0 m3/h, indicating that CaCO3 was completely decomposed. This shows that with the increase in calcination ventilation, the decomposition of calcite and dolomite can be promoted, which is conducive to the leaching of gold.

3.6. Effect of Calcination Ventilation on the Microporous Structure of Calcine

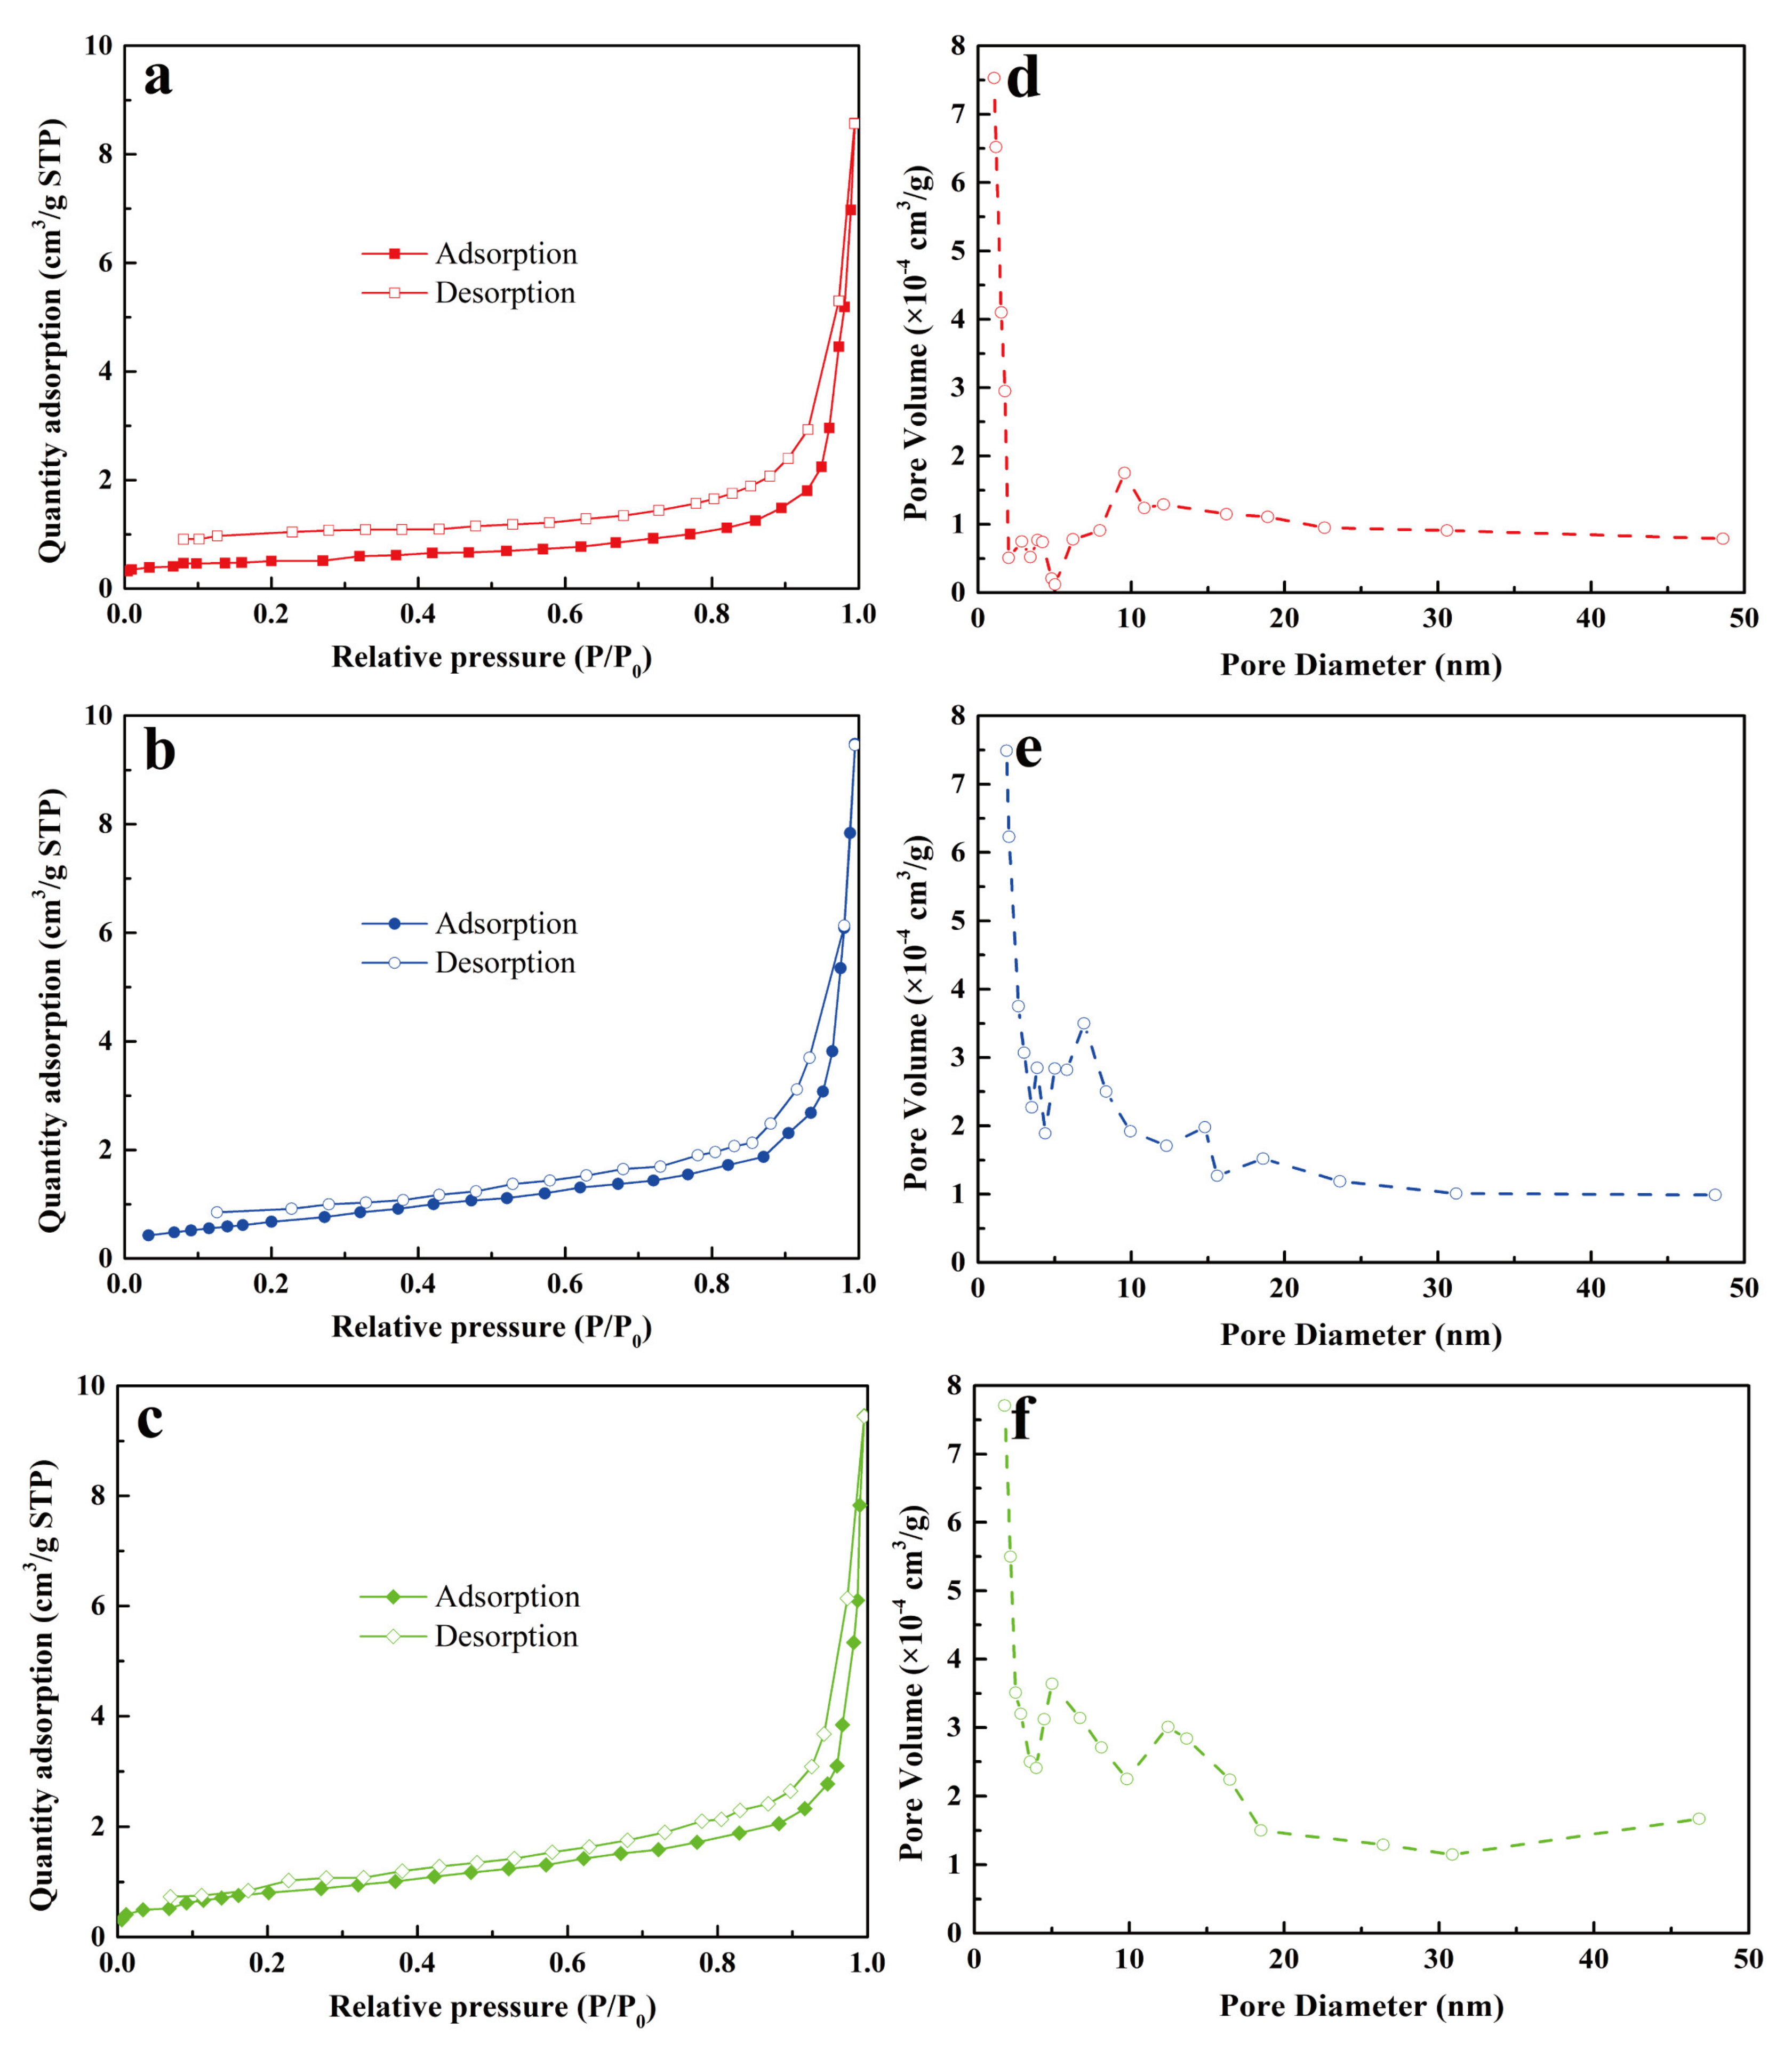
The aeration rate not only determines the concentration of oxygen in the roasting process but is also conducive to the timely discharge of CO2 generated in the reaction and the decomposition of oxidant. The N2-adsorption–desorption isotherms of calcine at different aeration rates (0.2, 0.6, and 1.0 m3/h) and the total pore volume are shown in Figure 7.
From the low-pressure section to the relative pressure (P/P0) of about 0.9, the adsorption capacity changed little. When the relative pressure exceeded 0.9, the adsorption capacity increased sharply with the increase in relative pressure. The desorption branch of the adsorption isotherm separated from the adsorption branch at a relative pressure of about 0.98. Over the entire pressure range, the separation of the desorption branch and the adsorption branch formed an obvious adsorption loop. When the relative pressure was less than 0.95, the adsorption and desorption branches were almost parallel. In the range of relative pressure from 0.95 to 1, both adsorption and desorption branches were vertical. Therefore, it was inferred that the channels in the calcine are slit or closed at one end, and the shape and size of these channels are non-uniform. Under 0.2 m3/h of ventilation, due to the lack of oxygen, the combustion reaction of raw ore is slow, a large amount of carbon cannot completely react, and the decomposition reaction of carbonate minerals cannot occur. The gold-robbing material can, therefore, not be completely eliminated, and the channels are closed at one end. This makes it difficult to leach gold from the calcine, which is one of the reasons for the low gold leaching rate.
With the increase in ventilation, hysteresis loops appeared in the curves shown in Figure 7a–c. When the ventilation rate increased from 0.6 to 1.0 m3/h, the shape of the hysteresis loop did not change significantly but slightly shifted to the right. Over the range of relative pressure 0.5 to 0.95, an obvious adsorption loop was observed. The hysteresis loop of 1.0 m3/h calcine shifted to the right, which also showed that the increase in airflow is beneficial to the increase in pore diameter and number of channels. The increase in the number of pores in the calcine is beneficial to the improvement in the gold leaching rate, which is also consistent with the leaching test results.
According to the N2 adsorption–desorption isotherms of calcine under different aeration rates, the pore size distribution and pore structure parameters of calcine under different aeration rates (0.2, 0.6, and 1.0 m3/h) were obtained using the BJH method. The results are shown in Figure 7d–f.
The total pore volume increased with the increase in aeration during roasting (Figure 7d–f). However, when the ventilation rate increased from 0.6 to 1.0 m3/h, the total pore volume increased slightly. When the aeration rate was 0.2 m3/h, the micropores of 1 to 2 nm in the calcine accounted for the largest proportion due to the low oxygen concentration and incomplete chemical reactions. With the increase in the aeration rate, the number of 1 to 2 nm micropores in the calcine decreased sharply, while the number of 5 to 20 nm mesopores increased significantly. The results showed that with the increase in aeration, both oxidation and decomposition reactions occur, which increases the number of 2–10 nm mesopores in the calcine and helps to improve the gold leaching rate.
The BET specific surface area, total pore volume, and average pore size were calculated according to the pore size distribution of calcine under different calcination ventilation rates (0.2, 0.6, and 1.0 m3/h). The results are shown in Table 8.
Table 8 shows that when the ventilation rate increased from 0.2 to 0.6 m3/h, the BET specific surface area, total pore volume, and average pore size increased by 1.06 m2/g, 0.010 cm3/g, and 2.15 nm, respectively, because the increase in calcination ventilation increased the oxygen concentration during calcination, which more fully calcined the sample. Therefore, increasing ventilation can greatly improve the pore structure parameters of calcined samples. However, the BET specific surface area, total pore volume, and average pore size increased by 0.0925 m2/g, 0.000105 cm3/g, and 1.06851 nm, respectively, when the aeration rate was increased to 1.0 m3/h. The reason for this finding may be that when the ventilation rate reached 0.6 m3/h, the oxygen demand of the roasting process was met. Therefore, increasing the aeration rate beyond this had little effect on the pore structure parameters of the roasted samples, which is consistent with the results of the roasting leaching test.
3.7. Effect of Calcination Ventilation on the Surface Morphology of Calcine

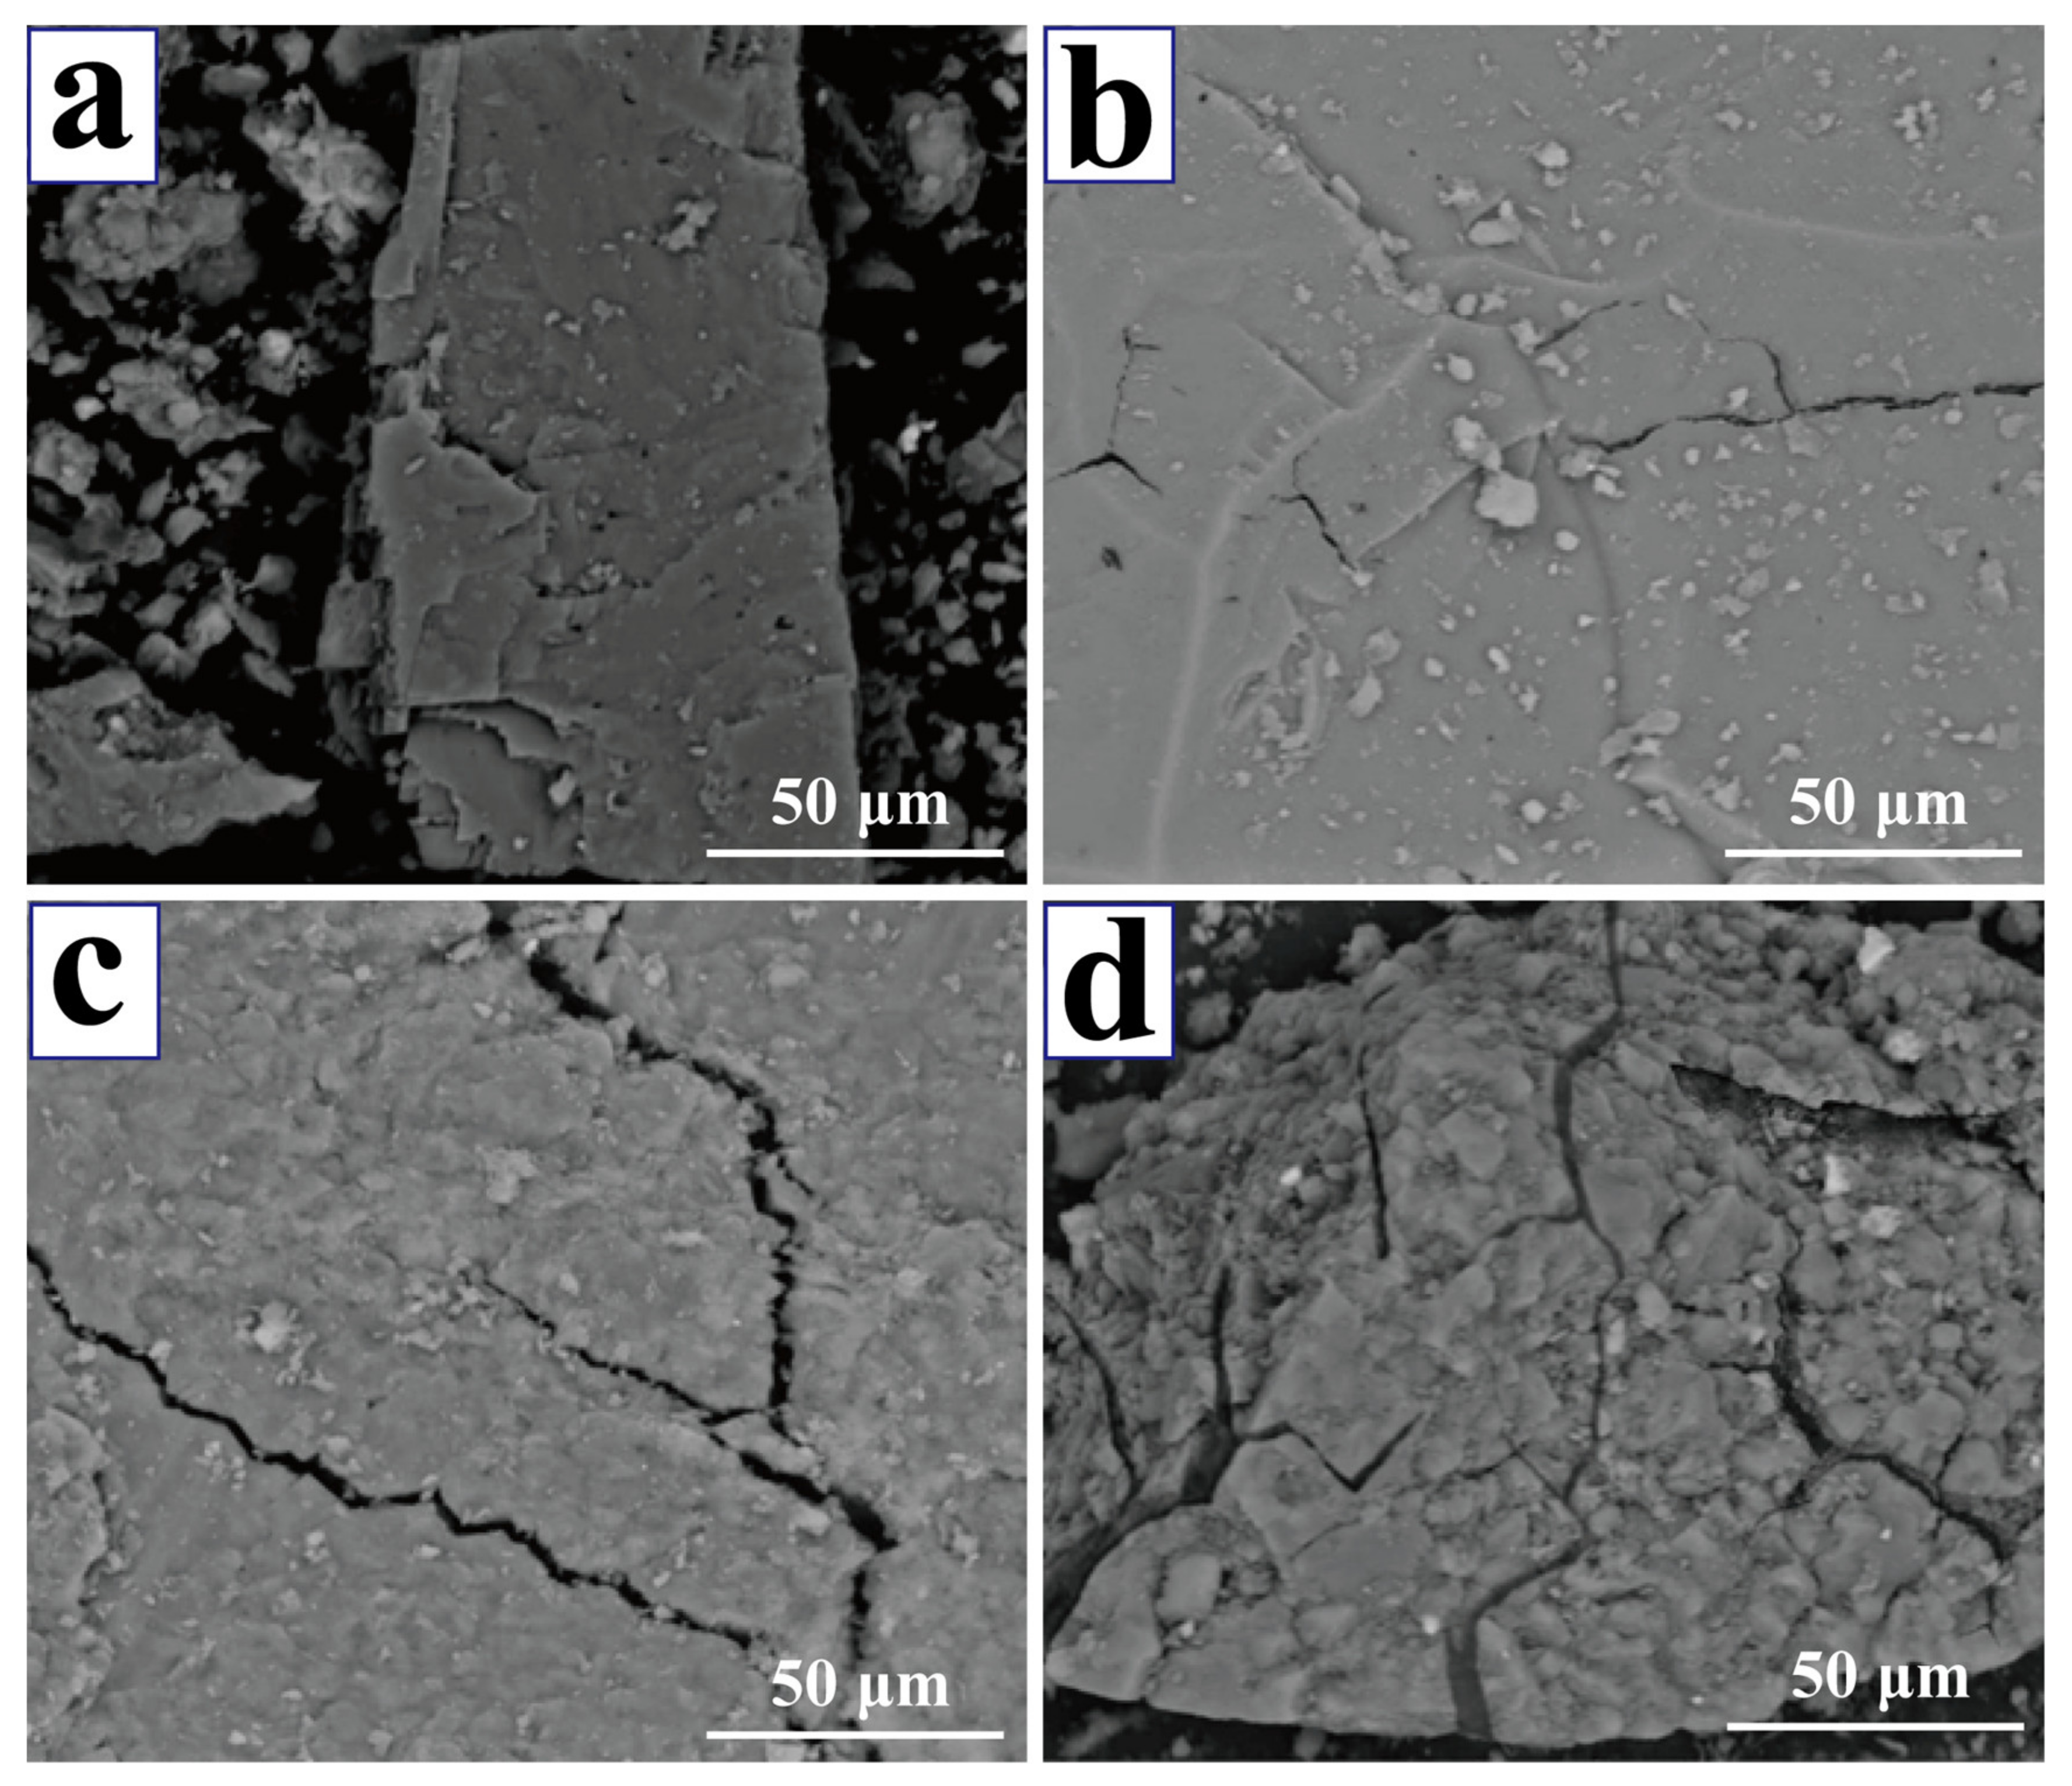
To characterize the sintering degree of calcine under different aeration rates, SEM images were captured of carbonaceous gold ore and calcine under aeration rates of 0.2, 0.6, and 1.0 m3/h, as shown in Figure 8.
Figure 8a shows that the carbonaceous matter in the ore was closely associated with quartz, and the surface was relatively dense. Figure 8b shows that the surface of calcine became loose and micropores appeared with proper ventilation, but the surface structure did not change greatly. Figure 8c shows that with the increase in ventilation, the surface of calcine was loose and porous, large cracks appeared, and the pore structure was rich. In Figure 8d, the cracks on the surface of calcine became larger with increased airflow, which indicates that the increase in airflow is conducive to the oxidation reaction or decomposition reaction of different minerals and the improvement in the gold leaching rate.

4. Conclusions

  • The results of the oxidation roasting leaching test showed that the leaching rate of gold was only 12.50% when the raw ore was directly cyanide leached. Using a suitable roasting temperature, roasting time, and aeration rate is beneficial to improving the gold leaching rate. The optimum roasting temperature is 600 to 700 °C, roasting time is 1.75 to 2.25 h, and ventilation rate is 0.4 to 0.8 m3/h. The orthogonal test of the roasting operation showed that the factors of the roasting process had a significant effect on gold leaching rate in the following decreasing order: ventilation rate > roasting temperature > roasting time; the leaching rate was 92.45% under the optimal conditions.
  • Under suitable roasting conditions, the carbonaceous matter and pyrite in the ore are oxidized, while the carbonate minerals such as dolomite and calcite and clay minerals are decomposed, and the gold-robbing materials lose their activity. With the release of CO2, SO, O2, and other gases, cracks appear on the surface of calcine, which is conducive to the reaction of CN with Au in the leaching process and is thus conducive to the improvement in gold leaching rate.

Author Contributions

H.L. and W.X. conceived of and designed the experiments; J.J. prepared the samples and performed the experiments; H.L. and J.J. analyzed the data and W.X. and Y.H. contributed to the writing and revising of the paper. All authors have read and agreed to the published version of the manuscript.

Funding

This research was funded by the National Natural Science Foundation of China (No. 52074068) and the Scientific Research Plan Projects of Shaanxi Education Department (No. 20JS073).

Data Availability Statement

Not Applicable.

Conflicts of Interest

The authors declare no conflict of interest.

References

  1. Torrance, K.W.; Redwood, S.D.; Cecchi, A. The impact of artisanal gold mining, ore processing and mineralization on water quality in Marmato, Colombia. Environ. Geochem. Heal. 2021, 1–18. [Google Scholar] [CrossRef]
  2. Barani, K.; Dehghani, M.; Azadi, M.; Karrech, A. Leaching of a polymetal gold ore and reducing cyanide consumption using cyanide-glycine solutions. Miner. Eng. 2021, 163, 106802. [Google Scholar] [CrossRef]
  3. Gao, P.; Qin, Y.-H.; Han, Y.-X.; Li, Y.-J.; Liu, S.-Y. Strengthening leaching effect of Carlin-type gold via high-voltage pulsed discharge pretreatment. Int. J. Miner. Met. Mater. 2021, 1–9. [Google Scholar] [CrossRef]
  4. Asamoah, R.K. Specific Refractory Gold Flotation and Bio-Oxidation Products: Research Overview. Minerals 2021, 11, 93. [Google Scholar] [CrossRef]
  5. Cao, P.; Zhang, S.-H.; Zheng, Y.-J.; He, H.-B.; Lai, S.-Z.; Wang, X.-J.; Tan, B. Differences of cyanide leaching between calcine and dust from refractory gold concentrates. Trans. Nonferrous Met. Soc. China 2020, 30, 1964–1979. [Google Scholar] [CrossRef]
  6. Zhao, H.-F.; Yang, H.-Y.; Tong, L.-L.; Zhang, Q.; Kong, Y. Biooxidation-thiosulfate leaching of refractory gold concentrate. Int. J. Miner. Met. Mater. 2020, 27, 1075–1082. [Google Scholar] [CrossRef]
  7. Munive, G.T.; Encinas, M.A.; Campoy, M.M.S.; Álvarez, V.E.; Vazquez, V.M.; Choque, D.C. Leaching Gold and Silver with an Alternative System: Glycine and Thiosulfate from Mineral Tailings. JOM 2019, 72, 918–924. [Google Scholar] [CrossRef]
  8. Wang, H.; Feng, Y.; Li, H.; Kang, J. The separation of gold and vanadium in carbonaceous gold ore by one-step roasting method. Powder Technol. 2019, 355, 191–200. [Google Scholar] [CrossRef]
  9. Wang, J.; Wang, W.; Dong, K.; Fu, Y.; Xie, F. Research on leaching of carbonaceous gold ore with copper-ammonia-thiosulfate solutions. Miner. Eng. 2019, 137, 232–240. [Google Scholar] [CrossRef]
  10. Jin, J.; Han, Y.; Li, H.; Huai, Y.; Peng, Y.; Gu, X.; Yang, W. Mineral phase and structure changes during roasting of fine-grained carbonaceous gold ores and their effects on gold leaching efficiency. Chin. J. Chem. Eng. 2019, 27, 1184–1190. [Google Scholar] [CrossRef] [Green Version]
  11. Zhang, S.-H.; Zheng, Y.-J.; Cao, P.; Li, C.-H.; Lai, S.-Z.; Wang, X.-J. Process mineralogy characteristics of acid leaching residue produced in low-temperature roasting-acid leaching pretreatment process of refractory gold concentrates. Int. J. Miner. Met. Mater. 2018, 25, 1132–1139. [Google Scholar] [CrossRef]
  12. Han, Y.; Jin, J.; Li, H.; Lei, D.; Wang, Y.; Gu, X. Study on the Mechanism of Oxidation Roasting of Carbonaceous Fine-Grained Gold Ores Based on XRD and SEM. Spectrosc. Spectr. Anal. 2018, 38, 1592–1598. [Google Scholar]
  13. Sitando, O.; Senanayake, G.; Dai, X.; Nikoloski, A.; Breuer, P. A review of factors affecting gold leaching in non-ammoniacal thiosulfate solutions including degradation and in-situ generation of thiosulfate. Hydrometallurgy 2018, 178, 151–175. [Google Scholar] [CrossRef]
  14. Abdollahi, H.; Karimi, P.; Amini, A.; Akcil, A. Direct cyanidation and roasting combination of a semi-refractory massive sulfide ore. Min. Met. Explor. 2015, 32, 161–169. [Google Scholar] [CrossRef]
  15. Amankwah, R.; Pickles, C. Microwave roasting of a carbonaceous sulphidic gold concentrate. Miner. Eng. 2009, 22, 1095–1101. [Google Scholar] [CrossRef]
  16. Xu, B.; Yang, Y.; Li, Q.; Jiang, T.; Liu, S.; Li, G. The development of an environmentally friendly leaching process of a high C, As and Sb bearing sulfide gold concentrate. Miner. Eng. 2016, 89, 138–147. [Google Scholar] [CrossRef]
  17. Huang, X.; Zhu, T.; Duan, W.; Liang, S.; Li, G.; Xiao, W. Comparative studies on catalytic mechanisms for natural chalcopyrite-induced Fenton oxidation: Effect of chalcopyrite type. J. Hazard. Mater. 2020, 381, 120998. [Google Scholar] [CrossRef] [PubMed]
  18. Xiao, W.; Ren, Y.-X.; Yang, J.; Cao, P.; Wang, J.; Qin, W.-Q.; Qiu, G.-Z. Adsorption mechanism of sodium oleate and styryl phosphonic acid on rutile and amphibole surfaces. Trans. Nonferrous Met. Soc. China 2019, 29, 1939–1947. [Google Scholar] [CrossRef]
  19. Fernández, R.R.; Sohn, H.Y.; LeVier, K.M. Process for treating refractory gold ores by roasting under oxidizing conditions. Min. Met. Explor. 2000, 17, 1–6. [Google Scholar] [CrossRef]
  20. Yang, H.-Y.; Liu, Q.; Song, X.-L.; Dong, J.-K. Research status of carbonaceous matter in carbonaceous gold ores and bio-oxidation pretreatment. Trans. Nonferrous Met. Soc. China 2013, 23, 3405–3411. [Google Scholar] [CrossRef]
Figure 1. The process mineralogical analysis of raw ore. (a) The native gold is surrounded by limonite, carbonaceous and pyrite fragments; (b) Natural gold is associated with pyrite and carbonaceous; (c) Natural gold and carbon debris are symbiotic with each other; (d) The characteristics of carbon embedded fabric.
Minerals 11 00558 g001
Figure 2. Effects of roasting temperature, roasting time, and ventilation rate on the gold leaching rate. (a) temperature; (b) time; (c) ventilation rate.
Minerals 11 00558 g002
Figure 3. (a) XRD patterns of samples roasted at different ventilations and (b) effect of ventilation on quartz d100 and d101.
Minerals 11 00558 g003
Figure 4. FTIR spectra of calcine at different ventilations.
Minerals 11 00558 g004
Figure 5. XPS total spectrum of calcine at different ventilatory volumes.
Minerals 11 00558 g005
Figure 6. Ca2p (a) and Fe2p (b) narrow peak scanning of XPS on calcine surface at different ventilatory volumes.
Minerals 11 00558 g006
Figure 7. The adsorption–desorption isotherms (a–c) and the total pore volume (d–f) at different aeration rates.
Minerals 11 00558 g007
Figure 8. SEM images of ore and calcine at ventilatory volume: (a) raw ore; (b) roasted at 0.2 m3/h; (c) roasted at 0.6 m3/h; (d) roasted at 1.0 m3/h.
Minerals 11 00558 g008
Table 1. Chemical composition analysis of raw ore.
ElementAu*Ag*SiO2Total
Carbon
Al2O3TFeMgOIgnition Loss
Content/%5.468.667.396.842.312.102.2316.90
Note: The unit of “*” is g/t.
Table 2. Chemical phase analysis of gold in the raw ore.
Physical PhaseLiberated/Exposed
Gold
Gold
in Carbonate
Gold
in Hematite
Gold
in Sulfide
Gold
in Silicate
Total
Content/×10−61.990.260.461.061.435.20
Distribution/%38.275.008.8520.3827.50100.00
Table 3. Chemical phase analysis of carbon in the raw ore.
Physical PhaseCarbon in CarbonateOrganic CarbonGraphite CarbonTotal
Content/%3.561.331.506.39
Distribution/%55.7120.8123.47100.00
Table 4. Different levels of factor and the amount of orthogonal experiment for roasting.
LevelTemperature (°C)Time (h)Ventilation (m3/h)
16001.750.60
26502.000.80
37002.251.00
Table 5. The result of the orthogonal experiment.
NumberTemperature (°C)Time (h)C(A × B)Ventilation (m3/h)Leaching Rate of Gold (%)
1111188.63
2122290.61
3133391.72
4212392.58
5223191.90
6231291.19
7313290.76
8321391.44
9332187.04
Table 6. The result of extreme difference analysis in orthogonal tests.
NumberTemperature (°C)Time (h)C(A × B)Ventilation (m3/h)
1541.91543.93542.51535.13
2551.34547.89540.45545.11
3538.45539.88548.74551.46
490.3290.6690.4289.19
591.8991.3290.0890.85
689.7489.9891.4691.91
R2.151.331.382.72
Table 7. Binding energy of inner layer electrons of mineral surface elements at different ventilatory volumes.
Ventilatory (m3/h)Binding Energy (eV)
FeOCaCAlSi
Control710.62531.17348.08284.60120.13102.85
0.2712.07531.55348.12284.61119.06102.71
0.4722.97531.12348.05284.58118.98102.65
0.6722.36531.16348.11286.29118.96102.59
Table 8. Pore parameters of samples roasted at different ventilations.
Ventilation (m3/h)BET Specific Surface Area (m2/g)Total Pore Volume (cm3/g)Average Pore Size (nm)
Control2.050.009418.02
0.22.050.009318.20
0.63.120.019820.36
1.03.210.019921.43
Publisher’s Note: MDPI stays neutral with regard to jurisdictional claims in published maps and institutional affiliations.