
Methodological Approach (In Situ and Laboratory) for the Characterisation of Late Prehistoric Rock Paintings—Penedo Gordo (NW Spain)

 ,
, 

Abstract
1. Introduction
- Could they bring additional data to inform us about the sequence of rock art production on site?
- To what extend could these analyses help us distinguish between red patches of pigment and natural mineral intrusions present in decorated panels?
- Does the red coat found on stone fragments exhumed in excavation correspond to natural mineral intrusions or actual paint? Could the samples bearing red mineral intrusions have been a local source of raw material for prehistoric paintings?
2. Materials and Methods
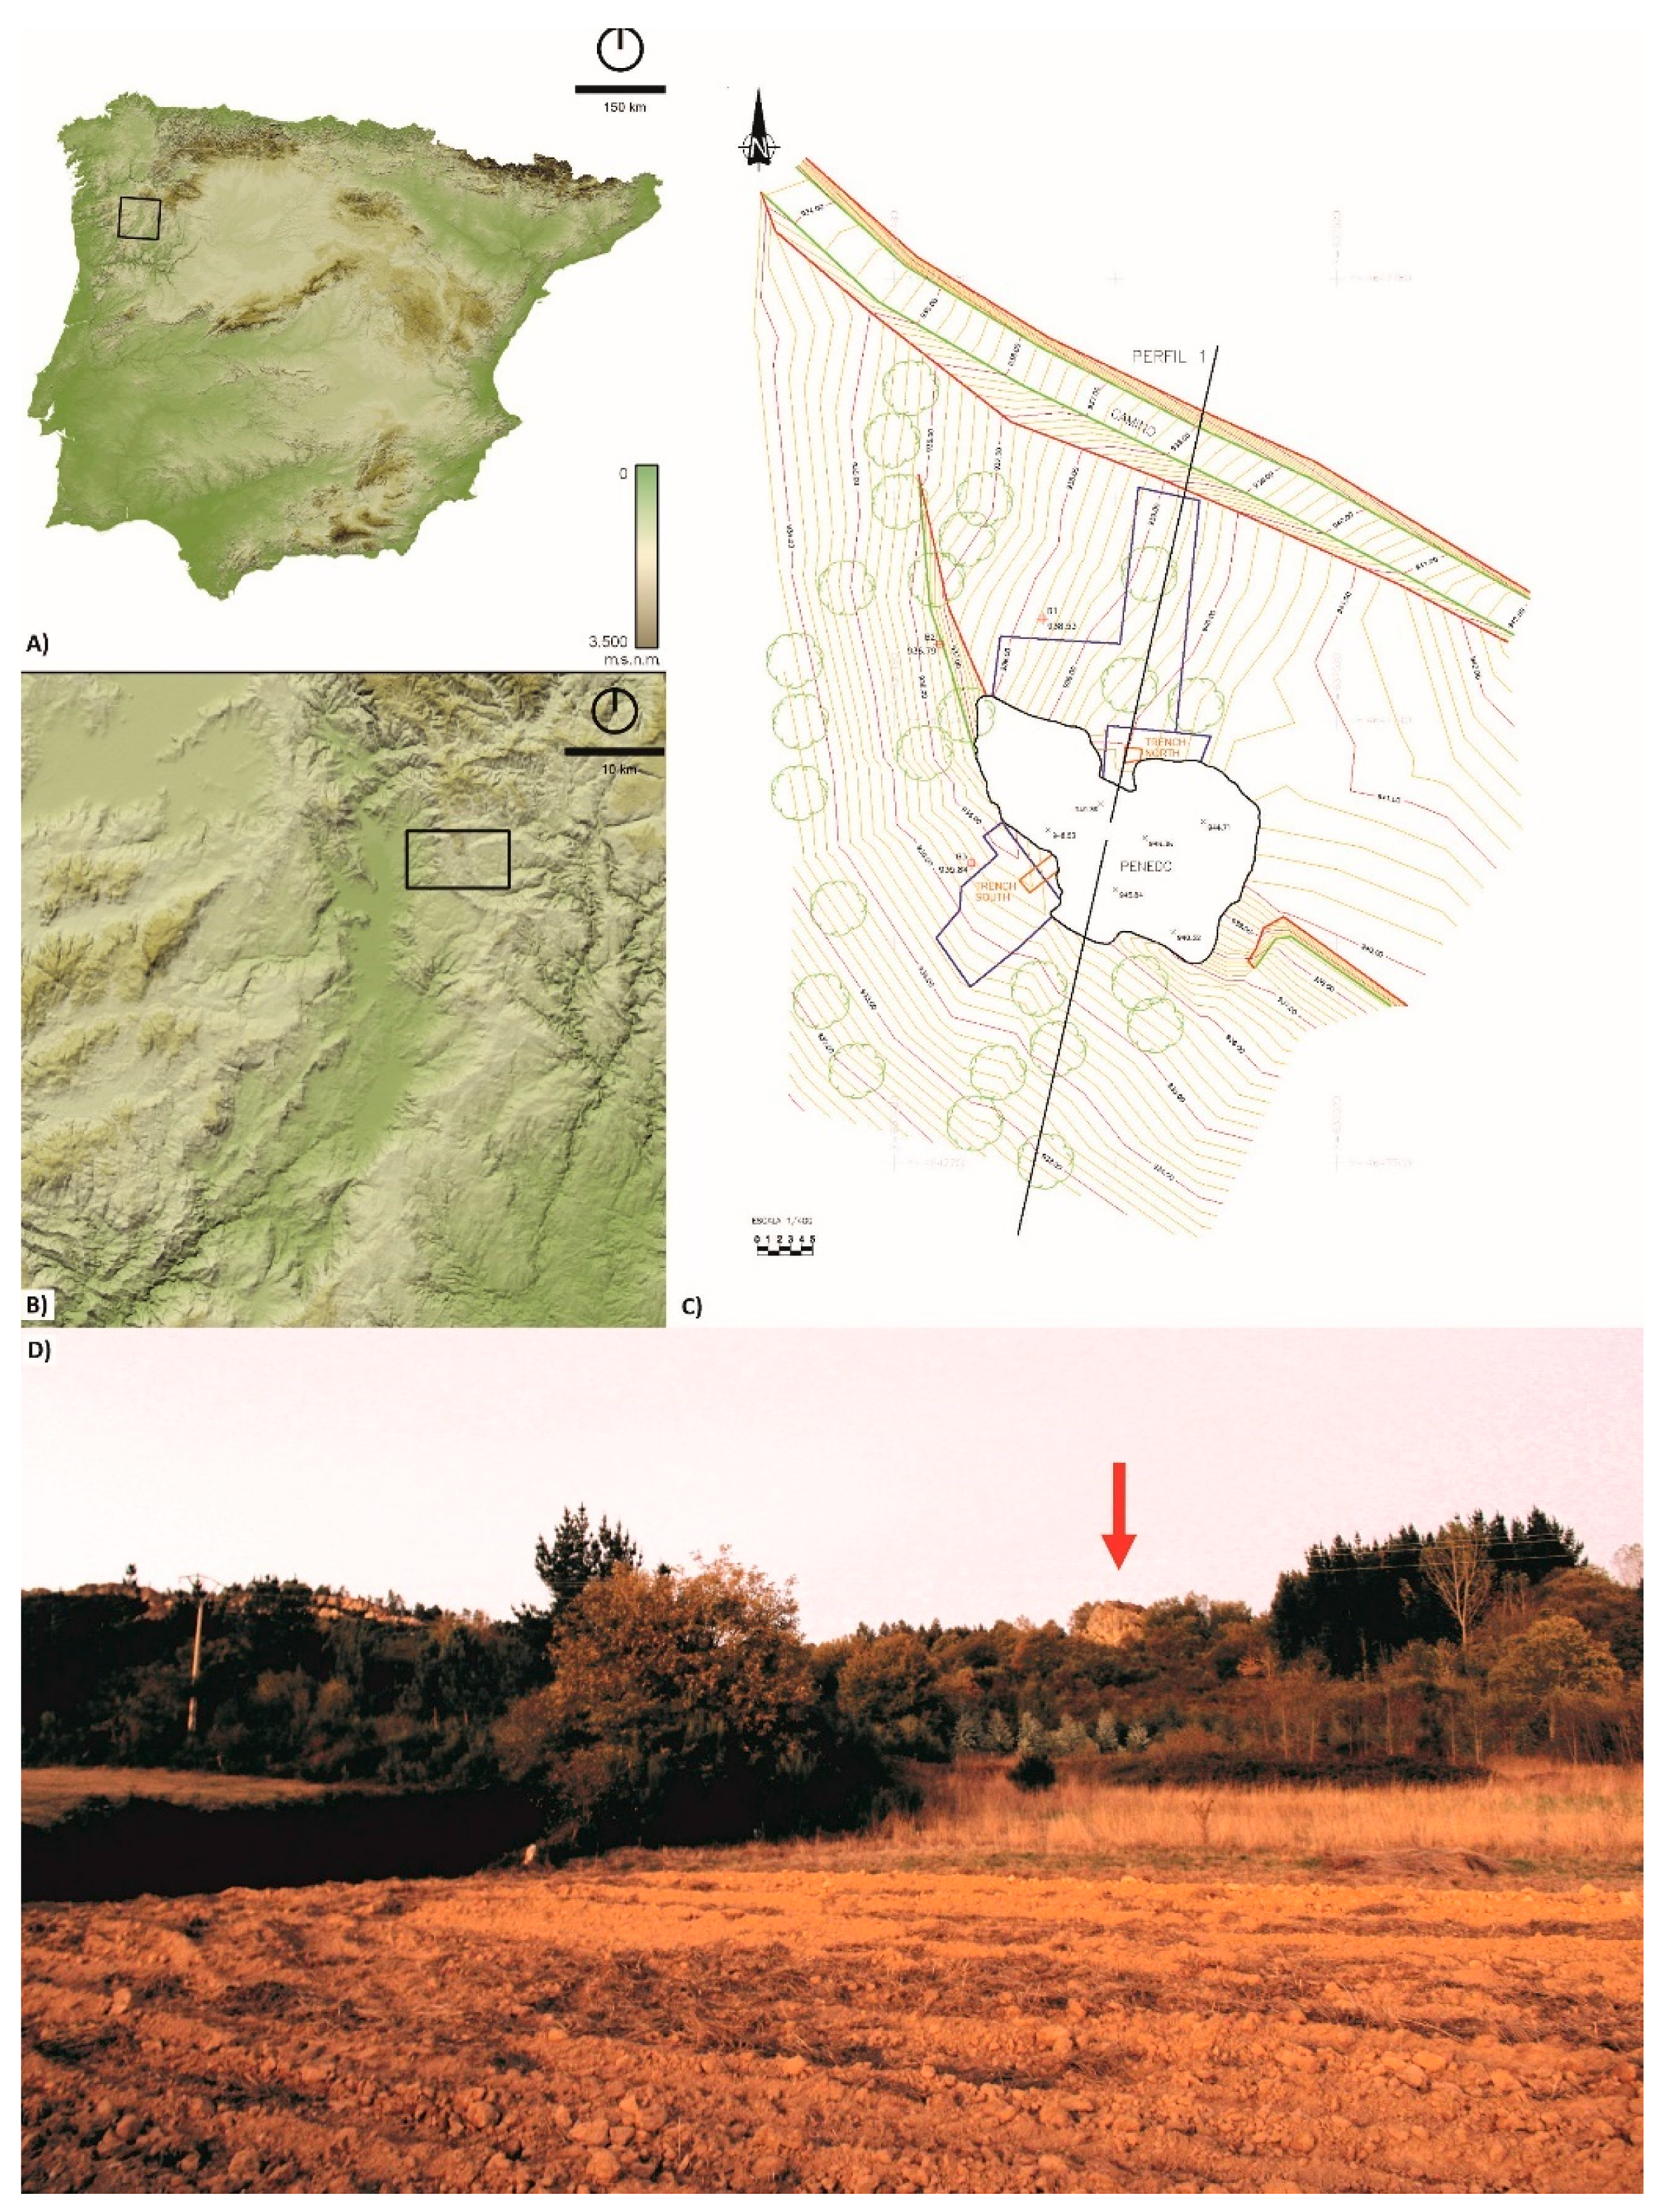
2.1. The Rock Art Site: Penedo Gordo (Vilardevós, Ourense, NW Spain)
2.2. Analytical Protocol
2.2.1. In Situ Characterisation
2.2.2. In Laboratory Characterisation
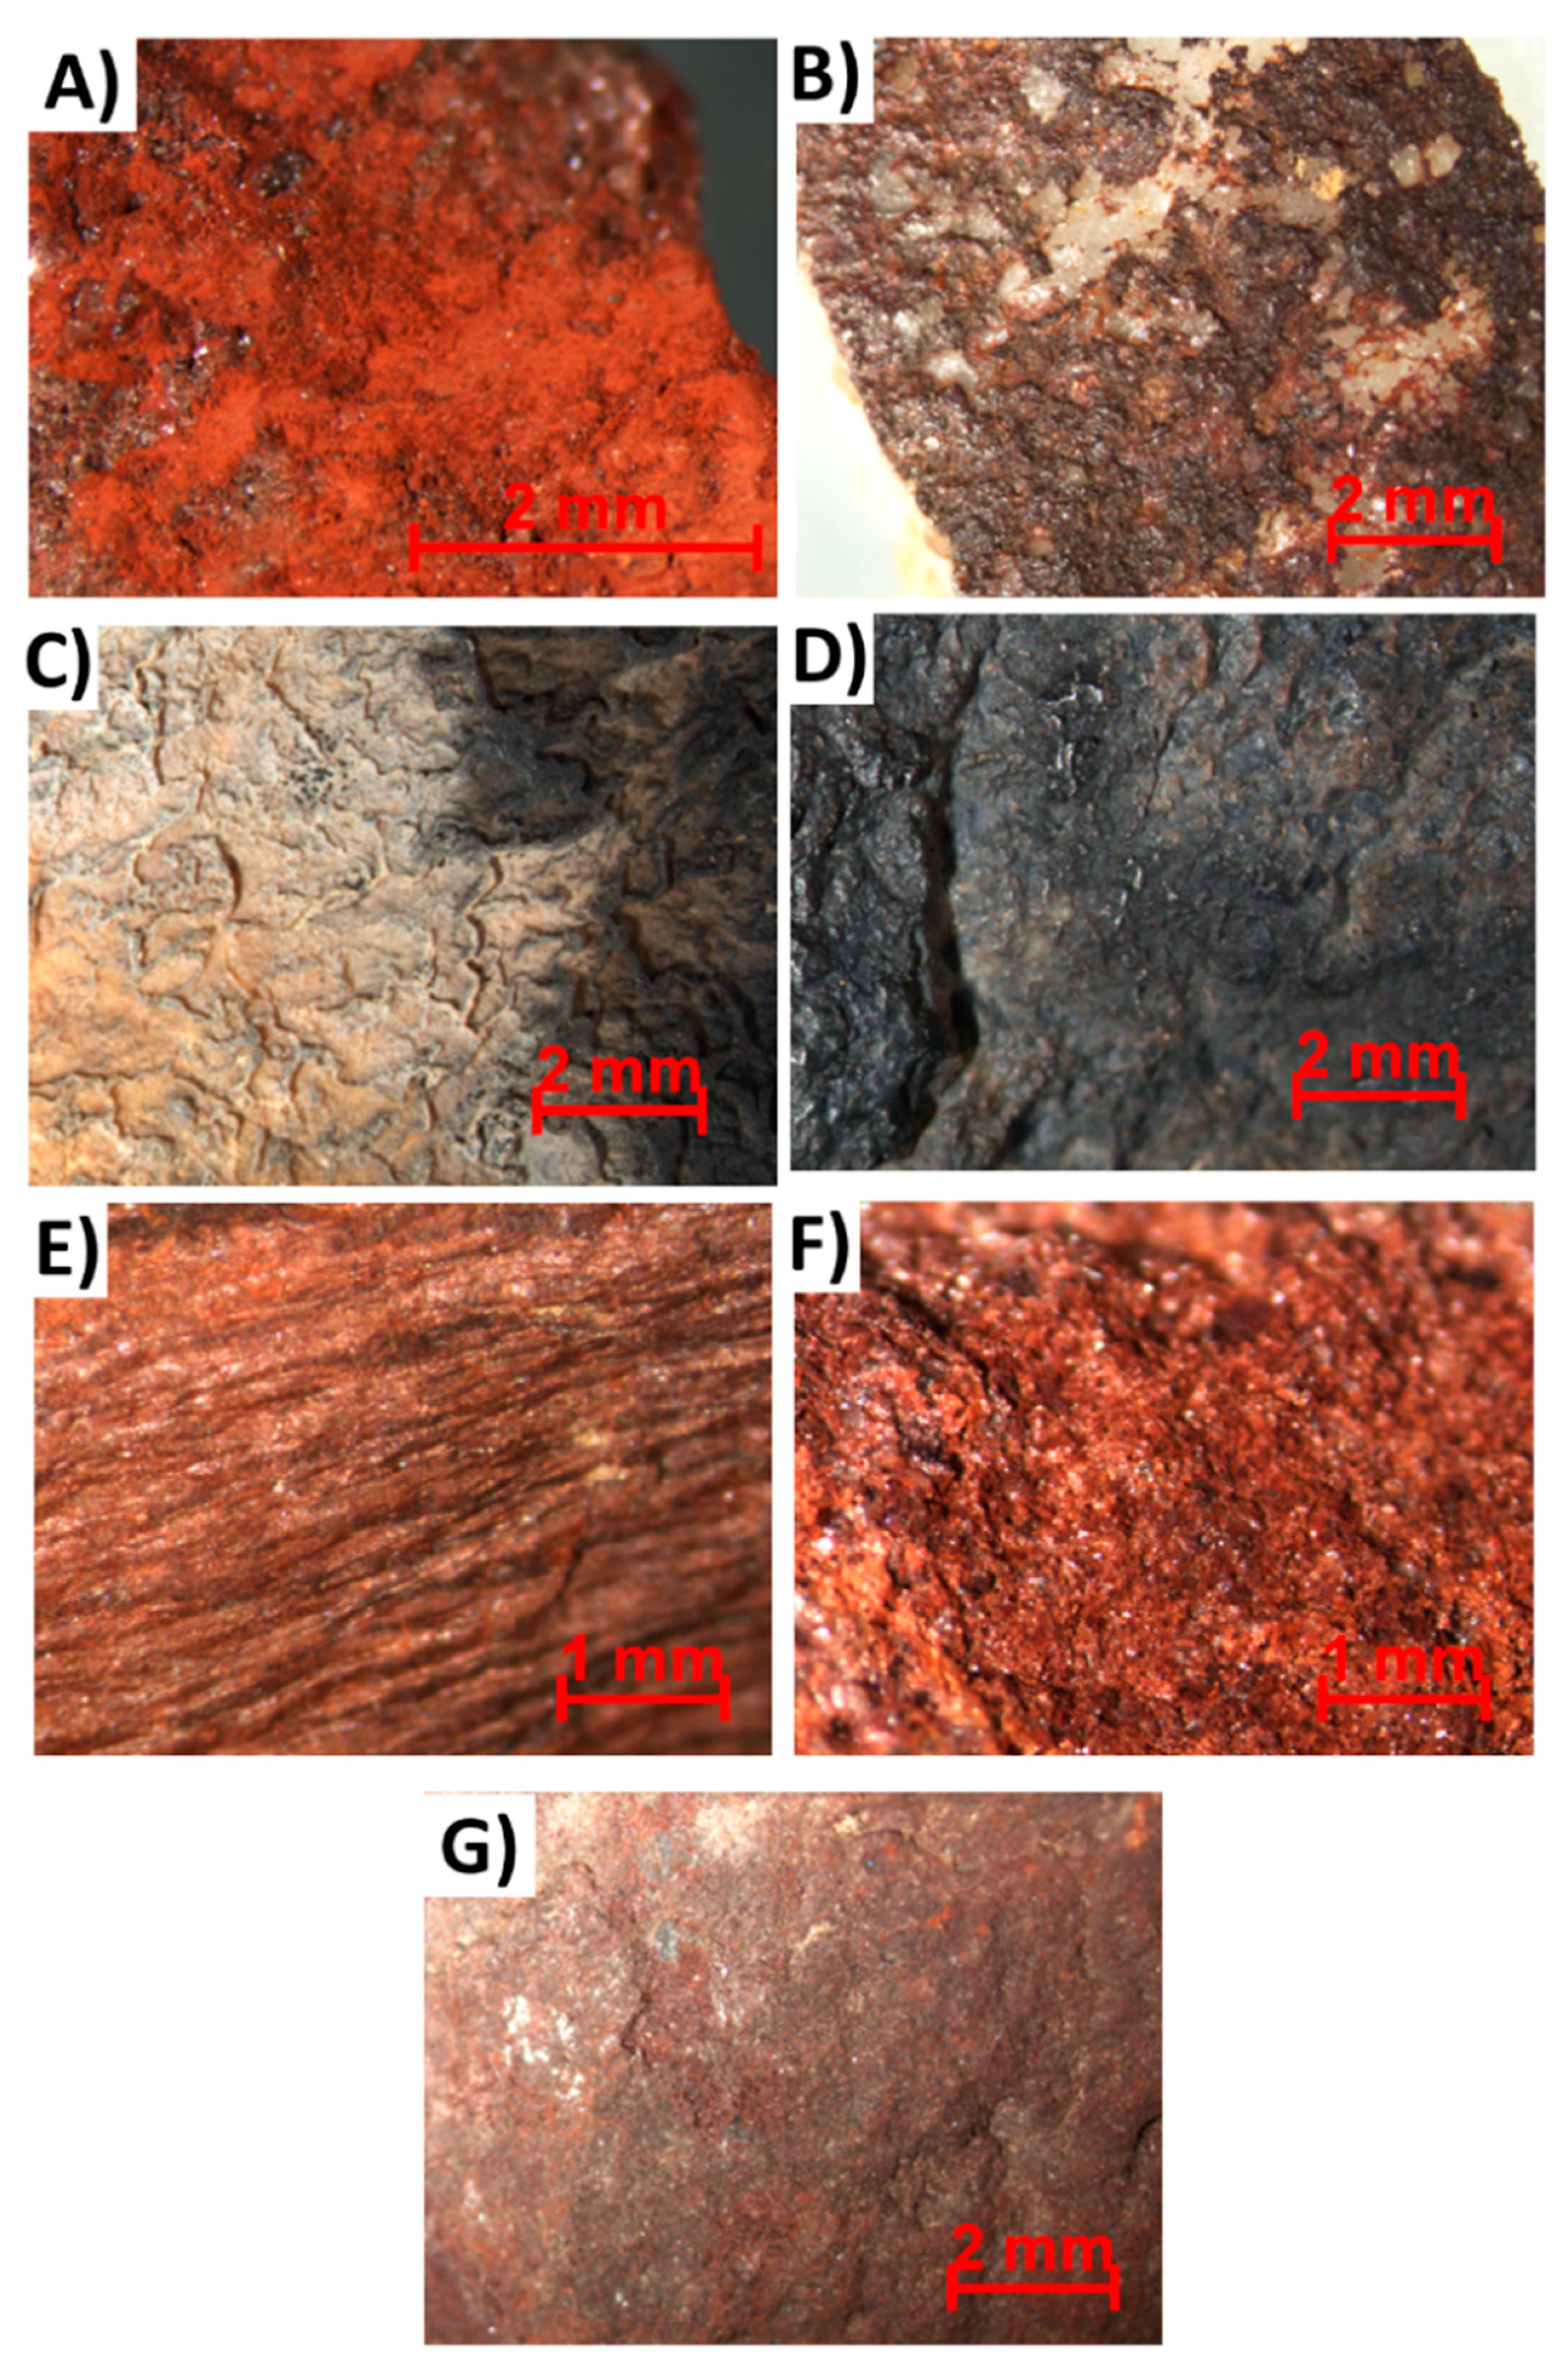
- A laminar red stone (PGMT1) was collected in the western trench.
- A granular red stone (PGMT2) was collected in the northern trench.
- Two white stones with red-coloured deposits (PGMT3 and PGMT4) were collected in the northern trench.
- A white quartzite with a dark patina on the surface (hereinafter SW).
- A quartzite with a dark-brown colouration (hereinafter SBB).
- A dark grey quartzite (hereinafter SB).
3. Results
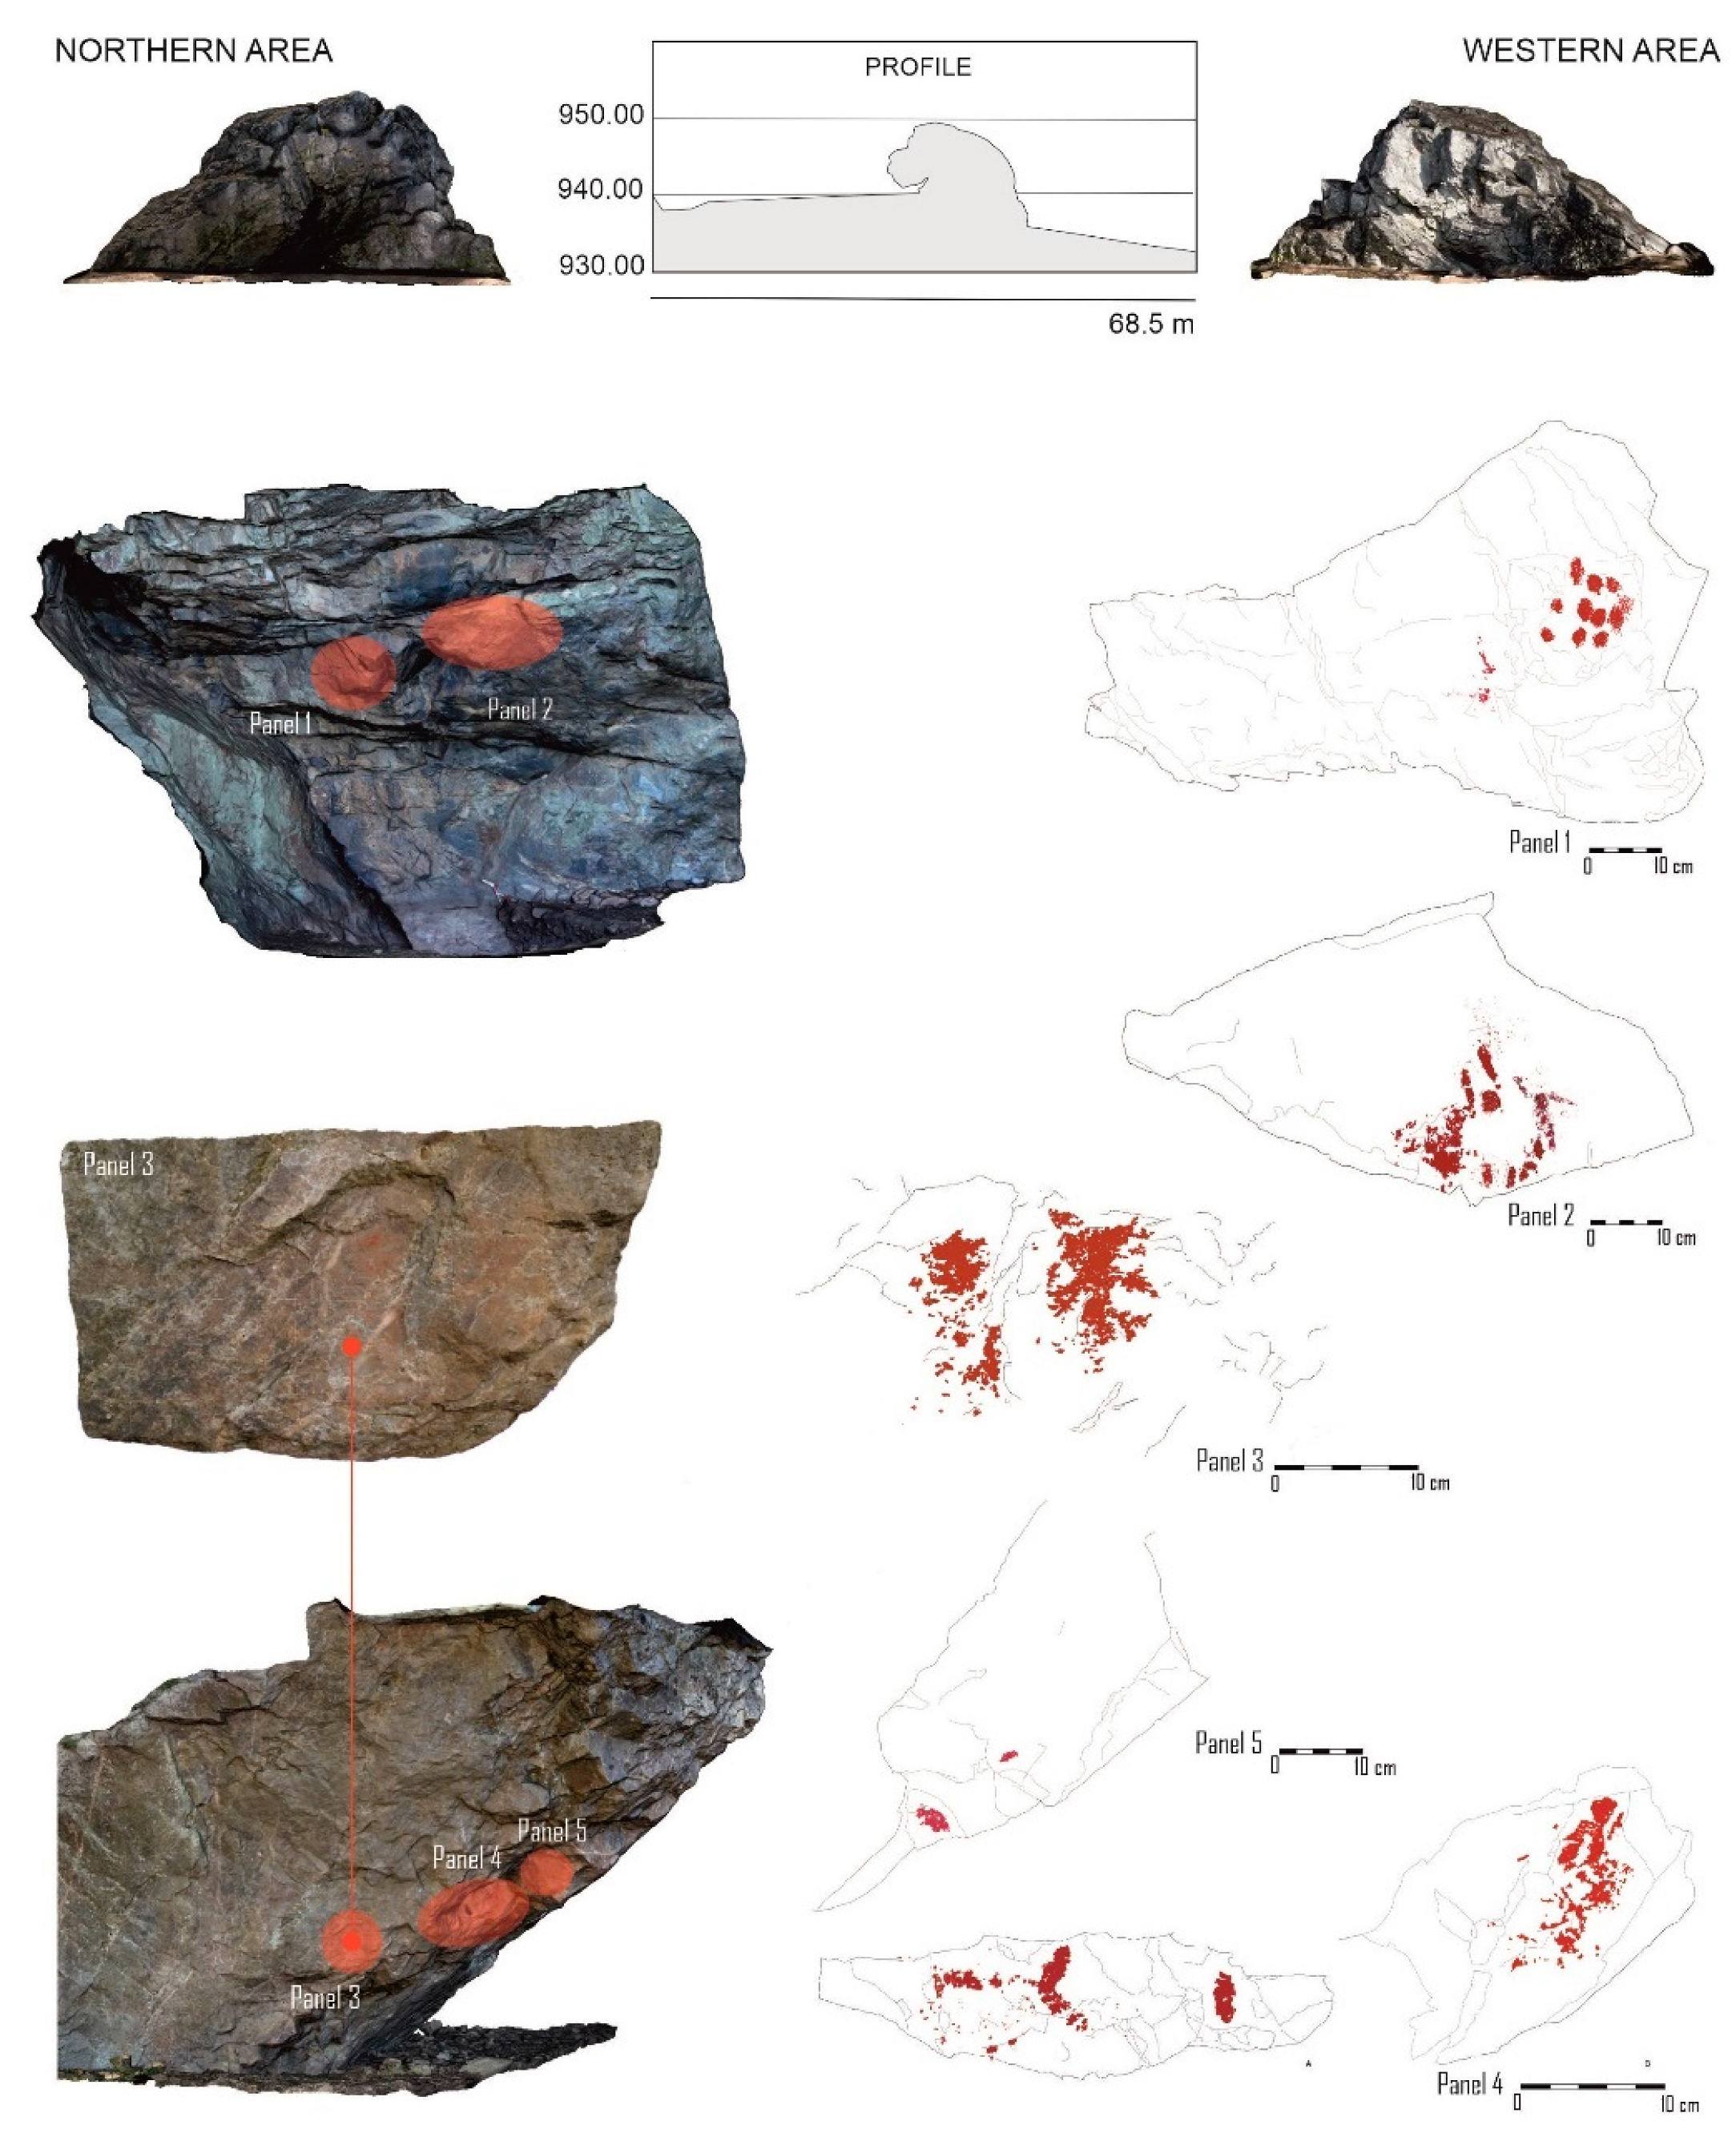
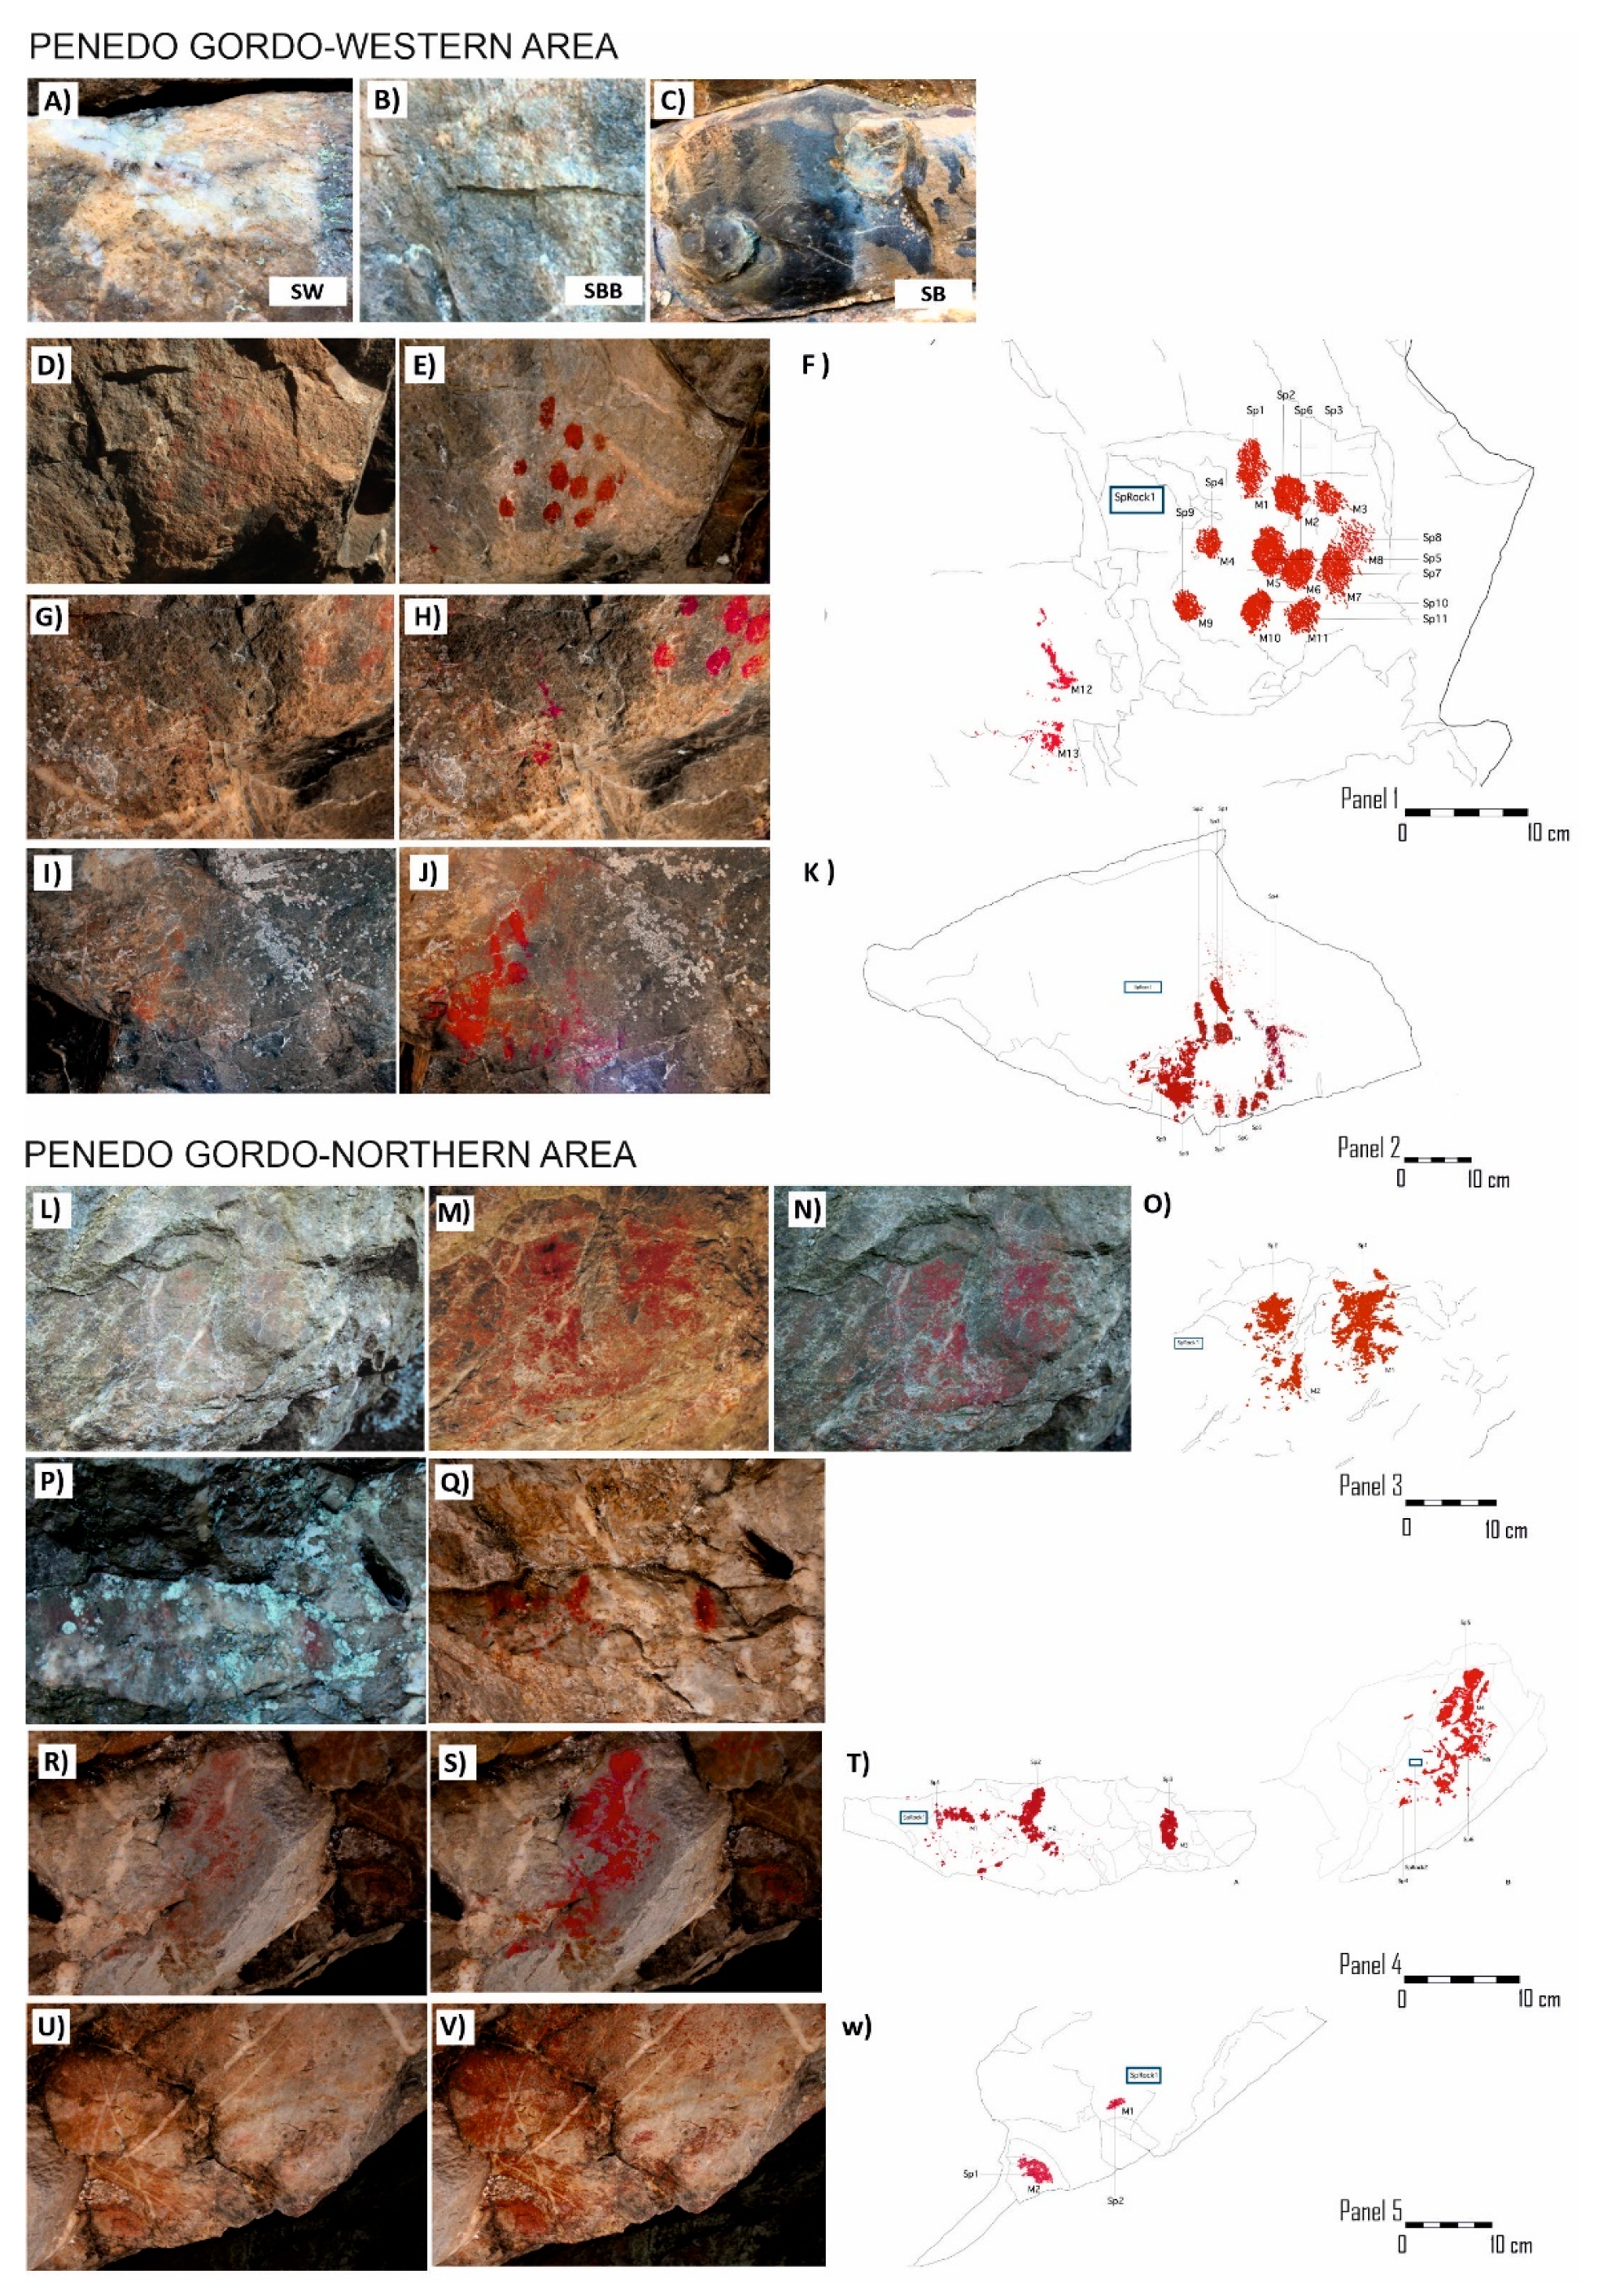
3.1. In Situ Analysis of the Rock Art: Paintings and Backdrop
- For the Sp from panels 1 (Figure 5B,H,N) and 5 (Figure 5F,L,R), the parameter a* was the one with more statistically significant differences comparatively to the value recorded on the original rock (P1SpR1, P1SpR2 and P5SpR1). The a* increase confirms the presence of a red painted layer on the surface.
- For the motifs from panels 2 (Figure 5C,I,O) and 4 (Figure 5E,K,Q), L* was the parameter showing more statistically significant differences when compared with its values for the unpainted rocks (P2SpR1, P4SpR1); this fact reveals a darkening of the surface. Although L* changes were negligible in most of the cases considering the standard deviations, the coloured surfaces tended to show L* decreases (darkening).
- For the motifs from panel 3 (Figure 5D,J,P), the parameter b* showed more statistically significant differences regarding the value of the rock (P3SpR1); b* increases are associated with a more orange tone, which was also detected under the naked eye.
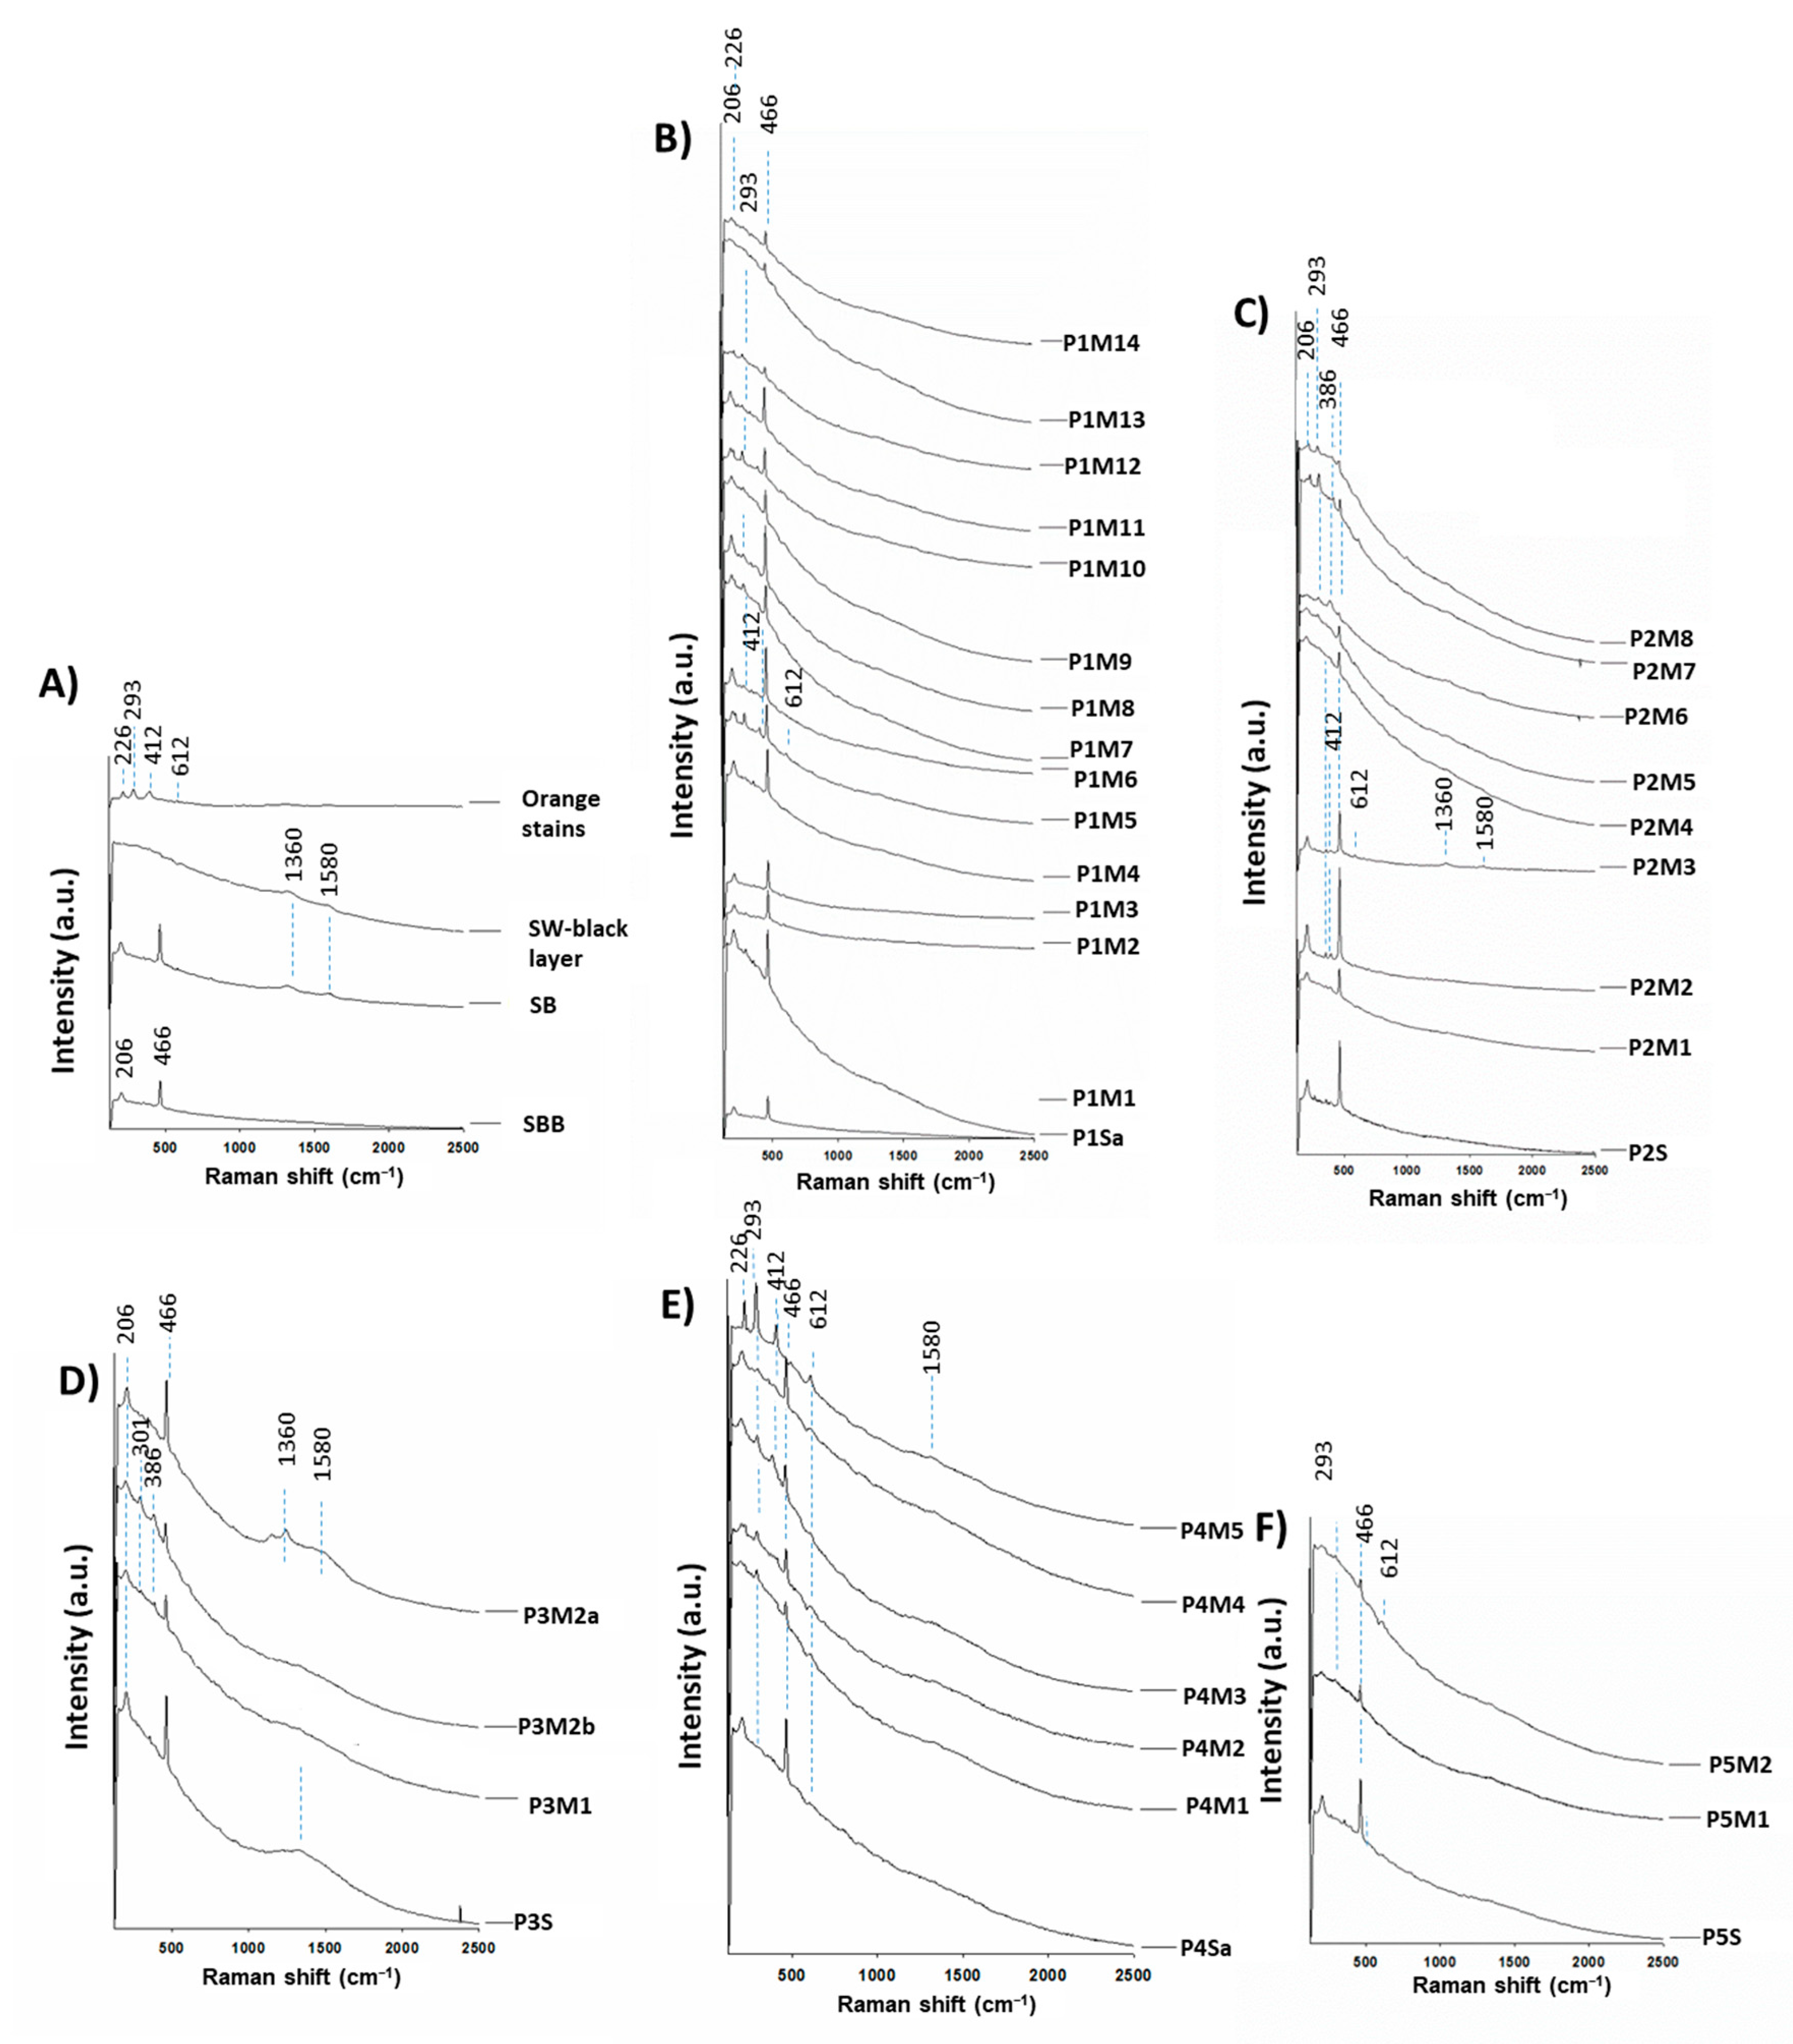
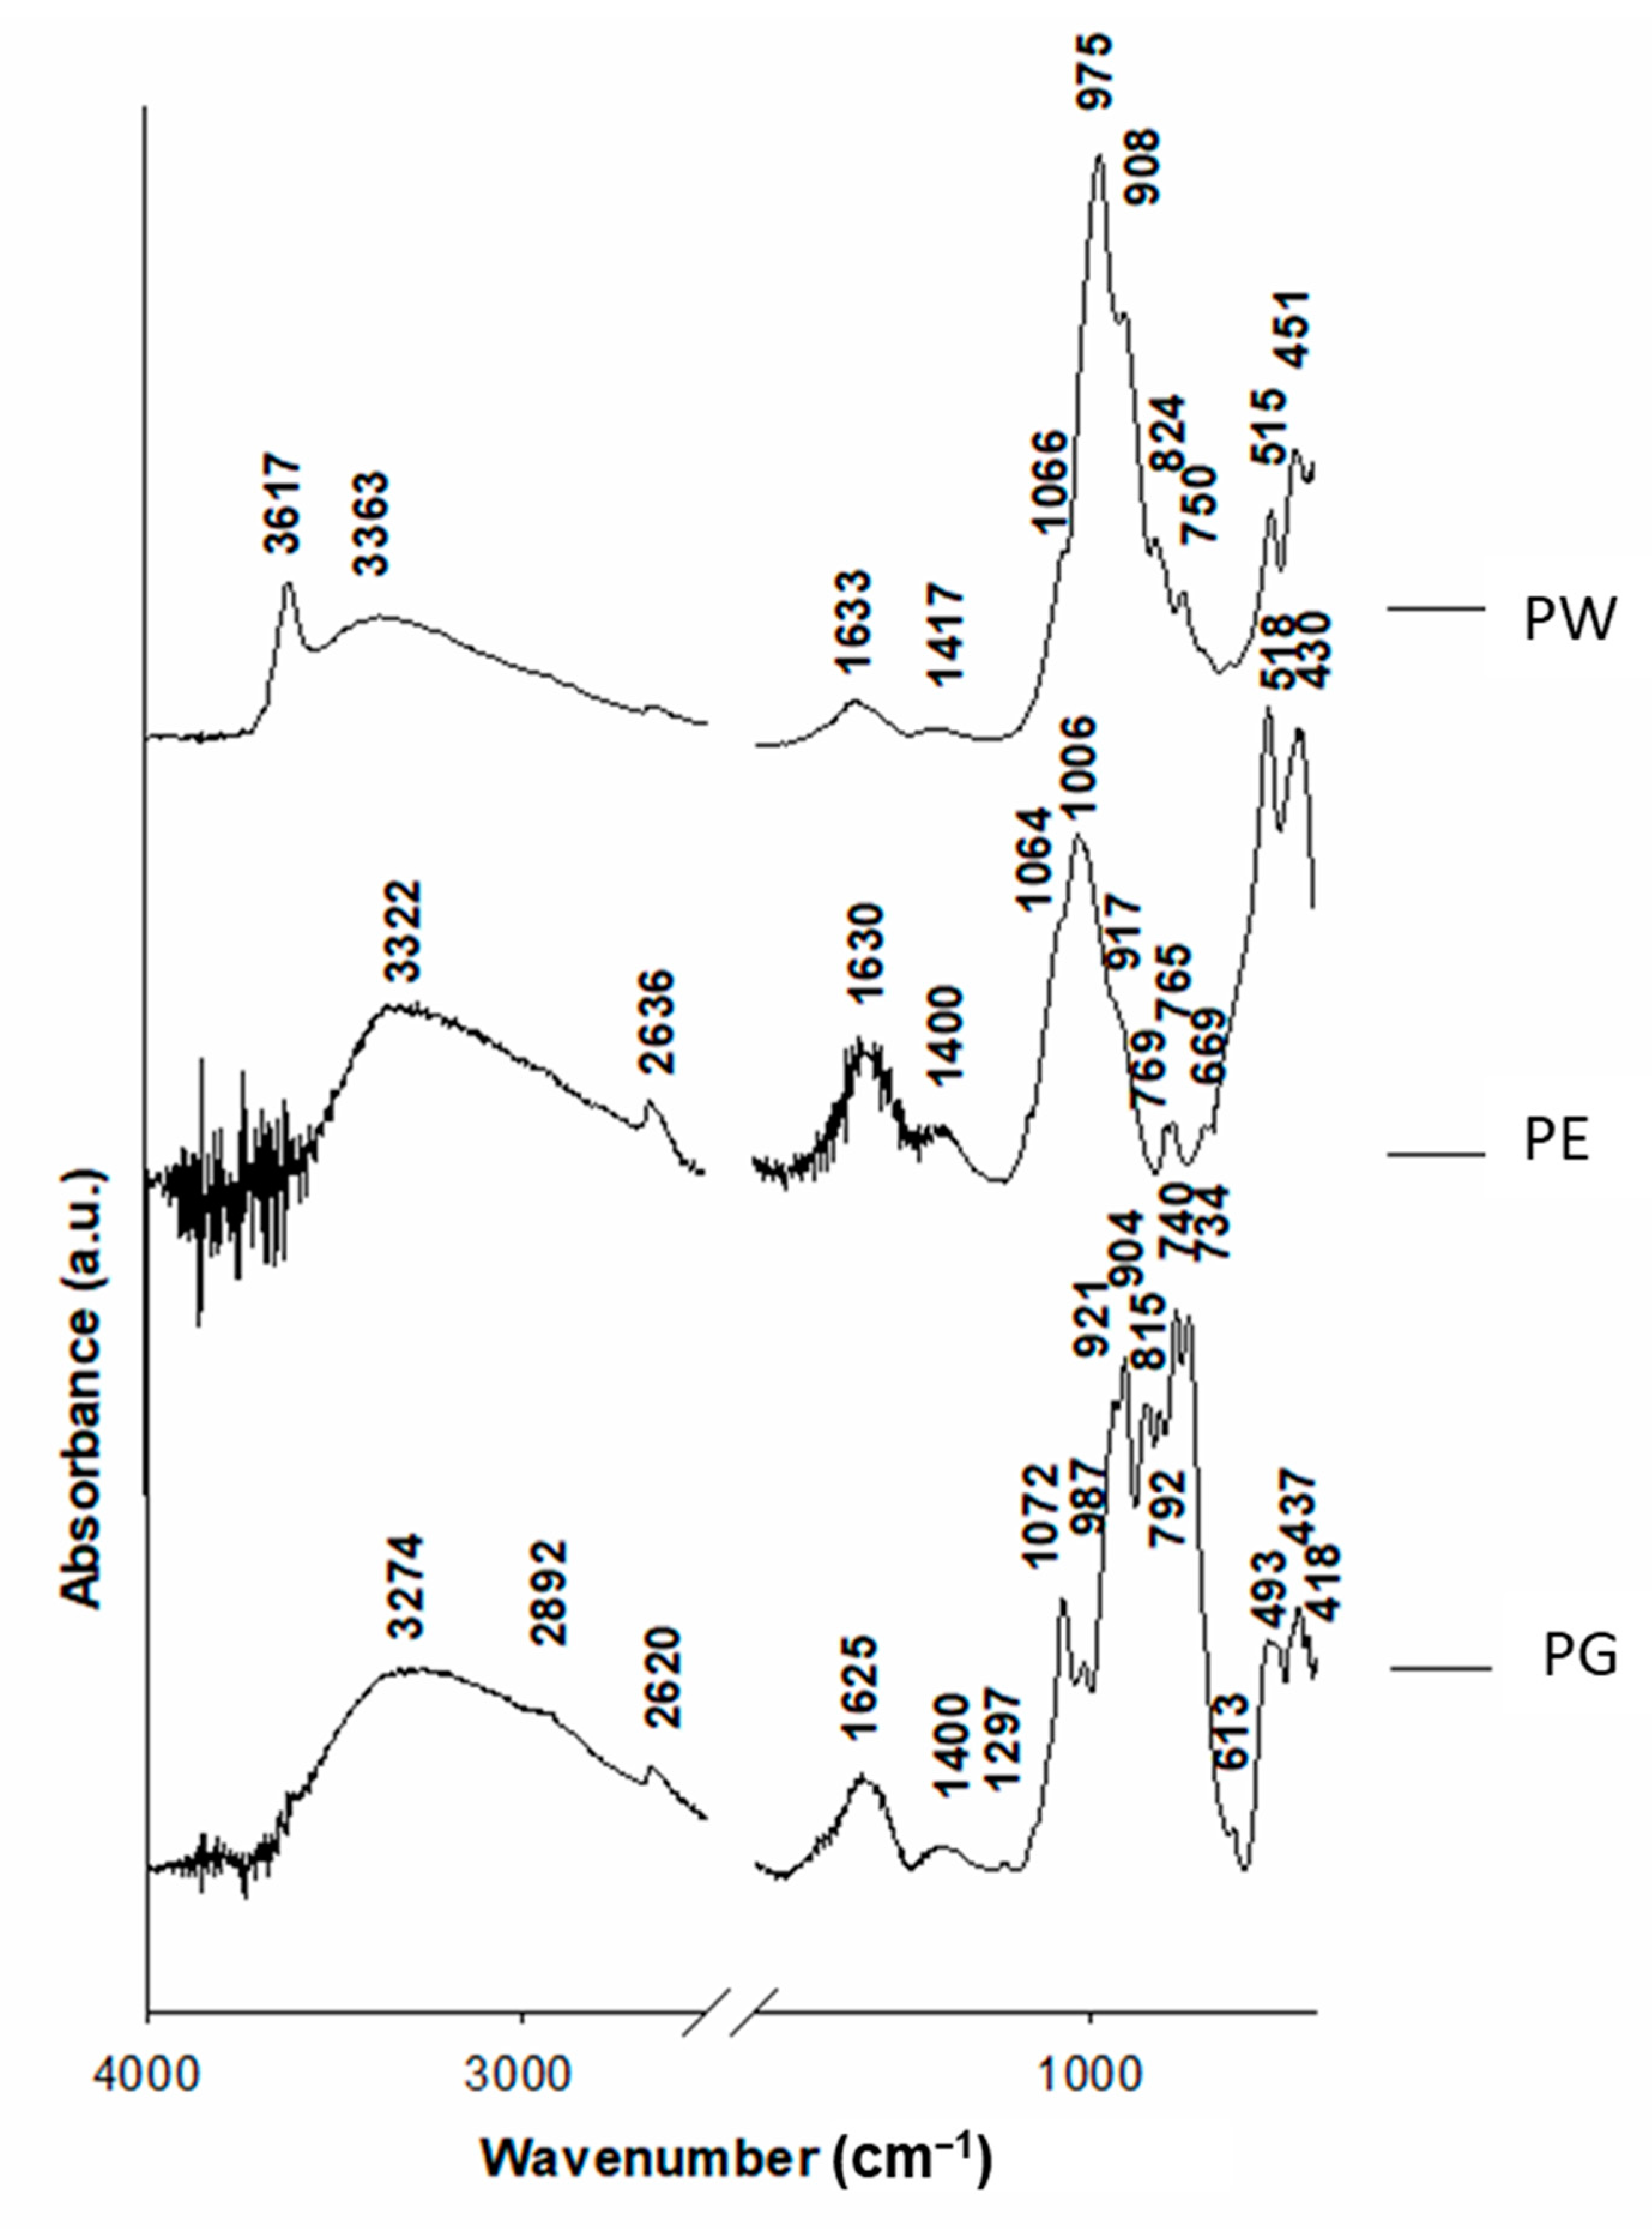
3.2. Laboratory Characterisation
- A broad band at 3340 cm−1 and a low intense band at 1600 cm−1 assigned to adsorbed water and vibration of the OH groups (O-H stretching and H-O-H bending, respectively) [33].
- Band at 2640 cm−1 assigned to hydrogen-bonded O-H which, with the weak band at 1400 cm−1 assigned to C-O stretching, suggested the presence of organic matter. These bands were negligible in PW. In the PG spectrum, organic molecules were also found through the slight band at 2892 cm−1 assigned to the symmetric C-H stretching, and also a weak band at 1237 cm−1 corresponding to COC group vibration stretching [34]. The presence of organic matter in PG was also confirmed by bands at 800–739 cm−1 attributed to the out-of-plane bending on aromatic ring C-H bending vibrations [35].
- Bands from 1082 to 840 cm−1 assigned to the stretching Si-O bond of the silicon tetrahedron (around 990 cm−1) and the bending vibration absorption band (at around 840 cm−1).
- The doublet at 527 and 440 cm−1 assigned to Fe-O stretching vibrations, which is attributed to the presence of hematite [36], was detected in all the spectra.
- Moreover, in PW spectra, a band at 3600 cm−1 was found, attributed to O-H groups in coordination with metals [34].
4. Discussion
5. Conclusions
Author Contributions
Funding
Data Availability Statement
Acknowledgments
Conflicts of Interest
References
- Comendador, B. Intervención Arqueolóxica No Penedo Gordo/Penedo da Moura. Memoria da Intervención Arqueolóxica 2018/2019; Report Deposited in the General Directorate of Heritage of the Xunta de Galicia: Santiago de Compostela, Spain, 2019; Volume 2. [Google Scholar]
- Alves, L.; Comendador, B. (forthcoming). Reshaping (all kinds of) borders. The site of Penedo Gordo in the context of north-western Iberia Schematic Art. In Proceedings of the International Conference “Breaking Borders. Crossing Territories” CITCEM, Faculty of Arts and Humanities—University of Porto, Porto, Portugal, 16–18 April 2020. [Google Scholar]
- Hernanz, A.; Gavira-Vallejo, J.M.; Ruiz-López, J.F.; Edwards, H.G.M. A comprehensive micro-Raman spectroscopic study of prehistoric rock paintings from the Sierra de las Cuerdas, Cuenca, Spain. J. Raman Spectrosc. 2008, 39, 972–984. [Google Scholar] [CrossRef]
- Oliveira, C.; Bettencourt, A.M.S.; Araújo, A.; Gonçalves, L.; Kuzniarska-Biernacka, I.; Costa, L. Integrated analytical techniques for the study of colouring materials from two megalithic barrows. Archaeometry 2017, 59, 1065–1081. [Google Scholar] [CrossRef]
- López-Montalvo, E.; Roldán, C.; Badal, E.; Murcia-Mascarós, S.; Villaverde, V. Identification of plant cells in black pigments of prehistoric Spanish Levantine rock art by means of a multi-analytical approach. A new method for social identity materialization using chaîne operatoire. PLoS ONE 2017, 12, e0172225. [Google Scholar] [CrossRef]
- Rosina, P.; Collado, H.; Garcés, S.; Gomes, H.; Eftekhari, N.; Nicoli, M.; Vaccaro, C. Benquerencia (La Serena-Spain) rock art: An integrated spectroscopy analysis with FTIR and Raman. Heliyon 2019, 5, e02561. [Google Scholar] [CrossRef]
- Bikiaris, D.; Daniilia, S.; Sotiropoulou, S.; Katsimbiri, O.; Pavlidou, E.; Moutsatsou, A.P.; Chryssoulakis, Y. Ochre-differentiation through micro-Raman and micro-FTIR spectroscopies: Application on wall paintings at Meteora and Mount Athos, Greece. Spectrochim. Acta Part A 1999, 56, 3–18. [Google Scholar] [CrossRef]
- Iriarte, E.; Foyo, A.; Sánchez, M.A.; Tomillo, C. The origin and geochemical characterization of red ochres from the Tito Bustillo and Monte Castillo caves (Northern Spain). Archaeometry 2009, 51, 231–251. [Google Scholar] [CrossRef]
- Cornell, R.M.; Schwertmann, U. The Iron Oxides: Structure, Properties, Reactions, Occurrences and Uses; Wiley-VCH: Weinheim, Germany, 2006. [Google Scholar]
- Wainwright, I.N.M.; Helwing, K.; Rolandi, D.S.; Gradin, C.; Podestas, M.M.; Onetto, M.; Aschero, C.A. Rock Paintings Conservation and Pigment Analysis at Cueva de las Manos and Cerro de los Indios, Santa Cruz (Patagonia), Argentina; Preprints of the 13° Triennial Meeting of ICOM Committee for Conservation 2: Río de Janeiro, Brazil, 2002; pp. 582–589. [Google Scholar]
- Froment, F.; Tournié, A.; Colomban, P. Raman identification of natural red to yellow pigments: Ochre and iron-containing ores. J. Raman Spectrosc. 2008, 39, 560–568. [Google Scholar] [CrossRef]
- Franquelo, M.L.; Duran, A.; Herrera, L.K.; de Haro, M.C.J.; Perez-Rodriguez, J.L. Comparison between micro-Raman and micro-FTIR spectroscopy techniques for the characterization of pigments from Southern Spain Cultural Heritage. J. Mol. Struct. 2009, 924–926, 404–412. [Google Scholar] [CrossRef]
- Iriarte, M.; Hernanz, A.; Ruiz-López, J.F.; Martin, S. μ-Raman spectroscopy of prehistoric paintings from the Abrigo Remacha rock shelter (Villaseca, Segovia, Spain). J. Raman Spectrosc. 2013, 44, 1557–1562. [Google Scholar] [CrossRef]
- Iriarte, M.; Hernanz, A.; Gavira-Vallejo, J.M.; Alcolea-Gonzalez, J.; de Balbín-Behrmann, R. μ-Raman spectroscopy of prehistoric paintings from the El Reno cave (Valdesotos, Guadalajara, Spain). J. Archaeol. Sci. Rep. 2017, 14, 454–460. [Google Scholar] [CrossRef]
- Hernanz, A.; Gavira-Vallejo, J.M.; Ruiz-López, J.F.; Martin, S.; Maroto-Valiente, Á.; de Balbín-Behrmann, R.; Menéndez, M.; Alcolea-González, J.J. Spectroscopy of Palaeolithic rock paintings from the Tito Bustillo and El Buxu Caves, Asturias, Spain. J. Raman Spectrosc. 2012, 43, 1644–1650. [Google Scholar] [CrossRef]
- Gomes, H.; Rosina, P.; Holakooei, P.; Solomon, T.; Vaccaro, C. Identification of pigments used in rock-art paintings in Gode Roriso-Ethiopia using Micro-Raman spectroscopy. J. Archaeol. Sci. 2013, 40, 4073–4082. [Google Scholar] [CrossRef]
- Rousaki, A.; Bellelli, C.; Calatayud, M.C.; Aldazabal, V.; Custo, G.; Moens, L.; Vandenabeelee, P.; Vázquez, C. Micro-Raman analysis of pigments from hunter–gatherer archaeological sites of North Patagonia (Argentina). J. Raman Spectrosc. 2015, 10. [Google Scholar] [CrossRef]
- Venice Charter. The Venice Charter for the Conservation and Restoration of Monuments and Sites. 1964. Available online: http://www.icomos.org/venicecharter2004/index.html (accessed on January 2018).
- Prinsloo, I.C.; Tounié, A.; Colomban, P.; Paris, C.; Bassett, T. In search of the optimum Raman/IR signatures of potential ingredients used in San/Bushman rock art paint. J. Archaeol. Sci. 2013, 40, 2981–2990. [Google Scholar] [CrossRef]
- Alves, L.; Comendador, B. Arte esquemático pintado en el noroeste peninsular: Una visión integrada transfronteriza. Gallaecia 2017, 36, 11–52. [Google Scholar] [CrossRef]
- IGME (Instituto Geológico y Minero de España). Mapa geológico de España (geological map of Spain) Serie Magna, E1:50.000. In Hoja nº 330, 2nd ed.; IGME: Verín, Spain, 1981. [Google Scholar]
- CIE. S014-4/E:2007 Colorimetry Part 4: CIE 1976 L*a*b* Color Space; CIE Central Bureau: Vienna, Austria, 2007. [Google Scholar]
- CR. Kimpe Clay and silt analysis. In Soil Sampling and Methods of Analysis. Canadian Society of Soil Science; Carter, M.R., Ed.; Lewis Publisher: Boca Raton, FL, USA, 1993; pp. 719–730, Chapter 67. [Google Scholar]
- Burgio, L.; Clark, R.J. Library of FT-Raman spectra of pigments, minerals, pigment media and varnishes, and supplement to existing library of Raman spectra of pigments with visible excitation. Spectrochim. Acta Part A Mol. Biomol. Spectrosc. 2001, 57, 1491–1521. [Google Scholar] [CrossRef]
- Wang, A.; Freeman, J.; Kuebler, K.E. Raman Spectroscopic Characterization of Phyllosilicates; Lunar and Planetary Science XXXIII; Cambridge University Press: Cambridge, UK, 2002; p. 1374. [Google Scholar]
- Wang, A.; Valentine, R.B. Seeking and Identifying Phyllosilicates on Mars—A Simulation Study; Lunar and Planetary Science XXXIII; Cambridge University Press: Cambridge, UK, 2002; p. 1370. [Google Scholar]
- Pan, A.; Rebollar, E.; Chiussi, S.; Serra, J.; González, P.; León, B. Optimisation of Raman analysis of walnut oil used as protective coating of Galician granite monuments. J. Raman Spectrosc. 2010, 41, 1449–1454. [Google Scholar] [CrossRef]
- Coccato, A.; Jehlicka, J.; Moens, L.; Vandenabeele, P. Raman spectroscopy for the investigation of carbon-based black pigments. J. Raman Spectrosc. 2014, 46, 1003–1015. [Google Scholar] [CrossRef]
- RRUFF Project. 2017. Available online: http://rruff.info/ (accessed on February 2020).
- Wray, R.A.L. A global review of solutional weathering forms on quartz sandstones. Earth-Sci. Rev. 1997, 42, 137–160. [Google Scholar] [CrossRef]
- Romaní, J.R.V.; Sánchez, J.S.; Rodríguez, M.V.; Mosquera, D.F. Speleothem development and biological activity in granite cavities. Géomorphologie Relief Process. Environ. 2010, 4, 337–346. [Google Scholar] [CrossRef]
- Sanjurjo, J.; Romaní, J.R.V.; Pallí, L.L.; Roqué, C. Opal speleothems and granite pseudocarst (in Spanish). Rev. C G 2007, 21, 123–134. [Google Scholar]
- Hwang, S.W.; Umar, A.; Dar, G.N.; Kim, S.H.; Badran, R.I. Synthesis and Characterization of Iron Oxide Nanoparticles for Phenyl Hydrazine Sensor Applications. Sens. Lett. 2014, 12, 1–5. [Google Scholar] [CrossRef]
- Socrates, G. Infrared and Raman Characteristic Group Frequencies: Tables and Charts, 3rd ed.; John Wiley and Sons: Hoboken, NJ, USA, 2001. [Google Scholar]
- Coates, G. Interpretation of Infrared Spectra, A Practical Approach. Encyclopedia of Analytical Chemistry; Meyers, R.A., Ed.; Copyright John Wiley & Sons Ltd.: Hoboken, NJ, USA, 2006. [Google Scholar] [CrossRef]
- Salama, W.; El Aref, M.; Gaupp, R. Spectroscopic characterization of iron ores formed in different geological environments using FTIR, XPS, Mössbauer spectroscopy and thermoanalyses. Spectrochim. Acta Part A Mol. Biomol. Spectrosc. 2015, 136, 1816–1826. [Google Scholar] [CrossRef]
- Cullen, W.R.; Reimer, K.J. Arsenic speciation in the environment. Chem. Rev. 1989, 4, 713–764. [Google Scholar] [CrossRef]
- Gialanella, S.; Belli, R.; Dalmeri, G.; Lonardelli, I.; Mattarelli, M.; Montagna, M.; Toniutti, L. Artificial and Natural Origin of the Hematite-Based Red Pigments in Archaeological Contexts: The Case of Riparo Dalmeri (Trento, Italy). Archaeometry 2011, 53, 950–962. [Google Scholar] [CrossRef]


| ID (Inventory ID) | A | Description | UE | X Coord. | Y Coord. | Z Coord. |
|---|---|---|---|---|---|---|
PG (PG18SNp003) | N | Fragment of a grey quartzite showing a red-coloured deposit covered by a dark soil patina | Ue205 | 637,502.114 | 4,647,736.408 | 939.84 |
PE (PG18SNp007) | N | Compact piece of soil with a thick layer of a red substance | Ue208/Ue209 | 637,501.69 | 4,647,737.16 | 939.88 |
PW (PG18p130) | N | Fragment of a white quartzite with a red deposit | Ue218 | 637,501.31 | 4,647,736.85 | 939.78 |
PGMT1 (PG18SOp016) | W | Possible colorant material collected in the western trench | Ue105 | - | - | - |
PGMT2 (PG18SNp062) | N | Possible colorant material collected in the northern trench | Ue214 | 637,502.02 | 4,647,736.46 | 939.73 |
PGMT3 (PG18SNp068) | N | Possible colorant material collected in the northern trench | Ue209/Ue213 | 637,501.44 | 4,647,736.90 | 939.81 |
PGMT4 (PG18SNp085) | N | Possible colorant material collected in the northern trench | Ue213 | 637,501.24 | 4,647,737.32 | 939.84 |
SW | W | A white quartzite with a dark patina on the surface | Collected near the W area. | |||
SBB | W | A quartzite with a dark-brown colouration | Collected near the W area. | |||
SB | W | A dark grey quartzite | Collected near the W area. | |||
| Stones and Panels | Sample | L* | ±std | a* | ±std | b* | ±std |
|---|---|---|---|---|---|---|---|
| Stones | SW | 64.04 | 3.02 | 2.53 | 1.05 | 15.54 | 2.44 |
| SBB | 36.68 | 1.36 | 1.57 | 0.65 | 6.78 | 1.28 | |
| SB | 27.74 | 1.17 | −0.40 | 0.10 | −0.16 | 0.61 | |
| Panel 1 | P1SpR1 | 44.51 | 2.36 | 4.13 | 1.88 | 12.71 | 2.75 |
| P1Sp1 | 42.65 | 2.52 | 7.71 | 1.49 | 12.40 | 1.42 | |
| P1Sp2 | 41.03 | 0.86 | 10.24 | 0.93 | 14.01 | 0.92 | |
| P1Sp3 | 44.27 | 1.76 | 8.25 | 1.39 | 14.64 | 1.22 | |
| P1Sp4 | 39.69 | 1.16 | 8.97 | 1.26 | 12.65 | 1.41 | |
| P1Sp5 | 38.85 | 1.38 | 9.73 | 1.48 | 12.61 | 1.07 | |
| P1Sp6 | 43.18 | 1.33 | 10.00 | 0.49 | 15.50 | 0.75 | |
| P1Sp7 | 42.48 | 0.91 | 10.58 | 1.01 | 15.44 | 1.25 | |
| P1Sp8 | 42.52 | 2.05 | 8.04 | 1.59 | 14.22 | 2.65 | |
| P1Sp9 | 42.10 | 2.91 | 9.29 | 1.53 | 14.47 | 1.13 | |
| P1Sp10 | 37.53 | 0.83 | 7.16 | 1.83 | 9.76 | 1.59 | |
| P1Sp11 | 42.01 | 0.77 | 9.15 | 0.66 | 14.85 | 0.82 | |
| P1SpR2 | 37.67 | 2.49 | 2.91 | 0.92 | 8.83 | 1.68 | |
| P1Sp12 | 36.13 | 1.42 | 2.38 | 0.44 | 7.28 | 0.85 | |
| P1Sp13 | 35.72 | 1.46 | 4.55 | 1.55 | 8.64 | 0.83 | |
| P1Sp14 | 37.51 | 1.17 | 6.99 | 0.92 | 11.20 | 0.98 | |
| Panel 2 | P2SpR1 | 42.54 | 1.70 | 5.84 | 0.57 | 14.54 | 1.39 |
| P2Sp1 | 42.19 | 2.34 | 6.33 | 3.13 | 11.76 | 3.01 | |
| P2Sp2 | 43.39 | 4.71 | 6.34 | 1.81 | 13.81 | 1.85 | |
| P2Sp3 | 37.32 | 1.27 | 5.15 | 1.69 | 8.74 | 1.59 | |
| P2Sp4 | 40.88 | 1.04 | 3.64 | 0.98 | 10.87 | 1.19 | |
| P2Sp5 | 39.07 | 1.44 | 4.93 | 0.96 | 12.27 | 1.12 | |
| P2Sp6 | 35.89 | 1.48 | 3.88 | 1.03 | 9.41 | 1.53 | |
| P2Sp7 | 36.15 | 1.74 | 5.62 | 1.83 | 8.57 | 1.68 | |
| P2Sp8 | 41.70 | 1.93 | 9.64 | 1.52 | 14.21 | 2.07 | |
| Panel 3 | P3SpR1 | 44.76 | 6.31 | 2.63 | 1.28 | 8.99 | 1.60 |
| P3Sp1 | 41.61 | 2.32 | 7.94 | 2.81 | 13.19 | 2.12 | |
| P3Sp2 | 41.87 | 2.28 | 7.01 | 1.24 | 13.78 | 1.90 | |
| Panel 4 | P4SpR1 | 54.51 | 3.34 | 3.11 | 0.98 | 16.16 | 1.26 |
| P4SpR2 | 48.39 | 2.74 | 1.15 | 0.56 | 9.31 | 1.78 | |
| P4Sp1 | 37.16 | 2.65 | 9.34 | 1.75 | 10.88 | 1.56 | |
| P4Sp2 | 43.38 | 2.61 | 9.72 | 2.16 | 14.45 | 1.73 | |
| P4Sp3 | 43.15 | 2.15 | 12.54 | 2.06 | 15.91 | 1.46 | |
| P4Sp4 | 44.66 | 3.58 | 4.53 | 4.35 | 11.66 | 3.62 | |
| P4Sp5 | 39.25 | 5.71 | 10.38 | 2.53 | 11.83 | 1.42 | |
| P4Sp6 | 46.95 | 1.53 | 10.09 | 2.15 | 14.85 | 1.48 | |
| Panel 5 | P5SpR1 | 48.50 | 2.65 | 2.38 | 0.83 | 12.02 | 1.20 |
| P5Sp1 | 36.39 | 2.25 | 7.44 | 3.07 | 11.52 | 1.53 | |
| P5Sp2 | 45.37 | 1.73 | 8.20 | 1.32 | 14.15 | 0.68 |
| Sample | Q | P | K-F | M | H | G | L | A | C | J | B | R |
|---|---|---|---|---|---|---|---|---|---|---|---|---|
| PG | ++++ | - | - | - | ++ | - | - | - | - | - | - | - |
| PE | ++++ | - | - | - | +++ | - | - | - | + | + | - | - |
| PW | +++ | - | - | ++ | ++ | - | - | - | - | - | - | + |
| SW | ++++ | - | - | - | - | + | - | + | - | - | - | - |
| SW-black layer | ++ | - | - | - | - | ++++ | - | - | - | - | - | - |
| SBB | ++++ | - | - | - | - | - | - | - | - | - | - | - |
| SB | ++++ | - | - | - | - | - | + | + | - | ++ | - | - |
| PGMT1 | +++ | ++ | + | - | ++ | - | - | ++ | - | - | ++ | - |
| PGMT2 | ++++ | - | - | + | ++ | - | - | - | - | - | - | - |
| PGMT3 | ++++ | - | - | - | + | - | - | tr. | - | - | - | - |
| PGMT4 | ++++ | - | - | - | + | - | - | - | - | - | - | - |
Publisher’s Note: MDPI stays neutral with regard to jurisdictional claims in published maps and institutional affiliations. |
© 2021 by the authors. Licensee MDPI, Basel, Switzerland. This article is an open access article distributed under the terms and conditions of the Creative Commons Attribution (CC BY) license (https://creativecommons.org/licenses/by/4.0/).
Share and Cite
Pozo-Antonio, J.S.; Comendador Rey, B.; Alves Bacelar, L.; Barreiro, P. Methodological Approach (In Situ and Laboratory) for the Characterisation of Late Prehistoric Rock Paintings—Penedo Gordo (NW Spain). Minerals 2021, 11, 551. https://doi.org/10.3390/min11060551
Pozo-Antonio JS, Comendador Rey B, Alves Bacelar L, Barreiro P. Methodological Approach (In Situ and Laboratory) for the Characterisation of Late Prehistoric Rock Paintings—Penedo Gordo (NW Spain). Minerals. 2021; 11(6):551. https://doi.org/10.3390/min11060551
Chicago/Turabian StylePozo-Antonio, Jose Santiago, Beatriz Comendador Rey, Lara Alves Bacelar, and Pablo Barreiro. 2021. "Methodological Approach (In Situ and Laboratory) for the Characterisation of Late Prehistoric Rock Paintings—Penedo Gordo (NW Spain)" Minerals 11, no. 6: 551. https://doi.org/10.3390/min11060551
APA StylePozo-Antonio, J. S., Comendador Rey, B., Alves Bacelar, L., & Barreiro, P. (2021). Methodological Approach (In Situ and Laboratory) for the Characterisation of Late Prehistoric Rock Paintings—Penedo Gordo (NW Spain). Minerals, 11(6), 551. https://doi.org/10.3390/min11060551