Case Report

An Evaluation of the Australian Coal Flotation Standards

School of Minerals and Energy Resources Engineering, University of New South Wales, Sydney, NSW 2052, Australia
*
Author to whom correspondence should be addressed.
Minerals 2021, 11(6), 550; https://doi.org/10.3390/min11060550
Submission received: 23 March 2021 / Revised: 9 April 2021 / Accepted: 17 May 2021 / Published: 21 May 2021
(This article belongs to the Section Mineral Processing and Extractive Metallurgy)

Abstract

:
Mining operations often send samples for testing to commercial laboratories. Unless a customised test is requested, they expect laboratories to use standard procedures, which are reproducible. A thermal coal and a metallurgical coal were sent to eight laboratories, which were requested to perform a basic flotation test (AS 4156.2.1-2004) and a sequential flotation procedure test, i.e., standard tree test (AS 4156.2.2-1998). This study compared the reports produced by the various laboratories and compared them with the requirements laid out by the Australian standards. It was found that many elements were missing in most cases, probably due to the fact that some of the requirements of the standard, such as size analysis, are offered as other services. The basic tests generally agreed with one another whilst the sequential tests presented more variations. A quantitative analysis of the variation in the yield–ash curves produced by the sequential procedure was conducted using dynamic time warping (DTW). This approach can be used to numerically compare yield–ash curves and perform statistical comparisons.

1. Introduction

Froth flotation is a process used to separate particles based on their surface properties. Fine particles are placed in a vessel and contacted with bubbles. Hydrophobic particles have a greater likelihood of being collected by bubbles to produce a concentrate. In the coal industry, the separation of the coal from the tailings is achieved mostly through gravity separation [1]. Froth flotation is used for the finer-sized fractions of coal. Up to 40% of the coal may be concentrated by flotation [1], a figure that may be as low as 10% in Australia [2]. It is believed that the proportion of coal concentrated by flotation is increasing with the increasing mechanisation of mining. Thus, flotation is now an integral part of most coal washeries.
Flotation is strongly influenced by the design of the device and its operation [3,4,5], the flotation reagents [6,7,8,9], and water [10,11,12,13,14,15,16]. Considering the number of factors influencing the flotation of coal, standard procedures have been established. A standard sets rules and procedures, which are considered as authoritative for a particular task [17]. There are several standard organisations and some standards are duplications of other standards. One standard of interest is the basic flotation test (AS 4156.2.1-2004) [18], which follows the International Standard (ISO 8858–1:1990). It consists of a single flotation test. It aims to give a preliminary evaluation method of the flotation characteristics of coal samples. The basic flotation test provides only a single yield point and ash percentage for a specific set of conditions. The sequential procedure (AS 4156.2.2-1998) [19], or standard tree test, aims to determine coal flotation characteristics by producing a curve that describes the sensitivity of flotation performance. It indicates the maximum possible yield for any specified ash level. Those two standards are particularly useful in the characterisation of coals and the development of process flowsheets.
Although standards are used to ensure uniformity in the interpretation of the results, the flotation standards are voluntary consensus standards. That is, they are not mandatory unlike safety standards. As such, companies are free to deviate from the standard procedures. This may be a problem for mining operations requesting standard tests to evaluate the floatability of their coal samples. Different commercial laboratories could produce varying results, which become difficult to interpret. Recognising this problem, the Australian Coal Association Research Program (ACARP), which includes many coal mining operations, decided to fund a study to determine the extent of the variation in those results. The aim of this study was to establish variations in the results obtained for a basic flotation test and a sequential flotation procedure across different laboratories. Samples were sent to eight laboratories and the results were assessed in terms of the standard procedures. It was noted that the interpretation of standard procedures is subjective. (It was not the aim of this study to investigate those differences. In addition, the interpretation of what must be present in the report and how the reports comply to the standards was performed according to the understanding of the standards by the authors.) The elements of the reports, the results from the basic test, and the sequential procedure were analysed. The application of dynamic time warping was proposed to quantitatively assess the latter. Future work for this investigation is concerned with differences in the methodology employed by different laboratories when following the standard procedure. It should be noted that this work is the first stage of a larger project in which the standard practice will be examined and changes to the standard will be tested.

2. Materials and Methods

The methodology for this study, whenever followed, is detailed in the Australian Standards AS 4156.2.1-2004 and AS 4156.2.2-1998. Only brief comments are made where necessary.
Both commercial laboratories (all approved by the National Association of Testing Authorities, NATA) and university laboratories participated in this study. No distinction was made between the two groups and they are all referred to as laboratory(ies). Each coal was tested 8 times since the laboratories were meant to conduct tests following the standard procedures. What was observed was within variation. The authors conducted the experiments and the results are displayed as one of the laboratories.

2.1. Coal Samples

Two coal samples were used for this study. A thermal coal sample was sourced from the Hunter Valley coal field in NSW and a metallurgical coal sample was sourced from the Bowen Basin in Qld, Australia. Both samples were plant feed and were taken from the conveyor belt. The sample preparation was performed by an external laboratory. The coal samples were wet tumbled to a top size of 212 μm, filtered, and air dried. The coal samples were divided into lots of 500 g. Two sample bags of 500 g were dispatched to each laboratory for each coal sample. Some of the laboratories characterised the feed. The mean moisture and the head ash of the feed are presented in Table 1. Only three laboratories provided the information contributing to Table 1. The determination of the moisture appears to have a relatively high variability, with one of the laboratories deviating from the other two laboratories.
The size analysis and size-by-size ash analysis of the feed was performed by three laboratories and is presented in Table 2. The results of the size analysis are consistent amongst the three laboratories, which provided this information.

2.2. Reagents

The collector used for the flotation of coal according to the standard was n-dodecane of analytical grade. The frother was 4-methyl-2-pentanol (or methyl isobutyl carbinol, MIBC) and was also of analytical grade. The water used for the flotation test according to the standard was deionised (DI) water or water of similar purity. It should be noted that some laboratories (C and G) have used diesel oil, as noted in Table 3. It should be noted that some laboratories may not have self-reported the use of different reagents.

2.3. Flotation

The flotation tests were to be conducted in a standard flotation cell. The tests were to be conducted according to the standards AS 4156.2.1 (2004) [18] for the basic test and AS 4156.2.2 (1998) [19] for the sequential flotation test. Briefly, in a standard test the sample is to be mixed in a flotation cell (approximately 3.5 L and equipped with a deflector block) to 10% solids. Dodecane and MIBC are to be added at a dosage rate of 1 mL/kg of dry solids and 0.1 mL/kg of dry solids, respectively. The pulp level is to be maintained at 20 mm below the overflow lip of the cell. The flotation test is to be conducted at impeller speed of 1500 rpm and the air flow rate is to be set at 4 L/min. During the test, the froth is to be scrapped every 15 s over a period of 3 min, after which the test is to be stopped. A sequential flotation test consists in a series of basic tests in which the concentrates and tailings are re-floated at various reagent concentrations.

2.4. Reporting

In each of the standards, a section is dedicated to reporting the results of the tests. They contain itemised elements, which ought to be included in the report. The reports were examined to determine if all the elements required by the standards were present. This step is subject to the interpretation of the authors.

2.5. Analysis of Results

All results were tabulated and statistically analysed with the statistical program R. The aim of the standard test is to obtain repeatable and reproducible results. The analysis looked at the reproducibility of the results achieved by the standards. It also included variations due to deviations from the standard procedures, which cannot be measured unless disclosed by the laboratories.

3. Results and Discussion

3.1. Reporting

The reports were submitted in various formats and contained various elements. A checklist of the elements and those reported in the different reports is presented in Table 3 and Table 4 for the basic test and sequential procedure, respectively. The tables reveal the high level of inconsistencies between the laboratories and the standards. A few comments are warranted.
Sample history cannot always be known by the laboratory performing the test since it is up to the customer to disclose the history of a sample. As such, it cannot always be included in the report. One major element missing is the characterisation of the feed. It is noted that sizing has its own standard and in some cases the customer of a laboratory may have to ‘order’ or ‘request’ a size analysis and a flotation test. Nevertheless, the flotation standard does require a size analysis to be conducted on the feed. In addition, the basic test requires an ash analysis of the different size fractions. Table 3 demonstrates that laboratories will have to adapt their practices in order to comply to the standard if they claim to follow the standard.
The standard may also lack clarity. The reporting section of the standard requires that the mass of the feed, concentrate, and tailings be reported. However, the same standard proposes a template for the report, which does not include the mass of the concentrate and the tailings. Whilst the report was deemed incomplete if the masses of all components were not included, it is important to highlight that this element is subject to interpretation. That is, given the mass of the feed and the distribution of the concentrate and tailings, the mass of coal to the concentrate and tailings can be easily calculated. However, the standard should be clear on the number of derived elements in the report. Similarly, the distribution of the tailings could be omitted and back calculated from the distribution of the concentrate.
The reports for the sequential test showed similar shortfalls to the basic test. For example, all elements were present to calculate the yield–ash relationship but in some cases the numbers were not tabulated and a graphical presentation of the yield–ash relationship was not included.

3.2. Basic Flotation Test

Laboratories were asked to perform a basic flotation test on two coal samples. The percent mass to the concentrate obtained for each laboratory is presented in Figure 1. The data was aggregated in bins of 5%. The standard specifies that when a repeat test is conducted, there should be no more than 5% (absolute) variation between the tests. Although it may differ in terms of reproducibility (as opposed to repeatability), a 5% variation was selected to present the results. For both samples, there are three distinct groups. Some statistics are also presented in Figure 1. The range clearly showed that the values taken by the yield were over three times that of the cut-off point for repeatability. A typical deviation from the mean value was 5.4% for the thermal coal and 6.2% for the metallurgical coal, which was also outside the repeatability limit. (Note that the standard has no reproducibility variation limit but it is assumed it should be close to the repeatability limit of the test.) Thus, the standard basic test was either (i) not reproducible or (ii) the method employed by the various laboratories differed (which is partly true in terms of operator). Another study will investigate those variations in procedures including the effect of the operator on the yield obtained from the basic test.
Further analysis was undertaken in order to determine the ‘true’ yield of the coal samples. Bootstrapping was employed to re-sample the measurements and produce estimates of the mean yield. A total of 10,000 re-samplings were performed and compiled. The means of the new samples are displayed in Figure 2. The mean yield for the thermal coal was 29.3% whilst that for the metallurgical coal was 76.7%, which for both represent a small bias. Of interest are the confidence limits. They show that with 95% confidence, the expected yield for the thermal coal was between 25.4 and 32.4% whilst that for the metallurgical coal was between 72.2 and 80.2%. Based on these estimates, three of the seven laboratories did not estimate the true yield of the thermal coal sample appropriately and four of the seven laboratories did likewise for the metallurgical coal sample. One of the laboratories had a lower estimate of the yield (outside the lower confidence limit) for both samples and another laboratory had a higher estimate of the yield (outside the upper confidence limit) for both samples.
The values of the ash produced upon the combustion of the concentrate are shown in Figure 3. The observations were grouped in bins of 0.5%, which was the cut-off point for the repeatability of the test. This cut-off point was for a repeat ash analysis on the same concentrate sample and is not correlated to the reproducibility of the test, which was not specified. In the result presented in Figure 3, the ash was analysed for eight different samples, which were produced by the laboratories from eight distinct concentrates. Therefore, more variability was expected. The metallurgical coal series had four distinct groups whilst the thermal coal had seven different groups, almost one per laboratory. The thermal coal, as shown in the statistics in Figure 3, had at least twice the range of the metallurgical coal and the typical variation from the mean value was also over twice as much as that of the metallurgical coal. Such results demonstrated the strong effect of the yield and coal type on the ash produced upon the combustion of the concentrate.
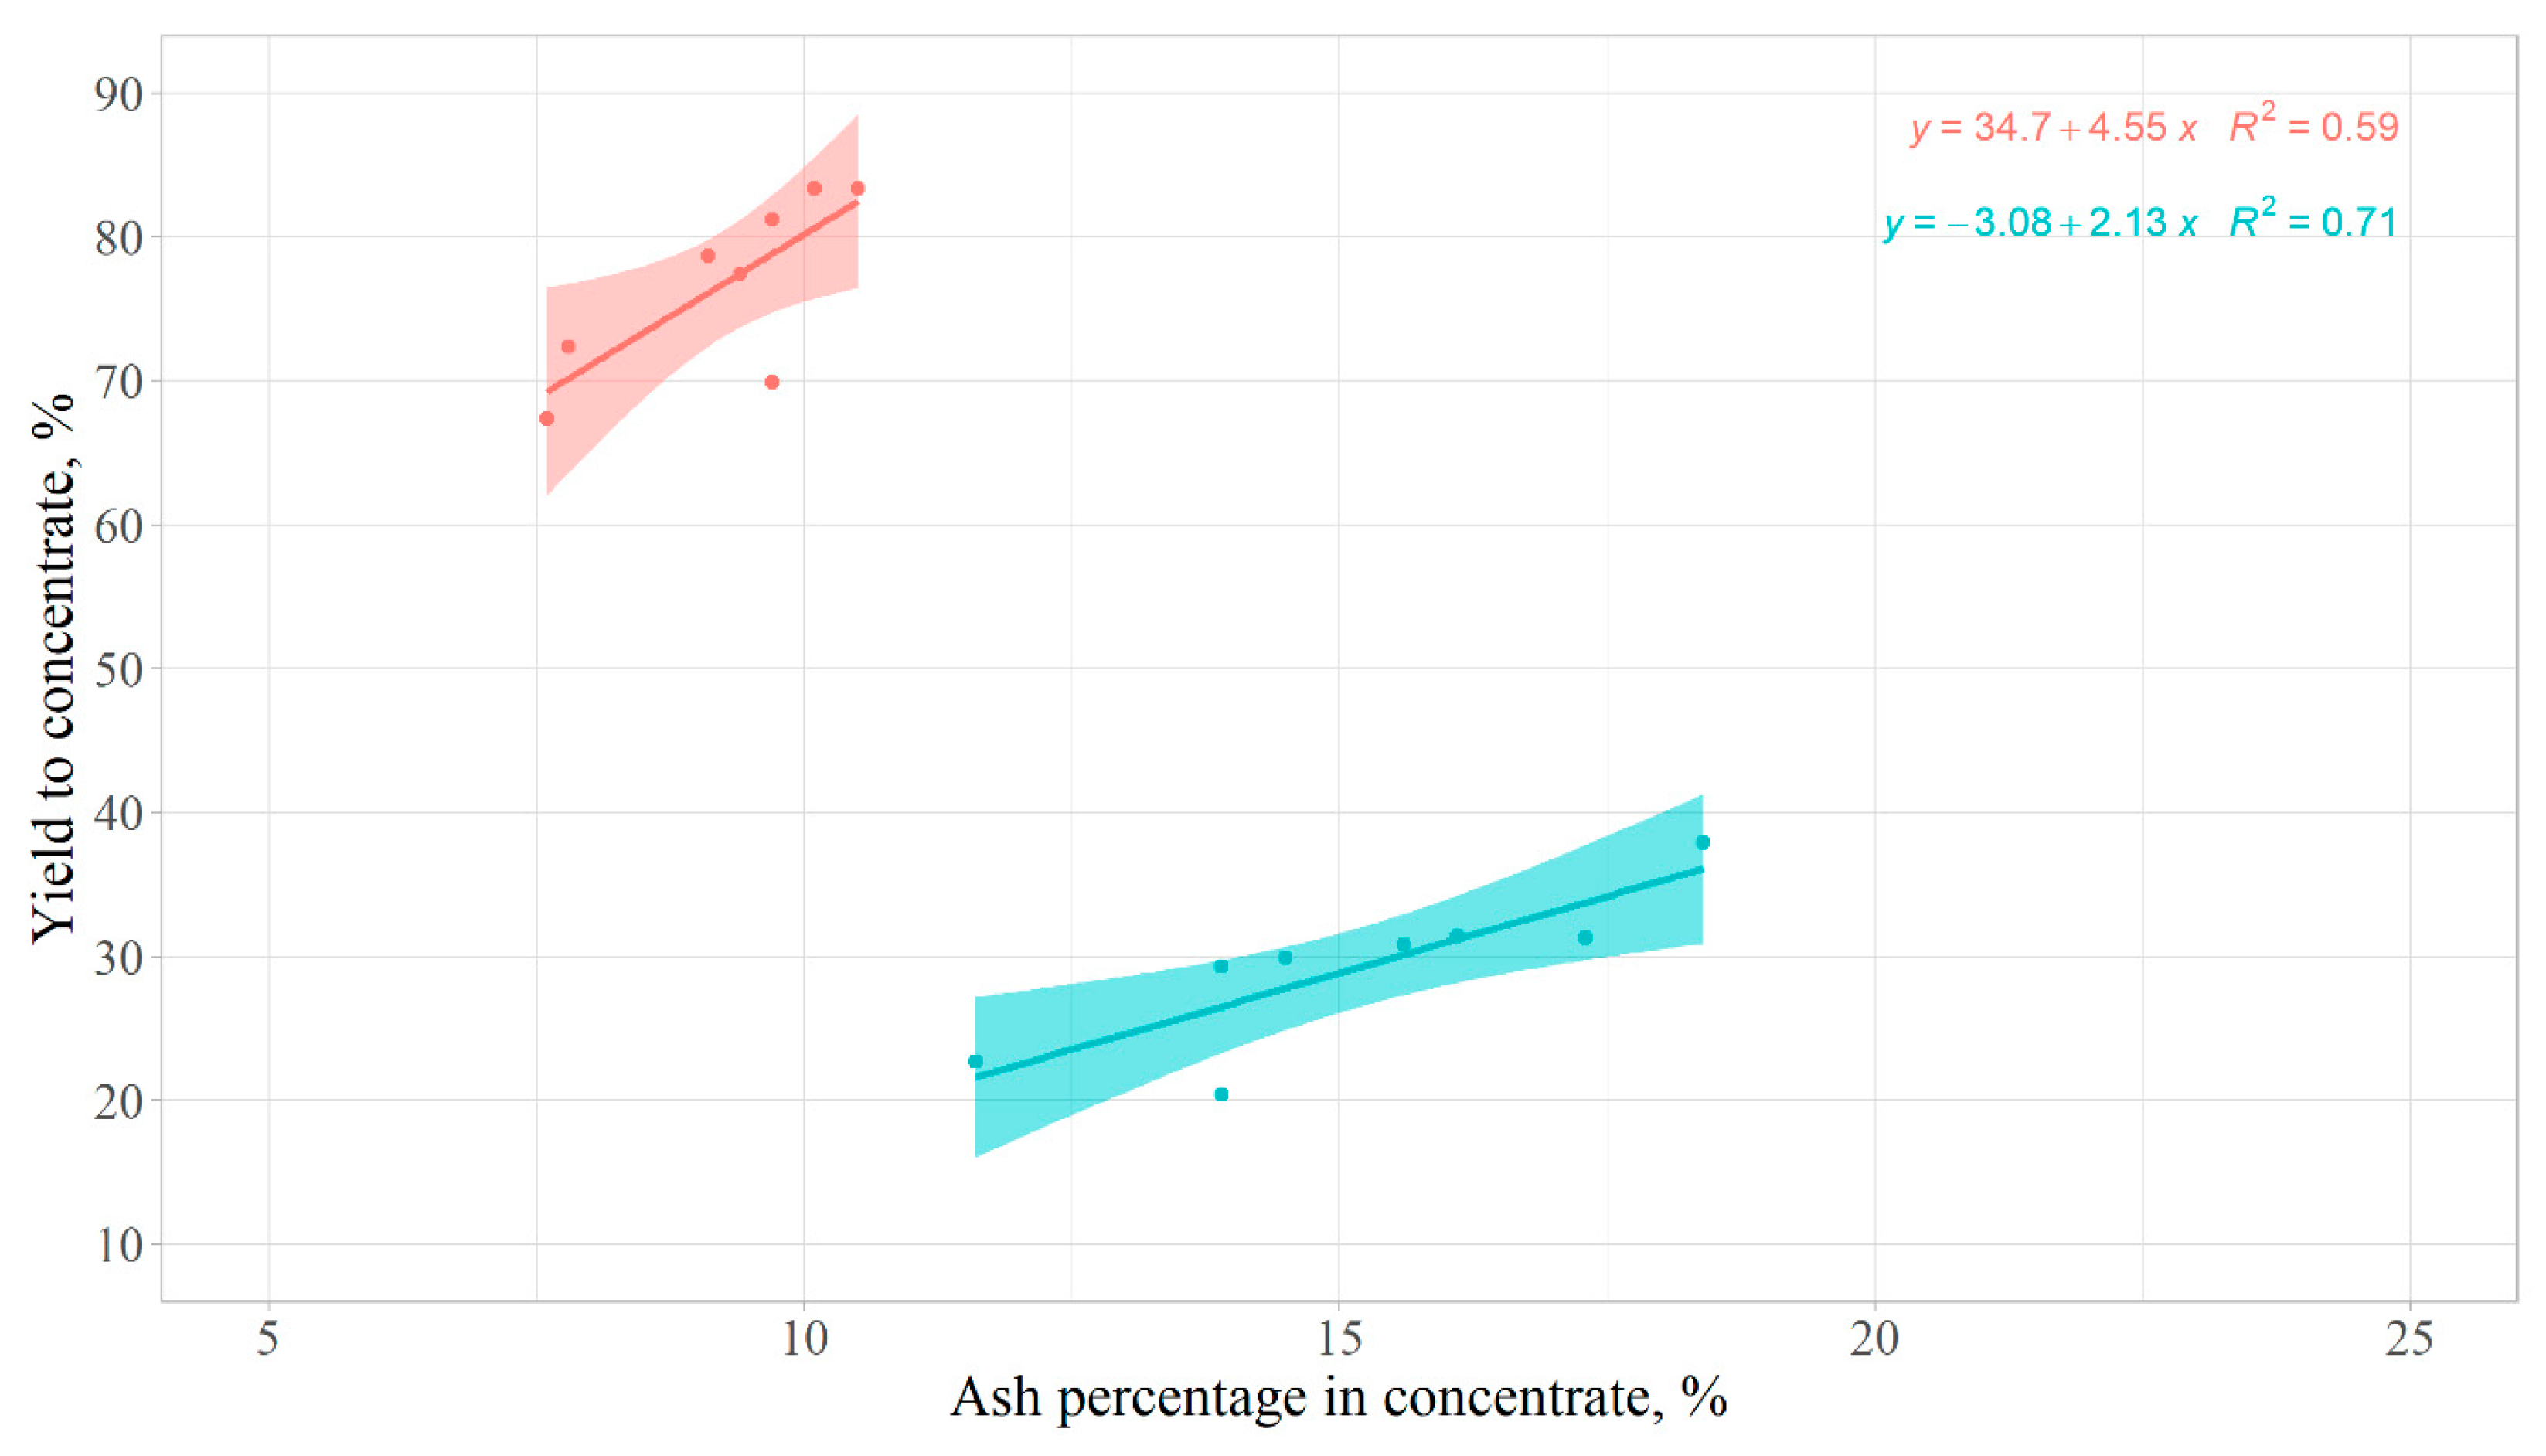
The relationship between the yield and the ash is captured in Figure 4. There was a somewhat linear trend over the range of the data considered. A change in the yield of the thermal coal resulted in a larger change in the measurement of the ash percentage as given by the slope, which explained the large variability in the ash percentage obtained from the different laboratories (Figure 3). This conclusion can be confirmed using the sequential procedure.

3.3. Sequential Flotation Procedure

3.3.1. Qualitative Comparison

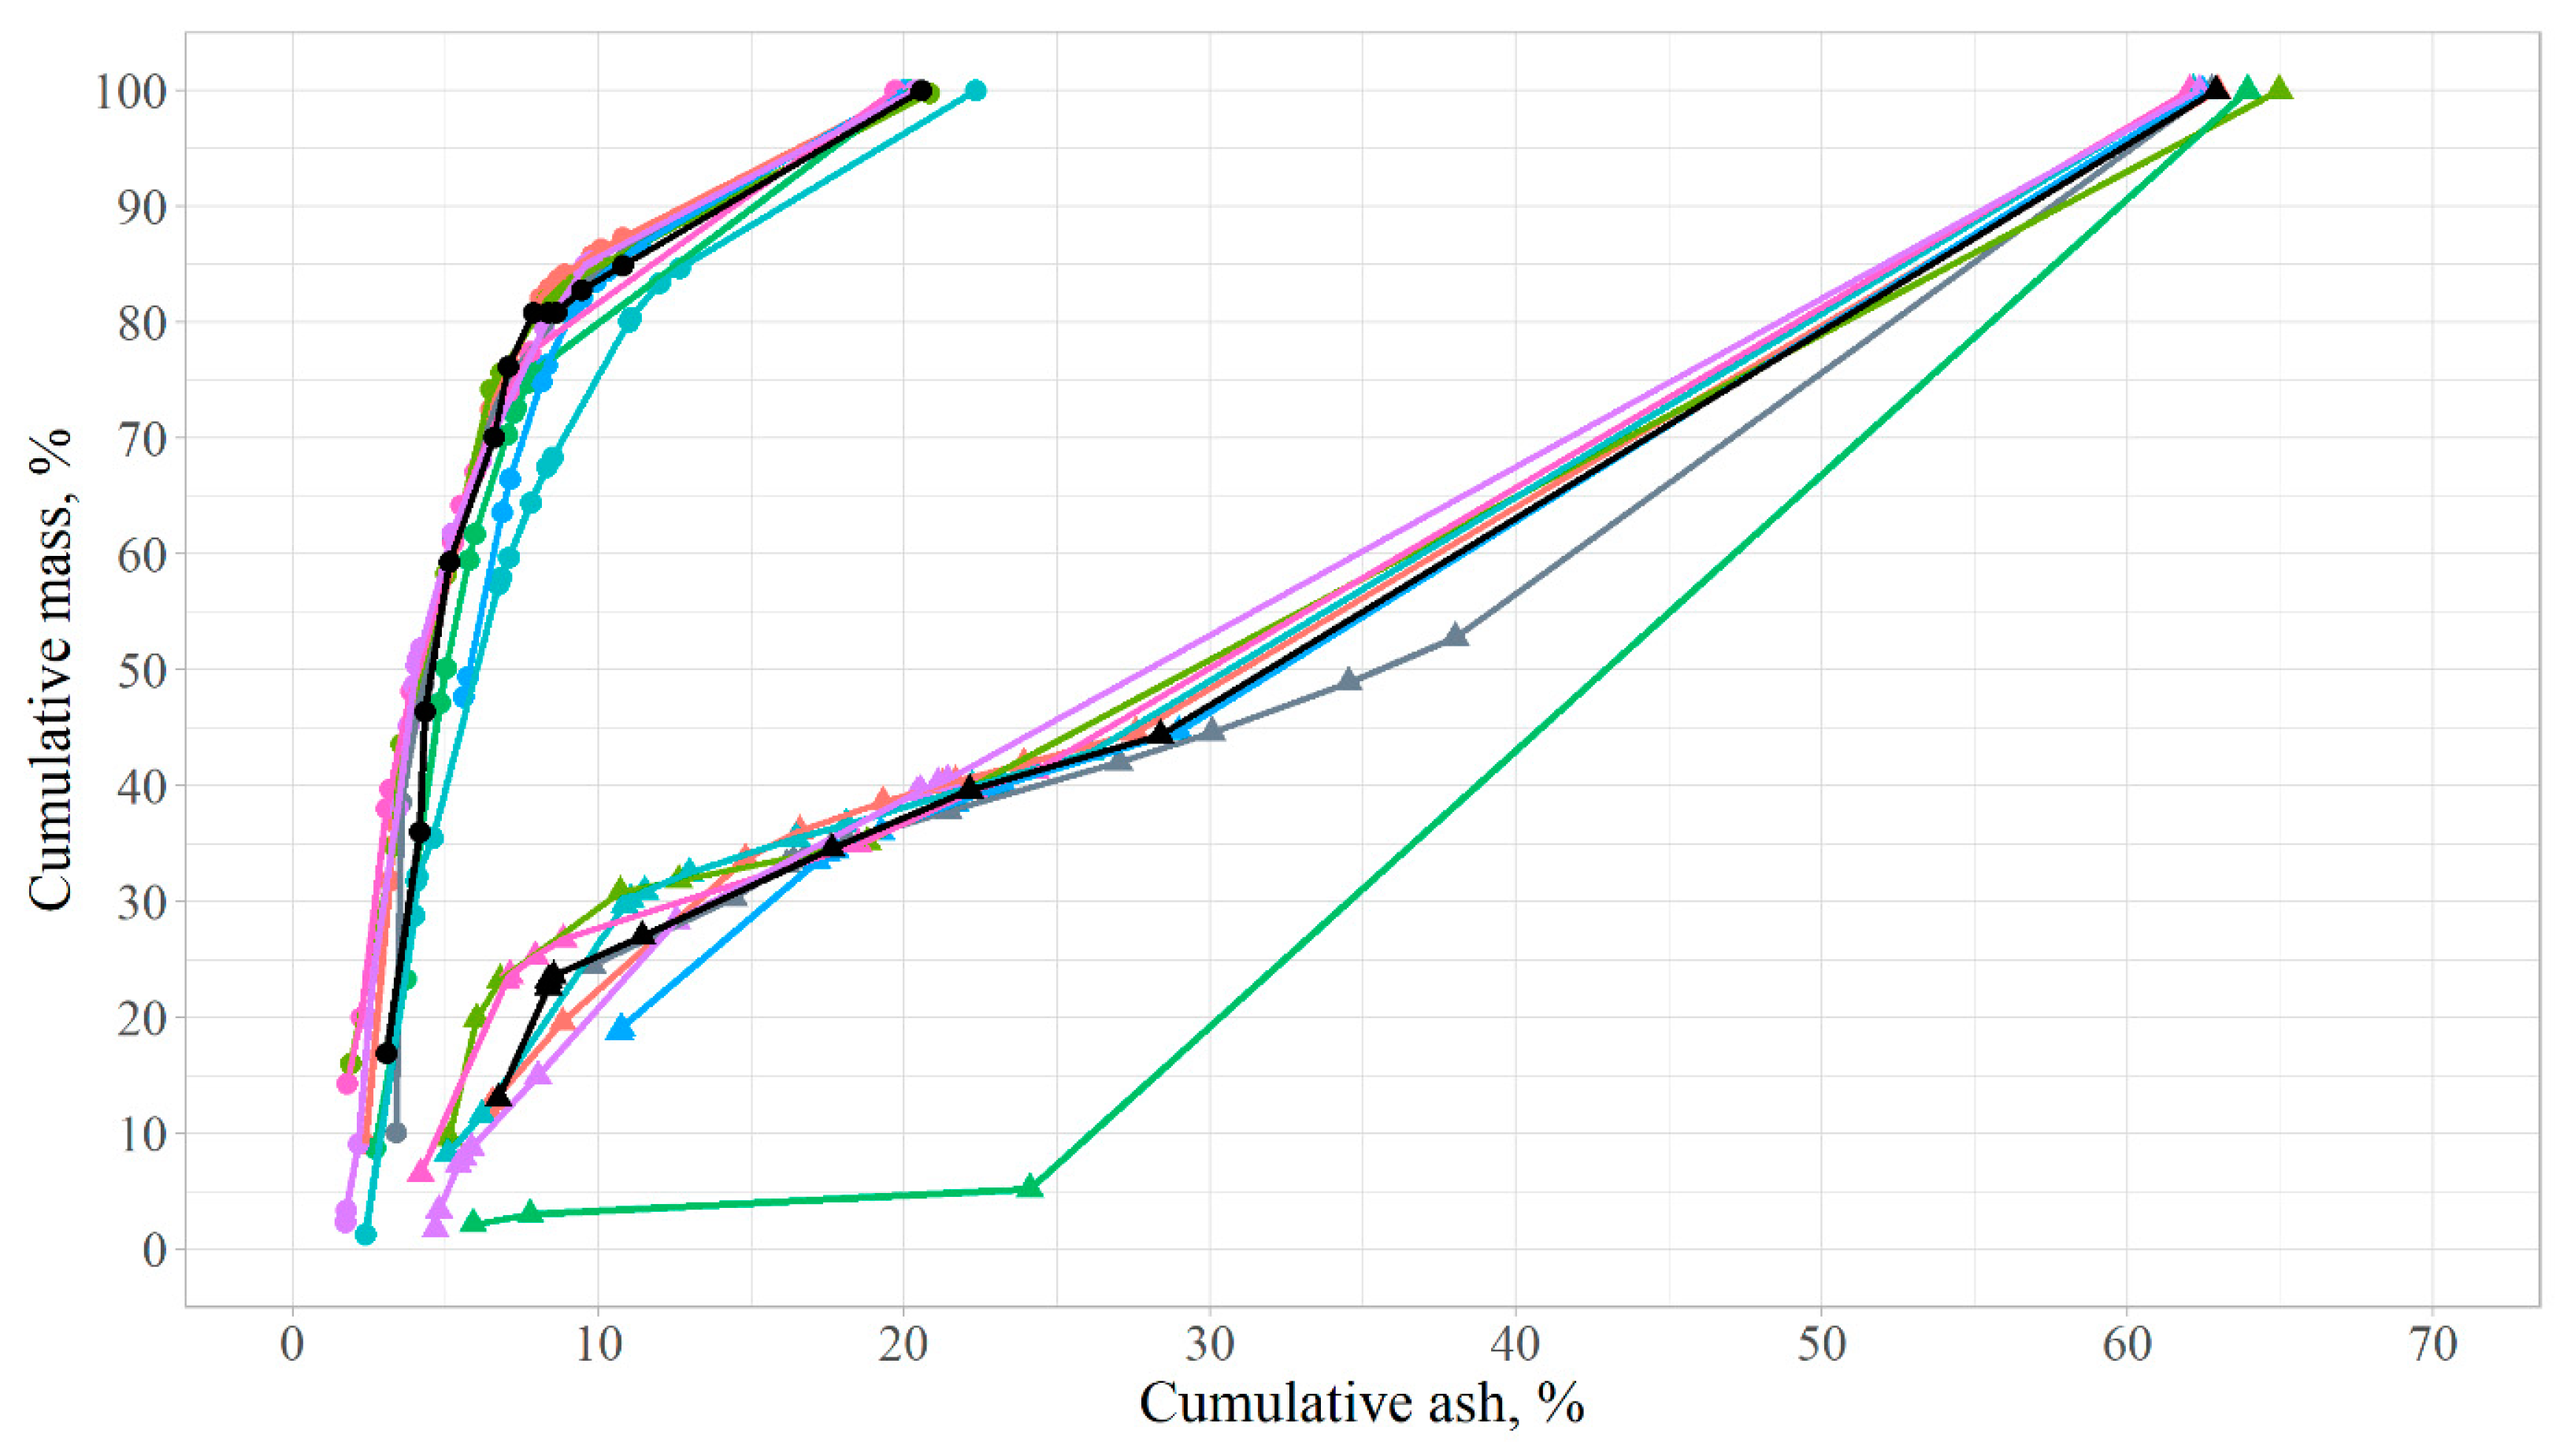
The sequential flotation procedure was used to determine the possible yield at any given ash level. The shape of the curve showed the sensitivity of the flotation performance to both the coal sample and to the operating conditions. Figure 5 presents the results of the sequential procedure for the thermal and metallurgical coals for the eight laboratories. The yield–ash curve of the metallurgical coal is more sensitive to changes in operation, since a small change in ash leads to a greater change in yield. For the thermal coal, the variation in the yield–ash curves appeared larger. An attempt to perform a quantitative analysis followed.

3.3.2. Qualitative Comparison

In the assessment of the repeatability of a yield–ash curve, the datapoints from different repeat experiments are plotted and qualitatively compared, e.g., in [20,21]. (An index can be used to compare different coals but not to evaluate the similarity or dissimilarity between the curves.) Dynamic time warping (DTW) is a method used to find the optimal coupling between two sequences [22]. Thus, the distance between two points from two sequences, if any correspondence is found, is not a one-to-one relationship as in the Euclidian distance. DTW can be used to analyse vectors of different lengths. It is commonly used to quantify the dissimilarity between sequences. The DTW distances between the curves for the thermal and metallurgical coal samples are presented in Table 5 and Table 6, respectively, for the different laboratories. The overall mean deviation indeed suggested that there was more variation in the thermal coal sample than the metallurgical coal sample.
The distance between two curves is sensitive to the extent of the curve. For example, laboratory A, the grey curve in Figure 5, had fewer data points in the lower end of the curve and a few more points in the mid-range to higher end of the curve (i.e., between 30 and 40% cumulative ash), which explained the higher mean dissimilarity.
The reagent was also shown to be very important, especially at lower concentrations. Laboratory C had similar results to the other laboratories for the basic test (see relative clustering of the data in Figure 1). However, the sequential procedure required lower collector dosing, which may be less effective, as shown by the green curve in Figure 5. As a result, the basic test produced a yield–ash concentrate greater than expected from the yield–ash curve. It is also noted that the sequential procedure was highly dependent on the operator.
The procedure of Petitjean, Ketterlin and Gançarski [22] to find a global average was applied on the datasets provided by the laboratories that used dodecane as a collector. The technique, called DTW barycentre averaging (DBA), consists in a series of iterations to refine an initial average sequence. The initial average sequence in the DBA uses elements from the set of sequences to be averaged. Although robust, it was found that variations occurred depending on the element used from the dataset to initialise the averaging sequence. Thus, 100 replications of the DBA algorithms were performed and the result is referred to as simulation 1. The mean of the pairwise distances of the sequences in simulation 1 was calculated. Running another set of 100 replications to find the global distance between the sequences from simulation 1 produced a set called simulation 2. The mean of the pairwise distances of the sequences in simulation 2 was not found to improve significantly upon simulation 1. Similarly, simulation 3, in fact, provided a worse mean pairwise distance. Thus, one global average was selected.
The global average sequence was plotted along with the individual laboratory data in Figure 5 for comparison (in black). Graphically, the global average showed a good agreement with the test data with a potential loss of resolution in the lower end of the curves. The distance of each curve from the global average is presented in Table 7. Again, the thermal coal showed a greater overall deviation in the measurements and the deviation from the mean was also larger.
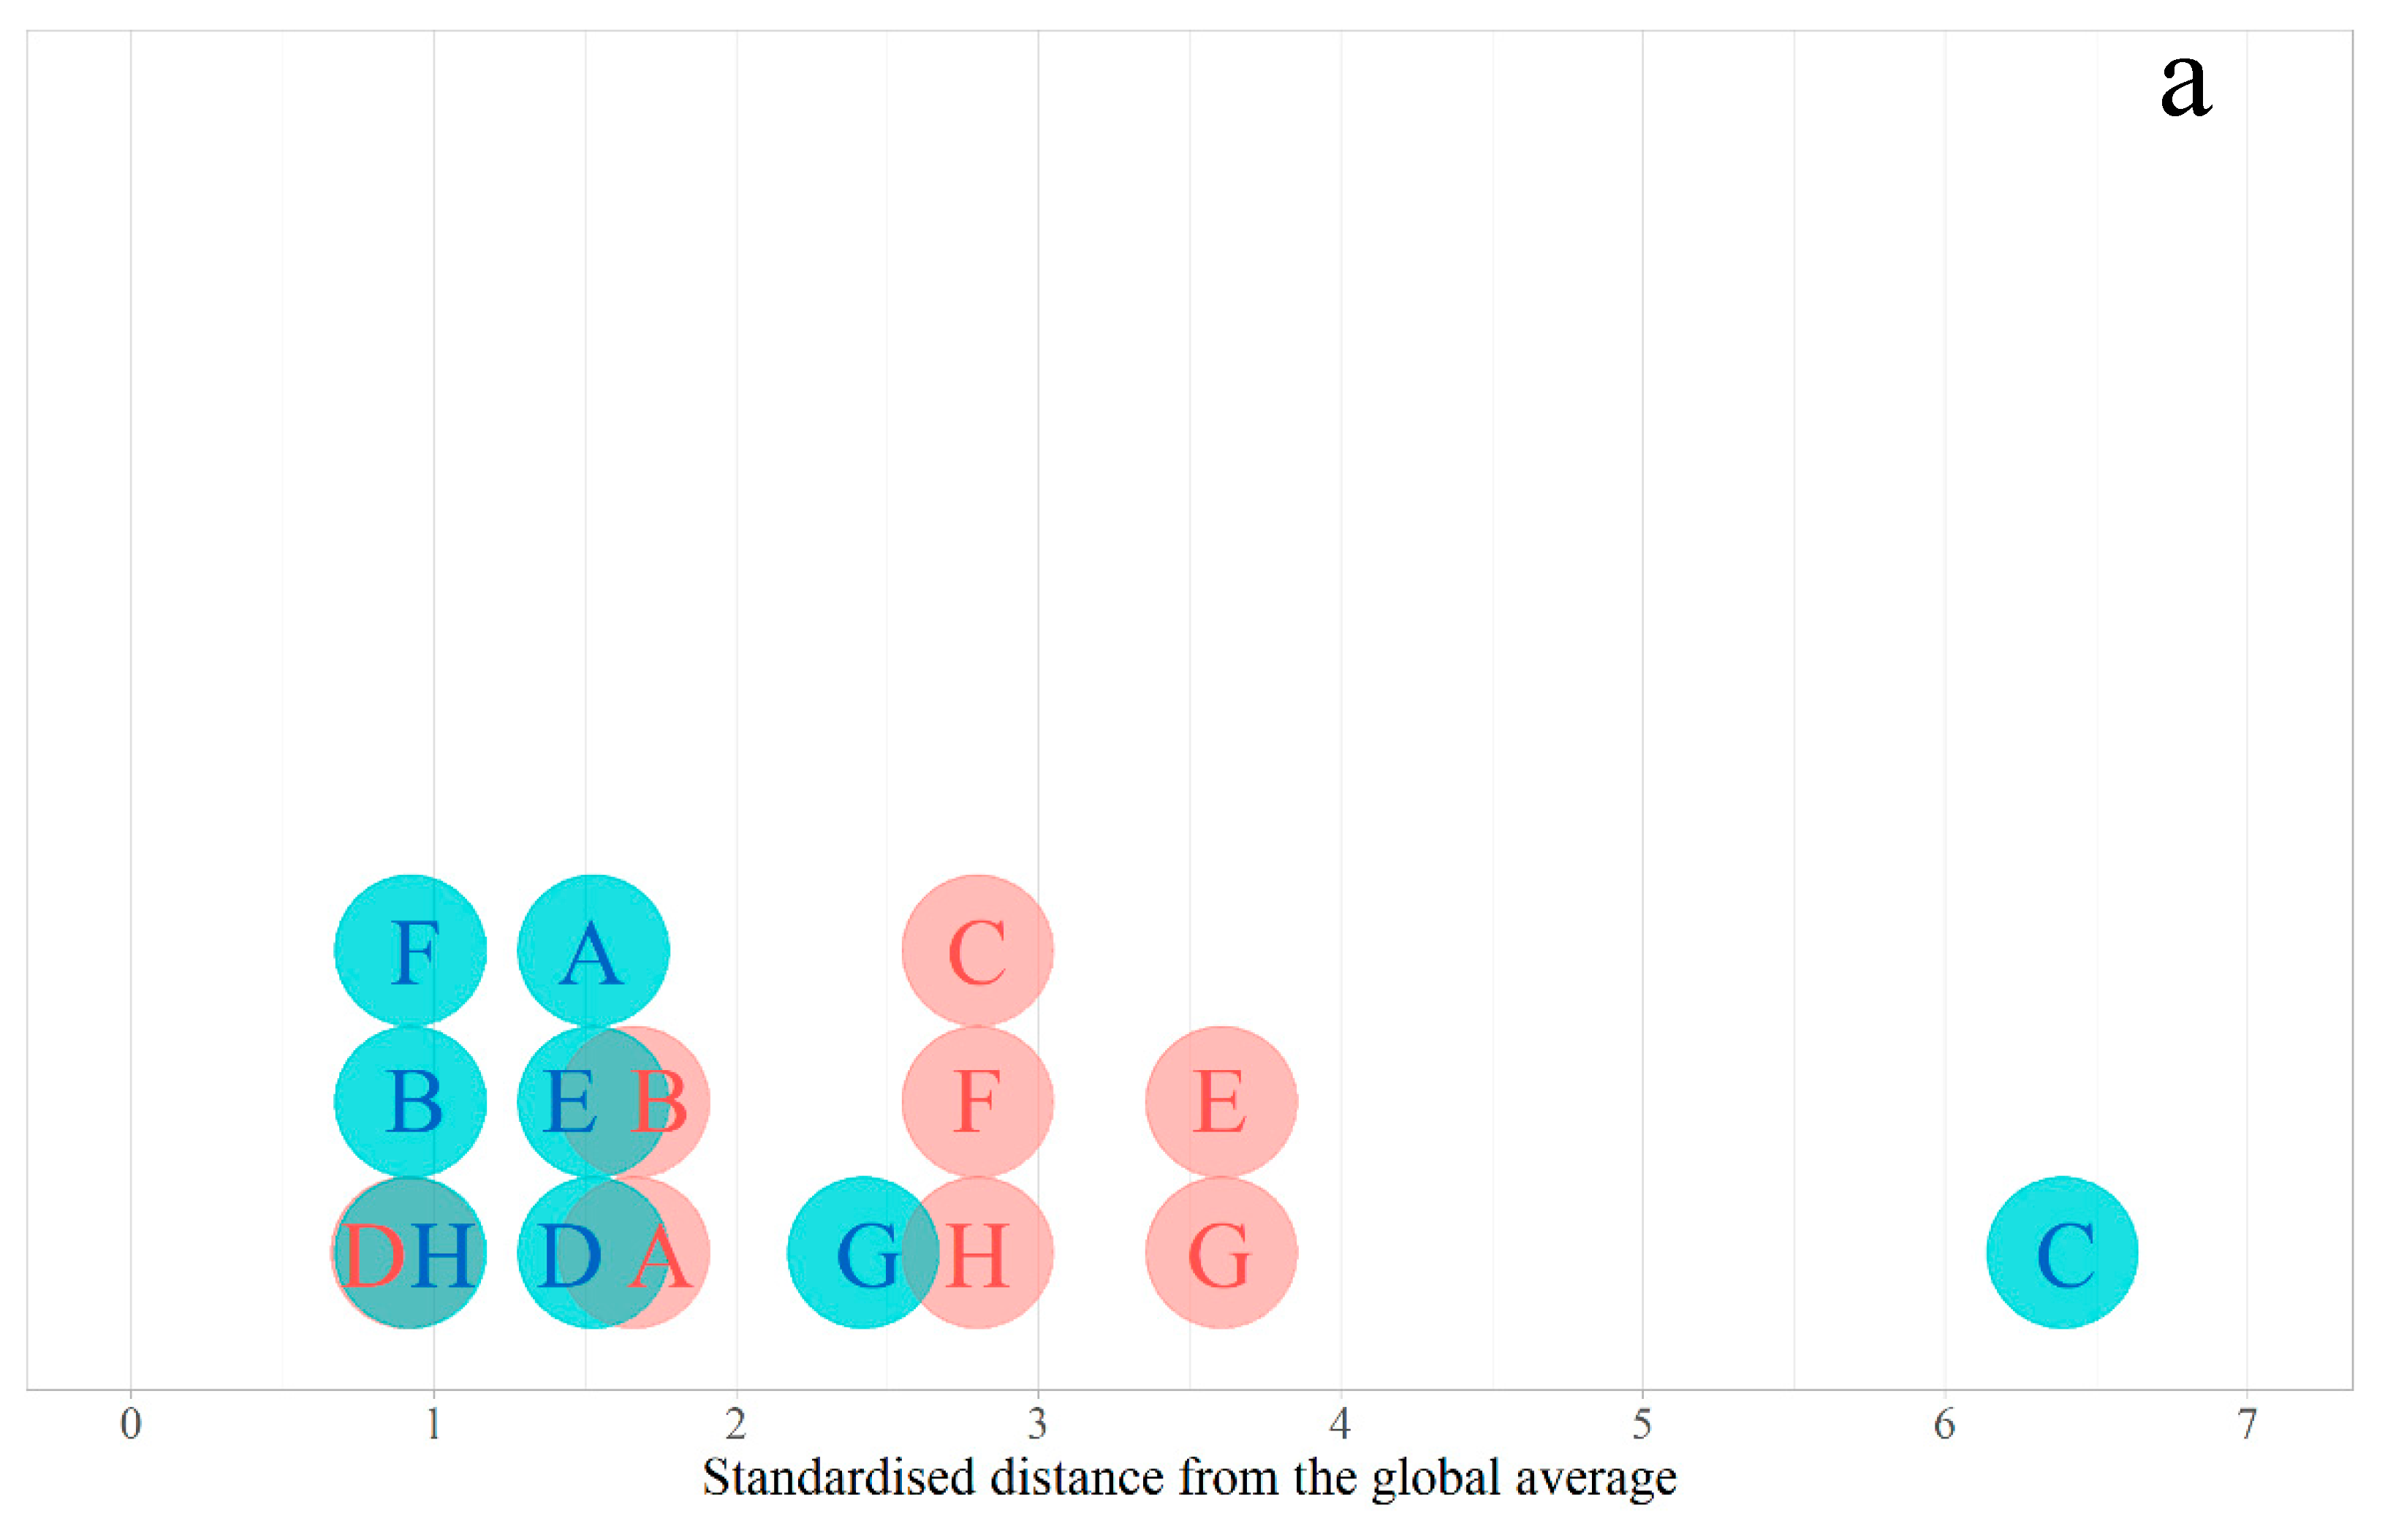
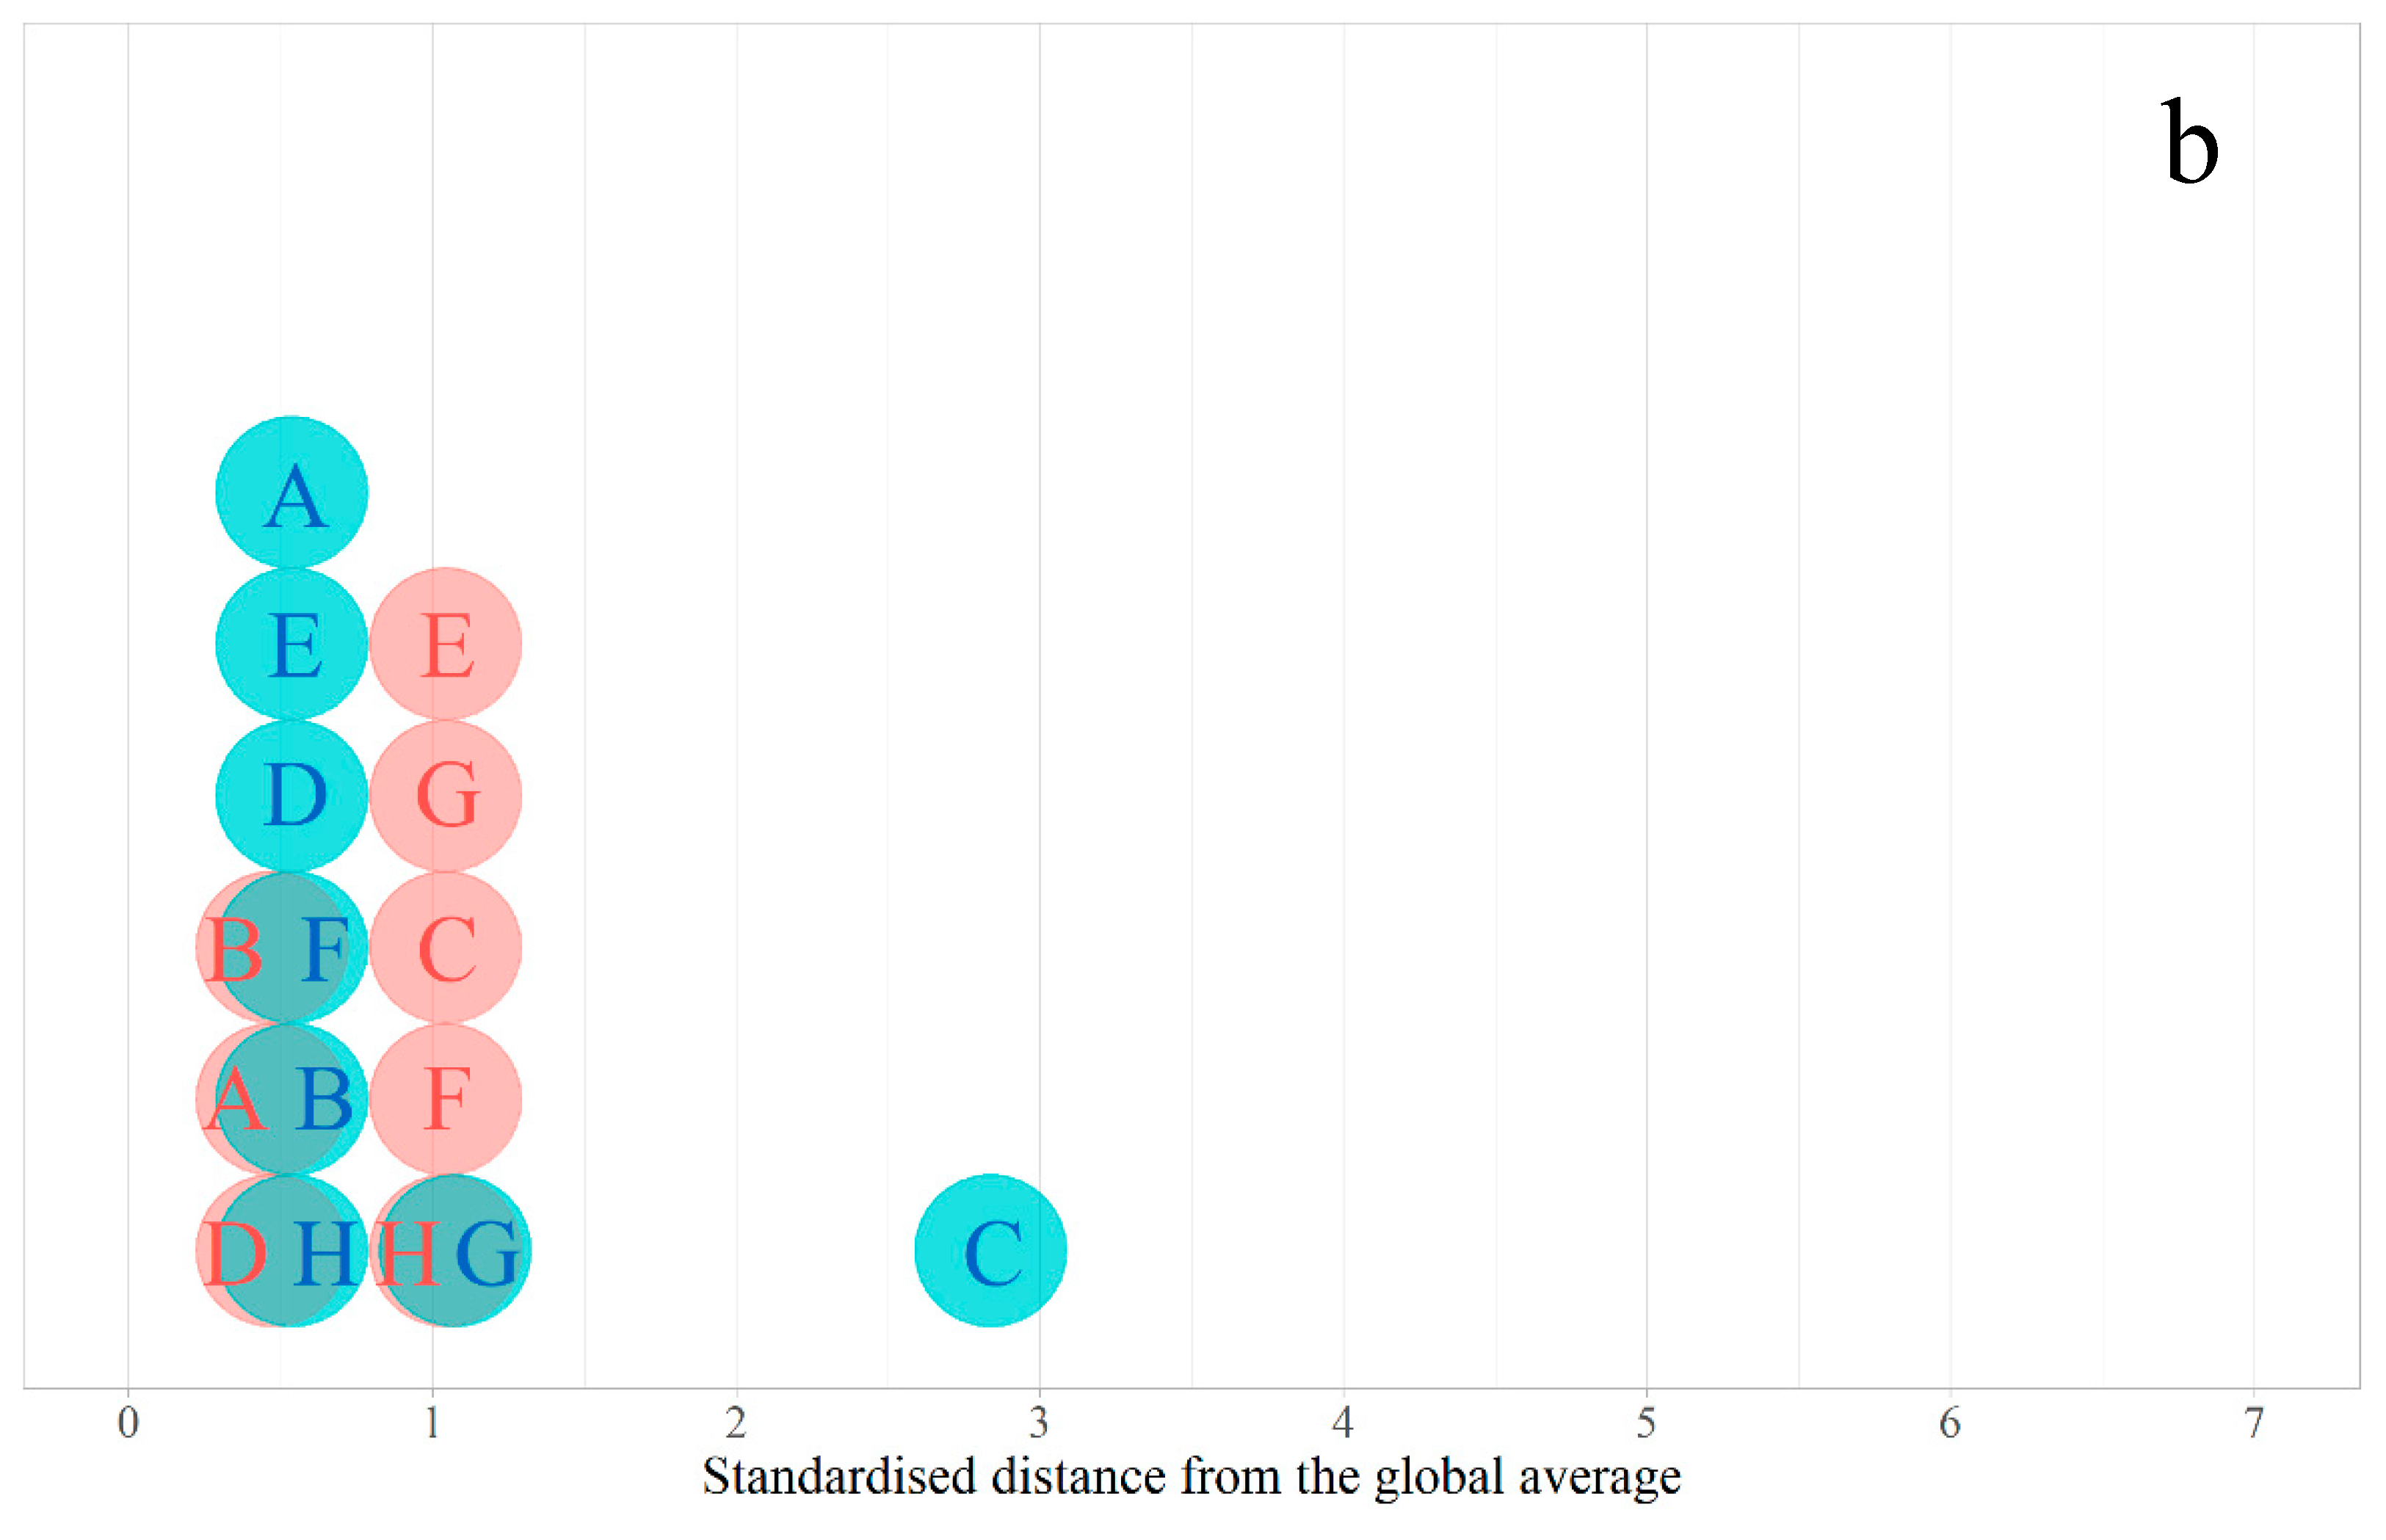
The standard deviation in Table 7 is the deviation within the measurements. A standard deviation from the global average was calculated as 88.8 and 67.0 ash % 2 + yield % 2 for the thermal and metallurgical coal, respectively. It was used to determine the t-score of the yield–ash curves, which is plotted in Figure 6a. The DTW distance is an absolute value such that only an absolute t-score is presented. Figure 6b assumed a constant standard deviation of 200 ash % 2 + yield % 2 . This selection was arbitrary and more experimentation could be used to determine an acceptable value for reproducibility. The figure is used to highlight that a deviation from the mean can be standardised and potential outliers may be identified.

3.3.3. Other Comparison Methods (Hypothesis Testing and Clustering)

A quantitative comparison of the yield–ash curves provided a means to generalise the sample data to a population, accounting for random variation. Unlike a mean value generally obtained for a sample, the method described in Section 3.3.1 provided a sequence. It was difficult to conduct further data reduction on the sequence without losing meaning. However, two populations could be compared given two sample sequences. It could also be used for more advanced comparison methods, such as clustering.
Two populations can be compared inferentially from two samples using a t-test [23]. For examples, given two populations, a system of hypotheses can be proposed:
H 0 :   μ 1 μ 2 = 0 H 1 :   μ 1 μ 2 0
where μ1 and μ2 are the distance means of the two populations. The two-sample t-test takes the form:
t = x ¯ 2 x ¯ 1 δ 0 s 1 n 1 + 1 n 2
where t is the size of the standardised distance between the means of two samples, x ¯ 1 and x ¯ 2 are the sample means, δ 0 is difference expected for the null hypothesis (here it is 0), n 1 and n 2 are the sample sizes, and s is the pooled standard deviation and is calculated as:
s = ( n 1 1 ) s 1 2 + ( n 2 1 ) s 2 2 n 1 + n 2 2
where s 1 and s 2 are the standard deviations of samples 1 and 2, respectively. For the purpose of calculation, the two samples were assumed to have equal standard deviations of 200 ash % 2 + yield % 2 . The means for each sample were curves, however, the distance between the curves could be used as a difference, i.e., x ¯ 2 x ¯ 1 in Equation (2), and equal to 492.5 ash % 2 + yield % 2 . The t-value calculated from the six observations (i.e., those not reporting using diesel as a collector) for each of the coal samples was 4.27. This corresponds to a p-value of 0.004, which meant that considering the difference in the means (i.e., the distance between the curves), there was only 0.4% probability that the deviation observed was possible under the null hypothesis. It is likely that the two samples were different, that is, they produced different yield–ash relationships (despite the large standard deviation assumed).
The standard in [19] suggested that the procedure could be modified to compare different reagents, to test the effect of liberation and of particle size fractions in the feed. The above procedure could allow the comparison of the modified tests with a benchmark. It could also be applied in the metal industry for grade–recovery curves, unless a model is applied as in Napier-Munn [23].
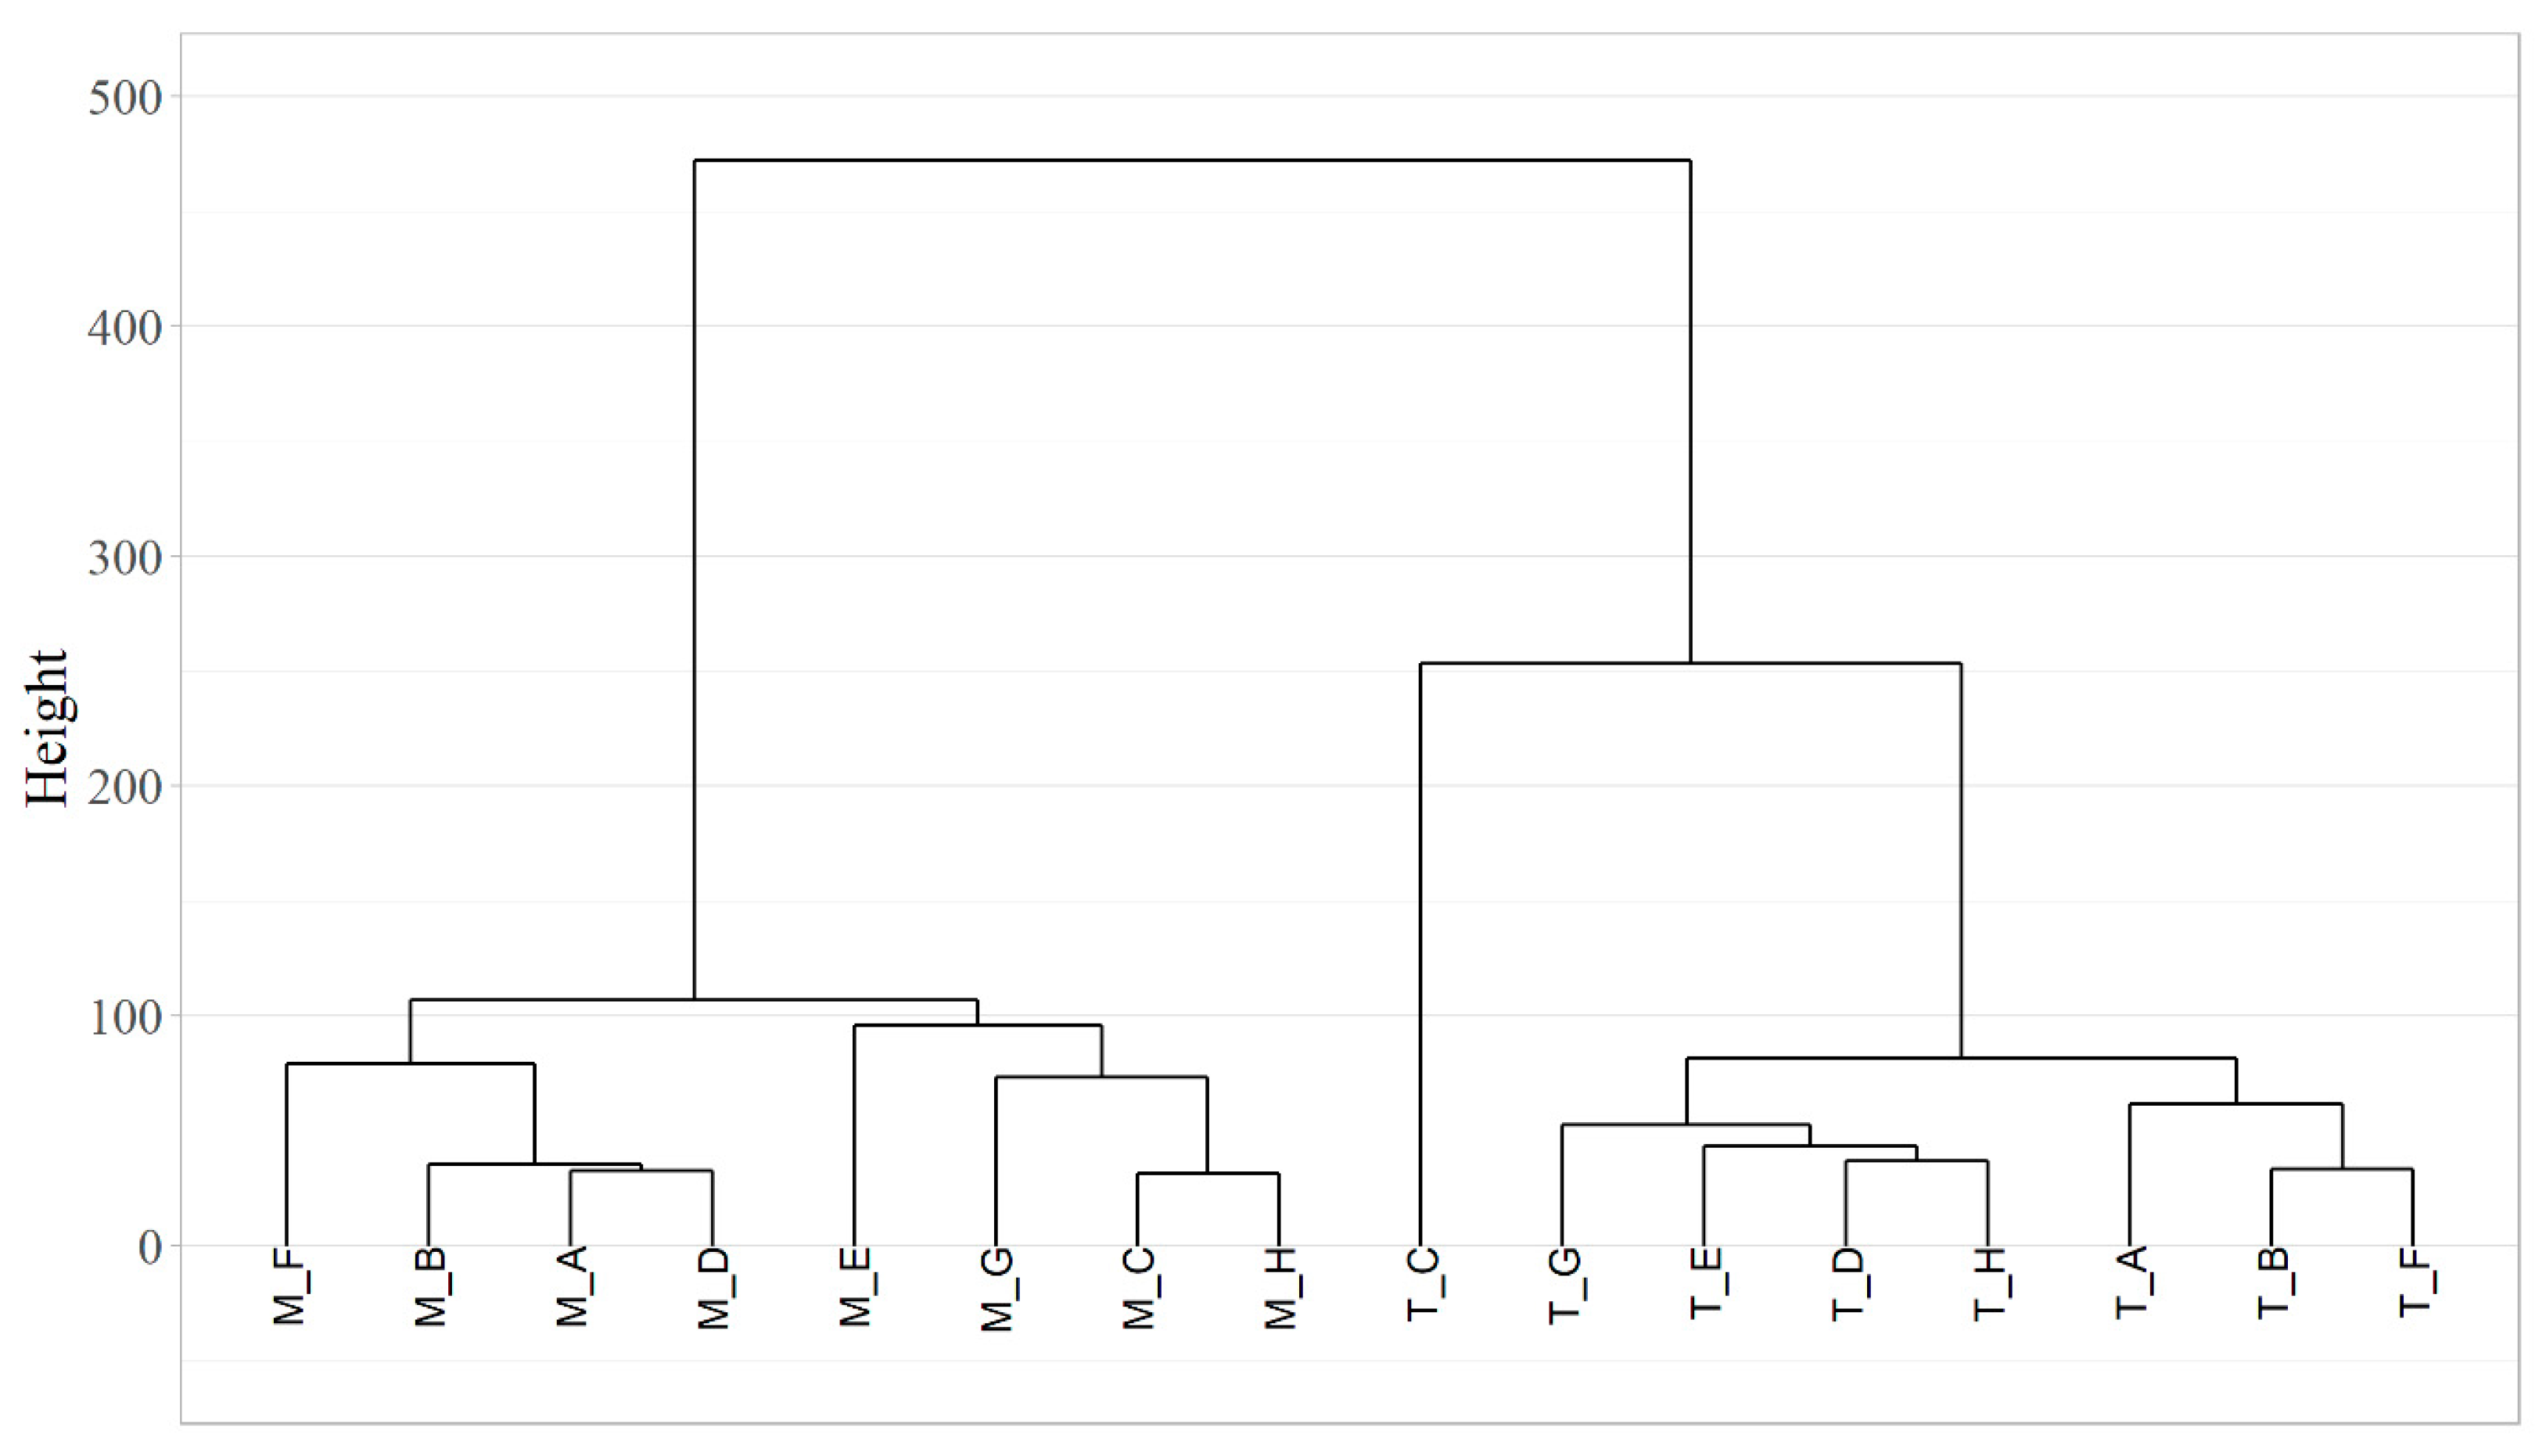
Using DTW provided a measure of dissimilarity of the yield–ash curves produced by the different laboratories. Hierarchical clustering could be used to agglomerate observations in a stepwise manner [24]. The algorithm used a dissimilarity measure between each of the observations, which was provided by the DTW distance. As the distance increased, the curves were considered increasingly more dissimilar. The algorithm compared the dissimilarity of the different elements using the Euclidean distance between the dissimilarity measures. Elements with the least dissimilarity were clustered. There are various ways of assigning a new dissimilarity measure to a group of elements (i.e., when two elements are clustered), which are called linkages. For this analysis, an average linkage was used, which considered the mean intercluster dissimilarity. The results of the clustering can be represented in the form of a dendrogram.
Figure 7 shows the dendrogram resulting from the clustering of the yield–ash curves based on the DTW distance and an average linkage. The dendrogram shows 16 leaves representing all individual yield–ash curves. The curves were progressively combined with branches to form subgroups based on the least amount of dissimilarity. The height at which elements and subgroups branched determined their similarity.
Figure 7 is a method of classifying the results presented in Table 3 and Table 4. A validation of the clusters should be performed to know if the clusters represented true subgroups. There were clearly two subgroups, which represented the two coal samples. Another remark was that the thermal coal yield–ash curve from laboratory C was different from the other thermal yield–ash curves. Thus, the clustering method could be employed to compare laboratories as well as coal samples, flotation reagents, particle size fractions, or any other factors tested according to the standard procedure.

4. Conclusions

A basic flotation test and a standard tree test (sequential procedure) were requested from eight laboratories to test the objective of measuring the reproducibility of the methods. The reproducibility is essential for mining operations to know the reliability of the results obtained from commercial laboratories. Some laboratories disclosed a methodology slightly deviating from the standard procedures. It was found that reporting was very inconsistent, which is likely due to the inclusion of multiple tests (e.g., sizing) with the flotation test. Such test may have to be specifically requested. It was also found that the yields obtained in the basic test are relatively consistent. However, the ash analysis resulted in greater variations, which was explained by the shape of the yield–ash curves.
Yield–ash curves were also produced and compared. Again, there was some variations in the results. Dynamic time warping (DTW) was used to assess the similarity between the curves. It could be used to produce an average curve and to perform comparisons. In the absence of a mathematical model, the procedure outlined in this study could be used to compare coal samples (i.e., compare the washability of coals from different seams or different coal splits within the same seam), reagents, or any variation in the method. It is recommended that more analyses be performed to establish what is a reasonable variation between repeats and replicates.
Finally, this work highlighted the extent of the variation in reproducing flotation tests using the standard. It is recommended to determine ways to improve the reproducibility of the standard.

Author Contributions

Conceptualisation, S.A.; methodology, G.B. and S.A.; formal analysis, G.B.; investigation, G.B.; data curation, G.B.; writing—original draft preparation, G.B.; writing—review and editing, G.B. and S.A.; project administration, S.A.; funding acquisition, S.A. All authors have read and agreed to the published version of the manuscript.

Funding

This research was funded by ACARP.

Institutional Review Board Statement

Not applicable.

Informed Consent Statement

Not applicable.

Data Availability Statement

Restrictions apply to the availability of these data.

Acknowledgments

The contribution from the Flotation Working Group, which has members from academia and the coal industry, is gratefully acknowledged.

Conflicts of Interest

The authors declare no conflict of interest.

References

  1. Leonard, J.W. (Ed.) Coal Preparation, 5th ed.; Society for Mining, Metallurgy, and Exploration, Inc.: Baltimore, ML, USA, 1991; p. 1184. [Google Scholar]
  2. Riazi, M.R.; Gupta, R. (Eds.) Coal Production and Processing Technology, 1st ed.; CRC Press (Taylor & Francis Group): Boca Raton, FL, USA, 2016; p. 535. [Google Scholar]
  3. Jameson, G.J. New directions in flotation machine design. Miner. Eng. 2010, 23, 835–841. [Google Scholar] [CrossRef]
  4. Gorain, B.K.; Franzidis, J.-P.; Manlapig, E.V. The empirical prediction of bubble surface area flux in mechanical cells from cell design and operating data. Miner. Eng. 1999, 12, 309–322. [Google Scholar] [CrossRef]
  5. Mohanty, M.K.; Honaker, R.Q. Performance optimization of Jameson flotation technology for fine coal cleaning. Miner. Eng. 1999, 12, 367–381. [Google Scholar] [CrossRef]
  6. Bonner, C.M.; Aplan, F.F. The influence of reagent dosage on the floatability of pyrite during coal flotation. Sep. Sci. Technol. 1993, 28, 747–764. [Google Scholar] [CrossRef]
  7. Dey, S.; Pani, S.; Singh, R. Study of interactions of frother blends and its effect on coal flotation. Powder Technol. 2014, 260, 78–83. [Google Scholar] [CrossRef]
  8. Erol, M.; Colduroglu, C.; Aktas, Z. The effect of reagents and reagent mixtures on froth flotation of coal fines. Int. J. Miner. Process. 2003, 71, 131–145. [Google Scholar] [CrossRef]
  9. Gupta, A.K.; Banerjee, P.K.; Mishra, A. Influence of chemical parameters on selectivity and recovery of fine coal through flotation. Int. J. Miner. Process. 2009, 92, 1–6. [Google Scholar] [CrossRef]
  10. Kurniawan, A.U.; Ozdemir, O.; Nguyen, A.V.; Ofori, P.; Firth, B. Flotation of coal particles in MgCl2, NaCl, and NaClO3 solutions in the absence and presence of Dowfroth 250. Int. J. Miner. Process. 2011, 98, 137–144. [Google Scholar] [CrossRef]
  11. Laskowski, J.S. Coal flotation in solution with a raised concentration of inorganic salts. Colliery Guard. 1965, 211, 361–365. [Google Scholar]
  12. Li, C.; Somasundaran, P. Role of electrical double layer forces and hydrophobicity in coal flotation in NaCl solutions. Energy Fuels 1993, 7, 244–248. [Google Scholar] [CrossRef]
  13. Li, G.; Deng, L.; Cao, Y.; Wang, B.; Ran, J.; Zhang, H. Effect of sodium chloride on fine coal flotation and discussion based on froth stability and particle coagulation. Int. J. Miner. Process. 2017, 169, 47–52. [Google Scholar] [CrossRef]
  14. Wei, T.; Peng, Y.; Vink, S. The joint action of saline water and flotation reagents in stabilizing froth in coal flotation. Int. J. Miner. Process. 2016, 148, 15–22. [Google Scholar] [CrossRef] [Green Version]
  15. Yoon, R.-H.; Sabey, J.B. Coal flotation in inorganic salt solutions. In Interfacial Phenomena in Coal Technology, 1st ed.; Botsaris, G.D., Glazman, Y.M., Eds.; Surfactant science series; Marcel Dekker, Inc.: New York, NY, USA, 1989; pp. 87–114. [Google Scholar]
  16. Bournival, G.; Yoshida, M.; Cox, N.; Lambert, N.; Ata, S. Analysis of a coal preparation plant. Part 2. Effect of water quality on flotation performance. Fuel Process. Technol. 2019, 190, 81–92. [Google Scholar] [CrossRef]
  17. Greulich, O.R.; Jawad, M.H. Primer on Engineering Standards, Expanded textbook ed.; John Wiley & ASME Press: Hoboken, NJ, USA, 2018; p. 146. [Google Scholar]
  18. Australian Standard. Froth flotation—Basic test (AS 4156.2.1). In Coal Preparation: Part 2.1: Higher Rank Coal; AS 4156.2.1; Australian Standard: Sydney, Australia, 2004; pp. 1–11. [Google Scholar]
  19. Australian Standard. Froth flotation—Sequential procedure (AS 4156.2.2-1998). In Coal Preparation: Part 2.2: Higher Rank Coal; AS 4156.2.2; Australian Standard: Sydney, Australia, 1998; pp. 1–20. [Google Scholar]
  20. Mohanty, M.K.; Honaker, R.Q.; Ho, K. Coal flotation washability: Development of an advanced procedure. Coal Prep. 1998, 19, 51–67. [Google Scholar] [CrossRef]
  21. Pratten, S.J.; Bensley, C.N.; Nicol, S.K. An evaluation of the flotation response of coals. Int. J. Miner. Process. 1989, 27, 243–262. [Google Scholar] [CrossRef]
  22. Petitjean, F.; Ketterlin, A.; Gançarski, P. A global averaging method for dynamic time warping, with applications to clustering. Pattern Recognit. 2011, 44, 678–693. [Google Scholar] [CrossRef]
  23. Napier-Munn, T.J. Statistical Methods for Mineral Engineers: How to Design Experiments and Analyse Data; Julius Kruttschnitt Mineral Research Centre: Indooroopilly, Australia, 2015; p. 628. [Google Scholar]
  24. James, G.; Witten, D.; Hastie, T.; Tibshirani, R. An Introduction to Statistical Learning with Applications in R; Springer: New York, NY, USA, 2017; p. 426. [Google Scholar]
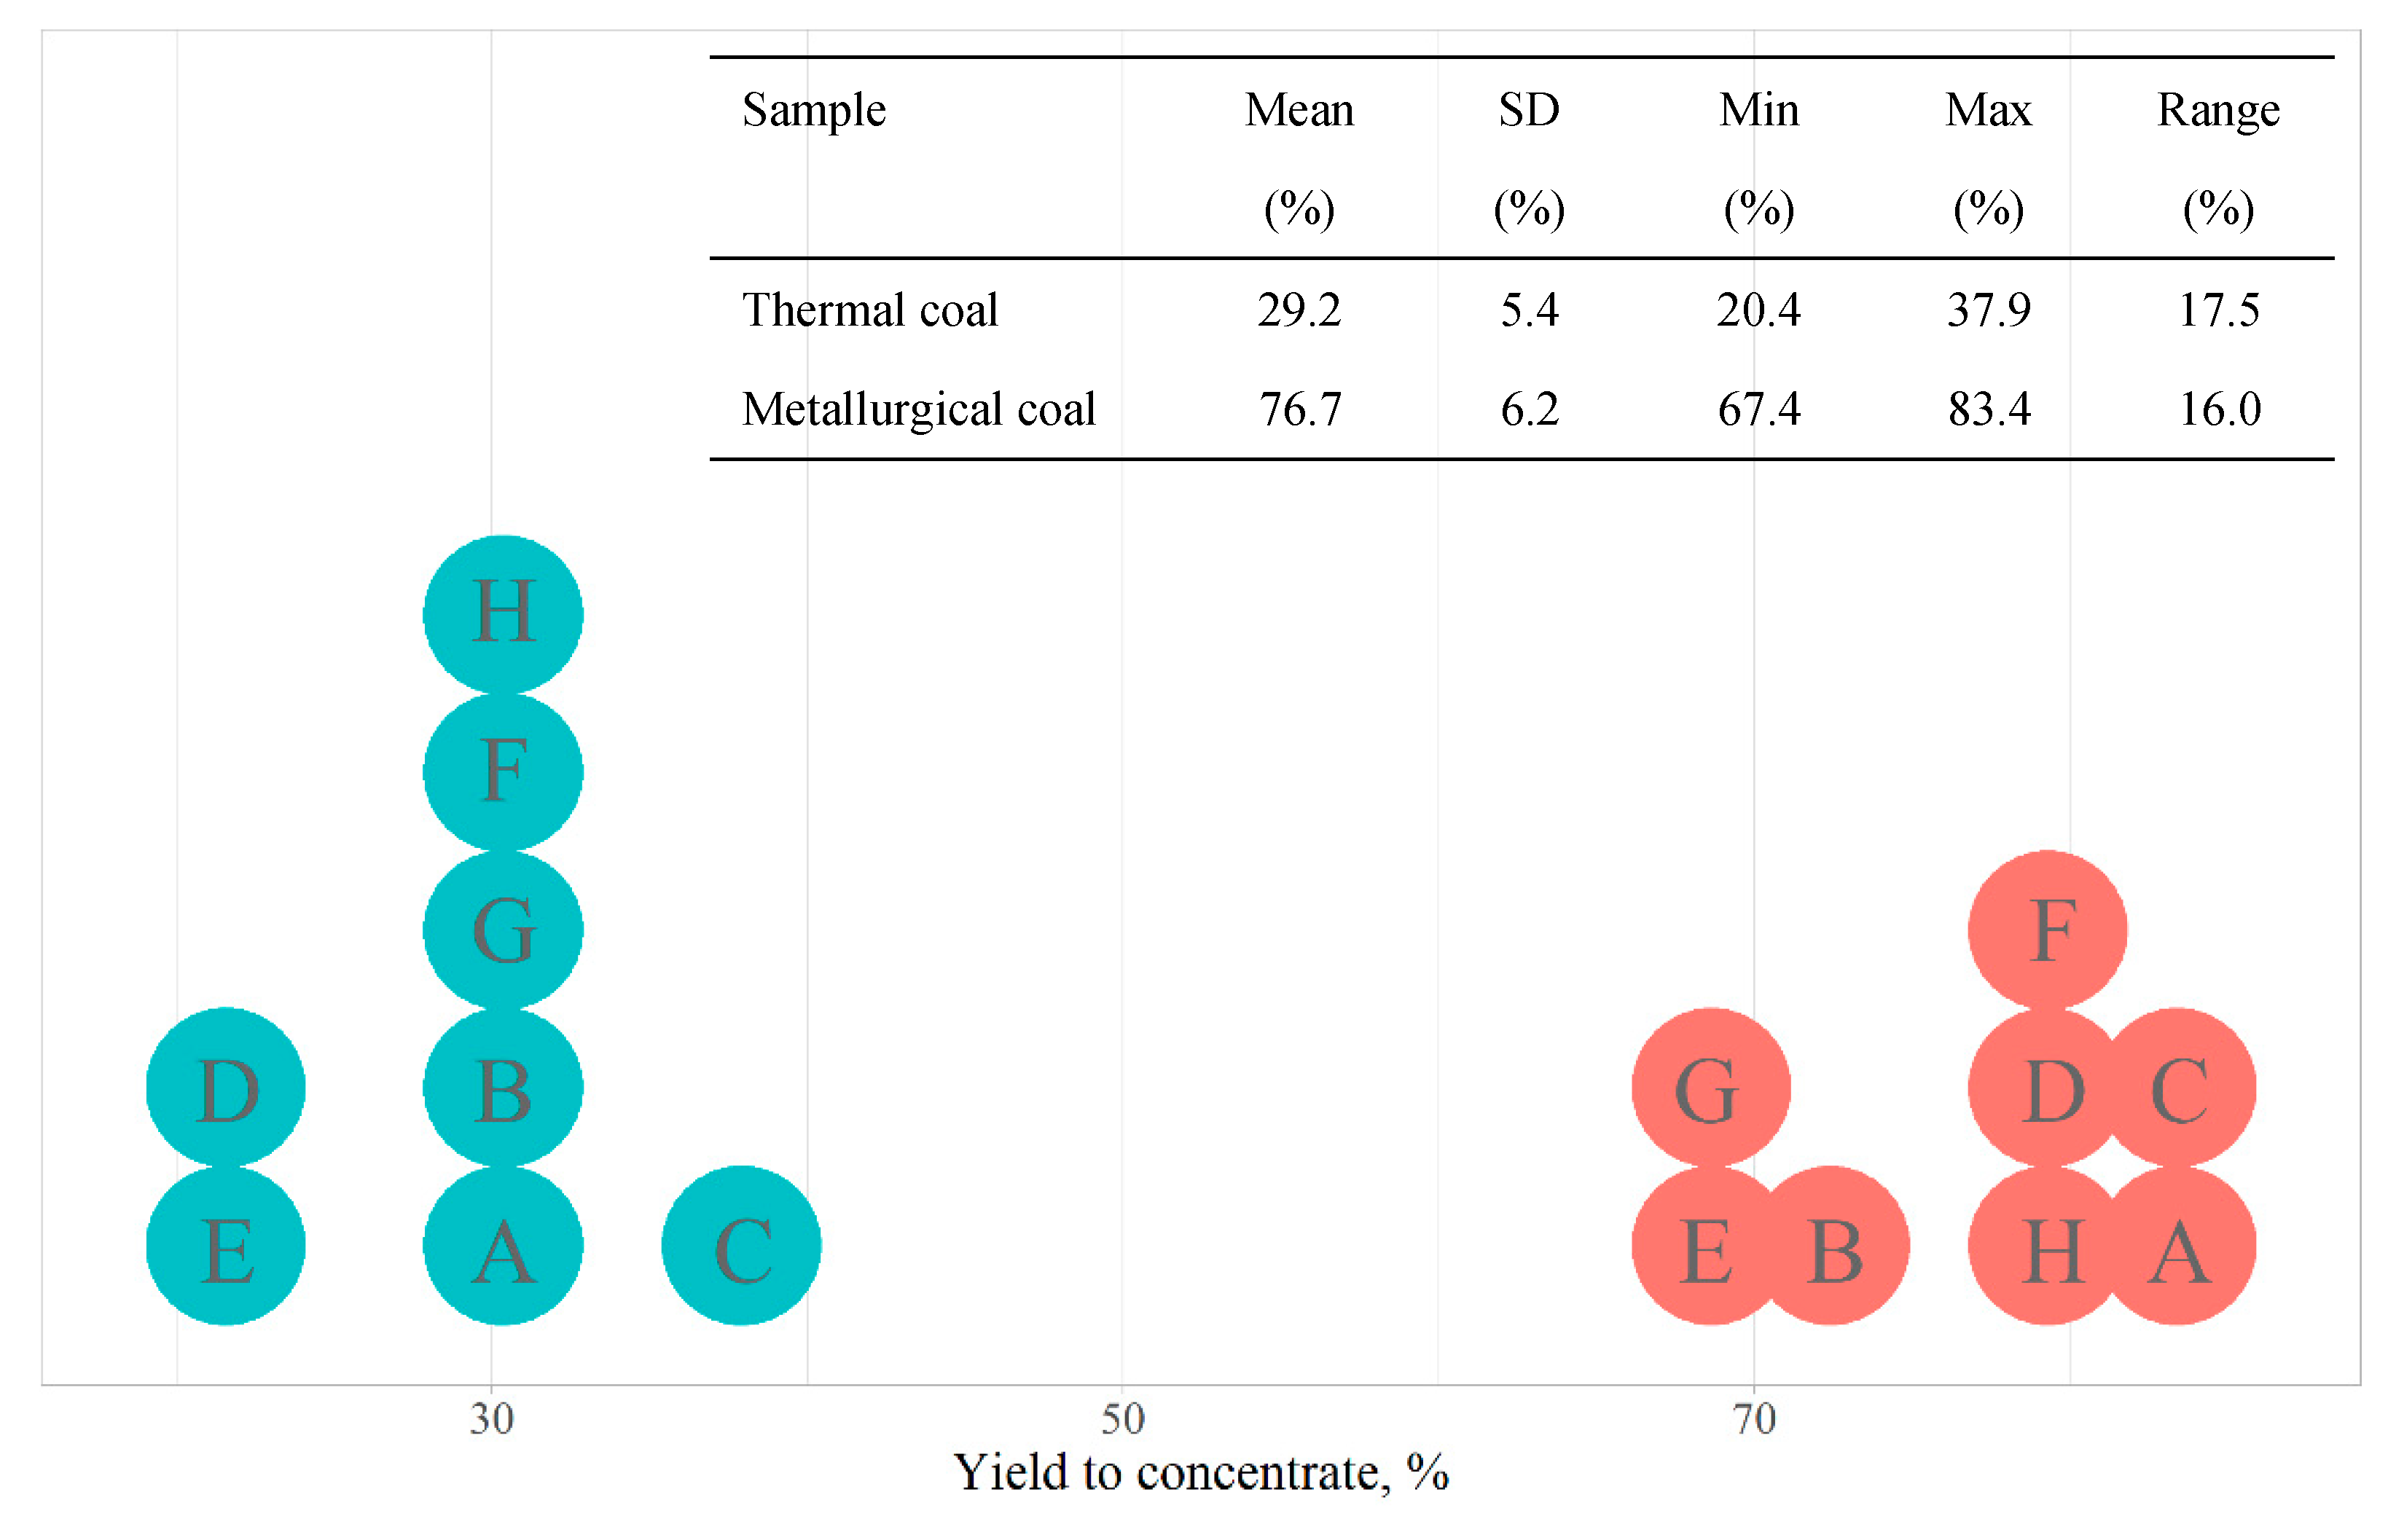
Figure 1. Dotplot showing the yield to the concentrate obtained from the different laboratories. The blue dots are data for the thermal coal and the salmon dots are data for the metallurgical coal. The data were agglomerated in bins of 5%.
Minerals 11 00550 g001
Figure 2. Histogram of the mean yields for the (left) thermal and (right) metallurgical coal samples. The means were obtained by re-sampling the measurements 10,000 times. The black curves are the associated normal distributions and the dashed lines are the 95% confidence limits.
Minerals 11 00550 g002
Figure 3. Dotplot showing the ash percentage in the concentrate obtained from the different laboratories. The blue dots are data for the thermal coal and the salmon dots are data for the metallurgical coal. The data were agglomerated in bins of 0.5%.
Minerals 11 00550 g003
Figure 4. Relationship between the yield to the concentrate and the ash produced upon the combustion of the concentrate. The blue markers are data for the thermal coal and the salmon markers are data for the metallurgical coal. The solid lines represent regression lines and the shaded areas are the 95% confidence interval on the yield at any given ash percentage.
Minerals 11 00550 g004
Figure 5. Results from a sequential flotation procedure showing the relationship between the yield to the cumulative mass and the ash produced upon combustion of coal concentrates and tailings for the 8 laboratories. The triangles are for the thermal coal and the circles are for the metallurgical coal. Each colour pair represents one laboratory (A = grey, B = salmon, C = green, D = olive, E = iris blue, F = sky blue, G = purple, H = pink) and the black line is the mean.
Minerals 11 00550 g005
Figure 6. Dotplot showing the standardised distance from the mean yield–ash curve obtained from the different laboratories with (a) the standard deviation of the data with respect to the global average and (b) a standard deviation of 200 ash % 2 + yield % 2 . The blue dots are data for the thermal coal and the salmon dots are data for the metallurgical coal. The data were agglomerated in bins of size 0.5.
Minerals 11 00550 g006aMinerals 11 00550 g006b
Figure 7. Dendrogram visualising the dissimilarity (and conversely similarity) between the different yield–ash curves. The DTW distance was used as a dissimilarity measure with an average linkage. The height of the tree is the average dissimilarity distance in ash % 2 + yield % 2 . The first letter is (M) for metallurgical coal and (T) for thermal coal. The second letter is the letter associated with each laboratory.
Minerals 11 00550 g007
Table 1. Moisture and ash in the feed calculated from the information provided by the laboratories. The means are presented with the standard deviations in brackets.
SampleMoisture, %Ash, %
Thermal1.4 (1.2)62.8 (1.4)
Metallurgical1.0 (0.7)20.7 (0.5)
Table 2. Sieve analysis and size-by-size ash analysis for the thermal and metallurgical coal samples.
Sieve Size, μmThermal CoalMetallurgical Coal
Mass Percentage Retained, %Ash, %Mass Percentage Retained, %Ash, %
2507.3 (2.3)47.1 (3.9)10.3 (3.3)18.4 (1.0)
12525.5 (3.1)57.8 (0.9)24.5 (3.8)18.0 (0.6)
6324.7 (4.4)62.4 (1.3)29.4 (8.9)20.0 (1.1)
pan42.6 (9.5)69.4 (4.9)35.7 (15.6)24.0 (1.4)
Table 3. Elements of the basic flotation test (section 11 of the AS) present in the different reports. A black tick means that the information is clearly presented. The absence of a tick indicates that the information is not present.
CriterionLaboratory
ABCDEFGH
Date the test was conducted
Sample ID
Sample history
Reference to the standard
Sample size analysis  3
Sample ash analysis (by size fraction)  1
Mass of coal (feed, concentrate, tailings)  2 1 2 1
Ash percentage (feed, concentrate, tailings) 11 1 2 1 2 1
Mass distribution (feed, concentrate, tailings) 11 1 2 1 1
Other properties Moisture
Collector
Moisture Collector Flotation cell
Format.xls.pdf, .xls.pdf.pdf.pdf, .xls.pdf.doc.pdf
1 The weight basis is unspecified or not dry or non-standardised drying method; 2 one stream is missing. In some cases, the feed is missing which may be calculated from the concentrate and the tailings; 3 dry sieving.
Table 4. Elements of the sequential flotation procedure (section 10 of the AS) present in the different reports. A black tick means that the information is clearly presented. The absence of a tick indicates that the information is not present.
CriterionLaboratory
ABCDEFGH
Date the test was conducted
Sample ID
Sample history
Reference to the standard
Sample size analysis  1  1 1
Mass of coal (feed, concentrate, tailings)  2
Mass distribution (feed, concentrate, tailings)  2
Ash percentage (feed, concentrate, tailings)  2
Yield–ash relationship in a tabular form * 2
Yield–ash relationship in a graphical form  2
Other properties Moisture
Collector
Moisture Collector Flotation cell
Format.xls.pdf, .xls.pdf.pdf.pdf, .xls.pdf.doc.pdf
* Taken as the tabulation of the cumulative yield and the cumulative ash sorted in order to incremental ash; 1 taken as given from the basic test; 2 one stream is missing. In some cases, the feed is missing which may be calculated from the concentrate and the tailings.
Table 5. Pairwise DTW distance (in ash % 2 + yield % 2 ) between the yield–ash curves for the thermal coal.
LabABCDEFGHMean
A076.0405.0117.984.247.5192.385.0144.0
B76.00279.462.037.733.361.149.585.5
C405.0279.40133.2264.3297.6198.1194.2253.1
D117.962.0133.2042.969.462.436.975.0
E84.237.3264.342.9056.045.243.181.9
F47.533.3297.669.456.00111.754.495.7
G192.361.1198.162.445.2111.7050.6103.1
H85.049.5194.236.943.154.450.6073.4
Mean144.085.5253.175.081.995.7103.173.4114.0
The marginal means and overall mean are taken only for pairs (i, j) where i ≠ j.
Table 6. Pairwise DTW distance (in ash % 2 + yield % 2 ) between the yield–ash curves for the metallurgical coal.
LabABCDEFGHMean
A034.079.232.7103.867.376.773.666.8
B34.00106.636.9108.396.179.3105.881.0
C79.2106.6080.888.7134.073.031.784.9
D32.736.980.8080.074.396.174.467.9
E103.8108.388.780.00160.0100.299.4105.8
F67.396.1134.074.3160.00223.5124.7125.7
G76.779.373.096.1100.2223.5073.3103.1
H73.6105.831.774.499.4124.773.3083.3
Mean66.881.084.967.9105.8125.7103.183.389.8
The marginal means and overall mean are taken only for pairs (i, j) where i ≠ j.
Table 7. DTW distance (in ash % 2 + yield % 2 ) from the global average sequence of yield–ash curves for the thermal and metallurgical coal samples obtained by different laboratories. The table includes the mean error and the standard deviation of the error.
CoalABCDEFGHMean ErrorError SD
Thermal54.730.1200.641.442.536.776.021.262.958.1
Metallurgical33.844.971.321.686.266.084.661.458.723.4
Publisher’s Note: MDPI stays neutral with regard to jurisdictional claims in published maps and institutional affiliations.