
Development of Mine Soils in a Chronosequence of Forestry-Reclaimed Sites in Eastern Kentucky

 ,
, 
 ,
,
Abstract
1. Introduction
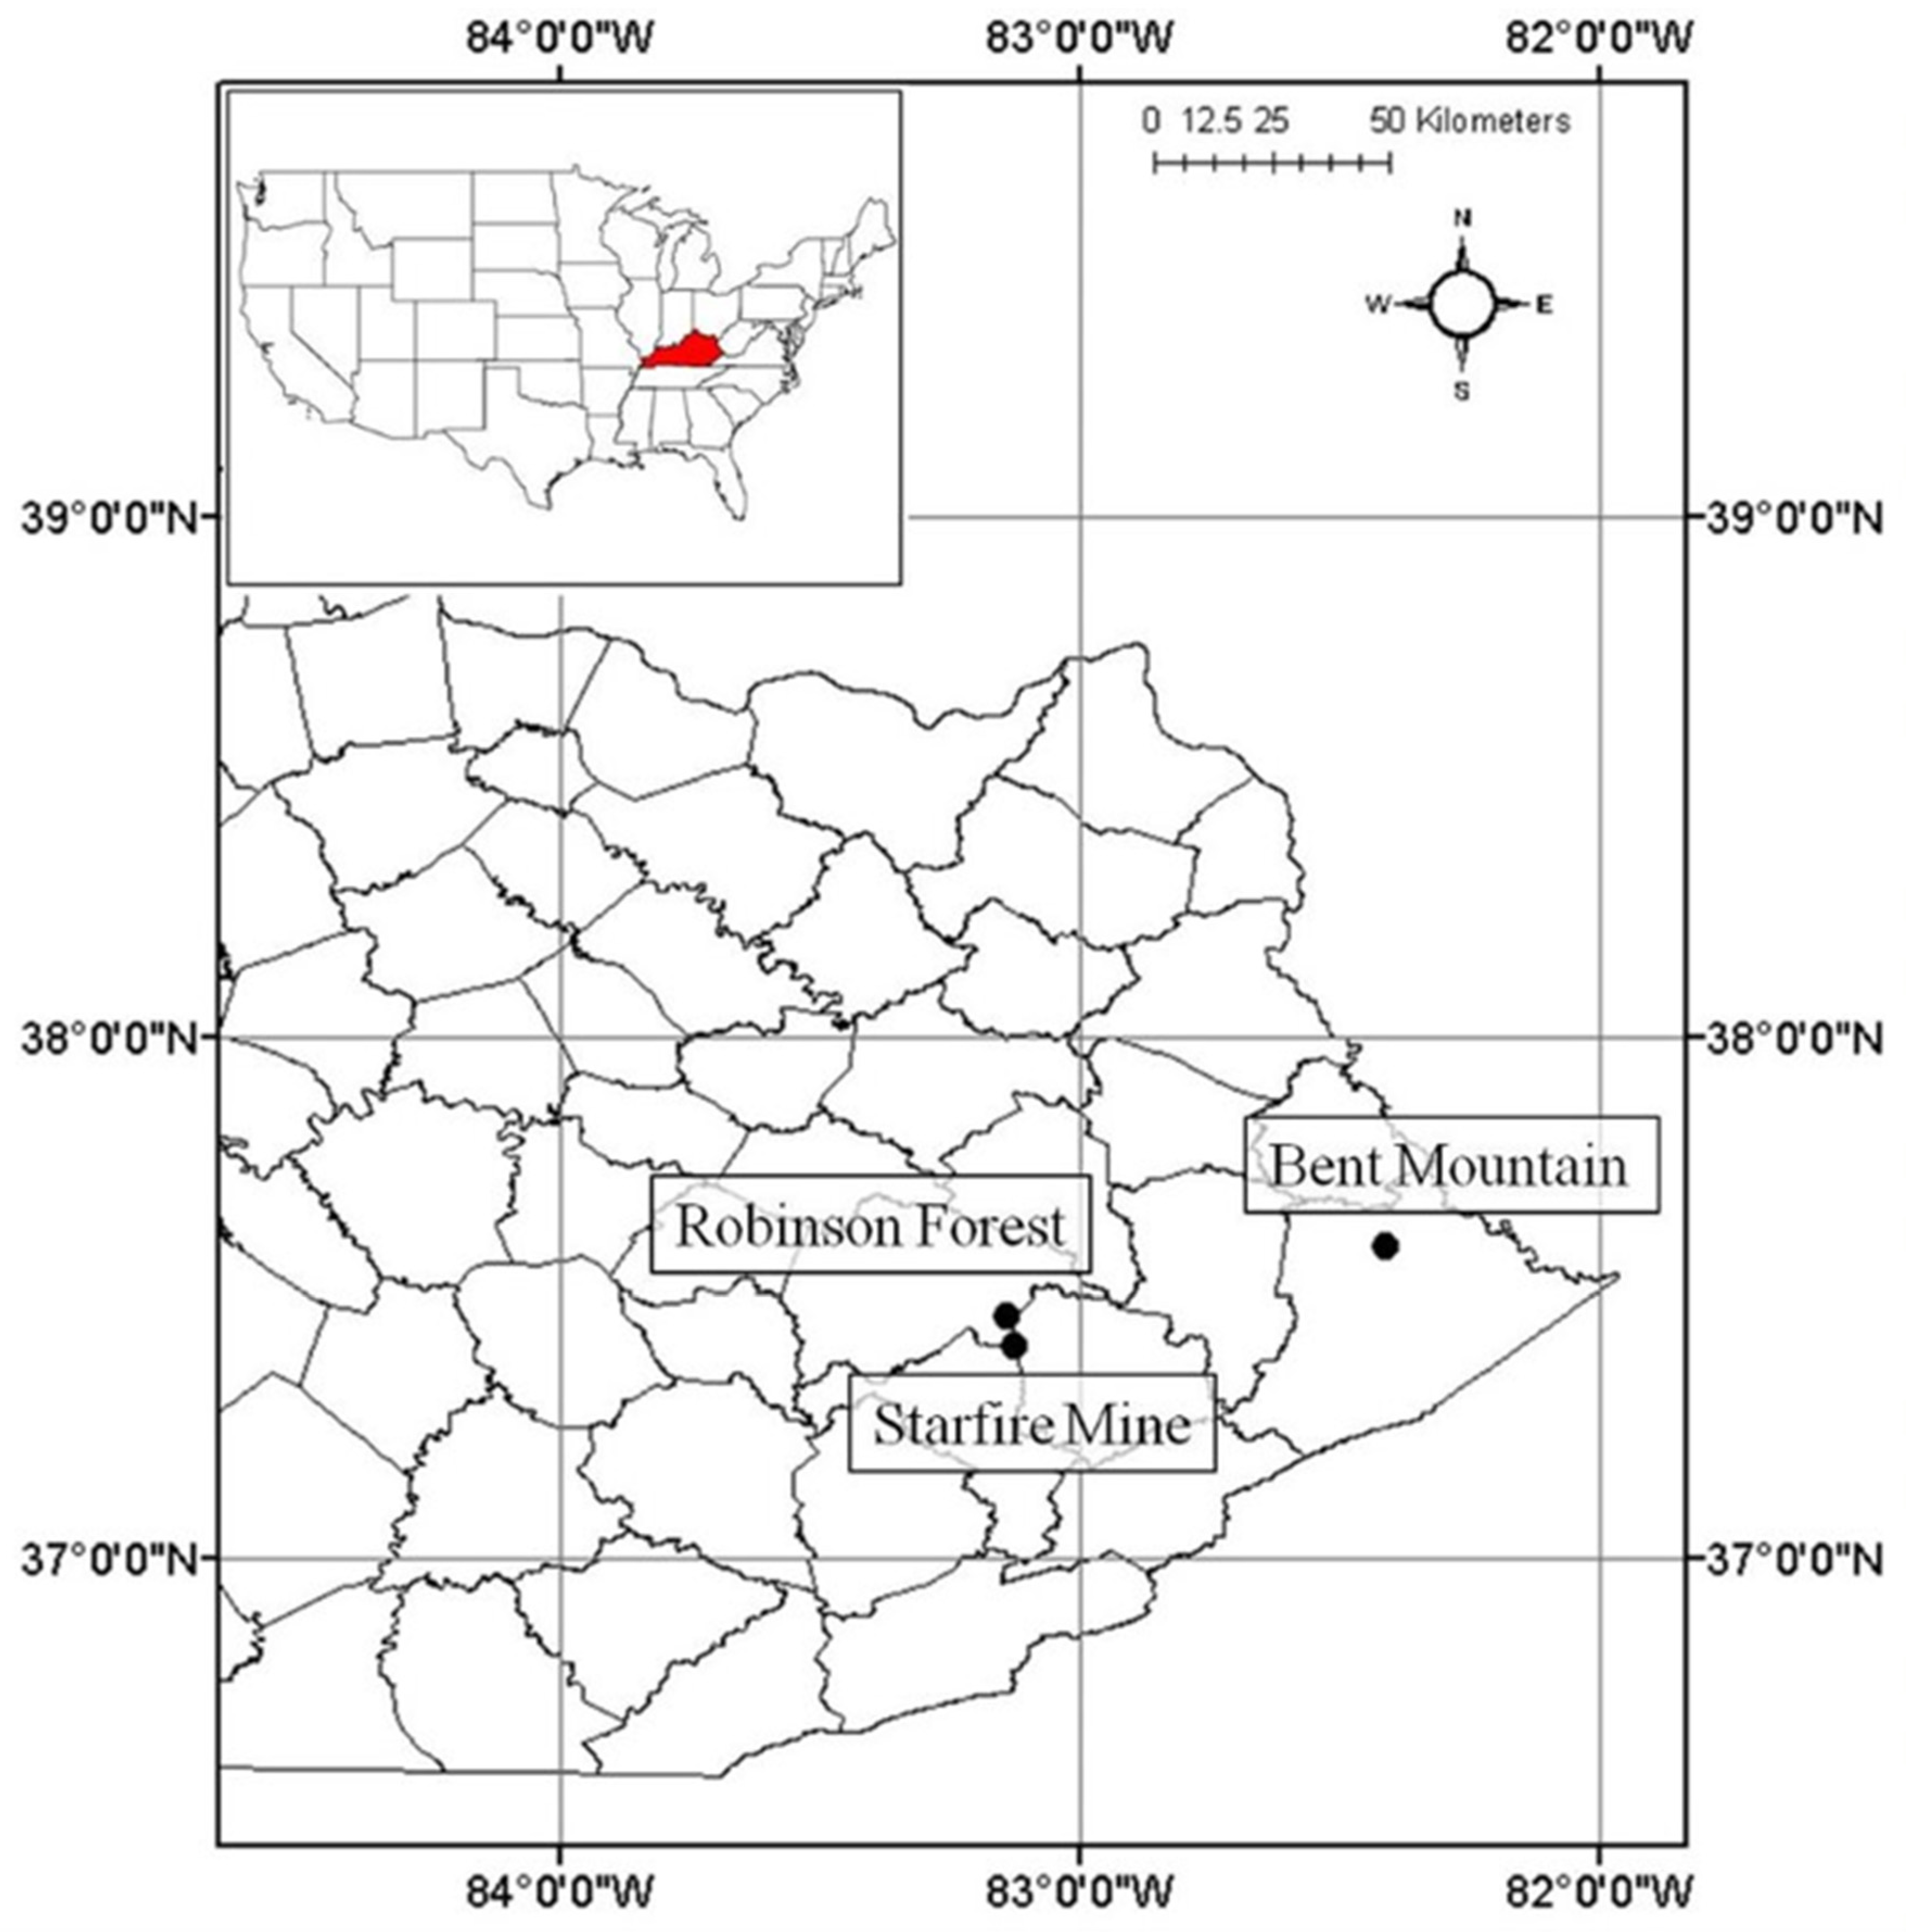
2. Materials and Methods
3. Results
3.1. Particle Size Distribution
3.2. Metals
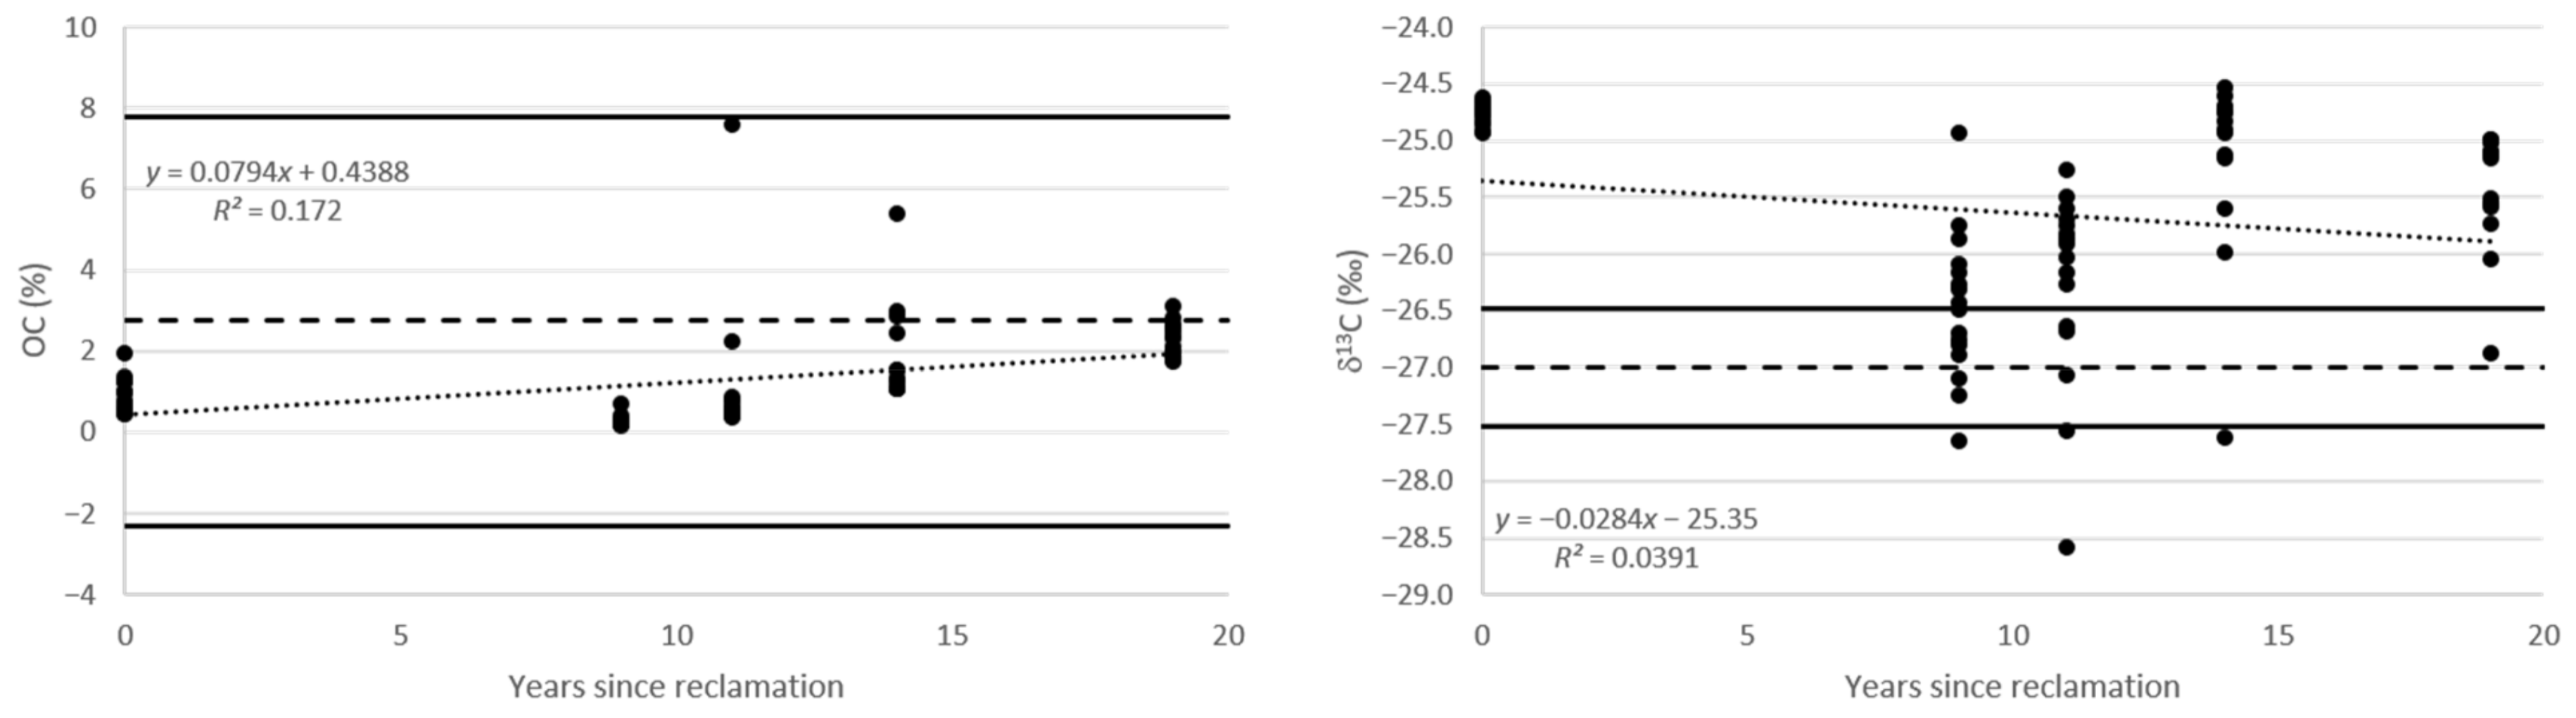
3.3. Carbon
3.4. Depth Analysis
4. Discussion
4.1. Particle Size Distribution
4.2. Metals
4.3. Carbon
4.4. Concentration Changes by Time and Depth
5. Conclusions
Supplementary Materials
Author Contributions
Funding
Institutional Review Board Statement
Informed Consent Statement
Data Availability Statement
Acknowledgments
Conflicts of Interest
References
- Wickham, J.; Wood, P.B.; Nicholson, M.C.; Jenkins, W.; Druckenbrod, D.; Suter, G.W.; Strager, M.P.; Mazzarella, C.; Galloway, W.; Amos, J. The Overlooked Terrestrial Impacts of Mountaintop Mining. BioScience 2013, 63, 335–348. [Google Scholar] [CrossRef]
- Ross, M.R.V.; McGlynn, B.L.; Bernhardt, E.S. Deep Impact: Effects of Mountaintop Mining on Surface Topography, Bedrock Structure, and Downstream Waters. Environ. Sci. Technol. 2016, 50, 2064–2074. [Google Scholar] [CrossRef] [PubMed]
- Pericak, A.A.; Thomas, C.J.; Kroodsma, D.A.; Wasson, M.F.; Ross, M.R.V.; Clinton, N.E.; Campagna, D.J.; Franklin, Y.; Bernhardt, E.S.; Amos, J.F. Mapping the yearly extent of surface coal mining in Central Appalachia using Landsat and Google Earth Engine. PLoS ONE 2018, 13, e0197758. [Google Scholar] [CrossRef] [PubMed]
- Petty, J.T.; Fulton, J.B.; Strager, M.P.; Merovich, G.T., Jr.; Stiles, J.M.; Ziemkiewicz, P.F. Landscape indicators and thresholds of stream ecological impairment in an intensively mined Appalachian watershed. J. of the North Am. Benthol. Soc. 2010, 29, 1292–1309. [Google Scholar] [CrossRef]
- Bernhardt, E.S.; Lutz, B.D.; King, R.S.; Fay, J.P.; Carter, C.E.; Helton, A.M.; Campagna, D.; Amos, J. How Many Mountains Can We Mine? Assessing the Regional Degradation of Central Appalachian Rivers by Surface Coal Mining. Environ. Sci. Technol. 2012, 46, 8115–8122. [Google Scholar] [CrossRef]
- Maigret, T.A.; Cox, J.J.; Yang, J. Persistent geophysical effects of mining threaten ridgetop biota of Appalachian forests. Front. Ecol. Environ. 2019, 17, 85–91. [Google Scholar] [CrossRef]
- Angel, P.; Davis, V.; Burger, J.; Graves, D.; Zipper, C. Chapter 1: The Appalachian regional reforestation initiative. In The Forestry Reclamation Approach: Guide to Successful Reforestation of Mined Lands. Gen. Tech. Rep. NRS-169; Adams, M.-B., Ed.; U.S. Department of Agriculture, Forest Service, Northern Research Station: Newtown Square, PA, USA, 2017; pp. 1-1–1-4. [Google Scholar]
- Reed, M.; Kite, S. Peripheral gully and landslide erosion on an extreme anthropogenic landscape produced by mountaintop removal coal mining. Earth Surf. Process. Landf. 2020, 45, 2078–2090. [Google Scholar] [CrossRef]
- Zipper, C.E.; Burger, J.A.; McGrath, J.M.; Rodrigue, J.A.; Holtzman, G.I. Forest Restoration Potentials of Coal-Mined Lands in the Eastern United States. J. Environ. Qual. 2011, 40, 1567–1577. [Google Scholar] [CrossRef]
- Skousen, J.; Zipper, C.; Burger, J.; Barton, C.; Angel, P. Chapter 3: Selecting materials for mine soil construction when establishing forests on Appalachian mined lands. In The Forestry Reclamation Approach: Guide to Successful Reforestation of Mined Lands. Gen. Tech. Rep. NRS-169; Adams, M.-B., Ed.; U.S. Department of Agriculture, Forest Service, Northern Research Station: Newtown Square, PA, USA, 2017; pp. 3-1–3-10. [Google Scholar]
- Feng, Y.; Wang, J.; Bai, Z.; Reading, L. Effects of surface coal mining and land reclamation on soil properties: A review. Earth-Science Rev. 2019, 191, 12–25. [Google Scholar] [CrossRef]
- Dement, W.T.; Hackworth, Z.J.; Lhotka, J.M.; Barton, C.D. Plantation development and colonization of woody species in response to post-mining spoil preparation methods. New For. 2020, 51, 965–984. [Google Scholar] [CrossRef]
- Adams, M.-B. (Ed.) The Forestry Reclamation Approach: Guide to Successful Reforestation of Mined Lands. Gen. Tech. Rep. NRS-169; U.S. Department of Agriculture, Forest Service, Northern Research Station: Newtown Square, PA, USA, 2017; 128p.
- Miller, J.; Barton, C.; Agouridis, C.; Fogel, A.; Dowdy, T.; Angel, P. Evaluating Soil Genesis and Reforestation Success on a Surface Coal Mine in Appalachia. Soil Sci. Soc. Am. J. 2012, 76, 950–960. [Google Scholar] [CrossRef]
- Sena, K.; Agouridis, C.; Miller, J.; Barton, C. Spoil Type Influences Soil Genesis and Forest Development on an Appalachian Surface Coal Mine Ten Years after Placement. Forests 2018, 9, 780. [Google Scholar] [CrossRef]
- Sena, K.; Barton, C.; Hall, S.; Angel, P.; Agouridis, C.; Warner, R. Influence of spoil type on afforestation success and natural vegetative recolonization on a surface coal mine in Appalachia, United States. Restor. Ecol. 2015, 23, 131–138. [Google Scholar] [CrossRef]
- Wilson-Kokes, L.; Delong, C.; Thomas, C.; Emerson, P.; O’Dell, K.; Skousen, J. Hardwood Tree Growth on Amended Mine Soils in West Virginia. J. Environ. Qual. 2013, 42, 1363–1371. [Google Scholar] [CrossRef]
- Wilson-Kokes, L.; Emerson, P.; Delong, C.; Thomas, C.; Skousen, J. Hardwood Tree Growth after Eight Years on Brown and Gray Mine Soils in West Virginia. J. Environ. Qual. 2013, 42, 1353–1362. [Google Scholar] [CrossRef]
- Agouridis, C.T.; Angel, P.N.; Taylor, T.J.; Barton, C.D.; Warner, R.C.; Yu, X.; Wood, C. Water Quality Characteristics of Discharge from Reforested Loose-Dumped Mine Spoil in Eastern Kentucky. J. Environ. Qual. 2012, 41, 454–468. [Google Scholar] [CrossRef]
- Orndorff, Z.W.; Daniels, W.L.; Zipper, C.E.; Eick, M.; Beck, M. A column evaluation of Appalachian coal mine spoils’ temporal leaching behavior. Environ. Pollut. 2015, 204, 39–47. [Google Scholar] [CrossRef]
- Daniels, W.; Zipper, C.; Orndorff, Z.; Skousen, J.; Barton, C.; McDonald, L.; Beck, M. Predicting total dissolved solids release from central Appalachian coal mine spoils. Environ. Pollut. 2016, 216, 371–379. [Google Scholar] [CrossRef]
- Haering, K.C.; Daniels, W.L.; Galbraith, J.M. Appalachian mine soil morphology and properties: Effects of weathering and mining method. Soil Sci. Soc. Am. J. 2004, 68, 1315–1325. [Google Scholar] [CrossRef]
- Nash, W.L.; Daniels, W.L.; Haering, K.C.; Burger, J.A.; Zipper, C.E. Long-term Effects of Rock Type on Appalachian Coal Mine Soil Properties. J. Environ. Qual. 2016, 45, 1597–1606. [Google Scholar] [CrossRef] [PubMed]
- Amichev, B.Y.; Burger, J.A.; Rodrigue, J.A. Carbon sequestration by forests and soils on mined land in the Midwestern and Appalachian coalfields of the U.S. For. Ecol. Manag. 2008, 256, 1949–1959. [Google Scholar] [CrossRef]
- Avera, B.N.; Strahm, B.D.; Burger, J.A.; Zipper, C.E. Development of ecosystem structure and function on reforested surface-mined lands in the Central Appalachian Coal Basin of the United States. New For. 2015, 46, 683–702. [Google Scholar] [CrossRef]
- Maharaj, S.; Barton, C.D.; Karathanasis, T.A.; Rowe, H.D.; Rimmer, S.M. Distinguishing “new” from “old” organic carbon in reclaimed coal mine sites using thermogravimetry: II. Field validation. Soil Sci. 2007, 172, 302–312. [Google Scholar] [CrossRef]
- Littlefield, T.; Barton, C.; Arthur, M.; Coyne, M. Factors controlling carbon distribution on reforested minelands and regenerating clearcuts in Appalachia, USA. Sci. Total. Environ. 2013, 465, 240–247. [Google Scholar] [CrossRef] [PubMed]
- Sweigard, R.; Burger, J.; Zipper, C.; Skousen, J.; Barton, C.; Angel, P. Chapter 4: Low compaction grading to enhance reforestation success on coal surface mines. In The Forestry Reclamation Approach: Guide to Successful Reforestation of Mined Lands. Gen. Tech. Rep. NRS-169; Adams, M.-B., Ed.; U.S. Department of Agriculture, Forest Service, Northern Research Station: Newtown Square, PA, USA, 2017; pp. 4-1–4-8. [Google Scholar]
- Wentworth, C.K. A Scale of Grade and Class Terms for Clastic Sediments. J. Geol. 1922, 30, 377–392. [Google Scholar] [CrossRef]
- Hillier, S. Particulate composition and origin of suspended sediment in the R. Don, Aberdeenshire, UK. Sci. Total. Environ. 2001, 265, 281–293. [Google Scholar] [CrossRef]
- Yeager, K.M.; Santschi, P.H.; Phillips, J.D.; Herbert, B.E. Suspended sediment sources and tributary effects in the lower reaches of a coastal plain stream as indicated by radionuclides, Loco Bayou, Texas. Environ. Earth Sci. 2005, 47, 382–395. [Google Scholar] [CrossRef]
- Sena, K.L.; Yeager, K.M.; Dreaden, T.J.; Barton, C.D. Phytophthora cinnamomi Colonized Reclaimed Surface Mined Sites in Eastern Kentucky: Implications for the Restoration of Susceptible Species. Forests 2018, 9, 203. [Google Scholar] [CrossRef]
- Gupta, S.C.; Larson, W.E. Estimating soil water retention characteristics from particle size distribution, organic matter percent, and bulk density. Water Resour. Res. 1979, 15, 1633–1635. [Google Scholar] [CrossRef]
- Dempster, D.N.; Jones, D.L.; Murphy, D.V. Clay and biochar amendments decreased inorganic but not dissolved organic nitrogen leaching in soil. Soil Res. 2012, 50, 216–221. [Google Scholar] [CrossRef]
- Sena, K.; Barton, C.D.; Angel, P.N.; Agouridis, C.T.; Warner, R.C. Influence of Spoil Type on Chemistry and Hydrology of Interflow on a Surface Coal Mine in the Eastern US Coalfield. Water Air Soil Pollut. 2014, 225, 1–14. [Google Scholar] [CrossRef]
- Jastrow, J. Soil aggregate formation and the accrual of particulate and mineral-associated organic matter. Soil Biol. Biochem. 1996, 28, 665–676. [Google Scholar] [CrossRef]
- Bending, G.D.; Turner, M.K.; Jones, J.E. Interactions between crop residue and soil organic matter quality and the functional diversity of soil microbial communities. Soil Biol. Biochem. 2002, 34, 1073–1082. [Google Scholar] [CrossRef]
- Castellano, M.J.; Lewis, D.B.; Kaye, J.P. Response of soil nitrogen retention to the interactive effects of soil texture, hydrology, and organic matter. J. Geophys. Res. Biogeosciences 2013, 118, 280–290. [Google Scholar] [CrossRef]
- Fuss, C.B.; Lovett, G.M.; Goodale, C.L.; Ollinger, S.V.; Lang, A.K.; Ouimette, A.P. Retention of Nitrate-N in Mineral Soil Organic Matter in Different Forest Age Classes. Ecosystems 2019, 22, 1280–1294. [Google Scholar] [CrossRef]
- Hudson, B.D. Soil organic matter and available water capacity. J. soil Water Conserv. 1994, 49, 189–194. [Google Scholar]
- Murphy, B.W. Impact of soil organic matter on soil properties—a review with emphasis on Australian soils. Soil Res. 2015, 53, 605–635. [Google Scholar] [CrossRef]
- Griscom, B.W.; Adams, J.; Ellis, P.W.; Houghton, R.A.; Lomax, G.; Miteva, D.A.; Schlesinger, W.H.; Shoch, D.; Siikamäki, J.V.; Smith, P.; et al. Natural climate solutions. Proc. Natl. Acad. Sci. USA 2017, 114, 11645–11650. [Google Scholar] [CrossRef]
- Barton, C.D.; Karathanasis, A.D. Aerobic and Anaerobic Metal Attenuation Processes in a Constructed Wetland Treating Acid Mine Drainage. Environ. Geosci. 1998, 5, 43–56. [Google Scholar] [CrossRef]
- Barton, C.; Paddock, L.; Romanek, C.; Maharaj, S.; Seaman, J. Metal attenuation processes in a landfill containing coal combustion waste: Implications for remediation. Environ. Geosci. 2005, 12, 45–55. [Google Scholar] [CrossRef]


| Site Age | Al | Mn | Fe | Mg | K | Ca | Na | δ13C | Total N | Organic Carbon | Gravel | Sand | Silt | Clay |
|---|---|---|---|---|---|---|---|---|---|---|---|---|---|---|
| Years | ppm | ppm | ppm | ppm | ppm | ppm | ppm | ‰ | % | % | % | % | % | % |
| 0 | 32,219 ± 14,324 | 244 ± 160 | 18,857 ± 8621 | 2132 ± 1169 | 10,920 ± 4547 | 976 ± 882 | 1819 ± 636 | −24.76 ± 0.09 | 0.03 ± 0.01 | 0.91 ± 0.42 | 65.5 ± 8.3 | 14.1 ± 5.7 | 17.2 ± 5.2 | 3.2 ± 1.6 |
| 9 | 38,241 ± 2368 | 191 ± 19.4 | 10,553 ± 903 | 1536 ± 132 | 14,112 ± 960 | 448 ± 22.4 | 3725 ± 325 | −26.46 ± 0.65 | - | 0.28 ± 0.13 | 32.7 ± 6.0 | 40.5 ± 4.4 | 24.0 ± 4.0 | 2.9 ± 0.6 |
| 11 | 40,671 ± 13,515 | 315 ± 111 | 18,760 ± 6216 | 2446 ± 839 | 13,346 ± 4506 | 825 ± 709 | 3189 ± 1175 | −26.28 ± 0.86 | 0.07 ± 0.10 | 1.10 ± 1.79 | 37.6 ± 12.8 | 23.0 ± 4.8 | 35.0 ± 8.1 | 4.4 ± 1.6 |
| 14 | 61,456 ± 6228 | 288 ± 24.5 | 19,644 ± 1507 | 3792 ± 484 | 17,900 ± 1890 | 988 ± 214 | 1296 ± 88.2 | −25.43 ± 0.51 | 0.10 ± 0.02 | 2.29 ± 0.42 | 42.7 ± 11.4 | 23.3 ± 8.0 | 28.3 ± 6.7 | 5.7 ± 2.6 |
| 19 | 60,983 ± 13,697 | 179 ± 85.1 | 25,133 ± 3446 | 3771 ± 1093 | 20,560 ± 4376 | 815 ± 430 | 2271 ± 362 | −25.19 ± 0.84 | 0.10 ± 0.08 | 1.92 ± 1.25 | 57.4 ± 17.9 | 11.7 ± 3.8 | 23.7 ± 10.4 | 2.8 ± 1.0 |
| 100+ | 44,082 ± 9970 | 1056 ± 355 | 23,288 ± 4994 | 1661 ± 328 | 10,975 ± 2315 | 418 ± 548 | 1028 ± 168 | −27.00 ± 0.52 | 0.12 ± 0.06 | 2.74 ± 5.06 | 29.6 ± 20.8 | 20.9 ± 7.2 | 41.2 ± 12.9 | 8.3 ± 3.5 |
| Soil Characteristic | OC | Gravel | Sand | Silt | Clay | |||||
|---|---|---|---|---|---|---|---|---|---|---|
| r | p | r | p | r | p | r | p | r | p | |
| Al | 0.026 | 0.804 | 0.023 | 0.825 | −0.269 | 0.009 | 0.161 | 0.124 | 0.240 | 0.021 |
| Mn | 0.473 | <0.001 | −0.148 | 0.159 | −0.186 | 0.076 | 0.324 | 0.002 | 0.403 | <0.001 |
| Fe | 0.184 | 0.080 | 0.170 | 0.105 | −0.510 | <0.001 | 0.127 | 0.229 | 0.337 | 0.001 |
| Mg | 0.090 | 0.396 | 0.292 | 0.005 | −0.450 | <0.001 | −0.057 | 0.587 | 0.033 | 0.756 |
| K | −0.054 | 0.609 | 0.051 | 0.627 | −0.100 | 0.342 | −0.004 | 0.971 | 0.063 | 0.552 |
| Ca | 0.515 | <0.001 | 0.516 | <0.001 | −0.408 | <0.001 | −0.393 | <0.001 | −0.268 | 0.010 |
| Na | −0.291 | 0.005 | −0.215 | 0.040 | 0.564 | <0.001 | −0.114 | 0.279 | −0.299 | 0.004 |
| OC | 1.000 | - | 0.342 | <0.001 | −0.347 | 0.001 | −0.199 | 0.058 | −0.133 | 0.205 |
| δ13C | −0.310 | 0.003 | 0.418 | <0.001 | −0.332 | 0.001 | −0.329 | 0.001 | −0.166 | 0.115 |
| Gravel | 0.342 | 0.001 | 1.000 | - | −0.691 | <0.001 | −0.831 | <0.001 | −0.630 | <0.001 |
| Sand | −0.347 | 0.001 | −0.691 | <0.001 | 1.000 | - | 0.181 | 0.085 | −0.006 | 0.953 |
| Silt | −0.199 | 0.058 | −0.831 | <0.001 | 0.181 | 0.085 | 1.000 | - | 0.799 | <0.001 |
| Clay | −0.133 | 0.205 | −0.630 | <0.001 | −0.006 | 0.953 | 0.799 | <0.001 | 1.000 | - |
| Tree Biomass Metrics | White Oak | White Pine | Yellow Poplar |
|---|---|---|---|
| Mean Survival (%) | 77.5 ± 0.5 | 43.1 ± 0.4 | 59.2 ± 0.1 |
| Mean Height (m) | 10.2 ± 0.6 | 13.9 ± 0.2 | 13.7 ± 0.1 |
| Mean DBH (cm) | 8.7 ± 1.7 | 20.2 ± 0.1 | 12.2 ± 0.8 |
| Mean Biomass OC (kg)/tree | 12.26 ± 2.68 | 35.56 ± 4.28 | 20.84 ± 4.88 |
| Mean Biomass OC (Mg)/ha | 25.84 ± 5.56 | 66.14 ± 8.23 | 42.83 ± 17.43 |
| Aboveground OC Sequestration Rate (Mg/ha/yr) | 1.44 | 3.67 | 2.38 |
| Soil Organic Carbon (Mg/ha) * | 17.34 | - | - |
Publisher’s Note: MDPI stays neutral with regard to jurisdictional claims in published maps and institutional affiliations. |
© 2021 by the authors. Licensee MDPI, Basel, Switzerland. This article is an open access article distributed under the terms and conditions of the Creative Commons Attribution (CC BY) license (https://creativecommons.org/licenses/by/4.0/).
Share and Cite
Sena, K.L.; Yeager, K.M.; Barton, C.D.; Lhotka, J.M.; Bond, W.E.; Schindler, K.J. Development of Mine Soils in a Chronosequence of Forestry-Reclaimed Sites in Eastern Kentucky. Minerals 2021, 11, 422. https://doi.org/10.3390/min11040422
Sena KL, Yeager KM, Barton CD, Lhotka JM, Bond WE, Schindler KJ. Development of Mine Soils in a Chronosequence of Forestry-Reclaimed Sites in Eastern Kentucky. Minerals. 2021; 11(4):422. https://doi.org/10.3390/min11040422
Chicago/Turabian StyleSena, Kenton L., Kevin M. Yeager, Christopher D. Barton, John M. Lhotka, William E. Bond, and Kimberly J. Schindler. 2021. "Development of Mine Soils in a Chronosequence of Forestry-Reclaimed Sites in Eastern Kentucky" Minerals 11, no. 4: 422. https://doi.org/10.3390/min11040422
APA StyleSena, K. L., Yeager, K. M., Barton, C. D., Lhotka, J. M., Bond, W. E., & Schindler, K. J. (2021). Development of Mine Soils in a Chronosequence of Forestry-Reclaimed Sites in Eastern Kentucky. Minerals, 11(4), 422. https://doi.org/10.3390/min11040422