
Chemical Analysis of Thermoluminescent Colorless Topaz Crystal Using Laser-Induced Breakdown Spectroscopy

 , ,
, ,  ,
,  ,
,  ,
,  ,
, 
Abstract
1. Introduction
2. Materials and Methods
2.1. Geology of Sampling Area
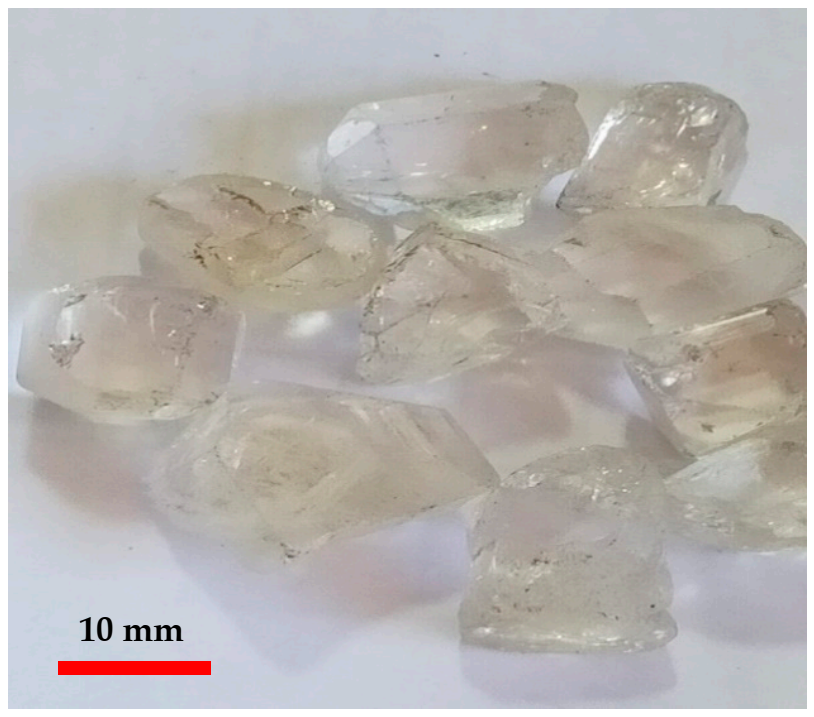
2.2. Sample Characteristics
2.3. Experimental Arrangement
2.4. Theoretical Background
3. Results and Discussion
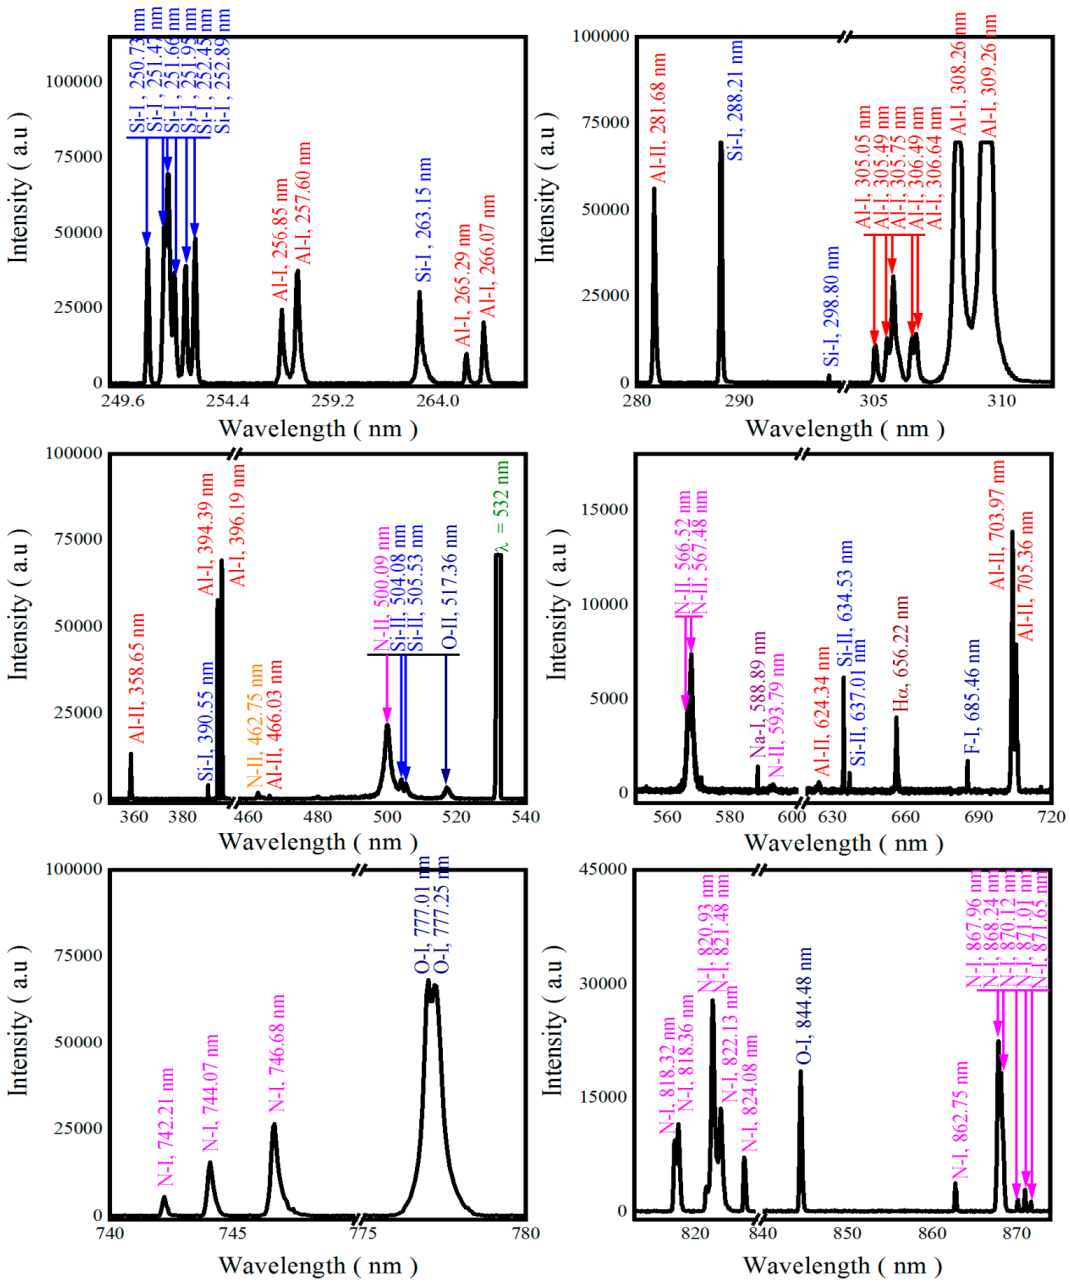
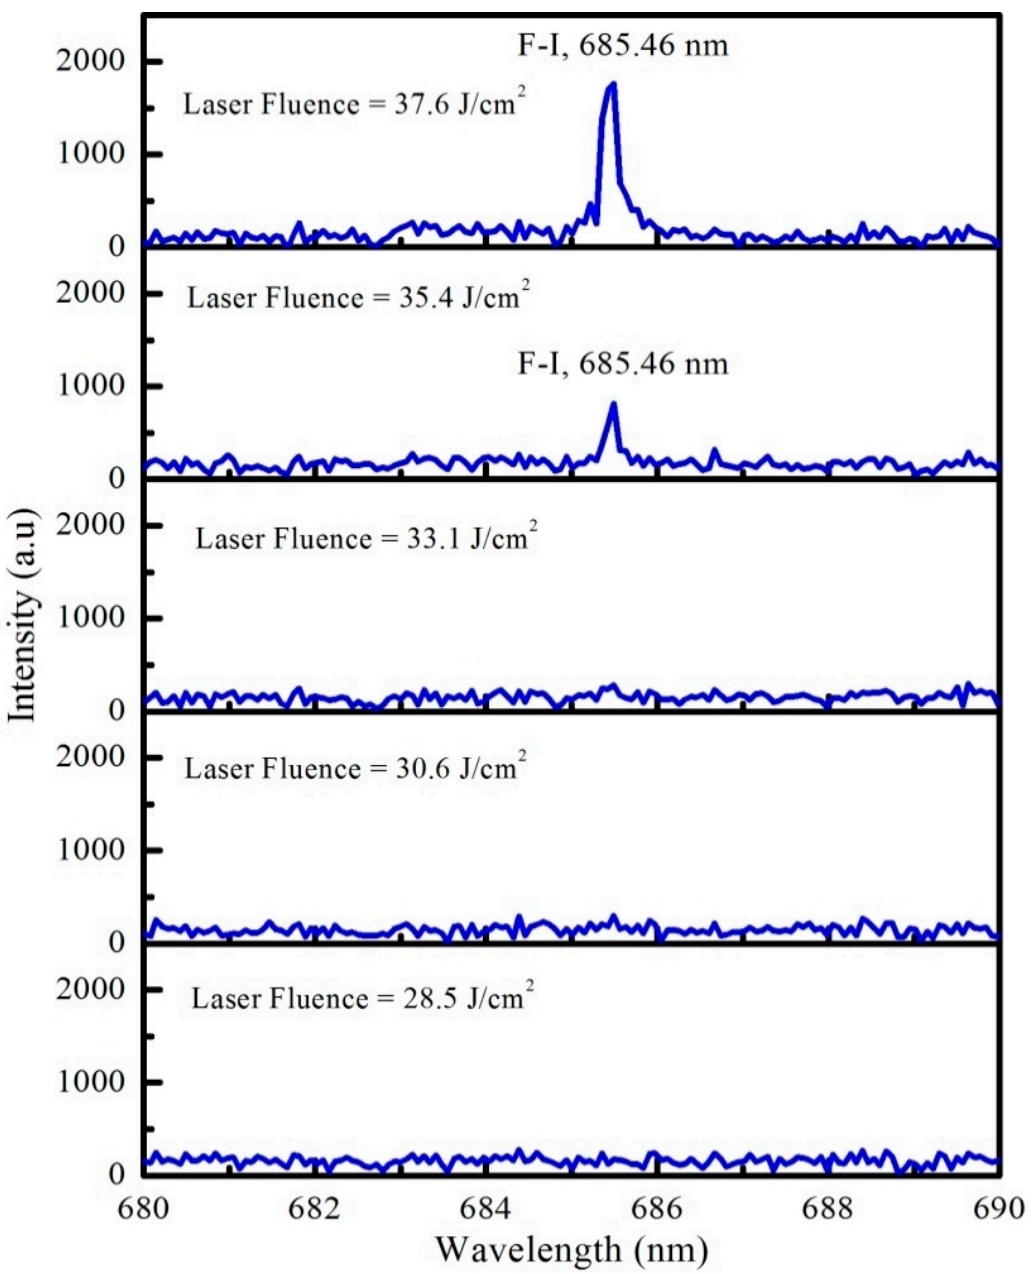
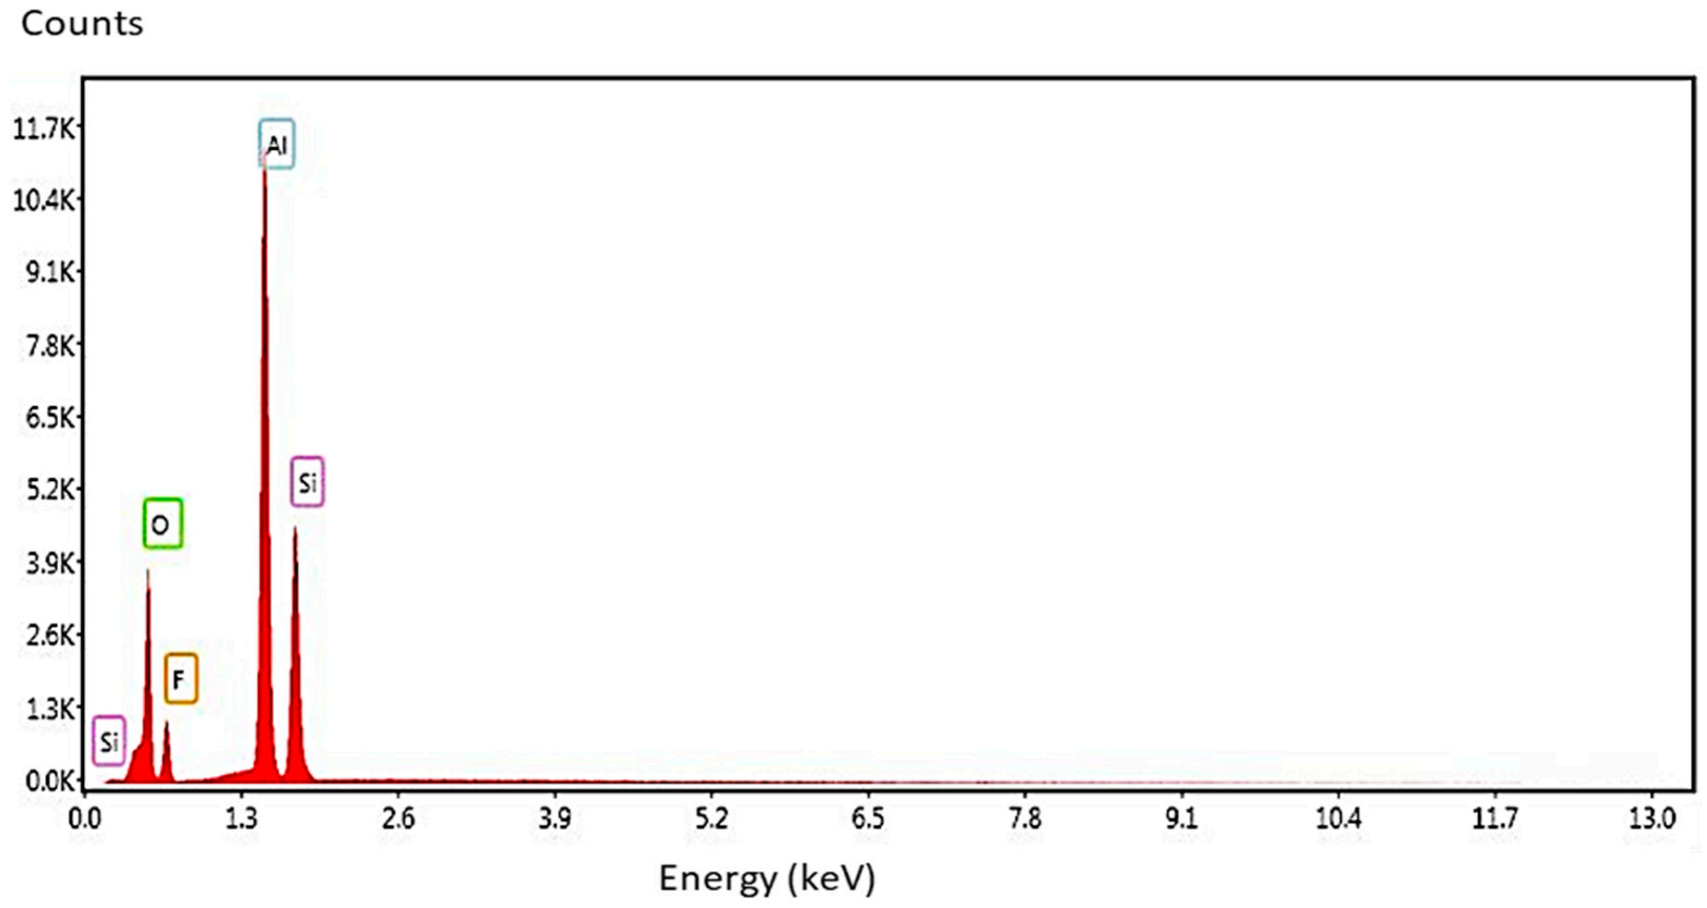
3.1. Qualitative Analysis
3.2. Quantitative Analysis
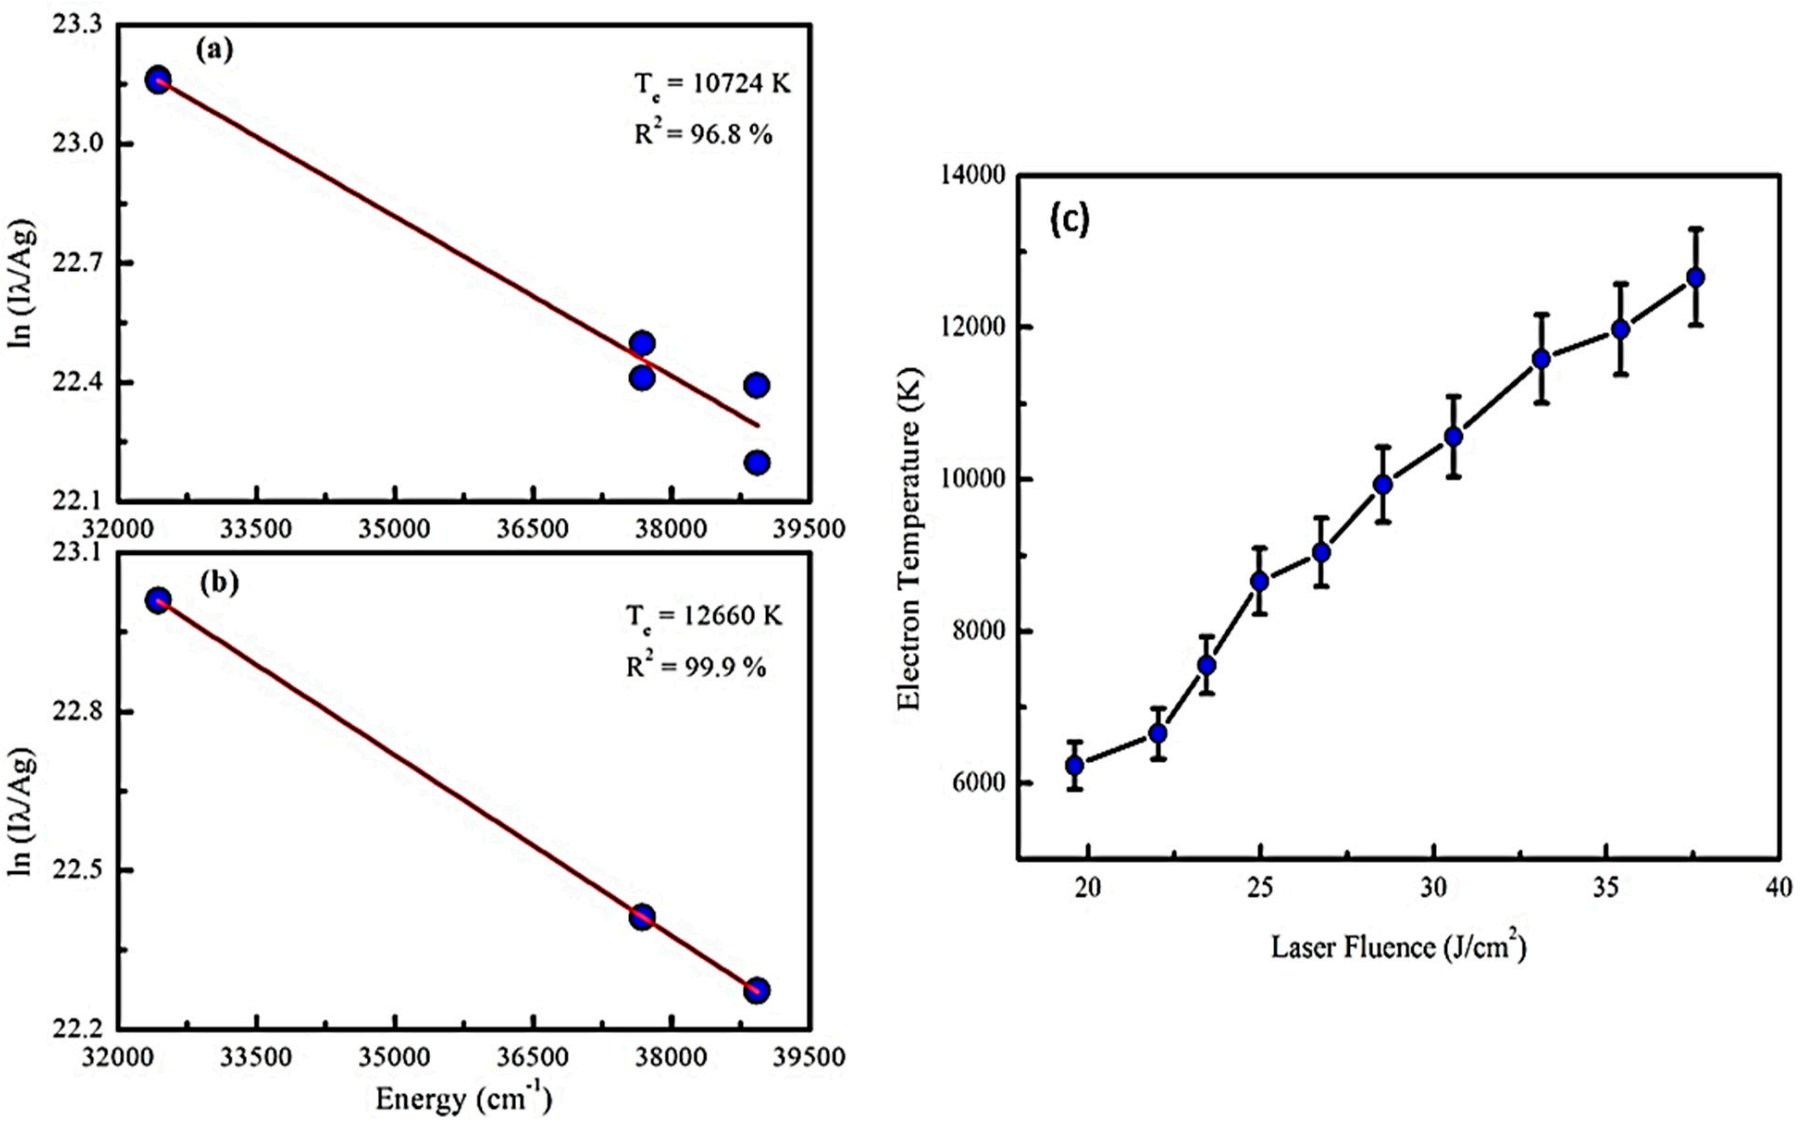
3.2.1. Electron Temperature
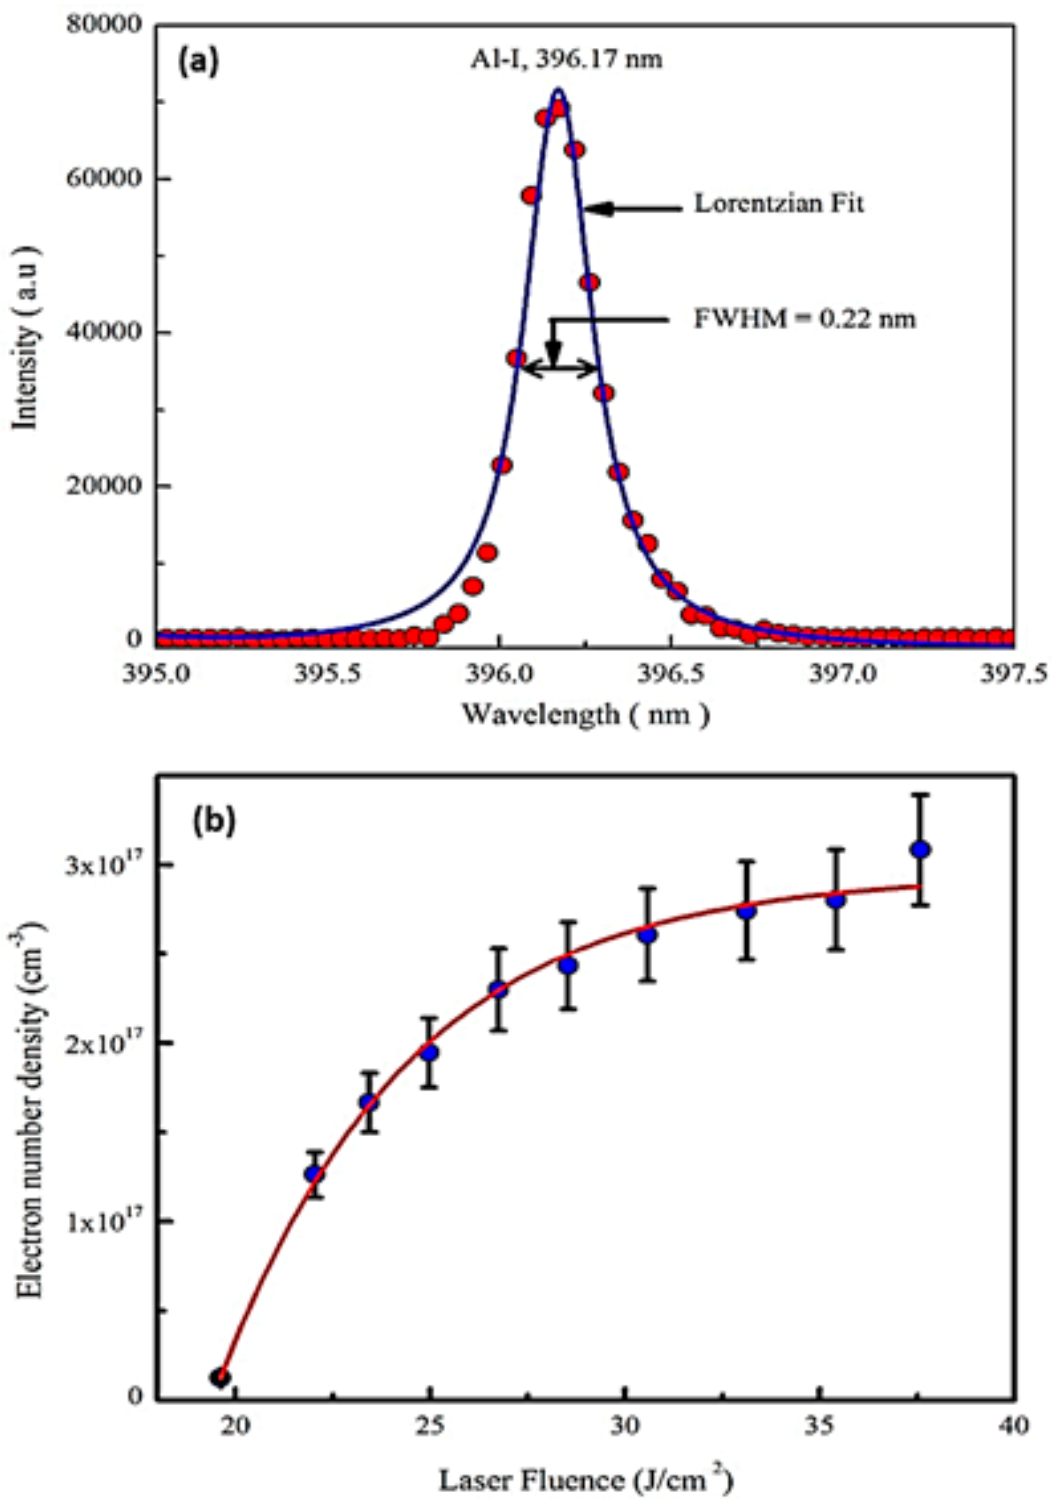
3.2.2. Electron Number Density
3.2.3. Local Thermodynamic Equilibrium (LTE)
3.2.4. Optically Thin Plasma
3.2.5. CF-LIBS Analysis
4. Discussion
5. Conclusions
Author Contributions
Funding
Data Availability Statement
Acknowledgments
Conflicts of Interest
References
- Ulian, G.; Valdrè, G. Effects of fluorine content on the elastic behavior of topaz [Al2SiO4 (F,OH)2]. Am. Min. 2017, 102, 347–356. [Google Scholar] [CrossRef]
- Hatipoglu, M.; Babalik, H.; Chamberlain, S.C. Gemstone deposits in Turkey. Rocks Miner. 2010, 85, 124–133. [Google Scholar] [CrossRef]
- Rout, P.P.; Sahoo, R.K.; Singh, S.K.; Mishra, B.K. Spectroscopic investigation and colour change of natural topaz exposed to PbO and CrO3 vapour. Vib. Spectrosc. 2017, 88, 1–8. [Google Scholar] [CrossRef]
- Salama, S.; Helal, A.I.; Gomaa, M.A.M.; Abou-Salem, L.I.; Nafie, H.; Badawi, E.A. Coloring of Topaz after Irradiation. In Proceedings of the Tenth Radiation Physics & Protection Conference, Cairo, Egypt, 27–30 November 2010. EG1100453. [Google Scholar]
- Souza, D.N.; Lima, J.F.; EG Valerio, M.E.; Caldas, L.V. Performance of pellets and composites of natural colourless topaz as radiation dosemeters. Radiat. Prot. Dosim. 2002, 100, 413–441. [Google Scholar] [CrossRef]
- McKeever, S.W.; Chen, C.Y.; Halliburton, L.E. Point defects and the pre-dose effect in natural quartz. Nucl. Tracks Radiat. Meas. 1985, 10, 489–495. [Google Scholar] [CrossRef]
- Souza, D.N.; Valerio, M.E.; De-Lima, J.F.; Caldas, L.V. Dosimetric properties of natural Brazilian topaz: A thermally stimulated exoeletronic emission and thermoluminescence study. Nucl. Instrum. Methods Phys. Res. 2000, 166, 209–214. [Google Scholar] [CrossRef]
- Souza, D.N.; Meira, R.A.; Lima, J.F.; Valerio, M.E.; Caldas, L.V. Evaluation of doses in radiotherapy using solid-state composites based on natural colourless topaz. Appl. Radiat. Isot. 2003, 58, 489–494. [Google Scholar] [CrossRef]
- Sardar, M.; Tufail, M. Thermoluminescent characteristics of topaz from Sabser mine near Sakardu in northern Pakistan. Nucl. Instrum. Methods Phys. Res. 2011, 269, 284–287. [Google Scholar] [CrossRef]
- Sardar, M.; Tufail, M. Thermoluminescence and dosimetric aspects of topaz from Yono Shigar mine in Pakistan. J. Lumin. 2012, 132, 1544–1549. [Google Scholar] [CrossRef]
- Sardar, M.; Souza, D.N.; Caldas, L.V.; Tufail, M. Effect of visible and ultraviolet light on TL study of topaz glass composites. Scientia Plena 2012, 8, 034801–034809. [Google Scholar]
- Miziolek, A.W.; Palleschi, V.; Schechter, I. (Eds.) Laser Induced Breakdown Spectroscopy; Cambridge University Press: Cambridge, UK, 2006. [Google Scholar]
- Radziemski, L.; Cremers, D. A brief history of laser-induced breakdown spectroscopy: From the concept of atoms to LIBS 2012. Spectrochim. Acta Part B At. Spec. 2013, 87, 3–10. [Google Scholar] [CrossRef]
- Hark, R.R.; Harmon, R.S. Geochemical fingerprinting using LIBS. In Laser-Induced Breakdown Spectroscopy; Springer: Berlin/Heidelberg, Germany, 2014; pp. 309–348. [Google Scholar]
- Vadillo, J.M.; Laserna, J.J. Laser-induced breakdown spectroscopy of silicate, vanadate and sulfide rocks. Talanta 1996, 43, 1149–1154. [Google Scholar] [CrossRef]
- Harmon, R.S.; Remus, J.; McMillan, N.J.; McManus, C.; Collins, L.; Gottfried, J.L., Jr.; DeLucia, F.C.; Miziolek, A.W. LIBS analysis of geomaterials: Geochemical fingerprinting for the rapid analysis and discrimination of minerals. Appl. Geochem. 2009, 24, 1125–1141. [Google Scholar] [CrossRef]
- McMillan, N.J.; Harmon, R.S.; De-Lucia, F.C.; Miziolek, A.M. Laser-induced breakdown spectroscopy analysis of minerals: Carbonates and silicates. Spectrochim. Acta Part B At. Spec. 2007, 62, 1528–1536. [Google Scholar] [CrossRef]
- Díaz Pace, D.M.; Gabriele, N.A.; Garcimuño, M.; D’Angelo, C.A.; Bertuccelli, G.; Bertuccelli, D. Analysis of minerals and rocks by laser-induced breakdown spectroscopy. Spec. Lett. 2011, 44, 399–411. [Google Scholar] [CrossRef]
- Gottfried, J.L.; Harmon, R.S.; De-Lucia Jr, F.C.; Miziolek, A.W. Multivariate analysis of laser-induced breakdown spectroscopy chemical signatures for geomaterial classification. Spectrochim. Acta Part B At. Spec. 2009, 64, 1009–1019. [Google Scholar] [CrossRef]
- Agrosì, G.; Tempesta, G.; Scandale, E.; Legnaioli, S.; Lorenzetti, G.; Pagnotta, S.; Palleschi, V.; Mangone, A.; Lezzerini, M. Application of Laser Induced Breakdown Spectroscopy to the identification of emeralds from different synthetic processes. Spectrochim. Acta Part B At. Spec. 2014, 102, 48–51. [Google Scholar] [CrossRef]
- Senesi, G.S. Laser-Induced Breakdown Spectroscopy (LIBS) applied to terrestrial and extraterrestrial analogue geomaterials with emphasis to minerals and rocks. Earth-Sci. Rev. 2014, 139, 231–267. [Google Scholar] [CrossRef]
- Qiao, S.; Ding, Y.; Tian, D.; Yao, L.; Yang, G. A review of laser-induced breakdown spectroscopy for analysis of geological materials. Appl. Spec. Rev. 2015, 50, 1–26. [Google Scholar] [CrossRef]
- Sallé, B.; Cremers, D.A.; Maurice, S.; Wiens, R.C. Laser-induced breakdown spectroscopy for space exploration applications: Influence of the ambient pressure on the calibration curves prepared from soil and clay samples. Spectrochim. Acta Part B At. Spec. 2005, 60, 479–490. [Google Scholar] [CrossRef]
- Tognoni, E.; Cristoforetti, G.; Legnaioli, S.; Palleschi, V. Calibration-free laser-induced breakdown spectroscopy: State of the art. Spectrochim. Acta Part B At. Spec. 2010, 65, 1–14. [Google Scholar] [CrossRef]
- Clegg, S.M.; Sklute, E.; Dyar, M.D.; Barefield, J.E.; Wiens, R.C. Multivariate analysis of remote laser-induced breakdown spectroscopy spectra using partial least squares, principal component analysis, and related techniques. Spectrochim. Acta Part B At. Spec. 2009, 64, 79–88. [Google Scholar] [CrossRef]
- Gonzcález, A.; Ortiz, M.; Campos, J. Determination of sulfur content in steel by laser-produced plasma atomic emission spectroscopy. Appl. Spec. 1995, 49, 1632–1635. [Google Scholar] [CrossRef]
- Sabsabi, M.; Cielo, P. Quantitative analysis of aluminum alloys by laser-induced breakdown spectroscopy and plasma characterization. Appl. Spec. 1995, 49, 499–507. [Google Scholar] [CrossRef]
- De-Giacomo, A.; Dell’Aglio, M.; De Pascale, O.; Longo, S.; Capitelli, M. Laser induced breakdown spectroscopy on meteorites. Spectrochim. Acta Part B At. Spec. 2007, 62, 1606–1611. [Google Scholar] [CrossRef]
- Ciucci, A.; Corsi, M.; Palleschi, V.; Rastelli, S.; Salvetti, A.; Tognoni, E. New procedure for quantitative elemental analysis by laser-induced plasma spectroscopy. Appl. Spec. 1999, 53, 960–964. [Google Scholar] [CrossRef]
- Sirven, J.B.; Bousquet, B.; Canioni, L.; Sarger, L.; Tellier, S.; Potin-Gautier, M.; Le Hecho, I. Qualitative and quantitative investigation of chromium-polluted soils by laser-induced breakdown spectroscopy combined with neural networks analysis. Anal. Bioanal. Chem. 2006, 385, 256–262. [Google Scholar] [CrossRef]
- De-Giacomo, A.; Dell’Aglio, M.; Gaudiuso, R.; Santagata, A.; Senesi, G.S.; Rossi, M.; Ghiara, M.R.; Capitelli, F.; De-Pascale, O. A laser induced breakdown spectroscopy application based on local thermodynamic equilibrium assumption for the elemental analysis of alexandrite gemstone and copper-based alloys. J. Chem. Phys. 2012, 398, 233–238. [Google Scholar] [CrossRef]
- Hafeez, M.; Abbasi, S.A.; Rafique, M.; Hayder, R.; Sajid, M.; Iqbal, J.; Ahmad, N.; Shahida, S. Calibration-free laser-induced breakdown spectroscopic analysis of copper-rich mineral collected from the Gilgit-Baltistan region of Pakistan. Appl. Opt. 2020, 59, 68–76. [Google Scholar] [CrossRef] [PubMed]
- Ahmad, N.; Ahmed, R.; Umar, Z.A.; Liaqat, U.; Manzoor, U.; Baig, M.A. Qualitative and quantitative analyses of copper ores collected from Baluchistan, Pakistan using LIBS and LA-TOF-MS. Appl. Phys. B 2018, 124, 160. [Google Scholar] [CrossRef]
- Rossi, M.; Dell’Aglio, M.; De-Giacomo, A.; Gaudiuso, R.; Senesi, G.S.; De-Pascale, O.; Capitelli, F.; Nestola, F.; Ghiara, M.R. Multi-methodological investigation of kunzite, hiddenite, alexandrite, elbaite and topaz, based on laser-induced breakdown spectroscopy and conventional analytical techniques for supporting mineralogical characterization. Phys. Chem. Miner. 2014, 41, 127–140. [Google Scholar] [CrossRef]
- Alvarez-Llamas, C.; Pisonero, J.; Bordel, N. Quantification of fluorine traces in solid samples using CaF molecular emission bands in atmospheric air Laser-Induced Breakdown Spectroscopy. Spectrochim. Acta Part B At. Spec. 2016, 123, 157–162. [Google Scholar] [CrossRef]
- Pořízka, P.; Kaski, S.; Hrdlička, A.; Modlitbová, P.; Sládková, L.; Häkkänen, H.; Prochazka, D.; Novotný, J.; Gadas, P.; Čelko, L.; et al. Detection of fluorine using laser-induced breakdown spectroscopy and Raman spectroscopy. J. Anal. Atom. Spectrom. 2017, 32, 1966–1974. [Google Scholar] [CrossRef]
- Quarles, C.D.; Gonzalez, J.J.; East, L.J.; Yoo, J.H.; Morey, M.; Russo, R.E. Fluorine analysis using laser induced breakdown spectroscopy (LIBS). J. Anal. Atom. Spectrom. 2014, 29, 1238–1242. [Google Scholar] [CrossRef]
- Foucaud, Y.; Fabre, C.; Demeusy, B.; Filippova, I.V.; Filippov, L.O. Optimisation of fast quantification of fluorine content using handheld laser induced breakdown spectroscopy. Spectrochim. Acta Part B At. Spec. 2019, 158, 105628. [Google Scholar] [CrossRef]
- Agheem, M.H.; Shah, M.T.; Khan, T.U. Gems and Gem-Bearing Pegmatites of the Shigsr Valley, Skardu, Norhtern Pakistan. JHES 2004, 37, 167–178. [Google Scholar]
- Searle, M.P.; Tirrul, R. Structural and thermal evolution of the Karakoram crust. J. Geol. Soc. 1991, 148, 65–82. [Google Scholar] [CrossRef]
- Fraser, J.E.; Searle, M.P.; Parrish, R.R.; Noble, S.R. Chronology of deformation, metamorphism, and magmatism in the southern Karakoram Mountains. Geol. Soc. Am. Bull. 2001, 113, 1443–1455. [Google Scholar] [CrossRef]
- Ahmed, N.; Ahmed, R.; Baig, M.A. Analytical analysis of different karats of gold using laser induced breakdown spectroscopy (LIBS) and laser ablation time of flight mass spectrometer (LA-TOF-MS). Plasma Chem. Plasma Process. 2018, 38, 207–222. [Google Scholar] [CrossRef]
- Aguilera, J.A.; Aragon, C. A comparison of the temperatures and electron densities of laser-produced plasmas obtained in air, argon, and helium at atmospheric pressure. Appl. Phys. A. 1999, 69, S475–S478. [Google Scholar] [CrossRef]
- Cristoforetti, G.; De-Giacomo, A.; Dell’Aglio, M.; Legnaioli, S.; Tognoni, E.; Palleschi, V.; Omenetto, N. Local thermodynamic equilibrium in laser-induced breakdown spectroscopy: Beyond the McWhirter criterion. Spectrochim. Acta Part B At. Spec. 2010, 65, 86–95. [Google Scholar] [CrossRef]
- Gigosos, M.A.; González, M.A.; Cardenoso, V. Computer simulated Balmer-alpha,-beta and-gamma Stark line profiles for non-equilibrium plasmas diagnostics. Spectrochim. Acta Part B At. Spec. 2003, 58, 1489–1504. [Google Scholar] [CrossRef]
- Chan, W.T.; Russo, R.E. Study of laser-material interactions using inductively coupled plasma-atomic emission spectrometry. Spectrochim. Acta Part B At. Spec. 1991, 46, 1471–1486. [Google Scholar] [CrossRef]
- Capitelli, M.; Casavola, A.; Colonna, G.; De-Giacomo, A. Laser-induced plasma expansion: Theoretical and experimental aspects. Spectrochim. Acta Part B At. Spec. 2004, 59, 271–289. [Google Scholar] [CrossRef]
- National Institute Of Standards and Technology. NIST Atomic Spectra Database Lines Form. Available online: https://physics.nist.gov/PhysRefData/ASD/lines_form.html (accessed on 8 September 2020).
- Ahmed, N.; Farooq, K.; Shahida, S.; ul Haq, K.; Abbasi, S.A.; Umar, Z.A.; Ahmed, R.; Baig, M.A. Spectrochemical analysis of Pakistani bakery breads using laser induced breakdown spectroscopy. Optik 2021, 226, 165743. [Google Scholar] [CrossRef]
- Thompson, J.R.; Wiens, R.C.; Barefield, J.E.; Vaniman, D.T.; Newsom, H.E.; Clegg, S.M. Remote laser-induced breakdown spectroscopy analyses of Dar al Gani 476 and Zagami Martian meteorites. J. Geophys. Res. Planets 2006, 111, E5. [Google Scholar] [CrossRef]
- Sun, L.; Yu, H. Correction of self-absorption effect in calibration-free laser-induced breakdown spectroscopy by an internal reference method. Talanta 2009, 79, 388–395. [Google Scholar] [CrossRef] [PubMed]
- Colon, C.; Hatem, G.; Verdugo, E.; Ruiz, P.; Campos, J. Measurement of the Stark broadening and shift parameters for several ultraviolet lines of singly ionized aluminum. J. Appl. Phys. 1993, 73, 4752–4758. [Google Scholar] [CrossRef]
- Stark Broadening Parameters for Neutral and Singly Charged Ions: Helium through Calcium and Cesium. Available online: https://griem.obspm.fr/ (accessed on 9 September 2020).
- Shaikh, N.M.; Hafeez, S.; Rashid, B.; Baig, M.A. Spectroscopic studies of laser induced aluminum plasma using fundamental, second and third harmonics of a Nd: YAG laser. Eur. Phys. J. D 2007, 44, 371–379. [Google Scholar] [CrossRef]
- Mineralogy Database. Available online: http://webmineral.com/data/Topaz.shtml#.X4idTtUzbIU (accessed on 16 October 2020).
- Souza, D.N.; De-Lima, J.F.; Valerio, M.E. Thermoluminescence of natural topaz crystals of differing genesis. In Materials Science Forum; Trans Tech Publications Ltd.: Stafa-Zurich, Switzerland, 1997; Volume 239, pp. 765–768. [Google Scholar]


| Element | Wavelength λ (nm) | Transition Probability A (s−1) | Statistical Weight (k) | Upper-Level Energy Ek (cm−1) |
|---|---|---|---|---|
| Al-I | 256.85 | 1.92 × 10⁷ | 4 | 38,929.41 |
| Al-I | 257.60 | 3.60 × 10⁷ | 6 | 38,933.97 |
| Al-I | 265.29 | 1.42 × 10⁷ | 2 | 37,689.41 |
| Al-I | 266.07 | 2.84 × 10⁷ | 2 | 37,689.41 |
| Al-I | 308.26 | 5.87 × 10⁷ | 4 | 32,435.45 |
| Al-I | 309.26 | 7.29 × 10⁷ | 6 | 32,436.80 |
| Element | Wavelength (nm) | Oscillator Strength f12 | MA | Dλ (mm) | 10Dλ (mm) | ||
|---|---|---|---|---|---|---|---|
| Si | 288.20 | 1.62 × 10⁻¹ | 28.08 | 4.30 | ≈0.1 | 0.001 | 0.01 |
| Al | 396.19 | 1.16 × 10⁻¹ | 26.98 | 3.12 | ≈0.1 | 0.0006 | 0.006 |
| Element | Wavelength λ (nm) | Transition Probability A (s−1) | Statistical Weight (k) | Upper-Level Energy Ek (cm−1) |
|---|---|---|---|---|
| Si-I | 250.73 | 5.47 × 10⁷ | 5 | 39,955.05 |
| Si-I | 251.66 | 1.68 × 10⁸ | 5 | 39,955.05 |
| Si-I | 251.97 | 5.49 × 10⁷ | 3 | 39,760.28 |
| Si-I | 252.45 | 2.22 × 10⁸ | 1 | 39,683.16 |
| Si-I | 252.89 | 9.04 × 10⁷ | 3 | 39,760.28 |
| Si-I | 263.15 | 1.06 × 10⁸ | 3 | 53,387.33 |
| Si-I | 288.21 | 2.17 × 10⁸ | 3 | 40,991.88 |
| Si-I | 298.78 | 2.66 × 10⁶ | 3 | 39,760.28 |
| Si-I | 390.55 | 1.33 × 10⁷ | 3 | 40,991.88 |
| Al-I | 257.60 | 3.60 × 10⁷ | 6 | 38,933.97 |
| Al-I | 266.07 | 2.84 × 10⁷ | 2 | 37,689.41 |
| Al-I | 396.19 | 9.85 × 10⁷ | 2 | 25,347.76 |
| Element | Wavelength λ (nm) | Number Density of Neutral Species | Number Density of Ionized Species | Sum of Number Densities of Neutral and Ionized Species (cm−3) |
|---|---|---|---|---|
| Si-I | 250.73 | 2.29 × 10¹⁶ | 3.67 × 10¹⁵ | 2.66 × 10¹⁶ |
| Si-I | 251.66 | 1.89 × 10¹⁶ | 3.03 × 10¹⁵ | 2.19 × 10¹⁶ |
| Si-I | 251.97 | 2.75 × 10¹⁶ | 4.40 × 10¹⁵ | 3.19 × 10¹⁶ |
| Si-I | 252.45 | 2.79 × 10¹⁶ | 4.47 × 10¹⁵ | 3.24 × 10¹⁶ |
| Si-I | 252.89 | 2.87 × 10¹⁶ | 4.59 × 10¹⁵ | 3.32 × 10¹⁶ |
| Si-I | 263.15 | 1.12 × 10¹⁷ | 1.79 × 10¹⁶ | 1.30 × 10¹⁷ |
| Si-I | 288.21 | 4.47 × 10¹⁶ | 7.16 × 10¹⁵ | 5.18 × 10¹⁶ |
| Si-I | 298.78 | 2.04 × 10¹⁶ | 3.27 × 10¹⁵ | 2.37 × 10¹⁶ |
| Si-I | 390.55 | 1.28 × 10¹⁶ | 2.06 × 10¹⁵ | 1.49 × 10¹⁶ |
| Al-I | 257.60 | 5.63 × 10¹⁶ | 4.65 × 10¹⁵ | 6.09 × 10¹⁶ |
| Al-I | 266.07 | 7.77 × 10¹⁶ | 6.42 × 10¹⁵ | 8.41 × 10¹⁶ |
| Al-I | 396.19 | 4.77 × 10¹⁶ | 3.94 × 10¹⁵ | 5.17 × 10¹⁶ |
| Element | Formula (Wt. %) [55] | CF-LIBS (Wt. %) | EDX (Wt. %) | Al/Si (Formula) | Al/Si (CF-LIBS) | Al/Si (EDX) | Relative Error |
|---|---|---|---|---|---|---|---|
| Al | 29.61 | 60.81 | 37.27 | 1.92 | 1.55 | 1.59 | 2.52 |
| Si | 15.41 | 39.18 | 23.41 | ||||
| O | 43.02 | - | 28.94 | ||||
| F | 11.47 | - | 10.38 | ||||
| Na | - | - | - | ||||
| N | - | - | - | ||||
| H | 0.50 | - | - |
Publisher’s Note: MDPI stays neutral with regard to jurisdictional claims in published maps and institutional affiliations. |
© 2021 by the authors. Licensee MDPI, Basel, Switzerland. This article is an open access article distributed under the terms and conditions of the Creative Commons Attribution (CC BY) license (http://creativecommons.org/licenses/by/4.0/).
Share and Cite
Abbasi, S.A.; Rafique, M.; Khan, T.M.; Khan, A.; Ahmad, N.; Faruque, M.R.I.; Khandaker, M.U.; Ahmad, P.; Saboor, A. Chemical Analysis of Thermoluminescent Colorless Topaz Crystal Using Laser-Induced Breakdown Spectroscopy. Minerals 2021, 11, 367. https://doi.org/10.3390/min11040367
Abbasi SA, Rafique M, Khan TM, Khan A, Ahmad N, Faruque MRI, Khandaker MU, Ahmad P, Saboor A. Chemical Analysis of Thermoluminescent Colorless Topaz Crystal Using Laser-Induced Breakdown Spectroscopy. Minerals. 2021; 11(4):367. https://doi.org/10.3390/min11040367
Chicago/Turabian StyleAbbasi, Shahab Ahmed, Muhammad Rafique, Taj Muhammad Khan, Adnan Khan, Nasar Ahmad, Mohammad Rashed Iqbal Faruque, Mayeen Uddin Khandaker, Pervaiz Ahmad, and Abdul Saboor. 2021. "Chemical Analysis of Thermoluminescent Colorless Topaz Crystal Using Laser-Induced Breakdown Spectroscopy" Minerals 11, no. 4: 367. https://doi.org/10.3390/min11040367
APA StyleAbbasi, S. A., Rafique, M., Khan, T. M., Khan, A., Ahmad, N., Faruque, M. R. I., Khandaker, M. U., Ahmad, P., & Saboor, A. (2021). Chemical Analysis of Thermoluminescent Colorless Topaz Crystal Using Laser-Induced Breakdown Spectroscopy. Minerals, 11(4), 367. https://doi.org/10.3390/min11040367