Article

Characterization and Suitability of Nigerian Barites for Different Industrial Applications

1
Department of Materials Science and Engineering, African University of Science and Technology, Abuja P.M.B 681, Nigeria
2
National Agency for Science and Engineering Infrastructure, Garki Abuja P.M.B 391, Nigeria
3
Department of Chemistry, Faculty of Science and Education, Busitema University Uganda, Tororo P.O. Box 236, Uganda
4
Materials Science and Engineering Department, Kwara State University, Malete Kwara P.M.B 1530, Nigeria
*
Author to whom correspondence should be addressed.
Minerals 2021, 11(4), 360; https://doi.org/10.3390/min11040360
Submission received: 20 February 2021 / Revised: 21 March 2021 / Accepted: 24 March 2021 / Published: 30 March 2021

Abstract

:
This work aimed to characterize barite samples from selected different locations in Nigeria and determine their suitability for various industrial applications. The properties determined include mineralogy, chemical composition, morphology, functional groups, and specific gravity. Samples were obtained from ten locations in Nasarawa and Taraba states as well as a standard working sample (WS) obtained from a drilling site. The samples were characterized using scanning electron microscope and energy dispersive X-ray (SEM-EDX), Fourier infrared analysis (FTIR), and X-ray diffraction (XRD). Specific gravity (SG) was determined using the pycnometer method. Results of SEM-EDX analysis show that the WS has a Ba-S-O empirical composition of 66.5% whereas these of the ten samples investigated vary between 59.36% and 98.86%. The FTIR analysis shows that the functional groups of S-O, SO42−, Ba-S-O, OH of the ten samples match that of the WS. Results of XRD show that the ten samples have the same mineralogical composition as the WS and all meet American Petroleum Institute (API) standards for industrial barite. Similar matching results are shown from EDXRF spectra intensity, position, and composition analysis of the ten samples compared to the WS. Specific gravity (SG) results show that six out of the ten samples have SG above 4.2 which is the recommended minimum for the American Petroleum Institute (API) standard. The other four samples will require beneficiation to meet the standard for drilling mud application. Using all the parameters of the assessment together, results show that while some (6) of the samples can be used for drilling fluid application, some (4) require beneficiation but all ten samples can be used for other industrial applications including healthcare, construction, plastic, cosmetics, paper, and rubber industries. The results of the study can be used for value addition in developing beneficiation procedures, processes, and technology for purification along with new materials for the industries.

Graphical Abstract

1. Introduction

The Federal Government of Nigeria is currently implementing the National Economic Recovery and Growth Plan (ERGP) aimed at re-directing the economy back to the path of recovery [1]. A major aspect of the plan is diversification of the economy away from oil and increasing the local content in operations of the oil industry. One way of diversifying the economy is by developing the mining sector, including adding value to extracted minerals. Approximately 85% of barite goes into the oil industry, about 10% into the chemical industry, 5% into the filler market. Barite is used as a weight density agent in drilling mud for gas and oil exploration to avoid the high-pressure formation and prevent blowouts. This is compressing the high pressure created by the drill bit as it passes through various formations with different characteristics. The deeper the drilling hole, the more barite is required for the total mud mix. For oil drilling, a specific gravity of barite is the only property checked. Other chemical and physical properties are needed for other barite applications. The physical appearance of barite used in drilling petroleum wells can be black, blue, brown, or grey dependent on the ore body. The used barite must be dense enough so that its specific gravity is greater than 4.1 and smooth not to damage the drill bit [2,3]. One of the minerals being promoted by the Federal Ministry of Mines and Steel Development is barite [4]. This mineral is not only useful in the oil industry but can also be used for other industrial applications. Most of the current use of barite in the oil industry is imported [4]. Therefore, there is a need to promote the exploitation and use of barite for the oil industry and other industrial applications.
One way of diversifying the economy is by developing the mining sector, including adding value to extracted minerals. This is mainly in the oil industry which depends on the appreciable supply of barite ore as a key constituent of drilling mud used to stabilize the oil well; prevent blow-outs; remove drill cuts by the fluid. It is a key constituent of drilling mud, which is the fluid pumped into the oil or gas well to lubricate the bit and drill stem, removes rock chips, prevents a collapse of well walls, and prevents blowouts if over pressured strata are encountered [5,6,7,8]. Barite is chemically stable, making it useful as an additive in the manufacturing of different products like rubber, paints, enamels, plastics, paper goods, wallpapers, asbestos goods, glass, and ceramics. Moreover, it is used in radiology for X-rays of the intestines and to make high-density concrete resistant to nuclear radiation [7]. Barite (BaSO4) is crucial to the oil and gas industrial application. This is due to a key constituent of the drilling mud used in oil and gas wells. Additionally, elemental barium is an additive in ceramic glazes, optical glass, paint, and other products. Barite deposits are categorized into different main types which include; bedded-volcanic, bedded-sedimentary, vein, cavity-fill, and metasomatic and residual. Bedded-sedimentary deposits are found in sedimentary rocks with properties of high biological productivity during sediment accumulation and they are the major sources of barite production that account for the majority of barite reserves worldwide [8]. In recent years, barite has found usage in brake shoe linings, noise reduction in engine compartments, and spark-plug alloys [9].
Barite is a heavy mineral that normally occurs with Pb-Zn ore, barite vein, barite-fluorite vein deposit, strata bound SEDEX-type deposit among other deposits as a gangue mineral, in sedimentary deposits, and rarely in salts [8]. It is usually mined as barium content. It occurs either in crystalline form, as tabular, prismatic, or bladed crystals. The pure crystals are often colorless, cream-colored, or white, but may also acquire various colors based on the impurities it contains. Granitic rocks characteristically have a somewhat higher content of barium than average continental crust, and basaltic rocks characteristically have lower barium content. The range of barium content of shales spans approximately the same range as the barium content of granitic rocks [8]. Some smaller mines exploit barite in veins, which formed when barium sulfate was precipitated from hot subterranean waters. In some cases, barite is a by-product of mining lead, zinc, silver, or other metal ores [10], in the paper and rubber industries, as a filler or extender in cloth, ink, and plastics products; in radiography (“barium milkshake”); as getter (scavenger) alloys in vacuum tubes; deoxidizer for copper; lubricant for anode rotors in X-ray tubes, spark-plug alloys, and white pigment. Other uses of barite include as an additive for friction materials, rubbers, plastics, paints, feedstock for chemical manufacturing, and shielding in X-ray and gamma-ray applications [8,11].
The status of barite mining activities in Nigeria currently shows that the barite quality from these different localities proves that Nigeria does not necessarily need to import high grade or any other specification of barite from foreign countries for its usage in the desired industries [12]. However, a large percentage of the barite used in the oil industry is imported. In 2020 alone, this is valued at about $96 million, and the estimated consumption is 440,000 metric tons for this year. To boost the mineral sector, the Federal Government of Nigeria has taken initiatives to encourage local mining, beneficiation, and mining of barite for the industries [4]. The valuation activities are usually done by the Federal Ministry of Mines and Steel Development (MMSD), Nigerian Geological Survey Agency (NGSA), and Nigerian Content Development and Monitoring Board (NCDMB).
Drilling activity accounts for nearly 95 percent of domestic consumption and about 90 percent of global consumption. Economic deposits of barite are relatively common and are found in many countries [8]. Literature shows that some Nigerian barites are suitable for drilling fluid formulations [13]. In another study, it was shown that barite and oil drilling fluid additives affect reservoir rock characteristics [13]. Another study reported on the effect of barite and ilmenite mixture on enhancing the drilling mud weight [14]. Mohamed et al. showed that barite sag can be prevented in oil-based drilling fluids using a mixture of barite and ilmenite as weighting material [7]. The future of drilling-grade barite weight material was presented by [15]. There are frequently auxiliary criteria used to compare deposits of barite. Some raw materials have sensitive costs which include transportation of raw materials and market, involving land and sea costs. This can inform how much surplus remains for mining and milling for the deposits to be considered economically viable. The grade of the deposits also renders economic viability including the revenue for the cost of mining and milling [16]. The mining process may have little or no effect on the policy change of the companies or management. For example, the change of management from a GmbH and Co. KG to a GmbH did not affect the economic identity of the legal entity and never lead to a transfer of assets. The alteration was limited to changing the legal control while preserving the legal identity. This is because there is no act of company asset transfer and results in no exchange of services, hence no legal taxes charged [17]. Characterization results from previous work were mostly centered on discovering the chemical composition (XRF), mineralogy (SEM), organic, polymeric (FTIR), specific gravity (SG), needed for the same oil industry. The use in other industries is not well documented even though it plays an important role in these industries.
This work aims at the characterization of barite samples from different locations in Nigeria and the determination of their suitability for different industrial applications. The properties determined include mineralogy, chemical composition, morphology, functional groups, specific gravity, and the physical appearance of the powdered samples.

2. Materials and Methods
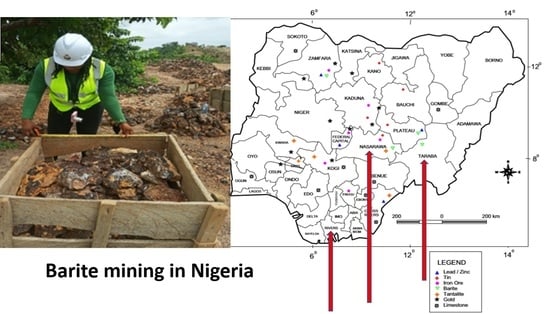
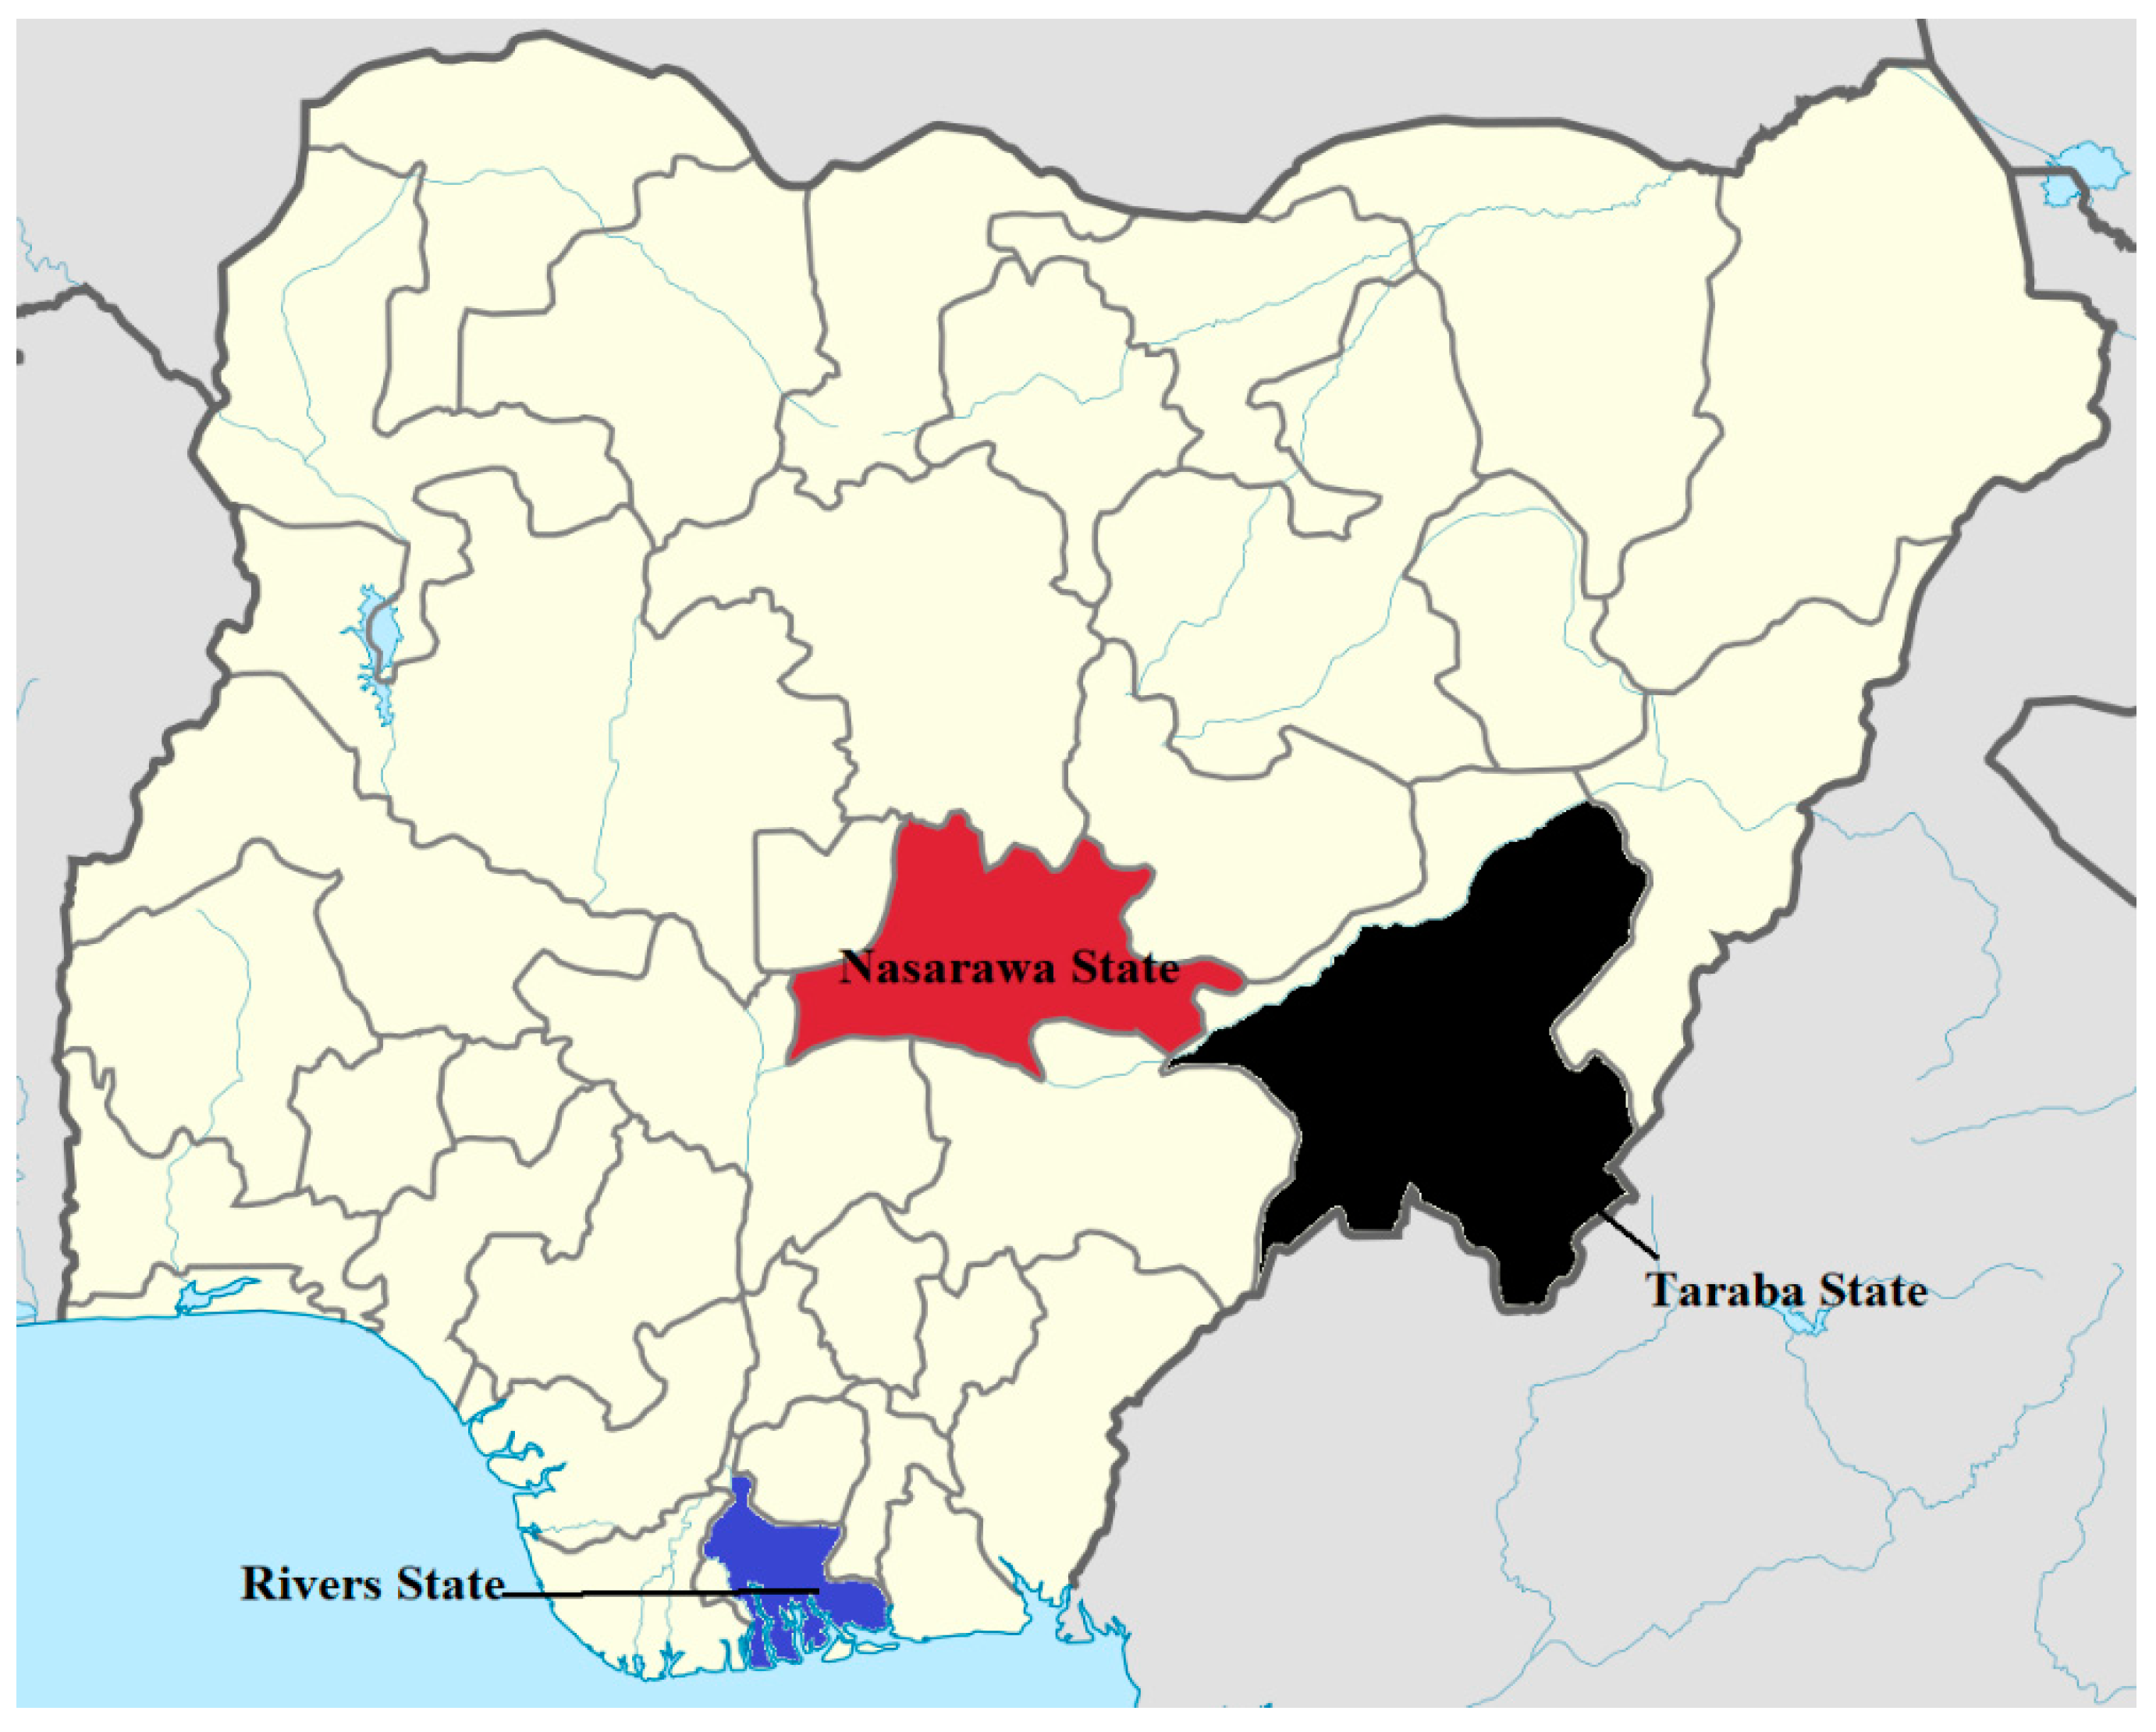
2.1. Study Location

Barite occurs in various locations within the Benue Trough. These include Adamawa, Benue, Cross River, Ebonyi, Gombe, Nasarawa, Plateau, and Taraba. But studies have shown that the major producing states are Benue, Cross River, Nasarawa, and Taraba. Samples used in the study were taken from Nasarawa (NS) and Taraba states (TS). The samples from Nassarawa state were obtained from nine different locations: Azara vein 1, Azara vein 17, Azara vein 18, Aloshi, Keana, Kumar, Ribi, Sauni, and Wuse. One sample was from Ibi in Taraba state. A sample was picked from one active well as a working sample was obtained from Port Harcourt (Rivers state) from a drilling site. These state locations are shown on the map of Nigeria in Figure 1.

2.2. Sample Collection

Different barite deposit sites were visited, including Nasarawa and Taraba states of Nigeria with representative samples collected from mining pits being worked by artisanal miners. Rocks exposure within the deposits were studied to understand the lithology of the deposits. Samples were collected across the veins and stored in sample bags with name tags as highlighted in the supplementary information.

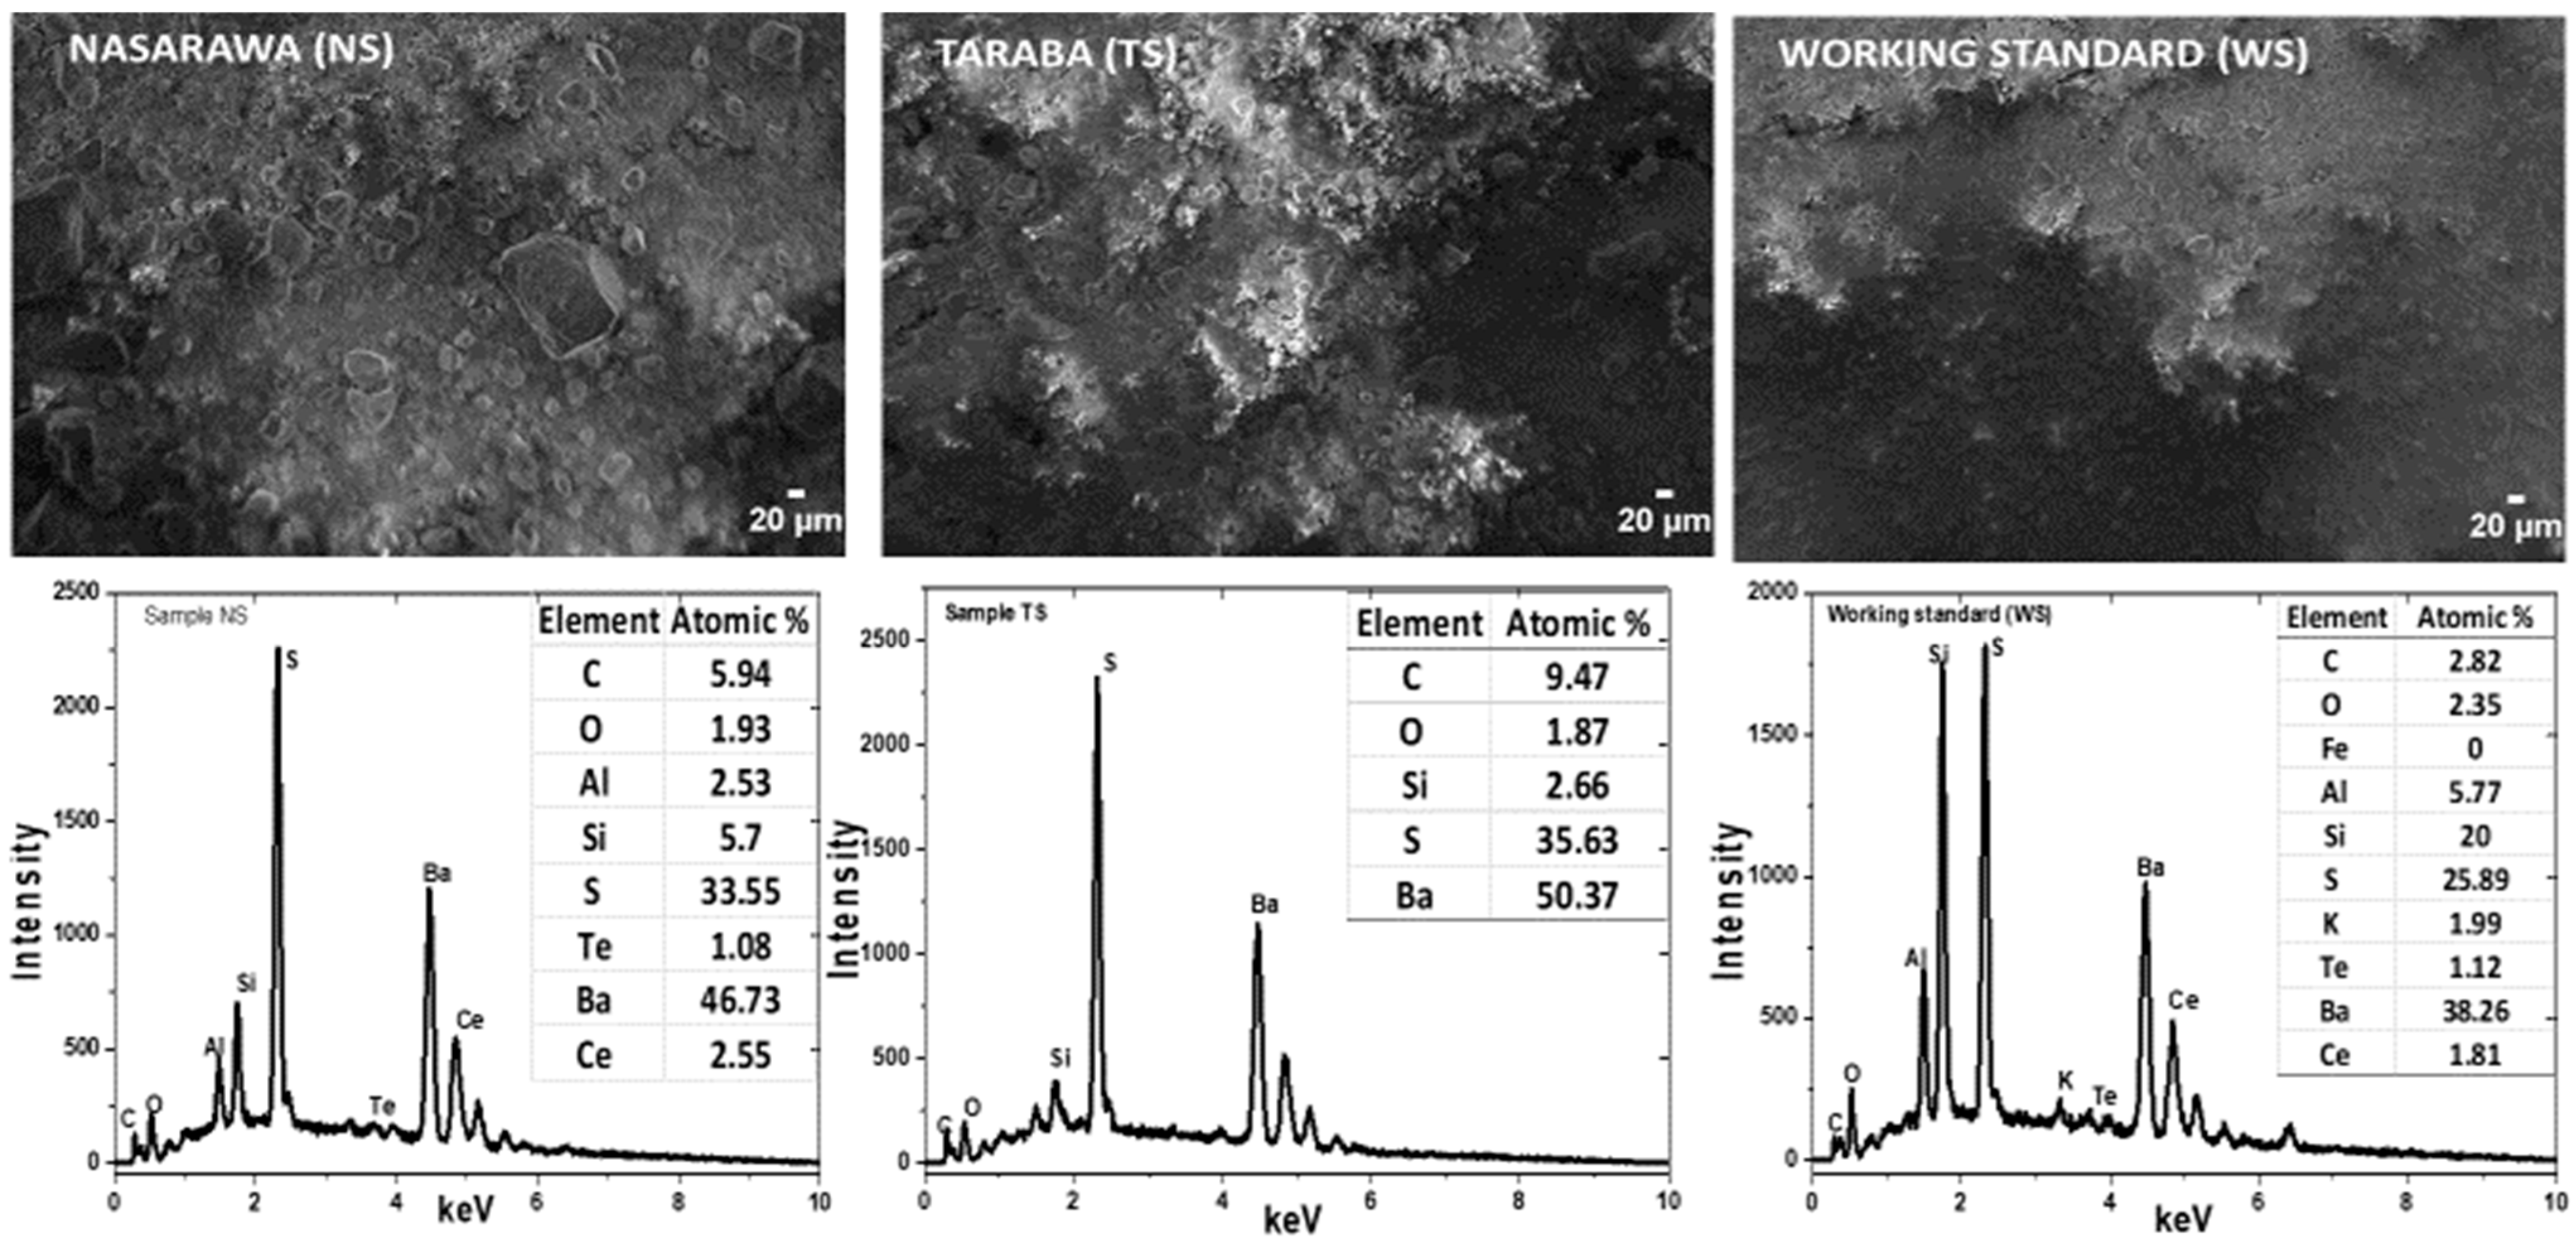
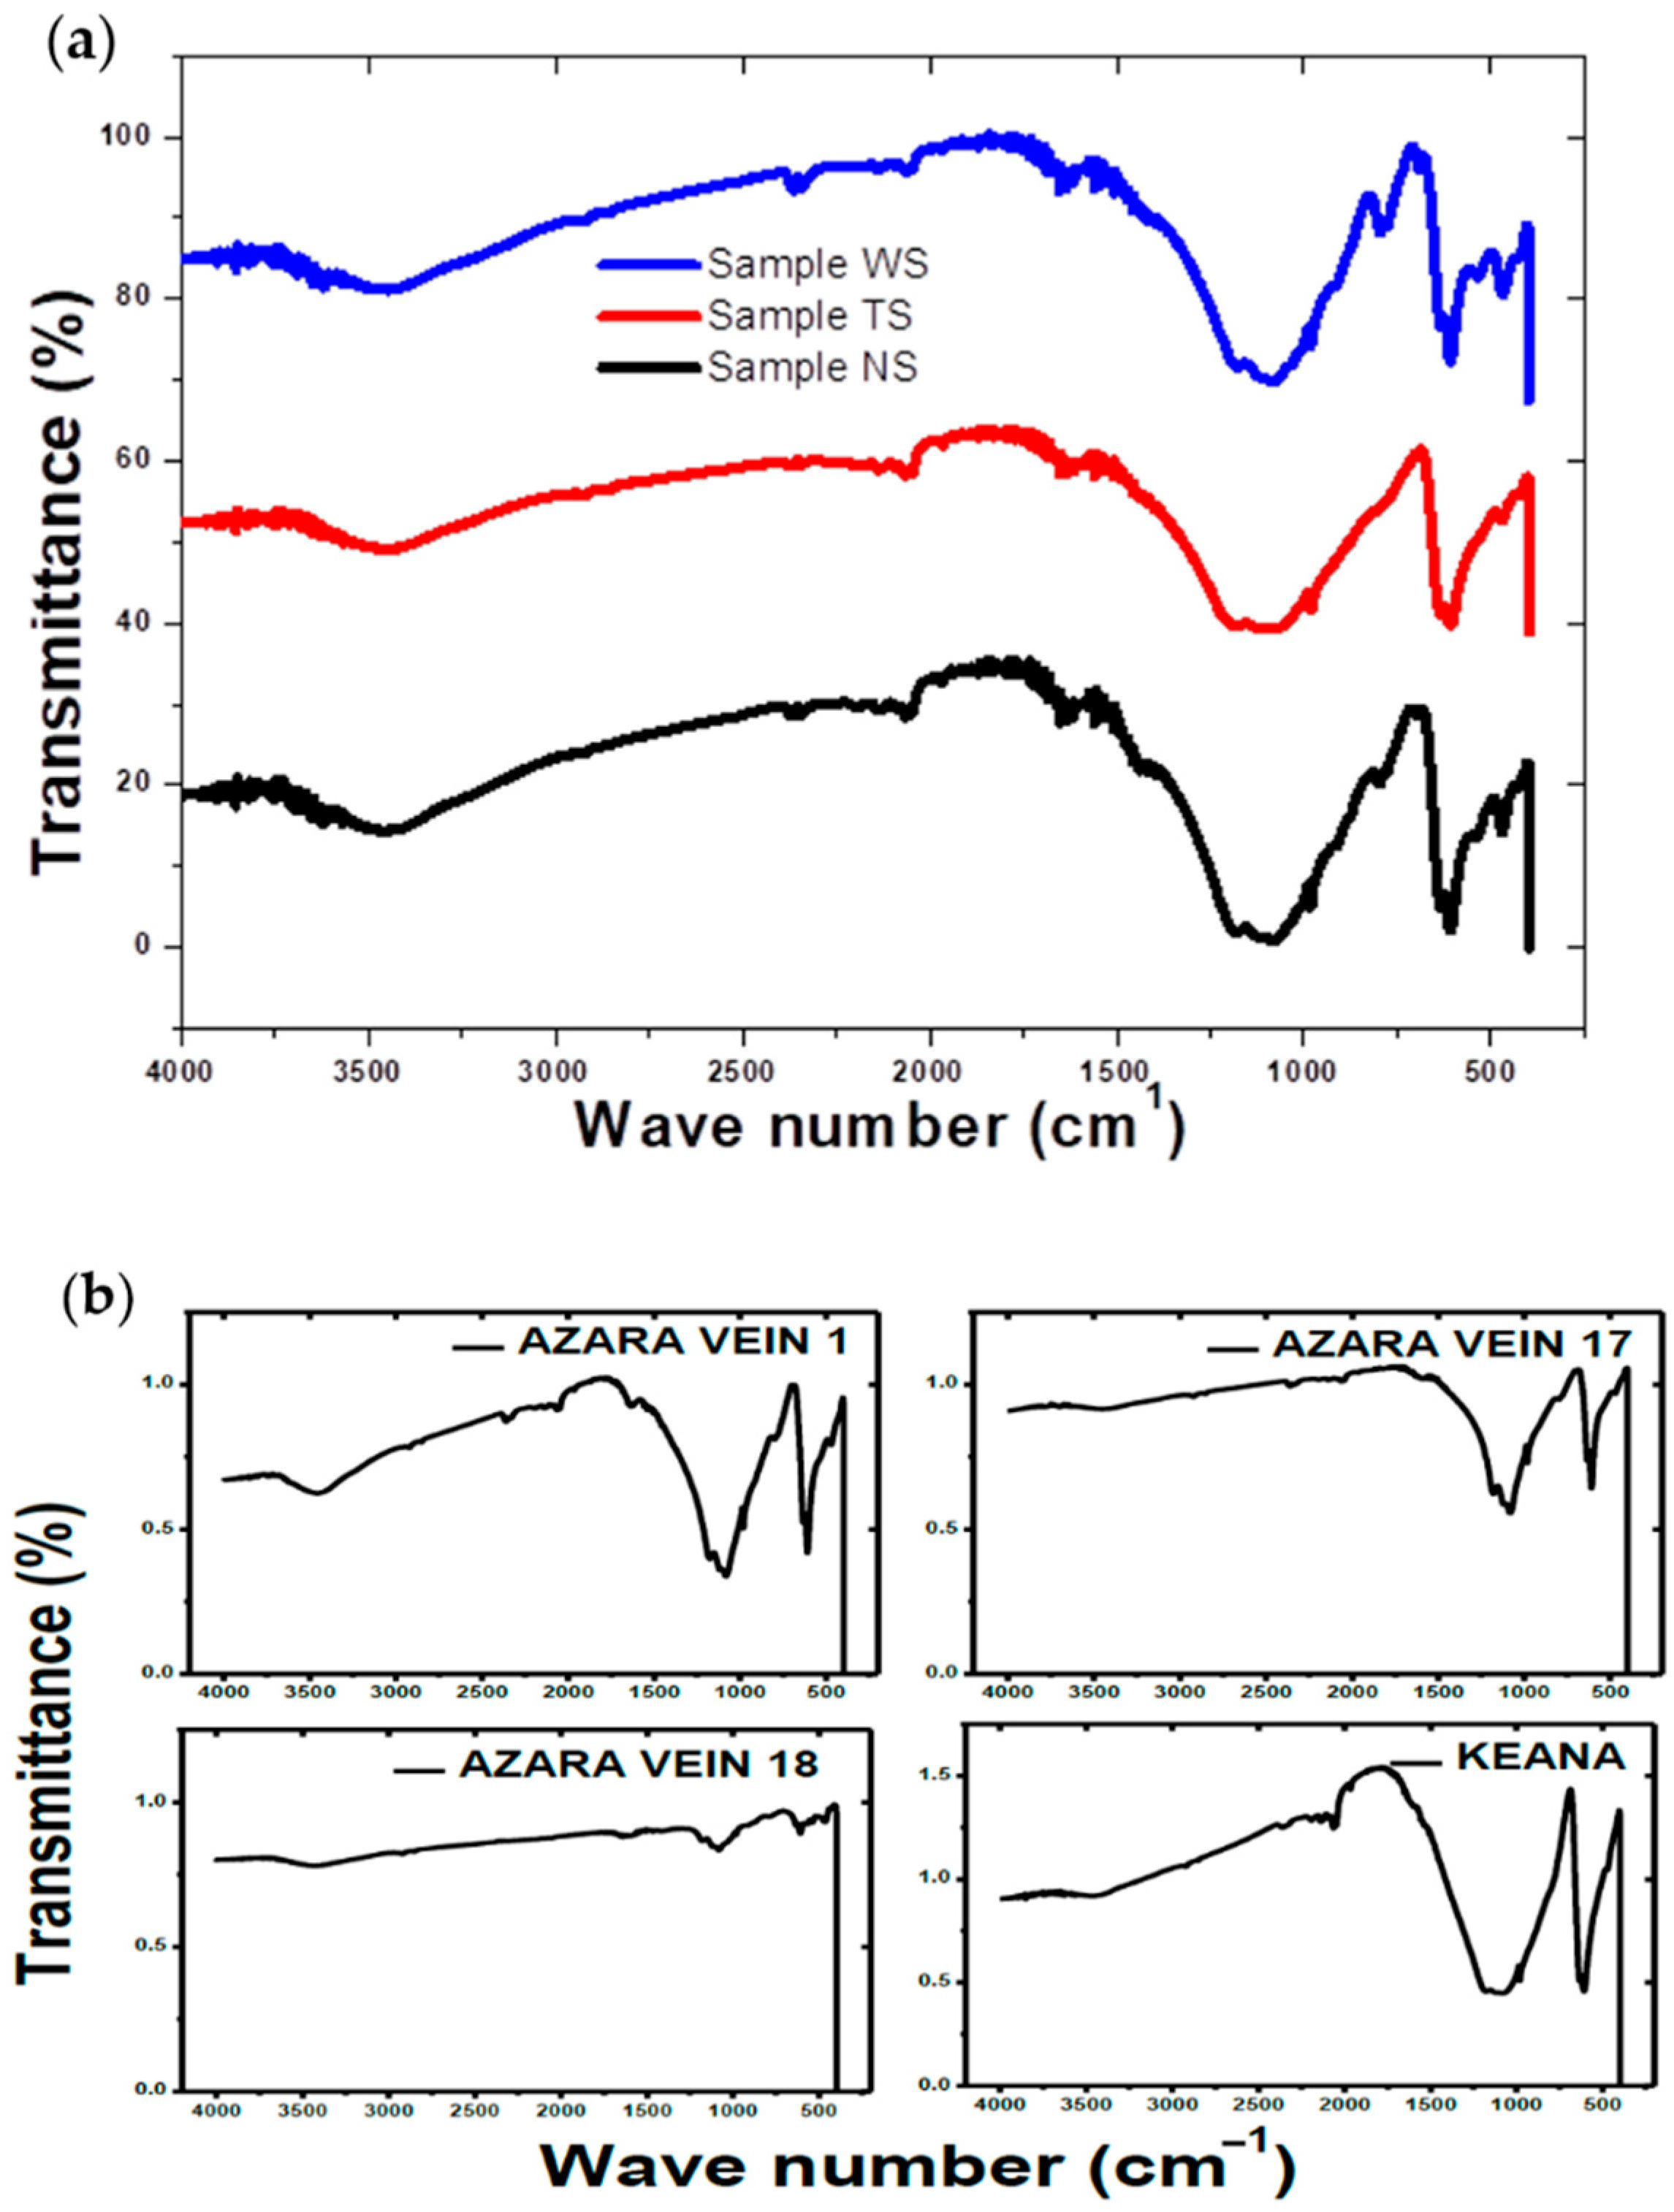
2.3. Sample Characterization

The samples were studied in the field as hand specimens and further characterized for physical and chemical properties which include: scanning electron microscope and energy dispersive X-ray (SEM-EDX, Carl ZEISS, Bangalore, India) for the in-depth surface analysis, the FTIR (Fourier transform infrared, Bruker Optik GmbH Vertex 70, Ettlingen, Germany), the XRD (X-ray diffraction, Riguku Smartlab Autosampler (RIGAKU Corp., Tokyo, Japan), the EDXRF (Malvern Panalytical B.V., Almole, Netherland) for oxides analysis [18,19,20]. SG was used to evaluate the physical, mineralogical, and chemical properties of the barite ores from the various locations [21,22,23] as described in the supplementary information.
Sample from Aloshi Nasarawa state was labeled as (NT) and Sample from Ibi, Taraba state was labeled as (TS); all other samples were labeled by the name of the location it was obtained from. The sample which was picked from the Port Harcourt drilling site labeled as (WS) was taken as the working standard.

3. Results and Discussion

The scanning electron microscope (SEM) and energy dispersive X-ray (EDX) analysis of morphology and element percentage composition data are shown in Figure 2 and supplementary information Figure S1 (Supplementary Materials). The morphology of samples NS, TS, Azara vein 1, Azara vein 17, Azara vein 18, Keana, Kumar, Ribi, Sauni, Wuse, and WS, showed surfaces of barite embedded form of material structure with clear unit boundaries. The working standard sample (WS) showed a fine surface in the morphology monograph. The surface chemical analysis was carried out with EDX, revealing the different elemental compositions of the material in-depth surfaces (Table 1). Sample NS revealed a composition of Ba as 46.73%, S as 33.55%, and oxygen as 1.93%. This gave 82.21% of the Ba-S-O empirical composition. Sample TS showed a composition of Ba as 50.37%, S as 35.63%, and oxygen as 1.87%. This gave 87.87% of the Ba-S-O empirical composition. Sample Azara vein 1 showed a composition of Ba as 51.73%, S as 43.36%, and oxygen as 2.11%. This gave 97.2% of the Ba-S-O empirical composition. Sample Azara vein 17 showed a composition of Ba as 38.59%, S as 36.84%, and oxygen as 2.88%. This gave 78.31% of the Ba-S-O empirical composition. Sample Azara vein 18 showed a composition of Ba as 34.79%, S as 31.48%, and oxygen as 3.74%. This gave 70.01% of the Ba-S-O empirical composition. Sample Keana showed a composition of Ba as 50.12%, S as 42.75%, and oxygen as 3.14%. This gave 96.01% of the Ba-S-O empirical composition. Sample Kumar showed a composition of Ba as 31.36%, S as 23.82%, and oxygen as 4.18%. This gave 59.36% of the Ba-S-O empirical composition. Sample Ribi showed a composition of Ba as 51.38%, S as 44.17%, and oxygen as 2.59%. This gave 98.14% of the Ba-S-O empirical composition. Sample Suani showed a composition of Ba as 51.17%, S as 44.75%, and oxygen as 3.94%. This gave 99.86% of the Ba-S-O empirical composition. Sample Wuse showed a composition of Ba as 51.42%, S as 42.58%, and oxygen as 2.98%. This gave 96.98% of the Ba-S-O empirical composition. Sample WS showed a composition of Ba as 38.26%, S as 25.89%, and oxygen as 2.35%. This gave 66.5% of the Ba-S-O empirical composition. The working standard sample showed a much lower element composition empirical percentage indicating that most of the samples will be suitable for drilling purposes [23,24,25,26].
The FTIR technique was used for bond identification for chemical structures in the materials. This is used as a fingerprint for the mineral group identification and information about the structure of the mineral. The FTIR spectra for the samples are shown in Figure 3a,b and supplementary information Figure S2. All samples show several peaks in both fingerprint and functional regions which are comparable to the working standard material (WS). There are strong peaks at 600, 1059, 1197 cm−1 wavenumber in the fingerprint region and 1640, 2047, and 3468 cm−1 wavenumber in the functional region. The peaks at 600 cm−1 with strong transmittance indicate the Ba-S-O polyhedral stretching which is the sheet structure of barite minerals. The peak at 1059 cm−1 demonstrates the triple asymmetric S-O stretching in barite which also indicates the stretching of SO42− tetrahedral. The peak at 1197 cm−1 shows the asymmetric and bond vibration [27]. In the functional region, the samples depicted peaks at different wavenumbers. The peak at 1640 cm−1, which is medium, indicates the stretching vibration of the oxygen group. This is an indication of the S-O bond for the structure. The peak at 2047 cm−1 shows the formation of the Ba-S-O bond stretching vibration in the functional region. This contributes to the empirical structure of barite [28]. The peak formation at 3468 cm−1 indicates the OH stretch which is due to the formation of crystalline structure in the material [27,29]. The peaks in the samples NS and TS are matching with those of the working standard sample. This means that the samples have the same functional groups which match the working standard sample. The sample results are identical to others in the literature [30].
The XRD spectra for all the samples are shown in Figure 4. Samples exhibit the main peak at 2θ = 28.75° with d-spacing of 3.102 Å with a plane of (211). Other peaks appeared at 2θ = 26.85° with d-spacing of 3.32 Å and plane of (102), at 2θ = 25.8° and d-spacing of 3.44 Å and plane of (210), and 2θ = 42.89° with d-spacing of 2.10 Å and plane of (112). The XRD data revealed a structure formation with a phase of BaSO4 in the chemical form of Ba4S4O16 and the calculated density of 4.47 g/cm3. Sample NS exhibited different peaks at slightly no difference in position from other samples with a peak from 2θ = 25.86° with d-space of 3.44 Å and plane of (210), the main peak at 2θ = 28.75° with d-spacing of 3.10 Å and plane of (211) same as other samples. Other peaks appeared at 2θ = 26.85° with d-spacing of 3.32 Å and plane of (102) also at 2θ = 31.54° with d-spacing of 2.83 Å with a plane of (112) for all the samples. The samples also revealed a structure formation with a phase of BaSO4 and the same chemical form of Ba4S4O16 and the calculated density of 4.47 g/cm3. XRD peaks of the crude Barite powder, which indicates peaks corresponding to Barite with chemical formula BaSO4 on ICPDS card number 00-024-0020 [16,29,30].
The working sample (WS) depicted the main peaks at 2θ = 28.737° with d-spacing of 3.104 Å and a plane of (211) as the main peak. Other peaks appeared at 2θ = 25.841° with d-spacing of 3.445 Å and plane of (211), 2θ = 26.837 with d-spacing of 3.319 Å and plane of (102), 2θ = 31.522° with d-spacing of 2.836 Å and plane of (112), 2θ = 32.797° d-spacing of 2.729 Å and plane of (020), 2θ = 42.871° with d-spacing of 2.11 Å. The main peaks in the working sample at 2θ of 28.737, 25.841, 26.837, 32.797, and 42.871° match with the main peaks in the samples. This means that the samples have the same composition which was also shown by FTIR results (Figure 3a,b). The amount of barium sulphate shown by the chemical analysis revealed that the tested local barite samples are following the API requirements for barite [12,30].
The samples were further analyzed by EDXRF as shown in the supplementary information (Figure S3–S10 in Supplementary Materials), show the spectra of a K feldspar and their quantification results as listed in Table 2. All the samples match well the chemical data of the working sample (WS) as shown in other figures in the supplementary information (Figure S3–S10). In general, the mineral distribution maps of both classifications of the samples correspond well with that of the working sample in the spectra intensity, position, and composition. Texture and grain structures of samples’ complex intergrowth are noticeably well in the monographs. A few variances can be found in details of the other trace elements which were able to be detected in the microstructures such as micro-perthitic intergrowth in sample WS and other samples. This was due to the smaller beam diameter and the crushing limitations to a few micrometers.
The specific gravity of the samples was determined and the results are shown in Table 3 for all the samples from different mining sites. In reference to the American Petroleum Institute (API) standard specification of not less than 4.15, barite is used to increase the apparent density of a liquid drilling fluid system. Most of the samples showed higher SG apart sample TS, NS, and Azara vein 18 with lower SG than the API standard. This makes barite [BaSO4] the most common weighting agent used today. It is a mined material ground to an API specification such that particle sizes are predominantly in the 3 to 74 µm. The results in Table 3 displayed that the specific gravity (SG) of the samples is higher than that of the working sample. This implies that these samples from the field can be used as a replacement for the working sample.

4. Suitability of Barites for Industrial Applications

As noted earlier, barites can be used in several industries including oil and gas (drilling fluid formulation); healthcare (X-ray, Plaster of Paris, making barium solution for stomach and intestine reflections); construction (paints, blocking emission of gamma-rays through walls in hospitals, power plants, and laboratories); plastic (filler), cosmetics, paper (filler), and rubber industries. The suitability of the barite samples for different industrial applications was evaluated. The samples which were analyzed from selected mining sites have a barite percentage ranging between 30 to 50% of barium content before beneficiation and removal of other impurities. This means that the barite from those different mining sites can be used for preliminary mining activities and other application which require a barite composition in the range of 18 to 34% like kilns, mud drilling, construction, among others [29,30,31]. If the materials are to be used for the main applications, some of the impurities need to be removed which will help to increase the composition percentage of barite. The removal of silica from the samples can increase the purity of the material for applications where silica is not needed [6]. Some impurities are used with barite to improve the properties of the materials as shown in Table 4. All samples can be beneficiated and hence improved for different applications as shown in Table 4 because they have the required chemical constituents. When the unwanted impurities are removed, the percentage composition of barite can be increased to suit the required application. In chemical manufacturing, some samples were eliminated because they lack CaCO3 in their initial composition.

5. Conclusions

The ten barite samples were obtained from different mining locations in the Nasarawa and Taraba states of Nigeria. Their properties were determined and compared with a standard working sample used by an oil industry operator in Nigeria. Using different characterization parameters (SEM-EDX, FTIR, XRD, SG, and physical appearance) exhibiting the molecular structure of BaSO4. The characterization has shown that some (6) of the samples can be used for drilling fluid formulation for the oil and gas industry due to their good specific gravity greater than 4.15 for API. Samples like TS, NS, and Azara vein require beneficiation to reach the standard for oil application due to their low specific gravity. All ten samples can be used for other industrial applications including healthcare, construction, plastic, cosmetics, paper, and rubber industries due to their level of barium content in the range of 30 to 50%. The results of the study are being used to develop beneficiation procedures, actions, and technology along with new materials for industrial applications. Different samples exhibited different colour appearances from white to off-white which be used as filler materials in paint and ceramics as shown in Table S2. These samples will further be purified by the removal of some other mineral content to increase the yield of barium concentration.

Supplementary Materials

The following are available online at https://www.mdpi.com/article/10.3390/min11040360/s1, Figure S1: SEM-EDX morphology and sample element atomic percentages, Figure S2: FTIR Spectra for the barite samples from different mining sites, Figure S3: XRF spectra for barite samples from AZARA VEIN 1, Figure S4: XRF spectra for barite samples from AZARA VEIN 17, Figure S5: XRF spectra for barite samples from AZARA VEIN 18, Figure S6: XRF spectra for barite samples from KEANA, Figure S7: XRF spectra for barite samples from KUMAR, Figure S8: XRF spectra for barite samples from RIBI, Figure S9: XRF spectra for barite samples from SAUNI, Figure S10: XRF spectra for barite samples from WUSE, Table S1: The physical appearance of the samples, Table S2: Mine site location in the Local Government Area.

Author Contributions

The research work was conceptualized by I.O. and administration supervision was done by P.A.O. and A.R.A. The methodologies were acted on by M.K. and I.O. which included: collection, preparations and analysis. Data curation, I.O. and M.K.; Formal analysis, I.O.; Funding acquisition, P.A.O.; Investigation, M.K. and A.R.A.; Methodology, I.O. and M.K.; Project administration, P.A.O.; Resources, P.A.O.; Supervision, A.R.A. and P.A.O.; Writing—original draft, I.O. and M.K.; Writing—review & editing, A.R.A. and P.A.O. All authors have read and agreed to the published version of the manuscript.

Funding

This research was funded by Pan African Materials Institute (PAMI), a regional Centre of Excellence in Materials Science and Engineering in West Africa established under the World Bank (WB) African Centres of Excellence (ACE) program, and hosted by African University of Science and Technology, Abuja, Nigeria. The grant number is AUST/PAMI/2015/5415-NG.

Data Availability Statement

The data presented in this study is contained within the present article.

Acknowledgments

The authors would like to acknowledge the support from the members of the Department of Materials science and Engineering and the entire staff of African University of Science and Technology (AUST) Abuja Nigeria.

Conflicts of Interest

The authors declare no conflict of interest.

References

  1. Ezekwesili, G.E.; Okogbue, C.O.; Chidozie, I.P. Structural styles and ecomic potentials of some barite deposits in the Southern Benue Trough, Nigeria. Rom. J. Earth Sci. 2012, 85, 1. [Google Scholar]
  2. Onwualu, A.; Ogunwusi, A.; Olife, I.C.; Inyang, A. Raw Materials Development for the Transformation of the Manufacturing Sector in Nigeria; Raw Materials Research and Developmen Council: Garki, Abuja, Nigeria, 2013.
  3. Onwualu, A.; Obasi, E.; Olife, I.; Inyang, A. Unlocking the Potentials of Nigeria’s Non-Oil Sector; Raw Materials Research and Developmen Council: Garki, Abuja, Nigeria, 2013.
  4. Olamilekan, A. Overview on the Accelerated Development of the Barite Industry in Nigeria; Raw Materials Research and Developmen Council: Garki, Abuja, Nigeria, 2020.
  5. MJohnson, M.A.C.; Pictak, M.N. Barite (Barium) in Minerals; U.S. Geological Survey: Reston, VA, USA, 2017.
  6. Labe, N.; Ogunleye, P.; Ibrahim, A.; Fajulugbe, T.; Gbadema, S.T. Review of the occurrence and structural controls of Baryte resources of Nigeria. J. Degrad. Min. Lands Manag. 2018, 5, 1207–1216. [Google Scholar] [CrossRef]
  7. Muhammad, A.B.; Kazmia, K.R.; Mehmooda, R.; Ahadb, A.; Tabbassumc, A.; Akram, A. Beneficiation Study on Barite Ore of Duddar Area, District Lasbela. Balochistan Province Pakistan. J. Sci. Ind. Res. Ser. A Phys. Sci. 2017, 60, 9–22. [Google Scholar]
  8. Johnson, C.A.; Piatak, N.M.; Miller, M.M. “Barite (Barium)”. In Critical Mineral Resources of the United States—Economic and Environmental Geology and Prospects for Future Supply; U.S. Geological Survey: Reston, VA, USA, 2017. [Google Scholar]
  9. Singh, R.; Banerjee, B.; Bhattacharyya, J.P.; Srivastava, K.K. Up-gradation of Barite Waste to Marketable Grade Concentrate. In Proceedings of the XXIII International Mineral Processing Congress (IMPC) Mineral Processing Division, National Metallurgical Laboratory, Chicago, IL, USA, 9–12 September 2007; pp. 2303–2307. [Google Scholar]
  10. Ariffin, K.S. Barite (BARIUM). Miner; EBS 425; Perindustrian: Hyderabad, India, 2016; Volume 1. [Google Scholar]
  11. Al-Awad, M.N.; Al-Qasabi, A.O. Characterization and Testing of Saudi Barite for Potential Use in Drilling Operations. J. King Saud Univ. Eng. Sci. 2001, 13, 287–298. [Google Scholar] [CrossRef]
  12. Oden, M.I. Barite Veins in the Benue Trough: Field Characteristics, the Quality Issue and Some Tectonic Implications. Environ. Nat. Resour. Res. 2012, 2, 21. [Google Scholar] [CrossRef] [Green Version]
  13. Duru, U.I.; Kerunwa, A.; Omeokwe, I.; Uwaezuoke, N.; Obah, B. Suitability of Some Nigerian Barites in Drilling Fluid Formulations. Pet. Sci. Eng. 2019, 3, 46. [Google Scholar] [CrossRef]
  14. Abdou, M.; Al-Sabagh, A.; Ahmed, H.E.-S.; Fadl, A. Impact of barite and ilmenite mixture on enhancing the drilling mud weight. Egypt J. Pet. 2018, 27, 955–967. [Google Scholar] [CrossRef]
  15. Bruton, J.R.; Bacho, J.P.; Newcaster, J. The Future of Drilling-Grade Barite Weight Material. In Proceedings of the SPE Annual Technical Conference and Exhibition, San Antonio, TX, USA, 24–27 September 2006. [Google Scholar]
  16. Wellmer, F.-W.; Dalheimer, M.; Wagner, M. Economic Evaluations in Exploration, 2nd ed.; Springer: Berlin/Heidelberg, Germany, 2008. [Google Scholar]
  17. Harneit, J. Umwandlung einer GmbH & Co. KG in eine GmbH. Die Bus. Judgement Rule 2019, 1, 1. [Google Scholar] [CrossRef]
  18. Lar, U.A.; Agene, J.I.; Umar, A.I. Geophagic clay materials from Nigeria: A potential source of heavy metals and human health implications in mostly women and children who practice it. Environ. Geochem. Health 2014, 37, 363–375. [Google Scholar] [CrossRef] [PubMed]
  19. Nikonow, W.; Rammlmair, D. Risk and benefit of diffraction in Energy Dispersive X-ray fluorescence mapping. Spectrochim. Acta Part B At. Spectrosc. 2016, 125, 120–126. [Google Scholar] [CrossRef]
  20. Poonoosamy, J.; Curti, G.; Grolimund, D.; van Loon, L.R.; Mäder, U. Barite precipitation following celestite dissolution in a porous medium: A SEM/BSE and µXRD/XRF study. Geochim. Cosmochim. Acta 2016, 182, 131–144. [Google Scholar] [CrossRef]
  21. Rammlmair, D.; Tacke, K.; Jung, H. Application of new XRFscanning techniques to monitor crust formation in column experiments, Securing the Future. In Proceedings of the International Conference on Mining and the Environment, San Jose, CA, USA, 29 November–2 December 2001; pp. 683–692. [Google Scholar]
  22. Pough, F.H.; Scovi, J.A. A field guide to rocks and minerals. Natl. Audubon Soc. 1996, 2. [Google Scholar]
  23. Ray, F.; Matt, W.; Wayde, M.; Loc, D. Identification of mixite minerals—An SEM and Raman spectroscopic analysis. Mineral. Mag. 2005, 69, 169–177. [Google Scholar]
  24. Janaki, K.; Velraj, G. Spectroscopic studies of some fired clay Artifacts recently excavated at Tiltagudi in Talmilnadu. Recent Res. Sci. Technol. 2011, 3, 89–91. [Google Scholar]
  25. Ramaswamy, V.; Vimalathithan, R.M.; Ponnusamy, V. Synthesis of well dispersed elliptical shaped barium sulphate nano particles water chloroform mixed solvent. Arch. Phys. Res. 2010, 1, 217–226. [Google Scholar]
  26. Dimova, M.; Panczer, G.; Gaft, M. Spectroscopic study of barite from the Kremikovtsi Deposit (Bulgaria) with implication for its origin. Ann. Gologiques Penins. Balk. 2006, 101–108. [Google Scholar] [CrossRef]
  27. Aroke, U.O.; Abdulkarim, A.; Ogubunka, R.O. Fourier transform infrared characterization of kaolin, Granite, Bentonite and barite. ATBU J. Environ. Technol. 2013, 6, 1. [Google Scholar]
  28. Nordstrom, D.K. What was the groundwater quality before mining in a mineralized region? Lessons from the Questa project. Geosci. J. 2008, 12, 139–149. [Google Scholar] [CrossRef]
  29. Nagaraju, A. Effects of barite mine on groundwater quality in Andhra Pradesh, India. Mine Water Environ. 2007, 26, 119–123. [Google Scholar]
  30. Forjanes, P.; Astilleros, J.M.; Fernández-Díaz, L. The Formation of Barite and Celestite through the Replacement of Gypsum. Mineral 2020, 10, 189. [Google Scholar] [CrossRef] [Green Version]
  31. Bhavan, I. Indian Minerals Yearbook-Barytes, 54th ed.; Indira Bhavan: Kerala, India, 2015. [Google Scholar]
Figure 1. Map of Nigeria showing active mining sites for various minerals [18]. The location and local Government area of the mine sites is shown in Table S1 (Supplementary Materials).
Minerals 11 00360 g001
Figure 2. SEM-EDX morphology and sample element atomic percentages.
Minerals 11 00360 g002
Figure 3. (a) FTIR spectra for the barite samples from different mining sites; (b) FTIR spectra for the barite samples from different mining sites.
Minerals 11 00360 g003
Figure 4. XRD spectra for samples from different mining sites.
Minerals 11 00360 g004
Table 1. Energy-dispersive X-ray spectroscopy (EDS) atomic percentage of elements from barite mineral samples from different mining sites.
SamplesEDS Elemental Percentage Composition
BaSOFeAlSiTeCeKLaNb
NS46.7333.551.93 2.535.71.082.55
TS50.3735.631.87 2.66
Azara Vein 151.7343.362.11 2.640.17
Azara Vein 1738.5936.842.88 21.66 0.03
Azara Vein 1834.7931.483.7423.892.23.250.29 0.36
Keana50.1242.753.14 2.21 0.02
Kumar31.3623.824.1828.64 11.680.32
Ribi51.3844.172.59 0.07 1.79
Sauni51.1744.753.94 0.14
Wuse51.4242.582.98 2.05
WS38.2625.892.35 5.77201.121.811.99
Table 2. EDXRF elemental oxide percentage composition of the samples from different mining sites.
OXIDES/ElementsPercentage of Elemental Oxide Composition for Samples
WSNSTSAZARA VEIN 1AZARA VEIN 17AZARA VEIN 18KEANAKUMARSAUNIRIBIWUSE
Fe2O30.1750.3070.0280.1010.2929.760.0280.5530.1650.1020.015
SiO21.8311.8781.1646.7525.03610.111.7092.9890.5924.3551.362
Al2O30.7220.6810.6671.1930.9142.4150.7831.2810.3971.2290.463
MgO1.7310.341.140.180.190.051.690.530.28 1.18
P2O50.0230.05 0.0230.0210.0560.033 0.05
SO317.37.6097.68713.7316.310.8116.6516.5312.316.2913.44
TiO2 6.3536.572
MnO 0.0130.421 0.0140.069
CaO 0.3890.1660.010.0040.113 0.002
K2O0.03001050.0920.0920.0480.4960.0290.0550.0150.1160.008
CuO0.0020.0010.0010.0020.0020.0150.0020.0030.0050.0010.003
ZnO 0.001 0.045
Cr2O30.023 0.030.0280.0020.0320.0180.0110.0340.02
PbO0.2810.0060.001 0.001 0.2740.0010.001
Rb2O0.002 0.001 0.0010.002
Cl0.4510.4940.6440.4320.5260.4690.4470.5560.3140.5150.322
BaO30.4518.0418.6226.3231.4224.1832.5731.3222.9431.6424.33
Ta2O5 0.0170.003 0.0030.001 0.002
WO30.312 0.0160.1060.304
SrO2.8550.5464.6874.2583.3092.722.8345.682.6661.4216.148
CeO21.712 1.421.7441.5131.6611.7721.31.6581.234
ThO3 0.0010.0010 0.0010.001
Y2O3 0.0020.0170.002
Nb2O50.0010.0010.0010.0020.0020.0020.0020.002 0.0020.02
SnO2 0.017
Sb2O30.001 0.11 0.0010.0010.001 0.001
Cs 0.1560.055
Table 3. The specific gravity of samples from different mining sites.
SampleSpecific Gravity (g/cm3)
SAMPLE TS4.0087
SAMPLE NS3.8122
AZARA VEIN 14.2138
AZARA VEIN 174.3761
AZARA VEIN 184.0106
KEANA4.4052
KUMAR4.4000
RIBI4.4200
SAUNI4.3800
WUSE4.4000
WORKING SAMPLE (WS)3.6001
Table 4. American Petroleum Institute (API) and American Society for Testing and Materials (ASTM) general specification standards for various uses of barite ores for different industrial applications.
Barite Application(%) BaSO4 Sinimum stdConstituentsSpecific Gravity Minimum std (g/cm3)Study Samples Suitable for Application after Purification
Oil well drilling90 4.15All samples apart from TS
Chemical manufacturing97SiO2, CaCO3, Al, Fe4.0NS, TS, Azara 1, Azara 17, Azara 18, Ribi
Paint manufacturing95 4.45All samples
Glass90–96SiO2, Al, Fe All samples
Pharmaceuticals97Fe2O3, SiO2, Al2O3 All samples
Rubber99.5SiO2 All samples
Asbestos products90Fe2O3, SiO2, Al2O3 All samples
Plastering95SiO2, Al2O3 All samples
Cement95SiO2 All samples
Publisher’s Note: MDPI stays neutral with regard to jurisdictional claims in published maps and institutional affiliations.

