Article

Study on Chromaticity Removal from Mineral Processing Wastewater with Salicylic Hydroxamic Acid by Granular Activated Carbon Catalyzed Ozonation

School of Chemical and Environmental Engineering, China University of Mining and Technology-Beijing, Beijing 100083, China
*
Author to whom correspondence should be addressed.
Minerals 2021, 11(4), 359; https://doi.org/10.3390/min11040359
Submission received: 23 February 2021 / Revised: 22 March 2021 / Accepted: 26 March 2021 / Published: 30 March 2021
(This article belongs to the Section Mineral Processing and Extractive Metallurgy)

Abstract

:
Salicylic hydroxamic acid is a novel flotation reagent used in mineral processing. However, it impacts the flotation wastewater leaving behind high chromaticity which limits its reuse and affects discharge for mining enterprises. This study researched ozonation catalyzed by the granular activated carbon (GAC) method to treat the chromaticity of the simulated mineral processing wastewater with salicylic hydroxamic acid. The effects of pH value, ozone (O3) concentration, GAC dosage, and reaction time on chromaticity and chemical oxygen demand (CODCr) removal were discussed. The results of individual ozonation experiments showed that the chromaticity removal ratio reached 79% and the effluent chromaticity exceeded the requirement of reuse and discharge when the optimal experimental conditions were pH value 3, ozone concentration 6 mg/L, and reaction time 40 min. The orthogonal experimental results of catalytic ozonation with GAC on chromaticity removal explained that the chromaticity removal ratio could reach 96.36% and the chromaticity of effluent was only 20 when the optimal level of experimental parameters was pH value 2.87, O3 concentration 6 mg/L, GAC dosage 0.06 g/L, reaction time 60 min respectively. The degradation pathway of salicylic hydroxamic acid by ozonation was also considered based on an analysis with ultraviolet absorption spectrum and high-performance liquid chromatography (HPLC).

1. Introduction

Tungsten ore is one of the dominant mineral resources in China, its production, consumption, and foreign trade exports rank first in the world. The identified reserves of tungsten ore in China were increased from 5516 million tons in 2007 up to 10,715 million tons by the end of 2018. According to relevant statistics, the water consumption of the flotation process is 4–7 m3/t raw ore, the water consumption of the gravity separation process is 6–15 m3/t raw ore. Mineral processing wastewater is the most important source of wastewater in China, which accounts for about one-tenth of industrial wastewater.
In the application of tungsten mineral processing reagents, anionic collectors, amphoteric collectors, cationic collectors, and non-polar collectors are the four most commonly used tungsten collectors [1,2]. Salicylic hydroxamic acid is a kind of chelating collector with high selectivity to metal oxide ore, it has been applied in the mineral processing of tungsten molybdenum ore, rare earth ore, nonferrous metal ore, and other oxide ores, and it is becoming a research hotspot of new oxide ore collectors [3,4].
In practical engineering, the wastewater produced by mineral processing enterprises is mainly removed by coagulation and sedimentation, part of the effluent is reused in the mineral processing production, the remaining wastewater enters into the tailing reservoir for subsequent reuse or external discharge through natural light degradation and natural sedimentation [5,6]. With the natural light degradation, residual mineral processing agents in the wastewater can be decomposed to a chromogenic substance resulting in the color of the mineral processing wastewater, and with the extension of natural light degradation time, the chromaticity gradually increases. Chromaticity is a problem of color in wastewater, which, together with the odor problem, is more easily perceived by other people. High color wastewater discharged into the water would affect the photosynthesis of algae and seriously threaten the ecological environment.
Coagulation is one of the most commonly used methods to remove chromaticity from wastewater, which has the advantages of low treatment cost, small occupied area, and a large throughput [7,8]. Li et al., treated actual wastewater from the secondary sedimentation tank of a coal chemical enterprise, the chromaticity removal ratio was 61.62% with a polyaluminium chloride (PAC) dosage of 350 mg/L and a polyacrylamide (PAM) dosage of 2.0 mg/L [9]. Verma et al., concluded that among the chemical coagulation and flocculation technologies, comparatively, pre-hydrolyzed coagulants such as PAC, polyferric chloride (PFCl), polyferric sulfate (PFS), and polyaluminum ferric chloride (PAFCl) might be considered as the better coagulants because of their superior color removal even at small dosage and availability at a wider pH range of wastewater. Ferrous sulfate may also be considered as a better coagulant over other hydrolyzing metallic salts [10] but the effluent on the coagulation process alone makes it difficult to meet the primary standard requirement of chromaticity 50 in the comprehensive discharge standards of China [11].
Chemical oxidation is a well-studied and mature method of chromaticity removal at present [10]. Chlorine oxidation can be used to remove a variety of organic compounds in wastewater, decolorization, deodorization, and sterilization [12]. The chlorine oxidation method has the advantages of high oxidation efficiency, simple operation, and high decolorization ratio, but it also has the disadvantages of strong corrosion, high chloride ion concentration in wastewater, and high toxicity of intermediate products [13].
Fenton reaction is one of the commonly used advanced oxidation processes (AOPs), which has the advantages of high safety, simple equipment, and low cost, but there is a problem of secondary pollution caused by a large amount of iron sludge [14,15]. Değermenci et al., researched decolorization of Drimaren Orange High Fast (DOHF) reactive azo dye from aqueous solutions with the Fenton oxidation process, the results showed that with the optimal conditions of 30 °C temperature, pH 3, 300 mg/L DOHF concentration, 15 mg/L Fe(II) and 100 mg/L H2O2, the chromaticity removal presented very good results [16]. Nurbas et al., performed the Fenton oxidation process on a laboratory-scale setup to decolorize the water samples containing azo dyes like Acid Red 88, under the optimal conditions, the efficiency of decolorization was about 99%, but the dosages of H2O2 and Fe2+ were large, the pH value was lower to 2 [17].
Ozone oxidation can be decomposed in wastewater to produce a variety of free radicals, which has significant effects on improving the flocculation effect, decolorization, sterilization, and degradation of refractory organic matters [18,19]. The main advantages of ozone oxidation are rapid reaction and no secondary pollution. Xu et al., used the multi-phase catalytic ozonation technology to treat the secondary biochemical effluent of dyed wastewater, with the chromaticity removal ratio up to 95% under the optimal operating conditions [20]. Zheng et al., used ozone oxidation to treat the secondary biochemical effluent of a municipal wastewater treatment plant, when the ozone dosage reached 6 mg/L, the chromaticity removal ratio was about 73% [21]. The major disadvantage of using ozone, however, is certainly the possible formation of toxic by-products starting from the biodegradable substances contained in the wastewater.
Adsorption is also one of the commonly used methods for chromaticity removal in wastewater treatment with many advantages such as simple operation, high efficiency, environmental friendliness, and reusable adsorbent [22,23]. Activated carbon (AC) is one of the most commonly used adsorbents, which has the characteristics of high adsorption capacity, large surface area, and many pores. But the costs related to the regeneration of the AC are high.
Using homogeneous or heterogeneous catalysts is one of the possible opportunities for accelerating ozonation reactions. Some researchers found that AC combined with ozone oxidation could enhance the decolorization or pollutants removal effect, with AC playing two roles of adsorption and catalysis [24,25].
At present, there is little research on AOPs applied in the chromaticity of salicylic hydroxamic acid wastewater from mineral processing. The main aim of the present work was to study the factors affecting the chromaticity removal ratio of mineral processing wastewater with different methods such as AC adsorption, ozone oxidation, and AC catalyzed ozonation. This study also focused on and provided a reference for a practical treatment project of salicylic hydroxamic acid wastewater from tungsten mineral processing.

2. Materials and Methods

2.1. Materials

2.1.1. Preparation of Experimental Wastewater

The wastewater used in this experiment was prepared based on the investigation of the effluent characteristics from the tailing reservoir of a tungsten ore dressing plant in Hunan Province. It was convenient to change certain factors with simulated wastewater and find out the common solution of this kind of flotation wastewater. Meanwhile, it was difficult to study the degradation mechanism of target pollutants due to the complex composition of actual flotation wastewater. The salicylic hydroxamic acid concentration of the simulated wastewater was 100 mg/L, sodium carbonate was added to adjust the pH to 8. The simulated wastewater was sealed after mixing evenly, then exposed to natural light for about 10 days until the chromaticity gradually reached about 600. Salicylic hydroxamic acid in the simulated wastewater would produce salicylic acid, which then could be oxidized to benzoquinone species in sunlight or air, with a resulting yellow-brown in chromaticity.

2.1.2. Chemicals

Commercially sourced salicylic hydroxamic acid and sodium carbonate used in all experiments were purchased from Aladdin (analytical purity, Aladdin Reagent Co. Ltd., Shanghai, China). Potassium hexachloroplatinate and cobalt chloride hexahydrate were purchased from Sinopharm (analytical purity, Sinopharm Group Chemical Reagent Co. Ltd., Shanghai, China). Hydrochloric acid and sulfuric acid were purchased from Beijing Chemical Plant (analytical purity, Beijing Chemical Plant, Beijing, China).
Granular activated carbon (GAC) was obtained from Huayu Activated Carbon Manufacturing Plant in Chengde, China (1.5 mm diameter, 1050 m2/g specific surface area, 800–1100 mg/g iodine adsorption value, and 0.9 cm3/g total pore volume). GAC was screened through a 200 mesh sieve, then thoroughly washed with deionized water, dried at 105 °C (Shanghai Jingqi Instrument Co., Ltd., DHG-9243A, Shanghai, China) for 8 h, and stored in a desiccator until use in catalyzed ozonation experiments.

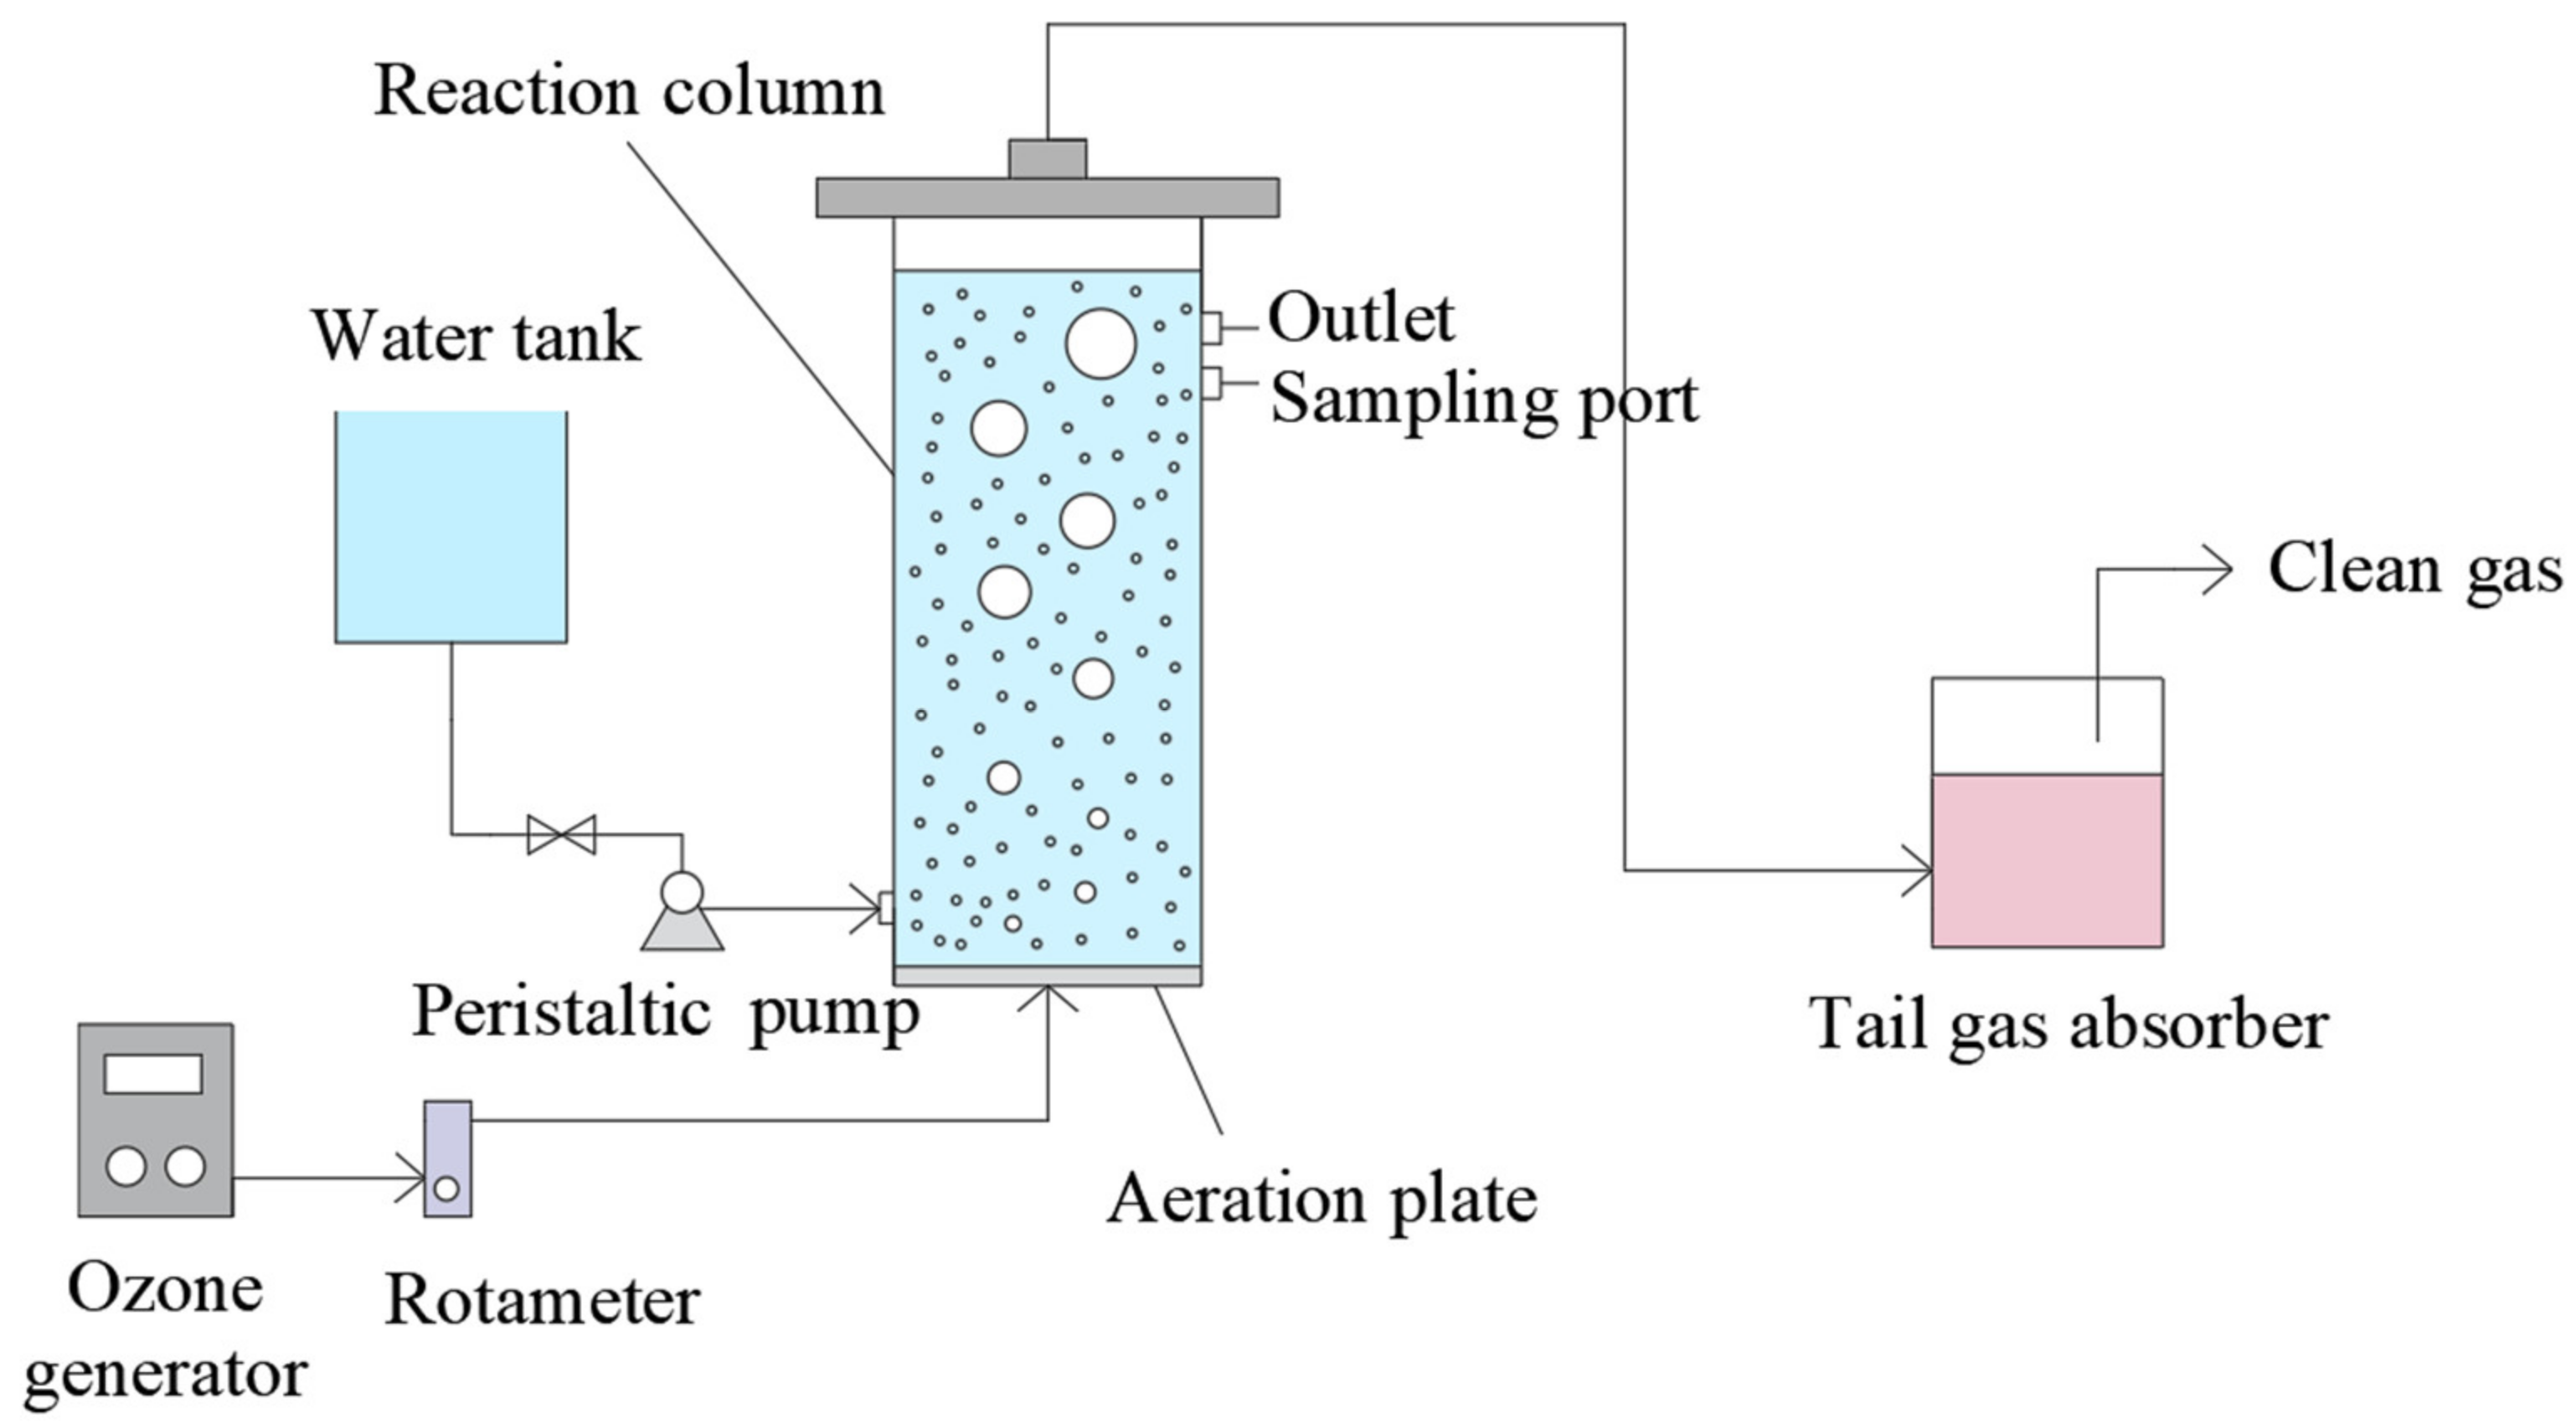
2.2. Experimental Setup

The O3 reaction setup is shown in Figure 1. It was mainly made of high borosilicate glass and an ozone generator (3S-A5, Tonglin Technology, Beijing, China). The height of the reactor was 500 mm, the outer and inner diameter was 70 and 65 mm, respectively, and the effective volume was 1.5 L. The flow rate of O3 gas could be controlled within 100 mL·min−1 in the reactor. The gas distributor in the reactor was a titanium plate with about 20–30% open porosity, and the average pore size of microporous was about 17 μm. The absorption solution of ozone reaction tail gas was KI solution with 1.5 mol/L concentration and 5 L capacity.

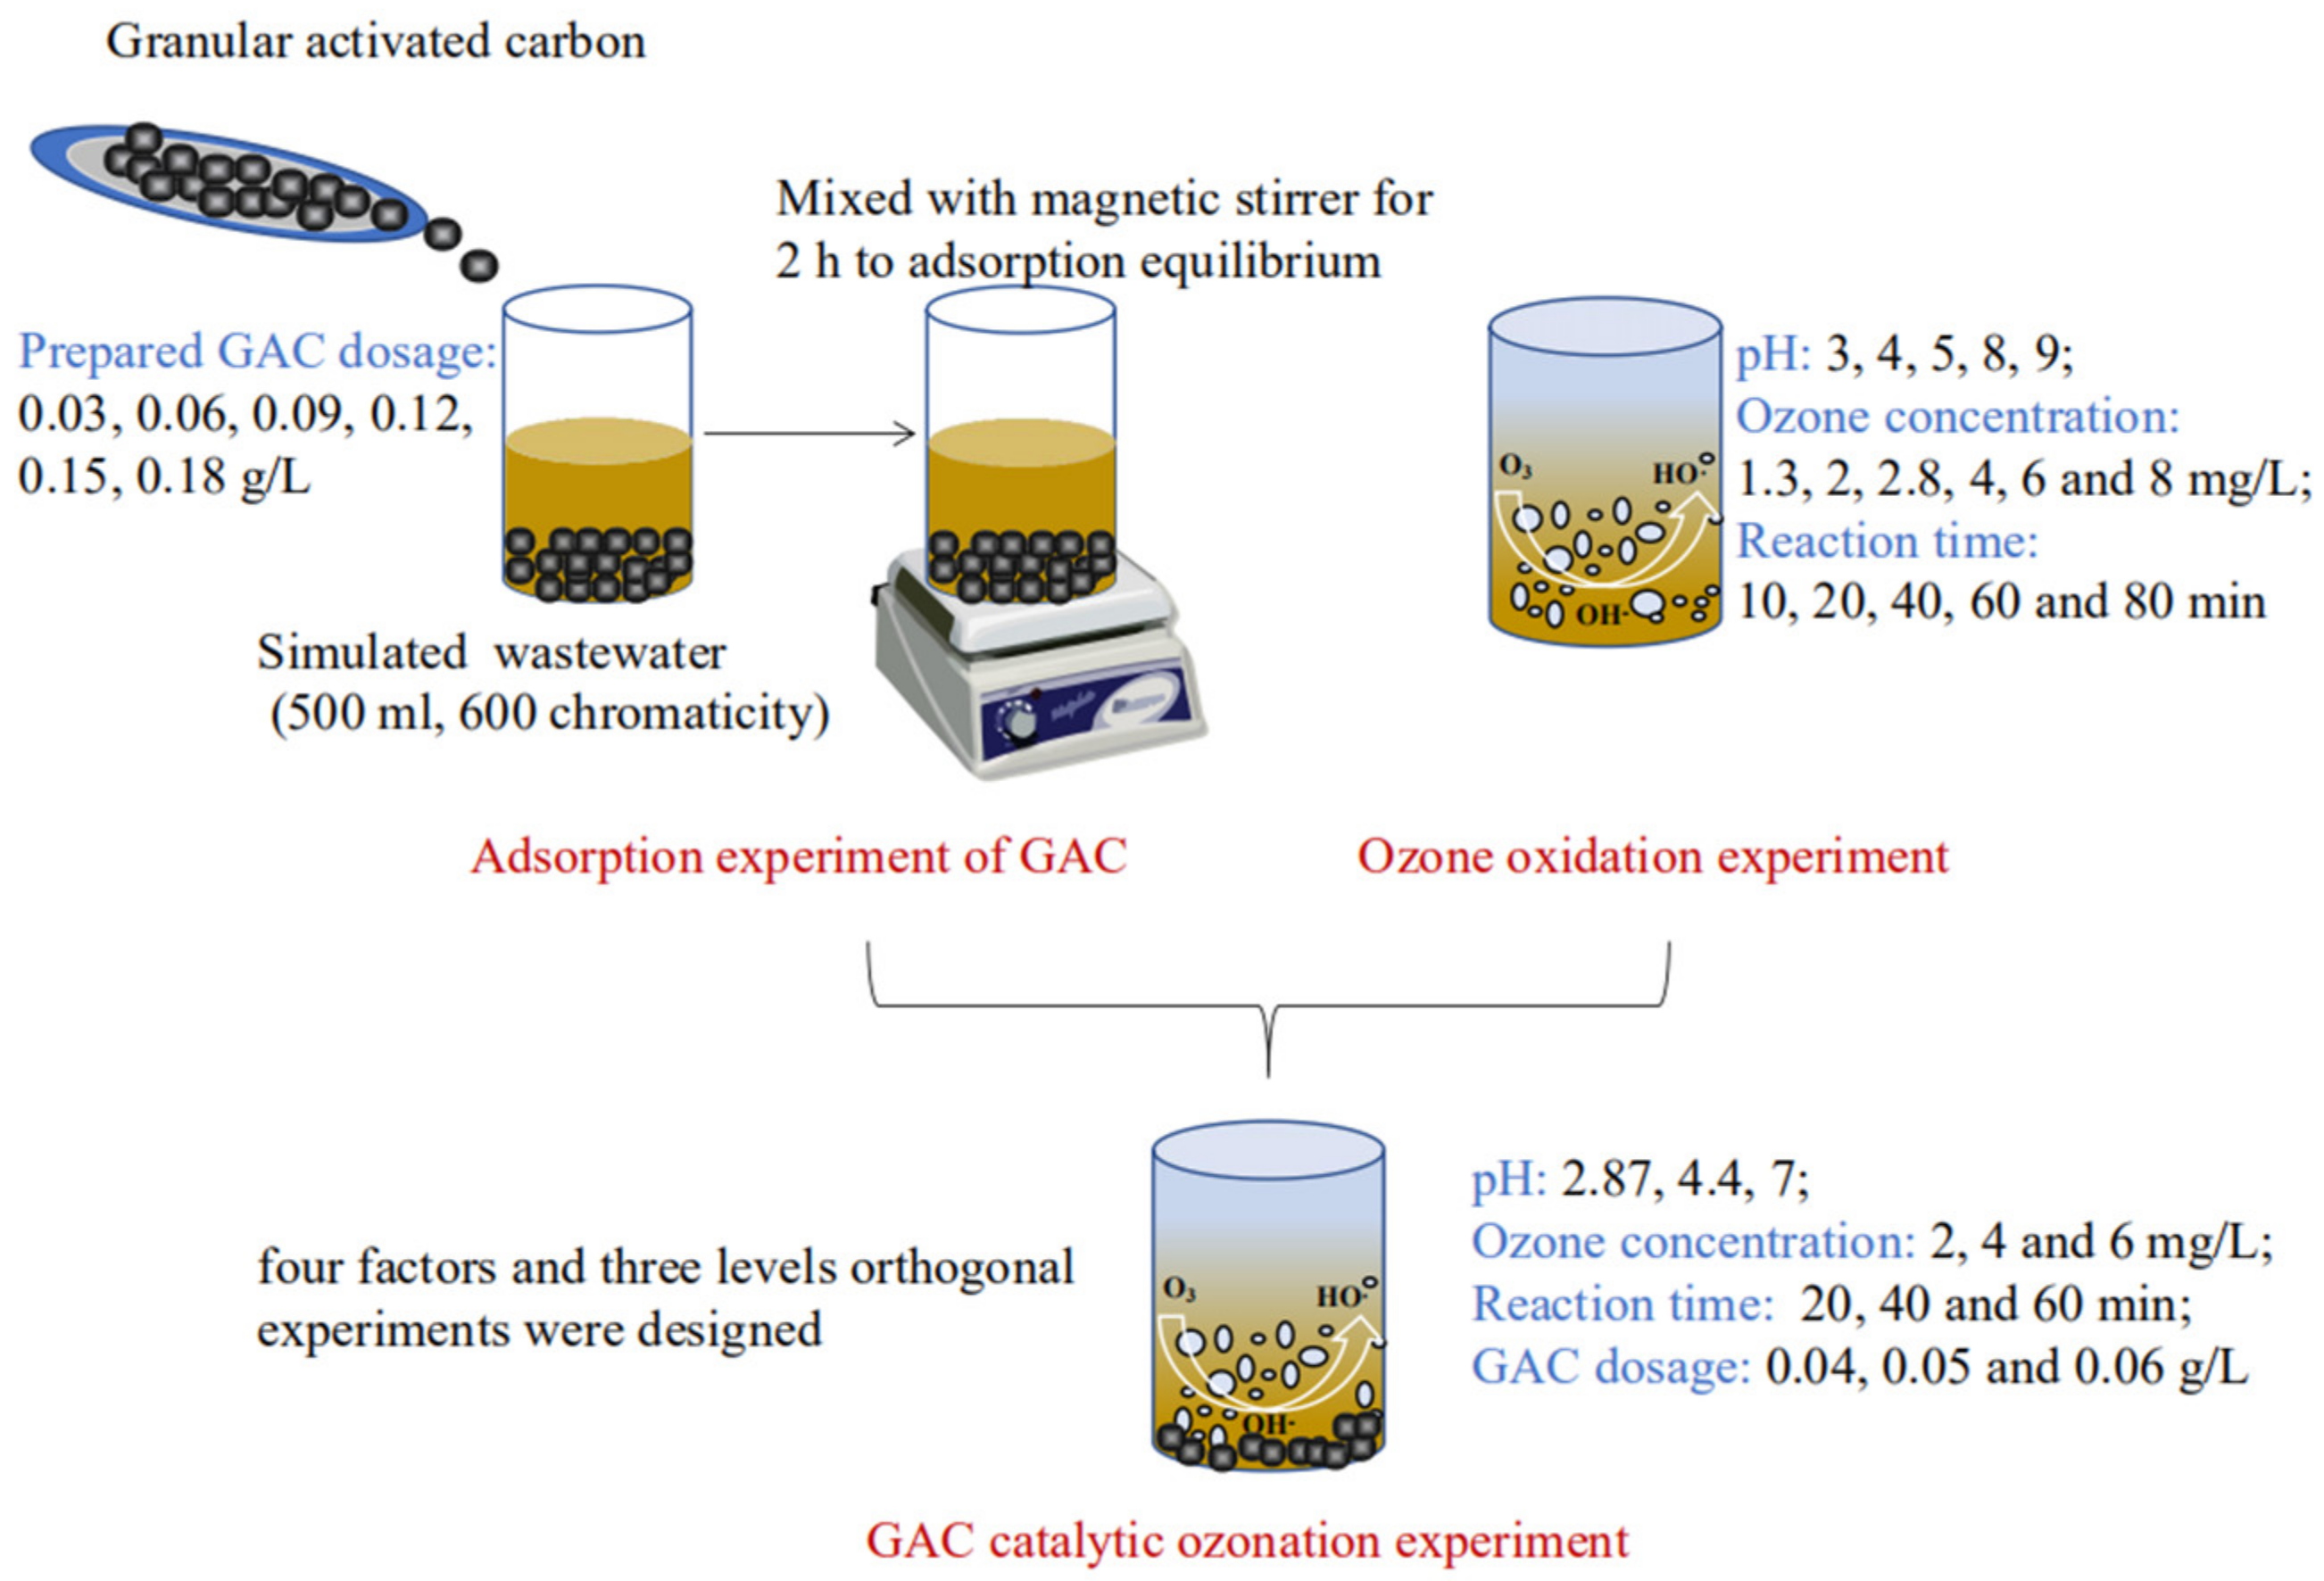
2.3. Experimental Procedure

2.3.1. Adsorption Experiment of GAC

The simulated salicylic hydroxamic acid wastewater 500 mL with chromaticity 600 was sampled and put into the beaker. The prepared GAC dosage 0.03, 0.06, 0.09, 0.12, 0.15, and 0.18 g/L was added into the former solution respectively, then mixed with a magnetic stirrer to adsorption equilibrium, the chromaticity of treated supernatant was analyzed to evaluate the treatment effect.

2.3.2. Ozone Oxidation Experiment

The main influencing factors such as initial pH value, ozone concentration, and reaction time were investigated to analyze the effect on chromaticity. According to the control variable method, individual ozone oxidation experiments were operated through adjusting pH 3, 4, 5, 8, and 9, ozone concentration 1.3, 2, 2.8, 4, 6, and 8 mg/L, and reaction time 10, 20, 40, 60, and 80 min respectively.

2.3.3. GAC Catalytic Ozonation Experiment

Based on the results of the former individual GAC adsorption and ozonation experiments, orthogonal experiments with four factors (pH value, ozone concentration, GAC dosage, reaction time) and three levels were designed to discuss the simulated wastewater chromaticity and CODCr removal effect and determine the optimal experimental parameters.
The flow chart diagram for experimental procedure design with operation conditions is shown in Figure 2.

2.4. Analysis

The chromaticity of simulated wastewater was measured by visual colorimetry (National standard analysis method, GB/T 605-2006), CODcr was characterized with UV-Vis spectrophotometer (UV3000PC, Mapada, Shanghai, China), pH value was performed by pH meter (PHS-3C, Raytheon, Shanghai, China), and O3 concentration was analyzed by iodometry. All the data presented in this study were the mean of triplicate experiments.

3. Results and Discussion

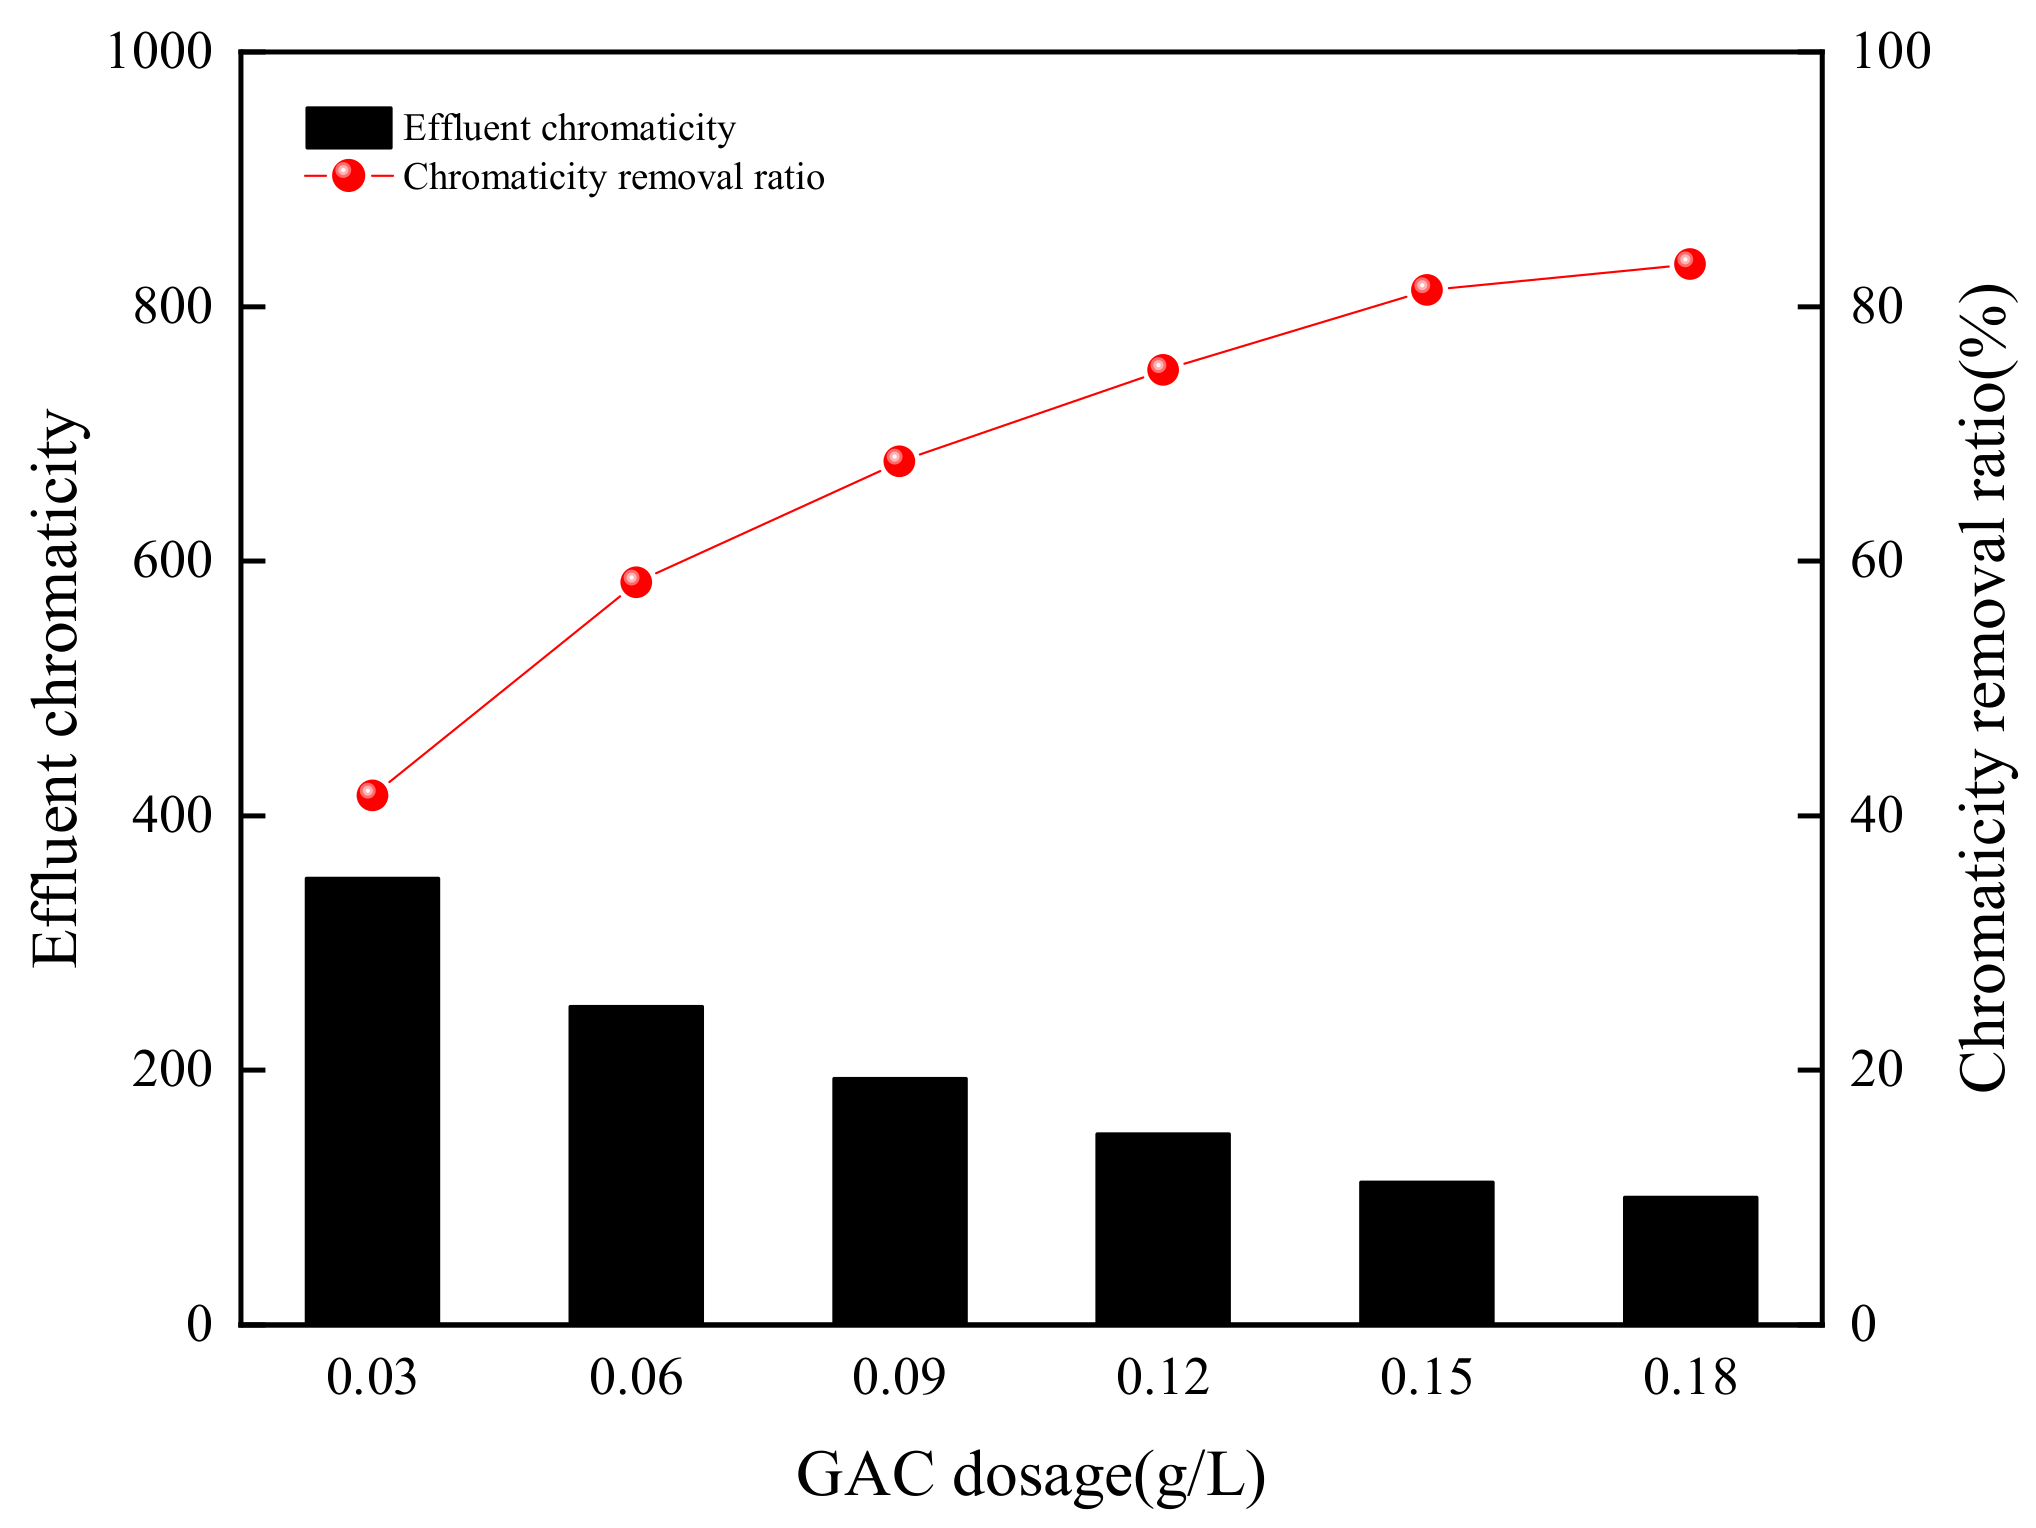
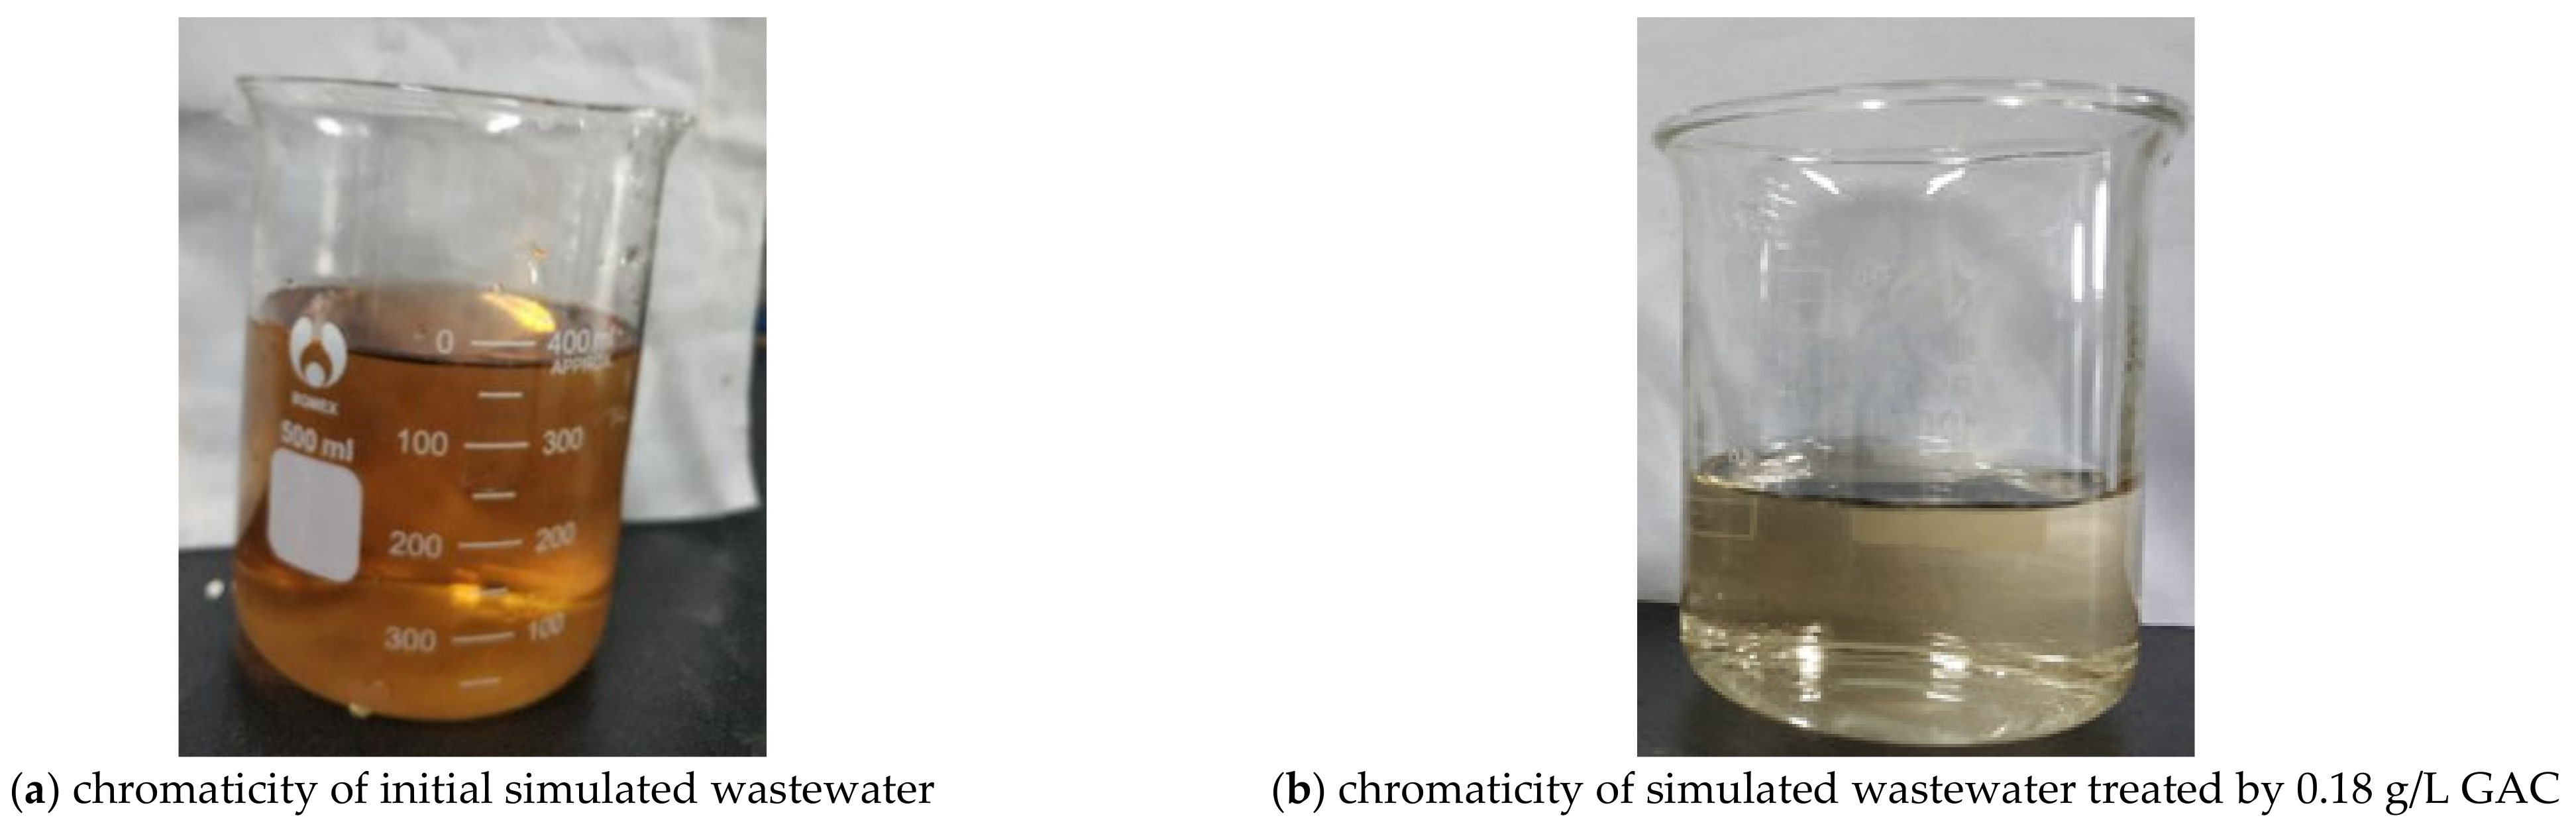
3.1. Effect of GAC Dosage on Chromaticity Removal

In order to explore the effect of GAC adsorption on color removal, the experiments were carried out at various dosages, ranging from 0.03 g/L to 0.18 g/L, initial chromaticity was at a constant value of 600. The effect of GAC dosage on chromaticity removal from simulated wastewater is shown in Figure 3 and Figure 4.
The chromaticity removal increased with GAC dosage increasing when the adsorption time was 2 h, which was enough to reach adsorption equilibrium according to the preliminary experiments. When GAC dosage increased from 0.03 to 0.18 g/L, the chromaticity removal ratio increased from 41.7 to 83.3%, the chromaticity of effluent decreased from 350 to 100. The higher dosage of adsorbent caused greater availability of the surface area and exchangeable binding sites, which had similar results as the previously reported research [26,27]. GAC had a good removal effect on the chromaticity of the simulated wastewater, but the effluent chromaticity could not meet the standard limit requirements of 30 [28]. It showed that the adsorption point had exceeded the required amount when the dosage of GAC was more than 0.15 g/L, and the binding force of chromophores and GAC became the decisive factor of adsorption [29].

3.2. Ozonation Effects of Operation Parameters on Chromaticity Removal
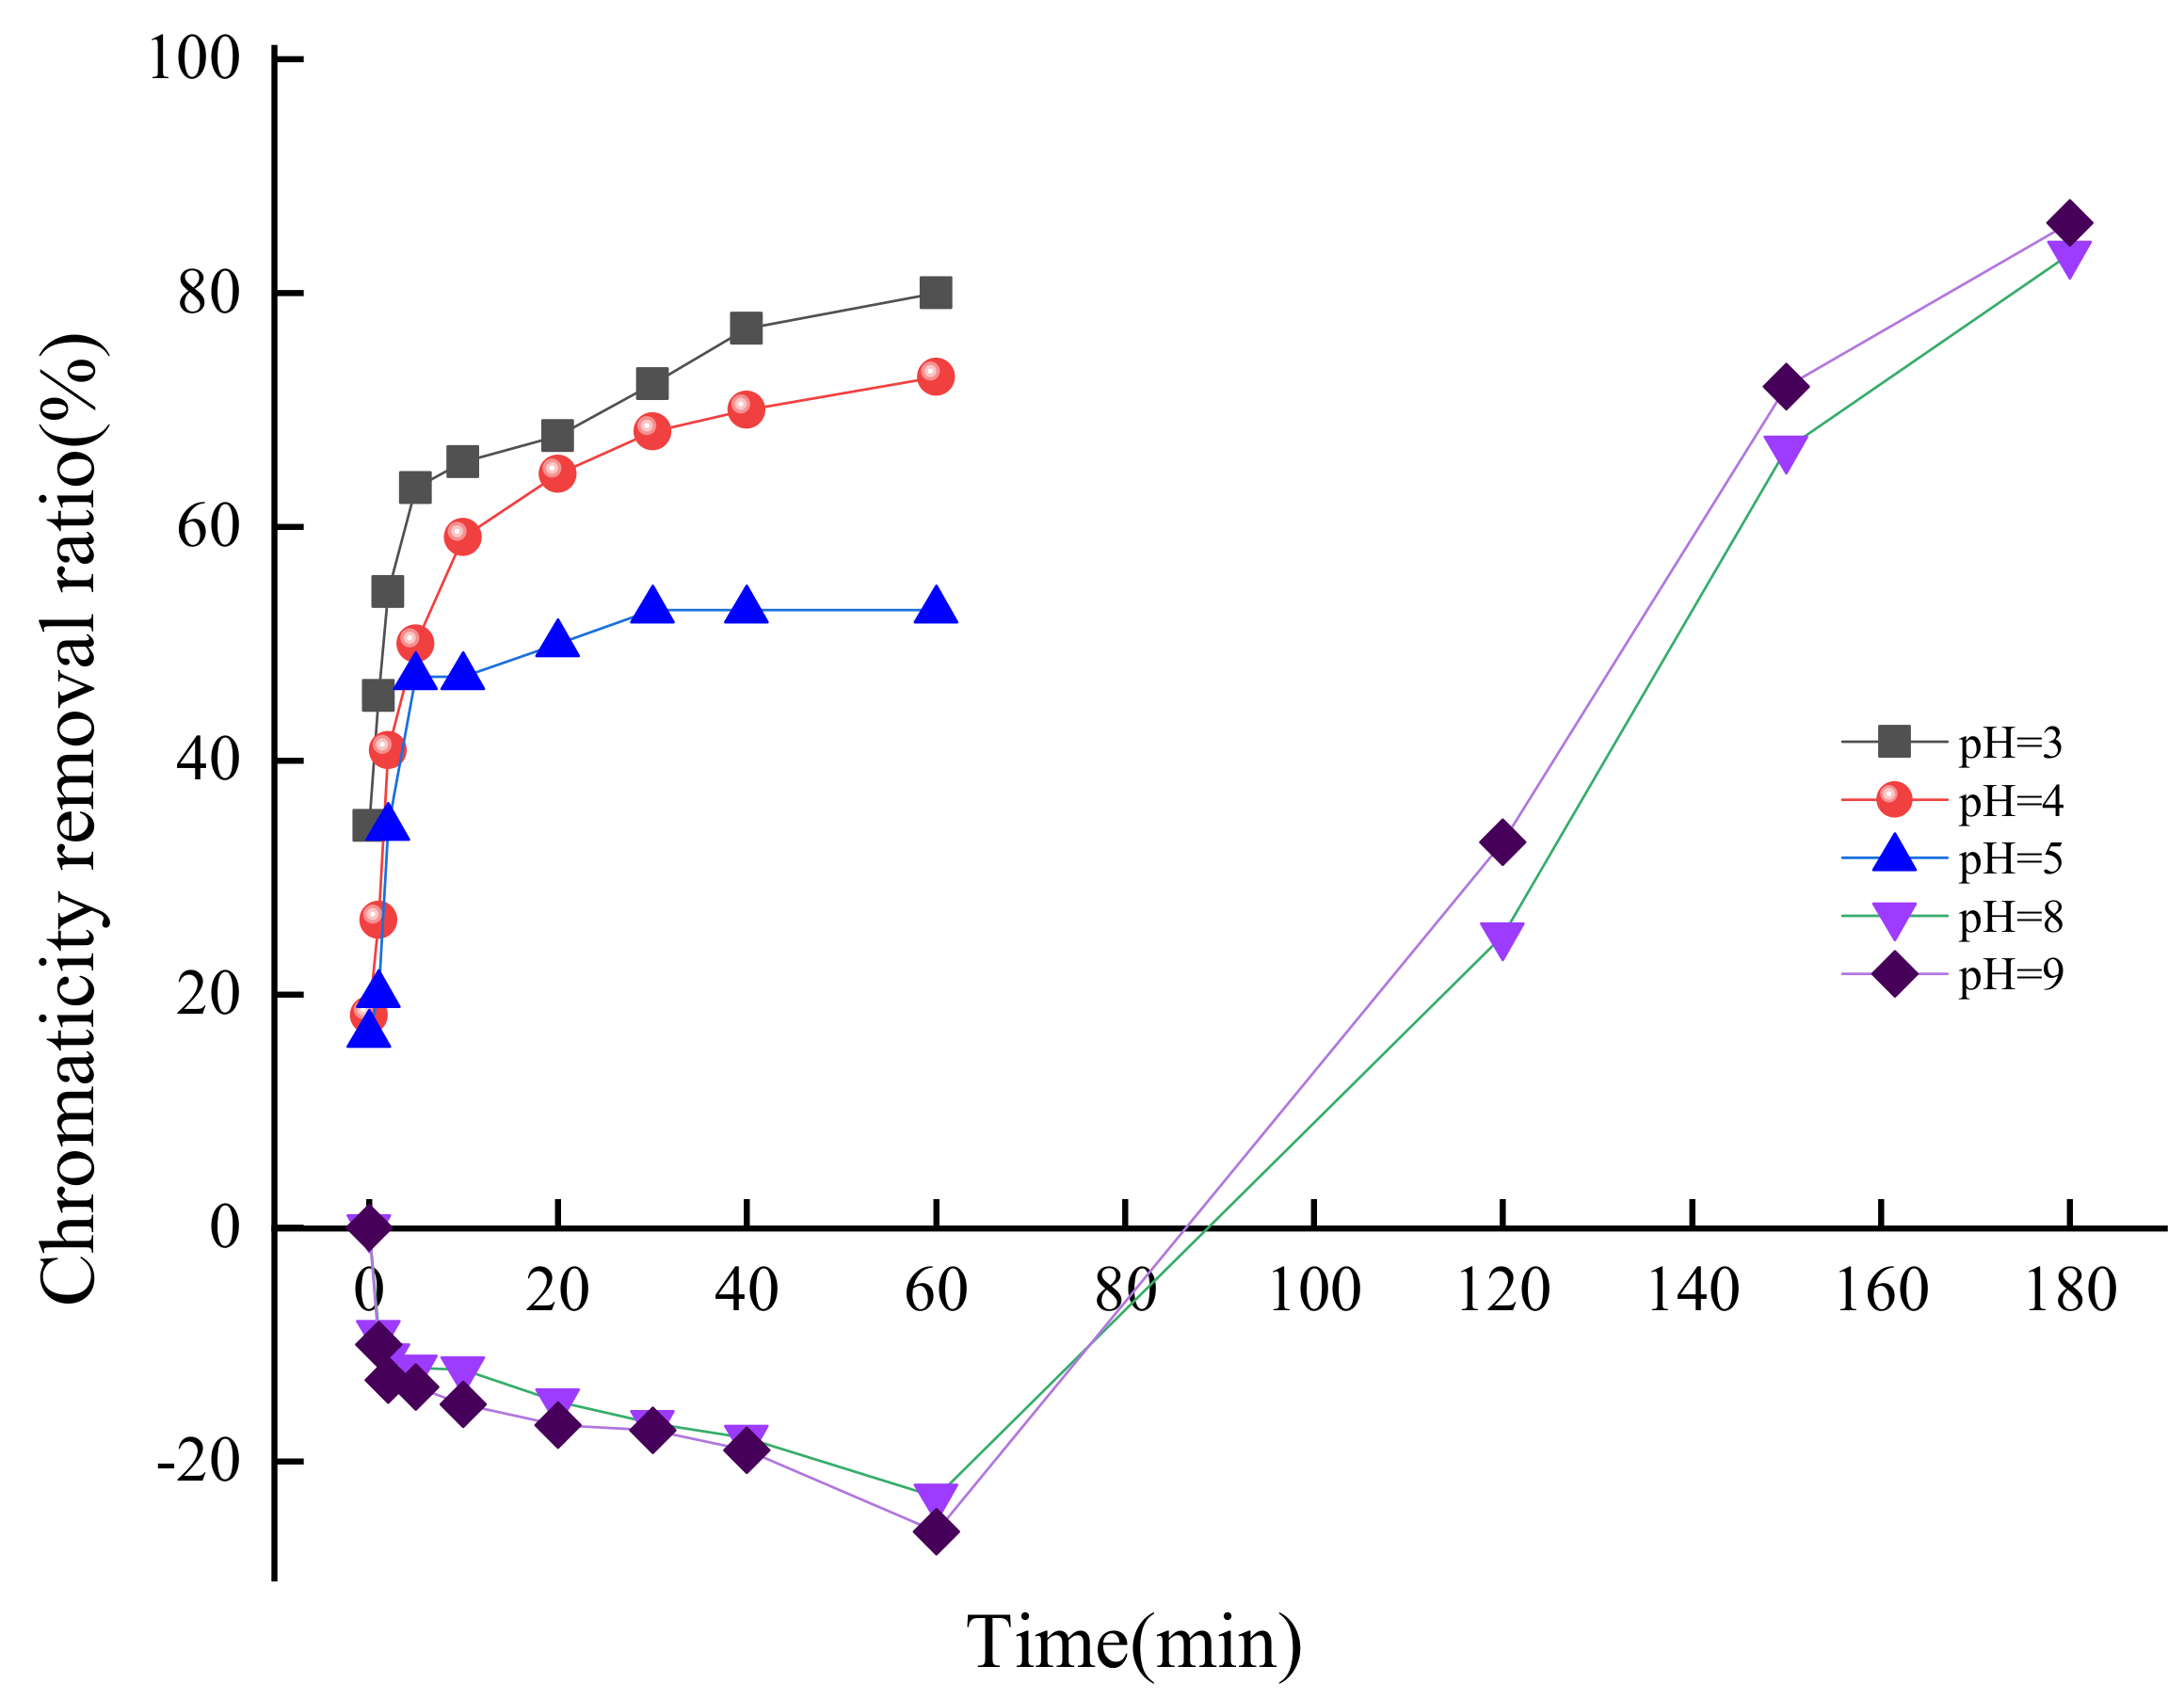
3.2.1. pH Value

The pH value is one of the important influencing factors during the ozonation process. In order to determine the effect of the pH value on chromaticity removal, the pH value varied from 3 to 9 adjusted with sulfuric acid, ozone concentration was 6 mg/L, and samples were taken out for analysis at different reaction times. The results are shown in Figure 5.
Under the acid condition, the chromaticity removal ratio of simulated wastewater increased with the decline of pH value when the reaction time was the same. A low pH value was helpful for o-benzoquinone oxidized by ozone to open the ring resulting in the declined chromaticity [30]. With the extension of reaction time, the chromaticity removal ratio of simulated wastewater increased rapidly within 20 min reaction time, then increased slowly with reaction time further extended to 60 min, which was due to o-benzoquinone rapidly degraded by ozone at the beginning 20 min, then the lower o-benzoquinone concentration reduced the degradation rate. When the pH value was 5 and the reaction time reached 60 min, the chromaticity removal ratio was only 52.8%. Under pH value 3, the chromaticity removal ratio was up to 80%, and the chromaticity of effluent was lower to 120.
Figure 5 demonstrates that changing the pH value of simulated wastewater to acidity without ozone dosage could reduce the chromaticity when the reaction time was 0 min. When the pH value was 3 and the reaction time was 0 min, the chromaticity removal ratio could reach 33.44%, while the chromaticity removal ratio was only 16.57% when the pH value was 5. Sulfuric acid was added to adjust the pH value of simulated wastewater which resulted in a sulfonation reaction with phenol or the reduction of quinone to diphenol with a reducing agent, thus the chromaticity decreased slightly.
Under the alkaline condition, the chromaticity of simulated wastewater increased firstly to about 750 when the reaction time ranged from 0 min to 60 min, thus the chromaticity removal ratio was about −25%. When the reaction time was extended, the chromaticity removal ratio was enhanced rapidly. Under the experimental conditions with a reaction time of 180 min and pH values of 8, 9 respectively, the chromaticity removal ratio could reach 83.3% and 86%. O3 is easier to decompose in an alkaline aqueous solution to produce hydroxyl radical with strong oxidation [31]. Therefore, the salicylic acid and phenolic compounds in the simulated wastewater were oxidized to benzoquinones during the initial 60 min reaction, which resulted in the chromaticity increasing and the chromaticity removal ratio showing negative [32]. Then the produced quinones were oxidized to ring-open, and finally degraded rapidly to other small molecules, thus the chromaticity decreased significantly [33]. According to the reported research results, the pH value affected the decolorization process by affecting the rate of ozone decomposition and ozonation kinetics [34]. The rate of ozone decomposition was favored by the formation of hydroxyl radicals at higher pH values [35]. Thus, the increase of pH value enhanced the chromaticity removal efficiency during the ozonation process.

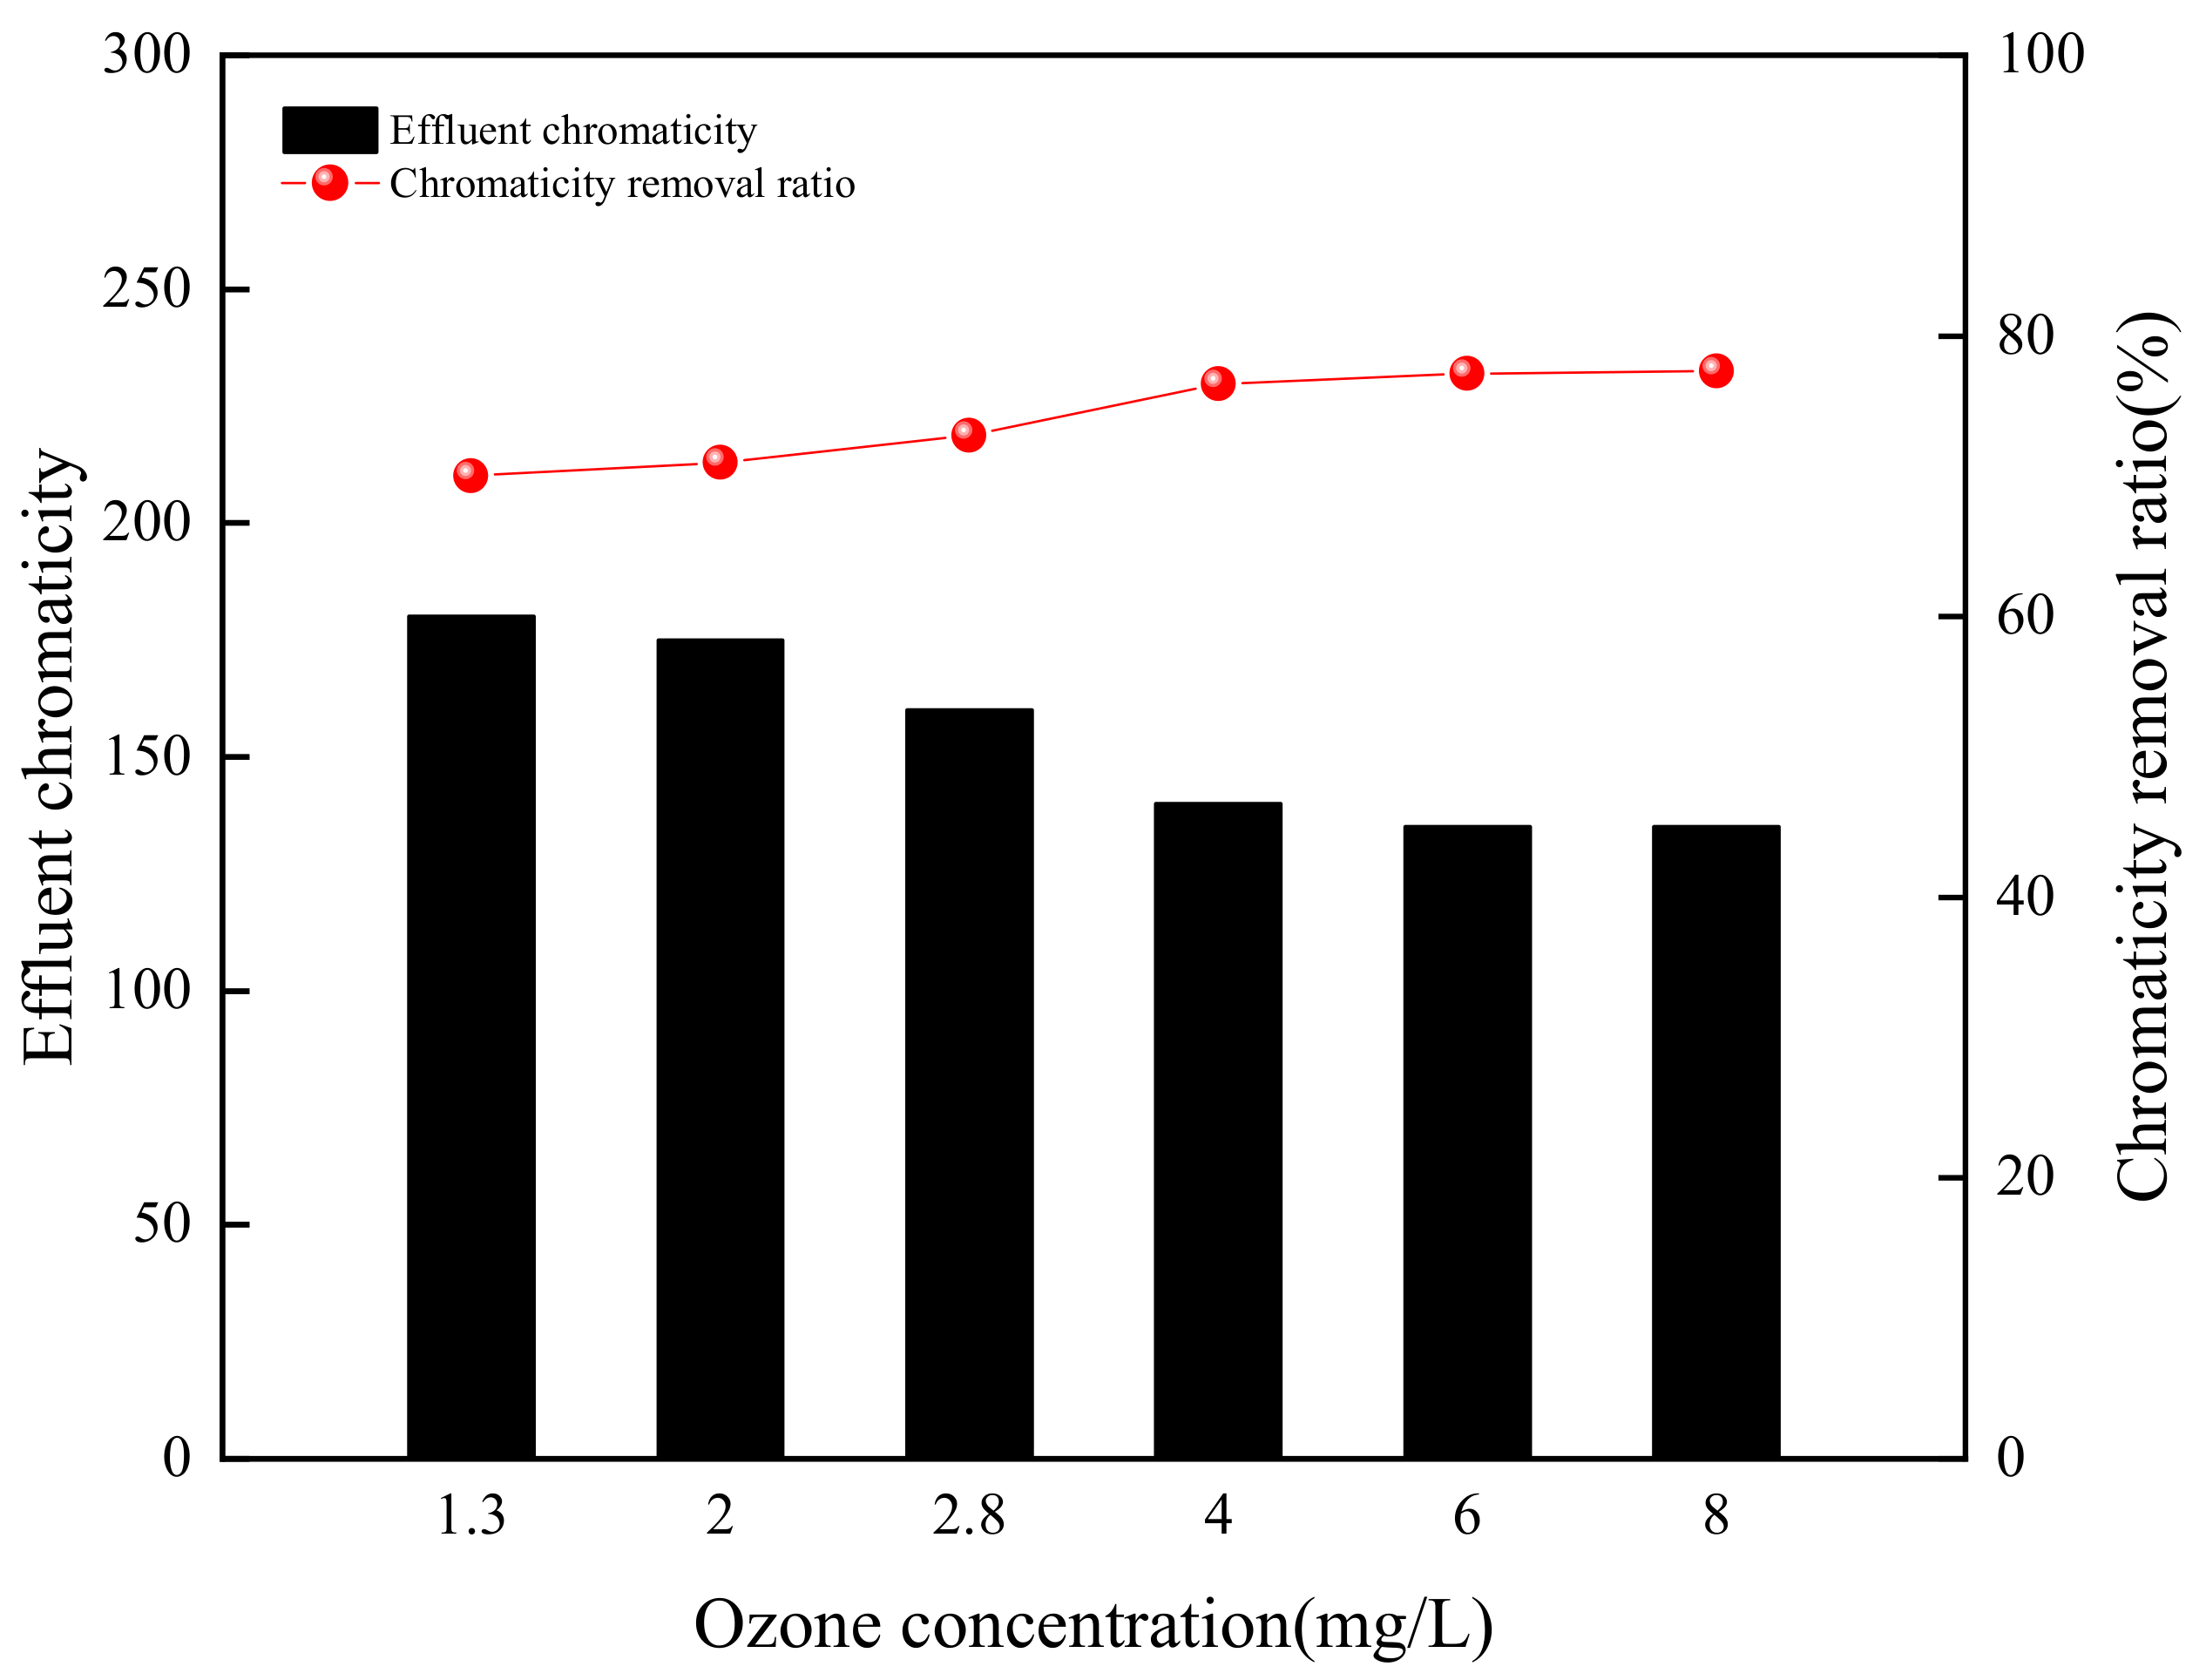
3.2.2. Ozone Concentration

According to the results shown in Figure 5 and considering the energy consumption of the ozonation reaction, a pH of 3 was selected as the optimal value in the following experiments. The effect of O3 concentration on chromaticity removal ratio was conducted in the range of 1.3 to 8 mg/L by maintaining the rest of the operating conditions with a pH value of 3 and a reaction time of 60 min. Figure 6 depicts that the low O3 concentration could rapidly and effectively degrade the chromaticity of simulated wastewater. When O3 concentration was 1.3 mg/L, the chromaticity was reduced from the initial 600 to 180 and the removal ratio was 70%. As the O3 concentration increased to 4 mg/L, the chromaticity was reduced to 140 and the removal ratio was 76.7%. When the O3 concentration further increased to 6 mg/L, the chromaticity removal ratio slightly rose to 77.3%. When the O3 concentration continuously increased to 8 mg/L, the chromaticity removal ratio maintained constant. Under the acid condition, direct ozonation played an important role. O3 was a selective oxidant, which has been suggested to react with aromatic and other electron-rich components of dissolved organic matter by electron transfer reactions, and the amount of O3 exceeded the required quantity for degradation of aromatic and other electron-rich components, the O3 gas overflowed from the wastewater, which led to the O3 ineffectively utilized [36].

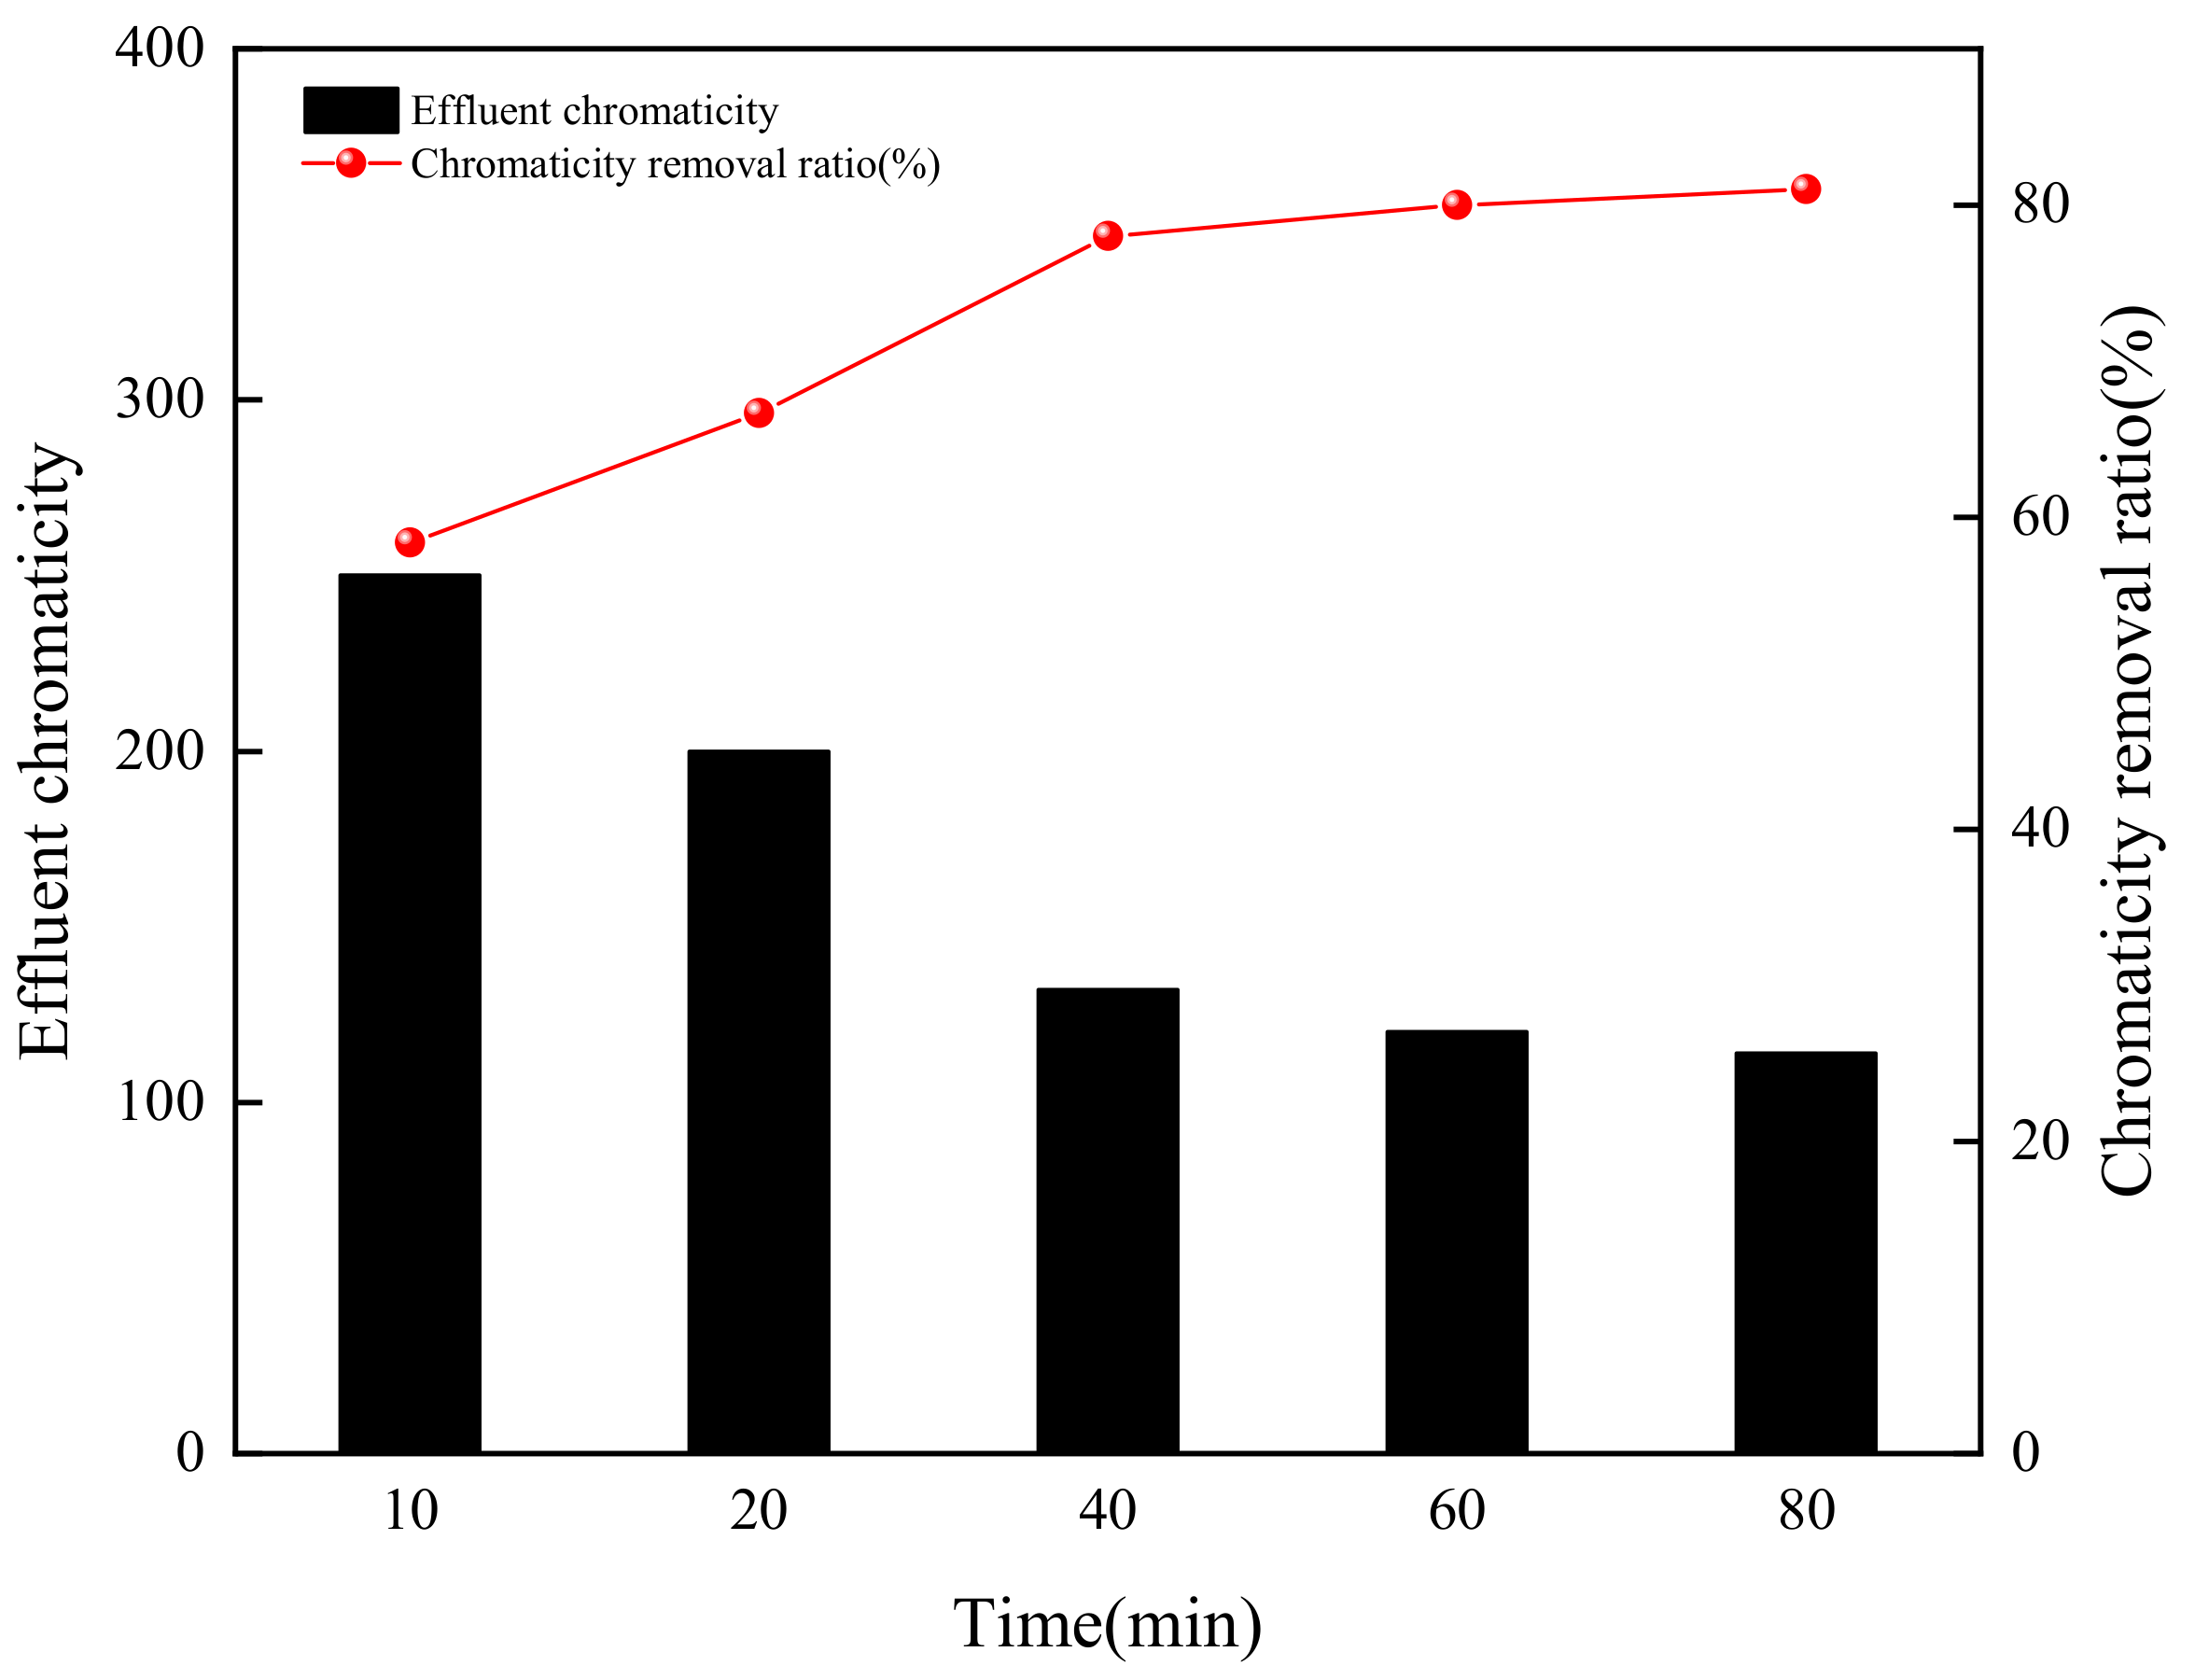
3.2.3. Ozonation Time

The effect of ozonation time on chromaticity removal ratio was operated in the range of 10 to 80 min by maintaining the rest of operating conditions as pH value 3 and ozone concentration 6 mg/L. The experimental results were shown in Figure 7. The chromaticity removal ratio increased with ozonation time in the range of 10 to 40 min. As ozonation time was 40 min, the chromaticity removal ratio was up to 79%. When ozonation time was prolonged to 80 min, the chromaticity removal ratio did not increase, which meant the chromogenic substances such as o-benzoquinone, one of the main degradation intermediates and chromogenic substances, could mostly be degraded to catechol and maleic acid within 40 min, the byproducts were similar to that reported in the literature [37].

3.3. Catalytic Ozonation Effects on Chromaticity Removal
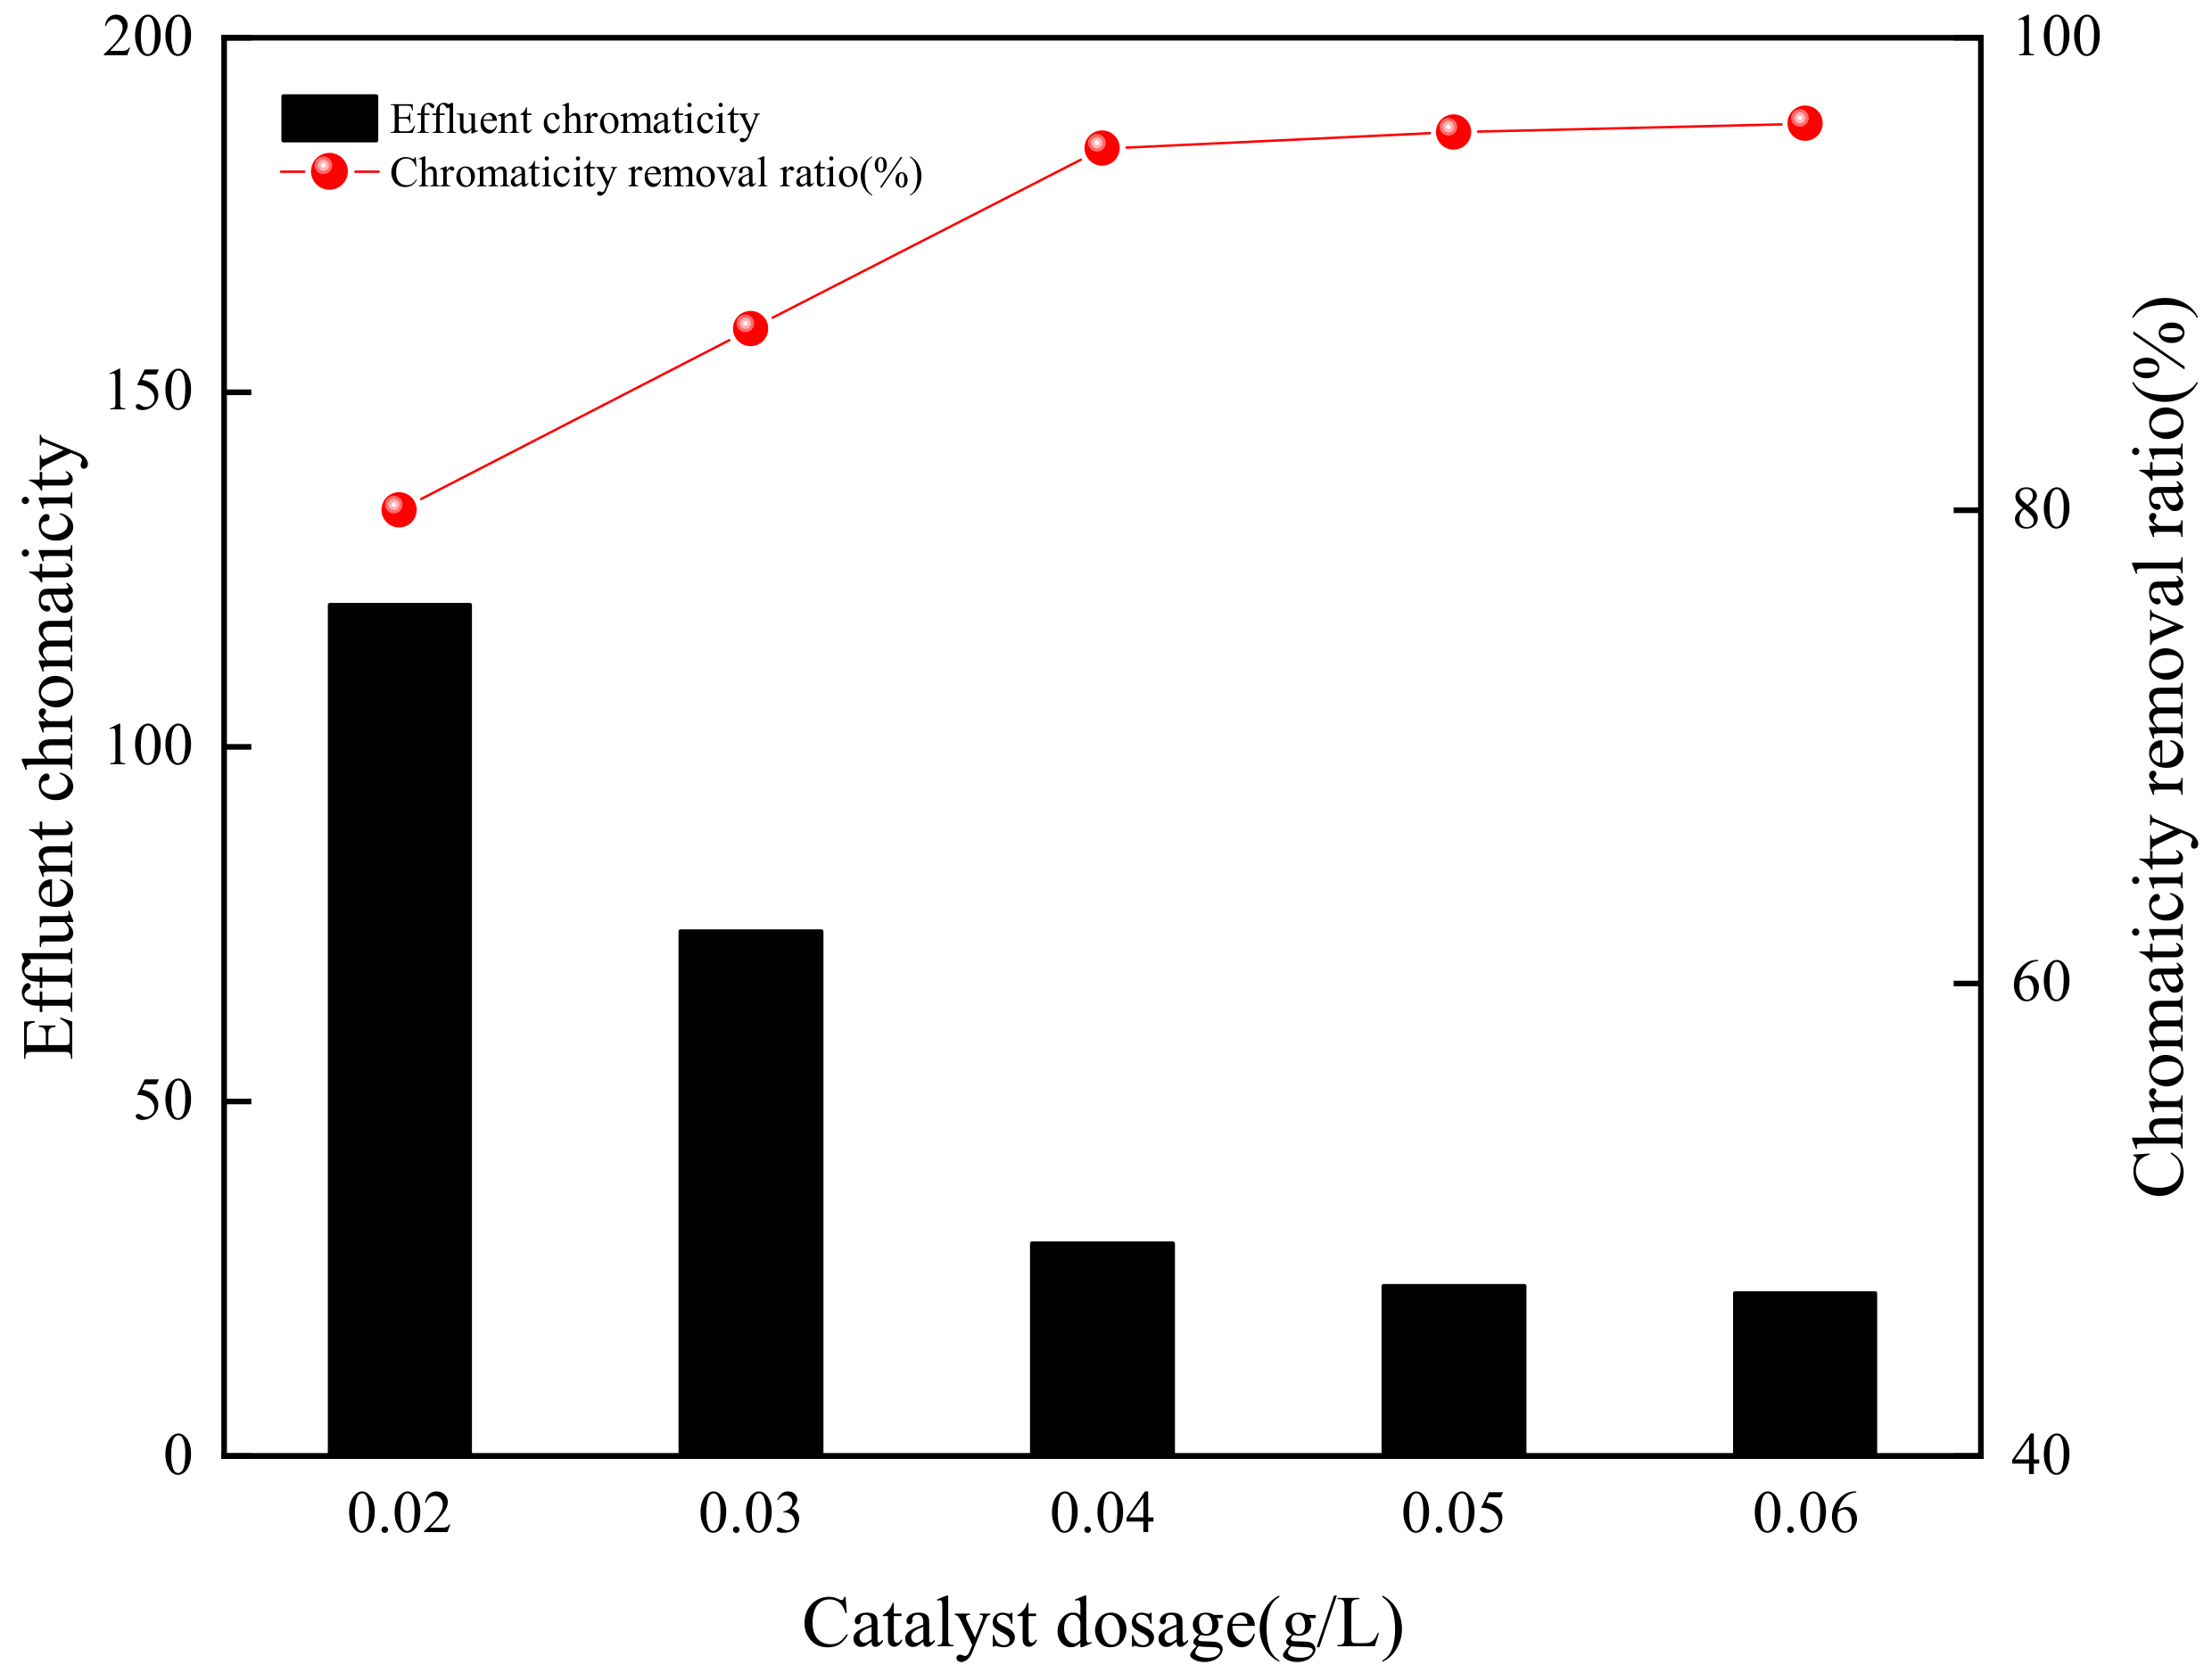
3.3.1. GAC Dosage

According to the results of the individual GAC adsorption experiments (Section 3.1) and ozonation experiments (Section 3.2), with comprehensive consideration of the chromaticity removal ratio and treatment cost, the operating conditions were selected as pH value 3, ozone concentration 6 mg/L, and ozonation time 40 min, the results, in Figure 8, showed the effect of GAC dosage on the chromaticity removal. It was clear that the chromaticity of effluent decreased rapidly with the increasing GAC dosage in the range of 0.02 to 0.04 g/L. The chromaticity of effluent declined to 30 when GAC dosage was 0.04 g/L, which met the primary emission requirements of the Integrated Wastewater Discharge Standard (GB 8978, chromaticity less than 50) and the requirements of The Reuse of Urban Recycling Water-Water Quality Standard for Industrial Uses (GB/T 19923, chromaticity less than 30), and the chromaticity removal ratio reached 95.5%. As the GAC dosage increased from 0.04 g/L to 0.06 g/L, the chromaticity of effluent reduced to 23, and the chromaticity removal ratio increased slightly to 96.4%. Compared with the removal ratio of O3 oxidation alone under optimal experimental conditions, catalytic ozonation could improve the chromaticity removal ratio by about 26%. Meanwhile, catalytic ozonation with 0.03 g/L GAC could greatly increase the chromaticity removal ratio by about 47%, compared to 0.03 g/L GAC adsorption with only a 41.7% removal ratio. Cai et. al. studied an advanced treatment of printing and dyeing wastewater by the AC catalytic ozonation method, with the optimal conditions as follows: pH value 11, reaction time 60 min, doped-AC catalyst dosage 50 g/L, and ozone 6.5 mg/min, the removal ratio of color was 95.83% [38]. Soluble O3 in an aqueous solution was adsorbed to the surface of the catalyst, a series of radical chain transfers occurred to generate many hydroxyl radicals, which provided high oxidation potential and could oxide the organic pollutants in wastewater [25]. With the increase of GAC dosage, the surface-active sites of GAC also increased, thus GAC created a good adsorption environment to promote the chromaticity removal. Meanwhile, GAC could also promote more conversion of O3 molecules to stronger oxidative hydroxyl radicals [24,39].

3.3.2. Orthogonal Experiment of Catalytic Ozonation

According to the previous research results, pH value, ozone dosage, GAC dosage, and reaction time were selected as the four main factors in the orthogonal experiment designing. The levels of the four factors and the analysis of the results of the L9 (34) orthogonal experiment are presented in Table 1.
According to the experimental results and the test of significance (F value) shown in Table 1, the order of the influence of various factors on chromaticity removal ratio was: pH value > reaction time > ozone concentration > GAC dosage. The results further indicated that, compared with other experimental parameters, the pH value was more likely to influence the chromaticity removal ratio, which was similar to the experimental result of Razi, et al., in that the pH value of the solution turned out to be the most important condition in the adsorption process for anionic dye, a low pH value was preferable in contrast for cationic dye where the suitable pH value was high [40]. The optimal level of the experimental parameters was pH value 2.87, O3 concentration 6 mg/L, GAC dosage 0.06 g/L, and reaction time 60 min respectively, with the chromaticity removal ratio reaching 96.36% and the chromaticity of effluent only 20, which met the requirements of GB 8978 and GB/T 19923. These optimal levels of the experimental parameters were similar to the treatment of methylene blue wastewater by catalytic ozonation using AC as a catalyst, with the optimal experimental parameters as follows: reaction temperature 20 °C, catalyst dosage 0.4 g/L, pH value 6, and methylene blue initial mass concentration 200 mg/L, with the methylene blue removal ratio reaching about 100% and the COD removal ratio reaching 76.1% when the reaction time was 33 min [41].

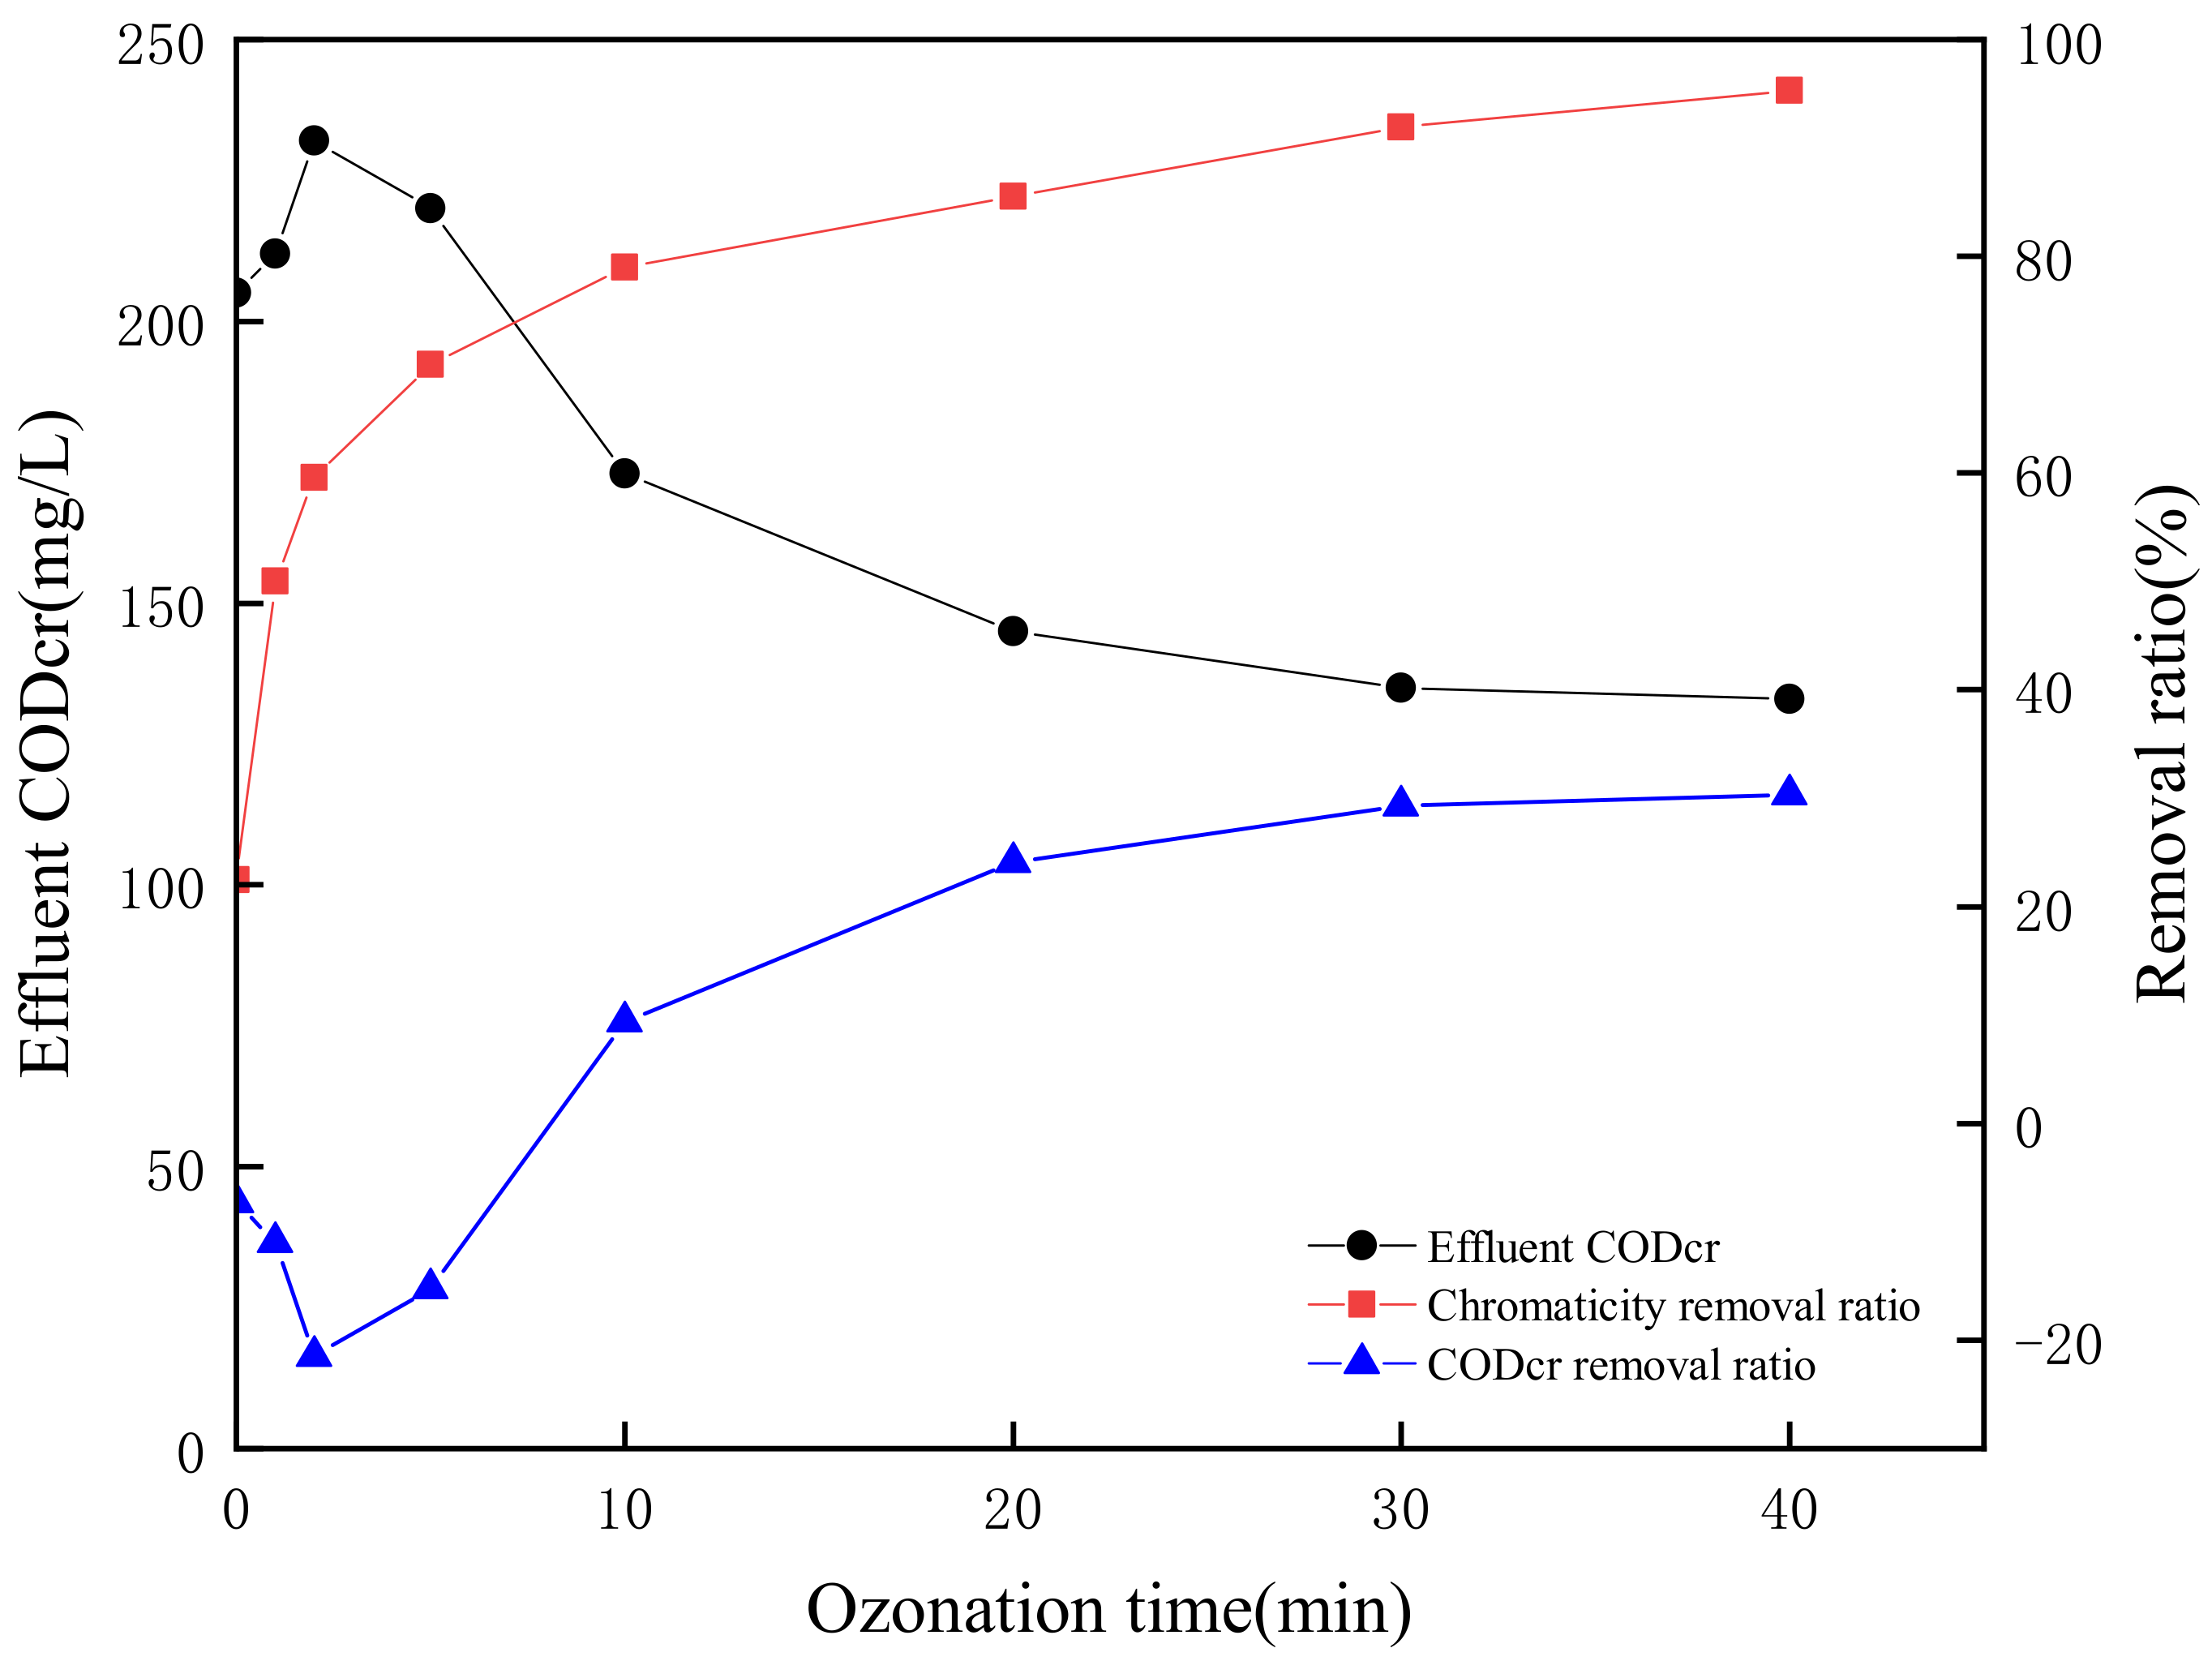
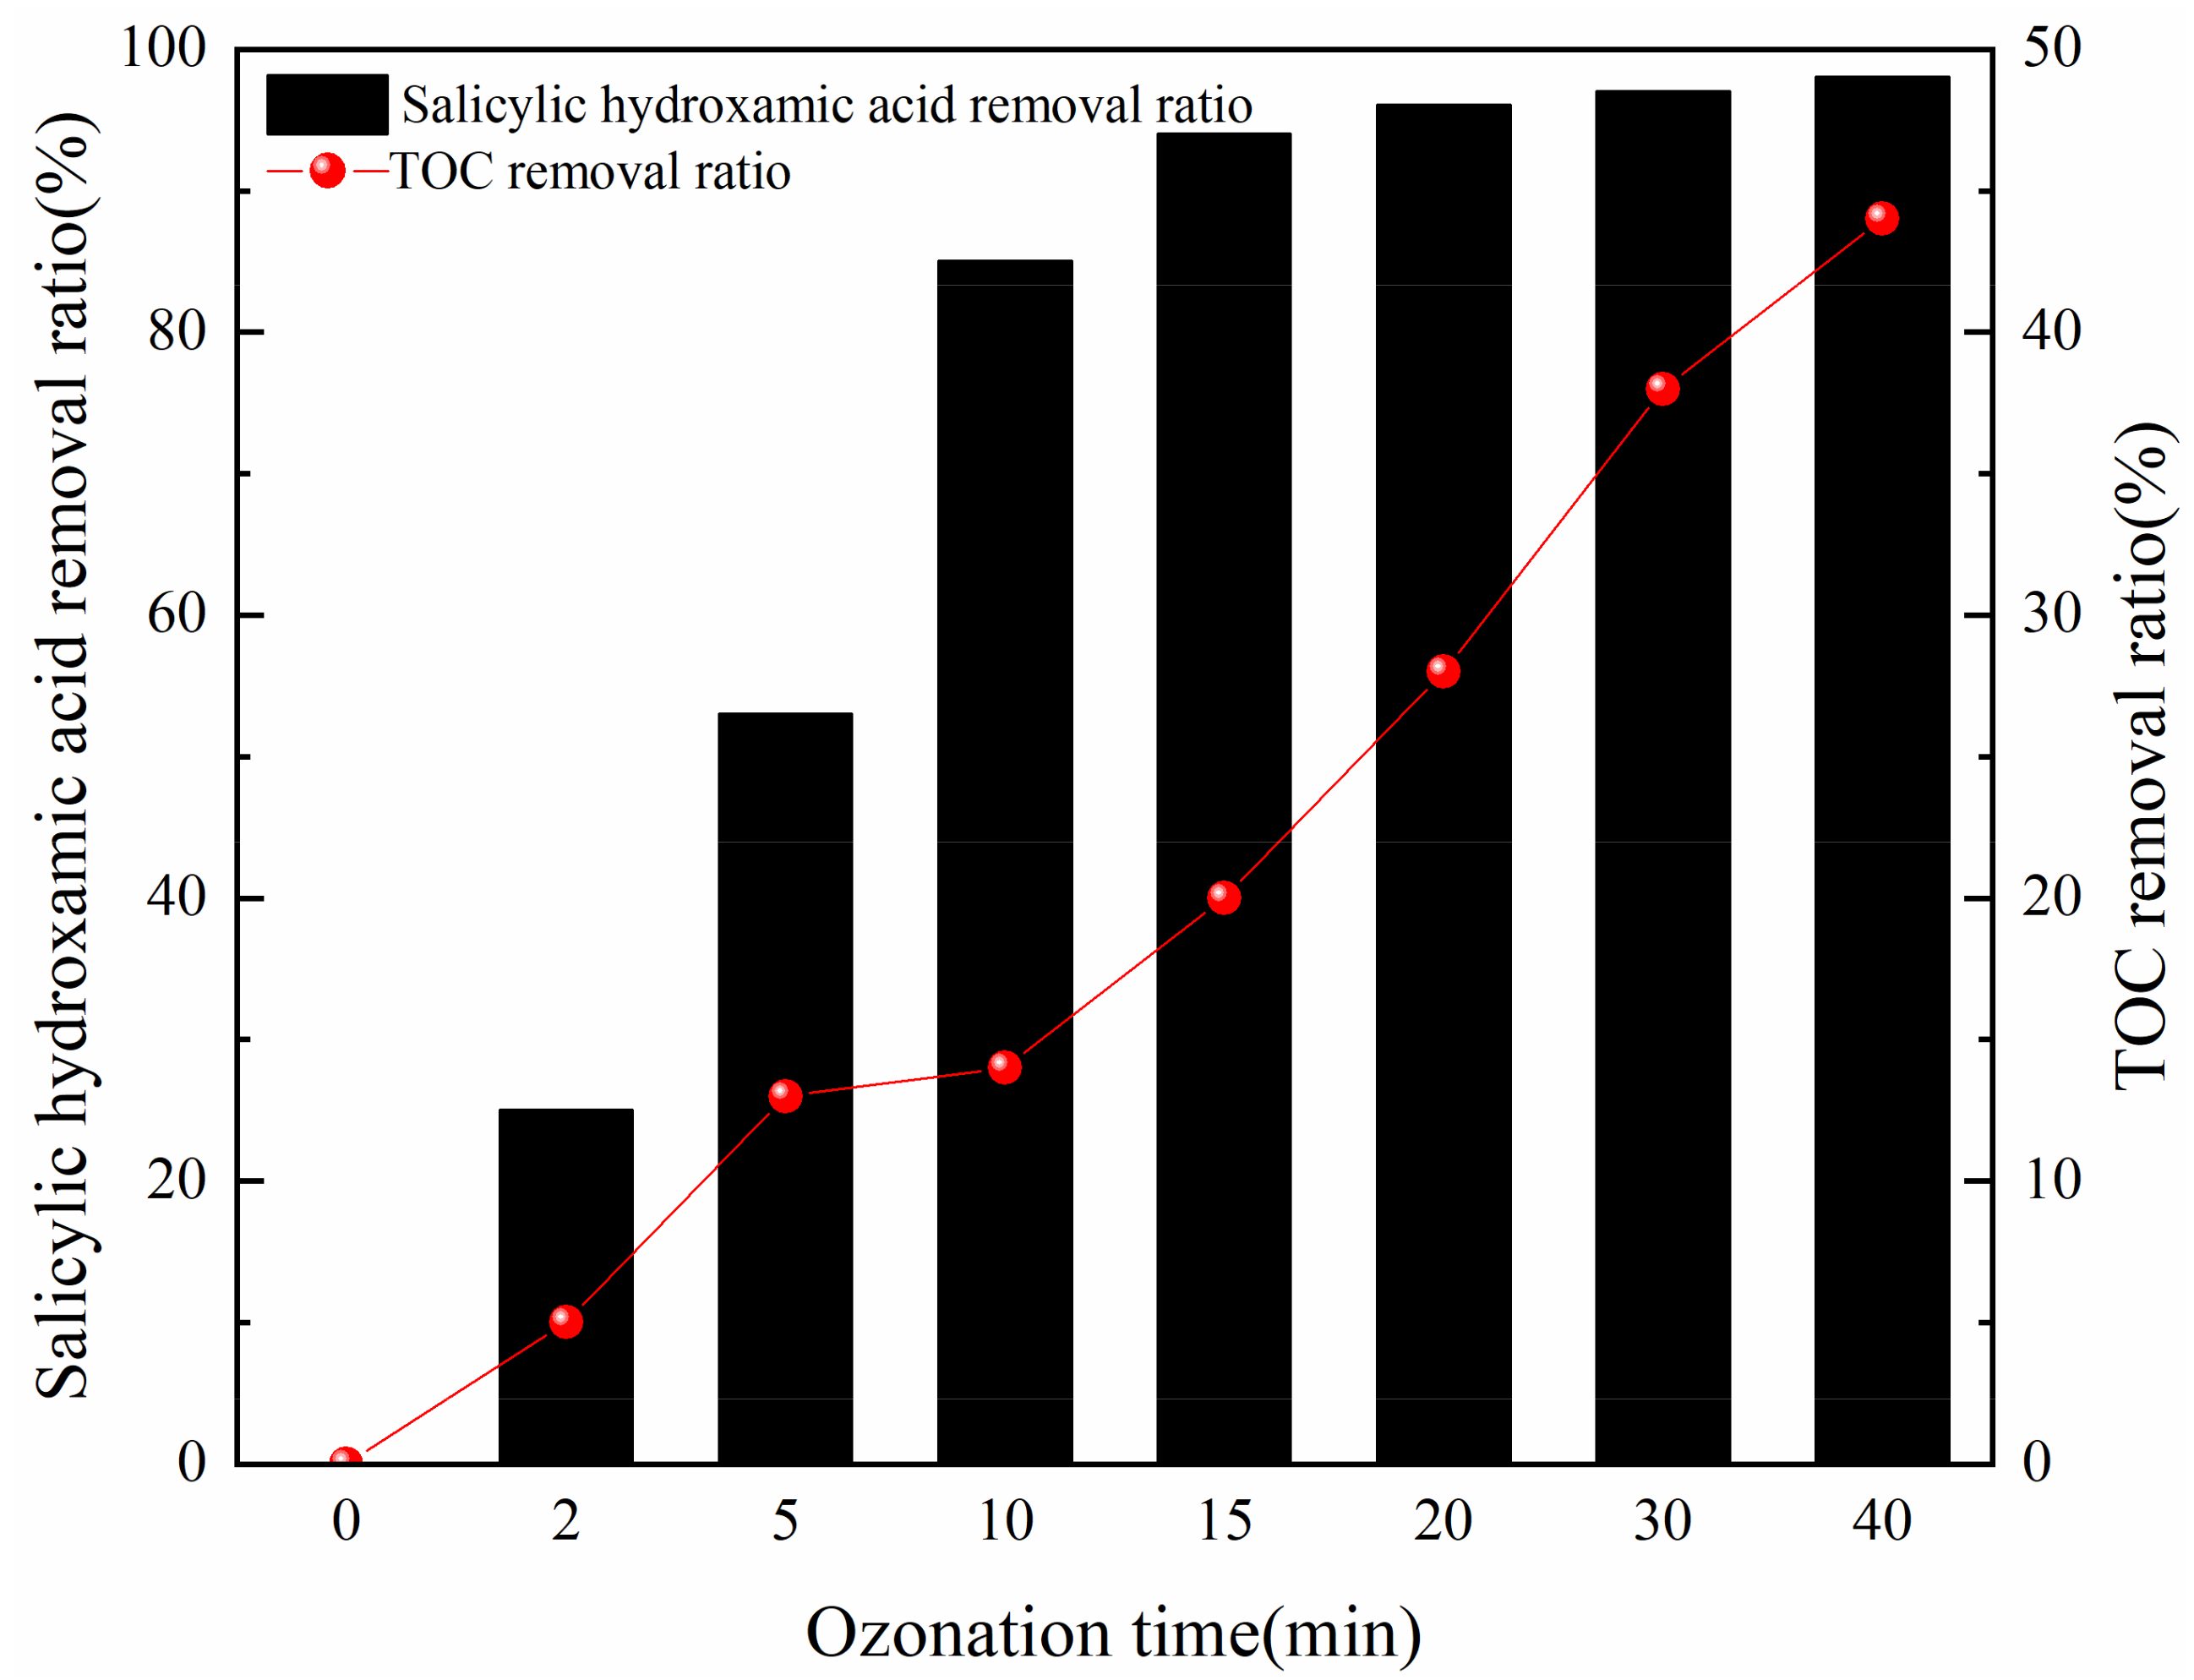
3.4. Catalytic Ozonation Effects on CODCr, TOC and Chromaticity

The catalytic ozonation effects on CODCr and chromaticity removal were researched based on the optimal experimental parameters obtained from the orthogonal experiment as pH value 2.87, O3 concentration 4 mg/L, GAC dosage 0.06 g/L, and reaction time 40 min. The results shown in Figure 9 revealed that the CODCr concentration of the initial simulated wastewater increased from 191 mg/L to 205 mg/L when the pH value was adjusted to 2.87 due to the hydrolysis and acidification of poly-quinone structure substances into relatively small molecular structures such as o-benzoquinone. The CODCr concentration further raised to 232 mg/L within a 2 min reaction time which was mainly attributed to the quinone ring destruction of hydroquinone to maleic acid. Then the CODCr concentration of effluent gradually declined to 133 mg/L when the ozonation time prolonged to 40 min, and the CODCr removal ratio was 30.37%. During the ozonation degradation, most of the maleic acid was decomposed into small molecular acids like formic acid which was hard to be oxidized to carbon dioxide and water [42]. The results in Figure 9 show that the chromaticity removal ratio of simulated wastewater was stably above 95% and the chromaticity was lower than 30 under the optimal experimental parameters.
Under the optimal experimental conditions, the salicylic hydroxamic acid and mineralization ratio of the simulated flotation wastewater by O3 oxidation at different times were analyzed as shown in Figure 10. As the oxidation time extended, the salicylic hydroxamic acid and total organic carbon (TOC) removal ratio increased. During the first 10 min reaction time, the removal ratio of salicylic hydroxamic acid was more than 80%, but the TOC removal ratio was lower than 15%. When the ozonation time was prolonged from 15 min to 40 min, the salicylic hydroxamic acid increased from 93.94% to 98.16%, and the TOC removal ratio improved from 19.99% to 44.86%. It could be deduced that salicylic hydroxamic acid was easy to be degraded in the process of ozonation, but other intermediate products were stable and difficult to be mineralized completely. Chang et al., detected oxidation byproducts of salicylic acid during the O3 process, catechol, maleic acid, and oxalic acid were chain compounds, but the mineralization ratio was low [37].

3.5. Degradation Mechanism of Chromaticity

3.5.1. Ultraviolet Absorption Spectrum

The simulated flotation wastewater with salicylic hydroxamic acid ozonated at different times was analyzed by ultraviolet absorption spectrum, which was collected in the wavelength range of 190 to 1100 nm and a minimum wavelength interval of 0.1 nm. The analysis results are shown in Figure 11.
The two characteristic absorption peaks at 296 nm and 204 nm of salicylic hydroxamic acid decreased with the prolonged ozonation time, which showed the characteristic functional group of salicylic hydroxamic acid being destroyed effectively. The peak (λmax = 296 nm) of absorption red-shifted was changed to 303 nm after 10 min ozonation. According to the literature, the characteristic absorption peak of salicylic acid was λmax = 303 nm, which prove that salicylic acid was an intermediate of salicylic hydroxamic acid during the ozonation process. Salicylic hydroxamic acid was synthesized from salicylic acid and easily hydrolyzed to salicylic acid. There was a new characteristic absorption peak of o-benzoquinone at 240 nm after 10 min ozonation time, which gradually weakened with the increased O3 reaction time. This experimental result was similar to the ozonation combined biodegradation process mechanism of salicylic hydroxamic acid [43].

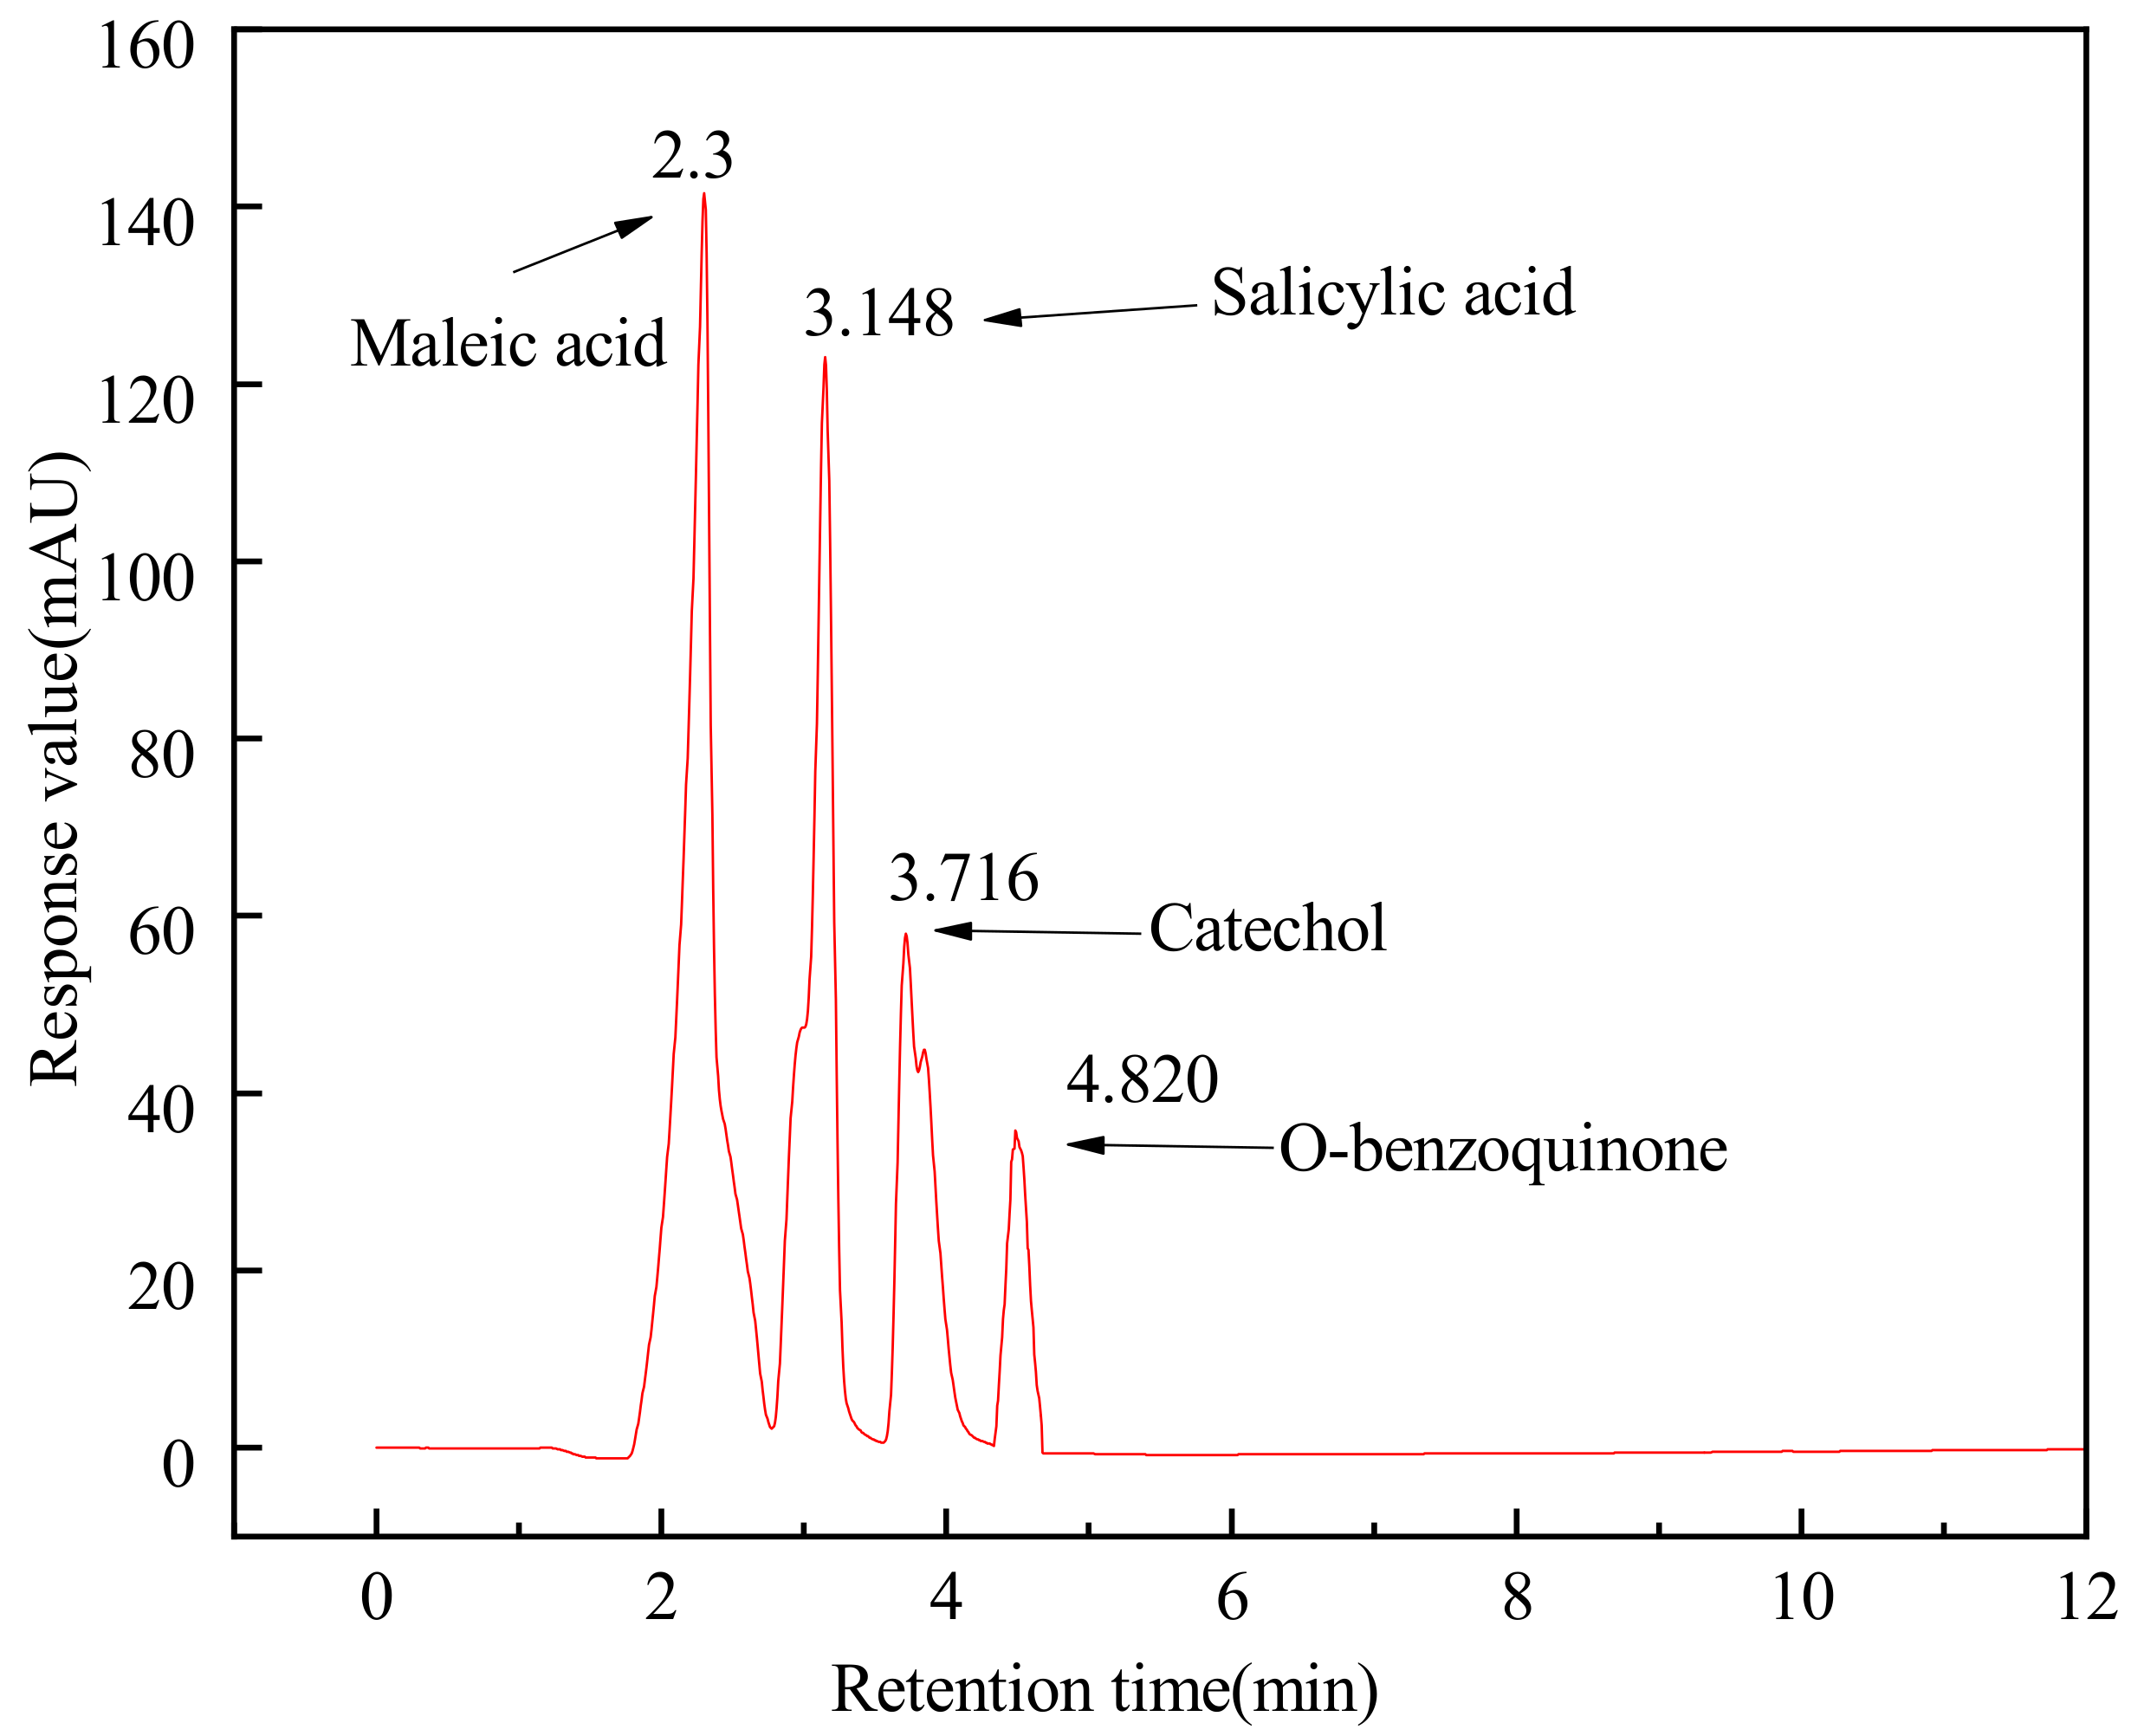
3.5.2. HPLC Analysis

According to the previous research achievements, salicylic acid as an intermediate of salicylic hydroxamic acid oxidation by O3 could be degraded to o-benzoquinone and catechol. Some literature showed that butene diacid was the main product of hydroxyl through aromatic compounds oxidation [29,36,37].
The HPLC analysis conditions of salicylic acid, o-benzoquinone, catechol, and maleic acid were as follows: column was SB-C18 (250 mm × 4.6 mm, 5 μm), sample volume was 10 μL, the flow rate of mobile phase was 0.8 mL·min−1, column temperature was 30 °C, the mobile phase was acetonitrile-water (35:65, volume ratio) solution, the pH value of the water sample and standard reserving solution was 4 adjusted with acetic acid. The chromatogram and retention time of the mixed standard solution is shown in Figure 12.
Under the detection conditions, comparing the HPLC chromatogram of the effluent, the salicylic hydroxamic acid wastewater oxidated by O3 after 5, 10, 20, and 40 min, the types of residual intermediate products were listed as follows: salicylic hydroxamic acid was mainly degraded to salicylic acid, o-benzoquinone, and catechol after 5 min ozonation. When the ozonation time was extended to 10 min, salicylic acid, o-benzoquinone, catechol, and maleic acid could be detected. When the ozonation time was prolonged to 20 min, the intermediate products of salicylic acid, o-benzoquinone, catechol, and maleic acid were all tested but the amount was declined. For ozonation of 40 min, the intermediate product was only maleic acid [37]. Thus, the degradation pathway of salicylic hydroxamic acid by ozonation could be inferred as follows:
salicylic hydroxamic acid salicylic acid catechol o benzoquinone maleic acid CO 2 + H 2 O
Salicylic hydroxamic acid was first oxidized and decomposed to salicylic acid and hydroxylamine. As the reaction carried through, the carboxyl group on the benzene ring of salicylic acid was attacked by ·OH, the hydroxyl group of salicylic acid provided electron for the benzene ring and made the hydroxylation reaction easily take place at the carboxyl group position, thus the salicylic acid was degraded to catechol. This was the characteristic reaction between ·OH and aromatic compounds, in other words, it was a substitution reaction between ·OH and the aromatic ring which resulted in aromatic hydroxylation. Catechol was further oxidized to o-benzoquinone, then o-benzoquinone was attacked by ·OH to form small molecule maleic acid by the ring-opening reaction. After 40 min ozonation, a portion of maleic acid remained in the wastewater, which showed that salicylic hydroxamic acid could not be totally mineralized to CO2 and H2O.

4. Conclusions

This research investigated an efficient chromaticity removal method with GAC catalytic ozonation. Based on the optimal experimental parameters as pH value 2.87, O3 concentration 4 mg/L, GAC dosage 0.06 g/L, and reaction time 40 min, the chromaticity removal ratio of simulated wastewater was above 95% and the chromaticity was lower than 30, which met the primary emission requirements of the Integrated Wastewater Discharge Standard (GB 8978, chromaticity less than 50) and the requirements of The Reuse of Urban Recycling Water-Water Quality Standard for Industrial Uses (GB/T 19923, chromaticity less than 30). A comprehensive analysis of the above experimental results, comparing the chromaticity removal effect and treatment cost, obviously showed that the ozone oxidation method under acidic conditions was more suitable for the treatment of high chromaticity simulated wastewater. The release of colored flotation wastewater from the tailing reservoir into the environment was a source of problem for the aquatic ecosystem with the commonly used coagulation and sedimentation treatment methods. This GAC catalytic ozonation method could provide strong support for the chromaticity removal in an actual mineral flotation wastewater treatment process.

Author Contributions

Conceptualization, L.Z. and N.Z.; methodology, N.Z. and S.W.; software, S.W. and R.Y.; validation, R.Y. and E.W.; formal analysis, L.Z., N.Z. and S.W.; investigation, N.Z., L.Z. and S.W.; resources, L.Z.; data curation, L.Z. and S.W.; writing—original draft preparation, L.Z., S.W. and N.Z.; writing—review and editing, L.Z. and S.W.; supervision, L.Z.; project administration, L.Z.; funding acquisition, L.Z. All authors have read and agreed to the published version of the manuscript.

Funding

This work was supported by the National Key R&D Program of China (NO. 2018YFC0406403-1) and the Fundamental Research Funds for the Central Universities (NO. 2020YJSHH21).

Data Availability Statement

The data presented in this study are available on request from the corresponding author. The data are not publicly available due to the research process of this project.

Conflicts of Interest

The authors declare no conflict of interest.

References

  1. Kholmogorov, A.G.; Kononova, O.N. Processing mineral raw materials in Siberia: Ores of molybdenum, tungsten, lead and gold. Hydrometallurgy 2005, 76, 37–54. [Google Scholar] [CrossRef]
  2. Zhang, L.P.; Zhang, X.; Xiang, J.; Xue, J.W.; Song, X.J. Study on Treatment of Salicylhydroxamic Acid Wastewater from Tungsten Molybdenum Mineral Processing. J. Chem. 2020, 2020, 1–8. [Google Scholar] [CrossRef] [Green Version]
  3. Hu, H.X.; Zhou, X.T.; Qiu, X.Y.; He, X.J. The Application of Floatation Reagents of Scheelite. China Tungsten Ind. 2010, 25, 19–22. [Google Scholar]
  4. Huang, J.P.; Zhong, H.; Qiu, X.Y.; Wang, S. Flotation behavior and adsorption mechanism of cyclohexyl hydroxamic acid to wolframite. Chin. J. Nonferrous Met. 2013, 23, 2033–2039. [Google Scholar]
  5. Wang, X.; Song, H.; Jiao, F.; Qin, W.Q.; Yang, C.R.; Cui, Y.F.; Zhang, Z.Q.; Zhang, J.; Li, H.B. Utilization of wastewater from zeolite production in synthesis of flotation reagents. Trans. Nonferrous Met. Soc. China 2020, 30, 3093–3102. [Google Scholar] [CrossRef]
  6. Al-Saati, N.; Hussein, T.; Abbas, M.; Hashim, K.S.; Al-Saati, Z.; Kot, P.; Sadique, M.M.; Aljefery, M.; Carnacina, I. Statistical modelling of turbidity removal applied to non-toxic natural coagulants in water treatment: A case study. Desalin. Water Treat. 2019, 150, 406–412. [Google Scholar] [CrossRef]
  7. Tian, Y.P.; Chen, S.P. Research on the Effect of Coagulation on Decolorization and Degradation of Red Dye Wastewater. Adv. Mater. Res. 2013, 610–613, 2401–2404. [Google Scholar] [CrossRef]
  8. Jovan, K.; Kenneth, S.S.; Hans, K.; Susiana, P.; Asaf, K.S. Optimization study of leucaena leucocephala seed extract as natural, coagulant on decolorization of aqueous congo red solutions. Arab. J. Sci. Eng. 2020, 2020, 1–12. [Google Scholar]
  9. Li, Z.Y.; Han, H.J. Study on Fenton oxidation-coagulation method of biologically treated coal-chemical engineering wastewater. Water Wastewater Eng. 2013, 39, 316–319. [Google Scholar]
  10. Verma, A.K.; Dash, R.R.; Bhunia, P. A review on chemical coagulation/flocculation technologies for removal of colour from textile wastewaters. J. Environ. Manag. 2012, 93, 154–168. [Google Scholar] [CrossRef]
  11. Ministry of Environmental Protection of the People’s Republic of China. Integrated Wastewater Discharge Standard, GB 8978–1996; The State Bureau of Quality and Technical Supervision: Beijing, China, 1996.
  12. Venkatesha, B.M.; Radhika, R.T.; Ananda, S.; Byrappa, K. Oxidative decolorization of indigo caramine dye with chloramine-T catalyzed by cobalt(II). Res. Chem. Intermed. 2011, 37, 195–199. [Google Scholar] [CrossRef]
  13. Huang, L.J.; Xu, T.B.; Wang, S.F. Decolorization of methyl orange simulated wastewater by chlorine dioxide with ultrasound. Adv. Mater. Res. 2011, 255–260, 2904–2908. [Google Scholar] [CrossRef]
  14. Yan, W.Y.; Chai, Y.H. The treatment of H-GL dye wastewater by Fenton oxidation. Adv. Mater. Res. 2012, 518–523, 2274–2277. [Google Scholar] [CrossRef]
  15. Torrades, F.; García-Montaño, J. Using central composite experimental design to optimize the degradation of real dye wastewater by Fenton and photo-Fenton reactions. Dye. Pigment. 2014, 100, 184–189. [Google Scholar] [CrossRef] [Green Version]
  16. Değermenci, N.; Değermenci, G.D.; Ulu, H.B. Decolorization of reactive azo dye from aqueous solutions with Fenton oxidation process: Effect of system parameters and kinetic study. Desalination Water Treat. 2019, 169, 363–371. [Google Scholar] [CrossRef]
  17. Nurbasa, M.; Kutukcuoglu, S.B. Investigation of water decolorization by Fenton oxidation process in batch and continuous systems. Desalination Water Treat. 2015, 55, 3731–3736. [Google Scholar] [CrossRef]
  18. Konsowa, A.H. Decolorization of wastewater containing direct dye by ozonation in a batch bubble column reactor. Desalination 2003, 158, 233–240. [Google Scholar] [CrossRef]
  19. Konsowa, A.H.; Ossman, M.E.; Chen, Y.S.; Crittendend, J.C. Decolorization of industrial wastewater by ozonation followed by adsorption on activated carbon. J. Hazard. Mater. 2010, 176, 181–185. [Google Scholar] [CrossRef] [PubMed]
  20. Xu, H.Y.; Wang, J.; Zhang, Y.J.; Han, L.M.; Song, Y.H.; Liu, G.Q.; Su, B.S. Treatment of biologically-treated effluent of dye wastewater by heterogeneous catalytic ozonation technology. Chin. J. Environ. Eng. 2017, 11, 2820–2827. [Google Scholar]
  21. Zheng, X.Y.; Wang, J.L.; Li, X.W.; Tian, W.J.; Li, K.X. Advanced treatment of secondary effluent by ozonation. China Environ. Sci. 2014, 34, 1159–1165. [Google Scholar]
  22. Jiang, G.A.; Zhao, Y.; Li, B.Z.; Guo, H.S. Treatment of acid brilliant scarlet dye wastewater by ozone catalytic oxidation over activated carbon-based catalyst. Mod. Chem. Ind. 2018, 5, 124–127. [Google Scholar]
  23. Liu, L.J.; Dong, J.; Zhang, L.X.; Wang, W.; Xiong, W.; Cao, B.Q.; Zhang, S.F. Pilot experiment on advanced treatment of printing and dyeing wastewater by powder activated carbon membrane bioreactor. Chem. Bioeng. 2021, 38, 43–46. [Google Scholar]
  24. Rajaha, Z.; Guiza, M.; Solísb, R.R.; Rivas, F.J.; Ouederni, A. Catalytic and photocatalytic ozonation with activated carbon as technologies in the removal of aqueous micropollutants. J. Photochem. Photobiol. A: Chem. 2019, 382, 1–9. [Google Scholar]
  25. Gümüs, D.; Akbal, F. A comparative study of ozonation, iron coated zeolite catalyzed ozonation and granular activated carbon catalyzed ozonation of humic acid. Chemosphere 2017, 174, 218–231. [Google Scholar] [CrossRef]
  26. Aljeboree, A.M.; Alshirifi, A.N.; Alkaim, A.F. Kinetics and equilibrium study for the adsorption of textile dyes on coconut shell activated carbon. Arab. J. Chem. 2017, 10, 3381–3393. [Google Scholar] [CrossRef] [Green Version]
  27. Zhu, Y.; Kolar, P.; Shah, S.B.; Cheng, J.J.; Lim, P.K. Avocado seed-derived activated carbon for mitigation of aqueous ammonium. Ind. Crop. Prod. 2016, 92, 34–41. [Google Scholar] [CrossRef]
  28. Zhang, D.; Zhou, T.; Liu, W. The Reuse of Urban Recycling Water-Water Quality Standard for Industrial Uses, GB/T 19923-2005; General Administration of Quality Supervision, Inspection and Quarantine of the People’s Republic of China: Beijing, China, 2005. [Google Scholar]
  29. Zi, L.; Li, X.Z.; Liu, Z.Q.; Liu, L.Z.; Chen, J.X. The enhanced mechanism of benzoquinone(BQ) on poly-silicate-ferric(PSF) in heterogeneous UV-Fenton system. China Environ. Sci. 2020, 40, 2943–2951. [Google Scholar]
  30. Ruan, C.; Huang, Q. Experimental study on decolorization of dyeing and printing wastewater by activated carbon adsorption. Sichuan Environ. 2006, 25, 29–58. [Google Scholar]
  31. Jiang, W.; Peng, X.; Zhang, L.; Li, Z.; Wei, G. Research progress in treatment of xanthate in mineral concentration wastewater by advanced oxidation technology. Met. Mine 2017, 498, 123–129. [Google Scholar]
  32. Scheck, C.K.; Frimmel, F.H. Degradation of phenol and salicylic acid by ultraviolet radiation/hydrogen peroxide/oxygen. Water Res. 1995, 29, 2346–2352. [Google Scholar] [CrossRef]
  33. Deng, S.; Bai, M.; Bai, X.; Liu, X.W. Characteristics and chemical reaction of hyaroxyl radical. J. Dalian Marit. Univ. 2004, 30, 62–64. [Google Scholar]
  34. Chu, W.; Ma, C.W. Quantitative prediction of direct and indirect dye ozonation kinetics. Water Res. 2000, 34, 3153–3160. [Google Scholar] [CrossRef]
  35. Shu, H.Y. Degradation of dyehouse effluent containing C.I. direct blue 199 by process of ozonation with UV/H2O2. J. Hazard. Mater 2006, 133, 92–98. [Google Scholar] [CrossRef] [PubMed]
  36. Sgroi, M.; Anumol, T.; Vagliasindi, F.G.A.; Snyder, S.A.; Roccaro, P. Comparison of the new Cl2/O3/UV process with different ozone- and UV-based AOPs for wastewater treatment at pilot scale: Removal of pharmaceuticals and changes in fluorescing organic matter. Sci. Total Environ. 2021, 765, 142720. [Google Scholar] [CrossRef]
  37. Chang, J.; Wang, S.P.; Zhang, Y.X.; Wang, Y.B.; Zhang, W.J.; Lu, J.F. Oxidation of salicylic acid in water by the O3 and UV/O3 processes: Removal and reaction byproducts. Water Sci. Technol. 2020, 81, 753–762. [Google Scholar]
  38. Cai, H.; Li, K.L.; Chen, Y.Z.; Wang, L.P. Advanced treatment of printing and dyeing wastewater by activated carbon catalytic ozonation method. J. Chang. Univ. 2010, 22, 38–41. [Google Scholar]
  39. Wei, K.J.; Wang, Z.; Ouyang, C.P.; Cao, X.X.; Liang, P.; Huang, X.; Zhang, X.Y. A hybrid fluidized-bed reactor (HFBR) based on arrayed ceramic membranes (ACMs) coupled with powdered activated carbon (PAC) for efficient catalytic ozonation: A comprehensive study on a pilot scale. Water Res. 2020, 173, 1–13. [Google Scholar] [CrossRef] [PubMed]
  40. Razi, M.A.M.; Hishammudin, M.N.A.M.; Hamdan, R. Factor Affecting Textile Dye Removal Using Adsorbent From Activated Carbon: A Review. In Proceedings of the International Symposium on Civil and Environmental Engineering, Melaka, Malaysia, 5–6 December 2016; Volume 103, p. 06015. [Google Scholar]
  41. Dong, J.W.; Xing, B.; Yang, G.; Jia, M.; Liu, X.Y. Treatment of methylene blue wastewater by catalytic ozonation using Mn-Ce bimetal/activated carbon as catalyst. Ind. Water Treat. 2019, 39, 60–65. [Google Scholar]
  42. Zhang, L.P.; Wu, S.N.; Xiang, J.; Jiao, X.F.; Wang, J. Research on treatment and mechanism of salicylhydroxamic acid flotation wastewater by O3-BAF process. Water Sci. Technol. 2020, 82, 861–876. [Google Scholar] [CrossRef] [PubMed]
  43. Han, W. Study on the Charateristics and Mechanism of Biodegradation of Typical Hydroxamic Acid Floatation Collectors; Wuhan University of Technology: Wuhan, China, 2012. [Google Scholar]
Figure 1. Schematic of the ozonation treatment process.
Minerals 11 00359 g001
Figure 2. Flow chart diagram for experimental procedure design.
Minerals 11 00359 g002
Figure 3. Granular activated carbon (GAC) dosage effect on chromaticity removal from simulated wastewater.
Minerals 11 00359 g003
Figure 4. Chromaticity of simulated wastewater.
Minerals 11 00359 g004
Figure 5. Effect of pH value on chromaticity removal from simulated wastewater.
Minerals 11 00359 g005
Figure 6. Effect of ozone concentration on chromaticity removal (pH value = 3).
Minerals 11 00359 g006
Figure 7. Effect of ozonation time on chromaticity removal (pH value = 3).
Minerals 11 00359 g007
Figure 8. Effect of GAC dosage on chromaticity removal (pH value = 3, O3 concentration = 6 mg/L, ozonation time = 40 min).
Minerals 11 00359 g008
Figure 9. Treatment efficiency of CODCr and chromaticity under the optimal conditions.
Minerals 11 00359 g009
Figure 10. Treatment efficiency of salicylic hydroxamic acid and TOC under the optimal conditions.
Minerals 11 00359 g010
Figure 11. The ultraviolet absorption spectrum of salicylic hydroxamic acid with different ozonation times.
Minerals 11 00359 g011
Figure 12. HPLC chromatogram of mixed standard solution.
Minerals 11 00359 g012
Table 1. Analysis of L9 (34) orthogonal experiment.
No.pH ValueOzone Concentration (mg/L)GAC Dosage (g/L)Reaction Time (min)Chromaticity Removal Ratio (%)
12.8720.042068.57
22.8740.054095.16
32.8760.066096.36
44.420.056072.5
54.440.062085
64.460.044078.33
7720.064020
8740.046020
9760.05200
K1260.09161.07166.9153.57
K2235.83200.16167.66193.49
K340174.69201.36188.86
Mean value 186.7053.6955.6351.19
Mean value 278.6166.7255.8964.50
Mean value 313.3358.2367.1262.95
Range73.3613.0311.4913.31
Mean Square4854.308131.236129.098158.913
F value37.6181.0161.0001.231
Order of precedencepH value > reaction time > ozone concentration > GAC dosage
Publisher’s Note: MDPI stays neutral with regard to jurisdictional claims in published maps and institutional affiliations.

