Article

Stable Bromine Isotopic Composition of Coal Bed Methane (CBM) Produced Water, the Occurrence of Enriched 81Br, and Implications for Fluid Flow in the Midcontinent, USA

1
Department of Earth and Environmental Sciences, University of Waterloo, Waterloo, ON N2L 3G1, Canada
2
Department of Geology, Kansas Interdisciplinary Carbonates Consortium (KICC), University of Kansas, Lawrence, KS 66045, USA
3
Department of Geology, Kansas State University, Manhattan, KS 66506, USA
4
Kansas Geological Survey, Lawrence, KS 66047, USA
*
Author to whom correspondence should be addressed.
Minerals 2021, 11(4), 358; https://doi.org/10.3390/min11040358
Submission received: 24 February 2021 / Revised: 22 March 2021 / Accepted: 23 March 2021 / Published: 30 March 2021
(This article belongs to the Special Issue Halogen Stable Isotope Studies in Geological Processes)

Abstract

:
This study characterizes the δ37Cl, δ81Br, and 87Sr/86Sr of coal bed methane produced fluids from Pennsylvanian Cherokee Group coals of the Cherokee Basin in southeast Kansas, USA. The δ37Cl, δ81Br, and 87Sr/86Sr values range between −0.81 and +0.68‰ (SMOC), −0.63 and +3.17‰ (SMOB), and 0.70880 and 0.71109, respectively. A large percentage of samples have δ81Br above +2.00‰. Two fluid groups were identified on the basis of K/Br, Br/Cl, and Ca/Mg ratios, temperature, He content, δ2H, δ18O, δ81Br, and 87Sr/86Sr. Both fluid groups have geochemical similarities to fluids in Cambrian, Ordovician, and Mississippian units. Lower salinity and higher temperature fluids from deeper units are leaking up into the Cherokee Group and mixing with a higher salinity fluid with higher δ81Br and more radiogenic 87Sr/86Sr. Variation in δ37Cl indicates an unknown process other than mixing is affecting the salinity. This process does not appear to be related to evaporation, evaporite dissolution, or diffusion. Insufficient data are available to evaluate halide–gas or water–rock interaction, but halide–gas interactions are not likely a significant contributor to high δ81Br. Rather, interactions with organically bound bromine and soluble chloride within the coal could have the strongest effect on δ37Cl and δ81Br values.

1. Introduction

Halides, particularly bromide and chloride, are a dominant inorganic component of formation brines and a key part of reservoir evolution and fluid migration interpretations (e.g., [1,2,3,4]). The evolution of chloride and bromide concentrations during evaporation is well-known and has long been used to identify fluid sources and evaluate subsurface mixing scenarios [2,3,5,6,7]. Although bromide is considered conservative in subsurface fluids, formation fluid investigations reveal a range for stable bromine isotopic compositions (δ81Br) that is typically larger than that of the stable chlorine isotopes (δ37Cl) in the same samples, with values poorly correlated [8,9]. While the distribution of stable bromine isotopes (81Br/79Br) in subsurface waters remains a rudimentary snapshot because of the small number of investigations, [10,11,12,13,14,15,16,17,18,19,20,21,22], even less is known about processes that result in its isotopic fractionation. Bromine isotopes are known to fractionate during diffusion, salt precipitation, degradation of methyl bromide, and between bromide ions and gaseous HBr and Br2; yet ascribing the effect of these and other processes on the stable bromine isotopic composition of natural waters remains elusive [23,24,25,26,27,28].
Halogens are active in biogeochemical reactions with organic matter, with bromine particularly associated with volatile compounds and abiotic oxidative conversion of bromide to organobromine in organic matter [29,30,31,32,33,34,35,36,37,38]. Subsurface diagenetic reactions that involve organic compounds can have a major influence on bromide content of fluids [39]. Earlier research also found a relationship between the carbon and hydrogen isotopic composition of methane and the stable bromine isotopic composition of fluids [13]. With strong evidence for organically associated bromine, as well as some of the highest bromide concentrations and bromide/chloride (Br/Cl) ratios [37,40,41,42], coal beds with active bacterial methane production provide a logical environment to explore the relationships among δ81Br, δ37Cl, and organic matter.
The goal of this study is to characterize the δ81Br and δ37Cl composition of gases and dissolved components in water from a high-organic matter subsurface environment with viable methanogenic microorganisms. This will provide the first insights into bromine and chlorine isotope behavior in such environments. The Cherokee Basin in southeast Kansas, USA, provides an ideal location for study. A recent investigation showed that hydrogenotrophic and acetoclastic methanogenesis occurred and may still be occurring within the coal-bearing strata of the basin [43]. By focusing in this previously characterized coal bed methane (CBM) play, this study elucidates the effects of water rock interaction on chlorine and bromine stable isotopic composition of fluids. In addition, it provides the opportunity to observe potential effects of different methanogenic pathways and associated biogeochemical reactions in highly organic strata on subsurface fractionation of chlorine and bromine stable isotopes. The results of this research will improve interpretations of regional fluid flow within the Cherokee Basin and direct further efforts to understand the chlorine and bromine isotopic systems.

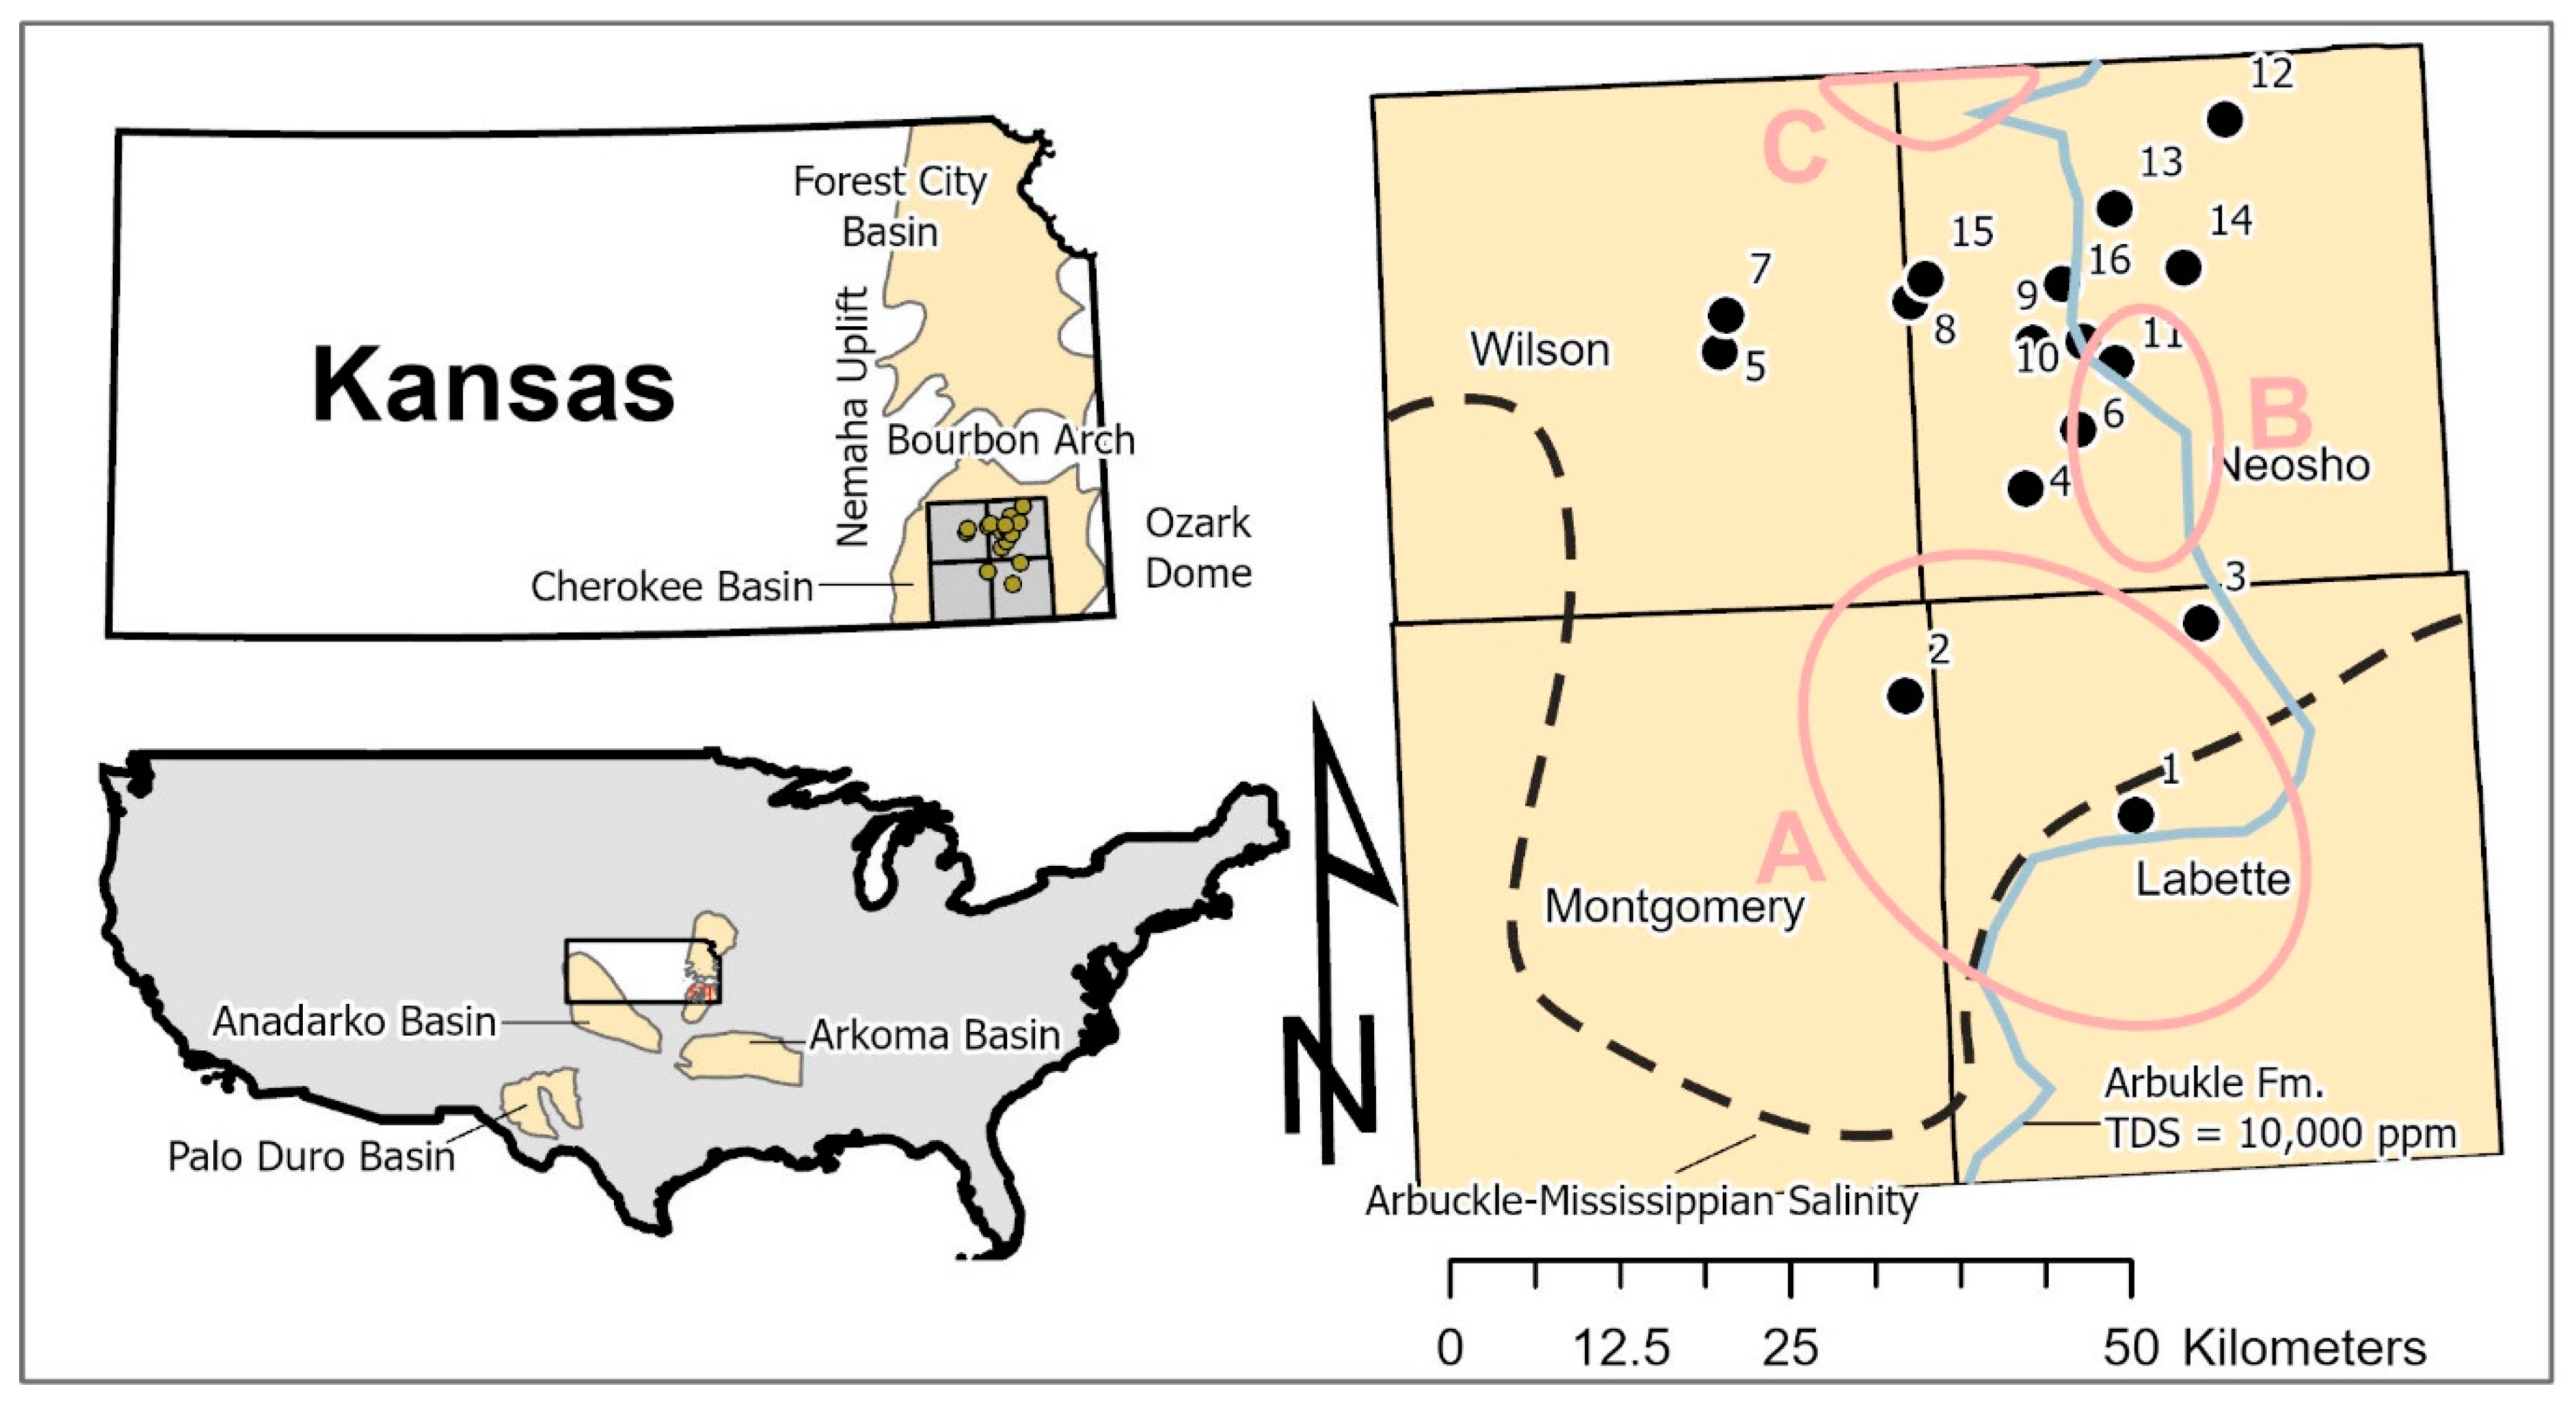
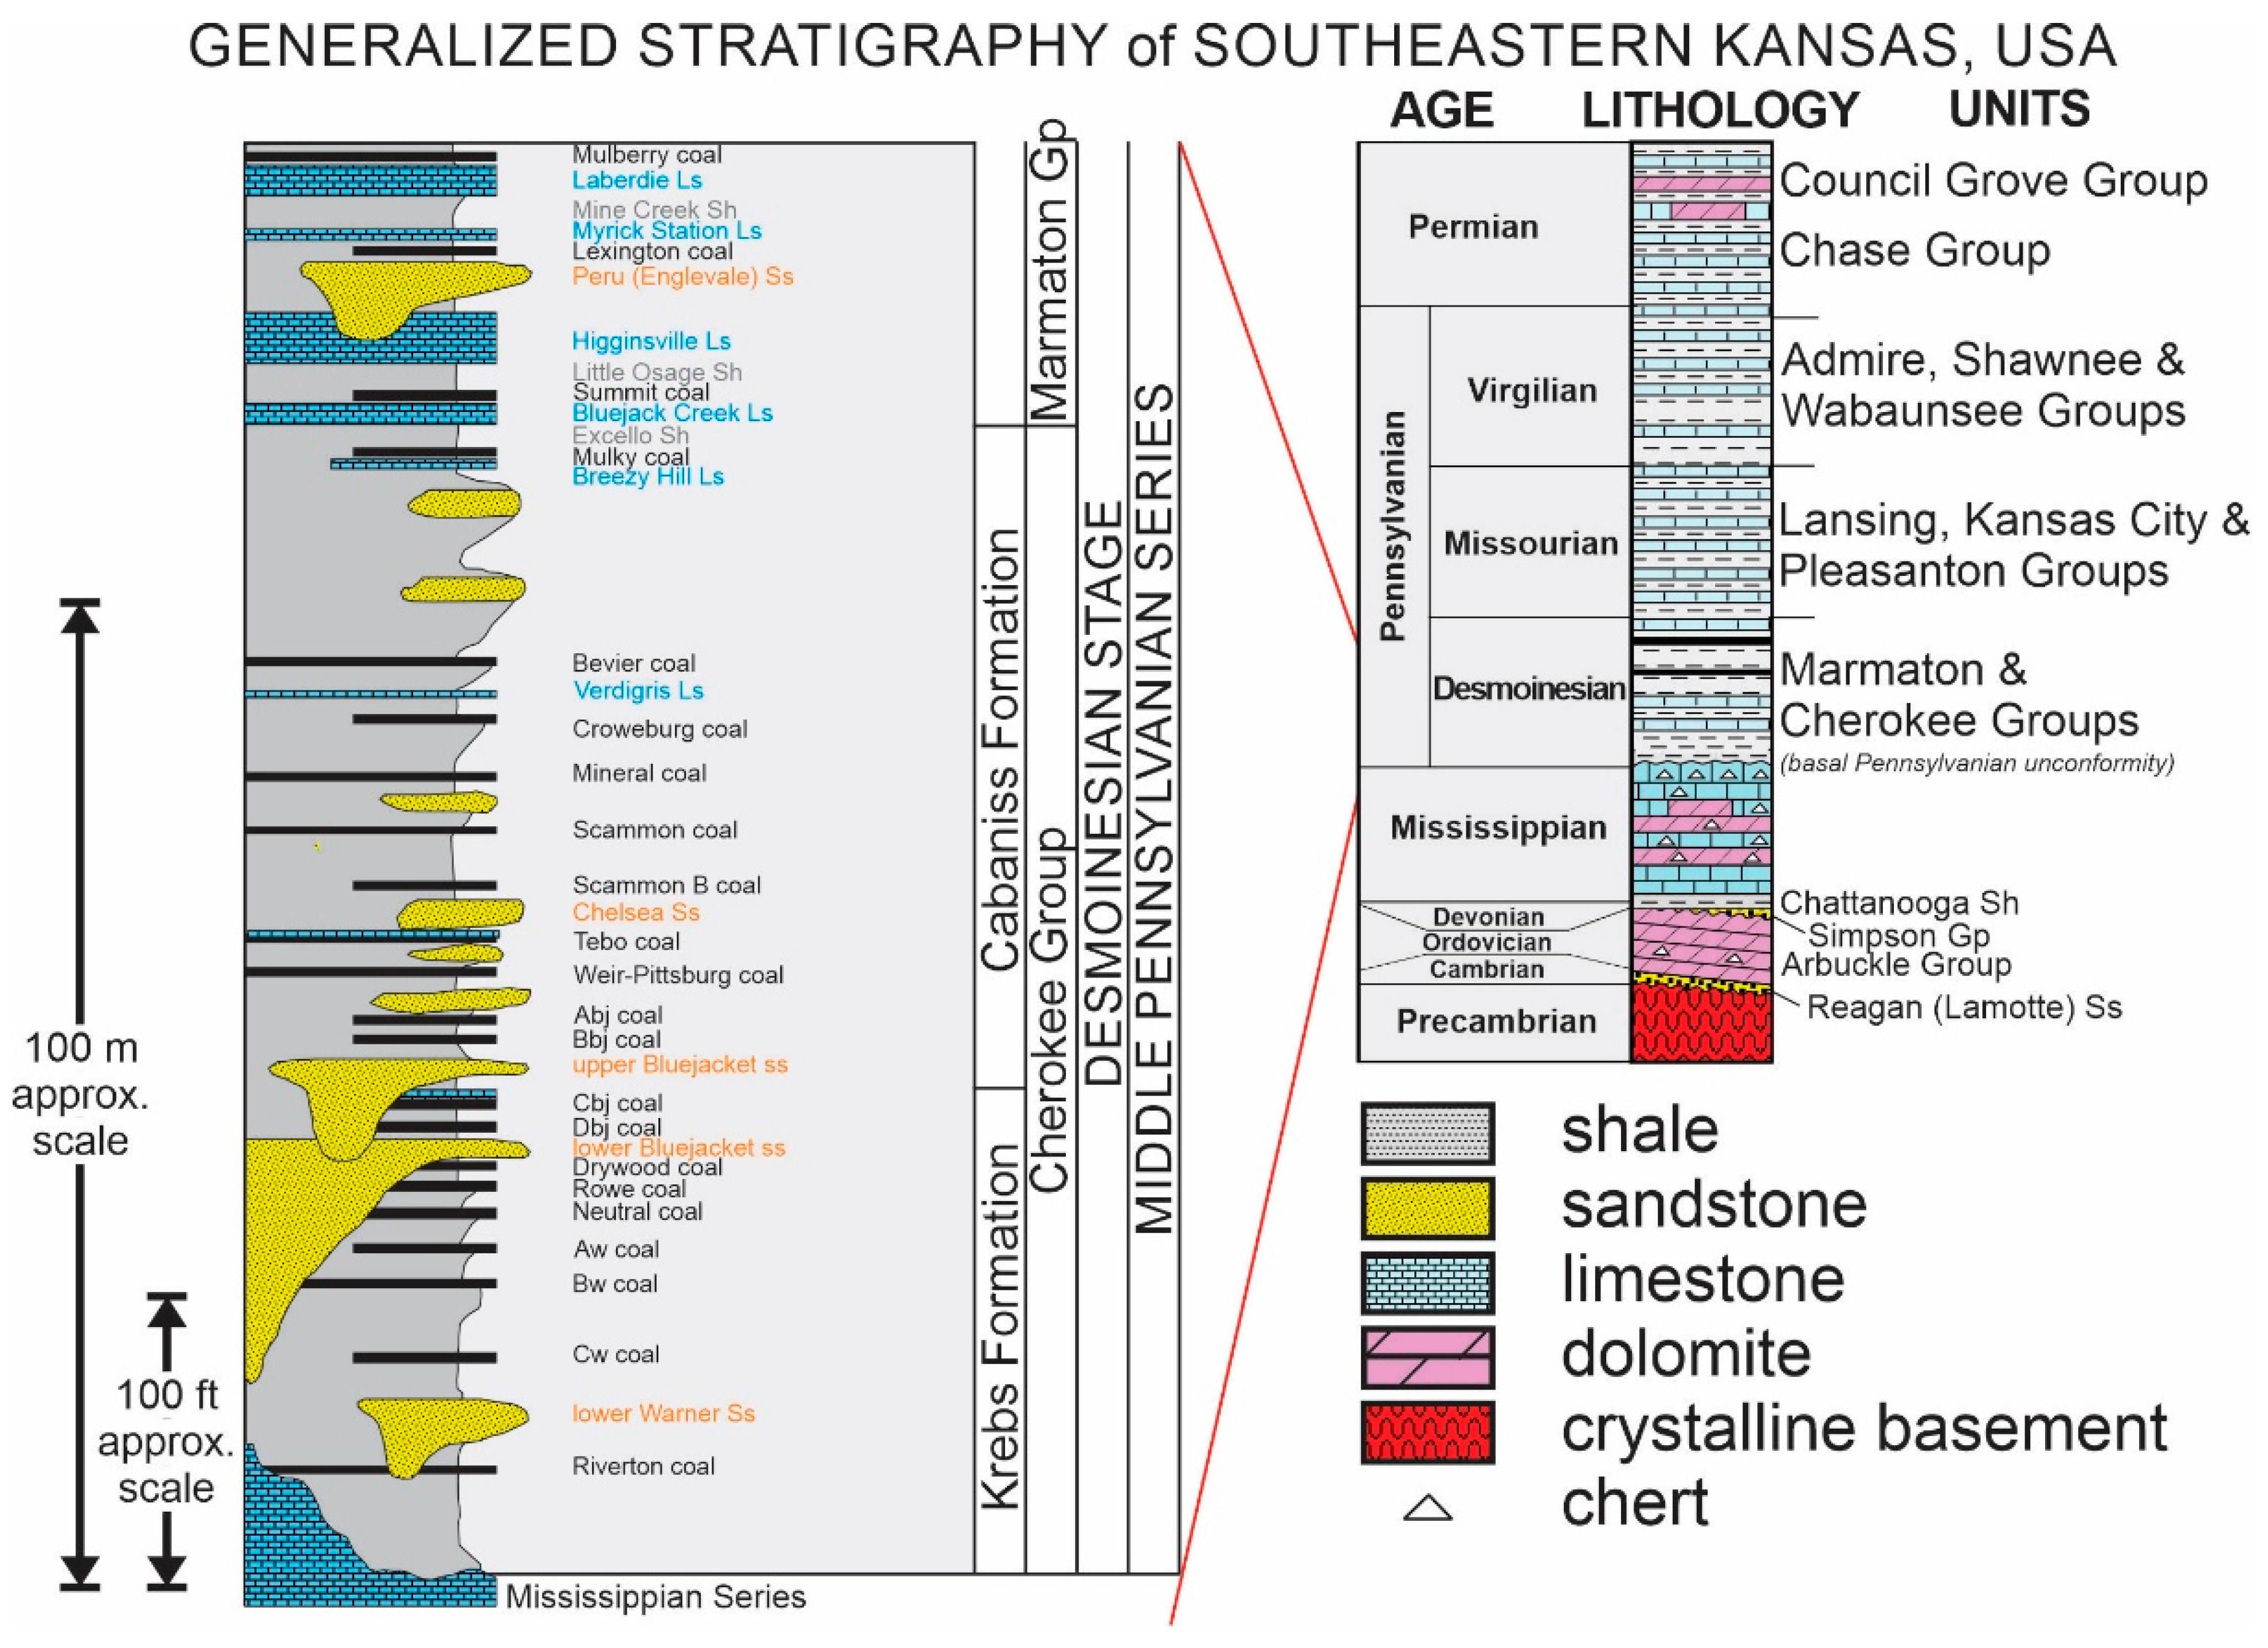
2. Cherokee Basin and Study Site

The Cherokee Basin extends across 22,000 km2 in southeast Kansas, southwestern Missouri, and northeastern Oklahoma, USA (Figure 1). It is separated from the Forest City Basin to the north by the weakly defined Bourbon Arch, and bounded by the Ozark dome on its eastern margin, the Arkoma Basin to the south, and the Nemaha uplift to the west [44]. Sedimentary units in the basin have a gentle westerly dip (<0.5°). Wells in this study are perforated in strata of Middle and Late Pennsylvanian age, primarily the coal-bearing Cherokee and Marmaton Groups of the Desmoinesian series (Figure 2) [45,46]. These strata are predominantly shale, with smaller amounts of sandstone and thin limestones [46].
Fluid flow in the Midcontinent Region, of which the Cherokee Basin is on the eastern edge, has a complex history. The Pennsylvanian strata that are the focus of this study are a part of the locally 150–460 m thick Western Interior Plains Confining System (WIPCS) [47,48]. After deposition, multiple distinct fluids of differing salinities and temperatures transited the Pennsylvanian strata, not counting the modern fluids. These included penetration of low-temperature residual evaporite brines during the Permian, and repeated events of localized upward leakage of hydrothermal fluids, hydrocarbons, and Pb-Zn ore-forming fluids beginning in the Pennsylvanian and continuing onward sporadically at least into the Paleogene [49,50,51,52,53,54]. Today, the study site is located near a confluence of three regional flow systems converging in a hydraulic saddle between the Rocky Mountain uplift to the west and the Ozark uplift, and a zone of higher hydraulic heads originating in the Arkoma Basin to the south and the Anadarko Basin to the southwest (Figure 1). Two distinct saline fluids flow eastward and north-eastward in the Western Interior Plains Aquifer System (WIPAS) to meet westward flowing fresher waters of the Ozark Plateau Aquifer System (OPAS) in the underlying Mississippian limestones and Cambrian–Ordovician Arbuckle Group [47,55]. In these deeper aquifers, there is a sharp transition from saline to fresh waters beneath central Neosho and Labette counties (Figure 1, [56]). Wells inject brine wastewater from oil and gas production into the Arbuckle Group, part of the WIPAS, 60–120 m deeper than the bottom of the CBM wells.
Coalbeds have vitrinite reflectance values between 0.5 and 0.7 Ro, and are ranked high-volatile bituminous A and B [54,58]. Rank increases with depth, towards the south, and in localized areas, a reflection of burial heating and warm fluid migration from the south during and after the Ouachita orogeny [49,58,59]. Gas is produced from thin coalbeds (0.4–1.1 m) and black shales (0.6–1.5 m) that overlie some of the coalbeds, which are interbedded with layers of shale, sandstone, and limestone [60]. Gas contents in coal and shale have a wide range, from 3 to >300 standard cubic feet of gas per dry ton (scf/ton) of coal (3254 to 325,379 kJ/ton), and 3 to 35 scf/ton (3254 to 37,961 kJ/ton) shale [61].
The 16 vertical commercial gas wells sampled for this study were completed between 8 and 12 years prior to the initial study, to depths ranging between 246 and 395 m below ground surface (bgs). In the 13 wells with information available, 0.3 to 2.4 m long perforations were completed in two to nine different coalbeds, totaling between 2 and 8 m of perforation in individual wells. Over the two weeks preceding the initial study, gas production averaged between 17 and 64 mcf/day across the sampled wells [43]. The stable isotopic compositions of the uniformly Na-Cl type waters sampled from the Cherokee Basin during the study fell along the Craig [62] global meteoric waterline (δ2H: −50.6 to −35.8‰; δ18O: −7.39 to −5.37‰), with total dissolved solids (TDS) values between 34.9 and 91.3 g/L [43]. Gases sampled from the Cherokee Basin were predominantly methane (between 95 and 98 mol %), with most of the remaining fraction composed of nitrogen and carbon dioxide [43]. Like the nearby Forest City Basin [63], gas sampled from the Cherokee Basin has a microbial origin (δ13C-C1 between −56.5 and −70.0‰ VPDB) [43]. Methane in the Cherokee Basin is primarily generated from hydrogenotrophic methanogens, with acetoclastic methanogen contributions increasing with salinity [43]. Their analysis demonstrated that viable populations of both groups were present in the produced water samples collected. Further detail on geochemical, microbiological, and well completion data may be found in Kirk et al. [43].

3. Materials and Methods
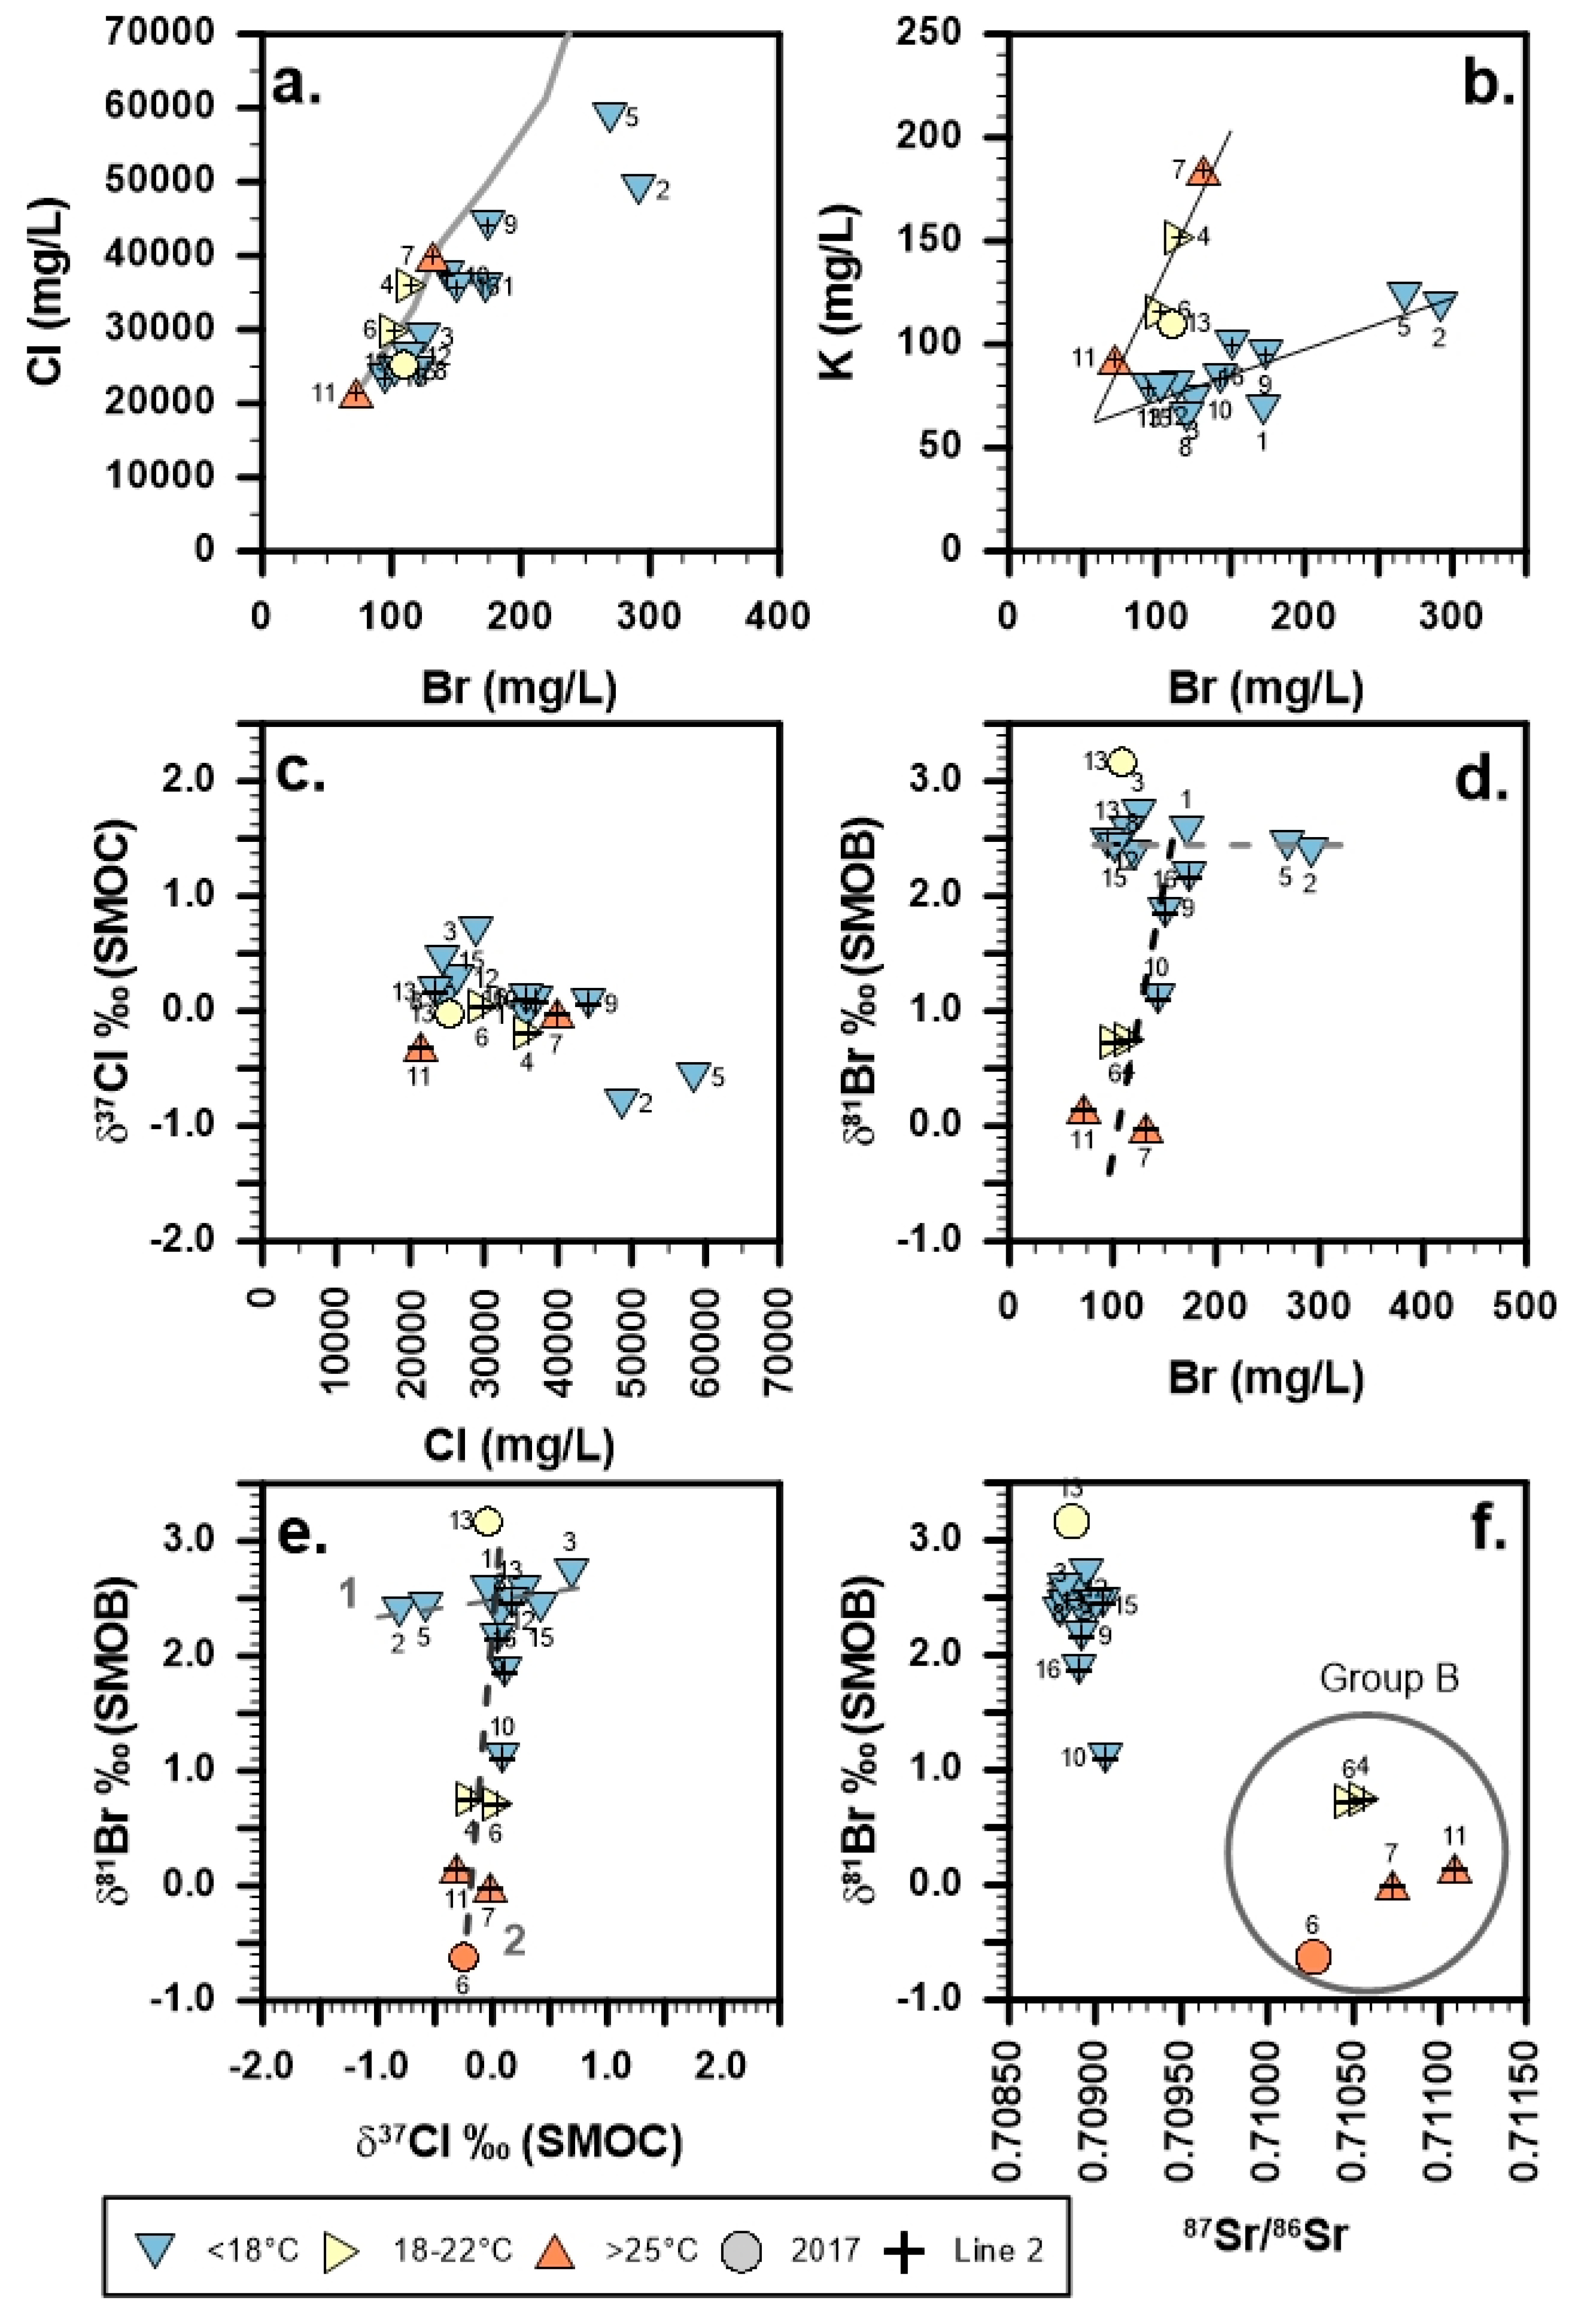
For this study, water and gas were sampled from wells located in four counties in southeast Kansas in November 2013 and March 2017, within an approximately 2500 km2 portion of the Cherokee Basin, with the distance between the two most distal wells approximately 50 km (Figure 1). During the initial study in 2013, samples for chemical and isotopic analysis of gas were collected from 16 wells, for chemical and isotopic analysis of water from 15 wells, and for bacterial culturing from 13 wells. Gas, water, and microorganism sampling is described in detail by Kirk et al. [43], as are techniques for fluid and gas geochemical analysis, stable isotopic analysis of gas (δ13C-CO2, δ13C-CH4, δ2H-CH4) and water (δ2H, δ18O), and anaerobic cultivation analysis and DNA sequencing.
Water and gas were resampled from two wells in March, 2017. Compared with 2013, daily gas production averaged over March 2017 decreased 3 and 7 mcf/d for the resampled wells (wells 6 and 13, respectively). It is typical for water production to be initially quite high from shale and CBM wells, as pressures are lowered to encourage release of sorbed gas [64]. Within five years, water production decreases dramatically, followed by a decline in gas and water production, and end of life for the well within 10–15 years [64,65]. During the 2017 resampling, water samples were collected in a similar manner as during the initial investigation, with a slight modification to filtration strategy. Water samples for isotopic analysis from the 2013 event were field-filtered with a 0.7 µm pre-combusted glass fiber membrane followed by a 0.2 µm polyethersulfone membrane, while isotopic samples from the 2017 event were not field-filtered. An additional gas sample was collected at each of the two wells sampled in 2017 using a method adapted from Hanlon, Stotler, Frape, and Gwynne [26]. Gas, which is separated from water within the well column, travelled through <1 m of polypropylene tubing at the surface to two Erlenmeyer flasks set-up in parallel. In the successive flasks, the gas was bubbled through 1000 mL and then 500 mL of 10 g/L KOH solution in ultrapure water for 2 h, with a goal of capturing and dissolving all gaseous forms of bromine as bromide. The hydroxide ion in KOH exchanges/substitutes with Br in reduced (e.g., CH3Br) and oxidized (e.g., BrO) compounds, and reacts with Br2, resulting in a solution containing dissolved KBr [10,66].
For this investigation, isotopic analyses for δ37Cl, δ81Br, and 87Sr/86Sr were completed on the water samples from both sampling events, and δ81Br for the two KOH solution samples, at the Environmental Isotope Laboratory (EIL) at the University of Waterloo. Analyses from the 2013 sampling event were performed in 2016, with analyses from the 2017 sampling event for δ81Br performed in 2017, and δ37Cl and 87Sr/86Sr in 2021. Samples were prepared for chlorine and bromine stable isotopic analysis following previously published methods [67,68], where dissolved chloride and bromide are converted to methyl chloride and methyl bromide, respectively. For stable chlorine isotopic determination, the samples, converted to methyl chloride, are injected into an Agilent 6890 gas chromatograph (GC) and measured on a Micromass Isoprime continuous flow isotope ratio mass spectrometer (CF-IRMS) with an internal precision of ±0.03‰. Stable bromine isotopic determinations are completed on a Thermo Scientific MAT 253 CF-IRMS with internal precision of ±0.03‰, after sample injection as methyl bromide into an Agilent 7890 GC via CombiPAL autosampler. Stable chlorine and bromine isotopic data are calibrated to at least two internal inter-lab calibrated standards and Standard Mean Ocean Chloride (SMOC) and Standard Mean Ocean Bromide (SMOB), respectively, and are reported in the delta-per mill (δ-‰) notation, relative to SMOC and SMOB, respectively. Strontium isotopic determinations were performed on a Thermo Scientific Triton Thermal Ionization Mass Spectrometer (TIMS) with an analytical precision of 2σ = 0.00004 following previously published procedures [69]. Strontium isotope analyses were corrected to the standard NIST-987.

4. Results

Temperature, chemical compositions and δ18O/δ2H isotopic values for water, and gas compositions and δ2H-C1, δ13C-C1, and δ13C-CO2 isotopic values for gases were initially reported by Kirk et al. [43], but bromide, chloride, and TDS data are summarized here to provide context. Bromide and chloride concentrations vary between 72 to 292 mg/L, and 21,300 to 58,540 mg/L, respectively. While bromide and chloride data generally plot along the seawater brine evaporation trend in the halite-precipitating region of McCaffrey, Lazar, and Holland [7], a slight excess of bromide is evident in several samples, with the highest excess in samples from wells 1, 2, and 5 (Figure 3a). Samples from wells 2 and 5 also have the highest TDS (76 and 91 g/L, respectively), although the specific conductance of water in the two wells (66.2 and 66.6 mS/cm) is only slightly above the mean (60.9 mS/cm). The TDS for water sampled from well 1 (56 g/L) is slightly above the mean (54 g/L), but the specific conductance of the water (49.9 mS/cm) is the second lowest of all the wells sampled.
Isotopic results for δ37Cl, δ81Br, and 87Sr/86Sr are reported here for the first time (Table 1). The range of δ37Cl values is smaller than values for δ81Br, with δ37Cl between −0.81 and +0.68‰ (SMOC), and δ81Br values between −0.63 and +3.17‰ (SMOB) (Table 1, Figure 3e). In general, δ37Cl values decrease with increasing chloride concentration (Figure 3c). Trends are less apparent for δ81Br; it is possible there is one trend where δ81Br values increase with a slight increase in bromide concentration (samples marked with a ‘+’ symbol in Figure 3d), and a second trend where isotopic values vary within a range above +2.00‰ as bromide concentrations increase (Figure 3d). The range of 87Sr/86Sr values is between 0.70880 and 0.71109, with samples clustered in two groups; 11 samples with values between 0.70880 and 0.70906, and four samples with more radiogenic values between 0.71048 and 0.71109 (samples 4, 6, 7, and 11) (Figure 3f).
Two wells were re-sampled just over three years after the first sampling event (wells 6 and 13). In 2017, oil in the water collected from well 6 overwhelmed the filtering capacity available in the field, so chemical results from that well are not available. The water from well 13 was also a little oily, but filtering in the field was still possible, and chemical compositions are reported here (Table 2). In well 13, the concentration of most ionic constituents increased from the 2013 to 2017 sampling, corresponding to a TDS increase from 38 to 42 g/L, an increase in the Br/Cl mass ratio from 0.00405 to 0.00434 (or a decrease in the Cl/Br mass ratio from 247 to 231), and an increase in temperature (from 17.7 °C to 21.1 °C) (Table 2). The δ81Br value for this well also increased from 2.46 to 3.17‰ (SMOB) between the 2013 and 2017 sampling events (Table 1). The δ81Br value for well 6 decreased between 2013 and 2017, from 0.72 to −0.63‰ (SMOB). These more extreme δ81Br values from the 2017 sampling event define the maximum and minimum of the range observed in this study (Table 1). Brominated gas recovered from well 6 had a δ81Br value of −0.81‰ (SMOB) (Table 1). Not enough brominated gas was recovered from well 13 to analyze the gas δ81Br composition. In both of the resampled wells, δ37Cl values decreased slightly (by 0.3‰ and 0.2‰ for wells 6 and 13, respectively) from 2013 to 2017 (Table 1).
Pearson correlations between different isotopic pairs and fluid temperatures are determined to identify potentially meaningful relationships (Table S1, Figures S1–S8). Statistically significant correlations (p < 0.10) are available for several, but not for every bivariate dataset (see Table S2 for p-values). Of note, significant very high (R = 0.90 to 1.00) and high (R = 0.70 to 0.90) positive associations are found for temperature with 87Sr/86Sr, δ2H with δ81Br, and δ18O with δ81Br. Very high and high (R = −1.00 to −0.70) negative associations are found for temperature with δ2H, δ18O, and δ81Br, and for δ2H with 87Sr/86Sr, δ18O with 87Sr/86Sr, and δ81Br with 87Sr/86Sr. It is notable that significant δ37Cl correlations are not observed for any of the water-based parameters tested. The stable isotopic compositions of gases were also compared with dissolved parameters to test a relationship between the stable isotopes of dissolved halogens (δ37Cl, δ81Br) and gases (δ2H-C1, δ13C-C1) observed by Stotler et al. [13]. Significant correlations are observed only between δ13C-C1 with δ81Br and δ37Cl; however, the associations are low (R = −0.50 to −0.30). Chlorine, bromine, and strontium isotope trends with either borehole depth below ground surface or end-of-hole elevation are also not evident (Figure S9).
Two groups of samples are identified based on several geochemical characteristics that are statistically different (Table S3). Water samples from Group A wells (n = 11) are lower temperature, with lower K/Br and higher Br/Cl × 1000 and Ca/Mg molar ratios, higher δ2H, δ18O, and δ81Br values, and less radiogenic 87Sr/86Sr values compared with Group B samples (n = 4). Gas samples from Group A wells also contain a lower amount of He gas than samples from Group B wells. Many other geochemical characteristics are not statistically distinguishable between the two groups, including TDS, δ37Cl, δ13C-CO2, δ13C-C1, δ2H-C1, or the molar ratios of Na/Cl, SO4/Cl, and SO4/Br. There is also no statistical difference in the total well depth, elevation of the bottom of the well, or elevation of the highest or lowest perforation intervals between the two groups.
Information about the fluid groups can be gleaned from comparisons of stable halogen isotopes (δ37Cl, δ81Br), 87Sr/86Sr, and Br/Cl ratios. Two distinct trends are apparent when comparing δ81Br and δ37Cl in a cross-plot (Figure 3e). For one group of samples (Line 1, Figure 3e), entirely composed of Group A wells, δ37Cl increases by 1.2‰ (from −0.81 to 0.68‰ (SMOC)) while δ81Br increases only slightly (from 2.35 to 2.71‰ (SMOB)). Along a second trend (Line 2, Figure 3e), consisting of all of the Group B wells and some Group A wells, δ81Br varies between −0.81‰ and +3.17‰ SMOB, with minimal change in δ37Cl values (−0.18 to 0.11‰ SMOC). All four of the samples exhibiting more radiogenic 87Sr/86Sr values and higher temperatures (Figure 3f) plot at the end of Line 2 with the lowest δ81Br values (Figure 3e). The groups of wells that plot along two trend lines in Figure 3e are also distinctly evident in numerous other geochemical comparisons, including comparisons of Br/Cl ratios with δ37Cl, δ81Br, 87Sr/86Sr (Figure 4), and comparisons of Br with K concentrations (Figure 3b).
Further insight into the fluid groups and apparent trends is obtained through spatial analysis. The samples with the more radiogenic 87Sr/86Sr and lower δ81Br values (Group B) were primarily obtained from wells in central/southwest Neosho county (Wells 4, 6, and 11), and one (Well 7) located in the western part of the study area in central Wilson county (Figure 5). The one well (Well 6) where a gas δ81Br analysis was obtained, and with the lowest δ81Br value in the study, is a part of this cluster of wells in Neosho County. The Group A wells that plot along Line 2 (Wells 9, 10, 16) are also found in central Neosho County. Well 13, where Lines 1 and 2 meet (2013 sample, Figure 3e), is located nearby, in the same part of Neosho County. The highest δ81Br value was also obtained from this well (2017 sample; Table 1). The most negative δ37Cl samples were obtained from wells located in the western part of the study area (Figure 5). There, wells 2 and 5 had the highest TDS, the highest excess Br concentration relative to Cl, and the most negative δ37Cl values (Table 1, Figure 3 and Figure 5). Wells 5 and 7, located in central Wilson county, despite their proximity to one another, plot near the distal ends of trend lines A and B in Figure 3e, and have distinct 87Sr/86Sr isotopic ratios (Figure 3f, Figure 5).

5. Discussion

The data indicate that there are two different processes affecting the halides, and at least two, if not three, different sources of salinity despite the close spatial association of Group A and B wells in Neosho and Wilson counties (Figure 5). The higher temperature and He content of Group B fluids would suggest these fluids are at least partially sourced from deeper units, as compared with Group A. The Line 2 wells (including most of Group B—Table S3), located in central and southwestern Neosho County, are near one of several temperature and geothermal gradient anomalies (Galesburg Anomaly, Figure 5) that have been identified in the Cherokee Basin [46]. The origins of the temperature and geothermal anomalies are not entirely certain, but are likely related to a combination of radioactive production in the Precambrian basement, the thickness of the shales in the Cherokee Formation, and fluid flow [46]. In the area of the Galesburg Anomaly, the thermal anomaly is well-defined with abrupt temperature changes of 5.6 °C along its lateral boundaries [46].
In the Galesburg Anomaly, rock thermal conductivity does not correlate with the geothermal gradient, suggesting that fluid is moving upward along faults/fractures from or through the underlying WIPAS strata [46]. This interpretation is consistent with higher He content in wells near this location, implying a deeper source for Group B waters. However, the effects of 8 to 12 years of pumping prior to geochemical sampling likely affected the fluid flow, as the location of the Line 2 wells is slightly offset from the Galesburg Anomaly, which was identified based on temperature measurements at the time of drilling. Changes in chemical and isotopic composition of waters across the production lifespan of a well or well-field has been observed elsewhere and have been attributed to groundwater inflow to the formation due to pumping [65]. Thus, Line 2 (Figure 3) is likely representative of mixing between the deeper-source fluids and other fluids in the Cherokee Formation. This provides the possibility that the one gas δ81Br value obtained could be derived from the deeper units. Although Newell [46] did not observe a geothermal or temperature anomaly near Well 7 in Wilson County, the geochemical data suggest a similar, but more limited, upward leakage process is occurring in this area.
The geochemical origins of the high δ81Br and the evolution of δ37Cl in Group A fluid along Line 1 are not as easily discerned as the fluid mixing process along Line 2. Nine of the 15 total wells sampled (60%), and all of the wells along Line 1 (Figure 3e) that are interpreted as unaffected by the deeper fluids, have δ81Br values above +2.00‰ (SMOB). These high δ81Br values may be significant, as only 18 of the 629 (3%) previously published groundwater δ81Br values are above +2.00‰ (SMOB) (Figure 6; references in figure caption). Other high values are reported in the Siberian Platform (including the highest published value of +3.35‰), the Bohemian Massif, southern Ontario sedimentary units (in Lower Silurian Whirlpool Fm, Middle Ordovician Trenton Fm, and one spring of unknown origin), Williston Basin (all in the Upper Devonian Bakken Shale, 30% of samples from the Bakken Shale), and the Fennoscandian Shield (Table S4). Most of the fluids with δ81Br > 2.00‰ are hosted in source rock formations with a high organic content. In the remaining studies of groundwater bromine stable isotopic composition (n = 251 samples), reported groundwater δ81Br values were less than 2.00‰ (SMOB) (Table S4). Although higher δ81Br values in fluids seem to be associated with organic-rich formations, numerous processes and fluids affect sedimentary formations, and not all samples from organic-rich formations have water with high δ81Br ratios. Thus, to identify the source(s) or process(es) affecting the bromine isotopic compositions in the Cherokee Basin, the discussion will look first to compare geochemistry of the study site with regional aquifers and past fluids to evaluate possible processes and solute origins.

5.1. Geochemical Relationships of Cherokee Basin CBM Produced Waters to Regional Aquifers

The fluids sampled in this study have geochemical similarities to the fluids found in the WIPAS. Geologically and geographically, this study is located in WIPCS (the confining units above the WIPAS), and just to the west of the confluence of three regional flow systems in the deeper aquifer system [47,55]. Musgrove and Banner [55] used a comparison of δ2H and Cl, which are relatively conservative, supported by 87Sr/86Sr data, to identify mixing between three end-member fluids in Cambrian to Mississippian aquifer units beneath southeastern Kansas. Endmember (1) is fresh water recharging the OPAS east of the study area; endmember (2) is a fresh water recharging in the Colorado Front Range that mixes with a fluid dissolving Permian salts; and endmember (3) is a saline water, possibly evolved from evaporated seawater, emanating from the Arkoma basin to the south and/or Anadarko basin to the southwest. More recent work by Scheerhorn [74] indicated the possibility of an additional endmember contributing freshwater to the western and central portions of the WIPAS. The Group A and B fluids of this study correspond geochemically with Musgrove and Banner [55] fluid groups 3B and 3C (Figure 7). These fluid groups are predominantly affected by Endmembers 2 and 3. Group A (and 3B) waters are more closely related to Endmember 3, whereas Group B (and 3C) waters are more closely related to Endmember 2. In the WIPAS, fluid group 3B was identified in southern Kansas and Northern Oklahoma, all the way to the Colorado border, but 3C was only identified along the transition zone between Endmember 2 and 3 waters [55,74]. According to Musgrove and Banner [55] the salinity of Endmember 3 is thought to originate from seawater evaporation, whereas the salinity of Endmember 2 is thought to originate from dissolution of halite. Later studies have also suggested the salinity in the basins to the south originated as residual evaporite brines refluxing at low temperatures during the Permian [49,52].
The geochemical signatures of Desmoinesian Series CBM produced fluids from the Forest City Basin [63] are distinct from the Cherokee Basin fluids studied here (Figure 7). Fluids from the Forest City Basin are more closely associated with Musgrove and Banner [55] fluid groups 1C, 1D, and 2C, and have a much lower salinity (<25 g/L). On the other side of the Bourbon Arch and hydraulically down-gradient from the present study area, the Forest City Basin fluids likely have not significantly affected Cherokee Basin CBM fluid chemistry.
Despite evidence for upward flow in the area of the Galesburg anomaly, the fluids sampled here are more saline than in Mississippian and Arbuckle strata immediately underlying the study area; however, more saline water is found in those deeper strata to the west and southwest (e.g., [55,56,74]). Fluid salinity in the Mississippian beneath Wilson, Neosho, and Labette counties are estimated at between 2400 and 26,300 ppm, but are higher, between 44,300 and 68,800 ppm, in Montgomery County to the southwest. Data for the Arbuckle also indicate salinities are higher in Montgomery County (17,200–39,900 ppm) than Labette or Neosho counties (1500–25,300 ppm), although the most saline fluid was sampled in Wilson county (62,300 ppm) [46,55]. Fluids in the Cherokee Group have a similar spatial trend, higher salinities in the west and southwest compared to the east. Northwest and west of the study area, salinities in the Mississippian are similar (43,000–73,000 ppm), and higher (>90,000 ppm), respectively.
Thus, the higher salinities observed in this study did not originate from the upward leakage of waters within the study area. Rather, these upward moving fluids are decreasing the salinity in the Cherokee Group. It could be hypothesized that the higher salinity fluids sampled locally in the Cherokee Group come from upward and then lateral flow of fluids from the deeper Mississippian and Arbuckle northwest, west, and/or southwest of the study area, but these fluid flow pathways are difficult to explain given current regional hydrogeology. Alternatively, a reasonable hypothesis is that fluids are migrating northward from deeper areas of the Arkoma Basin. Conduits for fluid flow may be controlled by fault and fracture systems that have acted as pathways for hydrothermal fluid flow since the Pennsylvanian. In southeastern Kansas and in the tri-state Mississippi Valley-Type district, southeast of the study area, the top of the Mississippian section acted as a preferred south-to-north fluid pathway for hydrothermal fluids, which leaked upwards into the Pennsylvanian section in areas with faults and fractures [52]. Thus, although the Pennsylvanian is a regional aquitard, it is locally and periodically leaky with respect to the underlying aquifers [52].
Given the strong correlation between 87Sr/86Sr and δ81Br in the Cherokee Basin CBM produced waters, 87Sr/86Sr ratios from across the Midcontinent are considered here. The 87Sr/86Sr ratio of Group B fluids (0.71048–0.71109) is lower than all Musgrove and Banner [55] Group 2 waters, but similar to those of Group 3C (Figure 7). The less radiogenic strontium of Group A samples (0.70880–0.70906) is similar to, but in general lower than, Musgrove and Banner [55] Group 3 waters, or any Mississippian or Arbuckle water sampled by Musgrove and Banner [55].
While this study provides the first look at 87Sr/86Sr compositions of any media associated with the coals and shales of the Cherokee Group, 87Sr/86Sr data are available for comparison from the Cambrian–Ordovician, Mississippian, Upper and Lower Pennsylvanian, and Permian strata in the Midcontinent [52,55,74,76,77,78,79,80,81,82,83]. The fluid 87Sr/86Sr values from this study (0.70880–0.71109) are on the low end of 87Sr/86Sr compared with rock data from these previous investigations. The range of values obtained in this study is similar to, but slightly narrower than that in fracture filling calcites (0.70842–0.71746) and baroque dolomite (0.70908–0.71019) that record past fluid flow in deeper Mississippian and Arbuckle strata west of the Nemaha Ridge and southwest of the study site [52,82,83]. Solution-mined Permian salts from west of the Nemaha Ridge have a similar 87Sr/86Sr value (0.708843) as the Group A samples from this study, within the range for Lower Permian halite (0.70848–0.70897) identified in a previous study [75,84,85].
Only Group A samples from this study have strontium isotopic compositions that overlap the range for Phanerozoic seawaters, which varied between 0.7068 and 0.7092 [86], while Group B samples had higher 87Sr/86Sr ratios (Table S3). The 87Sr/86Sr ratios for Group A samples (mean 87Sr/86Sr: 0.70892) are just slightly higher than Pennsylvanian seawater (0.70809–0.70830), with values peaking during the Desmoinesian, Missourian, and Virgilian [87]. Although seawater values were significantly higher during the Pennsylvanian than during the Permian or Mississippian, the highest 87Sr/86Sr seawater values are from the middle and late Cambrian into the early Ordovician (0.70875–0.70903) [87,88].
It is not uncommon for sedimentary basin formation waters to have higher 87Sr content than seawater [52,55,79,80,82,89]. Increasing 87Sr/86Sr ratios in saline subsurface fluids in Kansas was previously attributed to illitization in Pennsylvanian strata, and water–rock interaction with basement rock or hydrothermal fluids [55,79]. Higher 87Sr/86Sr values in Musgrove and Banner [55] Endmember 2 samples were attributed to this process as fluids that dissolved Permian halite transited Pennsylvanian argillaceous shales towards the WIPAS. Given the current temperatures and 87Sr/86Sr in the Cherokee Group in this study, it is suggested that illitization is not currently a significant local process. Other processes of rock–water interaction are still feasible, however, (i.e., alteration of feldspars) and are consistent with the paragenesis of these rocks [50,51].

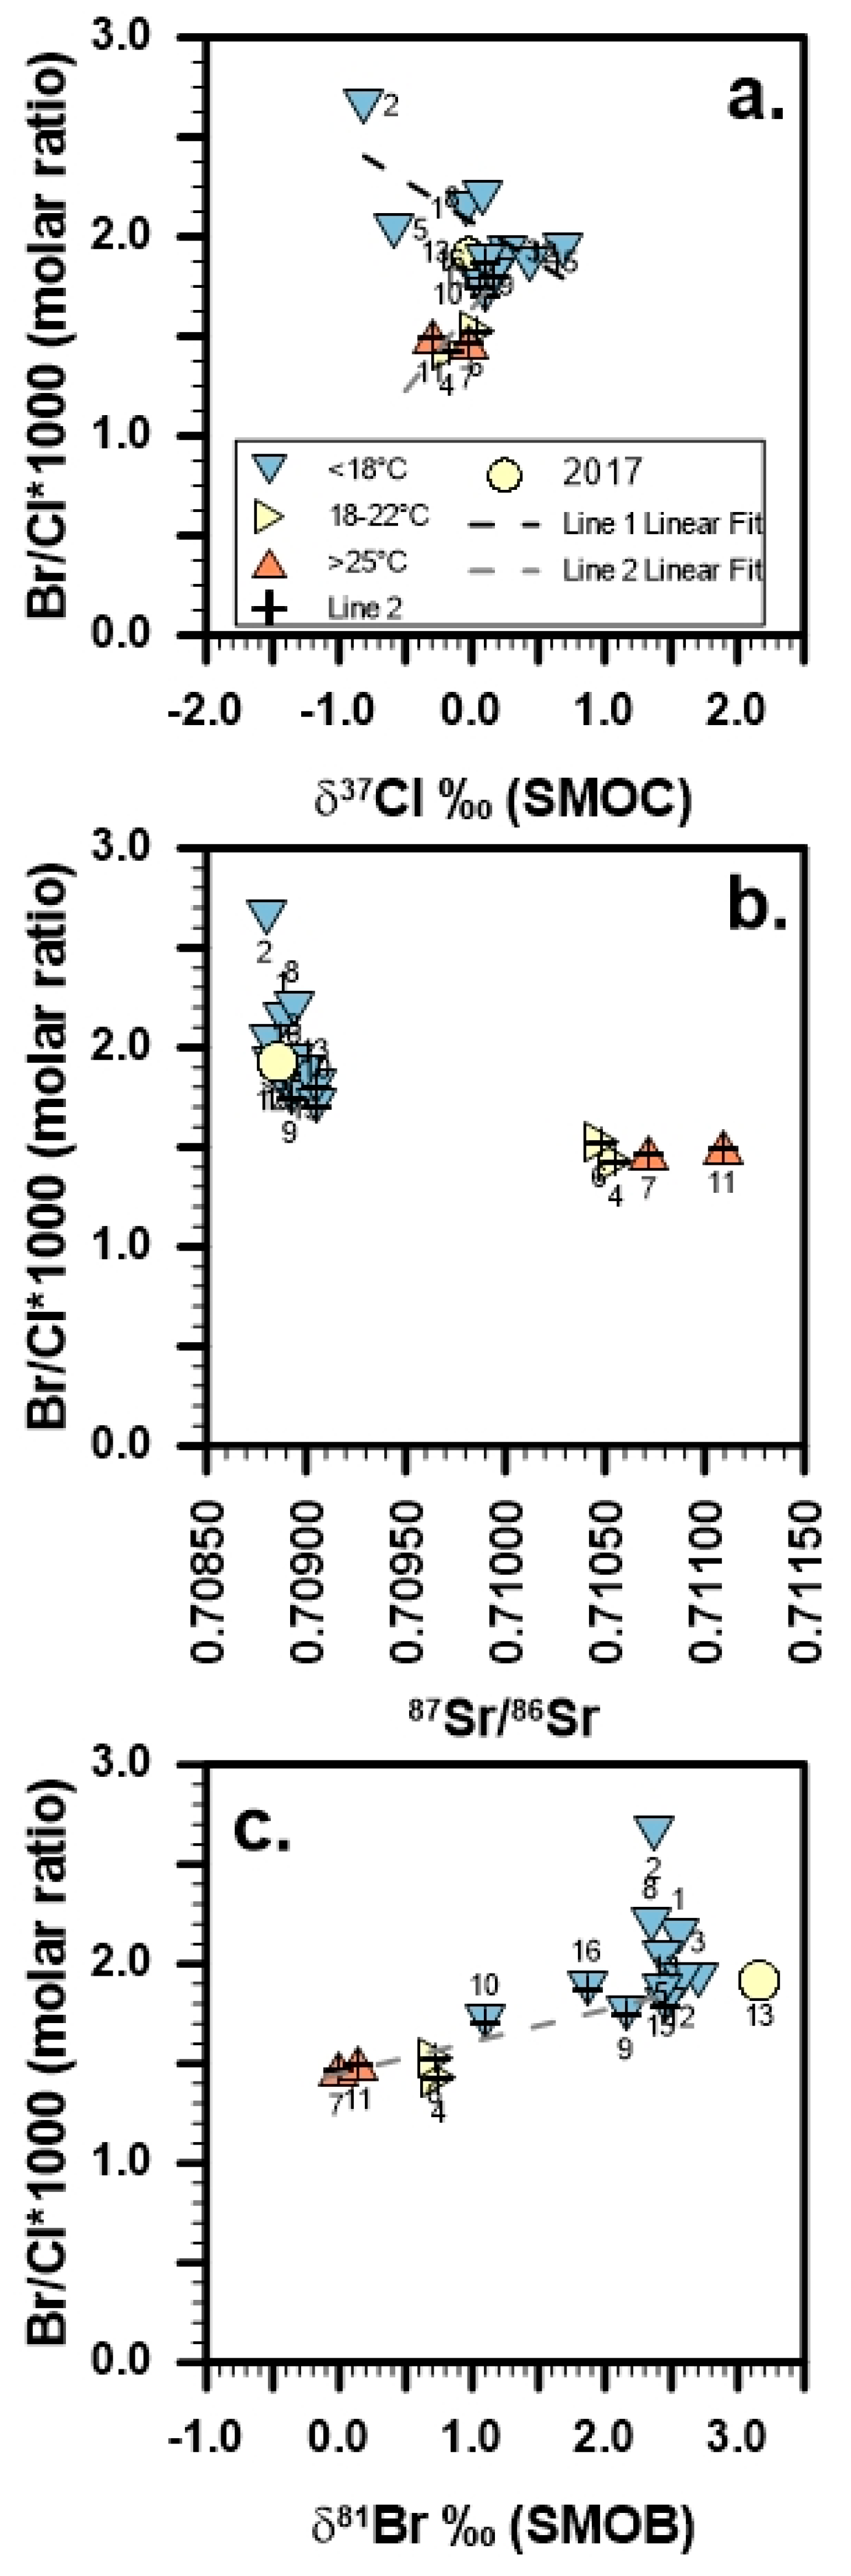
5.2. Sources and Processes along Line 1: Development of Enriched Br/Cl, High δ81Br, and Changing δ37Cl

The regional flow system evaluation above provides a reasonable explanation for the two distinct fluid groups sampled during this study and the evolution of fluids along Line 2, but it does not explain the evolution of δ37Cl along Line 1, or the origin of high δ81Br and enriched Br/Cl ratios in Group A fluids. Within Group A, characterized by uniformly high δ81Br and low 87Sr/86Sr, there is a large variation in δ37Cl values along Line 1 (Figure 3), indicating either two sources of chloride within this group, or a process affecting the δ37Cl isotopic composition that does not significantly affect other components. Br/Cl ratios are often used for describing evolution of salinity, as a saline fluid with an evaporative origin should have a considerably higher Br/Cl ratio than one resulting from dissolution of halite, although other processes, like cycles of incongruent dissolution and reprecipitation also affect Br/Cl ratios [4,90]. In a comparison of δ37Cl and Br/Cl ratios, Group A fluids exhibit a slightly decreasing Br/Cl ratio with increasing δ37Cl value, a trend distinct from Group B fluids, where both Br/Cl ratios and δ37Cl values increase (Figure 4a). The 87Sr/86Sr ratio for group A fluids is similar to solution-mined Permian halite from central Kansas (0.708843) [75], but the Br/Cl ratio is much higher for Group A (Figure 7). The increase in δ81Br from 2013 to 2017 for well 13 is also noteworthy. Although temperature increased over this period, indicating an increase in fluid contributions from deeper formations through the Galesburg Anomaly, this should have resulted in corresponding decrease in δ81Br ratios. However, as only limited sampling occurred in 2017, it is unknown whether δ81Br evolved further in other wells.
The Cherokee Basin fluids reveal an endmember for fluids sampled across the Midcontinent Paleozoic strata with respect to Br/Cl and 87Sr/86Sr (Figure 7). The more saline wells sampled in this study (2, 5) represent an indicator toward the end-member chemistry, although given the high δ81Br ratio in the 2017 well 13 sample, it is probable the end-member is not captured in this study. The evolution of increasing Br relative to Cl appears to represent a newly identified end-member within the regional aquifer/aquitard system; this is associated with an increase/high in δ81Br and a substantial decrease in δ37Cl (Figure 6). Because the Br/Cl ratios and 87Sr/86Sr ratios are end-members within the context of the regional flow system, the process or processes affecting these compositions must be explored. The high δ81Br values are not readily explained through previous experimental or theoretical work on bromine isotope fractionation. Several hypotheses have been developed to explain δ81Br evolution; below, the CBM data will be viewed with respect to three of the known and hypothesized fractionation pathways.

5.2.1. Evaporation of Seawater or Dissolution of Evaporites

As distinct processes that result in different fluid geochemistry, evaporation of seawater, and dissolution of evaporites will be considered separately, first by examining known δ37Cl and δ81Br isotopic compositions for evaporites. During evaporation, δ37Cl values in brine and precipitate sequentially decrease with increasing evaporation and precipitation, as the heavier 37Cl isotope is removed from solution and fractionated into the solid phase [91]. Experimental results suggest a smaller effect on δ81Br due to evaporation and precipitation compared with δ37Cl, with the direction and amount of fractionation dependent on the dominant cation [25]. Incongruent dissolution and partial recrystallization can increase the δ37Cl by 0.8‰ if a majority of the halite is dissolved, but in general, fractionation of δ37Cl is not expected to occur after burial [92,93,94]. Marine-derived evaporite deposits thus have a range of δ37Cl values predominantly between −0.5 and +0.5‰, but could be between −0.9 and 0.9‰, with additions of continental chloride, pushing values further from that derived from precipitation from evaporated seawater [27,91,92,94,95]. A significantly greater range in δ37Cl values has been observed in evaporites in arid continental basins compared to marine basins [96,97,98]. The highest fluid δ37Cl values in this study are higher than those observed during experimental evaporation of seawater and in the Permian salts of the Palo Duro Basin southwest of the study site, which evolved from marine to continental [84,95]. Most Permian salt in southern portions of the Midcontinent Region are thought to have a marine origin, but in the central and northern reaches, some have a lacustrine origin [99,100]. The known range of values for δ81Br in evaporites is considerably less, but with considerably fewer samples analyzed. In both terrestrial and marine evaporites and the associated fluids, the δ81Br values are less than 1.3‰ and 1.5‰ (SMOB), respectively [26,27,101]. This would seem to preclude evaporation as a source for the high δ81Br values observed here.
A trend where δ37Cl varies significantly while δ81Br remains relatively unchanged was previously hypothesized to indicate halite dissolution, as there is considerably less bromide in halite compared with chloride [71]. In this scenario, a (still unknown) process would result in the high δ81Br values observed in this study, with the fluid subsequently dissolving halite. However, several lines of evidence argue against this pathway in the study area. First, significant amounts of halite are not available for dissolution in the units studied. Although thick Permian salts are present to the west and up-section of the study area and presumably were present over the current study area in the past, dissolution of these salts is not suspected as the source of the low 87Sr/86Sr water that comprise Group A waters, which appear more similar to Anadarko Basin fluids (see discussion above). The relatively constant Br/Cl ratios for Group A samples also does not provide strong support for dissolution of evaporites. Regardless, if evaporite dissolution does indeed account for δ37Cl behavior, a second, separate process or source is still required to account for the high δ81Br values.

5.2.2. Gas–Halide Interactions

Very limited data are available to evaluate the effects of any possible interactions between halides and gases in this study area. Only one gaseous δ81Br sample was able to be analyzed of the two that were attempted, as the second had insufficient bromine for analysis after two hours of collection. The one sample has a δ81Br value similar to those obtained in the surface environment, but is less than atmospheric CH3Br [26,38,102]. The sample was obtained from a well interpreted to predominantly sample upward flowing fluids in the Galesburg Anomaly. Correlations between δ81Br and δ13C-C1 are weak, and even less strong between δ37Cl and δ13C-C1 (Table S1). Furthermore, although bacteriogenic methanogenic pathways are correlated with TDS in the Cherokee Basin [43], there is no apparent correlation between δ81Br or δ37Cl with TDS. Thus, there would appear to be no relationship between the bacteriogenic pathway and stable halide isotopes.
There are several possible mechanisms by which gas-halide interactions might fractionate dissolved δ81Br values: (1) during formation of the halide-containing gas molecule, (2) exchange between the gas molecule and dissolved Br, (3) escape of halide-containing gas molecules, and (4) degradation of halide-containing gases. Experimental data are only available for the final process (4), which indicate an initial enrichment in 13C and 81Br, but a depletion of 2H in dissolved CH3Br during abiotic decomposition, with evidence of bromine isotopic exchange at high methyl-bromide concentrations [28]. As the expected enrichment (relatively higher 81Br in the gaseous phase) is the opposite of what was observed (relatively higher 79Br in the gaseous phase), abiotic decomposition likely does not account for the high dissolved bromide δ81Br and low gaseous phase δ81Br values. Assuming formation of the gaseous phase proceeds in the opposite direction of degradation (i.e., an enrichment in 79Br in the gaseous phase), the low gas bromine isotope value is favorable for the enrichment of 81Br in fluids. However, dissolved bromide concentrations are currently relatively high, and given the difficulty in obtaining enough sample to analyze, concentrations of gaseous-Br compounds appear low. Thus, evolving a high dissolved δ81Br value would require a large loss of 79Br mass to the gaseous phase and subsequent escape. As the system has clearly not been closed over geologic history [52], it is of course possible for gaseous bromine to have escaped from the system. However, this would suggest either the initial Br/Cl ratio were even higher than presently observed at the site, or the concurrent or subsequent loss of Cl, but there are no data to support this hypothesis. Furthermore, formation of compounds such as HBr and CH3Br should result in fractionation of hydrogen and/or carbon isotopes, but is not evident in the data. Finally, the fluid δ81Br isotopic compositions in the two wells sampled for gaseous δ81Br moved in directions opposite to what would be expected for fractionation during formation of the gaseous phase (i.e., fluid δ81Br increased where no Br-containing gaseous compounds where found, and decreased where they were sampled). Although a gas–halide interaction process is not considered a significant factor currently affecting the evolution of bromine isotopic compositions at this site, it should be tested further to confirm this conclusion due to the limited dataset.

5.2.3. Water–Rock Interaction/Water–Organic Matter Interaction

Given the distinct δ81Br values between Groups A and B, the variation in δ37Cl observed in Group A, and the strong correlation between δ81Br and 87Sr/86Sr, the possibility of water–rock interaction affecting the halogen isotopic composition needs to be explored. The wells in this study are screened predominantly in organic-rich coal and shale units, similar to most of the other subsurface fluid samples worldwide with similar δ81Br values (>+2.00‰ SMOB). As such, the possibility of water-rock interaction with these organic-rich strata needs to be explored.
The chemistry and modes of occurrence of chlorine, and to a lesser extent, bromine, in coal has been extensively studied. While chlorine content increases with coal rank, bromine concentrations do not appear dependent on grade [37,42]. Through the coalification process, initially high concentrations of chlorine and bromine in the source organic material are expected to decrease [37,42]. Subsequent flushing of coals by subsurface fluids, weathering, and volcanism further affect the halogen content of coal deposits [42,103]. The highest concentrations of chlorine and bromine are in coals with pore sizes less than 30 nm, and likely greater than 1.2 nm [42]. Of course, concentrations of chlorine and bromine in coal vary geographically and across geologic time [42]. Despite these variations, coal units generally have higher water-soluble Br/Cl ratios than would be expected for seawater or seawater evaporated past halite precipitation [104]. Exchange or incorporation of bromine and chlorine from coals to formation water could thus account for the higher Br/Cl ratios observed in this study. Observations that some of the highest bromide concentrations and bromide/chloride (Br/Cl) ratios are found in groundwaters associated with coal seams [40,41] provide further support for water-rock interactions with the coal affecting the bromide concentrations and Br/Cl ratio in this study.
In coal, bromine and chlorine occur primarily within the organic components, with bromine at least 70% organically associated, and chlorine either equally distributed between organic and inorganic forms or predominantly present as halite [42,103,105]. Organically associated compounds may be covalently bonded as water-insoluble organo-halides or as ion exchange components of various surface or function groups, and to a lesser extent, as dissolved chloride and bromide coating the surfaces of the coal, likely anchored to organic ionic complexes [37,42,106]. There remains uncertainty on the mode of occurrence for chlorine and bromine in coals, especially with regard to the soluble fraction [103,104]. Much of the uncertainty over the amount of soluble fraction arises over disagreement on methodology for determination [37,103,104]. These methodological differences may also affect determination of exchange sites with varying affinity for chlorine or bromine, with bromine more likely associated with nitrogen functional groups [37,42]. It is generally thought, however, that there is a higher proportion of water-soluble Cl than Br [42]. Thus, the high Br/Cl ratios in most coal units do not support a strong component of soluble seawater-derived salts [104].
It is possible for water–rock (or water–organic matter) interaction to effect the changes to the Br/Cl ratios and the δ37Cl and δ81Br isotopic compositions observed within the Group A samples. This would likely require an exchange or other chemical process to release organically bound bromine, thus affecting bromide concentrations and δ81Br isotopic compositions. In this scenario, organically bound bromine would be initially enriched in 81Br, and/or preferentially release 81Br. The δ37Cl composition is more variable within Group A waters, which could indicate preferential incorporation of, or exchange with, soluble chloride in the coals. Release of Br from coal organics could be a result of microbial-degradation [107]. Depending on the form of Br and the organic compounds, this release could even be the result of a progressive reductive debromination, which could increase the dissolved bromide relative to chloride. Such processes typically result in enrichment of the heavy isotope in the substrate, and the limited information available for brominated organic compounds suggests a similar trend is expected [108]. If this process has occurred in the Cherokee Basin, given the high δ81Br in the fluids, it would suggest the organics are mostly debrominated and the previously released bromine with a lighter isotopic composition has escaped. Clearly identifying the functional groups which incorporate Br in coal would be necessary to identify which step in the degradation process would affect Br release. Unfortunately, information on the isotopic composition or association of bromine and chlorine within the Cherokee Basin coals, and the association of the Br are not known at this time. A study focusing on the coal units is needed to better understand the effects of organic matter on the δ37Cl and δ81Br isotopic compositions.

6. Summary and Conclusions

Many of the produced fluids sampled in this study have strong geochemical similarities to fluids in deeper regional flow systems. The geochemical and isotopic data indicate mixing of two different fluids in the Cherokee Group within the study. Upward movement of a lower salinity fluid is occurring above and down-gradient of a geothermal anomaly, with the remaining fluid in the Cherokee Group more saline than deeper fluids. This indicates either further development of fluid salinity occurs within the formation, or more saline fluids from deeper formations south or west of the study area move upward into the Cherokee Group in those areas before moving laterally to the study area. The δ81Br and 87Sr/86Sr ratios of the fluids are particularly sensitive in distinguishing between the two fluid sources.
The δ37Cl and δ81Br data indicate an additional process, beyond mixing of the two fluids, is affecting dissolved bromine and chlorine components. Although the relationship between δ37Cl and δ81Br, combined with 87Sr/86Sr values similar to Permian halite could indicate halite dissolution, Br/Cl ratios do not support this pathway. Influence of Pennsylvanian seawater could also account for less radiogenic 87Sr/86Sr ratios.
The δ81Br isotopic compositions found in this study are amongst the highest found so far in subsurface fluids. Fluids in this and other studies with similar high δ81Br compositions were found in association with organic-rich host rocks. Insufficient data was available to evaluate changes to the isotopic composition due to fluid interactions with bromine- and/or chlorine-containing gases or water–rock (water–organic matter) interaction. However, halide–gas interaction would require significant loss of bromine to the gas phase, as well as loss of chlorine. While the system has been open in the past, the observed changes in fluid δ81Br compositions from 2013 to 2017 suggests this is not a major process affecting the δ81Br composition. The significant and very high negative correlation between δ81Br and 87Sr/86Sr, and δ2H suggests bromine stable isotopes are strong indicators of water–rock interaction in the Cherokee Basin. It is further hypothesized that organic matter–water interaction is an important process in the development of the high δ81Br values, with high δ81Br values (>2.00‰ SMOB) in Cherokee Basin fluids derived from interactions with organic-rich shales and coals. Investigation of stable bromine isotopic compositions of nearby rock units and organic matter are needed to better clarify this relationship.

Supplementary Materials

The following are available online at https://www.mdpi.com/article/10.3390/min11040358/s1, Table S1: Pearson R correlations for various bivariate datasets, Table S2: The p-values for various bivariate datasets, Table S3: Summary of geochemical characteristics of Group A and B fluids, Table S4: Number and percentage of samples with δ81Br > 2.00‰. Figure S1: Comparisons of temperature with (a) δ2H-H2O, (b) δ18O, (c) δ37Cl, (d) δ81Br, (e) 87Sr/86Sr, (f) δ2H-C1, Figure S2: Temperature vs. (a) δ13C-C1, (b) δ13C-CO2. Figure S3: δ2H-H2O vs. (a) δ13C-C1, (b) δ13C-CO2, (c) δ37Cl, (d) δ81Br, (e) 87Sr/86Sr, (f) δ2H-C1., Figure S4: δ18O vs. (a) δ13C-C1, (b) δ13C-CO2, (c) δ37Cl, (d) δ81Br, (e) 87Sr/86Sr, (f) δ2H-C1, Figure S5: δ2H-H2O vs. δ18O, Figure S6: δ37Cl vs. (a) δ13C-C1, (b) δ13C-CO2, (c) δ2H-C1, (d) δ81Br, (e) 87Sr/86Sr, Figure S7: δ81Br vs. (a) δ13C-C1, (b) δ13C-CO2, (c) δ2H-C1, (e) 87Sr/86Sr, Figure S8: 87Sr/86Sr vs. (a) δ13C-C1, (b) δ13C-CO2, (c) δ2H-C1; (d) δ2H-C1 vs. δ13C-CO2; and δ13C-C1 vs. (e) δ13C-CO2, (f) δ2H-C1, Figure S9: δ37Cl vs. (a) depth (bgs = below ground surface) and (b) end of hole (EOH) elevation (AMSL = above mean sea level); δ81Br vs. (c) depth and (d) EOH elevation; and 87Sr/86Sr vs. (e) depth and (f) EOH elevation.

Author Contributions

Conceptualization, R.L.S.; Methodology, R.L.S., M.F.K., S.K.F. and R.G.; Data curation, R.L.S., M.F.K. and K.D.N.; Formal analysis, R.L.S.; Funding acquisition, M.F.K., S.K.F. and R.L.S.; Investigation, R.L.S. and M.F.K.; Project administration, R.L.S.; Resources, R.L.S., M.F.K., S.K.F. and R.G.; Supervision, R.L.S., M.F.K., S.K.F. and R.H.G.; Visualization, R.L.S. and K.D.N.; Writing—original draft preparation, R.L.S.; Writing—review and editing, R.L.S., M.F.K., R.H.G., K.D.N., S.K.F. and R.G. All authors have read and agreed to the published version of the manuscript.

Funding

This research was funded by the American Chemical Society Petroleum Research Fund (new investigator award no. 53188-UNI2) to M.F.K., Natural Sciences and Engineering Research Council of Canada Discovery Grant awarded to S.K.F., and support from the University of Kansas, Kansas State University, and the University of Waterloo.

Data Availability Statement

The Cherokee Basin data presented in this study are available in this article and in Kirk et al. [43]. Bromine isotope data referenced in Figure 6 not from the Cherokee Basin are available in several publications and a dissertation available online [10,11,12,13,14,15,16,17,18,19,20,21,22,70,71,72,73]. Data in Figure 7 from the WIPAS are from two publications and two dissertations available online [55,63,74,75].

Acknowledgments

Access to gas wells was provided by PostRock Energy Corporation (2013) and RiverRock Operating, LLC (2017). Travis Cobb and David Van Dyke coordinated access to wells and company equipment.

Conflicts of Interest

The authors declare no conflict of interest. The funders had no role in the design of the study; in the collection, analyses, or interpretation of data; in the writing of the manuscript, or in the decision to publish the results.

References

  1. Hanor, J.S. Chemical Properties of Subsurface Brines—Origin and Migration of Subsurface Sedimentary Brines; Hanor, J.S., Ed.; SEPM Society for Sedimentary Geology: Tulsa, OK, USA, 1987; Volume 21. [Google Scholar]
  2. Carpenter, A.B.; Carpenter, A.B. Origin and Chemical Evolution of Brines in Sedimentary Basins. In Proceedings of the SPE Annual Fall Technical Conference and Exhibition, Houston, TX, USA, 1–3 October 1978; Ohnson, K.S., Russell, J.A., Eds.; Society of Petroleum Engineers: Houston, TX, USA, 1978; pp. 60–77. [Google Scholar]
  3. Rittenhouse, G. Bromine in oil-field waters and its use in determining possibilities of origin of these waters. AAPG Bull. 1967, 51, 2430–2440. [Google Scholar] [CrossRef]
  4. Kharaka, Y.K.; Hanor, J.S. 7.14—Deep Fluids in Sedimentary Basins. In Treatise on Geochemistry, 2nd ed.; Drever, J.I., Ed.; Elsevier: Oxford, UK, 2014. [Google Scholar] [CrossRef]
  5. Davis, S.N.; Whittemore, D.O.; Fabryka-Martin, J. Uses of chloride/bromide ratios in studies of potable water. Ground Water 1998, 36, 338–350. [Google Scholar] [CrossRef]
  6. Whittemore, D.O. Fate and identification of oil-brine contamination in different hydrogeologic settings. Appl. Geochem. 2007, 22, 2099–2114. [Google Scholar] [CrossRef]
  7. McCaffrey, M.A.; Lazar, B.; Holland, H.D. The evaporation path of seawater and the coprecipitation of Br and K+ with halite. J. Sediment. Petrol. 1987, 57, 928–937. [Google Scholar]
  8. Eggenkamp, H.G.M. Why are variations in bromine isotope compositions in the Earth’s history larger than chlorine isotope compositions? Ann. Univ. Mariae-Curie-Sklodowska Sect. AAA Phys. 2015, 70, 185–196. [Google Scholar]
  9. Eggenkamp, H.G.M.; Agrinier, P.; Coleman, M.L.; Bonifacie, M.; Ader, M.; Griffioen, J.; Strydom, J.; Sterpenich, J.; Gaucher, E.; Louvat, P. Halogen stable isotope studies in formation waters, a comparison between their chlorine and bromine isotope systematics. In Proceedings of the Second EAGE Workshop on Geochemistry in Petroleum Operations and Production, Muscat, Oman, 1–4 October 2018. [Google Scholar]
  10. Eggenkamp, H.G.M.; Coleman, M.L. Rediscovery of classical methods and their application to the measurement of stable bromine isotopes in natural samples. Chem. Geol. 2000, 167, 393–402. [Google Scholar] [CrossRef]
  11. Frape, S.K.; Shouakar-Stash, O.; Paces, T.; Stotler, R. Geochemical and isotopic characteristics of the waters from crystalline and sedimentary structures of the Bohemian Massif. In Proceedings of the Water Rock Interaction 12, Kunming, China, 31 July–5 August 2007; pp. 727–733. [Google Scholar]
  12. Shouakar-Stash, O.; Alexeev, S.V.; Frape, S.K.; Alexeeva, L.P.; Drimmie, R.J. Geochemistry and stable isotopic signatures, including chlorine and bromine isotopes, of the deep groundwaters of the Siberian Platform, Russia. Appl. Geochem. 2007, 22, 589–605. [Google Scholar] [CrossRef]
  13. Stotler, R.L.; Frape, S.K.; Shouakar-Stash, O. An isotopic survey of d81Br and d37Cl of dissolved halides in the Canadian and Fennoscandian Shields. Chem. Geol. 2010, 274, 38–55. [Google Scholar] [CrossRef]
  14. Boschetti, T.; Toscani, L.; Shouakar-Stash, O.; Iacumin, P.; Venturelli, G.; Mucchino, C.; Frape, S.K. Salt waters of the Northern Apennine Foredeep Basin (Italy): Origin and evolution. Aquat. Geochem. 2011, 17, 71–108. [Google Scholar] [CrossRef]
  15. Bagheri, R.; Nadri, A.; Raeisi, E.; Eggenkamp, H.G.M.; Kazemi, G.A.; Montaseri, A. Hydrochemical and isotopic (d18O, d2H, 87Sr/86Sr, d37Cl and d81Br) evidence for the origin of saline formation water in a gas reservoir. Chem. Geol. 2014, 384, 62–75. [Google Scholar] [CrossRef]
  16. Chen, L.Z.; Ma, T.; Du, Y.; Yang, J.; Liu, L.; Shan, H.M.; Liu, C.F.; Cai, H.S. Origin and evolution of formation water in North China Plain based on hydrochemistry and stable isotopes (2H, 18O, 37Cl and 81Br). J. Geochem. Explor. 2014, 145, 250–259. [Google Scholar] [CrossRef]
  17. Du, Y.; Ma, T.; Chen, L.Z.; Shan, H.M.; Xiao, C.; Lu, Y.; Liu, C.F.; Cai, H.S. Genesis of salinized groundwater in Quaternary aquifer system of coastal plain, Laizhou Bay, China: Geochemical evidences, especially from bromine stable isotope. Appl. Geochem. 2015, 59, 155–165. [Google Scholar] [CrossRef]
  18. Eissa, M.A.; Thomas, J.M.; Pohll, G.; Shouakar-Stash, O.; Hershey, R.L.; Dawoud, M. Groundwater recharge and salinization in the arid coastal plain aquifer of the Wadi Watir delta, Sinai, Egypt. Appl. Geochem. 2016, 71, 48–62. [Google Scholar] [CrossRef]
  19. Yu, H.; Ma, T.; Du, Y.; Chen, L. Genesis of formation water in the northern sedimentary basin of South China Sea: Clues from hydrochemistry and stable isotopes (D, 18O, 37Cl and 81Br). J. Geochem. Explor. 2019, 196, 57–65. [Google Scholar] [CrossRef]
  20. Pinti, D.L.; Shouakar-Stash, O.; Castro, M.C.; Lopez-Hernández, A.; Hall, C.M.; Rocher, O.; Shibata, T.; Ramírez-Montes, M. The bromine and chlorine isotopic composition of the mantle as revealed by deep geothermal fluids. Geochim. Cosmochim. Acta 2020, 276, 14–30. [Google Scholar] [CrossRef]
  21. Hussain, M.; Al-Shaibani, A.; Al-Ramadan, K.; Wood, W.W. Geochemistry and isotopic analysis of brines in the coastal sabkhas, Eastern region, Kingdom of Saudi Arabia. J. Arid. Environ. 2020, 178, 104142. [Google Scholar] [CrossRef]
  22. Giunta, T.; Devauchelle, O.; Ader, M.; Locke, R.; Louvat, P.; Bonifacie, M.; Métivier, F.; Agrinier, P. The gravitas of gravitational isotope fractionation revealed in an isolated aquifer. Geochem. Perspect. Lett. 2017, 4, 53–58. [Google Scholar] [CrossRef] [Green Version]
  23. Eggenkamp, H.G.M.; Coleman, M.L. The effect of aqueous diffusion on the fractionation of chlorine and bromine stable isotopes. Geochim. Cosmochim. Acta 2009, 73, 3539–3548. [Google Scholar] [CrossRef]
  24. Czarnacki, M.; Halas, S. Isotope fractionation in aqua-gas systems: Cl2-HCl-Cl, Br2-HBr-Br and H2S-S2−. Isot. Environ. Health Stud. 2012, 48, 55–64. [Google Scholar] [CrossRef]
  25. Eggenkamp, H.G.M.; Bonifacie, M.; Ader, M.; Agrinier, P. Experimental determination of stable chlorine and bromine isotope fractionation during precipitation of salt from a saturated solution. Chem. Geol. 2016, 433, 46–56. [Google Scholar] [CrossRef]
  26. Hanlon, C.; Stotler, R.; Frape, S.; Gwynne, R. Comparison of δ81Br and δ37Cl composition of volatiles, salt precipitates, and associated water in terrestrial evaporative saline lake systems. Isot. Environ. Health Stud. 2017, 53, 446–465. [Google Scholar] [CrossRef]
  27. Eggenkamp, H.G.M.; Louvat, P.; Griffioen, J.; Agrinier, P. Chlorine and bromine isotope evolution within a fully developed Upper Permian natural salt sequence. Geochim. Cosmochim. Acta 2019, 245, 316–326. [Google Scholar] [CrossRef] [Green Version]
  28. Horst, A.; Bonifacie, M.; Bardoux, G.; Richnow, H.H. Isotopic Characterization (2H, 13C, 37Cl, 81Br) of Abiotic Degradation of Methyl Bromide and Methyl Chloride in Water and Implications for Future Studies. Environ. Sci. Technol. 2019, 53, 8813–8822. [Google Scholar] [CrossRef] [PubMed]
  29. Leri, A.C.; Hakala, J.A.; Marcus, M.A.; Lanzirotti, A.; Reddy, C.M.; Myneni, S.C.B. Natural organobromine in marine sediments: New evidence of biogeochemical Br cycling. Glob. Biogeochem. Cycle 2010, 24, 15. [Google Scholar] [CrossRef] [Green Version]
  30. Malcolm, S.J.; Price, N.B. The behavior of iodine and bromine in estuarine surface sediments. Mar. Chem. 1984, 15, 263–271. [Google Scholar] [CrossRef]
  31. Price, N.B.; Calvert, S.E. The contrasting geochemical behaviors of iodine and bromine in recent sediments from Namibian Shelf. Geochim. Cosmochim. Acta 1977, 41, 1769–1775. [Google Scholar] [CrossRef]
  32. Öberg, G. The natural chlorine cycle—fitting the scattered pieces. Appl. Microbiol. Biotechnol. 2002, 58, 565–581. [Google Scholar] [CrossRef]
  33. Cincinelli, A.; Pieri, F.; Zhang, Y.; Seed, M.; Jones, K.C. Compound Specific Isotope Analysis (CSIA) for chlorine and bromine: A review of techniques and applications to elucidate environmental sources and processes. Environ. Pollut. 2012, 169, 112–127. [Google Scholar] [CrossRef]
  34. Kaufmann, R.S. Bromine. In Geochemistry; Marshall, C.P., Fairbridge, R.W., Eds.; Springer: Dordrecht, The Netherlands, 1998; p. 49. [Google Scholar]
  35. Leri, A.C.; Ravel, B. Abiotic bromination of soil organic matter. Environ. Sci. Technol. 2015, 49, 13350–13359. [Google Scholar] [CrossRef] [Green Version]
  36. Leri, A.C.; Myneni, S.C.B. Natural organobromine in terrestrial ecosystems. Geochim. Cosmochim. Acta 2012, 77, 1–10. [Google Scholar] [CrossRef]
  37. Vainikka, P.; Hupa, M. Review on bromine in solid fuels. Part 1: Natural occurrence. Fuel 2012, 95, 1–14. [Google Scholar] [CrossRef]
  38. Horst, A.; Holmstrand, H.; Andersson, P.; Thornton, B.F.; Wishkerman, A.; Keppler, F.; Gustafsson, O. Stable bromine isotopic composition of methyl bromide released from plant matter. Geochim. Cosmochim. Acta 2014, 125, 186–195. [Google Scholar] [CrossRef] [Green Version]
  39. Land, L.S.; Prezbindowski, D.R. The origin and evolution of saline formation water, lower Cretaceous carbonates, south-central Texas, USA. J. Hydrol. 1981, 54, 51–74. [Google Scholar] [CrossRef]
  40. Edmunds, W.M. Bromine geochemistry of British groundwaters. Mineral. Mag. 1996, 60, 275–284. [Google Scholar] [CrossRef] [Green Version]
  41. Edmunds, W.M. Geochemistry of brines in the coal measures of northeast England. Trans. Inst. Min. Metall. Sect. B Appl. Earth Sci. 1975, 84, B39–B52. [Google Scholar]
  42. Vassilev, S.V.; Eskenazy, G.M.; Vassileva, C.G. Contents, modes of occurrence and origin of chlorine and bromine in coal. Fuel 2000, 79, 903–921. [Google Scholar] [CrossRef]
  43. Kirk, M.F.; Wilson, B.H.; Marquart, K.A.; Zeglin, L.H.; Vinson, D.S.; Flynn, T.M. Solute concentrations influence microbial methanogenesis in coal-bearing strata of the Cherokee basin, USA. Front. Microbiol. 2015, 6, 14. [Google Scholar] [CrossRef] [PubMed] [Green Version]
  44. Lange, J.P. Stratigraphy, Depositional Environments and Coalbed Methane Resources of Cherokee Group Coals (Middle Pennsylvanian)—Southeastern Kansas; Open-File Report 2003-82; Kansas Geological Survey: Lawrence, KS, USA, 2003; Available online: www.kgs.ku.edu/PRS/publication/ofr2003-82/ofr2003-82.pdf (accessed on 28 March 2021).
  45. Bostic, J.L.; Brady, L.L.; Howes, M.; Burchett, R.R.; Pierce, B.S. Investigation of the Coal Properties and the Potential for Coal-Bed Methane in the Forest City Basin, Open-File Report no. 93–576; U.S. Geological Survey: Reston, VA, USA, 1993; p. 45. [Google Scholar]
  46. Newell, K.D.; Newell, K.D.; Birdie, T.R. Geothermal Anomalies on the Eastern-Flank of the Cherokee Basin; Midcontinent Geoscience: Southeastern Kansas, KS, USA, 2021. [Google Scholar]
  47. Jorgenson, D.G.; Helgesen, J.O.; Imes, J.L. Regional Aquifers in Kansas, Nebraska, and Parts of Arkansas, Colorado, Missouri, New Mexico, Oklahoma, South Dakota, Texas, and Wyoming—Geohydrologic Framework, Professional Paper no. 1414–B.; U.S. Geological Survey: Reston, VA, USA, 1993. [Google Scholar]
  48. Macfarlane, P.A. Revisions to the nomenclature for Kansas aquifers. Kans. Geol. Surv. Bull. 2000, 244, 1–14. [Google Scholar]
  49. Wojcik, K.M.; Goldstein, R.H.; Walton, A.W. History of diagenetic fluids in a distant foreland area, Middle and Upper Pennsylvanian, Cherokee Basin, Kansas, USA—fluid inclusion evidence. Geochim. Cosmochim. Acta 1994, 58, 1175–1191. [Google Scholar] [CrossRef]
  50. Wojcik, K.M.; Goldstein, R.H.; Walton, A.W.; Montanez, I.P.; Gregg, J.M.; Shelton, K.L. Regional and Local Controls of Diagenesis Driven by Basin-Wide Flow System: Pennsylvanian Sandstones and Limestones, Cherokee Basin, Southeastern Kansas. In Basin-Wide Diagenetic Patterns: Integrated Petrologic, Geochemical, and Hydrologic Considerations; SEPM Society for Sedimentary Geology: Tulsa, OK, USA, 1997; Volume 57. [Google Scholar]
  51. Walton, A.W.; Wojcik, K.M.; Goldstein, R.H.; Barker, C.E. Diagenesis of Upper Carboniferous rocks in the Ouachita foreland shelf in mid-continent USA: An overview of widespread effects of a Variscan-equivalent orogeny. Geol. Rundsch. 1995, 84, 535–551. [Google Scholar] [CrossRef]
  52. Goldstein, R.H.; King, B.D.; Watney, W.L.; Pugliano, T.M. Drivers and history of late fluid flow impact on Midcontinent reservoir rocks. In Mississippian Reservoirs of the Midcontinent: AAPG Memoir 122; Grammer, G.M., Gregg, J.M., Puckette, J.O., Jaiswal, P., Mazzullo, S.J., Pranter, M.J., Goldstein, R.H., Eds.; The American Association of Petroleum Geologists: Tulsa, OK, USA, 2019; pp. 417–450. [Google Scholar] [CrossRef]
  53. Coveney, R.M., Jr.; Ragan, V.M.; Brannon, J.C. Temporal benchmarks for modeling Phanerozoic flow of basinal brines and hydrocarbons in the southern Midcontinent based on radiometrically dated calcite. Geology 2000, 28, 795–798. [Google Scholar] [CrossRef]
  54. Barker, C.E.; Goldstein, R.H.; Hatch, J.R.; Walton, A.W.; Wojcik, K.M. Burial history and thermal maturation of Pennsylvanian rocks, Cherokee Basin, southeastern Kansas. In Proceedings of the Source Rocks in the Southern Midcontinent, 1990 Symposium, Norman, OK, USA, 1990; pp. 299–310. [Google Scholar]
  55. Musgrove, M.; Banner, J.L. Regional Ground-Water Mixing and the Origin of Saline Fluids: Midcontinent, United States. Science 1993, 259, 1877–1882. [Google Scholar] [CrossRef] [PubMed] [Green Version]
  56. Carr, T.R.; Merriam, D.F.; Bartley, J.D. Use of relational databases to evaluate regional petroleum accumulation, groundwater flow, and CO2 sequestration in Kansas. AAPG Bull. 2005, 89, 1607–1627. [Google Scholar] [CrossRef]
  57. Coleman , J.L., Jr.; Cahan, S.M. Preliminary Catalog of the Sedimentary Basins of the United States, no. 2012–1111; U.S. Geological Survey: Reston, VA, USA, 2012; p. 31. [Google Scholar]
  58. Jenden, P.D.; Newell, K.D.; Kaplan, I.R.; Watney, W.L. Composition and stable isotope geochemistry of natural gases from Kansas, Midcontinent, USA. Chem. Geol. 1988, 71, 117–147. [Google Scholar] [CrossRef]
  59. Bethke, C.M.; Marshak, S. Brine migrations across North America—The plate-tectonics of groundwater. Annu. Rev. Earth Planet. Sci. 1990, 18, 287–315. [Google Scholar] [CrossRef]
  60. Newell, K.D.; Sawin, R.S.; Brady, L.L. Natural Gas from Coal in Eastern Kansas. Available online: http://www.kgs.ku.edu/Publications/pic19/pic19_1.html (accessed on 26 March 2021).
  61. Lange, J.P.; Carr, T.R.; Newell, K.D. Stratigraphy, Depositional Environments and Coalbed Methane Resources of Cherokee Group Coals (Middle Pennsylvanian)—Southeastern Kansas; Open-File Report 2003-28; Kansas Geological Survey: Lawrence, KS, USA, 2003; Available online: http://129.237.140.42/PRS/publication/2003/ofr2003-28/P3-04.html (accessed on 28 March 2021).
  62. Craig, H. Isotopic variations in meteoric waters. Science 1961, 133, 1702–1703. [Google Scholar] [CrossRef]
  63. McIntosh, J.; Martini, A.; Petsch, S.; Huang, R.; Nuesslein, K. Biogeochemistry of the Forest City Basin coalbed methane play. Int. J. Coal Geol. 2008, 76, 111–118. [Google Scholar] [CrossRef]
  64. EPA. Coalbed Methane Extraction: Detailed Study Report; U.S. Environmental Protection Agency: Washington, DC, USA, 2010; p. 91.
  65. Kirk, M.F.; Martini, A.M.; Breecker, D.O.; Colman, D.R.; Takacs-Vesbach, C.; Petsch, S.T. Impact of commercial natural gas production on geochemistry and microbiology in a shale-gas reservoir. Chem. Geol. 2012, 332, 15–25. [Google Scholar] [CrossRef] [Green Version]
  66. Stenger, V.A.; Shrader, S.A.; Beshgetoor, A.W. Analytical Methods for Methyl Bromide. Ind. Eng. Chem. Anal. Ed. 1939, 11, 121–125. [Google Scholar] [CrossRef]
  67. Shouakar-Stash, O.; Drimmie, R.J.; Frape, S.K. Determination of inorganic chlorine stable isotopes by continuous flow isotope ratio mass spectrometry. Rapid Commun. Mass Spectrom. 2005, 19, 121–127. [Google Scholar] [CrossRef]
  68. Shouakar-Stash, O.; Frape, S.K.; Drimmie, R.J. Determination of bromine stable isotopes using continuous-flow isotope ratio mass spectrometry. Anal. Chem. 2005, 77, 4027–4033. [Google Scholar] [CrossRef]
  69. McNutt, R.H.; Frape, S.K.; Fritz, P.; Jones, M.G.; Macdonald, I.M. The 87Sr/86Sr values of Canadian Shield brines and fracture minerals with applications to groundwater mixing, fracture history, and geochronology. Geochim. Cosmochim. Acta 1990, 54, 205–215. [Google Scholar] [CrossRef]
  70. Louvat, P.; Bonifacie, M.; Giunta, T.; Michel, A.; Coleman, M. Determination of bromine stable isotope ratios from saline solutions by “wet plasma” MC-ICPMS Including a comparison between high- and low-resolution modes, and three introduction systems. Anal. Chem. 2016, 88, 3891–3898. [Google Scholar] [CrossRef] [PubMed]
  71. Shouakar-Stash, O. Evaluation of Stable Chlorine and Bromine Isotopes in Sedimentary Formation Fluids. Ph.D. Thesis, University of Waterloo, Waterloo, ON, Canada, 2008. [Google Scholar]
  72. Skuce, M.; Longstaffe, F.J.; Carter, T.R.; Potter, J. Isotopic fingerprinting of groundwaters in southwestern Ontario: Applications to abandoned well remediation. Appl. Geochem. 2015, 58, 1–13. [Google Scholar] [CrossRef]
  73. Wang, Y.; Frape, S.K. Chlorine and Bromine Isotopic Analyses of Groundwater: DGR-3 and DGR-4. NWMO-TR-2015-20, NWMO-TR-2015-20; Nuclear Waste Management Organization: Toronto, ON, Canada, 2015; p. 41. [Google Scholar]
  74. Scheerhorn, R.V. Regional Geochemical Study of the Western Interior Plains Aquifer System and the Great Plains Aquifer System in the Mid-Continent, United States. Ph.D. Dissertation, University of Texas, Austin, TX, USA, 2006. [Google Scholar]
  75. Musgrove, M. Origin, evolution, and mixing of saline and dilute groundwaters in three regional flow systems, midcontinent, U.S.A. Master’s Thesis, University of Texas, Austin, TX, USA, 1993. [Google Scholar]
  76. Chaudhuri, S. Strontium isotopic composition of several oilfield brines from Kansas and Colorado. Geochim. Cosmochim. Acta 1978, 42, 329–331. [Google Scholar] [CrossRef]
  77. Chaudhuri, S.; Broedel, V.; Clauer, N. Strontium isotopic evolution of oil-field waters from carbonate reservoir rocks in Bindley Field, central Kansas, USA. Geochim. Cosmochim. Acta 1987, 51, 45–53. [Google Scholar] [CrossRef]
  78. Chaudhuri, S.; Broedel, V.; Nicastro, L.; Robinson, R. Strontium isotopic variations of oil-field waters—A clue to migration history of oils. AAPG Bull. Am. Assoc. Petr. Geol. 1983, 67, 1323–1324. [Google Scholar]
  79. Chaudhuri, S.; Clauer, N. Strontium isotopic compositions and potassium and rubidium contents of formation waters in sedimentary basins—clues to the origin of the solutes. Geochim. Cosmochim. Acta 1993, 57, 429–437. [Google Scholar] [CrossRef]
  80. Banner, J.L.; Wasserburg, G.J.; Dobson, P.F.; Carpenter, A.B.; Moore, C.H. Isotopic and trace-element constraints on the origin and evolution of saline groundwaters from central Missouri. Geochim. Cosmochim. Acta 1989, 53, 383–398. [Google Scholar] [CrossRef]
  81. Wood, H.K.; Macpherson, G.L. Sources of Sr and implications for weathering of limestone under tallgrass prairie, northeastern Kansas. Appl. Geochem. 2005, 20, 2325–2342. [Google Scholar] [CrossRef]
  82. King, B.D.; Goldstein, R.H. History of hydrothermal fluid flow in the midcontinent, USA: The relationship between inverted thermal structure, unconformities and porosity distribution. Geol. Soc. Lond. Spec. Publ. 2018, 435, 283–320. [Google Scholar] [CrossRef] [Green Version]
  83. Mohammadi, S.; Gregg, J.M.; Shelton, K.L.; Appold, M.S.; Puckette, J.O. Influence of late diagenetic fluids on Mississippian carbonate rocks on the Cherokee-Ozark Platform, northeast Oklahoma, northwest Arkansas, southwest Missouri, and southeast Kansas. In AAPG Memoir 122: Mississippian Reservoirs of the Midcontinent; Grammer, G.M., Gregg, J.M., Puckette, J.O., Jaiswal, P., Mazzullo, S.J., Pranter, M.J., Goldstein, R.H., Eds.; The American Association of Petroleum Geologists: Tulsa, OK, USA, 2019; pp. 323–352. [Google Scholar]
  84. Hovorka, S.D.; Knauth, L.P.; Fisher, R.S.; Gao, G. Marine to nonmarine facies transition in Permian evaporites of the Palo Duro Basin, Texas: Geochemical response. GSA Bull. 1993, 105, 1119–1134. [Google Scholar] [CrossRef]
  85. Chaudhuri, S.; Clauer, N. History of Marine Evaporites: Constraints from Radiogenic Isotopes; Springer: Berlin/Heidelberg, Germany, 1992; pp. 177–198. [Google Scholar]
  86. Veizer, J. Strontium isotopes in seawater through time. Annu. Rev. Earth Planet. Sci. 1989, 17, 141–167. [Google Scholar] [CrossRef]
  87. Denison, R.E.; Koepnick, R.B.; Burke, W.H.; Hetherington, E.A.; Fletcher, A. Construction of the Mississippian, Pennsylvanian and Permian seawater 87Sr/86Sr curve. Chem. Geol. 1994, 112, 145–167. [Google Scholar] [CrossRef]
  88. Denison, R.E.; Koepnick, R.B.; Burke, W.H.; Hetherington, E.A. Construction of the Cambrian and Ordovician seawater 87Sr/86Sr curve. Chem. Geol. 1998, 152, 325–340. [Google Scholar] [CrossRef]
  89. Chaudhuri, S.; Clauer, N. Fluctuations of isotopic composition of strontium in seawater during the Phanerozoic Eon. Chem. Geol. 1986, 59, 293–303. [Google Scholar] [CrossRef]
  90. Hanor, J.S. Physical and chemical controls on the composition of waters in sedimentary basins. Mar. Pet. Geol. 1994, 11, 31–45. [Google Scholar] [CrossRef]
  91. Eggenkamp, H.G.M.; Kreulen, R.; Van Groos, A.F.K. Chlorine stable isotope fractionation in evaporites. Geochim. Cosmochim. Acta 1995, 59, 5169–5175. [Google Scholar] [CrossRef]
  92. Eastoe, C.J.; Peryt, T. Stable chlorine isotope evidence for non-marine chloride in Badenian evaporites, Carpathian mountain region. Terra Nova 1999, 11, 118–123. [Google Scholar] [CrossRef]
  93. Eastoe, C.J.; Peryt, T.M.; Petrychenko, O.Y.; Geisler-Cussey, D. Stable chlorine isotopes in Phanerozoic evaporites. Appl. Geochem. 2007, 22, 575–588. [Google Scholar] [CrossRef]
  94. Eastoe, C.J.; Long, A.; Land, L.S.; Kyle, J.R. Stable chlorine isotopes in halite and brine from the Gulf Coast Basin: Brine genesis and evolution. Chem. Geol. 2001, 176, 343–360. [Google Scholar] [CrossRef]
  95. Eastoe, C.J.; Long, A.; Knauth, L.P. Stable chlorine isotopes in the Palo Duro Basin, Texas: Evidence for preservation of Permian evaporite brines. Geochim. Cosmochim. Acta 1999, 63, 1375–1382. [Google Scholar] [CrossRef]
  96. Eastoe, C.J. Stable chlorine isotopes in arid non-marine basins: Instances and possible fractionation mechanisms. Appl. Geochem. 2016, 74, 1–12. [Google Scholar] [CrossRef] [Green Version]
  97. Tan, H.B.; Ma, H.Z.; Wei, H.Z.; Xu, J.X.; Li, T.W. Chlorine, sulfur and oxygen isotopic constraints on ancient evaporite deposit in the Western Tarim Basin, China. Geochem. J. 2006, 40, 569–577. [Google Scholar] [CrossRef] [Green Version]
  98. Eggenkamp, H.G.M. Comment on “Stable isotope fractionation of chlorine during the precipitation of single chloride minerals’’ by Luo, C.-g., Xiao, Y.-k., Wen, H.-j., Ma, H.-z., Ma, Y.-q., Zhang, Y.-l., Zhang, Y.-x. and He, M.-y. Applied Geochemistry 47 (2014) 141–149. Appl. Geochem. 2015, 54, 111–116. [Google Scholar] [CrossRef]
  99. Benison, K.C.; Goldstein, R.H. Permian paleoclimate data from fluid inclusions in halite. Chem. Geol. 1999, 154, 113–132. [Google Scholar] [CrossRef]
  100. Benison, K.C.; Goldstein, R.H. Evaporites and siliciclastics of the Permian Nippewalla Group of Kansas, USA: A case for non-marine deposition in saline lakes and saline pans. Sedimentology 2001, 48, 165–188. [Google Scholar] [CrossRef] [Green Version]
  101. Ercan, H.Ü.; Karakaya, M.Ç.; Bozdağ, A.; Karakaya, N.; Delikan, A. Origin and evolution of halite based on stable isotopes (δ37Cl, δ81Br, δ11B and δ7Li) and trace elements in Tuz Gölü Basin, Turkey. Appl. Geochem. 2019, 105, 17–30. [Google Scholar] [CrossRef]
  102. Horst, A.; Thornton, B.F.; Holmstrand, H.; Andersson, P.; Crill, P.M.; Gustafsson, O. Stable bromine isotopic composition of atmospheric CH3Br. Tellus Ser. B Chem. Phys. Meteorol. 2013, 65, 8. [Google Scholar] [CrossRef]
  103. Yudovich, Y.E.; Ketris, M.P. Chlorine in coal: A review. Int. J. Coal Geol. 2006, 67, 127–144. [Google Scholar] [CrossRef]
  104. Spears, D.A. A review of chlorine and bromine in some United Kingdom coals. Int. J. Coal Geol. 2005, 64, 257–265. [Google Scholar] [CrossRef]
  105. Finkelman, R.B.; Palmer, C.A.; Wang, P. Quantification of the modes of occurrence of 42 elements in coal. Int. J. Coal Geol. 2018, 185, 138–160. [Google Scholar] [CrossRef]
  106. Huggins, F.E.; Huffman, G.P. Chlorine in coal: An XAFS spectroscopic investigation. Fuel 1995, 74, 556–569. [Google Scholar] [CrossRef]
  107. Strąpoć, D.; Mastalerz, M.; Dawson, K.; Macalady, J.; Callaghan, A.V.; Wawrik, B.; Turich, C.; Ashby, M. Biogeochemistry of Microbial Coal-Bed Methane. Annu. Rev. Earth Planet. Sci. 2011, 39, 617–656. [Google Scholar] [CrossRef]
  108. Woods, A.; Kuntze, K.; Gelman, F.; Halicz, L.; Nijenhuis, I. Variable dual carbon-bromine stable isotope fractionation during enzyme-catalyzed reductive dehalogenation of brominated ethenes. Chemosphere 2018, 190, 211–217. [Google Scholar] [CrossRef] [PubMed]
Figure 1. Study area location map. The study was completed within a four-county area in southeastern Kansas, USA, where 16 wells were sampled. Boundaries of the Anadarko, Arkoma, Cherokee, Forest City, and Palo Duro Basins are from Coleman Jr. and Cahan [57]. The Bourbon Arch separates the Cherokee and Forest City basins from each other, and the Nemaha Uplift is located immediately to their west. Circled areas A, B, and C refer to the Mound Valley, Galesburg, and Petrolia geothermal anomalies identified by Newell [46]. The solid grey line identifies location of the 10,000 ppm total dissolved solids (TDS) contour in the Arbuckle Gp [56], while the dashed black line identifies the approximate boundary where the underlying Arbuckle Gp. has a higher salinity than the overlying Mississippian [46]. In the deeper Arbuckle Gp., salinity is higher to the west of the grey line, and is higher than in the Mississippian to the south of the dashed line.
Minerals 11 00358 g001
Figure 2. Generalized stratigraphy of the study area, from [46]. Note the Chattanooga Sh. is absent beneath the wells studied, and is present only in the extreme southeast part of Labette Co.
Minerals 11 00358 g002
Figure 3. Geochemical and isotopic relationships for Cherokee Basin CBM produced water. Samples from 2013 are represented by triangles pointing in different directions depending on temperature, while 2017 samples are represented by circles, with colors representing temperature following the 2013 symbology. There is a slight excess of Br relative to Cl for most samples relative to water that is derived from evaporated seawater (a) (the seawater brine evaporation line of McCaffrey et al. [7] is provided for reference (light grey)). Two trends are evident when comparing K vs. Br (b). The trends in panel (b) have correlation coefficients of 0.92 and 0.70 for the fluids warmer than 18 °C and cooler than 18 °C, respectively. Panels (c,d) illustrate δ37Cl vs. Cl and δ81Br vs. Br, respectively. Two trends are also evident when comparing δ81Br vs. δ37Cl (e). Line 2 (e) is a mixing line, but the process resulting in Line 1 is less certain (see Discussion). In panels (ad), samples with a ‘+’ symbol denote those that fall along line 2 in panel (e). In panel (f), δ81Br vs. 87Sr/86Sr, the strong relationship between temperature, δ81Br, and 87Sr/86Sr in Group A and Group B samples (circled group) is evident. Group B samples (see Table S3 and discussion in text) are the four samples with temperatures above 18 °C.
Minerals 11 00358 g003
Figure 4. Comparisons of Br/Cl with δ37Cl (a), 87Sr/86Sr (b), and δ81Br (c). Linear fit 1 and 2 in this figure are constructed using the same wells as those along Lines 1 and 2 in Figure 3e. The samples with a ‘+’ symbol denote those that fall along line 2 in Figure 3e.
Minerals 11 00358 g004
Figure 5. Spatial relationship of δ81Br (A), 87Sr/86Sr (B), and δ37Cl (C) for 2013 samples. Three of the wells in Group “B” (see Table S3 and discussion in text), which includes 4, 6, 7, and 11, are located in southwest Neosho County. Galesburg geothermal anomaly [46]. Circled areas indicate the locations of geothermal anomalies identified by Newell [46]. The solid grey line identifies location of the 10,000 ppm TDS contour in the Arbuckle Gp. [56], while the dashed black line identifies the approximate boundary where the underlying Arbuckle Gp. has a higher salinity than the overlying Mississippian. In the deeper Arbuckle Gp. Well 2 is representative of the new end-member proposed in this work. In the deeper Arbuckle Gp., salinity is higher to the west of the grey line, and is higher than in the Mississippian to the south of the dashed line.
Minerals 11 00358 g005
Figure 6. Relative frequency (ac) and frequency (df) of δ81Br values in this study (a,d), sedimentary basins (b,e), and all known groundwater samples analyzed to date (c,f) [10,11,12,13,14,15,16,17,18,19,20,21,22,70,71,72,73]. Note the change in scale in panel (f) compared with (d) and (e).
Minerals 11 00358 g006
Figure 7. Regional geochemical context for Cherokee Basin fluids sampled in this study in comparison with Cambrian–Ordovician and Mississippian units of the Western Interior Plains Aquifer System (WIPAS) [55,74] and Pennsylvanian units of the Forest City Basin [63]. Cherokee Basin fluids sampled for this study are circled for reference. For both Cl vs. δ2H (a) and Br/Cl vs. 87Sr/86Sr (b), geochemical groups and endmembers (EM) for the WIPAS are as defined by Musgrove and Banner [55]. The salt sample is from a group of dissolution mine wells targeting the Permian Hutchinson Salt Member west of the study area [75]. Well 2 is representative of the new end-member proposed in this work. In (a), SMOW is standard mean ocean water.
Minerals 11 00358 g007
Table 1. Stable chlorine, bromine, and 87Sr/86Sr isotopic results for water samples and one gas sample collected from Cherokee Basin coal-bed methane production wells.
Well ID 1GroupYearδ37ClStdvδ81BrStdv87Sr/86Sr
SMOCSMOBNIST987
1A2013−0.040.072.560.090.7088860.000015
2A2013−0.810.082.370.170.7087970.000015
3A20130.680.102.710.090.7089440.000015
4B2013−0.180.060.750.030.7105580.000014
5A2013−0.590.082.430.040.7088170.000015
6B20130.040.100.720.040.7104770.000014
6B2017−0.250.03−0.630.130.7102660.000015
6 2B2017 −0.810.05
7B2013−0.030.10−0.010.060.7107260.000015
8A20130.070.092.350.130.7089360.000015
9A20130.050.052.160.030.7089220.000015
10A20130.090.081.100.050.7090550.000015
11B2013−0.300.100.150.070.7110910.000015
12A20130.270.092.570.110.7088260.000015
13A20130.160.102.460.050.7090480.000015
13A2017−0.030.063.170.100.7088620.000011
14 no water production
15B20130.430.092.430.050.7089990.000016
16B20130.110.071.860.010.7089060.000016
1 Well ID matches [43]. 2 Gas sample results.
Table 2. Geochemical results from 2017 sampling.
Well ID 1YearpHTemp.Sp. Cond.ClBrSO4NaKMgCaSr
°CmS/cmmg/L
1320176.5621.157.425,400110BQL14,2001106401100390
1 Well ID matches [43].
Publisher’s Note: MDPI stays neutral with regard to jurisdictional claims in published maps and institutional affiliations.

