Article

Origin and Evolution of the Late Cretaceous Reworked Phosphorite in the Sirhan-Turayf Basin, Northern Saudi Arabia

1
Beijing Research Institute of Uranium Geology, Beijing 100029, China
2
Saudi Geological Survey, Jeddah 21424, Saudi Arabia
*
Authors to whom correspondence should be addressed.
Minerals 2021, 11(4), 350; https://doi.org/10.3390/min11040350
Submission received: 31 January 2021 / Revised: 13 March 2021 / Accepted: 16 March 2021 / Published: 27 March 2021
(This article belongs to the Section Mineral Deposits)

Abstract

:
The redeposition of pristine phosphorite plays an important role in phosphorus accumulation, which created reworked phosphorite extensively on the continental shelf. This paper, using geochemical analysis combined with data from petrology and diagenesis, focuses on the reconstruction of the formation processes of the Late Cretaceous Thaniyat phosphorite deposition in northwestern Saudi Arabia, which is a part of the famous large Neo-Tethys Ocean’s phosphorite deposit. The results of our study illustrate that the phosphorites represent the reworked products from the north, close to the edge of the Neo-Tethys Ocean’s shelf, where upwelling had accreted the pristine phosphorite. The reworked phosphatic grains were redeposited near the shore in sandstone, forming sandy phosphorite and on a carbonate platform and creating calcareous phosphorite. The microscale sedimentological and geochemical information hosted in the eroded phosphorite grains indicates that the source sediment, pristine phosphorite, occurred under a fluctuating geophysical condition and in a relatively limited geochemical environment. They were physically crushed and transported landward and deposited under oxic conditions, forming the Thaniyat phosphorites. Early diagenesis in the Thaniyat phosphorite was evidenced by recrystallization of the phosphate minerals, geochemical depletion, and C and O isotope excursion.

Graphical Abstract

1. Introduction

As one of the three major macronutrients, phosphorus is a crucial element for the growth of organisms [1,2] and plays an important role in the origin of life, e.g., [3]. Phosphorite is a marine sedimentary rock type containing at least 18 wt.% P2O5 and is the main ore of the element phosphorous [4]. At present, phosphorite ore serves as the backbone of phosphate fertilization, which fertilizes global agriculture, e.g., [5,6,7,8]. The Middle East hosts the majority of the global phosphorite reserves; exhaustive mining of phosphate has appeared in the northern part of Jordan, etc.; China, which has less than 5% of the global phosphorite reserves, also dominates the global phosphate products [9,10,11]. There is no doubt that the global phosphate supply security is extremely urgent.
As the majority of the phosphorite, reworked phosphorite commonly occurred in offshore environments near the west coast of the ocean, such as Namibia and Peru in the west of the Atlantic and Pacific Ocean [12,13]. These reworked phosphorites were related to upwelling, which brought in an abundance of nutrients and accumulated phosphorus via blooming and burial of plankton [12,14,15,16]. Hydrolysis and microbial catalysis of the buried phosphorus-rich organic matter form the precursor of the pristine phosphorite [17,18] and the fluctuation of the sea-level are possible causes of erosion and physical transportation of the pristine phosphorite landward, forming reworked phosphorite [19]. The upwelling driving and physical erosion and transportation is a generally accepted depositional process of reworked phosphorite. However, the formation details and the sedimentary environment evolution of the reworked phosphorite are still not well understood.
Thaniyat phosphorite in northern Saudi Arabia developed in the Late Cretaceous and is part of the world’s largest Neo-Tethys Ocean’s phosphorite deposit. Occurring near the south coast of the Neo-Tethys Ocean, Thaniyat phosphorite is a typical reworked phosphorite consisting of detrital quartz grains, reworked phosphorite grains, and carbonate cements. Abundant reserves and convenient mining conditions enable the phosphorite in northern Saudi Arabia to be industrially produced [20]. However, the poor understanding of the formation mechanism of the Thaniyat phosphorite has significantly obstructed the prediction and exploration of buried phosphorite in depth. This has a negative impact on the phosphate supply in Saudi Arabia. Additionally, reworked phosphorite is widely deposited in the south coast of the Neo-Tethys Ocean, such as in Algeria and Tunisia [21,22]. The investigation of the Thaniyat phosphorite could shed a light on understanding the formation of reworked phosphorite in the Noe-Tethys Ocean’s phosphorite deposit.
Geochemical and sedimentological data were used to decipher the detailed information of the Thaniyat reworked phosphorite in this research to reconstruct the depositional processes and sedimentary environment that the Thaniyat reworked phosphorite has undergone. Additionally, the diagenetic events were recognized, which occurred after the deposition of the Thaniyat phosphorite. Finally, we established a scenario to interpret the formation mechanism of the Thaniyat phosphorite.

2. Geological Setting

2.1. Tectonics and Paleogeography

The Sirhan-Turayf basin is located on the north side of the Arabian Shield, and adjacent to the Palmyra fold belt in the north, and the Dead Sea transform in the west. The movement of the Arabian Plate created Zagros thrust and Bitlis suture in the northeast [23]. A microplate, named Anatolian Plate, which is also the north branch of the Neo-Tethys Ocean, is located between the Arabian Plate and the Eurasian Plate. The subduction of the Anatolian Plate to the north indicated the tectonics is characterized by the gradual closure of the Neo-Tethys Ocean in the Late Cretaceous [24,25]. The Sirhan-Turayf basin is in the south of the Neo-Tethys Ocean, which is a shallow marine depositional basin, and the research area in the south part of the Sirhan-Turayf basin is near the shore in the Late Cretaceous [26]. Located in the east of Sirhan Arc, which is developed in the N–S direction, the research area is on a carbonate platform, where upwelling occurred frequently [27].

2.2. Stratigraphy

The research area is located in the northwestern part of Saudi Arabia that borders Jordan on the south and is adjacent to the Arabian Shield (Figure 1a). Sedimentary phosphorite was identified in 1965 in commercial quantities in the Sirhan-Turayf basin within the northwestern corner of Saudi Arabia (Figure 1a). More than six phosphorite localities had been identified within this basin, and the Thaniyat is one of them (Figure 1b) [20]. The outcrops of the Thaniyat escarpment and drillings revealed the sedimentary stratigraphy in this area.
The Thaniyat phosphorite occurred in the Late Cretaceous, which overlies the Late Cretaceous Zallum Formation. The Zallum Formation consists of white to mottled brownish red, lavender, and purple unconsolidated sandstones (Figure 1b), and is different from the contemporary formation to the north, such as the Amman Formation in the middle of Jordan, which developed chert deposits [28]. Unconformably underlaying the Zallum Formation is the Devonian Jubah Formation and Jauf Formation, which are dominated by limestone and dolomite.
The Thaniyat Phosphorite Member is in the bottom part of the Jalamid Formation (Figure 1c). These thin phosphorite beds consistently extend to the north, crossing toward Jordan [20,29,30,31]. At its base is a bed of phosphorite that is largely friable to semi-friable. The upper part of the type section is composed of thin beds of phosphorite, which is semi-friable to calcareous and hard, in addition to chert, micrite, and dolomicrite [32,33].
Figure 1. Geological background of the Arabia Plate and stratigraphy of the Sirhan-Turayf basin: (a) geologic map of the Arabian Peninsula and its surroundings, marked with the location of the research area in the northwestern part of Saudi Arabia modified after [34]. (b) geological map of the research area, south part of the Sirhan-Turayf basin. The sampling work was conducted on the escarpment in the south of the basin (marked by red triangles), and drill hole samples were used for C- O-isotope analysis; and (c) the general stratigraphy of Sirhan-Turayf basin in the northwestern part of Saudi Arabia, showing the Thaniyat Phosphorite Member occurred in the late Cretaceous sequence modified after [32].
Minerals 11 00350 g001
Mira Formation, consisting of marl and micrite, unconformably overlies the Thaniyat Phosphorite Member (Figure 1c), which initiated the start of the early Eocene and is marked by a very thin layer of chert. The Eocene carbonates spread out over the entire margin of the northern Arabian Peninsula [35].

2.3. Phosphorite Occurrence

The phosphorites in the northwestern part of Saudi Arabia and south Jordan form an important part of the Late Cretaceous–Eocene Tethys Ocean’s phosphorite deposit that extends from the eastern Mediterranean through North Africa to Columbia and Venezuela [36,37,38]. The Thaniyat Phosphorite Member in the northwestern part of Saudi Arabia had developed in interbedded thin layers, in which phosphorite layers are dominated. The thickness of the Thaniyat Phosphorite Member ranges from 3 to 5 m [20]. Two types of phosphorite were recognized based on the rock component—sandy and calcareous phosphorites. The sandy phosphorite, consisting of quartz grains and phosphatic grains, is dominantly occurred in the bottom part of the Thaniyat Phosphorite Member and usually lacks interlayers. In contrast, the calcareous phosphorite, consisting of phosphatic grains and calcareous cements, developed after the sandy phosphorite and contains interlayers of chert, mudstone, and micrite. In the most upper part of the Thaniyat Phosphorite Member, a chert breccia layer insistently occurred.
Phosphatic grains dominate the phosphate components, which include pellets, ooids, and bone fragments. The phosphatic grains are medium to coarse and can be usually identified easily by their white-gray color, round shape, or organic texture. The phosphorite beds can be described as being well-packed, sorted, friable and semi-friable, sandy phosphorite to friable, chalky, or locally hard, calcareous phosphorite.

3. Materials and Methods

Samples were collected along the escarpment in the south of the Sirhan-Turayf basin, where the Thaniyat Phosphorite Member was outcropped, and from the cores in the drill holes near the escarpment to the north (Figure 1b). A total of 12 outcrop samples and 14 core samples were collected. The samples are mainly sandy phosphorite and calcareous phosphorite, and some phosphatic chert and phosphatic mudstone samples were collected from cores. The samples presented the Thaniyat phosphorite, which is several meters in thickness, occurred in the very late of the Cretaceous, and dominated the Thaniyat Phosphorite Member in the Sirhan-Turayf basin.
Thin sections of the Thaniyat phosphorite were analyzed using a Leica DM4 P microscope and were also analyzed using a Zeiss Sigma 300 scanning electron microscope (SEM) with a Bruker XFlash 6130 (Carl Zeiss Microscopy Ltd., Cambridge, UK) probe for energy dispersive spectrometry (EDS) analysis after carbon-coated by using a Leica EM ACE500. The SEM analysis was conducted under the energy of 20 kV and the work distance for the probe was 8–10 mm.
The phosphate samples were analyzed for their major, minor, trace, and rare earth element contents. The major elements were determined using X-ray fluorescence (AB104L, AxiosMAX, PANalytical, Almelo, Netherlands), and for their in-situ measurement, electron probe microanalysis (EPMA, JXA 8100, JEOL, Tokyo, Japan) was used. The trace and rare earth elements were determined using inductively coupled plasma mass spectrometry (ICP-MS, NexIon300D, Perkinelmer, Waltham, MA, USA). The samples were digested using hydrochloric and nitric acids, and after sufficient dissolution, they were centrifuged and filtered. Standard reference materials were also analyzed, together with the samples, and the accuracies of the obtained values for the major and trace elements were ±5% and ±3%, respectively.
For each sample, about 100 mg were weighed and dissolved by using acetic and hydrochloric acids for the measurements of their carbonate and phosphate fractions and then were dried. Afterward, the sample was dissolved with nitric acid and with Rh as an internal standard for analysis. The rare earth elements were analyzed using an ICP–MS (NexIon300D, Perkinelmer, Waltham, MA, USA). The Ce, Eu, Y, and Pr anomalies in both the carbonate and phosphate fractions were calculated using the following equations: Ce/Ce* = 3CeN/(2LaN + NdN); Eu/Eu*= 2EuN/(SmN + GdN); Y/Y* = 2YN/(DyN + HoN); and Pr/Pr* = 2PrN/(CeN + NdN) [39,40,41], where N refers to the normalization of the concentrations using the Post-Archean Australian Shale (PAAS) standards [42].
The C and O isotopes were analyzed according to the methods for carbonate C and O isotope analyses. The powdered sample was digested with HNO3 and was analyzed using a Kiel IV device attached to a Thermo MAT 253 mass spectrometer that is equipped with a dual inlet system. The liberated CO2 was carried by He. All conventional stable isotope values are expressed using the standard per mil notation and are reported here based on the Vienna Peedee Belemnite (VPDB) standard. The accuracy of the measurement is ±0.1% for the δ13C and ±0.2% for the δ18O.

4. Results

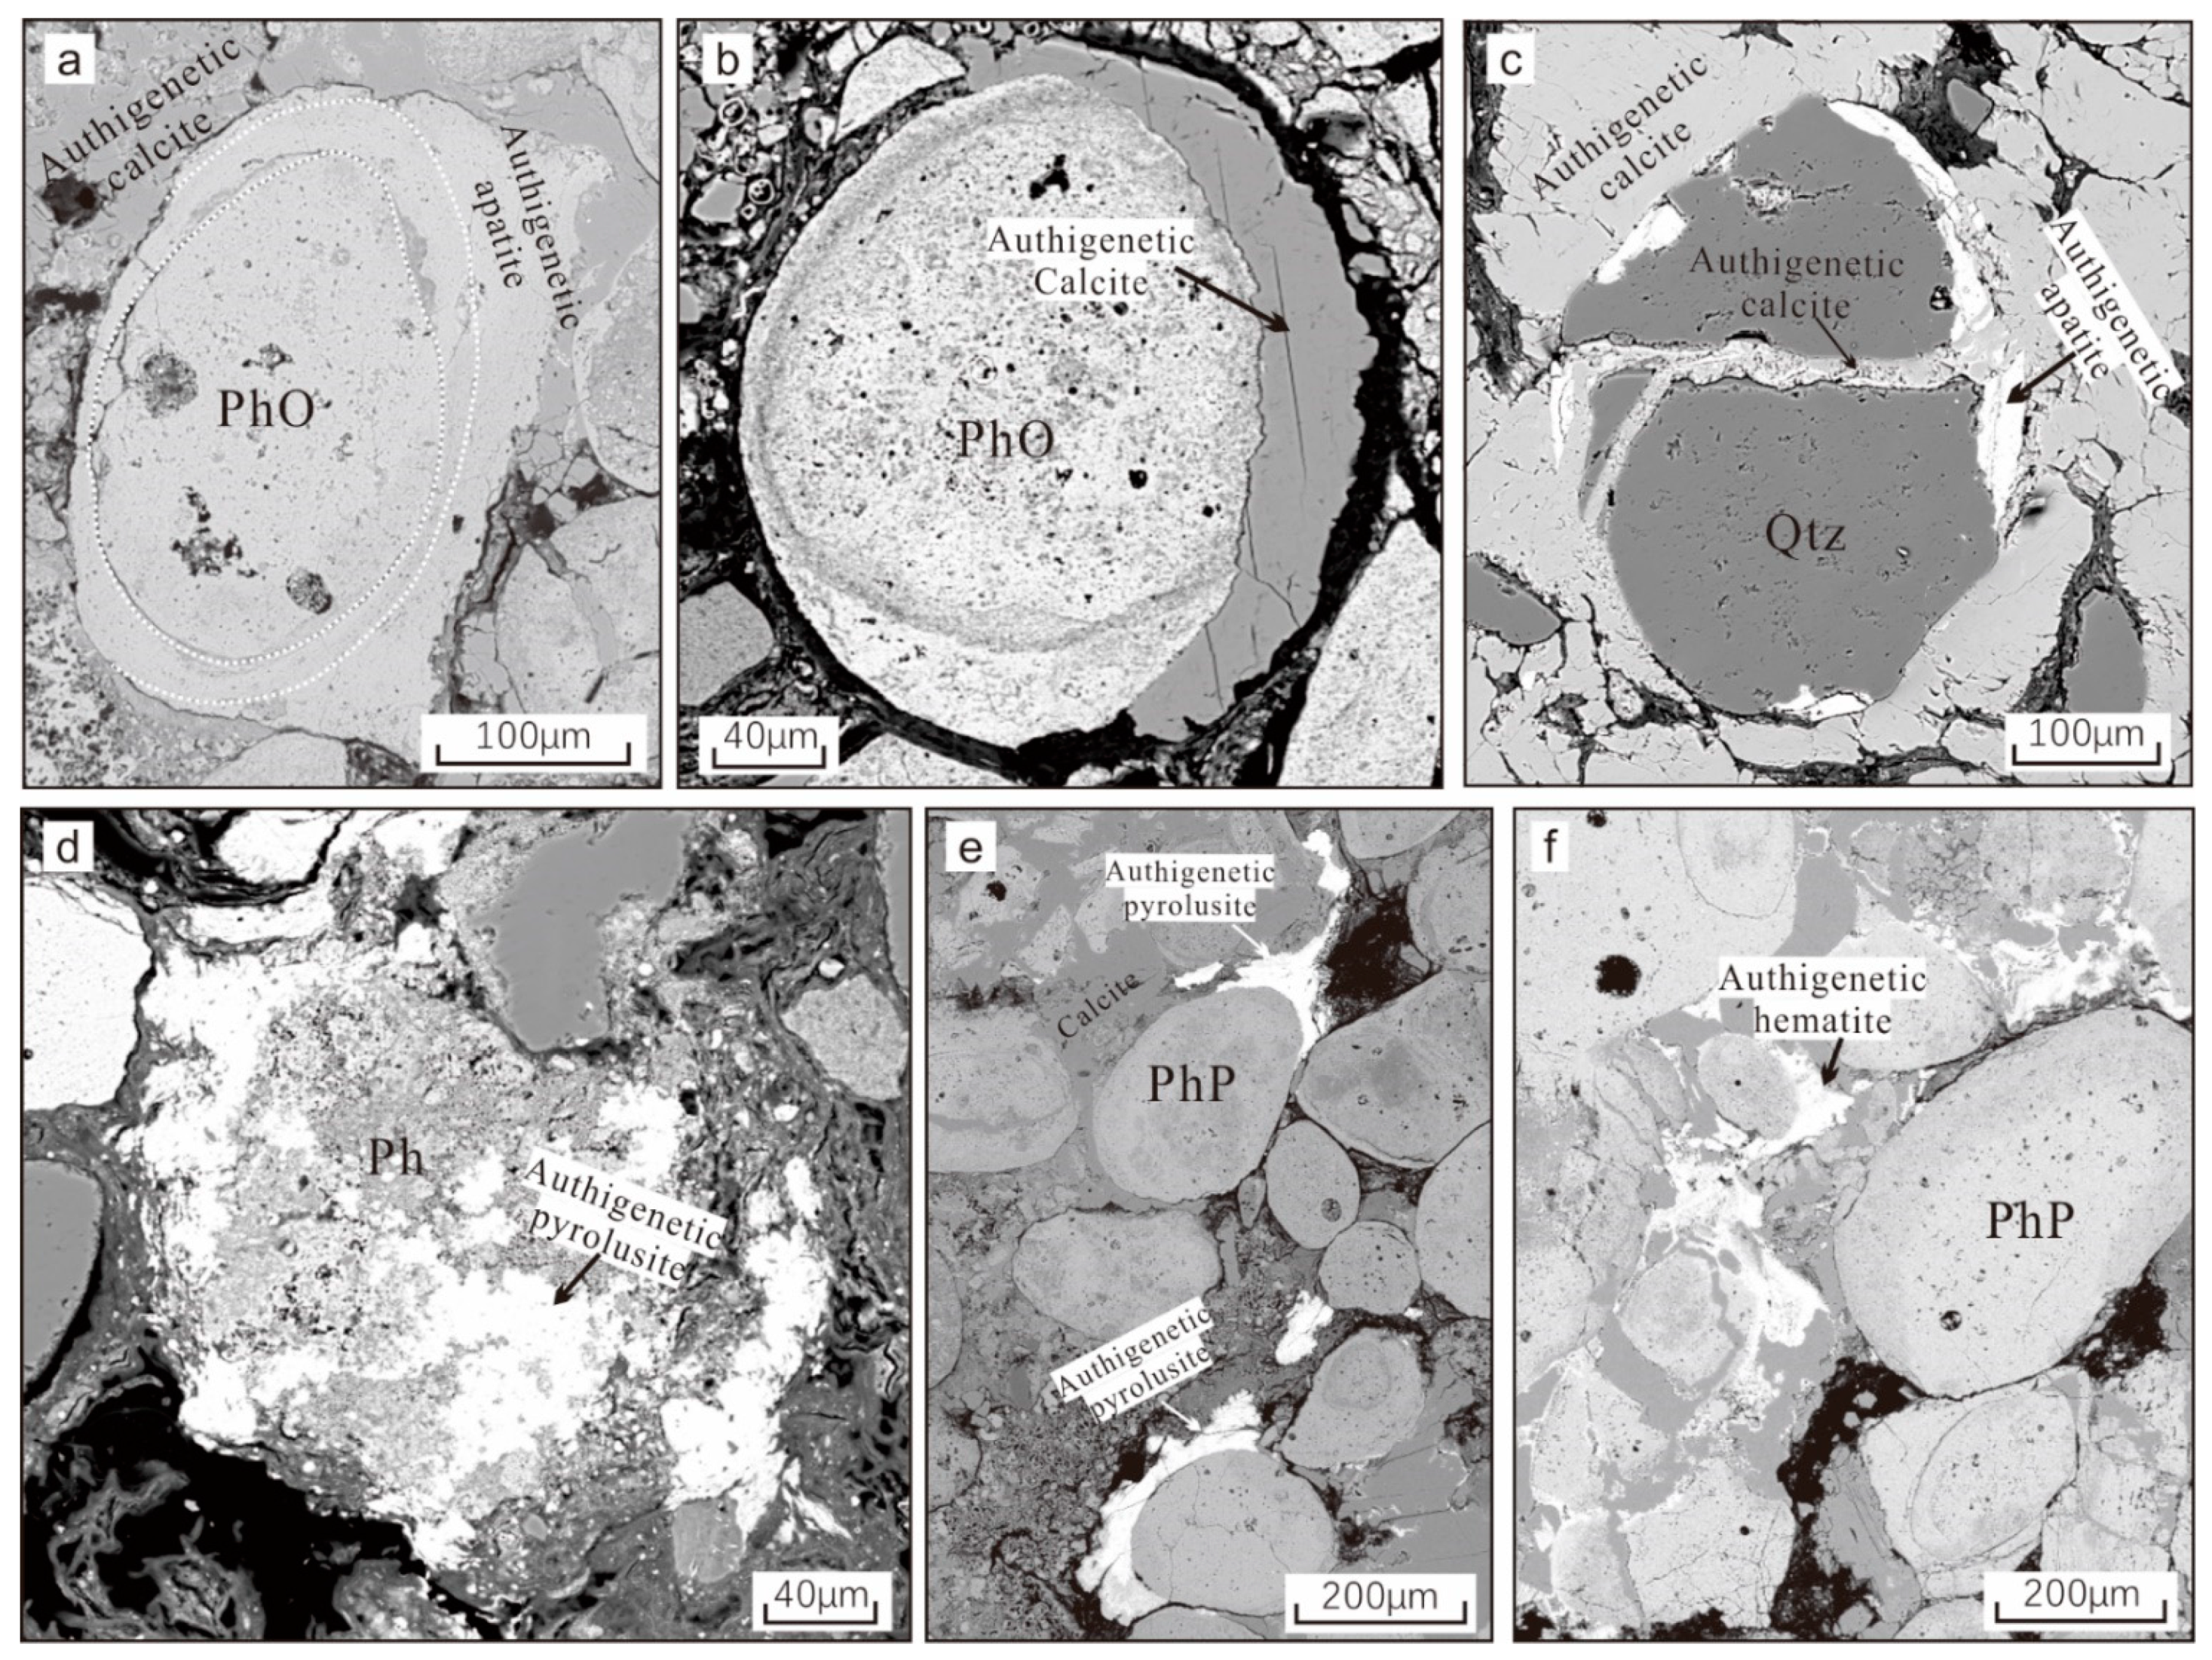
4.1. Petrography of the Phosphorite

4.1.1. Sandy Phosphorite

The sandy phosphorites are composed of quartz and phosphatic grains, matrix, and slight carbonate cement (Figure 2). The densely and randomly packed phosphate pellets and coated grains are round or sub-round, deposited with clay matrix and organic matter (Figure 2a). The compacted phosphate grains are crushed and partially cemented by calcite (Figure 2b). The diameter of the phosphate grain varies from 0.1 to 1.0 mm. The differences are set in a phosphatic matrix, excluding quartz grains and terrestrial matrix (Figure 2c). Few grains show significant biological characteristics. They may be derived from bone fragments, deposited with the quartz grains and the calcite cement (Figure 2d). The matrix in sandy phosphorite is clay and organic matter, and some interstitial space is filled by calcite cement, which was formed after deposition (Table 1).

4.1.2. Calcareous Phosphorite

The calcareous phosphorite deposited overlying the sandy phosphorite contains different forms of phosphatic grains and calcareous cement. The grains are mainly phosphatic ooids, pellets, and bio-fragments. They are compacted tightly, with some cortex peeled off, or the grains are crushed (Figure 3a). The content of the phosphatic component is higher than, and the texture is significantly different to, that in the sandy phosphorite estimated by using an optical microscope. The different grains are tightly cemented by calcite, and the amount of organic matter is lesser than sandy phosphorite. The phosphatic ooids may contain multiple cores, and the cores are also coated ooids (Figure 3b). There are also some minor forms of phosphate, such as phosphatic grains with unclear boundaries (Figure 3c), and bio-fragments, possibly chips of bones or shells (Figure 3d). The phosphatic grains in the calcareous phosphorite are cemented by calcite (Table 1).
According to the lithology research on the outcrops and microscale observation using optical and electron scanning microscopes, a brief comparison between the sandy phosphorite, which is dominated the lower part of the Thaniyat Phosphorite Member, and the calcareous phosphorite, occurred after the sandy phosphorite was made (Table 1). The composition, sedimentary structure, and lithological association are all significantly different between the sandy phosphorite and the calcareous phosphorite. These differences reflect the variation of the sediment source, sedimentary dynamic environment, and potential diagenesis that occurred after deposition from sandy phosphorite to the calcareous phosphorite.

4.1.3. The Phosphatic Component

The phosphatic components are dominated by coated grains and phosphatic pellets. The chemical composition of the phosphatic component was confirmed by the EDS. The coated grains are phosphatic ooids. They have distinct concentric zonation, consisting of alternating light gray and dark gray phosphatic layers (Figure 4a). The cores of the ooids are structureless phosphatic pellets, and they are usually tens to hundreds of microns in diameter. Multiple ooids could serve as the core of a new larger ooid (Figure 4b). The abundant microscale observation results reveal that ooids are more common in the calcareous phosphorite than in the sandy phosphorite. The phosphatic pellets show a structureless interior pattern and are deposited chaotically with the ooids (Figure 4c). The size of the pellets and the ooids varies, and they are the majority of the phosphatic components. During the growth of an ooid, other grains, including bio-fragments (Figure 4d) or quartz grains (Figure 4e), can serve as a core in forming an ooid. These ooids lack concentric zonation. One layer of cortex surrounds the irregular core and creates a new round grain.
Phosphatic components could also be present in other minor forms. The deposited phosphates are commonly poorly crystallized, and their growth occurs near the surface of the sediments undersea [18,43]. Their deformation and transportation could create integrated grains that are rich in phosphate. The interior structure of an integrated grain is complex, and these grains usually have larger sizes (Figure 5a). Most integrated grains show unclear boundaries, which are directly associated with the integration of the phosphatic pellets near the boundary (Figure 5b). Phosphatized bones and shells still show their original structures, and their chambers are filled with apatite (Figure 5c). The reassembled, phosphatized, and tiny bio-fragments are cemented together, set in a phosphatic matrix, and shown as a solid, internally complex grain (Figure 5d). Partially, these phosphatized bio-fragments remain in their original forms without cement or reassembled as grains. They were deposited in different sizes and irregular shapes (Figure 5e).
The main minerals of the phosphatic component are likely fluorapatite, carbonate fluorapatite, and hydroxyapatite, but occurring in crystallite or amorphousness, which is hard to recognize the crystalloid of the minerals according to the morphology using the SEM. However, the chemical information worked out by EDS and more precisely confirmed by EPMA indicated the consistent chemical component of the phosphatic ooids and pellets to be the phosphate minerals, and the previous research concluded that fluorapatite, carbonate fluorapatite, and hydroxyapatite dominated the phosphorite in the phosphogenetic province where the Sirhan-Turayf basin is located in [44].

4.2. Element Distribution

4.2.1. Major, Minor, and Trace Elements of the Phosphorite

Commonly, the major elements of the shelf sediments can be grouped into two. The “siliciclastic” group represents the terrestrial influx, including Si, Ti, Al, Mg, and K. The “authigenic” group represents the marine-derived fraction, which includes P, Ca, and Na, e.g., [41,45]. Petrographically, quartz dominates the siliciclastic components, which are exemplified by the terrestrially supplied quartz grains. The SiO2 content in the sandy phosphorite varies from 33% to 56%, with an average of 42%, while the calcareous phosphorite has a relatively lesser SiO2 content, which ranges from 3% to 21%, with an average of 9%. The calcareous phosphorite contains 32% P2O5 and 46% CaO contents on average, which is more than half of those found in sandy phosphorite, with 19.5% P2O5 and 29% CaO on average. These three components consist nearly 90% of the bulk of the phosphorite. The amounts of Al2O3, MgO, Na2O, K2O, Fe2O3, MnO, and TiO2 are less than 1% in both types of phosphorite, presenting as minor components (Table 2).
The trace element group is mainly made up of V, Cr, Ni, Cu, Zn, and Sr, and their concentrations range from tens to hundreds of ppm. The trace element contents of calcareous and sandy phosphorites show slight differences (Table 3).

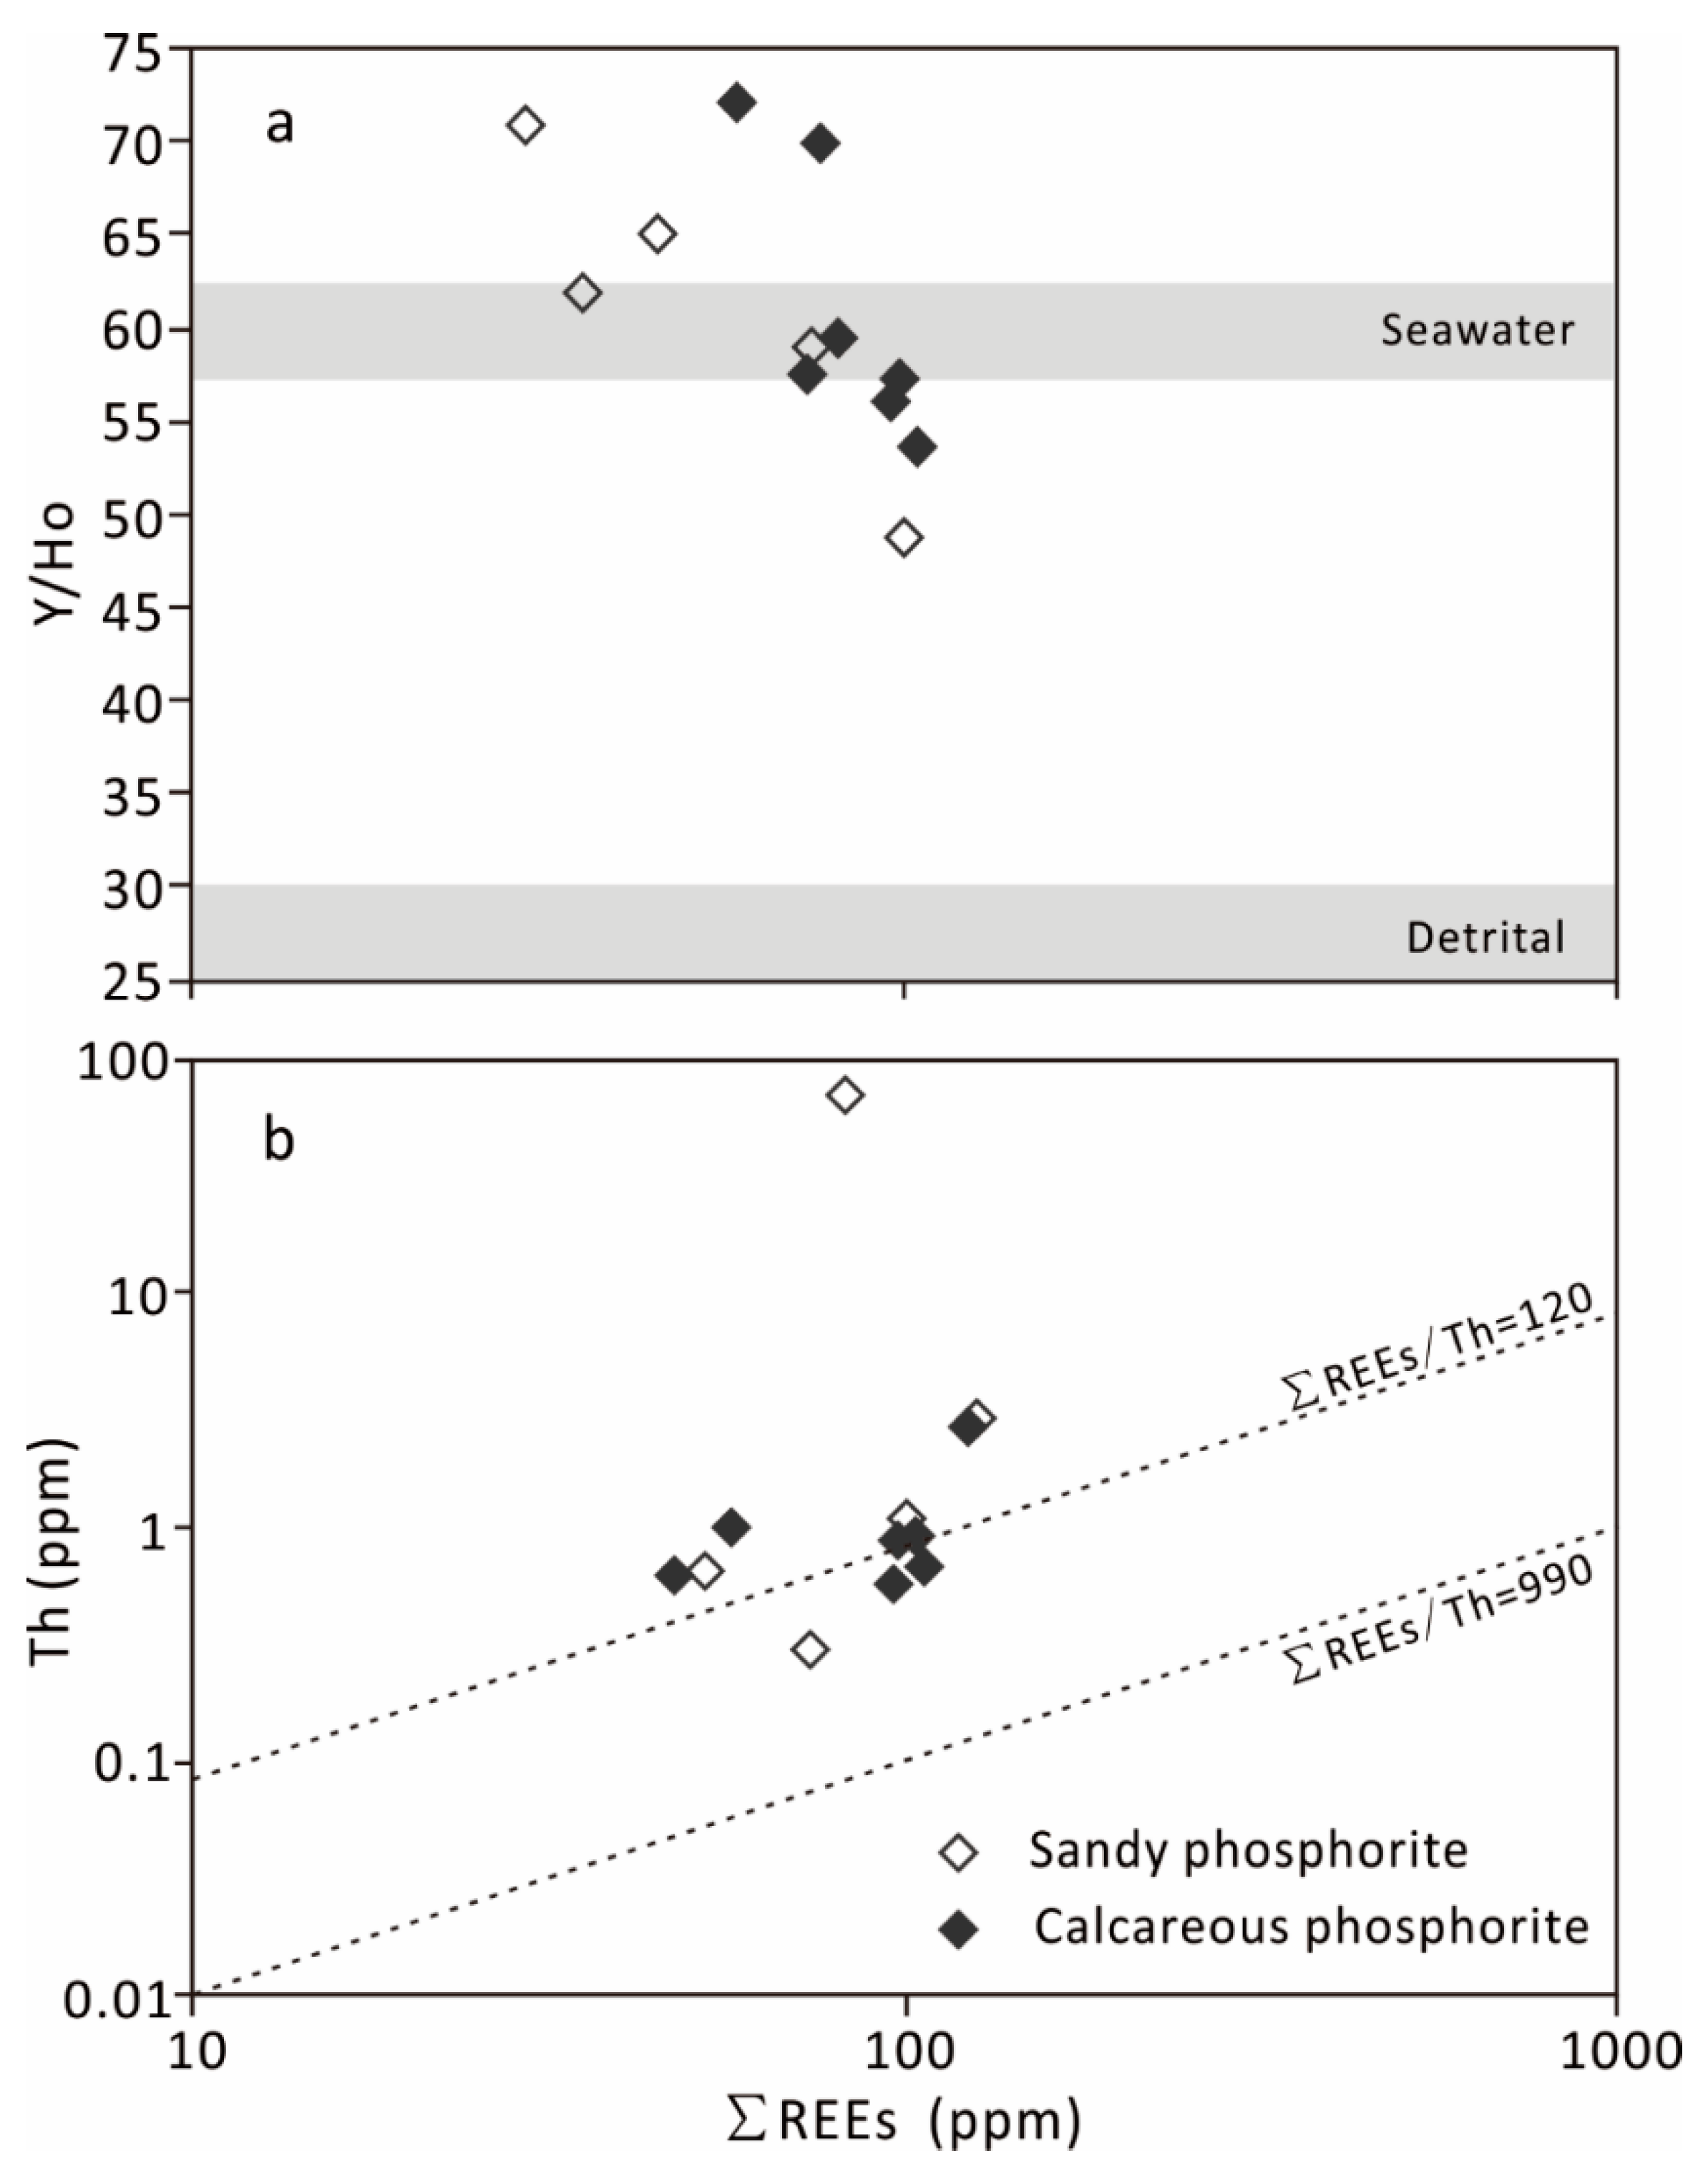
4.2.2. Rare Earth Elements

Rare earth elements (REEs) are normalized against the Post-Archean Australian Shale (PAAS) values [42]. The normalized REE patterns in both sandy and calcareous phosphorites show a slight hat-shape pattern (Figure 6a,b). Classifying the REEs into Light rare earth elements (LREEs, La-Nd), middle rare earth elements (MREEs, Sm-Ho), and heavy rare earth elements (HREEs, Er-Lu) [46], the values of normalized MREEs/LREEs and MREEs/HREEs ratios range from 2 to 2.52 and from 1.13 to 1.77, respectively. The Ce anomalies of the sandy and calcareous phosphorites are similar. The anomaly value varies from 0.4 to 0.66, illustrating a negative anomaly. Europium anomaly value ranges from 0.98 to 1.14, which shows negligible anomaly levels (Table 4).
The REEs in the chert and the mudstone, which are interbedded with the calcareous phosphorite layers in the upper part of the Thaniyat Phosphorite Member, show distinctively different patterns comparing to that of the phosphorite (Table 4 and Figure 6). The REE pattern of the chert varies from “seawater-like” to one that is enriched with MREEs and HREEs (Figure 6c), while the patterns from the mudstone demonstrate the lack of HREEs (Figure 6d). The chert samples show a strong negative anomaly of Ce and a slight positive anomaly of Eu. The mudstones show negligible anomalies of Ce and Eu.

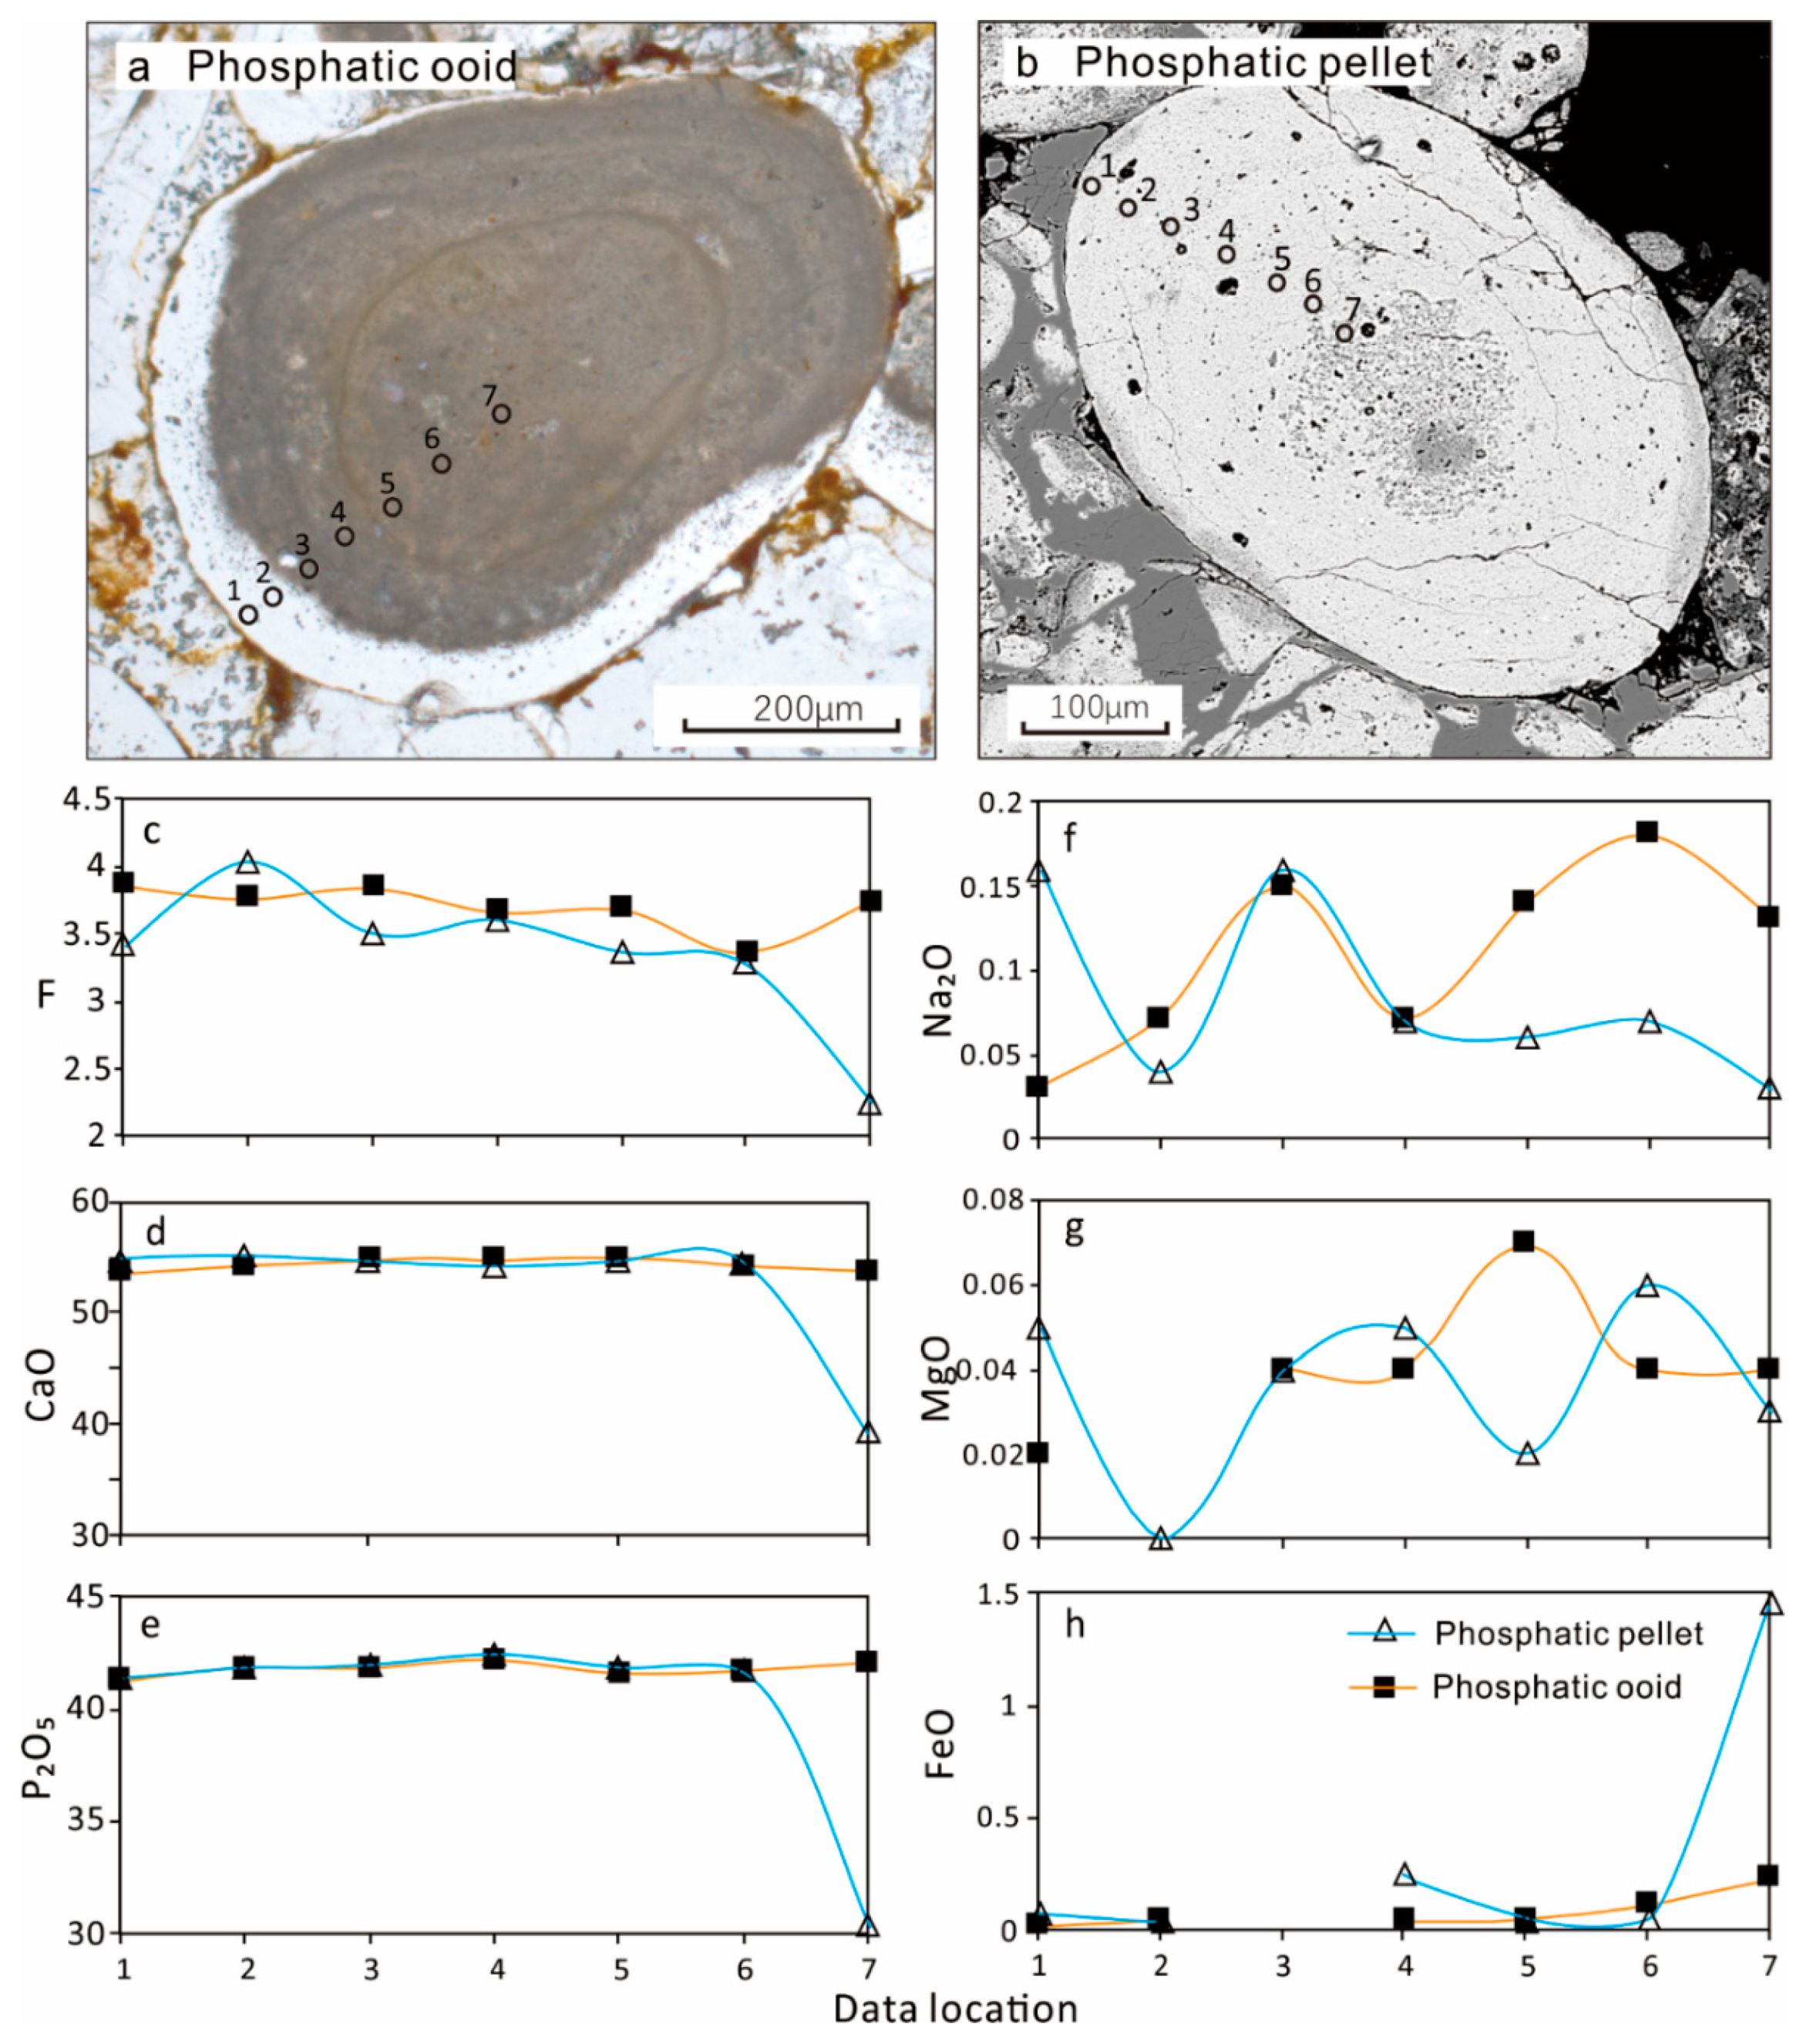
4.2.3. Element Distribution in a Phosphatic Grain

Overall, 23 EPMA data were assayed on different phosphatic grains. The concentrations of major elements, phosphorus, and calcium vary in a narrow range in both phosphatic ooid and pellet in outside–in direction, except near the central part of the pellet, which shows relatively low concentrations of P2O5, CaO, F, Na2O, and MgO contents (Figure 7c–e). Generally, the fluorine content varies and increases slightly from the inside of both grains (Figure 7c). The other minor elements show a dramatic variation in their concentrations, including Na2O, MgO, and FeO (Figure 7f–h). They have very low concentrations, and therefore, will be easily affected by the changes in the ambient geochemical environment.

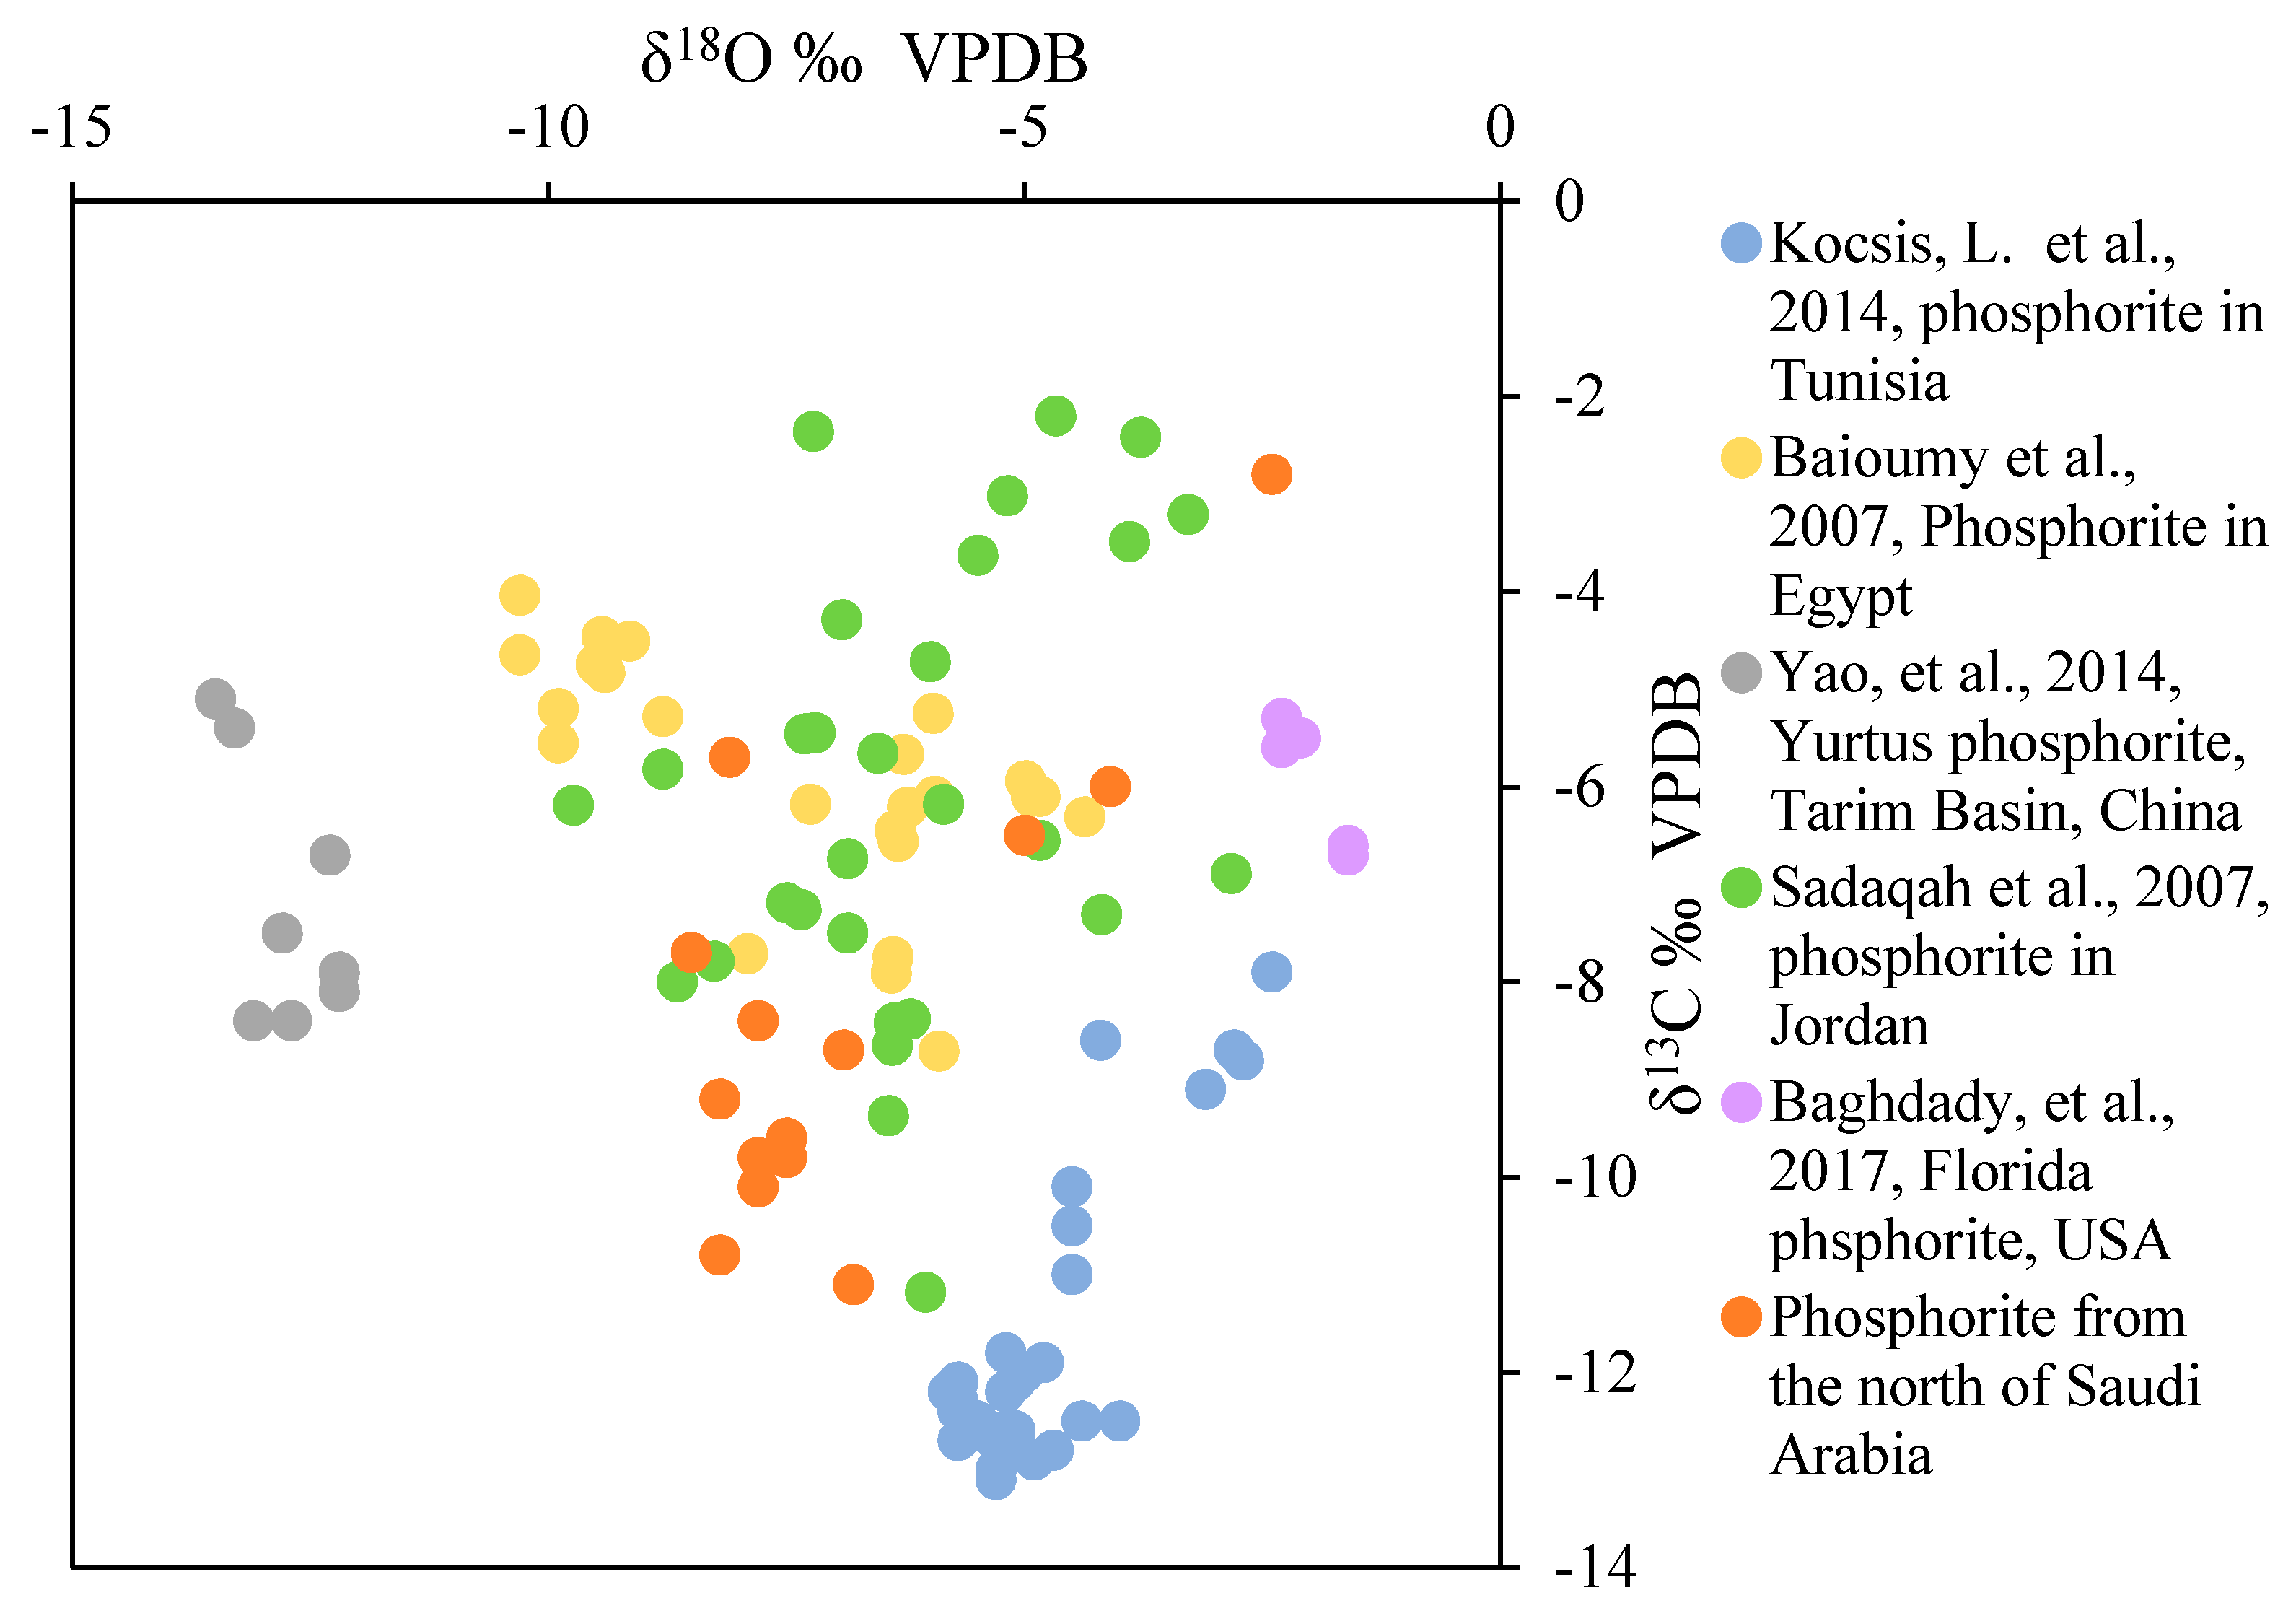
4.3. Isotope Composition

The Thaniyat phosphorites from the Sirhan-Turayf basin have variable C and O isotope values (Table 5). The δ13C values vary between −11.1‰ to −2.8‰ (−8.3‰ on average), and the δ18O values range from −8.5‰ to −2.4‰ (−6.5‰ on average). The negative excursion of C and O isotopes is similar to other phosphorites from Jordan and Tunisia [47,48].

5. Discussion

5.1. Major Elements Component

The geochemical component is an indicator of sediment source and petrographic component. A positive correlation between TiO2 and Al2O3 contents generally suggests source control of the TiO2 content, in which the Al2O3 is dominated by terrigenous input (Figure 8a). The plot of the geochemical proxies for sediment provenance indicates a varying range of sediment supply (Figure 8b). The terrestrial influx and marine-derived components show a nearly strictly negative correlation. The calcareous phosphorites are dominated by sediments of marine origin with less than 20% siliciclastic sediments, while the sandy phosphorites contain mostly terrestrial sediments and marine materials (Figure 8c). This suggests that the phosphates that occur in both the carbonate and the sandstone rocks were derived from marine sources. The SiO2 and CaO contents are the key components that represent the terrestrial sediments that were deposited near the shoreline and the carbonate platform, respectively. The negative correlation between the SiO2 and P2O5 contents and the positive correlation between the CaO and P2O5 contents indicate that CaO content is determined by the content of phosphate, and the phosphate is negatively related to terrestrial input (Figure 8d). Furthermore, these correlations support that the phosphates mainly precipitated from the seawater rather than were derived from terrestrial detrital input.

5.2. Trace Elements Implications

The trace elements V, Ni, Mo, U, Cu, and Cr are usually used as proxies for sedimentary environments, particularly in describing redox conditions and productivity [50,51,52]. We used V, Ni, Co, Mo, and Cr as proxies for a sedimentary environment in this study.
Nickel behaves as a micronutrient and occurs in soluble forms, Ni2+ or NiCl+. Under moderately reducing conditions, Ni is released from the sediments into the overlying water, and under sulfate-reducing conditions, Ni forms insoluble NiS within pyrite [53]. Chromium is present mainly as Cr4+ in oxic environments and is reduced to Cr3+ under anoxic conditions, easily precipitated into the sediments [54]. Vanadium occurs as V5+, and under mildly reducing conditions, it is present as V4+ and is reduced further to V3+. Vanadium starts precipitating in suboxic environments. Compared to Ni and Cr, V is more effectively fixed in sediments under anoxic conditions. Therefore, V/Ni and V/Cr ratios can be used to indicate the level of oxygenation of the depositional environment. Higher V/Ni and V/Cr ratios indicate more strongly reducing conditions [51,52,55]. Mo precipitates under euxinic conditions. Thus, when the V/Mo ratio in sediments is close to the seawater ratio, it indicates an anoxic condition, and an increasing ratio indicates higher oxygenation levels [56,57]. Cobalt can be diffused out of the sediments under reducing conditions [58], which increases the Ni/Co ratio, and thus, the Ni/Co ratio can be used as a redox proxy [51,59]. Statistic results (Figure 9) classify most samples into the oxic and suboxic domain, defining a depositional environment that had sufficient oxygen during the time the Thaniyat phosphorite was deposited. This conclusion is consistent with the lithological data.

5.3. REE Patterns and Their Implications

The phosphorite deposits contain a significant enrichment in the REEs [61]. Many marine phosphorites, especially those belonging to the Tethys phosphogenesis provenance, such as the lower Maastrichtian phosphorites in the Gafsa Basin, Tunisia [45], and the Morocco phosphorites [62], show flat patterns without any enrichment of their LREE over their HREE, whereas in the Hazm Al-Jalamid phosphorites, the REE patterns show a progressive enrichment toward the heavier REEs [20]. The concentrations of the REEs in the Thaniyat phosphorite from the northwest of Saudi Arabia vary widely (Figure 6a,b). Their statistics indicate that all of these phosphorites are rich in MREEs, and the content of HREEs is higher than LREEs (Figure 10). The patterns and variability of the REEs in phosphorite may be modified by lithogenous, biogenic, and other hydrogenous phases after their deposition because the REEs are generally more concentrated in the marine apatites than in the bulk phosphorite [63]. The authigenic chert bed adjacent to the phosphorite shows a highly variable REE pattern (Figure 6c), indicating the variation in the seawater REE concentration. Moreover, the sources of the REEs fundamentally determine their final pattern. Except for the seawater itself, the riverine, eolian, volcanic, and bio-inputs could influence the REE concentration in the sediments, and the terrestrial input provides a large flux of REEs to the marine sediments, which are commonly released to the sediment pore waters [40,61,64]. When the REEs are used as proxies for paleo-redox estimation, the validity of the data should be considered, because only the seawater-sourced REEs have more exact paleo-redox information [40]. The brown mudstone interbedded with the phosphorite indicates the significant terrestrial characteristics by enriching the LREEs and MREEs distinctively (Figure 6d).
To estimate the validity of the REE data as indicators for paleo-ocean redox, two approaches were employed. Here, yttrium (Y) and holmium (Ho) are used, which act as a twin pair due to their similar charges and radii. Silicate rocks or clastic sedimentary rocks generally have chondritic Y/Ho values, which implies that there is no apparent fractionation of Y from Ho. In contrast, seawater is generally characterized by a superchondritic Y/Ho ratio, which results from Ho being scavenged faster than Y [65]. Using the Y/Ho ratio is a valid approach to separate the influence of terrestrial input from that of the oceanic REEs, which differ from the detritally sourced REEs (~25–30), and the hydrogenously sourced REEs (~60) [66]. The cross plot of the Y/Ho ratio and the ∑REEs of the phosphorite show that the plots of the samples cluster around the domain of the modern ocean, which implies the effects of seawater-dominated REEs (Figure 11a). The detrital origin of REEs always produces a positive correlation with Th or Al, which are dominantly of terrestrial origin [66]. This relationship can also be illustrated by the diagenetic integration of REEs [40]. The plot of Th versus ∑REEs indicates the negligible control of the terrestrial influx of the REEs on the phosphorite (Figure 11b). Consequently, the occurrence of REEs in the phosphorite is mostly controlled by the seawater source. The REEs in seawater could be concentrated into phosphate by absorption and ion exchange, which is hardly occurred in the terrestrial sediments [40,67]. Thus, we can reasonably infer that the occurrence of REEs is mostly due to the phosphatic components of the sediments.

5.4. Redox Conditions during the Reworked Phosphorite Deposition

Cerium (Ce) is highly sensitive to changes in redox conditions. Ce (Ⅲ) is readily oxidized to Ce (IV) under oxic conditions, creating a potential fractionation pattern relative to the other REEs, e.g., [40,68]. This Ce response to redox condition results in a negative Ce anomaly relative to La and Pr in well-oxygenated seawater. In anoxic seawater, Ce (Ⅲ) is similar to the other REEs and shows a weak fractionation pattern. The Ce anomaly (Ce/Ce* ratio) decreases in the upper oxic water and increases in the suboxic water at depths in the modern ocean, which demonstrates its sensitivity to redox conditions, e.g., [41,68,69]. The negative anomaly of Ce is relative to the concentrations of La and Pr, and thus, it could be masked by high La concentrations. To correct this, the Pr/Pr* ratio can be used to assess the degree of La effect [39]. The cross plot between the Ce/Ce* and the Pr/Pr* ratios confirms that Ce in the northern Saudi Arabia phosphorite has a negative anomaly (Figure 9a; see [39]. The negative trends of Ce/Ce* and Pr/Pr* values show the variations of Ce anomalies. Compared with the modern coastal waters [64], less negative Ce anomalies (higher Ce/Ce* values) are displayed by the sandy phosphorite, which underlies the calcareous phosphorite with a relatively lower Ce/Ce* value.
The bivariate plot of (La/Sm)N-Ce/Ce* was used to refine the Ce/Ce* ratio. Morad and Felitsyn [47] proposed that, when there is a lack of correlation between (La/Sm)N and Ce/Ce* and the ratio of (La/Sm)N is less than 0.35, the Ce anomalies are unlikely affected by artifacts due to the calculations. The (La/Sm)N values of the phosphorite samples have a range of 0.80–1.62, and the (La/Sm)N-Ce/Ce* plot shows a weak correlation (Figure 12b). Therefore, the Ce negative anomalies may be weakly influenced by artificial calculation.
Post-depositional processes may also affect the fractionation of the REEs, such as diagenesis, e.g., [40,56,70]. (Dy/Sm)N-Ce/Ce* and REEs-Ce/Ce* are two geochemical criteria that are used in determining the effects of diagenetic processes on the Ce anomalies, e.g., [46,71]. The negative correlation between Ce/Ce* and (Dy/Sm)N (r2 = 0.67) (Figure 12c) and a slightly positive correlation between the REEs and Ce/Ce* (Figure 12d) suggest that diagenetic processes have influenced the variation of Ce anomaly values in these phosphorites.
Europium is another redox-sensitive REE. It could be reduced from Eu (Ⅲ) to Eu (Ⅱ) and causes fractionation relative to the other REEs under reducing conditions, e.g., [40,46,72]. The strong negative Eu anomalies in the phosphorite indicate extremely reducing conditions [46,73], and positive Eu anomalies indicate the contribution of allochthonous sediment sources [13] or suggest oxic depositional conditions [46]. The Eu/Eu* values of the phosphorite from northern Saudi Arabia clustered around 1, indicating negligible Eu fractionation (Figure 12e).

5.5. Formation of the Reworked Phosphorite

5.5.1. Depositional Processes

The geochemical information discussed above illustrates the basic environment, where the phosphorite was deposited, and the potential post-depositional processes that it has undergone. The authigenic phosphate grains form below the sediment–water interface [74]. In the suboxic zone of the sediments in upwelling areas, high rates of supersaturation in the pore water with respect to carbonate fluorapatite (CFA) occur due to the decomposition of the P-enriched organisms, e.g., [13,75,76]. This supersaturation leads to the rapid precipitation of CFA via an amorphous metastable precursor, which is transformed into a stable apatite by involving the uptake of fluoride from the seawater [13,77,78,79]. This forms pristine phosphorite, and the oscillations in environmental conditions cause the formation of phosphatic ooids and pellets in the pristine phosphorite deposit [13,44,80,81]. Although the variations in the environment, both geochemical and redox, are the main controls in the variation of the composition between the cortices [13], the nearly consistent concentrations of the major elements from the inside to the surface in both the phosphatic ooids and the pellets demonstrate an almost constant geochemical environment for the formation of the phosphate (Figure 7c–e). Only the variation in minor elements could indicate the slight difference in the ambient environment during the formation of the different cortices (Figure 7f–h).
The phosphatic ooids with numerous cortex unconformities are interpreted to have formed through multiple episodes of phosphatization, exhumation, and erosion, followed by reburial into the zone of phosphogenesis (ZOP) (Figure 4a). Conversely, the conformable cortices indicate the precipitation of pristine francolite within the ZOP, accompanied by changes in pore water redox potential [13,80]. The ooids inside of a larger grain serving as cores exhibit nearly conformable cortices (Figure 4b), while they are winnowed to form new larger grains. This indicates that the environment for the growth of phosphatic grains varies hydrodynamically and geochemically (Figure 4a,b). The pristine phosphogenesis province prefers to occur near the margin of the shelf and is potentially dominated by upwelling [31,79,82,83]. However, the phosphorite host rocks are carbonate and sandstone in the northwestern part of Saudi Arabia, implying that the pristine phosphorite has been reworked and transported landward. The grains are all raised up from the benthal sediments, in which the pristine phosphates occurred, and then were transported by transgressive currents to their present location [31,84,85]. This interpretation is also supported by the presence of rock fragments derived from the pristine phosphorite, which are larger in grain sizes, show complicity in composition, contain phosphatic matrix, and were deformed by transportation (Figure 5a,b). Their incompatible grain sizes imply the effects of storm currents, or at least, a variable current. The bio-related components also provide information about the depositional processes that acted on the deposits. Vertebrate fossil fragments (Figure 5c), reassembled organisms in phosphatic grains (Figure 5d), and cluttered biological skeletons (Figure 5e) all indicate intensive reworking and redeposition.
Chemical redox proxies indicate adequate oxygen during the deposition. It is the characteristics of pervasively reworking current that occurred in a shallow-water shelf. The yttrium anomaly (Y/Y*) and the (La/Nd)N ratio closely relate to post-depositional changes, such as weathering processes [45,46]. The cross plot of Y/Y* and (La/Nd)N values shows a strong positive correlation (Figure 13a), which indicates the close relationship between Y and La behavior in the pore water [41]. This trend presumably results from the reworking processes that have enriched Y and La in the phosphorite by absorption [45,71]. Reworking is also an effective agent in preferential leaching of the MREEs relative to the rest of the REEs [86], which gives rise to the positive correlation between the Y/Y* and the (La/Sm)N [46]. Although the distribution pattern of the REEs normalized to the PAAS generally indicates the enrichment of the MREEs (Figure 6a,b), the less likely hat-shape pattern implies the fractionation of the MREEs. The strong positive correlation of the Y/Y* and the (La/Sm)N (Figure 13b) suggests that reworking occurred [46,71].

5.5.2. Diagenesis

The (La/Yb)N and (La/Sm)N ratios are considered as indicators of LREEs and MREEs enrichment, respectively [41,87]. Reynard, Lécuyer, and Grandjean [87] proposed that the adsorption by moderate diagenesis and recrystallization processes are two ways with respect to the REE fractionation. The (La/Yb)N values would increase compared to those of the seawater due to the preferential sorption of the LREEs. The (La/Sm)N ratio would show a significant decrease if the substitution through the recrystallization of apatite predominates. The (La/Yb)N and (La/Sm)N ratios in the calcareous and sandy phosphorites from the northwestern part of Saudi Arabia (Figure 13c) plot into the field of oceanic water of Reynard, Lécuyer, and Grandjean [87]. This is consistent with the preservation of an original surface seawater REE pattern [45], indicating that limited post-depositional recrystallization and adsorption took place in these phosphorites [41]. However, the trend shown by the Ce anomaly is considered as the result of diagenesis (Figure 12a), indicating that post-depositional alteration had occurred [71]. The formation of apatite or fluorapatite affects the concentrations of the REEs during the very early stage when it occurred near the interface between the sediments and the seawater [17,71,88].
The petrologic analysis and the presence of authigenic minerals in these phosphorites demonstrate early diagenetic events that occurred after their redeposition. Weak apatite recrystallization and precipitation around the phosphatic grains occurred during the very early stage (Figure 14a) and was followed by the formation of calcite cement (Figure 14b,c). The apatite cement is sporadically distributed. On the other hand, calcite recrystallized extensively and is more intense in the calcareous phosphorite, caused by tight and local cementation (Figure 3). It precipitated in the sandy phosphorite as a pore-filling (Figure 2). Subsequently, pyrolusite and hematite precipitated as replacement of apatite (Figure 14d), or they sporadically filled the pores (Figure 14e,f). The diagenetic processes and the precipitated minerals imply a relative oxygen-sufficient environment that the phosphorite has undergone after being redeposited.
The fractionation of C and O occurred during the precipitation of the minerals and is affected directly by the environment where they developed, e.g., [62,71,89]. Compared to other phosphorites in the world, the pristine phosphorite has stronger negative C and O excursions [22,55], which was explained by organic matter participation. The northern Saudi Arabia phosphorite has a very close relationship with the Jordanian reworked phosphorite [28,31] and with the reworked Egyptian phosphorite [48]. They show a very similar distribution of C and O isotopes. This indicates that the carbonates precipitated with the reworked phosphorite are affected by the seaward transport of the pristine phosphorite and this effect works in spreading the C and O isotopes in a wide range (Figure 15).

5.5.3. Scenario of Phosphorite Occurrence

The formation of the phosphorite in the northwest of Saudi Arabia is explained in three scenarios (Figure 16). Originally, they formed in the north, near the margin of the slope, where it was the favorable location for the deposition of pristine phosphorite due to the upwelling in this area (Figure 16A). This is evidenced by the preserved phosphorite in the north [90,91]. The palaeogeographic location indicated that the phosphorites in the Jordan and other places in the north were developed closer to the slope, where pristine phosphorites were preferred, which could be the source of reworked phosphorite in the Sirhan-Turayf basin. The information derived from the phosphatic grains implies that the current was variable during the deposition of the pristine phosphorite [13,80], but the geochemical environment, however, was relatively consistent (Figure 7).
The pristine phosphorite was reworked and transported landward due to the eustatic changes [31,85]. The reworked phosphorite grains were transported to nearshore areas, where the research area was in a shallow marine nearshore environment in the Late Cretaceous, which was redeposited with the siliciclastic sediments that were derived from terrestrial sources, forming the sandy phosphorites (Figure 16B). This occurred at the very beginning of the transgression event during the Late Campanian [44,84,91]. The evolution of the transgression caused the sea-level rise, and the research area evolved from a nearshore environment to a carbonate platform, in which the water was relatively deeper. The accumulation of unloaded phosphatic grains on the carbonate platform, deposited with the carbonate matrix simultaneously, leads to the formation of calcareous phosphorites (Figure 16C). After deposition, compaction, phosphate precipitation, and calcite cementation, the formation of pyrolusite and hematite occurred in both types of phosphorite. These are supported by petrological, geochemical, and isotopic analyses (Figure 2, Figure 3, Figure 5, Figure 14 and Figure 15), and caused by the uplift of the Arabian Plate from the Late Eocene [92].
The scenario about the processes of phosphorite deposition can explain the occurrences of sandy and calcareous phosphorites. However, the very thin nature of these deposits (Figure 1) indicates a very low supply of reworked primary phosphorites. This condition relates to the transition in the sedimentary environment that was affected by the transgression. The pristine phosphorites sensitively depended on the primary productivity of the ocean and were closely related to the decay of organisms and phosphogenesis in the pores near the water and sediment interface [91]. The complexity of the primary phosphorite origin demands a rigorous sedimentary environment, which can allow the rapid growth of the phosphates. Thus, an industrial phosphorite deposit requires a consistent and narrow range of sedimentary conditions. The reworked phosphorite accumulation is regulated by the sedimentary facies that is elongated along the coastline.

6. Conclusions

(1) The transgression and storm events of the Tethys Ocean reworked the pristine phosphorites of the northern margin of the Arabian Plate in the Late Cretaceous sequence. The reworked phosphate was transported to the shelf near the shoreline, mixed with the terrestrial input and the precipitated carbonate, which created thin layers of Thaniyat phosphorite in the Sirhan-Turayf basin;
(2) The evidence from the various phosphatic grains, which contains original information on the phosphorite, indicates that the pristine phosphorite was deposited in a fluctuating hydrodynamic condition and a relatively consistent geochemical environment, which implies a narrow range of geochemical environment of phosphogenesis;
(3) The bulk geochemical data suggest oxic conditions for the Thaniyat phosphorite formation in the Sirhan-Turayf basin, compared to the relative phosphorite deposits in the north of Jordan, where the redox conditions tend to be suboxic and anoxic;
(4) A model was established to illustrate the formation of the phosphorite in the research area, including the source of the pristine phosphorite in the north, the transportation of the Neo-Tethys’ transgression, which may relate to tectonic movement, and the deposition result variation according to the changes in the sedimentary environment and sediment sources;
(5) Diagenesis, including compaction, recrystallization, and cementation, was initiated after the deposition of the phosphorites. These processes partially account for the depletion of REEs and the excursion of C and O isotopes in the Thaniyat phosphorite;
(6) The detail of the mudstone and chert interbedded with the calcareous phosphorite contains information of the environment’s evolution in a smaller scale, which implied that the sea level changed frequently.

Author Contributions

Conceptualization, Z.L. (Ziying Li), M.Q. and Y.Z.; methodology, Z.L. (Zhingxing Li), L.Y. and G.L.; investigation, S.M.D., M.Q., Y.Z. and A.S.B.; resources, S.M.D., A.S.B., A.M.M. and A.M.S.; data curation, Y.Z., Z.L. (Zhixing Li), G.L., A.M.M., S.M.D. and A.M.S.; writing—original draft preparation, Y.Z. and Z.L. (Ziying Li); writing—review and editing, Z.L. (Ziying Li), A.M.M. and A.S.B.; supervision, Z.L. (Ziying Li), M.Q. and S.M.D.; project administration, Z.L. (Ziying Li) and S.M.D.; funding acquisition, Z.L. (Ziying Li) and Y.Z. All authors have read and agreed to the published version of the manuscript.

Funding

This research was funded by the Beijing Research Institute of Uranium Geology (BRIUG) projects, grant number ST1703–2 and LCEQ01–5.

Institutional Review Board Statement

Not applicable.

Informed Consent Statement

Not applicable.

Data Availability Statement

The data presented in this study are available in this article.

Acknowledgments

We thank the fieldwork team members: Yang Li and Tianfa Lin from the No. 243 Party of the CNNC; Zhengqian Wu, Xu Zhao, and Shanming Liang from the No. 203 Research Institute of the CNNC; Kebao Yin from the No. 216 Party of the CNNC; and Yong Wu and Huanpeng Xie from the No. 290 Research Institute of the CNNC. We appreciate the assistance provided by the members of the laboratory of the BRIUG for their help in the electron microscope analysis and the chemical assay.

Conflicts of Interest

The authors declare no conflict of interest.

References

  1. Cook, P.J.; Shergold, J.H. Phosphorus, phosphorites and skeletal evolution at the Precambrian—Cambrian boundary. Nature 1984, 308, 231–236. [Google Scholar] [CrossRef]
  2. Van Cappellen, P.; Ingall, E.D. Redox Stabilization of the Atmosphere and Oceans by Phosphorus-Limited Marine Productivity. Science 1996, 275, 406–408. [Google Scholar] [CrossRef] [PubMed]
  3. Xiao, S.; Zhang, Y.; Knoll, A.H. Three-dimensional preservation of algae and animal embryos in a Neoproterozoic phosphorite. Nature 1998, 391, 553–558. [Google Scholar] [CrossRef]
  4. Gál, P.; Polgári, M.; Józsa, S.; Gyollai, I.; Kovács, I.; Szabó, M.; Fintor, K. Contribution to the origin of Mn-U-Be-HREE-enrichment in phosphorite, near Bükkszentkereszt, NE Hungary. Ore Geol. Rev. 2020, 125, 103665. [Google Scholar] [CrossRef]
  5. Zhang, Y.; Xie, D.; Ni, J.; Zeng, X. Optimizing phosphate fertilizer application to reduce nutrient loss in a mustard (Brassica juncea var. tumida)-maize (Zea mays L.) rotation system in Three Gorges Reservoir area. Soil Tillage Res. 2019, 190, 78–85. [Google Scholar] [CrossRef]
  6. Barra, P.J.; Pontigo, S.; Delgado, M.; Parra–Almuna, L.; Duran, P.; Valentine, A.J.; Jorquera, M.A.; Mora, M.d.l.L. Phosphobacteria inoculation enhances the benefit of P–fertilization on Lolium perenne in soils contrasting in P–availability. Soil Biol. Biochem. 2019, 136, 107516. [Google Scholar] [CrossRef]
  7. Bi, Q.-F.; Zheng, B.-X.; Lin, X.-Y.; Li, K.-J.; Liu, X.-P.; Hao, X.-L.; Zhang, H.; Zhang, J.-B.; Jaisi, D.P.; Zhu, Y.-G. The microbial cycling of phosphorus on long-term fertilized soil: Insights from phosphate oxygen isotope ratios. Chem. Geol. 2018, 483, 56–64. [Google Scholar] [CrossRef]
  8. Naureen, Z.; Sham, A.; Al Ashram, H.; Gilani, S.A.; Al Gheilani, S.; Mabood, F.; Hussain, J.; Al Harrasi, A.; AbuQamar, S.F. Effect of phosphate nutrition on growth, physiology and phosphate transporter expression of cucumber seedlings. Plant Physiol. Biochem. 2018, 127, 211–222. [Google Scholar] [CrossRef]
  9. Li, B.; Bicknell, K.B.; Renwick, A. Peak phosphorus, demand trends and implications for the sustainable management of phosphorus in China. Resour. Conserv. Recycl. 2019, 146, 316–328. [Google Scholar] [CrossRef]
  10. Geissler, B.; Mew, M.C.; Steiner, G. Phosphate supply security for importing countries: Developments and the current situation. Sci. Total Environ. 2019, 677, 511–523. [Google Scholar] [CrossRef]
  11. Wang, X.-Q.; Ruan, W.-Y.; Yi, K.-K. Internal phosphate starvation signaling and external phosphate availability have no obvious effect on the accumulation of cadmium in rice. J. Integr. Agric. 2019, 18, 2153–2161. [Google Scholar] [CrossRef]
  12. Edelman-Furstenberg, Y. Distribution and paleoecology of molluscan skeletal remains along an upwelling tract: Benguela system, Namibian shelf. Mar. Geol. 2014, 353, 153–162. [Google Scholar] [CrossRef]
  13. Arning, E.T.; Lueckge, A.; Breuer, C.; Gussone, N.; Birgel, D.; Peckmann, J. Genesis of phosphorite crusts off Peru. Mar. Geol. 2009, 262, 68–81. [Google Scholar] [CrossRef]
  14. Papineau, D. Global Biogeochemical Changes at Both Ends of the Proterozoic: Insights from Phosphorites. Astrobiology 2010, 10, 165–181. [Google Scholar] [CrossRef]
  15. Brandano, M.; Westphal, H.; Mateu-Vicens, G.; Preto, N.; Obrador, A. Ancient upwelling record in a phosphate hardground (Tortonian of Menorca, Balearic Islands, Spain). Mar. Pet. Geol. 2016, 78, 593–605. [Google Scholar] [CrossRef]
  16. Albuquerque, A.L.; Meyers, P.; Belem, A.L.; Turcq, B.; Siffedine, A.; Mendoza, U.; Capilla, R. Mineral and elemental indicators of post-glacial changes in sediment delivery and deposition under a western boundary upwelling system (Cabo Frio, southeastern Brazil). Palaeogeogr. Palaeoclim. Palaeoecol. 2016, 445, 72–82. [Google Scholar] [CrossRef]
  17. Defforey, D.; Paytan, A. Phosphorus cycling in marine sediments: Advances and challenges. Chem. Geol. 2018, 477, 1–11. [Google Scholar] [CrossRef]
  18. Drummond, J.B.R.; Pufahl, P.K.; Porto, C.G.; Carvalho, M. Neoproterozoic peritidal phosphorite from the Sete Lagoas Formation (Brazil) and the Precambrian phosphorus cycle. Sedimentology 2015, 62, 1978–2008. [Google Scholar] [CrossRef]
  19. Wigley, R.; Compton, J.S. Oligocene to Holocene glauconite-phosphorite grains from the Head of the Cape Canyon on the western margin of South Africa. Deep Sea Res. Part II Top. Stud. Oceanogr. 2007, 54, 1375–1395. [Google Scholar] [CrossRef]
  20. Al-Hobaib, A.S.; Baioumy, H.M.; Al-Ateeq, M.A. Geochemistry and origin of the Paleocene phosphorites from the Hazm Al-Jalamid area, northern Saudi Arabia. J. Geochem. Explor. 2013, 132, 15–25. [Google Scholar] [CrossRef]
  21. Kechiched, R.; Laouar, R.; Bruguier, O.; Salmi-Laouar, S.; Kocsis, L.; Bosch, D.; Foufou, A.; Ameur-Zaimeche, O.; Larit, H. Glauconite-bearing sedimentary phosphorites from the Tebessa region (eastern Algeria): Evidence of REE enrichment and geochemical constraints on their origin. J. Afr. Earth Sci. 2018, 145, 190–200. [Google Scholar] [CrossRef]
  22. Kocsis, L.; Ounis, A.; Baumgartner, C.; Pirkenseer, C.; Harding, I.C.; Adatte, T.; Chaabani, F.; Neili, S.M. Paleocene-Eocene palaeoenvironmental conditions of the main phosphorite deposits (Chouabine Formation) in the Gafsa Basin, Tunisia. J. Afr. Earth Sci. 2014, 100, 586–597. [Google Scholar] [CrossRef]
  23. Stern, R.J.; Johnson, P. Continental lithosphere of the Arabian Plate: A geologic, petrologic, and geophysical synthesis. Earth Sci. Rev. 2010, 101, 29–67. [Google Scholar] [CrossRef]
  24. Beyazpirinç, M.; Akçay, A.E.; Yilmaz, A.; Sönmez, M.K. A Late Cretaceous ensimatic arc developed during closure of the northern branch of Neo-Tethys (central-northern Turkey). Geosci. Front. 2019, 10, 1015–1028. [Google Scholar] [CrossRef]
  25. Golonka, J. Plate tectonic evolution of the southern margin of Eurasia in the Mesozoic and Cenozoic. Tectonophysics 2004, 381, 235–273. [Google Scholar] [CrossRef]
  26. Zhang, Y.; Li, Z.; Qin, M.; Bao, Z.; Li, Z.; Yi, L.; Li, G. Sedimentology and stratigraphy sequence of the north of Saudi Arabia: Implications for the evolution of the Neo-Tethys in the Late Cretaceous. Geol. J. 2021, 56, 1510–1530. [Google Scholar] [CrossRef]
  27. Alqudah, M.; Ali Hussein, M.; van den Boorn, S.; Podlaha, O.G.; Mutterlose, J. Biostratigraphy and depositional setting of Maastrichtian—Eocene oil shales from Jordan. Mar. Pet. Geol. 2015, 60, 87–104. [Google Scholar] [CrossRef]
  28. Abed, A.M.; Arouri, X.R.; Boreham, C.J. Source rock potential of the phosphorite-bituminous chalk-marl sequence in Jordan. Mar. Pet. Geol. 2005, 22, 413–425. [Google Scholar] [CrossRef]
  29. Farouk, S.; Marzouk, A.M.; Ahmad, F. The Cretaceous/Paleogene boundary in Jordan. J. Asian Earth Sci. 2014, 94, 113–125. [Google Scholar] [CrossRef]
  30. Abed, A.M.; Amireh, B.S. Sedimentology, geochemistry, economic potential and palaeogeography of an Upper Cretaceous phosphorite belt in the southeastern desert of Jordan. Cretac. Res. 1999, 20, 119–133. [Google Scholar] [CrossRef]
  31. Abed, A.M.; Sadaqah, R.; Al-Jazi, M. Sequence stratigraphy and evolution of Eshidiyya phosphorite platform, southern Jordan. Sediment. Geol. 2007, 198, 209–219. [Google Scholar] [CrossRef]
  32. Meissner, C.R.; Dini, S.M.; Farasani, A.M.; Riddler, G.P.; Smith, G.H.; Griffin, M.B.; Eck, M.V. Preliminary Geologic Map of the Thaniyat Turayf Quadrangle, Sheet 29C, Kingdom of Saudi Arabia; U.S. Geological Survey: Reston, VA, USA; Saudi Geological Survey: Jeddah, Saudi Arabia, 1990.
  33. Meissner, R.C.; Ankary, A. Geology of Phosphate Deposits in the Sirhan-Turayf Basin, Kingdom of Saudi Arabia; U.S. Geological Survey: Reston, VA, USA; Saudi Geological Survey: Jeddah, Saudi Arabia, 1970.
  34. Haq, B.U.; Al-Qahtani, A.M. Phanerozoic cycles of sea-level change on the Arabian Platform. GeoArabia 2005, 10, 127–160. [Google Scholar]
  35. Ashckenazi-Polivoda, S.; Abramovich, S.; Almogi-Labin, A.; Schneider-Mor, A.; Feinstein, S.; Püttmann, W.; Berner, Z. Paleoenvironments of the latest Cretaceous oil shale sequence, Southern Tethys, Israel, as an integral part of the prevailing upwelling system. Palaeogeogr. Palaeoclim. Palaeoecol. 2011, 305, 93–108. [Google Scholar] [CrossRef]
  36. Notholt, A.J.G.; Jarvis, I. A decade of phosphorite research and development. J. Geol. Soc. Lond. 1989, 146, 873–876. [Google Scholar] [CrossRef]
  37. Föllmi, K.B. The phosphorus cycle, phosphogenesis and marine phosphate-rich deposits. Earth Sci. Rev. 1996, 40, 55–124. [Google Scholar] [CrossRef]
  38. Abed, A.M.; Fakhouri, K. On the chemical variability of phosphatic particles from Jordanian phosphorite deposits. Geochem. Geol. 1996, 131, 1–13. [Google Scholar] [CrossRef]
  39. Bau, M.; Dulski, P. Distribution of yttrium and rare-earth elements in the Penge and Kuruman iron-formations, Transvaal Supergroup, South Africa. Precambrian Res. 1996, 79, 37–55. [Google Scholar] [CrossRef]
  40. Chen, J.; Algeo, T.J.; Zhao, L.; Chen, Z.-Q.; Cao, L.; Zhang, L.; Li, Y. Diagenetic uptake of rare earth elements by bioapatite, with an example from Lower Triassic conodonts of South China. Earth Sci. Rev. 2015, 149, 181–202. [Google Scholar] [CrossRef]
  41. Fazio, A.M.; Scasso, R.A.; Castro, L.N.; Carey, S. Geochemistry of rare earth elements in early-diagenetic miocene phosphatic concretions of Patagonia, Argentina: Phosphogenetic implications. Deep Sea Res. Part II Top. Stud. Oceanogr. 2007, 54, 1414–1432. [Google Scholar] [CrossRef]
  42. McLennan, S.M. Rare earth elements in sedimentary rocks: Influence of provenance and sedimentary processes. Rev. Mineral. Geochem. 1989, 21, 169–200. [Google Scholar]
  43. Scholz, F.; McManus, J.; Mix, A.C.; Hensen, C.; Schneider, R.R. The impact of ocean deoxygenation on iron release from continental margin sediments. Nat. Geosci. 2014, 7, 433–437. [Google Scholar] [CrossRef] [Green Version]
  44. Pufahl, P.K.; Grimm, K.A.; Abed, A.M.; Sadaqah, R.M.Y. Upper Cretaceous (Campanian) phosphorites in Jordan implications for the formation of a south Tethyan phosphorite giant. Sediment. Geol. 2003, 161, 175–205. [Google Scholar] [CrossRef]
  45. Garnit, H.; Bouhlel, S.; Jarvis, I. Geochemistry and depositional environments of Paleocene Eocene phosphorites: Metlaoui Group, Tunisia. J. Afr. Earth Sci. 2017, 134, 704–736. [Google Scholar] [CrossRef] [Green Version]
  46. Abedini, A.; Calagari, A.A. REEs geochemical characteristics of lower Cambrian phosphatic rocks in the Gorgan-Rasht Zone, northern Iran: Implications for diagenetic effects and depositional conditions. J. Afr. Earth Sci. 2017, 135, 115–124. [Google Scholar] [CrossRef]
  47. Morad, S.; Felitsyn, S. Identification of primary Ce-anomaly signatures in fossil biogenic apatite: Implication for the Cambrian oceanic anoxia and phosphogenesis. Sediment. Geol. 2001, 143, 259–264. [Google Scholar] [CrossRef]
  48. Baioumy, H.M.; Tada, R.; Gharaie, M.H.M. Geochemistry of Late Cretaceous phosphorites in Egypt: Implication for their genesis and diagenesis. J. Afr. Earth Sci. 2007, 49, 12–28. [Google Scholar] [CrossRef]
  49. Murray, R.W. Chemical criteria to identify the depositional environment of chert: General principles and applications. Sedimen. Geol. 1994, 90, 213–232. [Google Scholar] [CrossRef]
  50. Baioumy, H.; Lehmann, B. Anomalous enrichment of redox-sensitive trace elements in the marine black shales from the Duwi Formation, Egypt: Evidence for the late Cretaceous Tethys anoxia. J. Afr. Earth Sci. 2017, 133, 7–14. [Google Scholar] [CrossRef]
  51. Garnit, H.; Bouhlel, S.; Barca, D.; Chtara, C. Application of LA-ICP-MS to sedimentary phosphatic particles from Tunisian phosphorite deposits: Insights from trace elements and REE into paleo-depositional environments. Chemie Erde Geochem. 2012, 72, 127–139. [Google Scholar] [CrossRef]
  52. Pi, D.-H.; Jiang, S.-Y.; Luo, L.; Yang, J.-H.; Ling, H.-F. Depositional environments for stratiform witherite deposits in the Lower Cambrian black shale sequence of the Yangtze Platform, southern Qinling region, SW China: Evidence from redox-sensitive trace element geochemistry. Palaeogeogr. Palaeoclim. Palaeoecol. 2014, 398, 125–131. [Google Scholar] [CrossRef]
  53. Tribovillard, N.; Algeo, T.J.; Lyons, T.; Riboulleau, A. Trace metals as paleoredox and paleoproductivity proxies: An update. Chem. Geol. 2006, 232, 12–32. [Google Scholar] [CrossRef]
  54. Algeo, T.J.; Maynard, J.B. Trace-element behavior and redox facies in core shales of Upper Pennsylvanian Kansas-type cyclothems. Geochem. Geol. 2004, 206, 289–318. [Google Scholar] [CrossRef]
  55. Yao, C.; Ma, D.; Ding, H.; Zhang, X.; Huang, H. Trace elements and stable isotopic geochemistry of an Early Cambrian chert-phosphorite unit from the lower Yurtus Formation of the Sugetbrak section in the Tarim Basin. Sci. China Earth Sci. 2014, 57, 454–464. [Google Scholar] [CrossRef]
  56. Gallego-Torres, D.; Martinez-Ruiz, F.; De Lange, G.J.; Jimenez-Espejo, F.J.; Ortega-Huertas, M. Trace-elemental derived paleoceanographic and paleoclimatic conditions for Pleistocene Eastern Mediterranean sapropels. Palaeogeogr. Palaeoclim. Palaeoecol. 2010, 293, 76–89. [Google Scholar] [CrossRef]
  57. Piper, D.Z.; Calvert, S.E. A marine biogeochemical perspective on black shale deposition. Earth Sci. Rev. 2009, 95, 63–96. [Google Scholar] [CrossRef]
  58. Heggie, D.; Lewis, T. Cobalt in pore waters of marine sediments. Nature 1984, 311, 453–455. [Google Scholar] [CrossRef]
  59. Jones, B.; Manning, D.A.C. Composition of Geochemical indices used for the interpretation of paleoredox conditions in ancient mudstones. Chem. Geol. 1994, 111, 111–129. [Google Scholar] [CrossRef]
  60. Galarraga, F.; Reategui, K.; Martïnez, A.; Martínez, M.; Llamas, J.F.; Marquez, G. V/Ni ratio as a parameter in palaeoenvironmental characterisation of non-mature medium-crude oils from several Latin American basins. J. Pet. Sci. Eng. 2008, 61, 9–14. [Google Scholar] [CrossRef]
  61. Emsbo, P.; McLaughlin, P.I.; Breit, G.N.; du Bray, E.A.; Koenig, A.E. Rare earth elements in sedimentary phosphate deposits: Solution to the global REE crisis? Gondwana Res. 2015, 27, 776–785. [Google Scholar] [CrossRef] [Green Version]
  62. Jarvis, I.; Burnett, W.C.; Nathan, Y.; Almbaydin, F.S.M.; Attia, A.K.M.; Castro, L.N.; Flicoteaux, R.; Hilmy, M.E.; Husain, V.; Qutawnah, A.A.; et al. Phosphorite geochemistry-state-of-the-art and environmental concerns. Eclogae Geol. Helv. 1994, 87, 643–700. [Google Scholar]
  63. Fleet, A.J. Aqueous and Sedimentary Geochemistry of the Rare Earth Elements. In Rare Earth Element Geochemistry; Henderson, P., Ed.; Elsevier: Amsterdam, The Netherlands, 1984; Volume 2, pp. 343–347. [Google Scholar]
  64. Elderfield, H.; Upstill-Goddard, R.; Sholkovitz, E.R. The rare earth elements in rivers, estuaries, and coastal seas and their significance to the composition of ocean waters. Geochim. Cosmochim. Acta 1990, 54, 971–991. [Google Scholar] [CrossRef]
  65. Zhang, K.; Zhu, X.; Wood, R.A.; Shi, Y.; Gao, Z.; Poulton, S.W. Oxygenation of the Mesoproterozoic ocean and the evolution of complex eukaryotes. Nat. Geosci. 2018, 11, 345–350. [Google Scholar] [CrossRef]
  66. Webb, G.E.; Kamber, B.S. Rare earth elements in Holocene reefal microbialites: A new shallow seawater proxy. Geochim. Cosmochim. Acta 2000, 64, 1557–1565. [Google Scholar] [CrossRef]
  67. Liao, J.; Sun, X.; Li, D.; Sa, R.; Lu, Y.; Lin, Z.; Xu, L.; Zhan, R.; Pan, Y.; Xu, H. New insights into nanostructure and geochemistry of bioapatite in REE-rich deep-sea sediments: LA-ICP-MS, TEM, and Z-contrast imaging studies. Chem. Geol. 2019, 512, 58–68. [Google Scholar] [CrossRef]
  68. Elderfield, H.; Pagett, R. REE in ichthyoliths: Variations with redox conditions and depositional environment. Sci. Total Environ. 1986, 49, 175–197. [Google Scholar] [CrossRef]
  69. Soudry, D.; Glenn, C.R.; Nathan, Y.; Segal, I.; VonderHaar, D. Evolution of Tethyan phosphogenesis along the northern edges of the Arabian–African shield during the Cretaceous–Eocene as deduced from temporal variations of Ca and Nd isotopes and rates of P accumulation. Earth Sci. Rev. 2006, 78, 27–57. [Google Scholar] [CrossRef]
  70. Caetano-Filho, S.; Paula-Santos, G.M.; Dias-Brito, D. Carbonate REE + Y signatures from the restricted early marine phase of South Atlantic Ocean (late Aptian—Albian): The influence of early anoxic diagenesis on shale-normalized REE + Y patterns of ancient carbonate rocks. Palaeogeogr. Palaeoclim. Palaeoecol. 2018, 500, 69–83. [Google Scholar] [CrossRef] [Green Version]
  71. Shields, G.; Stille, P. Diagenetic constraints on the use of cerium anomalies as palaeoseawater redox proxies: An isotopic and REE study of Cambrian phosphorites. Chem. Geol. 2001, 175, 29–48. [Google Scholar] [CrossRef]
  72. Awadalla, G.S. Geochemistry and microprobe investigations of Abu Tartur REE-bearing phosphorite, Western Desert, Egypt. J. Afr. Earth Sci. 2010, 57, 431–443. [Google Scholar] [CrossRef]
  73. Khan, K.F.; Dar, S.A.; Khan, S.A. Rare earth element (REE) geochemistry of phosphorites of the Sonrai area of Paleoproterozoic Bijawar basin, Uttar Pradesh, India. J. Rare Earths 2012, 30, 507–514. [Google Scholar] [CrossRef]
  74. Soudry, D. Microbial phosphate sediment. In Microbial Sediments; Riding, R.E., Awramik, S.M., Eds.; Spinger: Berlin/Heidelberg, Germany, 2000; pp. 127–136. [Google Scholar]
  75. Schulz, H.N.; Schulz, H.D. Large sulfur bacteria and the formation of phosphorite. Science 2005, 307, 416–418. [Google Scholar] [CrossRef]
  76. O’Brien, G.W.; Harris, J.R.; Milnes, A.R.; Veeh, H.H. Bacterial origin of East Australian continental margin phosphorites. Nature 1981, 294, 442–444. [Google Scholar] [CrossRef]
  77. Compton, J.S.; Bergh, E.W. Phosphorite deposits on the Namibian shelf. Mar. Geol. 2016, 380, 290–314. [Google Scholar] [CrossRef]
  78. Godfrey, L.V.; Falkowski, P.G. The cycling and redox state of nitrogen in the Archaean ocean. Nat. Geosci. 2009, 2, 725. [Google Scholar] [CrossRef]
  79. Goldhammer, T.; Brüchert, V.; Ferdelman, T.G.; Zabel, M. Microbial sequestration of phosphorus in anoxic upwelling sediments. Nat. Geosci. 2010, 3, 557–560. [Google Scholar] [CrossRef]
  80. Pufahl, P.K.; Grimm, K.A. Coated phosphate grains: Proxy for physical, chemical, and ecological changes in seawater. Geology 2003, 31, 801–804. [Google Scholar] [CrossRef]
  81. Pe-Piper, G.; Weir-Murphy, S. Early diagenesis of inner-shelf phosphorite and iron-silicate minerals, Lower Cretaceous of the Orpheus graben, southeastern Canada: Implications for the origin of chlorite rims. AAPG Bull. 2008, 92, 1153–1168. [Google Scholar] [CrossRef]
  82. Javier Alvaro, J.; Shields-Zhou, G.A.; Ahlberg, P.; Jensen, S.; Palacios, T. Ediacaran-Cambrian phosphorites from the western margins of Gondwana and Baltica. Sedimentology 2016, 63, 350–377. [Google Scholar] [CrossRef]
  83. Birch, G.F.; Thomson, J.; McArthur, J.M.; Burnett, W.C. Pleistocene phosphorites off the west coast of South Africa. Nature 1983, 302, 601–603. [Google Scholar] [CrossRef]
  84. Ahmad, F.; Farouk, S.; Abd El-Moghny, M.W. A regional stratigraphic correlation for the upper Campanian phosphorites and associated rocks in Egypt and Jordan. Proc. Geol. Assoc. 2014, 125, 419–431. [Google Scholar] [CrossRef]
  85. Simmons, M.D.; Sharland, P.R.; Casey, D.M.; Davies, R.B.; Sutcliffe, O.E. Arabian Plate sequence stratigraphy: Potential implications for global chronostratigraphy. GeoArabia 2007, 12, 101–130. [Google Scholar]
  86. Hannigan, R.E.; Sholkovitz, E.R. The development of middle rare earth element enrichments in freshwaters: Weathering of phosphatic minerals. Chem. Geol. 2001, 175, 495–508. [Google Scholar] [CrossRef]
  87. Reynard, B.; Lécuyer, C.; Grandjean, P. Crystal-chemical controls on rare-earth element concentrations in fossil biogenic apatites and implications for paleoenvironmental reconstructions. Chem. Geol. 1999, 155, 233–241. [Google Scholar] [CrossRef]
  88. Lumiste, K.; Mänd, K.; Bailey, J.; Paiste, P.; Lang, L.; Lepland, A.; Kirsimäe, K. REE+Y uptake and diagenesis in Recent sedimentary apatites. Chem. Geol. 2019, 525, 268–281. [Google Scholar] [CrossRef]
  89. Sholkovitz, E.R.; Landing, W.M.; Lewis, B.L. Ocean particle chemistry: The fractionation of rare earth elements between suspended particles and seawater. Geochim. Cosmochim. Acta 1994, 58, 1567–1579. [Google Scholar] [CrossRef]
  90. Edelman-Furstenberg, Y. Cyclic upwelling facies along the Late Cretaceous southern Tethys (Israel): Taphonomic and ichnofacies evidence of a high-productivity mosaic. Cretac. Res. 2009, 30, 847–863. [Google Scholar] [CrossRef]
  91. Soudry, D.; Nathan, Y.; Ehrlich, S. Geochemical diagenetic trends during phosphorite formation—Economic implications: The case of the Negev Campanian phosphorites, Southern Israel. Sedimentology 2013, 60, 800–819. [Google Scholar] [CrossRef]
  92. Bar, O.; Zilberman, E.; Feinstein, S.; Calvo, R.; Gvirtzman, Z. The uplift history of the Arabian Plateau as inferred from geomorphologic analysis of its northwestern edge. Tectonophysics 2016, 671, 9–23. [Google Scholar] [CrossRef]
Figure 2. Assembled backscattered scanning electronic microscopy (BSEM) photographs of the sandy phosphorite from the Sirhan-Turayf basin in the northwestern part of Saudi Arabia: (a) phosphatic pellet (PhP), quartz grains (Qtz), clay matrix, and calcite cement (Cal) are the main components; (b) phosphatic pellet (PhP) and phosphatic ooid (PhO), cemented by calcite (Cal); (c) phosphatic grains with different grain sizes and morphology; the boundary-clear grain and the amorphous grain (Ph, dotted line) aggregated together with phosphatic matrix, filling in the pores; and (d) phosphatized bio-fragment (bone) and quartz grains cemented by calcite.
Minerals 11 00350 g002
Figure 3. Assembled BSEM and polarized microscope photographs of calcareous phosphorite from the Sirhan-Turayf basin in the northwest of Saudi Arabia show significant carbonate growth, extensively filling the pores and fractures in the phosphatic grains: (a) BSEM image shows a phosphatic ooid (PhO) compacted with calcite cement. Its cortex has been crushed and peeled off; (b) polarized microscope image shows a multiple core ooid grain. The cores are also phosphatic ooids; (c) BSEM image shows that the shape of an amorphous phosphatic grain (Ph) is determined by the ambient grains; and (d) polarized microscope image shows that the phosphatic grains and the phosphatized bio-fragments are cemented by pore-filled calcite.
Minerals 11 00350 g003
Figure 4. BSEM photographs of phosphatic grains from the Sirhan-Turayf basin: (a) a phosphatic ooid (PhO) has several unconformable cortices (dotted white line); (b) a multi-stage integrated phosphatic grain includes phosphatic ooids with concentric zone texture; (c) different grain-sized phosphatic pellets have structureless interior; (d) a phosphatic ooid has a bio-fragment core, rounded and pitted on the surface; and (e) a phosphatic ooid has a core of fissured detrital quartz grain. Fractures occur in the apatite cortex (AP).
Minerals 11 00350 g004
Figure 5. Assembled BSEM photographs show the various phosphate components in the phosphorite from the Sirhan-Turayf basin: (a) a multi-stage integrated complex phosphatic grain, including various sizes of phosphatic pellets and structureless larger phosphatic grains (possibly collophane). This integrated grain is significantly larger than the other grains that surround it; (b) a relatively large phosphatic grain, including the phosphatic pellets on its rim, ambiguous in the grain boundary; (c) a phosphogenized bio-fragment. The grain has crushed, and the chamber was filled with apatite; (d) a phosphatic grain contains the small-scale bio-detritus; and (e) bio-debris in different sizes and shapes.
Minerals 11 00350 g005
Figure 6. PAAS-normalized REE pattern of the phosphorite and ambient rocks of the Sirhan-Turayf basin, see [42]: (a) sandy phosphorite; (b) calcareous phosphorite; (c) chert interbedded with the phosphorite; and (d) mudstones interbedded within the phosphorite.
Minerals 11 00350 g006
Figure 7. The geochemical variations in the phosphatic ooid and the pellet as detected by electron probe microanalysis (EPMA). The analysis was conducted from the rim inwards and the curves show nearly consistent contents of Ca, P, and F in both the ooid (a) and the pellet (b), which only drop down in the center of the pellet (c,d,e); the minor elements, Fe, Mg, and Na vary extensively in the different cortices or according to position (f,g,h).
Minerals 11 00350 g007
Figure 8. The correlations between the major elements and the element groups of the phosphorite from the Sirhan-Turayf basin: (a) the positive correlation between TiO2 and Al2O3 contents suggests their close deriving relationship; (b) the provenance of the phosphorite falls into a wide range from pelagic to coastal facies, based on the classification established by Murray [49]; (c) the authigenic group and the terrestrial group elements show negative correlation; and (d) CaO has a positive correlation and SiO2 has a negative correlation with P2O5.
Minerals 11 00350 g008
Figure 9. Statistical results of the trace element proxies indicate oxic- and suboxic-dominated environments during the deposition of the phosphorite. The brown trend signifies oxic conditions, and the grey trend presents anoxic conditions: (a) plot of V/Cr and V/Ni ratios and (b) plot of Ni/Co and V/Mo. Less than 2 V/Cr values represent oxic conditions, between 2–4.25 values indicate suboxic conditions, and greater than 4.25 values indicate anoxic conditions [55]. V/Ni values higher than 3 indicate anoxic conditions, between 1.9 and 3 values indicate suboxic conditions, and less than 1.9 values indicate oxic condition [60]. Jones and Manning [59] assigned Ni/Co values of <5 for oxic conditions, 5–7 for suboxic conditions, and >7 for anoxic conditions. V/Mo values of less than 2 indicate anoxic conditions, between 2 and 10 values indicate suboxic conditions, and greater than 10 values indicate oxic conditions [56].
Minerals 11 00350 g009
Figure 10. Cross plot between PAAS-normalized MREEs/HREEs and MREEs/LREEs illustrate the enrichment of MREEs both in the sandy and calcareous phosphorites from the Thaniyat Phosphorite Member.
Minerals 11 00350 g010
Figure 11. REE ratios and trace elements reveal that the provenance of the REEs is seawater rather than the terrestrial sediment supply: (a) the Y/Ho ratios have a wide range but are scattered around the seawater field and (b) The ∑REEs has a weak correlation with Th, which is dominated by terrestrial sediment supply.
Minerals 11 00350 g011
Figure 12. Ce and Eu anomalies versus other REE ratios: (a) Ce/Ce* against Pr/Pr* indicates negative Ce anomaly; (b) cross plot of Ce/Ce* against PAAS-normalized La/Sm excludes the artificial calculation influences on the Ce anomaly; (c) correlation between Ce/Ce* and PAAS-normalized Dy/Sm indicates the effects of diagenesis on the REE distribution; (d) Ce/Ce* has a slightly positive correlation with ∑REEs, indicating a possible post-depositional redistribution of the REEs in the phosphorite; and (e) the Eu/Eu* values are plotted around 1, indicating negligible Eu anomaly.
Minerals 11 00350 g012
Figure 13. The correlations between REE ratios indicate that diagenesis may have occurred; however, the effects of apatite precipitation and the effects of the events after deposition have overprinted the effects of diagenesis: (a) positive correlation between Y/Y* and (La/Nd)N suggests that diagenesis or weathering had occurred; (b) Y/Y* plotted against (La/Sm)N may relate to the reworking process; and (c) the plot of (La/Yb)N against (La/Sm)N fits the modern coastal and estuarine water signature, indicating the possible environment of deposition when the alterations are not taken into account.
Minerals 11 00350 g013
Figure 14. BSEM images show the effects of diagenesis, particularly the cement that formed after the redeposition of the phosphorite: (a) authigenic apatite on the rim of a phosphatic grain; (b) an eroded phosphatic grain compensated by calcite cement; (c) authigenic calcite filled a fissure in a quartz grain and crossed the authigenic apatite rim; (d) replacement of authigenic pyrolusite in a phosphatic grain; (e) pore-filling cementation of pyrolusite; and (f) pore-filling cementation and replacement of hematite. PhO, phosphatic ooid; PhP, phosphatic pellet; Ph, amorphous phosphatic grain; Qtz, quartz.
Minerals 11 00350 g014
Figure 15. The plot of the carbonate C and O isotopes of the phosphorite, compared to those of other data from phosphorites worldwide.
Minerals 11 00350 g015
Figure 16. A sketch of phosphorite depositional scenario in the Sirhan-Turayf basin: (A) pristine phosphorite deposited by the ocean productivity-driven phosphogenetic mechanism and hydrodynamic oscillation. Phosphate precipitates at depths near the surface of the sediments, named zone of phosphogenesis (ZOP); (B) landward transport of various phosphatic grains deposited near the shore, mixed with the terrestrial sediment influx, forming the sandy phosphorite; and (C) Transgression driving the sea-level rise had stranded the phosphatic grains on the carbonate platform, producing the calcareous phosphorite. Both types of phosphorites experienced similar diagenetic events after their deposition.
Minerals 11 00350 g016
Table 1. Sedimentary characteristics of the sandy and calcareous phosphorites from the Thaniyat Phosphorite Member in northern Saudi Arabia.
Sediment FeaturesCalcareous PhosphoriteSandy Phosphorite
BeddingRelative thin, interbedded with thin chert, carbonate, and mudstone layersThick, varies in the top part of the Devonian sandstones (unconsolidated).
Phosphate fractionPellet grains, ooids, amalgamated greater grains and boundary-unclear concretions, and bio-derived particlesSame with calcareous phosphorite, fewer ooids but more pellets.
Vertebrate fragmentsSporadicSporadic
Allochthonous non-phosphate clastsRare or absentOften present, quartz grains and terrestrial matrix (clay minerals etc.)
Carbonate fractionHigh (calcareous matrix)Low (carbonate cement)
Diagenesis affectionApatite and calcite cemented densely, distinguished compaction, hematite, and pyrolusite cement.Calcite and clay minerals cemented partially, apatite re-crystallization, hematite, and pyrolusite cement
Spatial distributionSpreading under the carbonate and over the sandy phosphorite In the uppermost part of the sandstone layer, beneath the calcareous phosphorite
Table 2. The concentration of major and minor elements (wt.%) in sandy and calcareous phosphorite from the Sirhan-Turayf basin, in northern Saudi Arabia.
Sample IDLithologySiO₂Al2O3Fe2O3MgOCaONa2OK2OMnOTiO2P2O5LOI a
C–Ph–16Calcareous phosphorite12.831.192.921.3542.40.820.1040.0290.07428.575.64
C–Ph–173.380.8930.2040.65742.067.030.1240.0220.0529.3513.70
C–Ph–2121.320.9580.8910.27840.60.4970.0670.0170.06228.313.00
C–Ph–223.210.7970.4370.32350.670.7910.0520.0150.04435.913.22
C–Ph–2410.222.060.3990.64446.040.5110.1190.0390.11632.53.31
C–Ph–268.31.110.4040.6346.711.190.0670.0090.0633.084.41
C–Ph–534.290.9271.710.29650.150.370.0580.0210.06235.422.66
C–Ph–25Sandy phosphorite33.330.5020.340.2830.683.530.0590.0070.0520.937.28
C–Ph–4533.241.260.5730.49333.620.4730.2630.0230.08123.133.13
C–Ph–4642.370.3930.2850.35329.480.3610.080.010.0319.83.11
C–Ph–4946.620.1340.6480.1927.20.7060.0280.020.03718.812.60
C–Ph–5055.740.1870.4330.2621.910.7510.0360.0470.0214.922.67
Table 3. Trace element concentration (×106) of sandy and calcareous phosphorite from the Sirhan-Turayf basin, in northern Saudi Arabia.
Sample IDLithologyVCrCoNiCuZnSrMoV/NiV/CrNi/CoV/Mo
C-Ph-16Calcareous phosphorite4281067.9743.876.62919141.289.774.045.50334.38
C-Ph-1724078.98.745087.32415522.064.803.045.72116.50
C-Ph-2188.3588.983562.42062155.82.521.523.9015.22
C-Ph-221781238.5331.856.71472146.525.601.453.7327.30
C-Ph-2481.11348.0728.251.51711691.962.880.613.4941.38
C-Ph-2682.71568.354046.81271550.672.070.534.79123.43
C-Ph-531861308.5654.140.72531556.563.441.436.3228.35
C-Ph-25Sandy phosphorite58.745.36.9624.873.11481983.522.371.303.5616.68
C-Ph-455671.24.8222.460.31952964.962.500.794.6511.29
C-Ph-4660.153.24.5377.648.98292111.760.771.1317.1334.15
C-Ph-49127724.538.550.62051552.883.301.768.5644.10
C-Ph-5074.737.32.5811.627.587.8122<0.0026.442.004.5037350.00
Table 4. The concentration of rare earth elements (ppm) of sandy and calcareous phosphorite from the Sirhan-Turayf basin, in northern Saudi Arabia. The average Post-Archean Australian Shale (PAAS) values used for rare earth element (REE) normalization are after McLennan (1989) and marked by N.
LithologyCalcareous PhosphoriteSandy PhosphoriteChertMudstone
Sample IDC–Ph–16C–Ph–17C–Ph–21C–Ph–22C–Ph–24C–Ph–26C–Ph–53C–Ph–25C–Ph–45C–Ph–46C–Ph–49C–Ph–50C–Ch–01C–Ch–02C–Ch–03C–Ch–52C–Ch–55C–Ch–56C–M–18C–M–23
LaN0.5210.6310.6880.6540.7880.510.7280.5160.6650.2830.3560.2440.0550.1370.0270.0580.1180.2590.7980.751
CeN0.180.2650.3690.2450.3570.2750.3020.3040.4120.1190.1580.0880.0220.0550.0220.030.050.1070.6490.648
PrN0.2920.4130.490.3690.5540.3910.5330.3810.530.1680.2270.1490.0340.0940.0220.0360.0690.1530.6740.681
NdN0.3130.4370.5220.3830.5840.4130.5870.4040.5430.1810.2330.1660.0370.0940.0230.0350.0710.1630.6460.655
SmN0.3230.5030.6180.4410.6760.4470.7010.4610.6720.1950.2880.20.0540.1090.0360.0360.0780.1820.7510.751
EuN0.4130.6630.7270.5820.8910.5640.880.530.80.2480.3330.2280.0720.1350.0340.0910.0750.2260.7970.78
GdN0.4720.7080.7770.620.8910.6330.9210.5620.8030.2730.3730.2640.0370.1560.0240.0260.0760.2470.8350.794
TbN0.4770.7180.7760.620.8970.5970.9250.5370.760.2780.370.2710.0430.1510.0450.0170.0850.2520.7920.736
DyN0.4890.7310.7970.6650.8890.5790.9680.5530.7560.3140.3740.280.0530.1610.0470.0320.0930.2760.690.637
HoN0.5550.7920.8290.7450.9560.6311.0290.5650.7720.3630.430.2950.0640.1820.0720.0390.1050.3110.6120.595
ErN0.5860.8490.860.8141.0390.6881.070.6040.8070.4210.4490.2970.0590.2050.0840.0550.0990.3040.6530.6
TmN0.3850.6960.630.640.8470.5280.9530.4790.7140.3260.3190.2020.040.1580.0590.0050.0670.2490.4840.375
YbN0.4220.730.6950.6770.8790.5850.8690.4890.6950.3870.3720.2080.0350.1590.0780.0170.0840.2140.5390.447
LuN0.3530.6540.6910.6930.910.5450.9490.4850.6970.3460.3810.1620.0420.1780.0790.0050.0530.240.4530.381
YN1.471.731.7071.9151.8851.3332.171.2261.3810.8261.0260.7670.1270.3780.1590.1290.2710.731.0410.881
∑REEs58.19480.26295.68275.846104.0372.74698.10373.78299.35835.12544.89629.2526.6217.3284.9676.90913.49531.162127.192124.649
(MREEs/LREEs)N2.092.362.192.222.282.172.522.002.122.232.232.372.172.352.721.521.672.191.62 1.57
(MREEs/HREEs)N1.561.401.571.301.411.471.411.561.571.131.431.771.841.280.862.951.691.482.10 2.38
Eu/Eu*1.041.101.041.101.141.041.081.031.091.061.010.981.581.021.152.950.981.051.01 1.01
Ce/Ce*0.400.470.580.430.500.580.440.640.660.480.500.400.450.450.860.590.490.470.87 0.90
Y/Y*2.822.272.102.722.042.202.172.191.812.442.552.672.182.202.693.592.732.491.60 1.43
Pr/Pr*1.191.181.101.171.181.141.201.071.111.121.161.181.161.260.981.121.141.131.04 1.04
(La/Sm)N1.621.251.111.481.171.141.041.120.991.451.231.221.02 0.761.611.511.421.06 1.00
(La/Yb)N1.230.860.990.970.900.870.841.050.960.730.961.171.571.260.353.331.411.211.48 1.68
(Dy/Sm)N1.521.451.291.511.321.301.381.201.131.611.301.400.981.481.300.901.191.510.92 0.85
(La/Nd)N1.661.441.321.711.351.231.241.281.221.561.531.471.491.461.171.661.661.591.24 1.15
Y/Ho72.1859.4956.0870.0553.7557.6057.4559.1148.7661.9465.0270.8954.4456.6760.5688.9770.2963.9646.37 40.34
Table 5. δ13C (‰, Vienna Peedee Belemnite (VPDB)), δ18O (‰, VPDB) of the Thaniyat phosphorite from the Sirhan-Turayf basin, in northern Saudi Arabia.
Sample IDLithologyδ13Cδ18O
C–Ph–24–04Phosphatic chert−9.6−7.5
C–Ph–24–05Phosphorite−9.2−8.2
C–Ph–24–06Phosphorite−9.8−7.8
C–Ph–24–07Phosphatic sandstone−6.5−5
C-Ph–24–50Phosphorite−5.7−8.1
C–Ph–24–52Phosphorite−6−4.1
C–Ph–24–54Phosphorite−2.8−2.4
C–Ph–24–76Phosphorite−7.7−8.5
C–Ph–24–77Phosphatic mudstone−8.4−7.8
C–Ph–24–80Phosphorite−9.8−7.5
C–Ph–24–81Phosphorite−8.7−6.9
C–Ph–18Sandy Phosphorite−10.1−7.8
C–Ph–20Sandy Phosphorite−11.1−6.8
C–Ph–22Sandy Phosphorite−10.8−8.2
Publisher’s Note: MDPI stays neutral with regard to jurisdictional claims in published maps and institutional affiliations.

