Article

The Effect of Hydrodynamic Conditions on the Selective Flotation of Fully Liberated Low Grade Copper-Nickel Ore

1
Oulu Mining School, University of Oulu, Erkki Koiso-Kanttilankatu V2, 90014 Oulu, Finland
2
Department of Computer Science, Aalto University, 02150 Espoo, Finland
3
Centre for Ubiquituous Computing, University of Oulu, Erkki Koiso-Kanttilankatu 3, 90014 Oulu, Finland
*
Author to whom correspondence should be addressed.
Minerals 2021, 11(3), 328; https://doi.org/10.3390/min11030328
Submission received: 6 February 2021 / Revised: 6 March 2021 / Accepted: 17 March 2021 / Published: 21 March 2021
(This article belongs to the Special Issue Process Optimization in Mineral Processing)

Abstract

:
Low grade sulfide ores are difficult to process due to their composite mineralogy and their fine grained dissemination with gangue minerals. Therefore, fine grinding of such ores becomes essential to liberate valuable minerals. In this research, selective flotation was carried out using two pitched blade turbine impellers with diameters of 6 cm and 7 cm to float copper and nickel. The main focus of this research was to generate optimum hydrodynamic conditions that can effectively separate nickel and copper from gangue minerals. In addition, we investigated the effects of superficial gas velocity, impeller speed, bubble size distribution, and bubble surface area flux on the flotation recovery and rate constant. The results demonstrated that a 7 cm impeller comparatively produced optimum hydrodynamic conditions that improved Cu-Ni recovery and the rate constant. The maximum copper and nickel recoveries in the 7 cm impeller tests were observed at 93.1% and 72.5%, respectively. However, a significant decrease in the flotation rate of nickel was observed, due to entrainment of nickel in copper concentrate and the slime coating of gangue minerals on the nickel particle surfaces.

1. Introduction

Complex and low grade sulfide ores are difficult to process due to their fine-grained and disseminated nature. In order to process such ores, a high degree of liberation is required prior to the flotation process. Furthermore, processing low grade sulfide ores is seldom/rarely done using selective separation due to its processing difficulty and higher cost [1]. The flotation behavior of complex sulfide ore tends to vary due to differences in mineralogy [2]. The presence of varying amounts of gangue minerals such as talc, serpentine, and amphibole poses a challenge to maintain the targeted concentrate grade [3]. Typically, serpentine tends to increase viscosity in the pulp, particularly in low grade ore with finely disseminated sulfide. The high slurry viscosity increases when air bubbles coalesce, which reduces the flotation rate and increases the mechanical recovery of the gangue minerals [1]. Furthermore, serpentine milling results in a high amount of slime, due to its low hardness in nature and increased opposite electrostatic attraction between sulfide and slimes. The coating of serpentine slime on pentlandite and chalcopyrite significantly reduces the copper-nickel/magnesium oxide (Cu-Ni/MgO) separation efficiency, resulting in high magnesium oxide (MgO) content in the concentrate.
A study by [4] demonstrated that the presence of serpentine in a small amount can be enough to cause almost complete depression of pentlandite. According to [5], the composite of valuable and gangue minerals causes problem in flotation since the surface of the hydrophobic particle is partially made up by gangue minerals, which decreases the floatability of the valuable minerals. However, pentlandite flotation can be improved by removing hydrophilic species by surface cleaning [6]. The separation selectivity and efficiency of the flotation depends not only on differences in the physico-chemical surface properties of different minerals within an ore, but also on the hydrodynamics of flotation. The hydrodynamics influences many sub-processes of the flotation, such as the suspension of particles in the pulp, the dispersion of the air into bubbles, and the probability of particle–bubble collision. Mechanical entrainment plays a major role in the quality of the flotation concentrate and the separation selectivity [7]. In addition, turbulence tends to increase the particle detachment in flotation cells.
Previous studies by [8,9] suggested that bubble size strongly affects the flotation rate constant, whereas the bubble surface area flux ( S b ) is considered as the key variable to characterize gas dispersion properties in the flotation cell by integrating the effect of the bubble size and superficial gas velocity [10,11]. Extensive research carried out by [12,13,14] demonstrated the effect of different gas dispersion conditions on the bubble size, the superficial gas velocity, the bubble surface area flux, the and rate constant. It was concluded that the flotation performance is not only dependent on the bubble size and the superficial gas velocity, but it is linearly related to the bubble surface area flux. However, the bubble surface area flux better correlates with the rate constant of fine particles. In order to understand the relationship between the rate constant and the bubble surface area flux, more research is needed with different types of ores [15].
Flotation kinetics usually depends on the gas dispersion characteristics and the turbulence created by the impeller-stator assembly. The turbulence in the flotation cell can be changed by the impeller speed, impeller size, and airflow rate. Therefore, it is necessary to investigate the gas dispersion parameters along with the effect of impeller size on the flotation performance of low grade sulfide ore. The superficial gas velocity is the volumetric gas flow rate (cm 3 /s) divided by the cross-sectional area of the cell.
J g = Q / A
where Q is the gas volumetric flow rate and A is the cell cross-sectional area. Bubble surface area flux S b is defined by the following equation:
S b = ( 6 J g ) / d 32
where J g is the superficial gas velocity and d 32 is the Sauter mean diameter of the bubbles, and it is defined as:
d 32 = i n n i d i 3 / i n n i d i 2
where n i and d i are the number and diameter of the bubbles, respectively [16].
The flotation rate constant is calculated using the first order rate equation.
R = R ( 1 e k t )
where R is the recovery at the maximum time of flotation.
In the previous studies, a single mineral is used to correlate hydrodynamic parameters. However, in this research, we carried out selective flotation tests with a complex sulfide ore, which might contradict the relationship between hydrodynamic and flotation performance.

2. Materials and Methods
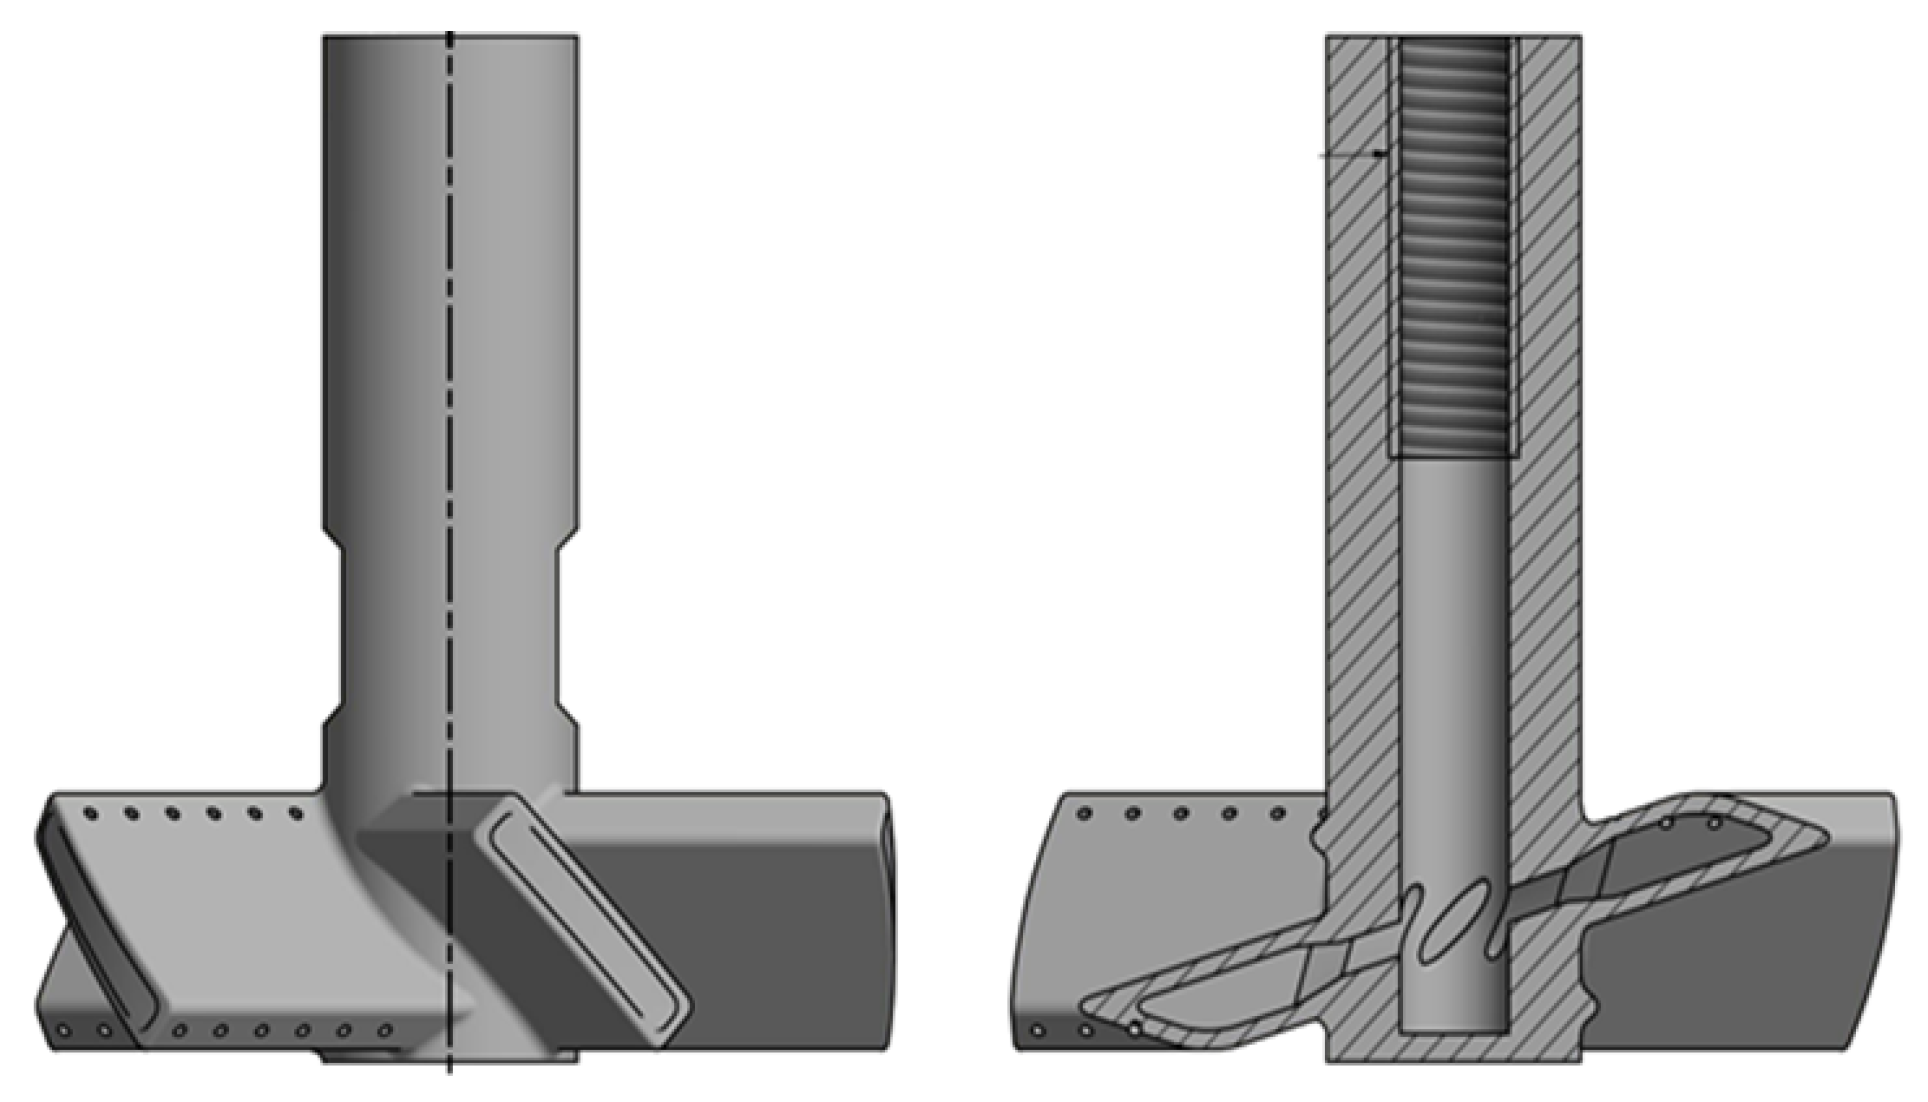
The experiments in this research were conducted using low grade Cu-Ni ore samples from the Kevitsa mine provided by Boliden AB. Samples were subject to initial crushing by a Metso Minerals Marcy jaw crusher, and a further size reduction to 2 mm was conducted by a Metso Minerals Marcy cone crusher at the Oulu Mining School. Ore samples were representatively prepared using a riffle divider followed by a rotary sample splitter, which were further sealed separately into one kg samples each to avoid oxidation. The mineralogical and chemical characterization of the ore was conducted by FE-SEM and XRF, respectively. The average copper and nickel grades in the Kevitsa ore were 0.40% Cu and 0.32% Ni, respectively. A one kilogram ore sample was ground to P80 of −32 μ m for each test in a stainless steel rod mill. The collector used in the flotation tests was sodium isobutyl xanthate with a dose of 70 g/t, carboxymethyl cellulose (CMC) with a dose of 200 g/t, and Dow froth 250 with a dose of 50 g/t. These reagents were prepared daily prior to the flotation tests using tap water. The slurry pH was regulated with lime and sulfuric acid in copper and nickel flotation, respectively.
In order to examine the liberation of chalcopyrite and pentlandite, a reference test was carried out using a 60 mm impeller size. Flotation was initiated by adding the chemical reagent and conditioned for 5 min, and pulp level was adjusted by adding make up water. Flotation was started by opening the air valve, and the air flow was adjusted to 4 L/min, while the copper concentrate was collected for five minutes followed by the nickel concentrate. The concentrates were weighed and dried in an oven overnight. Small samples of copper and nickel concentrates along with feed sample were cast into epoxy in a thin section mold.
The analysis of the samples was conducted using a mineral liberation analyzer FEI quanta 650F, an FE-SEM scanning electron microscope with an acceleration voltage of 25 kV and an emission current of 207 µA at Gtk Mintec (Outokumpu, Finland). The bubble size distribution was measured by a prototype camera (Gige camera; Model# Mars 5000 S-20 gc) developed by the Technical Research Center of Finland (VTT, Espoo, Finland). The camera was fixed inside a 15 cm wide waterproof cylinder Figure 1a. The lens was protected by a sapphire in order to avoid an abrasion effect of ore particles. LED lights were installed in the camera to capture bright images of the bubbles (Figure 1b). Flotation experiments were conducted in an Outotec flotation machine equipped with a time controlled automatic scraper. Two pitched blade turbine impellers Figure 2, with a diameter of 6 cm and 7 cm, were used for pulp agitation and a 4 L cell with square section in which the length and height were 25 cm and 20 cm, respectively.

Image Processing

The images of bubbles were captured for each test using different impeller speeds and aeration rates (Table 1), and the average count of image for each test was 100. Later, the images were further preprocessed using a custom script developed using standard Python libraries [17]. First, the color (RGB) images were converted to grayscale and Gaussian smoothed to reduce noise [18]. Then, a Canny edge detector found the bubble outlines/edges, which were processed by a circular Hough transform to find the circle candidates. Finally, non-maxima-suppression (NMS) was used to remove low confidence duplicate detections [19].

3. Results and Discussion

In this section, we analyze and discuss the results retrieved from the experimentation in this study. The information on the methods and materials used is detailed in Section 2.

3.1. Mineralogical Analysis of the Kevitsa Cu-Ni Sulfide Ore

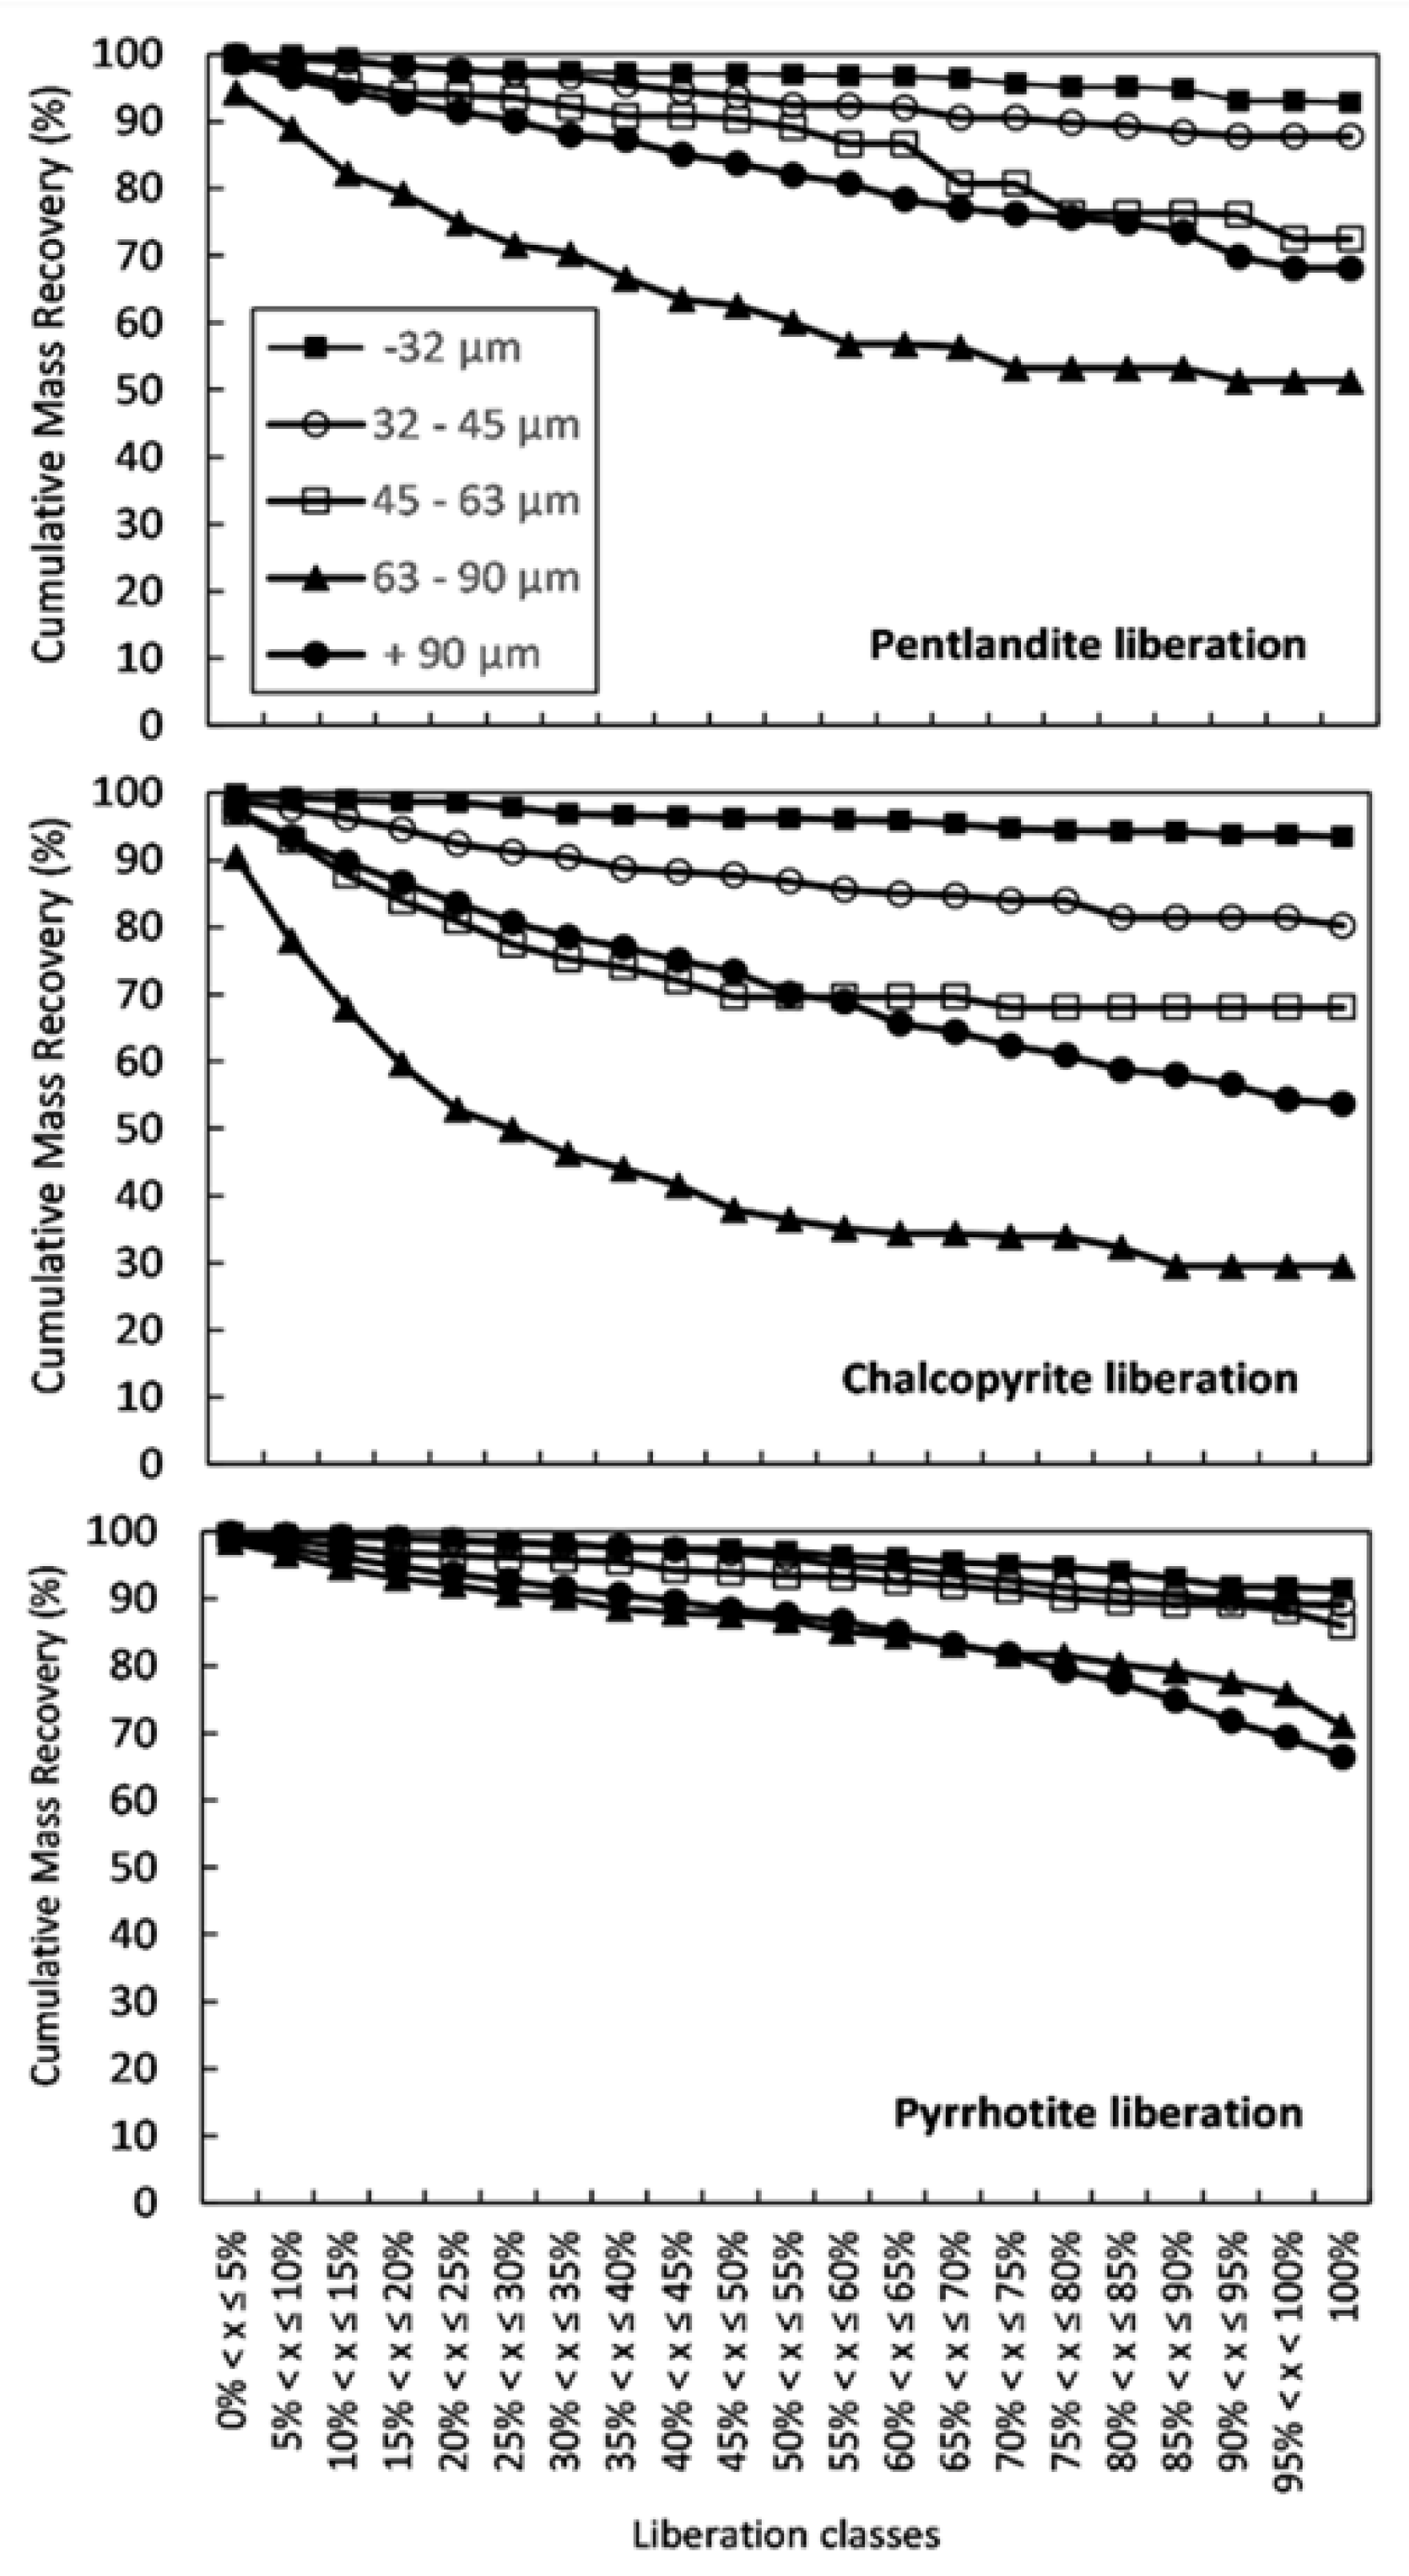
3.1.1. Feed Analysis

The quantitative modal mineralogy was determined for all five sieve fractions (+90 μ m, 63–90 μ m, 45–63 μ m, 32–45 μ m, and −32 μ m). A combination of the results was used as an approximation of the bulk mineralogical composition for the Kevitsa feed, which can be seen in Figure 3. To determine the bulk modal mineralogy, the mass fraction of each sieve size was used as a weighing coefficient in the calculation. Given that the mass fraction of the finest particle size −32 μ m represented 80% of the total sample mass, the calculated bulk mineralogy largely mimicked that of the feed of −32 μ m.
Figure 4 illustrates the mineral liberation curves for pentlandite and chalcopyrite in the studied particle size fractions, expressed as mineral liberation by the free surface. Mineral liberation classes range from 0–100%, and cumulative proportions of each class are plotted against mass recovery percentage. Class 95–100% represents fully liberated mineral grains.
The mineral liberation curves for pentlandite and chalcopyrite in the studied particle size fractions are expressed as mineral liberation by the free surface. Mineral liberation classes range from 0–100%, and cumulative proportions of each class are plotted against the mass recovery percentage. Class 95–100% represents fully liberated mineral grains. The results of the liberation analysis show that in the grain size fraction −32 μ m, both chalcopyrite and pentlandite were liberated. Ninety-three-point-nine percent of chalcopyrite grains was comprised of 95–100 wt.% and ninety-four-point-three percent of pentlandite grains of 95–100 wt.% of pentlandite. In size fractions 32–45 μ m and 45–63 μ m, chalcopyrite and pentlandite were 87.2% and 76.3% and 81.5% and 68.1% liberated, respectively. For a comparison, the liberation of pyrrhotite is also shown. Pyrrhotite was 92.4% liberated in size fraction <32 μ m and was almost 90% liberated in particle sizes of 32–45 μ m and 45–63 μ m.
Mineral association data for chalcopyrite, pentlandite, and pyrrhotite are broadly in line with the results of modal mineralogy. The sulfide phases are commonly associated with amphibole and clinopyroxene, which are the dominant mineral phases in the Kevitsa ore samples. Furthermore, it is evident that pentlandite and pyrrhotite tend to occur together, as shown in Figure 5.

3.1.2. Concentrate Analysis

The mineralogical compositions of Cu and Ni concentrates are shown in Figure 6. The Cu concentrate was comprised of 45% of chalcopyrite, with a minor amount of the other sulfide phases (9% pentlandite and 4% pyrrhotite). The pentlandite content in the Ni concentrate was only 20%, and pyrrhotite was substantially enriched in the Ni concentrate (23%). On average, zero-point-five percent Ni content was reported in the pyrrhotite. Only 2% of chalcopyrite was found from the Ni concentrate, notably being much finer grained than pentlandite and pyrrhotite.
Although the analysis of mineral associations in the feed of −32 μ m suggests that pentlandite and pyrrhotite tend to form composite grains, pyrrhotite in the Ni concentrate was largely found as liberated grains with 97%, and only a small amount of pentlandite occurred in association with pyrrhotite, as shown in Figure 7. When comparing the relative abundance of gangue minerals in the feed of −32 μ m and in the concentrates, it can be stated that orthopyroxene was substantially enriched in both the Ni and Cu concentrate. In addition, amphibole and carbonates were mildly enriched in the Ni concentrate. Otherwise, the proportions of gangue minerals were broadly on the same level or lower in the feed of −32 μ m and in the concentrates.

3.1.3. Tailings Analysis

The modal mineralogy of the tailings and the mineral association of tailings are shown in Figure 8 and Figure 9. Notably, the tailings contained 0.75% pentlandite, which was only slightly lower than that in the feed of −32 μ m (1.1%). On the contrary, only a small amount of chalcopyrite was reported in the tailings (0.17%), of which 80% was liberated and very fine grained (<16 μ m), with pentlandite in the tailings being fully liberated of 92%.

3.2. Effect of the Bubble Surface Area Flux on the Bubble Size Distribution

The measurement of the bubble size against the bubble surface area flux at different J g values using 6 and 7 cm diameter impellers is shown in Figure 10a,b. The curves clearly depict that the bubble size continuously decreases as the bubble surface area flux value increases, as demonstrated by [20,21]. At lower J g 0.08 cm/s with a rotation speed of 800 rpm, the bubble size increased to 341 μ m compared to the other conditions. However, the bubble size significantly decreased as the impeller speed increased, which was attributed to higher turbulence exerted by the impeller. Contrary to the 6 cm impeller measurements, the highest bubble diameter in 7 cm impeller was observed of 371 μ m at higher J g , 0.32 cm/s, and S b , 50.88 s 1 1 .

3.3. Effect of Superficial Gas Velocity and Impeller Speed on Copper Recovery with 6 and 7 cm Impellers

Since we carried out selective flotation tests, the copper results are first presented for both impellers. The effect of hydrodynamics conditions (e.g., impeller speed and superficial gas velocity) on the copper recovery using both 6 cm and 7 cm impellers is shown in Figure 11 and Figure 12, respectively. The results in Figure 11 show that the copper recovery increased steeply, when J g was set to 0.08 cm/s (aeration rate of 2 L/min), and the maximum flotation recovery of copper of 91.2% was obtained at the lowest rotation speed of 800 rpm. Conversely, at higher J g , 0.26 cm/s, copper recovery increased to 93.11% at the rotation speed of 1200 rpm. However, at the same aeration rate and 800 rpm speed, copper recovery decreased to 50%.
The results suggest that a higher rotation speed reduces the bubble size, which enhances the bubble particle collisions, which result in the maximum recovery of copper. It was also observed that the maximum recovery of copper, 91.13%, was noticed at an impeller speed of 1000 rpm at J g of 0.17 cm/s (aeration rate of 4 L/min), whilst the lowest copper recovery, 48.7%, was also obtained at an impeller speed of 1200 rpm.
The copper recovery response to different J g values, 0.11, 0.21, 0.32 cm/s, at different rotation speeds of 685, 769, 870 944, and 1027 rpm using the 7 cm diameter impeller are illustrated in Figure 12. When J g changed from 0.11 to 0.17 cm/s and at a more turbulent rotation speed of 1025 rpm, copper recovery reached its highest level of 95.85% and 86.72%, respectively. However, under similar conditions, a poor recovery of copper was observed, 64.72% and 56.41% at 769 rpm and 685 rpm, respectively. The lower rotational speed decreased the bubble-particle collisions, resulting in particles settling at the bottom of the cell [22]. At the highest J g value of 0.32 cm/s, the recovery response was almost similar, but the maximum copper recovery of 94.7% was achieved at a rotation speed of 870 rpm. Correspondingly, at the lowest turbulence speed of 680 rpm, copper recovery decreased to 72.21%.

3.4. Effect of Superficial Gas Velocity and Impeller Speed on Nickel Recovery

In this section, the recovery of nickel vs. time with the superficial velocity rate ranging from 0.08, 0.17, to 0.26 cm/s at different impeller rotation speeds is discussed with a 6 cm impeller. The curves in Figure 13a indicate that the nickel recovery was significantly higher in the quiescent condition, i.e., 800 rpm and at low J g (0.08 cm/s) and high J g (0.26 cm/s), and it reached to maximum of 69.13% and 60.21%, respectively. It was observed that nickel recovery was not a function of the aeration rate; however, the maximum recovery rate was observed at a rotation speed of 800 rpm in the 6 cm impeller test.
A poor nickel recovery was observed at a superficial gas velocity of g 0.17 cm/s at all rotation speeds. It is clearly shown that at a cumulative flotation time of 1 min, the nickel response was significantly low, and nickel recovery increased after a cumulative time of 7 min. It was observed that pentlandite was a slow floating and sensitive mineral to turbulence, and it weakly reacted with the collector ions. Furthermore, the limited rejection of pyrrhotite in the Ni concentration was the main cause of concentrate dilution. Another factor for the poor flotation of nickel was the entrainment of nickel particles in copper flotation.
According to Figure 14, when a 7 cm diameter impeller was used, the highest nickel recovery of 72.57% was observed at higher J g of 0.32 cm/s and an impeller speed of 875 rpm. However, at a J g value of 0.11 cm/s and 0.21 cm/s, the maximum recovery was observed of 55.04% and 60.32% at a rotation speed of 685 rpm and 875 rpm, respectively. Comparatively, it is obvious that with both impellers, nickel floated slowly in the initial stage; however, the flotation increased over time at different rotation speeds and superficial gas velocity rates. In addition, the MLAresults showed that the gangue particles, i.e., Mg-silicate minerals and minor oxide and carbonates, were fully liberated. It is reasonable to assume that gangue recovery was concentrated by entrainment, resulting in lower recovery of nickel.
Kevitsa is a low-grade Cu-Ni ore, and the presence of a higher amount of hydrophilic serpentine gangue can easily coat the pentlandite surface and act as a hydrophilic barrier between air bubbles and pentlandite particles. Furthermore, it is also expected that, under ordinary conditions of complex ore processing, the sufficient presence of xanthate pentlandite can still be floated at a relatively higher pH [23]. Thus, it can be concluded that some of the pentlandite floated with chalcopyrite in the early stages, which can be also observed in the elemental analysis of the copper concentrate.

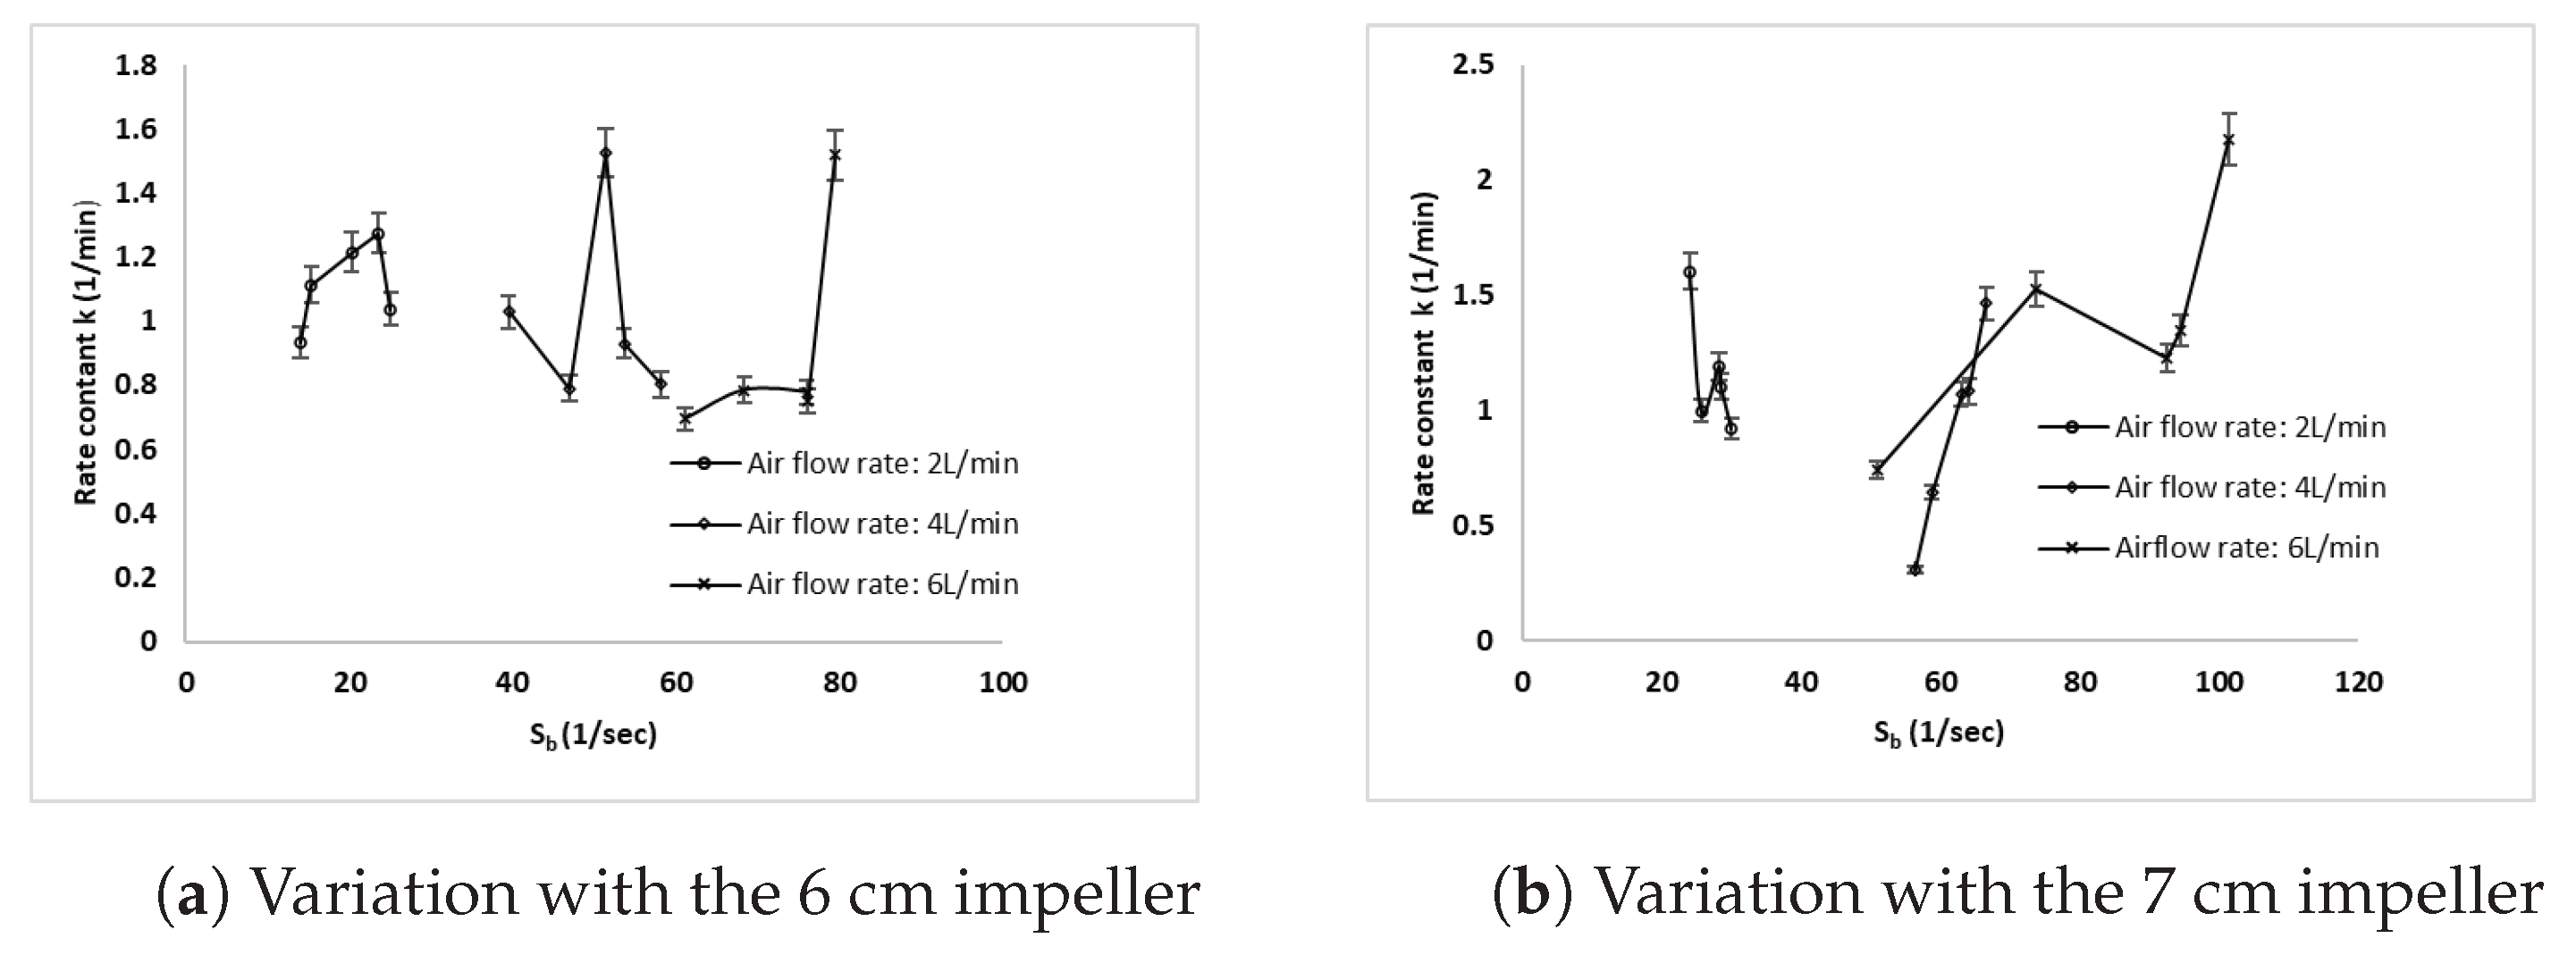
3.5. Effect of the Bubble Surface Area Flux on the Copper Rate Constant

The flotation rate constant (k) of copper using both impellers are depicted against the bubble surface area flux ( S b ) in Figure 15a. The maximum rate constant reached 1.5245 min 1 at a S b value of 51.48 s 1 and an airflow rate of 4 L/min, and the minimum k is obtained at 0.69 min 1 at an Sb value of 61.14 s 1 and an airflow rate of 6 L/min. The reason is that due to the lower impeller speed of 800 rpm, the bubble particle collisions decreased, and higher flow rate increased the entrainment, which resulted in a smaller flotation rate constant [24]. At 6 L/min aeration, the flotation rate constant increased slowly with the increasing S b value from 61.44–79.56 s 1 , but the rate constant increased twice the S b value to reach the of maximum 101.58 s 1 . However, there was a clear difference in the rate constant using the 7 cm impeller.
Figure 15b shows that at a low S b value of 24.08 s 1 , the flotation rate constant obtained was 1.6 min 1 , and it decreased significantly with the increase in the value of S b . Even though the lowest flotation rate constant was observed for a 4 L/min aeration rate, it steeply increased with the increase in the S b value, as suggested by [14,25,26]. In addition, it is clearly shown that the maximum rate constant of 2.17 min 1 was observed at a maximum S b value 101.58 s 1 for a higher aeration rate.

3.6. Effect of the Bubble the Surface Area Flux on the Nickel Rate Constant

Figure 16a,b shows the plots of the nickel flotation rate constant against the bubble surface area flux for both impellers at different airflow rates. The plots clearly show that the nickel rate constant was smaller at all S b values and aeration rates when compared to the copper flotation rate constant. As we discussed above, pentlandite floated slowly in comparison to chalcopyrite, and some amount of nickel was reported in the copper concentrate. Figure 16a shows that in the 6 cm impeller test, the maximum observed value was 0.88 min 1 at a S b value of 20.34 s 1 , but it decreased as the S b value increased. There was a linear relationship between S b and k at a 6 L aeration rate, but when the S b reached its maximum value, a small decrease in the rate constant was noticed.
A similar pattern is observed in Figure 16b for a 4 L/min aeration rate. However, a smaller rate constant of Ni was achieved at a smaller S b value of 25.68 s 1 . Therefore, it was assumed that at a lower aeration rate and impeller speed, particles were not fully suspended in the pulp, and it took time to reach the concentrate. Furthermore, due to the lower turbulence, particles settled faster at the bottom of the cell and resulted in a low rate constant.

4. Conclusions

Our aim was to evaluate the effect of the impeller size, impeller speed, and aeration rate on the hydrodynamic parameters and how these parameters can affect the flotation performance of copper and nickel. The overall results suggested that the bubble size decreased as the rotation speed of both impellers increased. The maximum copper recovery of 93.1% was achieved at a superficial gas velocity of 0.17 cm/s and a rotation speed of 1000 rpm for the 6 cm impeller. However, in the 7 cm diameter tests, copper recovery increased to 95.85% at a 0.11 cm/s superficial gas velocity and at an impeller speed of 1027 rpm. Therefore, it can be said that the large size impeller generated a better hydrodynamic condition in copper flotation. The maximum Ni recovery of 72.5% was also achieved using the 7 cm diameter impeller at a superficial gas velocity of 0.32 cm/s and an impeller speed of 870 rpm. In general, the poor response of Ni was observed in both impeller tests. There were several reasons that might have affected the nickel recovery, such as the entrainment of nickel particles in the copper flotation and the hydrophilic coating of gangue minerals on the surface of nickel particles. In the industrial processing units, copper tailings are re-grounded to produce fresh surfaces of the pentlandite, which was not carried out in this research.
The flotation rate constant of Cu and Ni was not linearly related to the bubble surface area flux in both impeller tests. In order to investigate the relationship between k and S b , cleaner flotation tests need to be carried out in the future.

Author Contributions

The contributions of the authors are declared as follows: Conceptualization, H.K.; methodology, H.K.; software, S.U.A. and H.M.; validation, H.K. and K.L.; formal analysis, H.K.; original draft preparation, H.K. and K.L.; review and editing, S.L. and H.K. All authors read and agreed to the published version of the manuscript.

Funding

This study was funded by K.H. Renlund’s Foundation https://khrenlund.fi/en/foundation/ (accessed on 19 March 2021).

Institutional Review Board Statement

Not applicable.

Informed Consent Statement

Not applicable.

Data Availability Statement

Not applicable.

Acknowledgments

We would like to thank Boliden AB for providing ore material, as well as the VTT Technical Research Centre of Finland for providing the bubble size analyzer. The authors express their deepest gratitude to Jukka Laukkanen for analyzing the samples for mineral characterization.

Conflicts of Interest

The authors declare no conflict of interest.

References

  1. Kirjavainen, V.; Heiskanen, K. Some factors that affect beneficiation of sulfide nickel-copper ores. Miner. Eng. 2007, 20, 629–633. [Google Scholar] [CrossRef]
  2. Sibanda, V.; Khan, R.; Danha, G. The effect of chemical reagents on flotation performance of a pentlandite ore: An attainable region approach. Powder Technol. 2019, 352, 462–469. [Google Scholar] [CrossRef]
  3. Musuku, B.; Muzinda, I.; Lumsden, B. Cu-Ni processing improvements at First Quantum’s Kevitsa mine. Miner. Eng. 2016, 88, 9–17. [Google Scholar] [CrossRef]
  4. Edwards, C.; Kipkie, W.; Agar, G. The effect of slime coatings of the serpentine minerals, chrysotile and lizardite, on pentlandite flotation. Int. J. Miner. Process. 1980, 7, 33–42. [Google Scholar] [CrossRef]
  5. Lynch, A.J.; Johnson, N.; Manlapig, E.; Thorne, C. Mineral and Coal Flotation Circuits: Their Simulation and Control; Elsevier: Amsterdam, The Netherlands, 1981. [Google Scholar]
  6. Chen, G.; Grano, S.; Sobieraj, S.; Ralston, J. The effect of high intensity conditioning on the flotation of a nickel ore. Part 1: Size-by-size analysis. Miner. Eng. 1999, 12, 1185–1200. [Google Scholar] [CrossRef]
  7. Cilek, E.C. The effect of hydrodynamic conditions on true flotation and entrainment in flotation of a complex sulfide ore. Int. J. Miner. Process. 2009, 90, 35–44. [Google Scholar] [CrossRef]
  8. Ahmed, N.; Jameson, G. The effect of bubble size on the rate of flotation of fine particles. Int. J. Miner. Process. 1985, 14, 195–215. [Google Scholar] [CrossRef]
  9. Yoon, R.H. Microbubble flotation. Miner. Eng. 1993, 6, 619–630. [Google Scholar] [CrossRef]
  10. Finch, J.; Xiao, J.; Hardie, C.; Gomez, C. Gas dispersion properties: Bubble surface area flux and gas holdup. Miner. Eng. 2000, 13, 365–372. [Google Scholar] [CrossRef]
  11. Gomez, C.; Mesías, J.; Alvarez, J. Bubble Surface Area Flux and Performance in Laboratory Flotation Testing. In Proceedings of the XXVIII International Mineral Processing Congress Proceedings, Quebec City, QC, Canada, 11–15 September 2016. [Google Scholar]
  12. Gorain, B.; Franzidis, J.P.; Manlapig, E. Studies on impeller type, impeller speed and air flow rate in an industrial scale flotation cell—Part 1: Effect on bubble size distribution. Miner. Eng. 1995, 8, 615–635. [Google Scholar] [CrossRef]
  13. Gorain, B.; Franzidis, J.P.; Manlapig, E. Studies on impeller type, impeller speed and air flow rate in an industrial scale flotation cell. Part 3: Effect on superficial gas velocity. Miner. Eng. 1996, 9, 639–654. [Google Scholar] [CrossRef]
  14. Gorain, B.; Franzidis, J.; Manlapig, E. Studies on impeller type, impeller speed and air flow rate in an industrial scale flotation cell. Part 4: Effect of bubble surface area flux on flotation performance. Miner. Eng. 1997, 10, 367–379. [Google Scholar] [CrossRef]
  15. Heiskanen, K. On the relationship between flotation rate and bubble surface area flux. Miner. Eng. 2000, 13, 141–149. [Google Scholar] [CrossRef]
  16. Kowalczuk, P.B.; Drzymala, J. Physical meaning of the Sauter mean diameter of spherical particulate matter. Part. Sci. Technol. 2016, 34, 645–647. [Google Scholar] [CrossRef]
  17. Welcome to Python.org. Available online: https://www.python.org/ (accessed on 19 March 2021).
  18. Virtanen, P.; Gommers, R.; Oliphant, T.E.; Haberland, M.; Reddy, T.; Cournapeau, D.; Burovski, E.; Peterson, P.; Weckesser, W.; Bright, J.; et al. SciPy 1.0: Fundamental algorithms for scientific computing in Python. Nat. Methods 2020, 17, 261–272. [Google Scholar] [CrossRef] [PubMed] [Green Version]
  19. Devernay, F. A non-maxima suppression method for edge detection with sub-pixel accuracy. Ph.D. Thesis, INRIA, Rocquencourt, France, 1995. [Google Scholar]
  20. Grau, R.A.; Laskowski, J.S.; Heiskanen, K. Effect of frothers on bubble size. Int. J. Miner. Process. 2005, 76, 225–233. [Google Scholar] [CrossRef]
  21. Leiva, J.; Vinnett, L.; Contreras, F.; Yianatos, J. Estimation of the actual bubble surface area flux in flotation. Miner. Eng. 2010, 23, 888–894. [Google Scholar] [CrossRef]
  22. Nazari, S.; Shafaei, S.Z.; Gharabaghi, M.; Ahmadi, R.; Shahbazi, B.; Maoming, F. Effects of nanobubble and hydrodynamic parameters on coarse quartz flotation. Int. J. Min. Sci. Technol. 2019, 29, 289–295. [Google Scholar] [CrossRef]
  23. Gibson, C.; Kelebek, S. Sensitivity of pentlandite flotation in complex sulfide ores towards pH control by lime versus soda ash: Effect on ore type. Int. J. Miner. Process. 2014, 127, 44–51. [Google Scholar] [CrossRef]
  24. Laplante, A.; Toguri, J.; Smith, H. The effect of air flow rate on the kinetics of flotation. Part 1: The transfer of material from the slurry to the froth. Int. J. Miner. Process. 1983, 11, 203–219. [Google Scholar] [CrossRef]
  25. Shahbazi, B.; Rezai, B.; Koleini, S.M.J.; Noparast, M. The effect of bubble surface area flux on flotation efficiency of pyrite particles. Iran. J. Chem. Chem. Eng. 2013, 32, 109–118. [Google Scholar]
  26. Hernandez-Aguilar, J.; Rao, S.; Finch, J. Testing the k-Sb relationship at the microscale. Miner. Eng. 2005, 18, 591–598. [Google Scholar] [CrossRef]
Figure 1. Setup of the bubble size measurements where, (a) shows the image of the bubble size camera and (b) shows the front view of the camera containing LEDs.
Minerals 11 00328 g001
Figure 2. 3D model of the impeller used in this research.
Minerals 11 00328 g002
Figure 3. Modal mineralogy of the feed.
Minerals 11 00328 g003
Figure 4. Liberation class of chalcopyrite (Cpy), pentlandite (Pn), and pyrrhotite (Po) in the feed.
Minerals 11 00328 g004
Figure 5. Mineral association in the feed.
Minerals 11 00328 g005
Figure 6. Modal mineralogy of concentrates.
Minerals 11 00328 g006
Figure 7. Mineral association in the concentrates.
Minerals 11 00328 g007
Figure 8. Modal mineralogy of the tailings.
Minerals 11 00328 g008
Figure 9. Mineral association in the tailings.
Minerals 11 00328 g009
Figure 10. Variation of the bubble size distribution against the bubble surface area flux where (a) shows the variation with 6 cm impeller and (b) shows variation with 7 cm impeller.
Minerals 11 00328 g010
Figure 11. Copper recovery vs. time at different Jg values (a) 0.08 cm/s, (b) 0.17 cm/s and (c) 0.26 cm/s) using an impeller of a diameter of 6 cm.
Minerals 11 00328 g011
Figure 12. Copper recovery vs. time at different J g values (a) 0.11 cm/s, (b) 0.21 cm/s and (c) 0.32 cm/s) using the 7 cm diameter impeller.
Minerals 11 00328 g012
Figure 13. Recovery of nickel vs. time with different J g values (a) 0.08 cm/s, (b) 0.17 cm/s and (c) 0.26 cm/s) using a 6 cm impeller diameter.
Minerals 11 00328 g013
Figure 14. Recovery of nickel vs. time using different J g values (a) 0.11 cm/s, (b) 0.21 cm/s and (c) 0.32 cm/s) with a 7 cm diameter impeller.
Minerals 11 00328 g014
Figure 15. Copper flotation rate constant vs. bubble surface area flux with different diameter impellers where (a) shows variation with 6 cm impeller and (b) shows variation with 7 cm impeller.
Minerals 11 00328 g015
Figure 16. Nickel flotation rate constant vs. the bubble surface area flux with different diameter impellers where (a) shows variation with 6 cm impeller and (b) shows variation with 7 cm impeller.
Minerals 11 00328 g016
Table 1. Test conditions and calculated hydrodynamics, where M1-M10 depict the measurement parameters.
Aeration RateParameter with UnitsM1M2M3M4M5M6M7M8M9M10
Air flow rate (2 L/min)Impeller diameter (cm)6666677777
Impeller speed (rpm)8009001000110012006857698709441027
d b (µm)341279236203191274257234231220
J g (cm/s)0.080.080.080.080.080.110.110.110.110.11
S b (s 1 )14.0715.4220.3423.6425.0924.0825.6828.2028.5830
Air flow rate (2 L/min)Impeller diameter (cm)6666677777
Impeller speed (rpm)8009001000110012006857698709441027
d b (µm)258217198190175223214200196189
J g (cm/s)0.170.170.170.170.170.210.210.210.210.21
S b (s 1 )39.5446.9851.4853.758.2054.4658.8663.0064.2066.66
Air flow rate (2 L/min)Impeller diameter (cm)6666677777
Impeller speed (rpm)8009001000110012006857698709441027
d b (µm)255228205204196377260207203189
J g (cm/s)0.260.260.260.260.260.320.320.320.320.32
S b (s 1 )61.1468.4076.0976.2079.5651.8873.8692.7094.56101.58
Publisher’s Note: MDPI stays neutral with regard to jurisdictional claims in published maps and institutional affiliations.

