Article

Grain-Based DEM for Particle Bed Comminution

by
Michael Klichowicz
* and
Holger Lieberwirth
Institute for Mineral Processing Machines and Recycling Systems Technology, Technische Universität Bergakademie Freiberg, 09599 Freiberg, Germany
*
Author to whom correspondence should be addressed.
Minerals 2021, 11(3), 306; https://doi.org/10.3390/min11030306
Submission received: 15 December 2020 / Revised: 10 March 2021 / Accepted: 12 March 2021 / Published: 16 March 2021

Abstract

:
The comminution at the grain size level for liberating the valuable minerals usually requires the highest size-specific energy. Therefore, a full understanding of the comminution process at this level is essential. Models based on the Discrete Element Method (DEM) can become a helpful tool for this purpose. One major concern, however, is the missing representativeness of mineral microstructures in the simulations. In this study, a method to overcome this limitation is presented. The authors show how a realistic microstructure can be implemented into a particle bed comminution simulation using grain-based models in DEM (GBM-DEM). The improved algorithm-based modeling approach is exemplarily compared to an equivalent real experiment. The simulated results obtained within the presented study show that it is possible to reproduce the interfacial breakage observed in real experiments at the grain size level. This is of particular interest as the aim of comminution in mineral processing is not only the size reduction of coarse particles, but often an efficient liberation of valuable components. Simulations with automatically generated real mineral microstructures will help to further improve the efficiency of ore processing.

1. Introduction

The successful implementation of the confined bed comminution process in minerals processing plants is a decisive milestone in the recent history of mineral processing. Although the principle of particle bed comminution was already applied in machines like Vertical Roller Mills (VRM) earlier, the basic concept was first studied by the workgroup of Schönert during the 1970s. In 1982, his main idea was patented in the USA [1]. Based on this, he analyzed how this principle can be used on an industrial scale [2]. This can be seen as the High-Pressure Grinding Rolls (HPGR) zero hour. As a consequence, the particle bed comminution in HPGRs was increasingly applied in the cement industry due to their low power consumption. Currently, particle bed comminution in HPGRs and also in VRMs is widely accepted as an energy-efficient alternative to conventional grinding in tumbling mills.
Our understanding of particle bed comminution is mainly based on excessive experimental studies. One of the most common approaches is to use piston die test setups, where relatively small samples are stressed based on well-known test conditions. This is often considered more convenient than experiments with real HPGRs as these usually require a much higher experimental effort.
Due to the increasing computational capabilities and progress in simulation algorithms, the Discrete Element Method (DEM) tool’s capabilities have been enhanced and are more able to deal with aspects like particle bed comminution.
Thus, the DEM tool can be used for detailed studies of the processes that occur on a particle bed during stressing. The area of application ranges from simulating the general procedure of particle bed stressing [3] to the compression distribution in the particle bed [4] and analyzing the comminution and degree of liberation for different particle bed setups [5]. Recent studies have focused on realistically simulating the actual breakage process of the particles and important associated process parameters like energy consumption or product particle size distribution. This is done with typical piston die setups but also with more dynamic impact stressing of particle beds [6,7,8].
This approach is also used to model the interaction between particle bed and HPGRs [9,10,11,12]. The actual breakage process of the particles has to be modeled with more general assumptions due to the lack of understanding of the details of comminution at the grain size level. Nevertheless, studies have shown that adequate prediction of the machine’s process behavior can be achieved. The effort to calibrate such simulations with appropriate model parameters is relatively high. Thus, lab-scale experiments are still indispensable for plant design.
The fact that the liberation of minerals and the recovery of valuables is one of the most important goals of plant operation makes the simulation of these processes an important contribution. For this reason, the so-called grain-based models (GBM) are increasingly researched in mineral processing. This approach allows one to simulate materials consisting of different grains in DEM [13,14,15,16], which is important as the mineral microstructure has a significant influence on mineral processing characteristics. Furthermore, GBM-DEM can be used to simulate the differences between various mineral phases. This new level of modeling detail was mainly used to simulate idealized test setups like uniaxial compression tests of natural rock [17,18,19,20,21,22,23]. These extensive studies show the potential of this method, while modeling of the micromechanics in the comminution of mineral materials remains challenging.
Based on this encouraging progress, we applied the approach to two-dimensionally simulate particle bed comminution in a piston die press. For this purpose, we modeled the microstructure of granite on the basis of quantitative mineralogical analysis (QMA), which is a special analytical method usually done with polarized light microscopy [24,25,26]. The resulting synthetic microstructure served as a template for the grain-based model. This approach had already been successfully applied to granite specimens, which were broken in an indenter test [27]. The current study shows that this approach applies also to more complex applications like particle bed comminution in principle.

2. Methods and Material

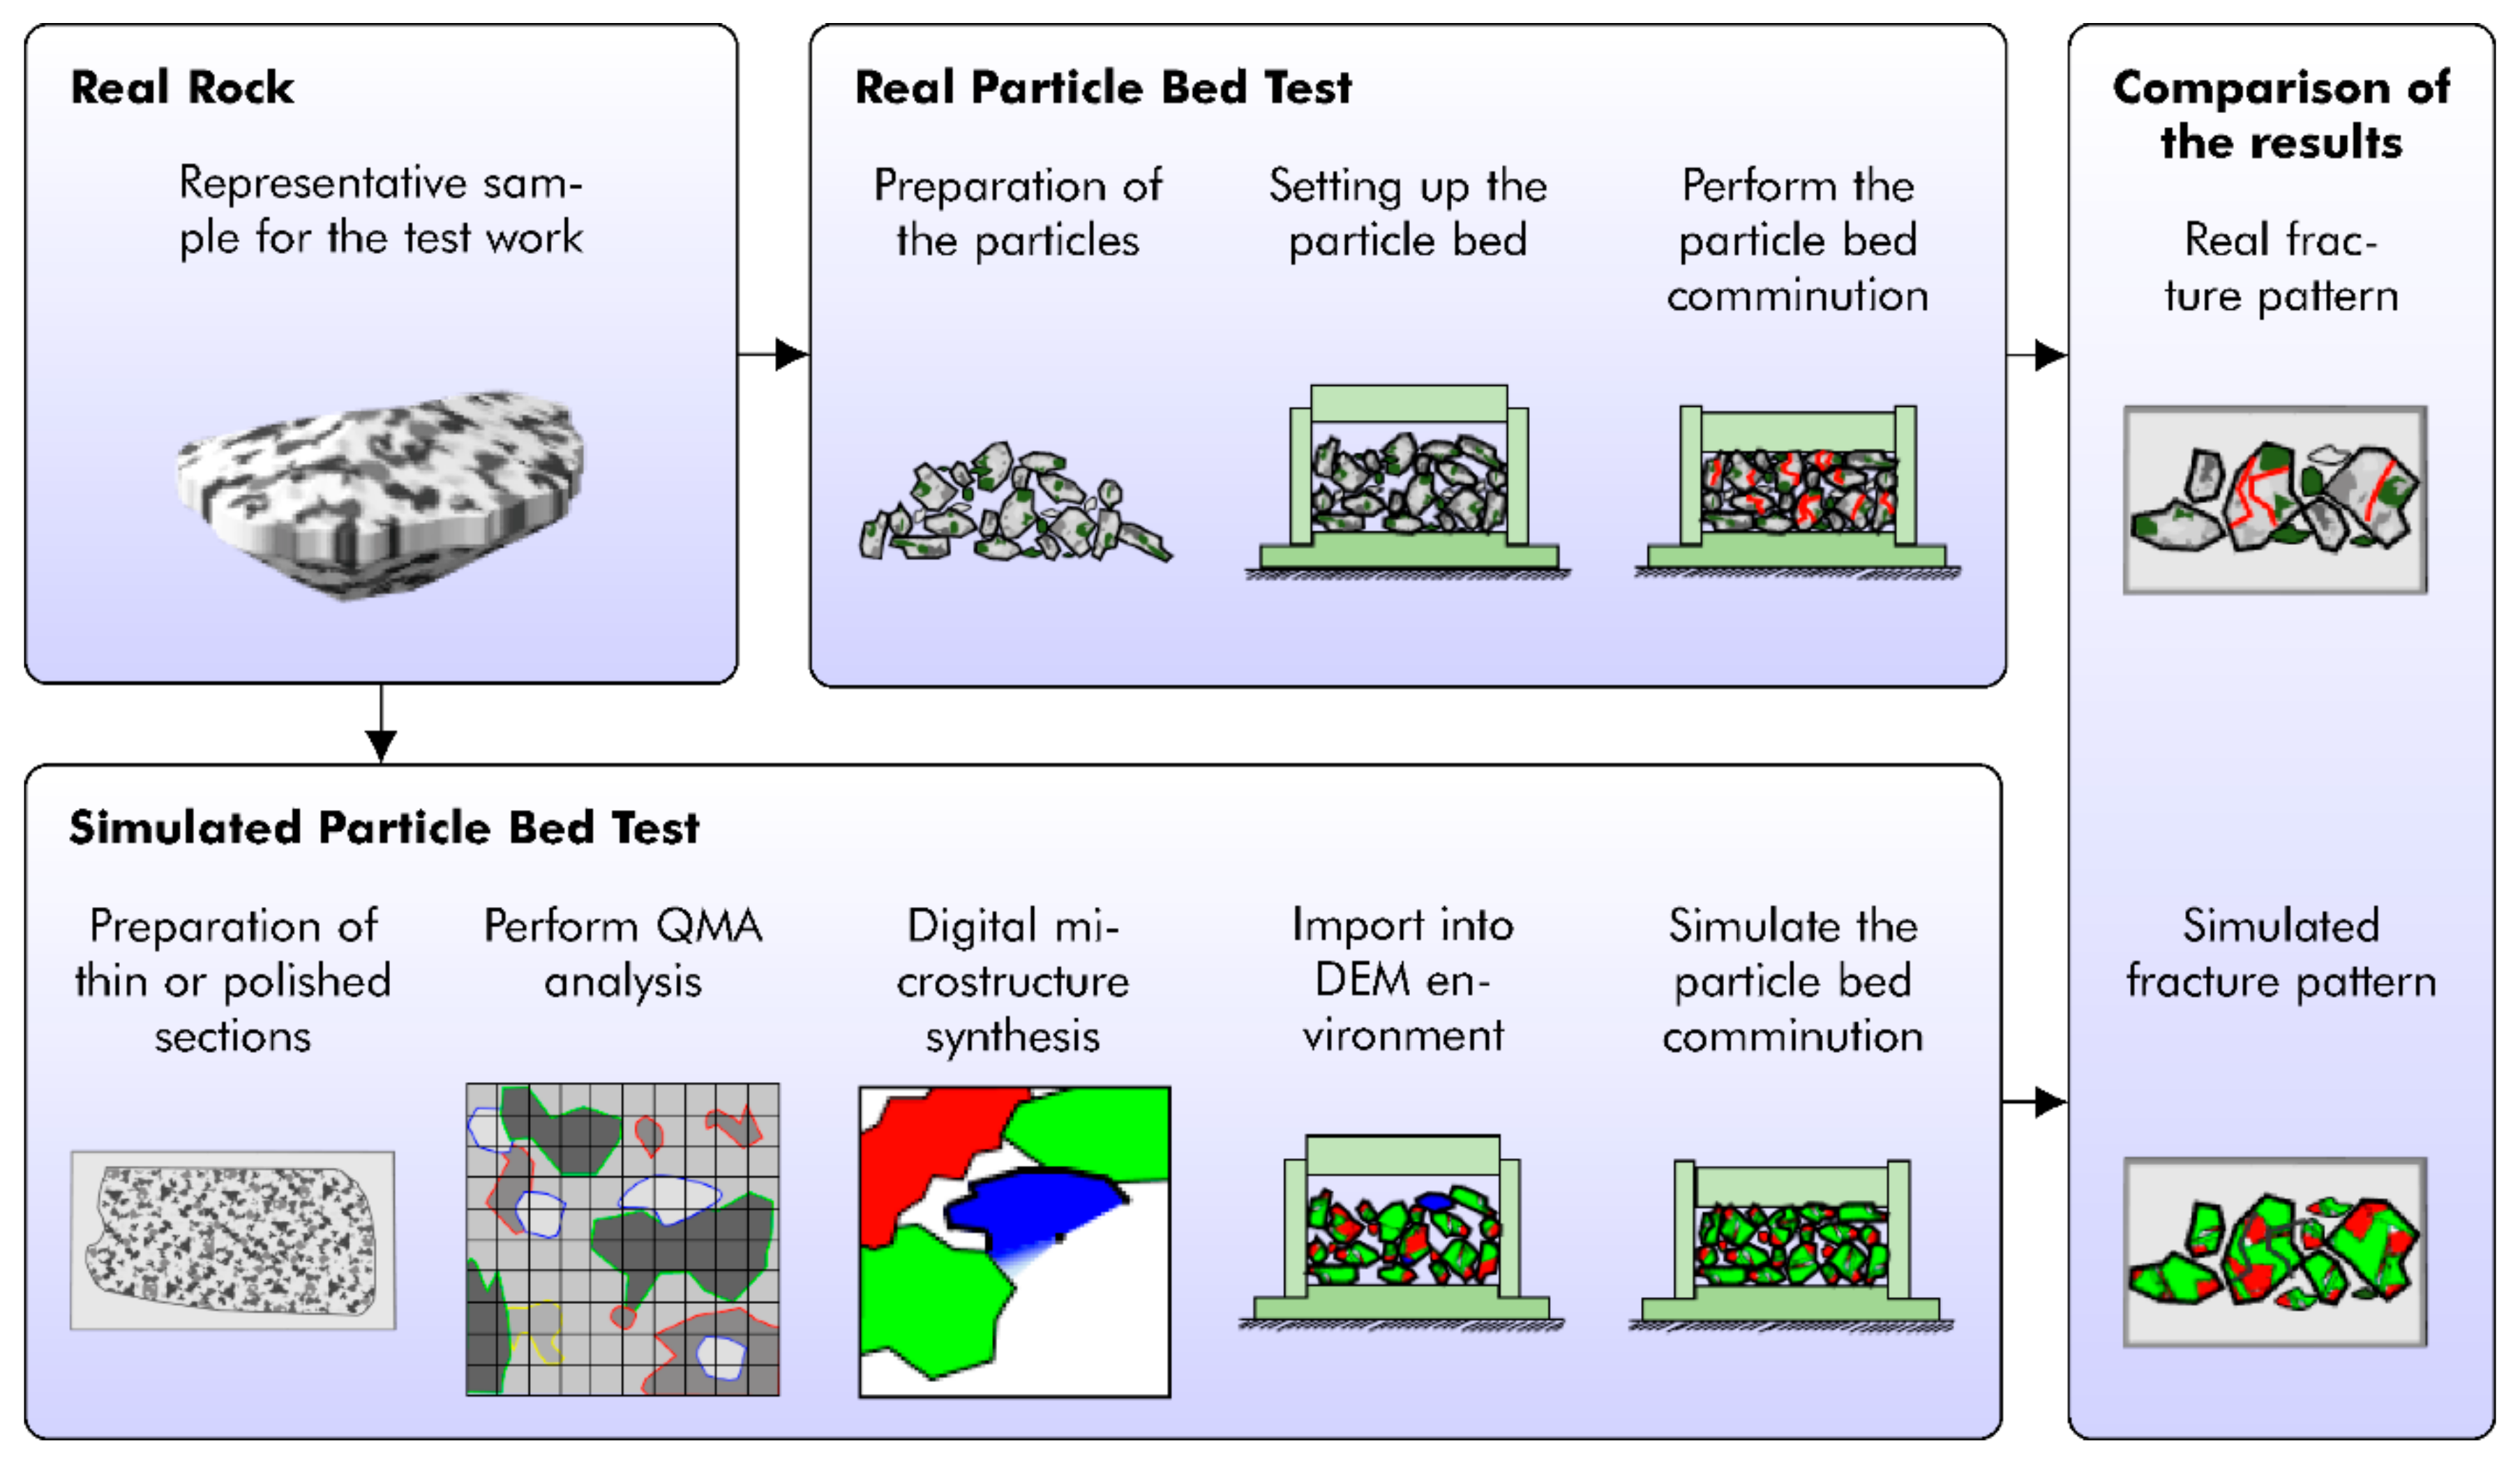
2.1. Basic Idea of the Parallel Test Setup

The main aim of this research is to present the possibilities that arise when realistic mineral microstructure models are used in GBM-DEM. For this reason, a parallel procedure for a real and a simulated particle bed comminution test was applied (Figure 1). To evaluate the simulation, it is compared to the real particle bed test. Therefore, a physical experimental test is done in parallel. However, due to the differences between the three-dimensional real test setup and the two-dimensional simulated setup, and due to the lack of knowledge of appropriate micromechanical parametrization of the various grains, we focus on analyzing the proportion of observed inter- and intragranular cracks, which are pertinent features of the breakage pattern.
Based on a representative sample of the real test material, its mineral microstructure was modeled with the help of QMA. We then were able to simulate the microstructure in arbitrary sizes and import it into DEM, for which we used YADE [28]. Afterward, the particle bed comminution was simulated using GBM in combination with the bonded particle model (BPM) to simulate inter- and intragranular breakage.

2.2. Selection of the Test Material

In order to benchmark these tests with the previous study [27], the same granite from Meissen, Saxony is used. This comprises finely dispersed hematite inside from middle to coarse-grained feldspar, which takes up about 70 percent of the granite, giving it its typical reddish color. It has an unconfined compressive strength UCS of 168.10 ± 6.27 MPa and a Brazilian tensile strength σtB of 8.25 ± 0.94 MPa. Both characteristics were measured with the standard test procedures according to DIN EN 1926 [29] and ISRM [30]. Further, a porosity of about 0.7 % and an average dry particle density of 2.62 g/cm3 were measured.
The prerequisite for modeling a realistic mineral microstructure is the correct measurement and quantification of the mineralogy. For this task, we used the QMA as reference. This approach allows a high level of detail, including the quantification of grain clusters of the same phase, which is not possible with other methods such as computed tomography (CT) [31].
In detail, QMA is a statistical method to characterize mineral microstructures [24,25]. This approach uses the data of point, line and area analysis of up to three orthogonal polished or thin sections as a database. By means of spatial statistics, the mineral microstructure can then be quantitatively described. The QMA results for the chosen granite are shown in Table 1.

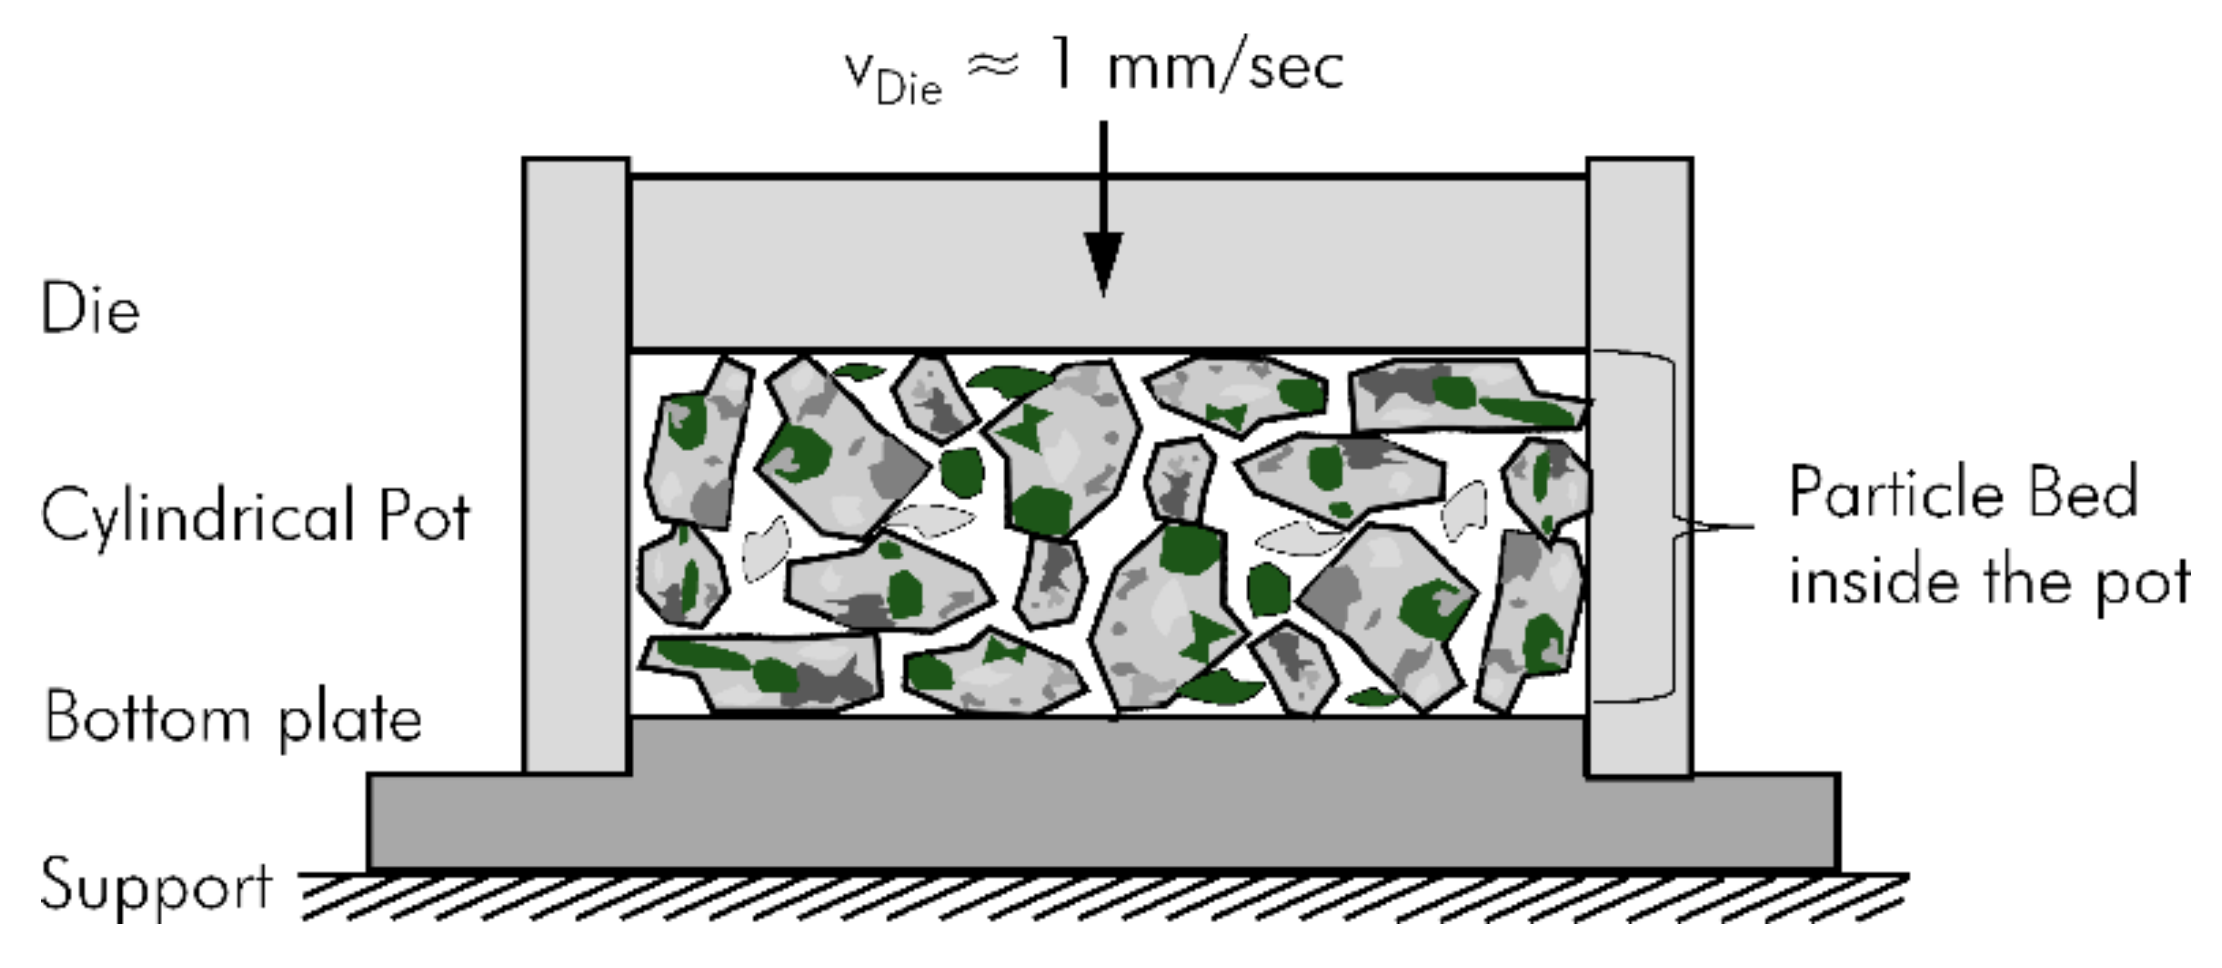
2.3. Setup of the Particle Bed Test

The setup of the particle bed test is shown in Figure 2. The approach is comparable to other studies, which use piston die setups [32,33,34]. A piston die press of the type KV.135.02, manufactured by the RUCKS Maschinenbau GmbH, is used. This press has a capacity of approximately 4000 kN and can be equipped with different tool configurations, which are suitable for particle bed experiments. The used diameter of the piston is 160 mm. This dimension corresponds to the inner diameter of the pot, in which the particles are filled. All parts of the press, which are in contact with the material, are made of steel. For measuring purposes, the piston die press is equipped with force and displacement sensors, which allow monitoring of the force–displacement behavior of the particle bed during the test.

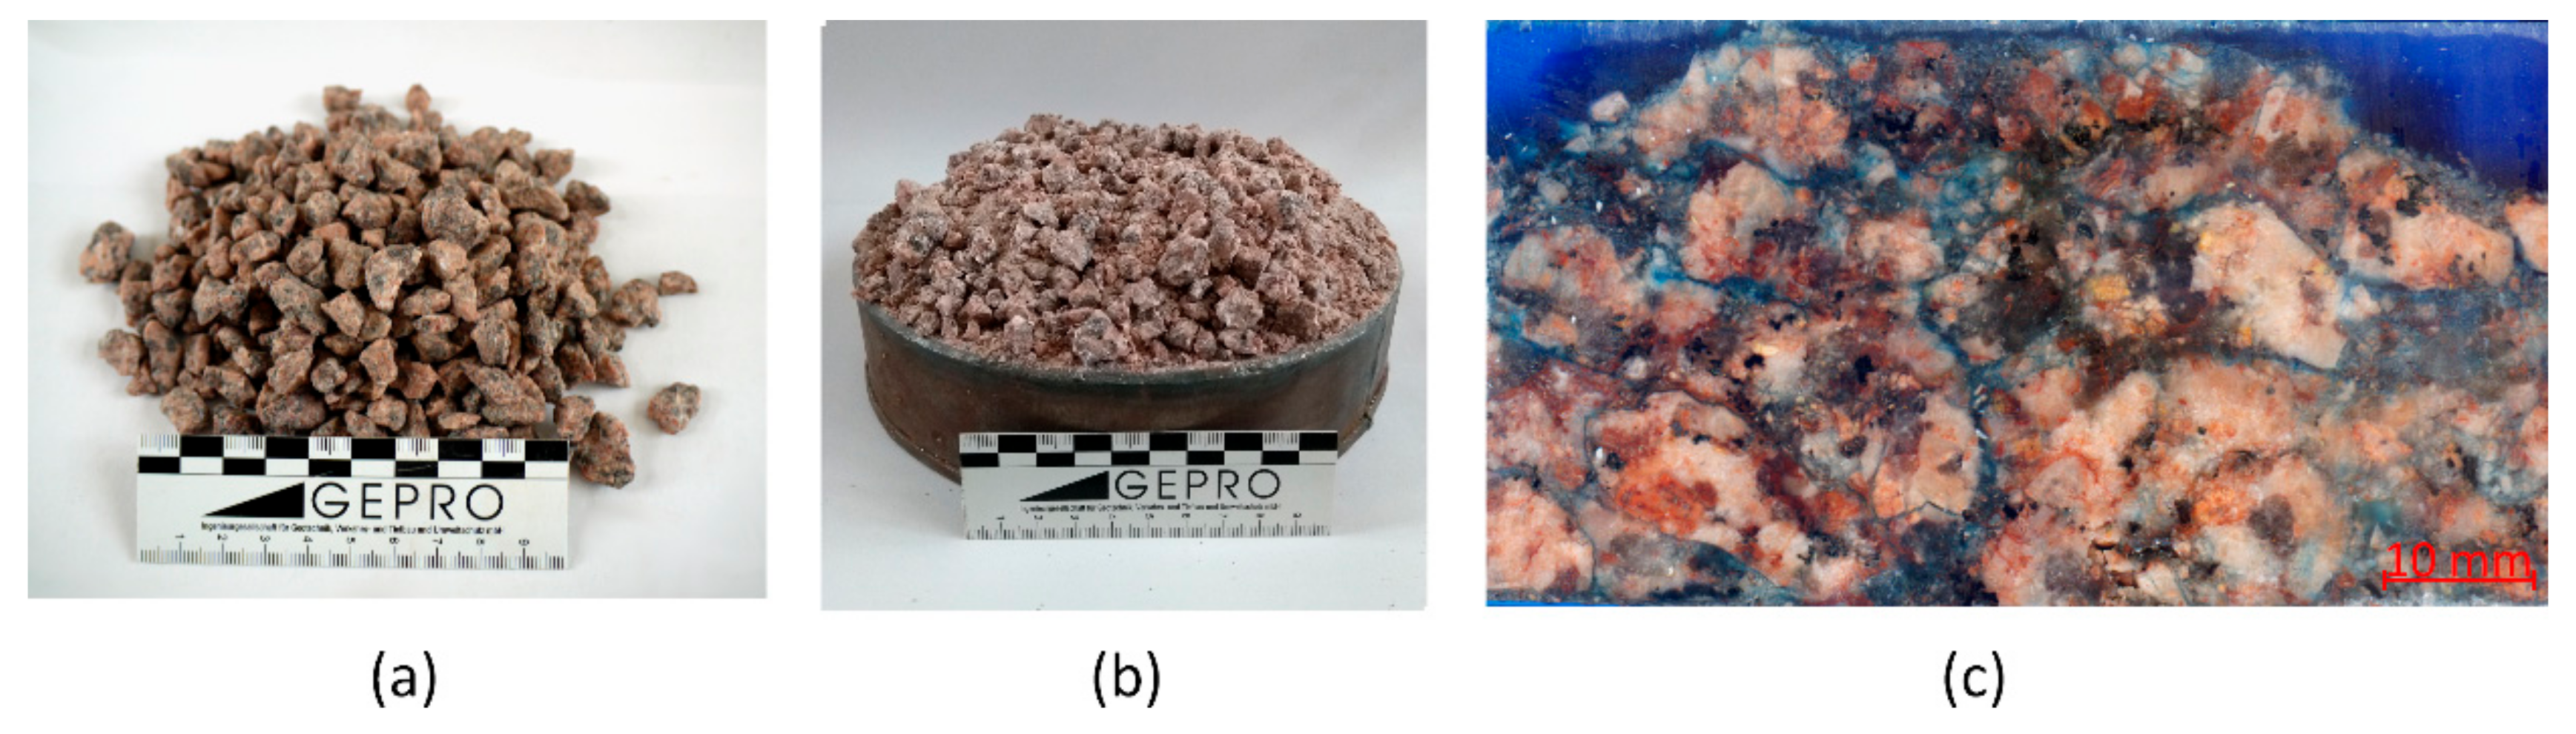
2.4. Procedure of the Real Particle Bed Test and Sample Preparation

For the test, particles of size range 8 to 12.5 mm were used as feed material. On the one hand, the particles of this fraction may be sufficiently small, so that the wall effects are negligible to the greatest possible extent, meeting the requirements of an ideal particle bed according to Schwechten [35]. However, granite particles of this size must still be coarse enough, so that even smaller particles consist of enough individual grains. If too small particles are used, one has to keep in mind the mineral microstructure influence on the breakage behavior, which decreases at a certain point when the diversity of grains inside the particles is low.
Before the test starts, a total mass of approximately 1500 g of the feed material is evenly distributed in the pot. This results in a particle bed height of 50 to 55 mm. After the preparation is finished, the particle bed test can be started with an approximate loading speed of 1 mm/sec. The actual test procedure as well as the subsequent specimen preparation are schematically illustrated in Figure 3.
At the beginning of the test, the piston starts to compress and comminute the particles (see Figure 3a) until the final load is reached and the piston movement is stopped (Figure 3b). After releasing the load, the pot is lifted and removed, so that the particle bed can be accessed freely for further handling (Figure 3c). Due to the compaction, the particle bed stays largely intact, without the support of the pot wall. Subsequently, the particles at the outer side of the briquette-like press product are removed and the inner part is encased with a hollow cylinder (Figure 3d) since the wall region is neglected. We used a plastic pipe with an inner diameter of 110 mm for this purpose. Following, the gap between the pipe edge and the bottom plate is sealed and the inner part of the particle bed is carefully grouted with resin, to fix the particles in place. To enable better differentiation, we used a blue dye to color the resin. After curing the resin, the specimen with the inner part of the particle bed is removed and cut into slices. (Figure 3e). The slice of the center, which is marked orange, is then used to prepare a thin section (Figure 3f) for the analysis of the breakage pattern.

3. The Real Particle Bed Test

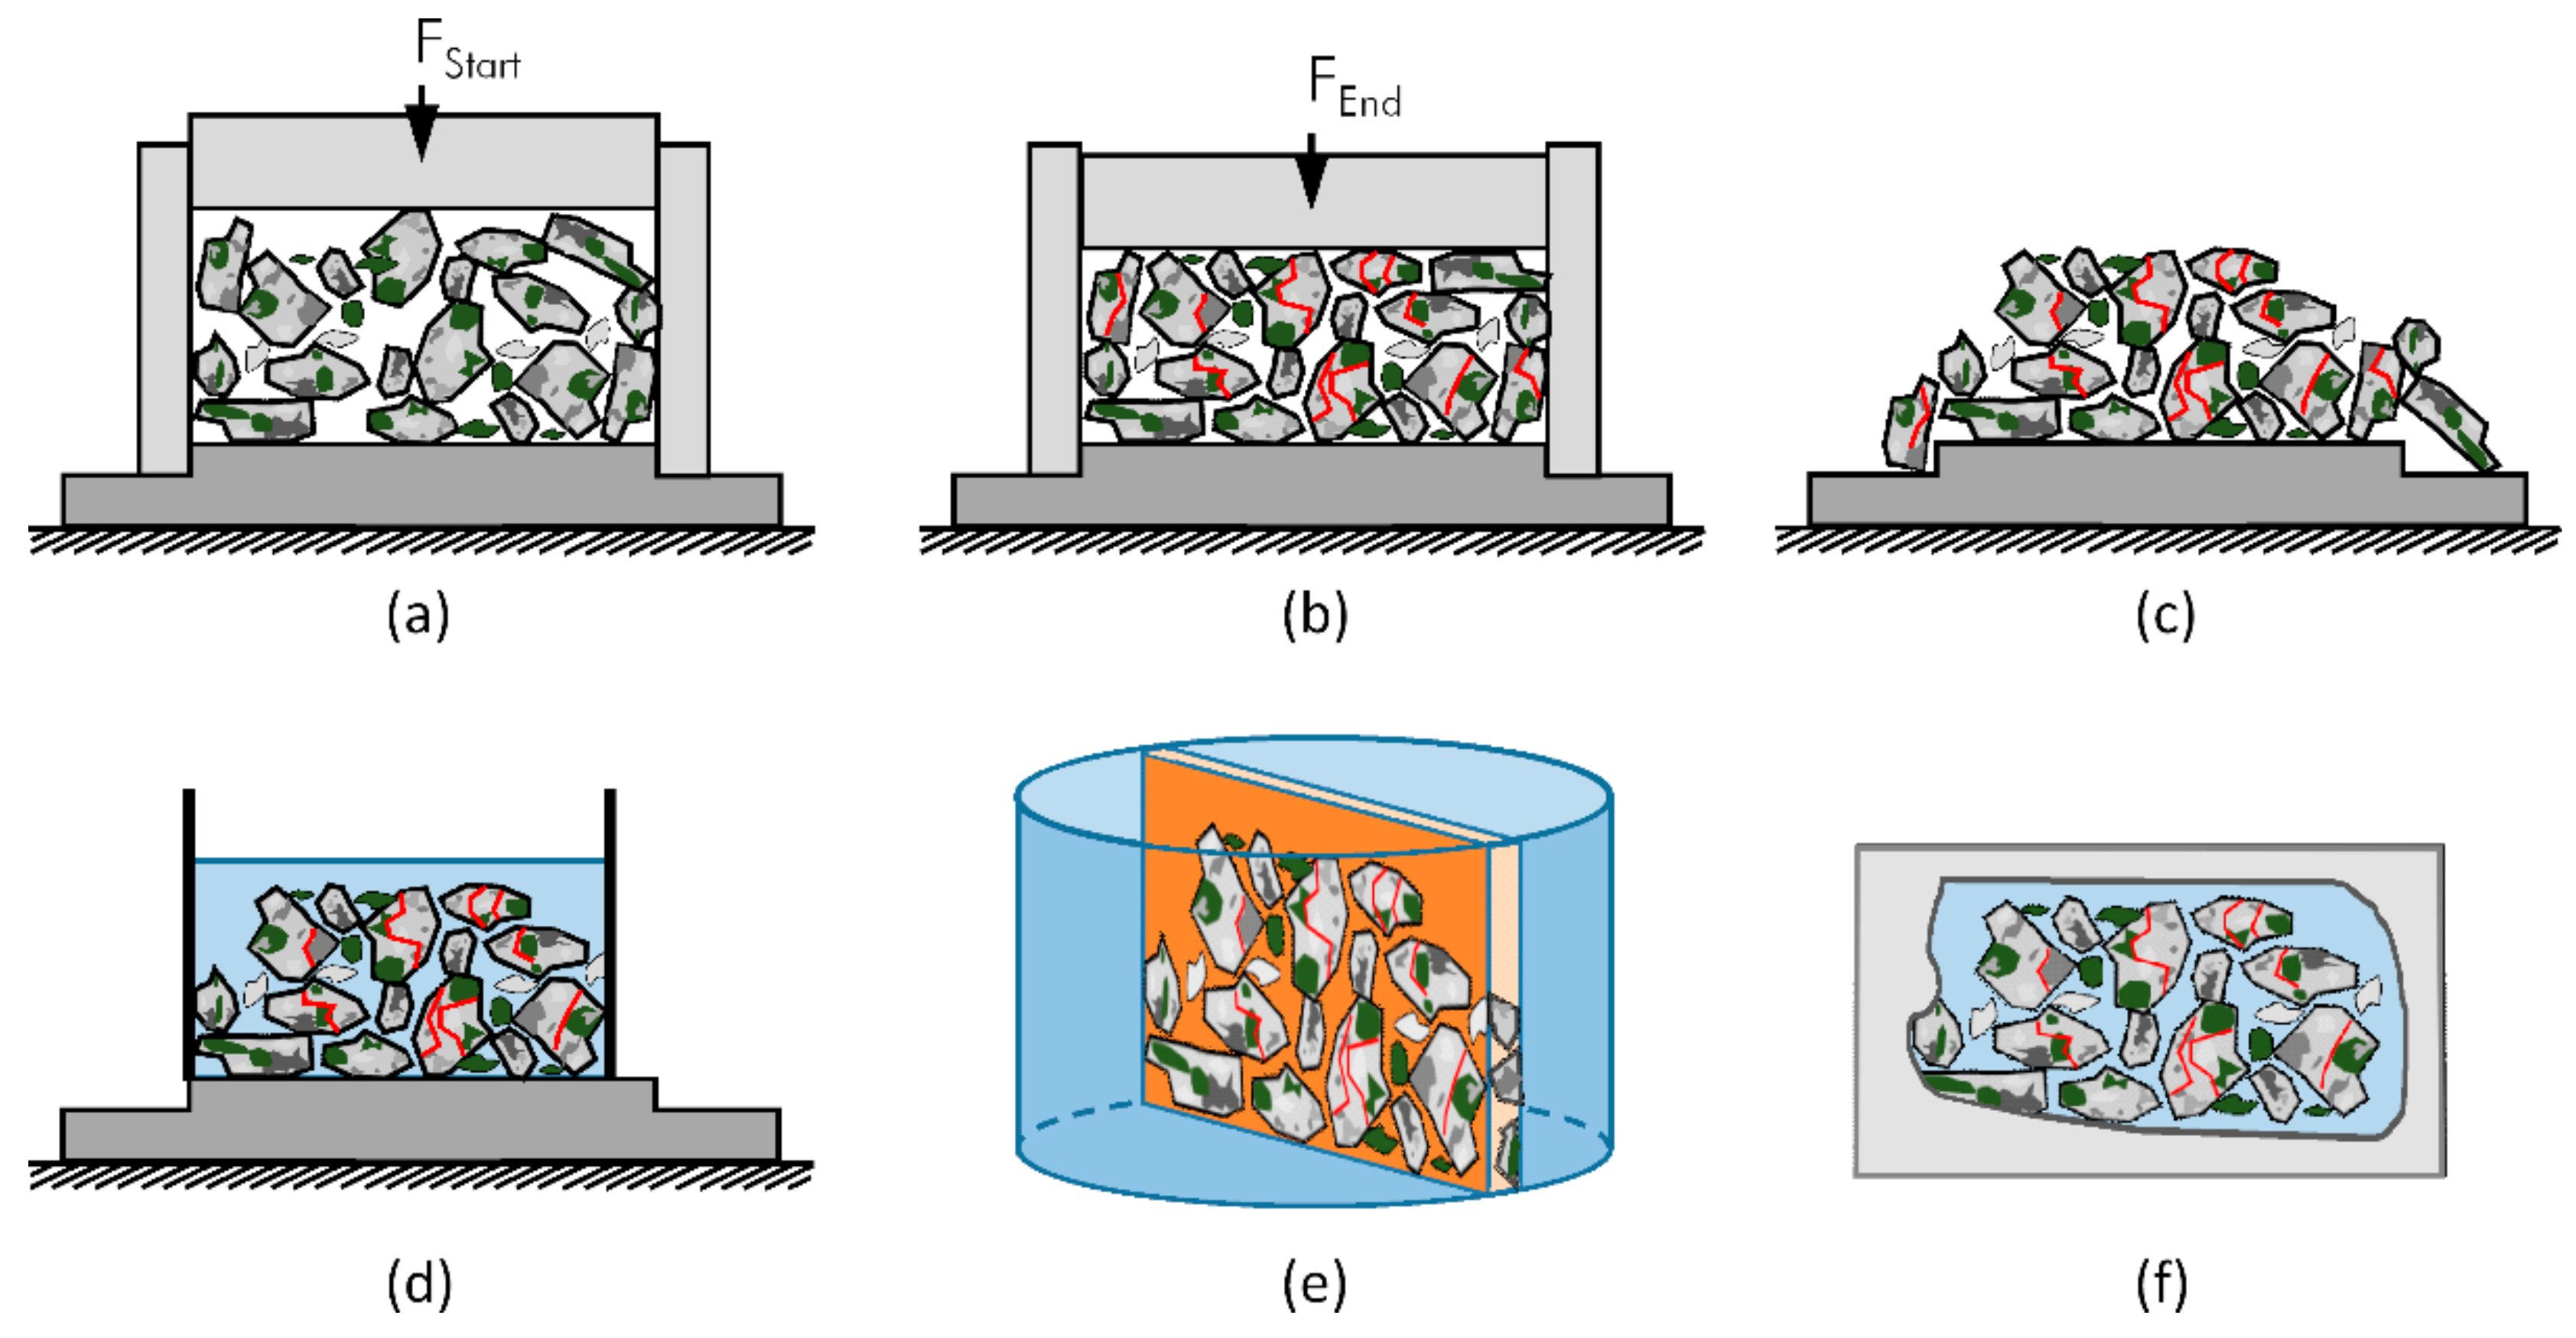
3.1. Realization of the Real Particle Bed Test

In this study, we present the results of a piston die test that was done with a load of approximately 20 MPa. We chose this relatively low load since we wanted to achieve that the majority of the particles is broken by guaranteeing that the sample still contains a significant number of bigger fragments, which can be analyzed.
According to the procedure presented in Figure 3, a thin section of the crushing product of this test was prepared for the evaluation of the breakage pattern. Figure 4 shows images of a sample of feed material (Figure 4a), of the particle bed, after it was removed from the piston die press (Figure 4b), and of the section through the center of the grouted sample (Figure 4c). For the evaluation of the breakage pattern, a thin section of this center slice was further prepared.
Additionally, also a fresh particle bed of feed material was prepared to allow comparison of the starting conditions between the real and the simulated test.

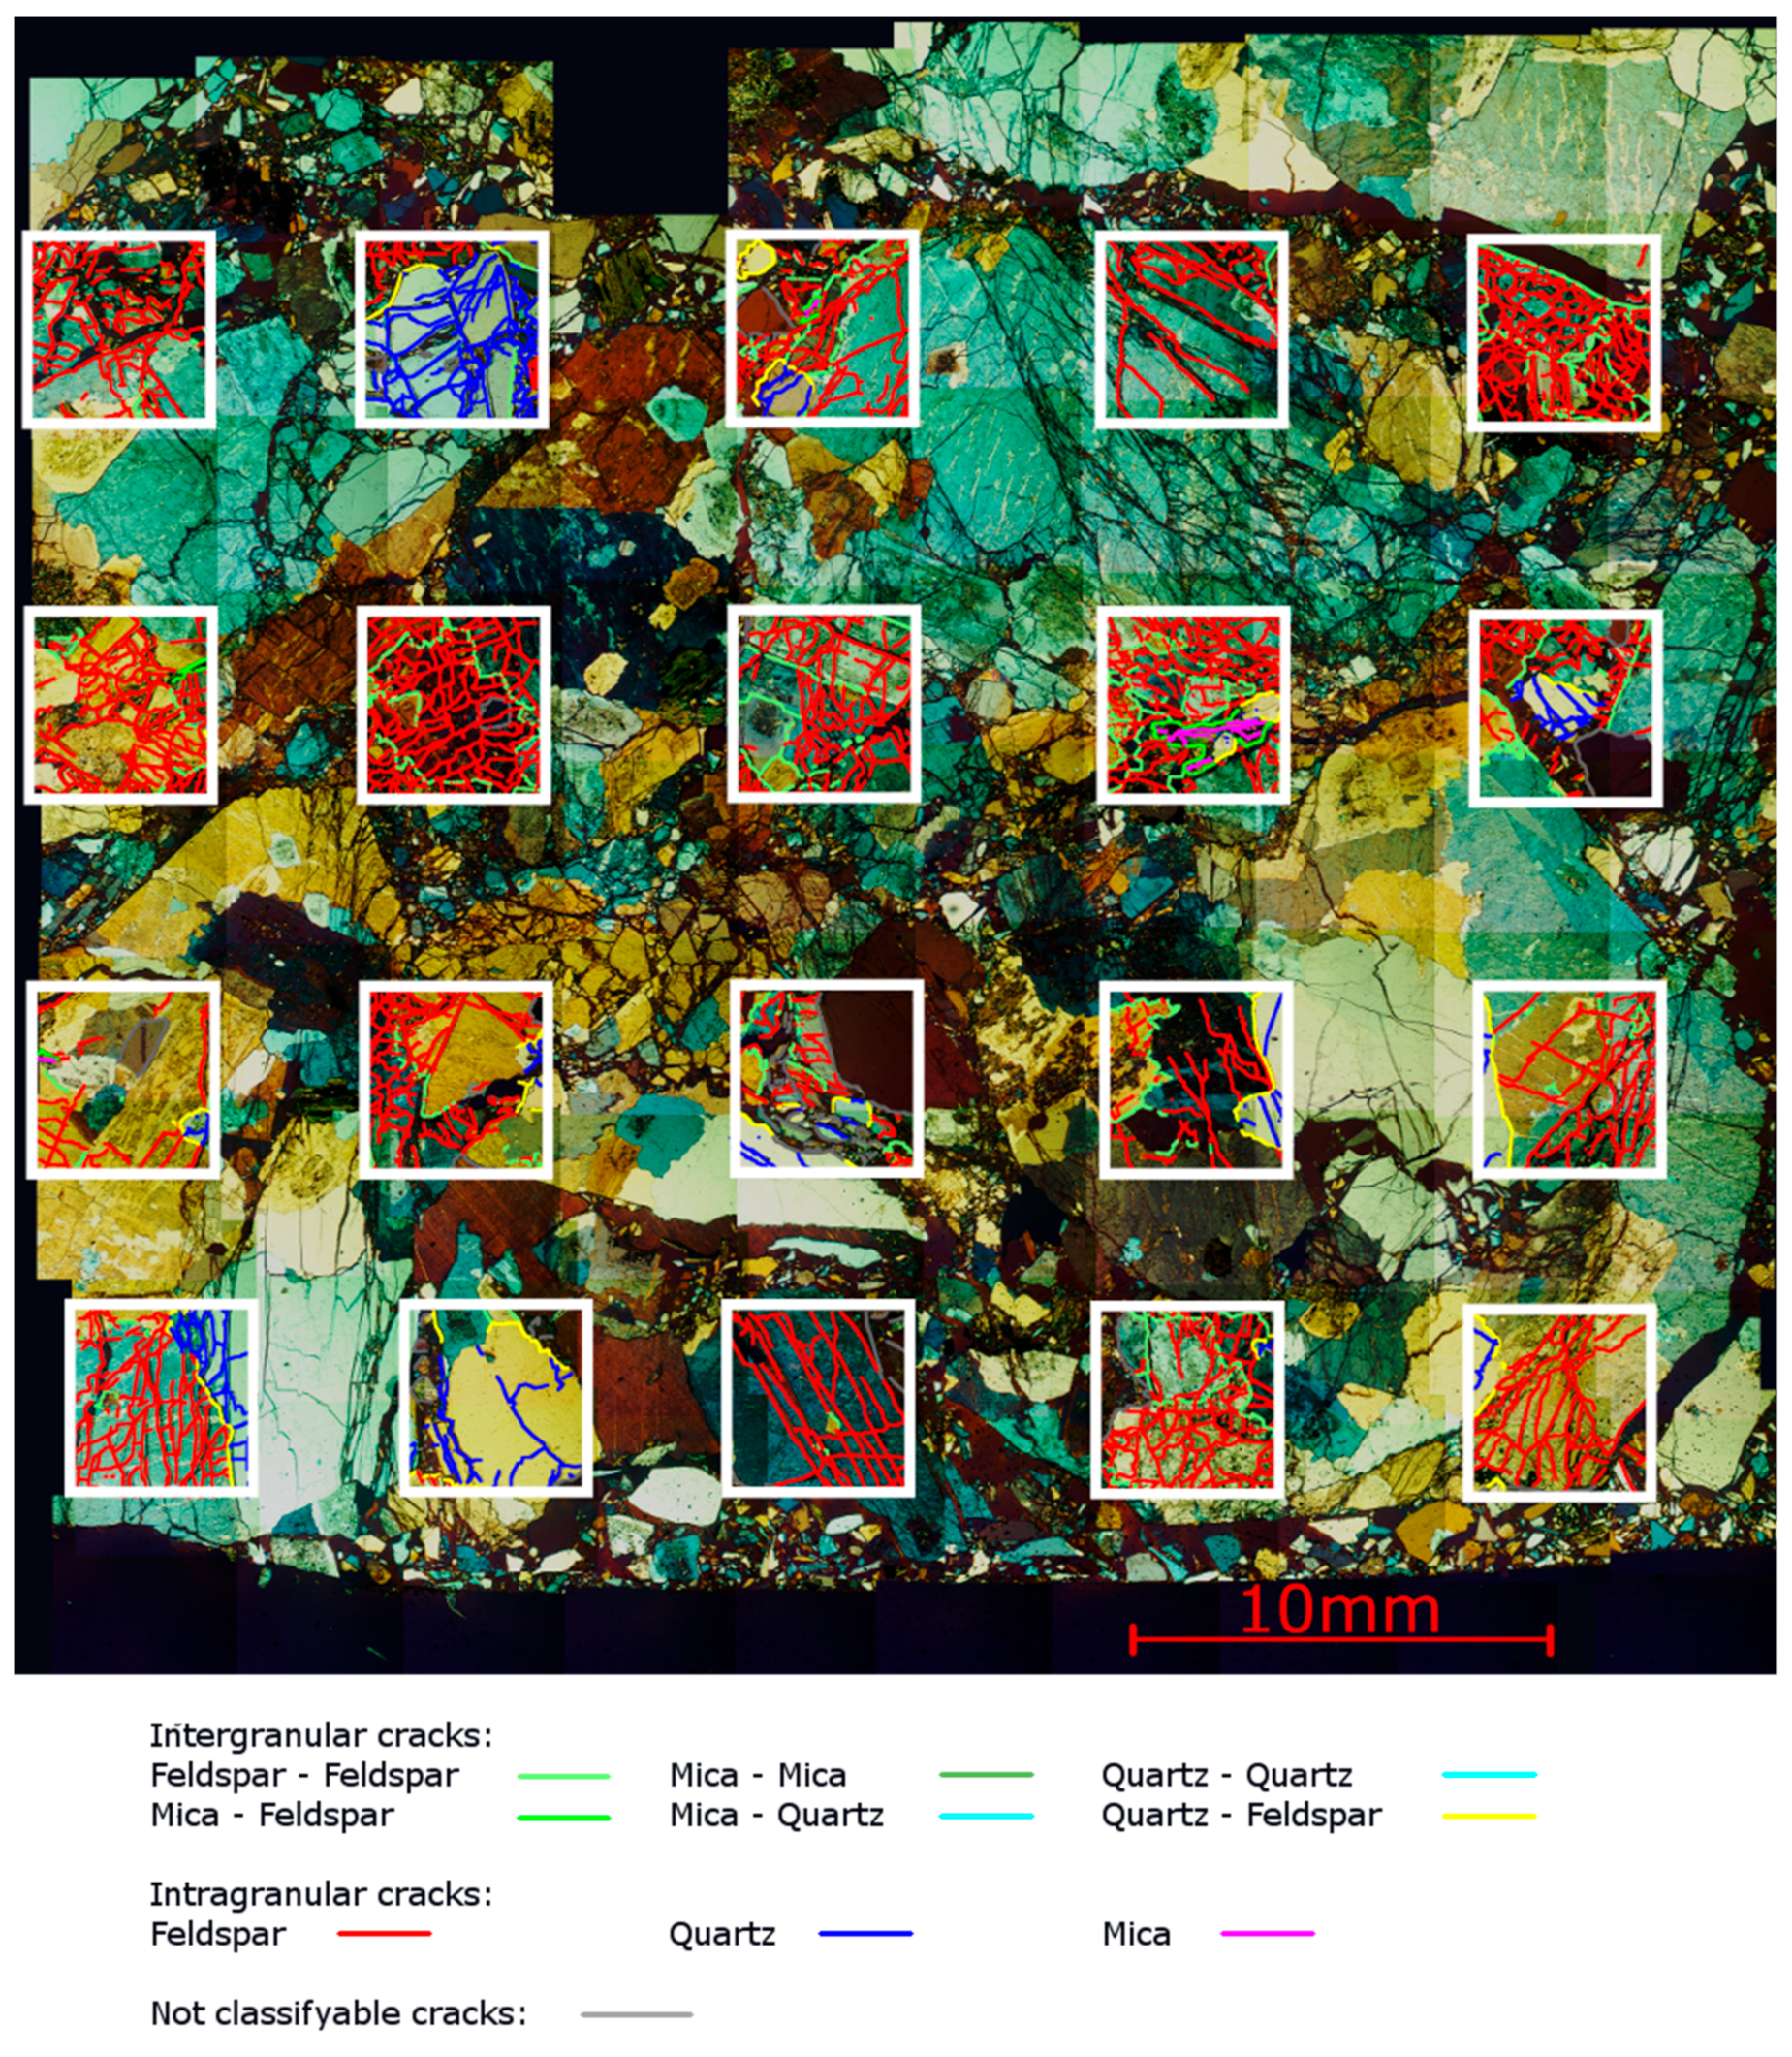
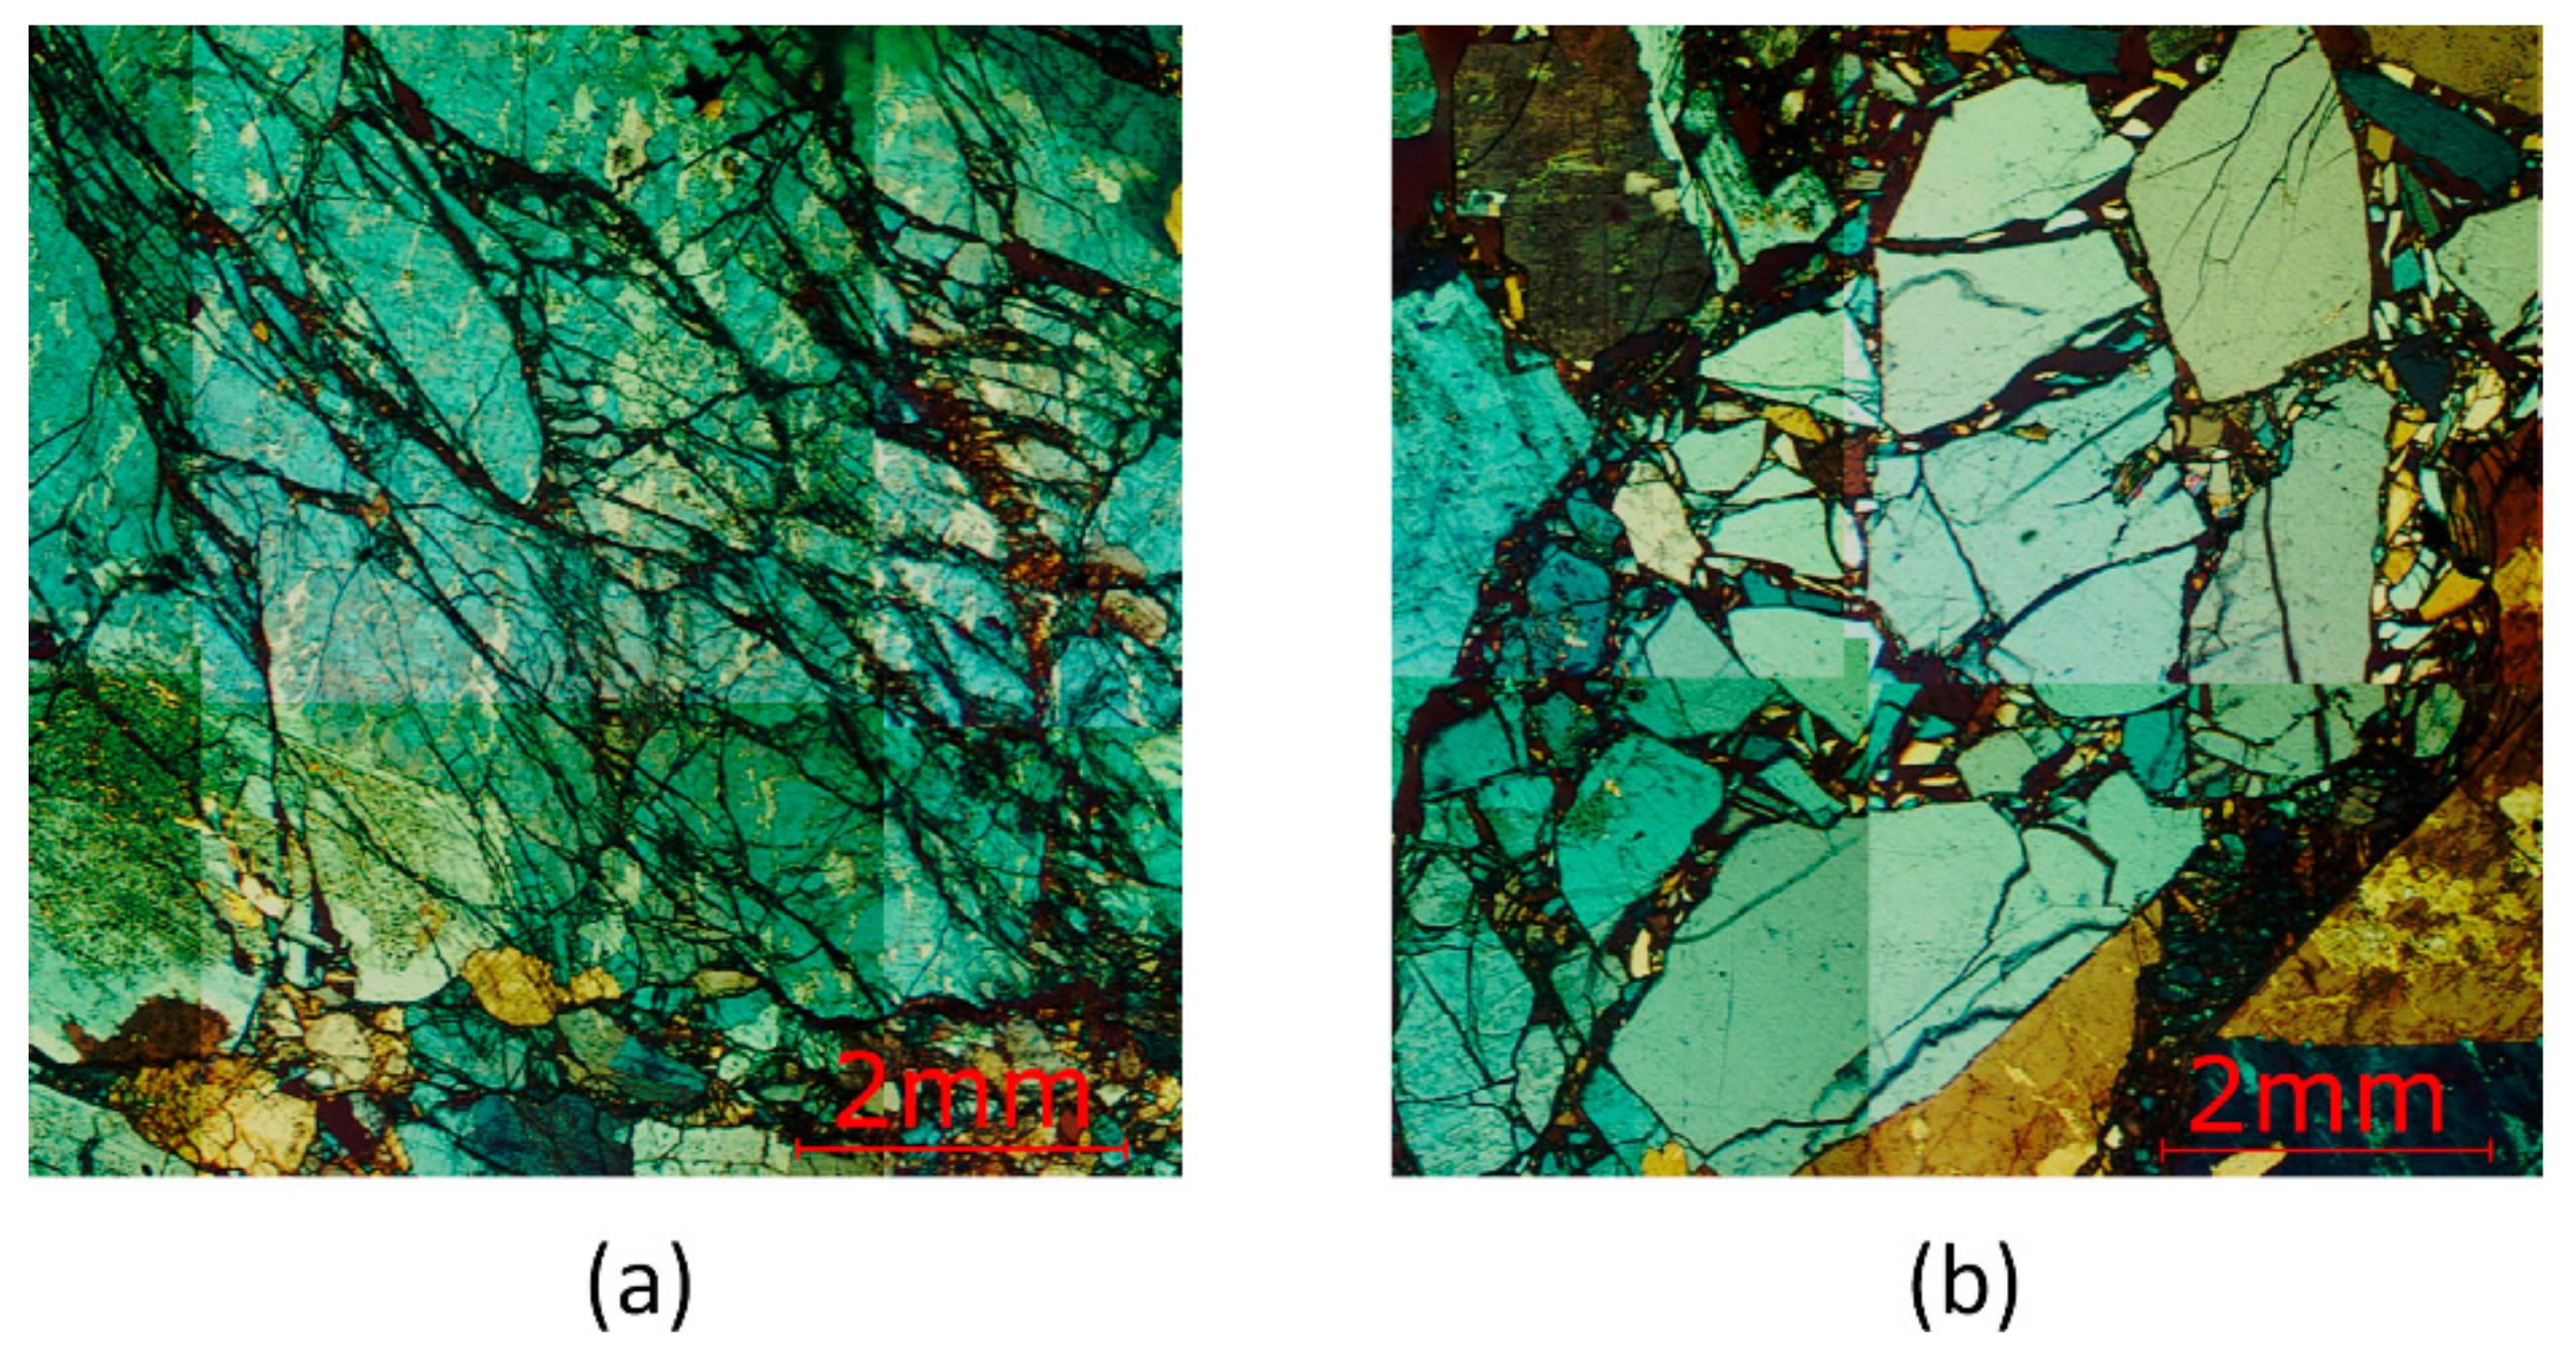
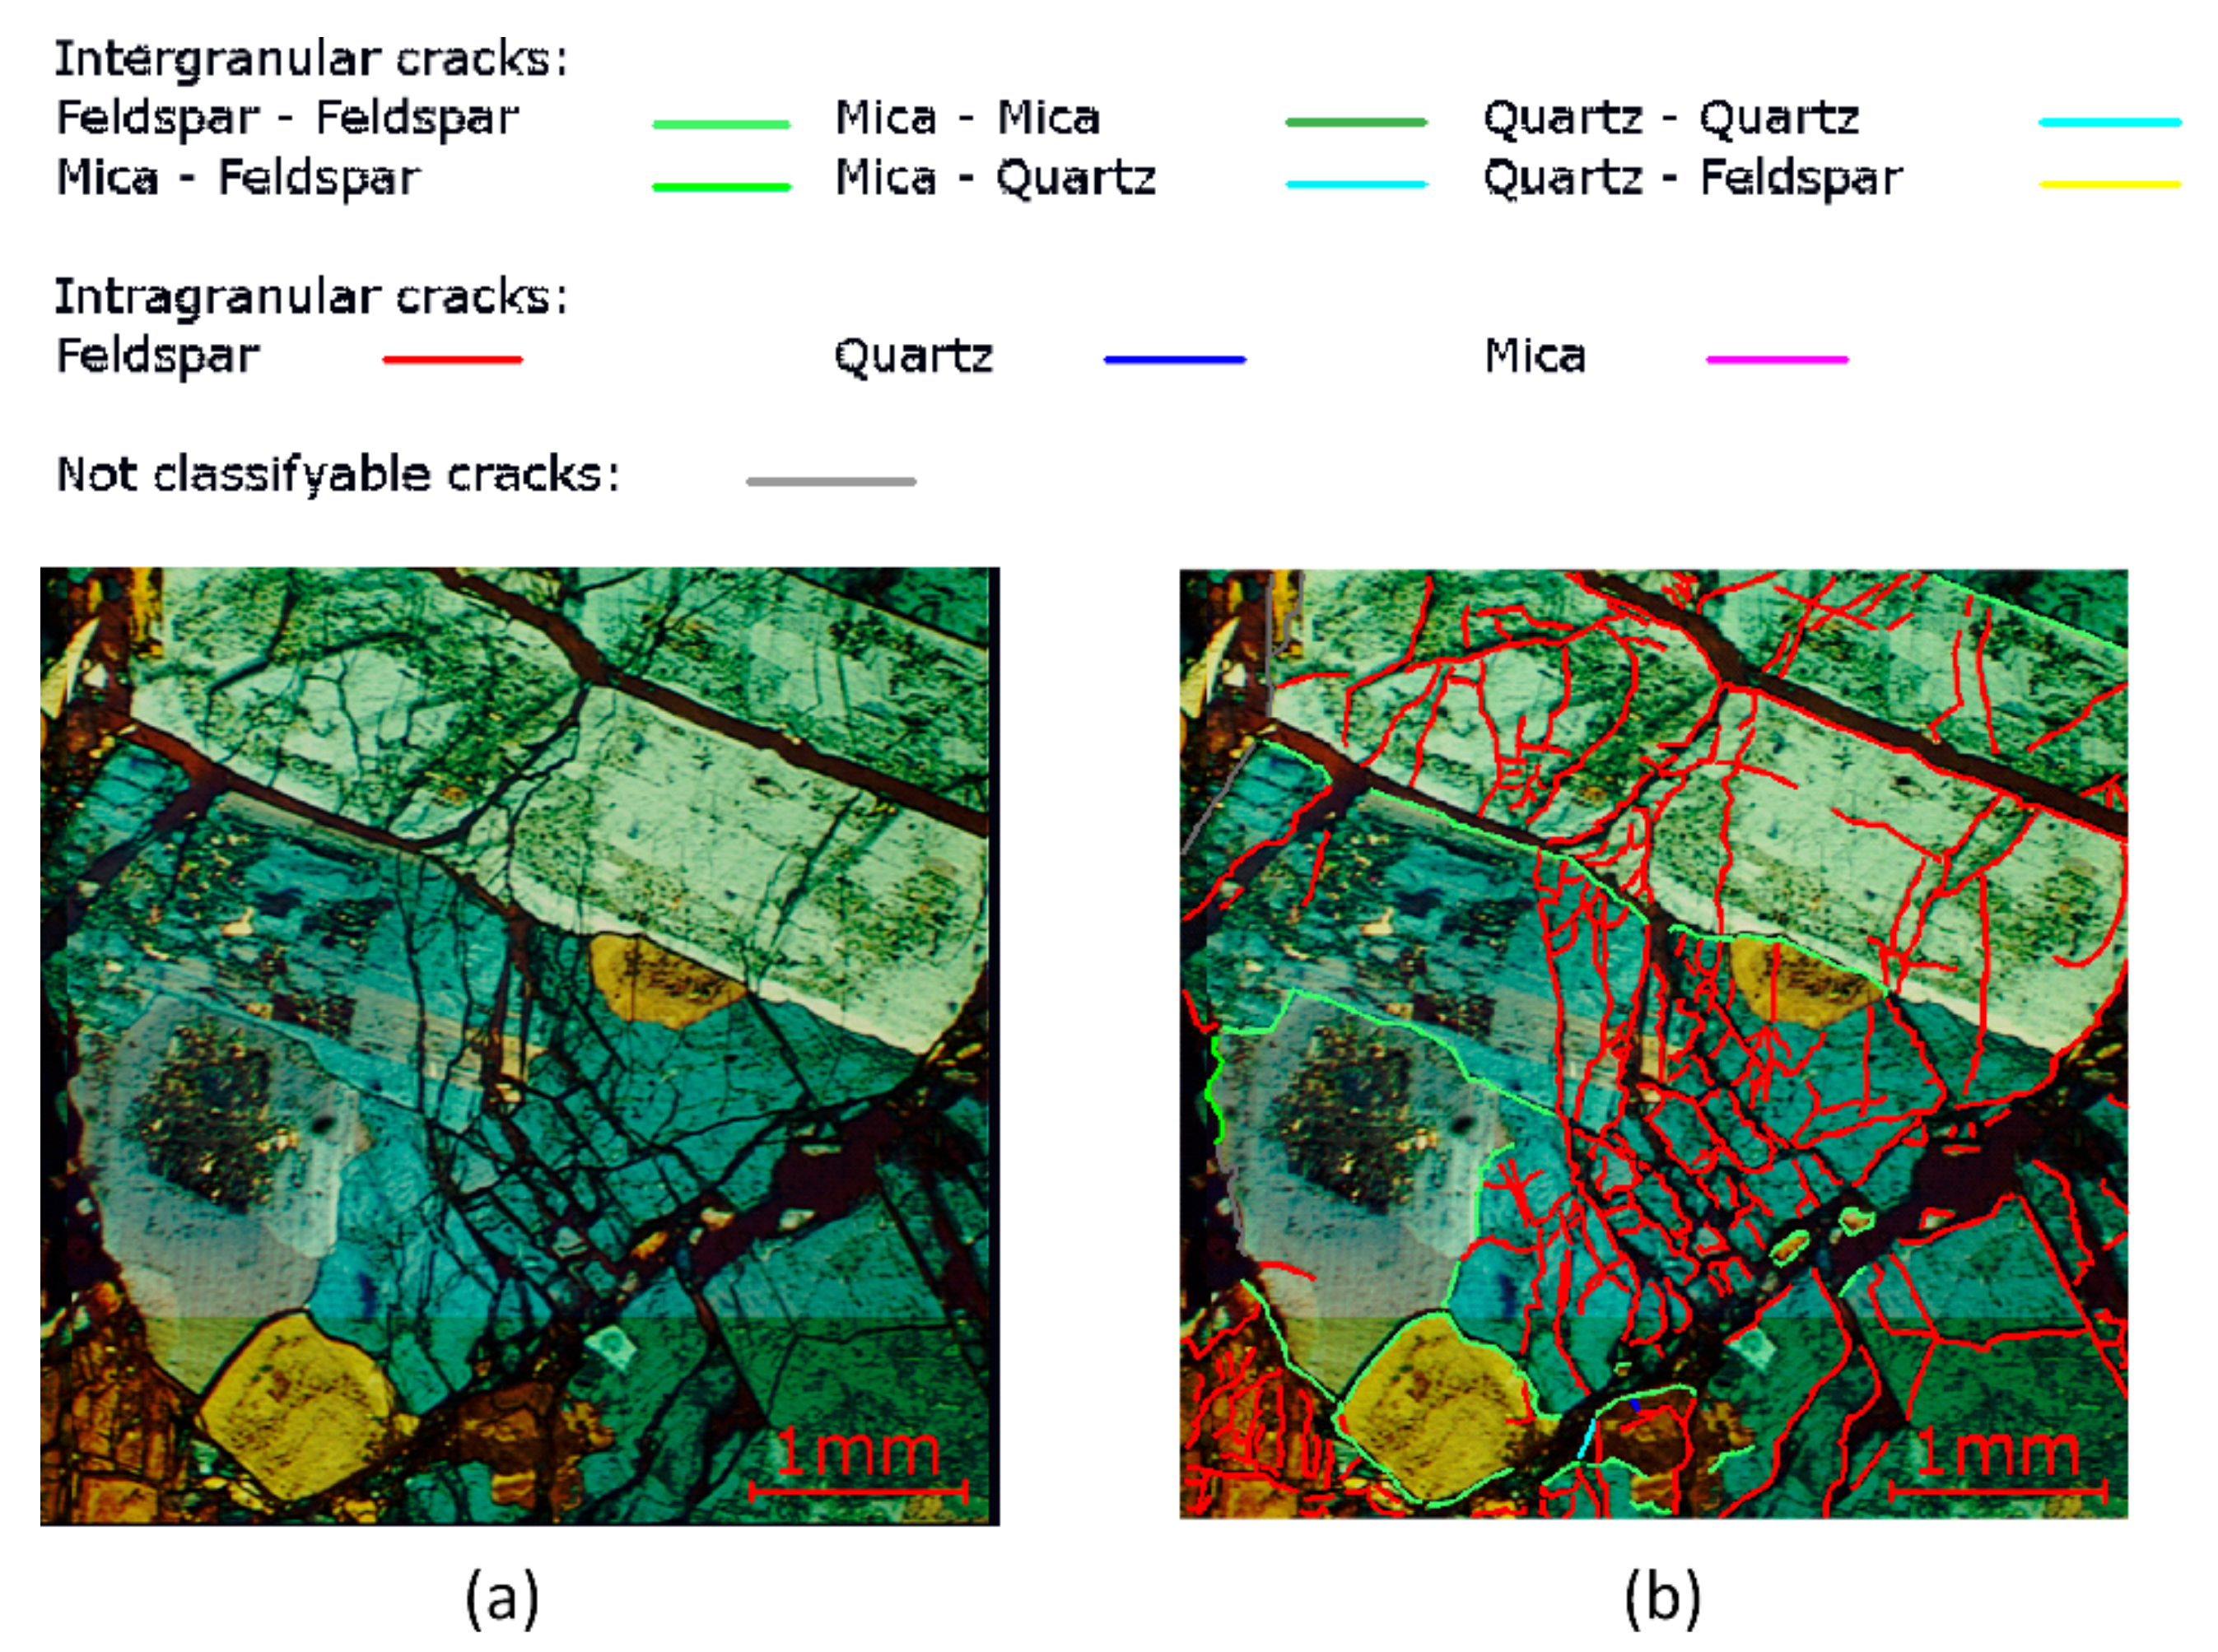
3.2. Evaluation of the Breakage Pattern of the Real Particle Bed Test

For the evaluation of the breakage pattern, the thin section was analyzed using polarized microscopy. Since the thin section of the particle bed is much larger than usual thin sections for microscopy, only a part was digitized as shown in Figure 5.
Since the digitalized part of this thin section is too large and contains too many fragments and cracks for manual analysis, it was decided to analyze only part of it. A raster of 5 by 4 quadratic subsections was used for this purpose (Figure 6). Each subsection was 4.2 mm in size. Following, the cracks found in these separate observation windows were marked according to the mineral phases through which the cracks have propagated.
In general, it can be seen that the grouted particle bed mostly stayed in the structure, it had directly after ending the comminution process. An indicator of this characteristic is that most fragments and crack structures are intact and appear to be a jigsaw puzzle of the former parent particles.
Based on the analysis of this thin section, it is possible to calculate the proportions of the various crack types as presented in Table 2. This was done with different resolutions for the cracks. First, all identified cracks were taken into account (column “all”). However, since it was found that some crack structures are much finer than the resolution we can achieve with our DEM simulation, the results were additionally evaluated with a lower resolution. A minimum of 1 mm was used for the crack sizes (column “>1 mm”) to be able to compare the results with the simulation.
Considering all cracks, it was found that approximately 87.50 % of the cracks are of intragranular nature. The majority is due to cracks inside feldspar grains, which can be seen as a logical consequence of the high overall proportion of feldspar on the microstructure. We interpret this result as follows: The higher the proportion of grains of a certain phase in the total mineral content of the microstructure, the higher the proportion of cracks in the grains of this phase in relation to all measured intragranular cracks.
The remaining 12.50 % of the cracks are due to intergranular breakages. This is a small but significant amount, which suggests that there is preferential breakage along some grain boundaries. These cracks are found particularly along the boundaries between feldspar grains, which can also be attributed to the high feldspar content of the granite. Based on the explanation for the intragranular cracks, we interpret this result as follows: The more boundaries there are between grains of a certain phase in the microstructure considering all grain boundaries, the higher the proportion of cracks at these boundaries, considering all measured intergranular cracks. For this explanation, however, we must assume that there are only negligible differences in the breakage characteristics of the various grain boundaries.
It can be assumed that the above-explained relationship between the high feldspar proportion and the high proportion of inter- and intragranular cracks in relation to feldspar grains is additionally influenced by differences between the breakage characteristics of the various minerals and grain boundary types. These influences can, however, only be evaluated quantitatively. For a detailed analysis of such characteristics, more extensive studies with different microstructures and including process parameters such as stress rate are required.
Despite this limitation in the interpretation, the pure existence of intergranular cracks inside the granite already confirms the results of the previous study, where the same was found for a special indenter breakage test with identical material [27]. This agreement suggests that there is also a certain tendency for intergranular breakage in particle bed comminution. Hence, the details of the inter- and intragranular cracks are discussed in the following.

3.2.1. Intragranular Cracks

A closer look at the breakage pattern reveals that a significant amount of the intragranular breakage is measured in areas where the grains are literally shattered to small debris. A good example of this effect is shown in Figure 7a.
Furthermore, the proportions between measured intragranular breakage in the particle bed specimen and the content of the mineral phases in the granite seem to be shifted. Although the general ranking order of the mineral phases by content is correct, the intergranular breakage of feldspar seems to be overrepresented and that of quartz, in particular, appears to be underrepresented. Even though it cannot be excluded that there is a bias in the results due to the deviation in the mineral content between this part of the analyzed section and the QMA results, there is another characteristic that has to be considered for the general evaluation of the breakage pattern.
It appears that the shattering in other phases than feldspar is less pronounced. This effect is particularly noticeable with quartz. There are also areas dominated by quartz debris, but those fragments appear to be larger and less crushed, than in areas with shattered feldspar (Figure 7b). This finding is supported by the significantly reduced proportion of measurable intragranular feldspar cracks if structures smaller than approximately 1 mm are ignored.
If it is assumed that these differences in the shattering are due to a higher resistance to breakage of quartz compared to feldspar, this would logically cause a lower proportion of intragranular quartz cracks. Although this finding is somewhat in line with the general idea that quartz has a higher strength than feldspar, the results presented here are not considered sufficient for a final assessment of these characteristics since the database is relatively small.

3.2.2. Intergranular Cracks

Regardless of the characteristics of the intragranular breakage pattern, there is also a comparatively small but still significant intergranular breakage of 12.50 % or 16.96 %, if the cracks are filtered out smaller than approximately 1 mm. This implies that at least some of the grain boundaries are preferably chosen by the cracks to propagate. If the existence of grain boundaries would have no effect on the breakage behavior, the crack propagation would be random. In this case, the proportion of intergranular breakage would converge to zero.
This phenomenon can be explained by the difference between the limited set of possible crack paths along grain boundaries and the infinite set of possible crack paths through grains. Considering the two-dimensional case as an example, the grain boundaries and cracks can be seen as slightly contoured lines. The fractal dimensions of such contoured lines are assumed to be slightly larger than one. However, grains in this case are cells with contoured outlines. Those cells have a fractal dimension just below two. For a problem with little-contoured objects, the dimensions of the grain boundaries and cracks are approximately one and the dimension of the grains is approximately two. Such a simple microstructure is schematically shown in Figure 8. For clarity reasons, the boundaries of the grains are simplified drawn with black straight lines.
It can be noted, that the probability for a random crack to propagate exactly oriented along an object of the same dimension like a grain boundary is negligible compared to the probability to propagate through an object of a higher dimension like a grain. This effect is all the more important, as the space for crack propagation is fully filled with grains. This relationship is illustrated by the three red, straight cracks in Figure 8, which were randomly drawn. In no cases do they fall exactly on a grain boundary. Even if the straight cracks would be replaced by more sophisticated structures like polygonal lines with randomly oriented segments, this adjustment would not change the overall outcome.
Considering the above-explained relations, the measured proportion of intergranular cracks is an unambiguous indicator of the existing tendency of the cracks not to propagate completely randomly. It also indicates that the cracks at least partially orient along grain boundaries, if the spatial proximity and the state of stress allow it.
This effect can be seen in an exemplary fashion in Figure 9, where the stress inside the particle bed induced the breakup of significant parts of the microstructure along grain boundaries. Interestingly, right next to the intergranular cracks is an area dominated by intragranular shattering, which shows that the two effects described are not mutually exclusive.
The presented results, especially the measurable intergranular cracks, are seen to be a good basis for the validation of the appropriateness of the synthetic microstructure approach in a more realistic comminution setup like in a confined bed.

4. The Simulated Particle Bed Test

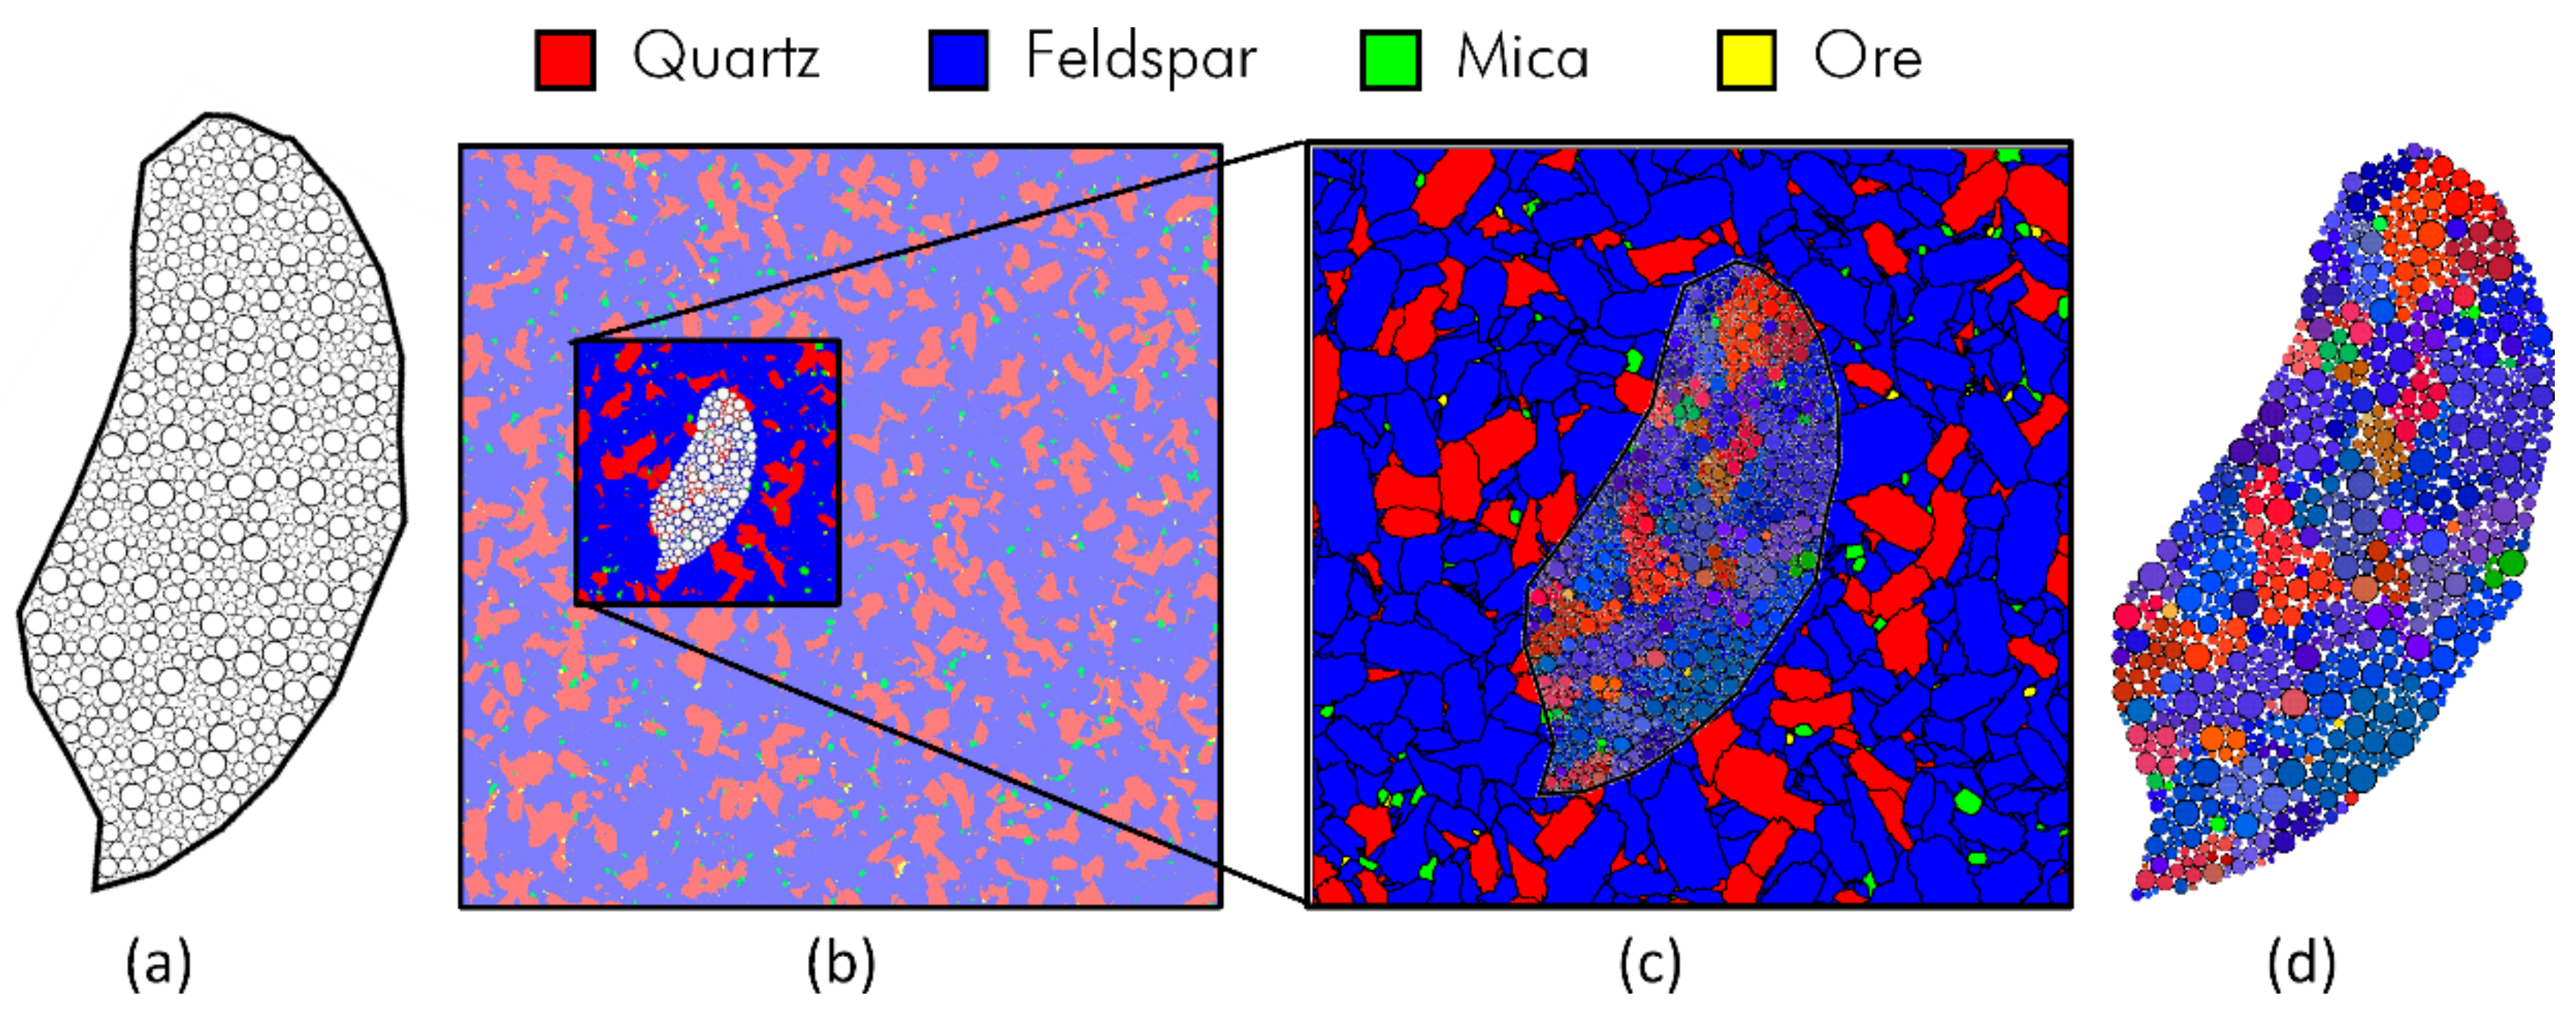
4.1. Synthesizing the Realistic Mineral Microstructure

For applying GBM-DEM to simulate the presented particle bed test with realistic microstructures of the particles, a realistic synthetic sample microstructure must first be simulated. This synthesis process is based on the data of the QMA of the granite presented in Table 1. More details of the simulation of the synthetic microstructure of the used granite are described elsewhere [27].

4.2. Principle of Mapping the Microstructure to Particles

After simulating the microstructure, it has to be mapped to particles in a DEM simulation. In order to make practical use of the grain-based simulation approach, realistic particle shapes have to be used as templates for the simulated particles. For this task, Imaging Particle Analysis (IPA) of the original particle fraction is seen to be a suitable basis.
We analyzed a representative sample of 670 granite particles with a computerized particle analyzer HAVER CPA 4-2. This machine uses dynamic imaging particle analysis for measuring the size and shape characteristics of bulk goods in the size range of approximately 34 µm to 90 mm [36]. According to the principle of this analytical method, it is possible to analyze shadow images of single particles. Due to the two-dimensional measuring principle, these silhouettes are already planar approximations of the spatial contoured particles. Hence, these images are seen to be a suitable basis for deriving the particle shape for the two-dimensional simulation to be filled by discrete element packings.
The corresponding procedure for using the measuring results from the IPA is shown for one particle in Figure 10. In the beginning, the single shadow image has to be exported from the HAVER CPA software. Subsequently, the actual bitmap silhouette in this image is cropped and traced to a path using image processing methods. The resulting Bézier spline is then reduced to a simple polygonal path. The vertices, in turn, are used as input for the packing process, which is done with the GenGeo library [37].
With this approach, we created packings of 67 individual particles with two resolutions. For simulations of the whole particle bed, we used a diameter range of 1 mm to 5 mm. In addition, packings with significantly smaller discrete elements ranging between 0.1 mm to 0.5 mm were created for comparative simulations with a higher resolution of the grains.
In the next step, the synthetic simulated granite microstructure is used as a template for the mapping process into the final DEM environment, where the particle bed test shall be simulated. For this purpose, we used the open-source framework YADE [28]. The general procedure for creating grain-based particles is shown for a single particle in Figure 11.
First, the particle with the raw discrete elements packing is placed randomly on the microstructure. Then, the material of each discrete element is assigned according to the grains that are located in the respective positions in the microstructure. The resulting particle with the individual grain microstructure can then be further parametrized.

4.3. The Material Model

The generated grain-based particles were then parameterized. However, due to the difficulty in determining the physical properties of the individual microstructural components, an integral material model for the granite equal to the previous study [27] was used. In detail, we applied a cohesive frictional material model, which can be used to create breakable bondings between discrete elements (Table 3). The parameters used can be considered substitutes for future improvements in the parametrization since they model the granite-like a generalized abstract hard rock. If the knowledge on microphysical characteristics is more profound, realistic properties can be assigned to all individual mineral phases and grain boundary types in the simulation.
In the presented model, the differences between the properties of inter- and intragranular bondings are considered via a grain boundary factor zBoundary. For this parameter, values in the range of 0.6 to 1.4 were applied for intergranular bondings, while 1.0 was applied for all intragranular bondings. Thus, this factor allows to selectively strengthen or weaken all bondings, which belong to grain boundaries, while the remaining bondings, which represent contacts between discrete elements inside grains, are unaffected. For this purpose, the normal and shear strengths of the bondings are multiplied by zBoundary. These simplifications allow studying the influence of the grain boundary strength although the actual microphysical parameters of the model are estimated only. This grain boundary factor approach is comparable to the approach of Bewick et al. [38], who manually assigned separate strengths to grain boundaries and each mineral.
The authors are aware that this approach is not suitable for simulating a realistic loading behavior of the granite. This would require realistic material parameters for modeling the granite in grain-based DEM. Therefore, the usual approach to compare the force-displacement data or the energy consumption is not possible here. Such an evaluation approach would also be limited by the two-dimensionality of the simulation, which makes quantitative comparison of measured data with the real spatial setup difficult. However, since the focus of this study was to demonstrate the general applicability of the grain-based modeling approach with realistic geometric microstructures, this is considered a justifiable limitation. The evaluation and comparison of the breakage pattern, in particular, the proportion of inter- and intragranular cracks is regarded as a suitable basis for assessing the proposed approach.

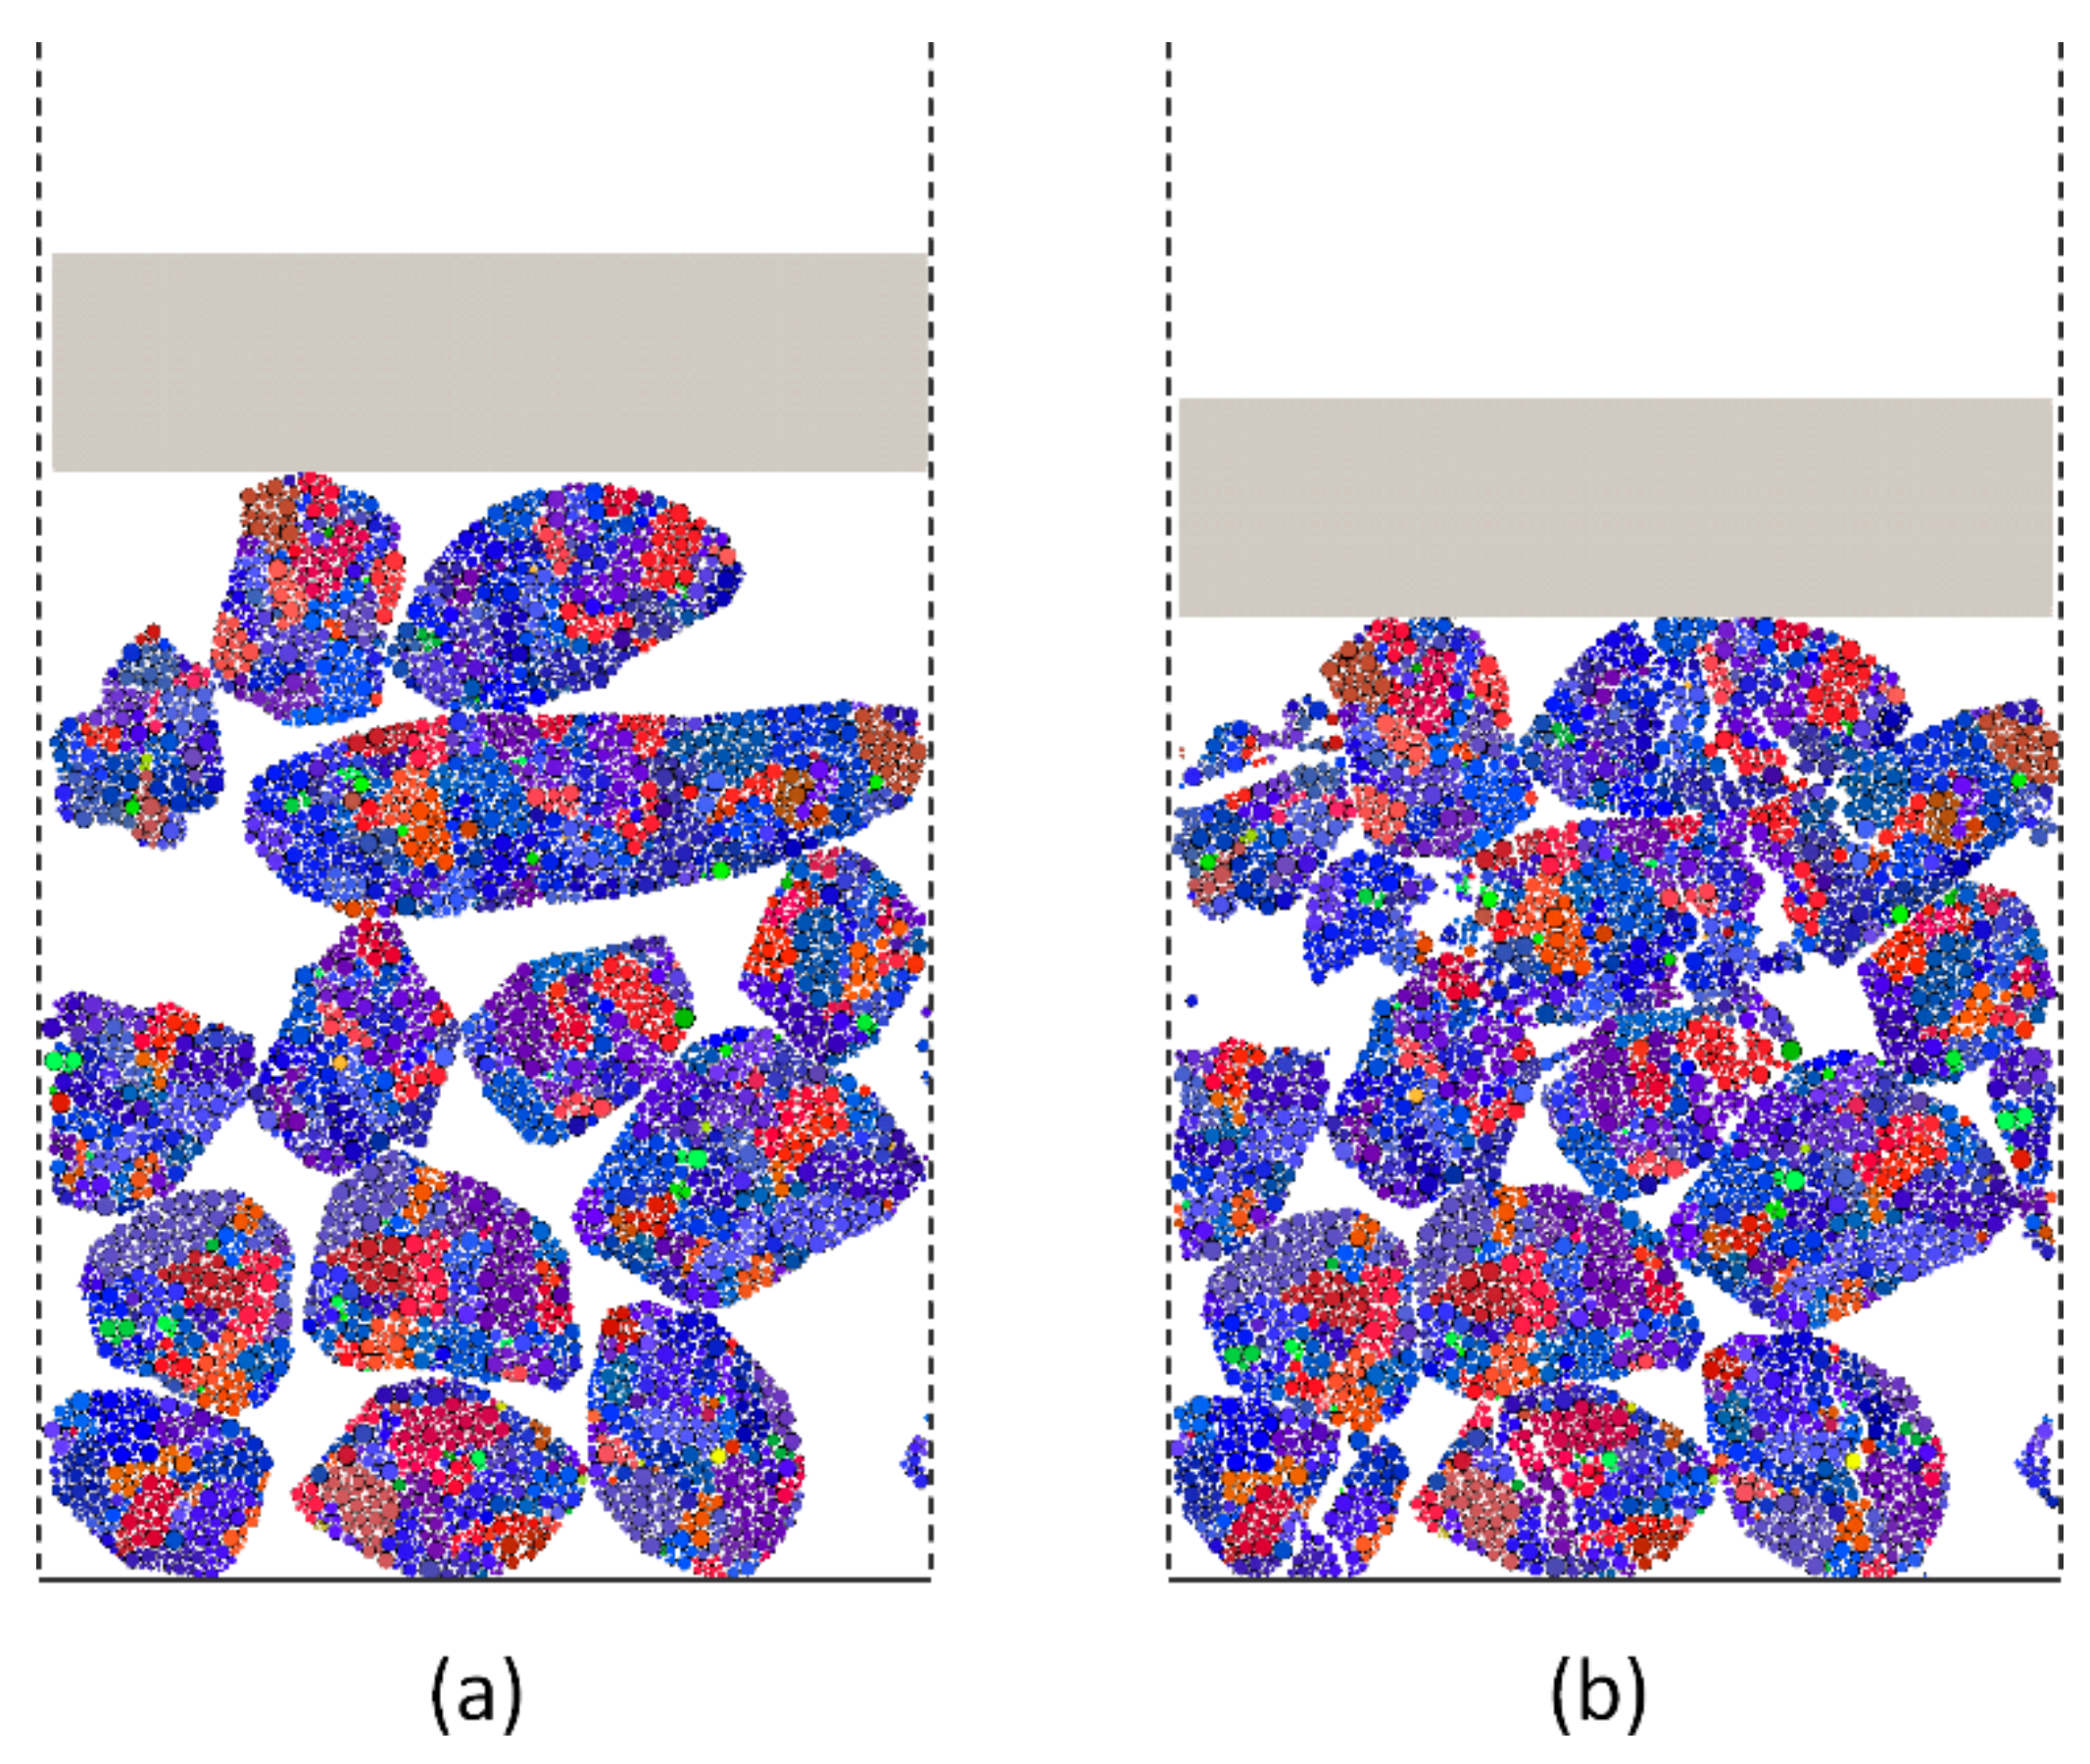
4.4. Setup and Procedure of the Particle Bed Test Simulation in YADE

In order to make the simulation setup comparable to the real one, all dimensions must match. However, since our synthetic microstructure is two-dimensional, this restriction also applies to our simulation. Hence, we set up the pot as a rigid group of planar, open-top facets with a width of 160 mm and a height of 100 mm. This simulation represents a two-dimensional central section of the actual spatial setup. The corresponding piston is a movable facet that exactly fits into the top opening of the pot. Based on this setup, it is possible to simulate the particle bed comminution of the grain-based particles.
At the beginning of each simulation, a random sample of the grain-based particles is placed inside the pot, which has an equal bed height as in the real test. The piston in the simulation is affected to get the same compression as in the real test. For this reason, the relative stroke is used as a comparative value, which is approximately 42% for the test with 20 MPa. This parameter is calculated as the fraction of the final stroke of the piston at the end of the test relative to the initial packing height.
Since the models used in YADE are focused on a reliable approximation of real physics and not optimized for high computation speeds, the simulation of the whole particle bed was done with a relatively low resolution of 1 mm to 5 mm for the discrete elements first. With this setup, single grains inside the particles are represented by 1 to 5 discrete elements, which is quite coarse. This setup is shown in Figure 12.
A more detailed simulation setup was then applied using a periodic boundary in the horizontal axis. With this periodic boundary, the particles are allowed to leave the process space in the simulation at a side and simultaneously enter it again at the other side, without being physically affected [39]. Actually, these “beamed” particles behave as if there was no boundary at all.
The idea is to simulate the center of the particle bed, where the wall effects on the mechanics of the process are negligible as defined for the ideal particle bed by Schönert [1]. The simulation of such a section, however, can be done with a significantly higher resolution of the discrete elements, which ranges from 0.1 mm to 0.5 mm, ensuring that most of the grains are simulated by at least 10 to 20 discrete elements. We found that simulating a quarter of the original setup, which is a pot width of 40 mm, allows stable simulations of confined bed comminution (Figure 13).
In consequence, this artifice enables us to simulate the particle bed with a significantly smaller number of particles and still retain the particle bed character. The authors admit that the results of the two simulation setups can only be compared to a limited extent due to the differences in the process mechanics. However, this limitation is seen to be justifiable since the aim of this study is not to exactly simulate the breakage behavior of a certain granite in confined bed comminution but to show how grain-based DEM representing a realistic microstructure can be used for this purpose in principle.

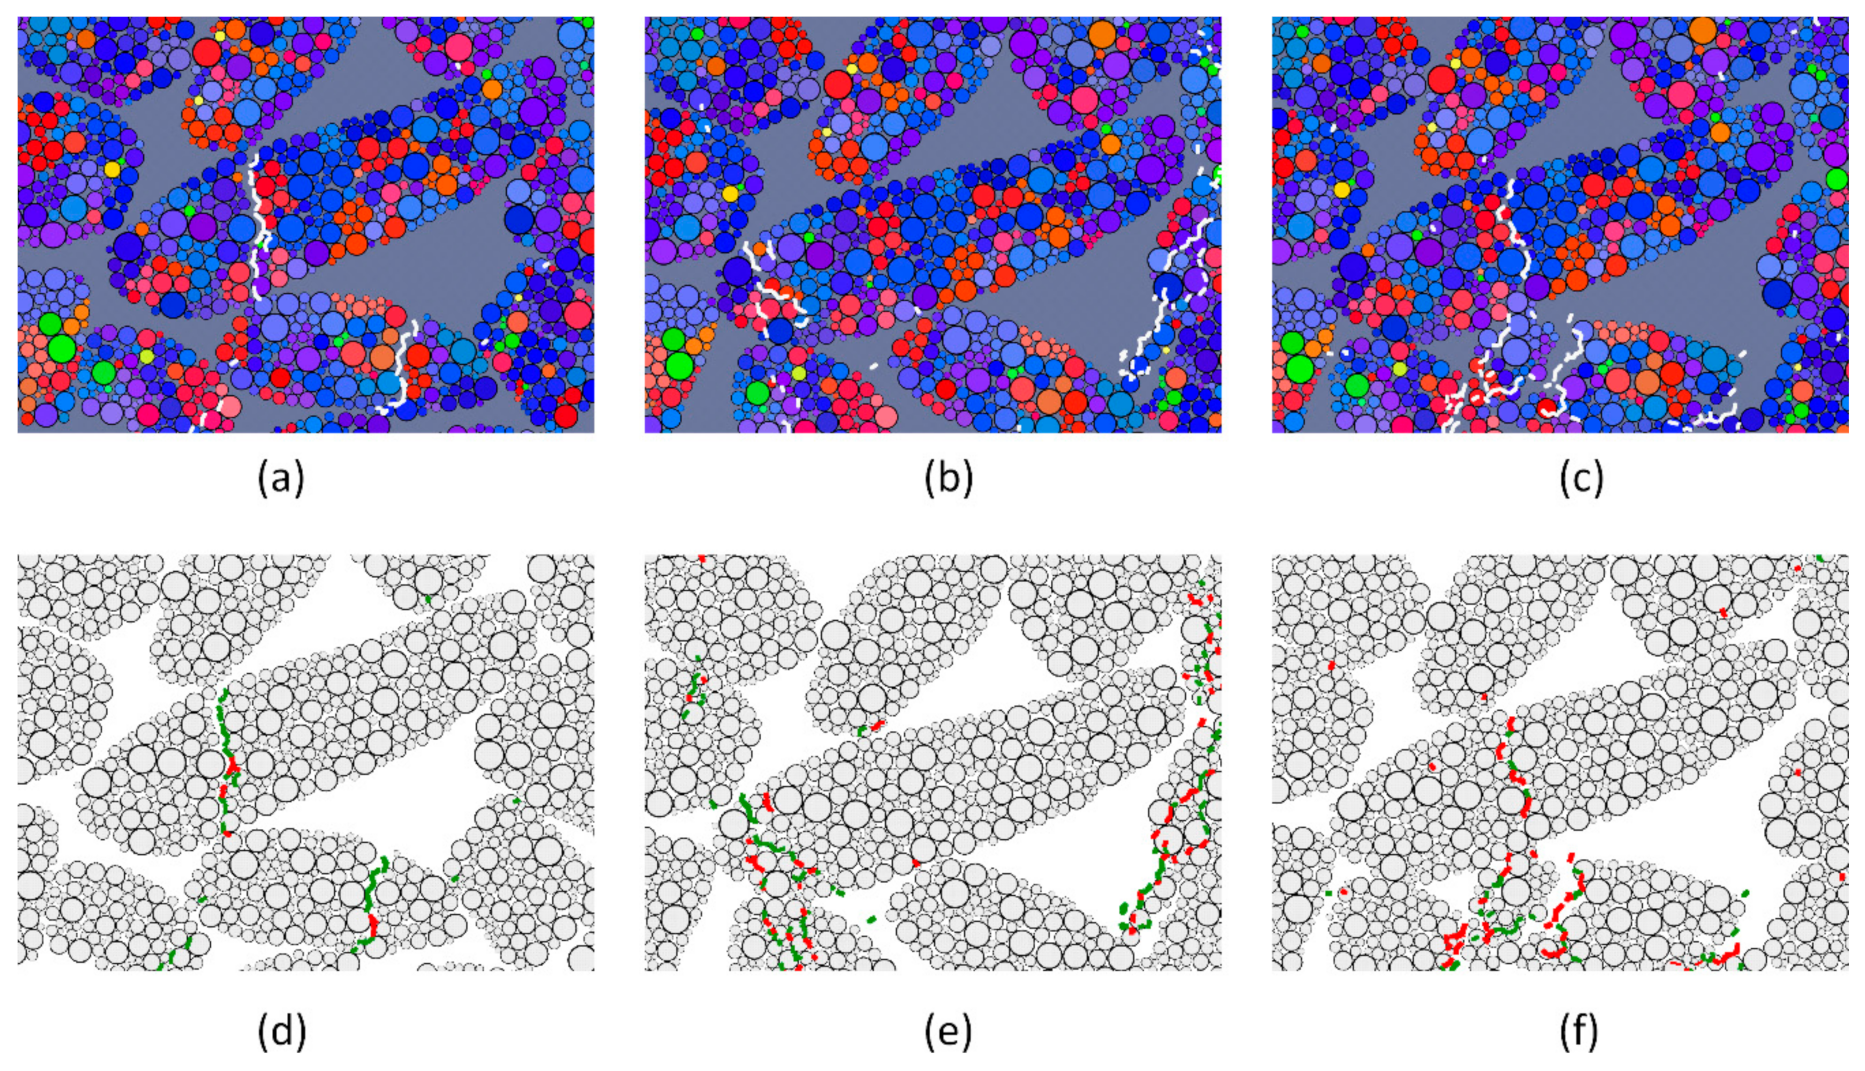
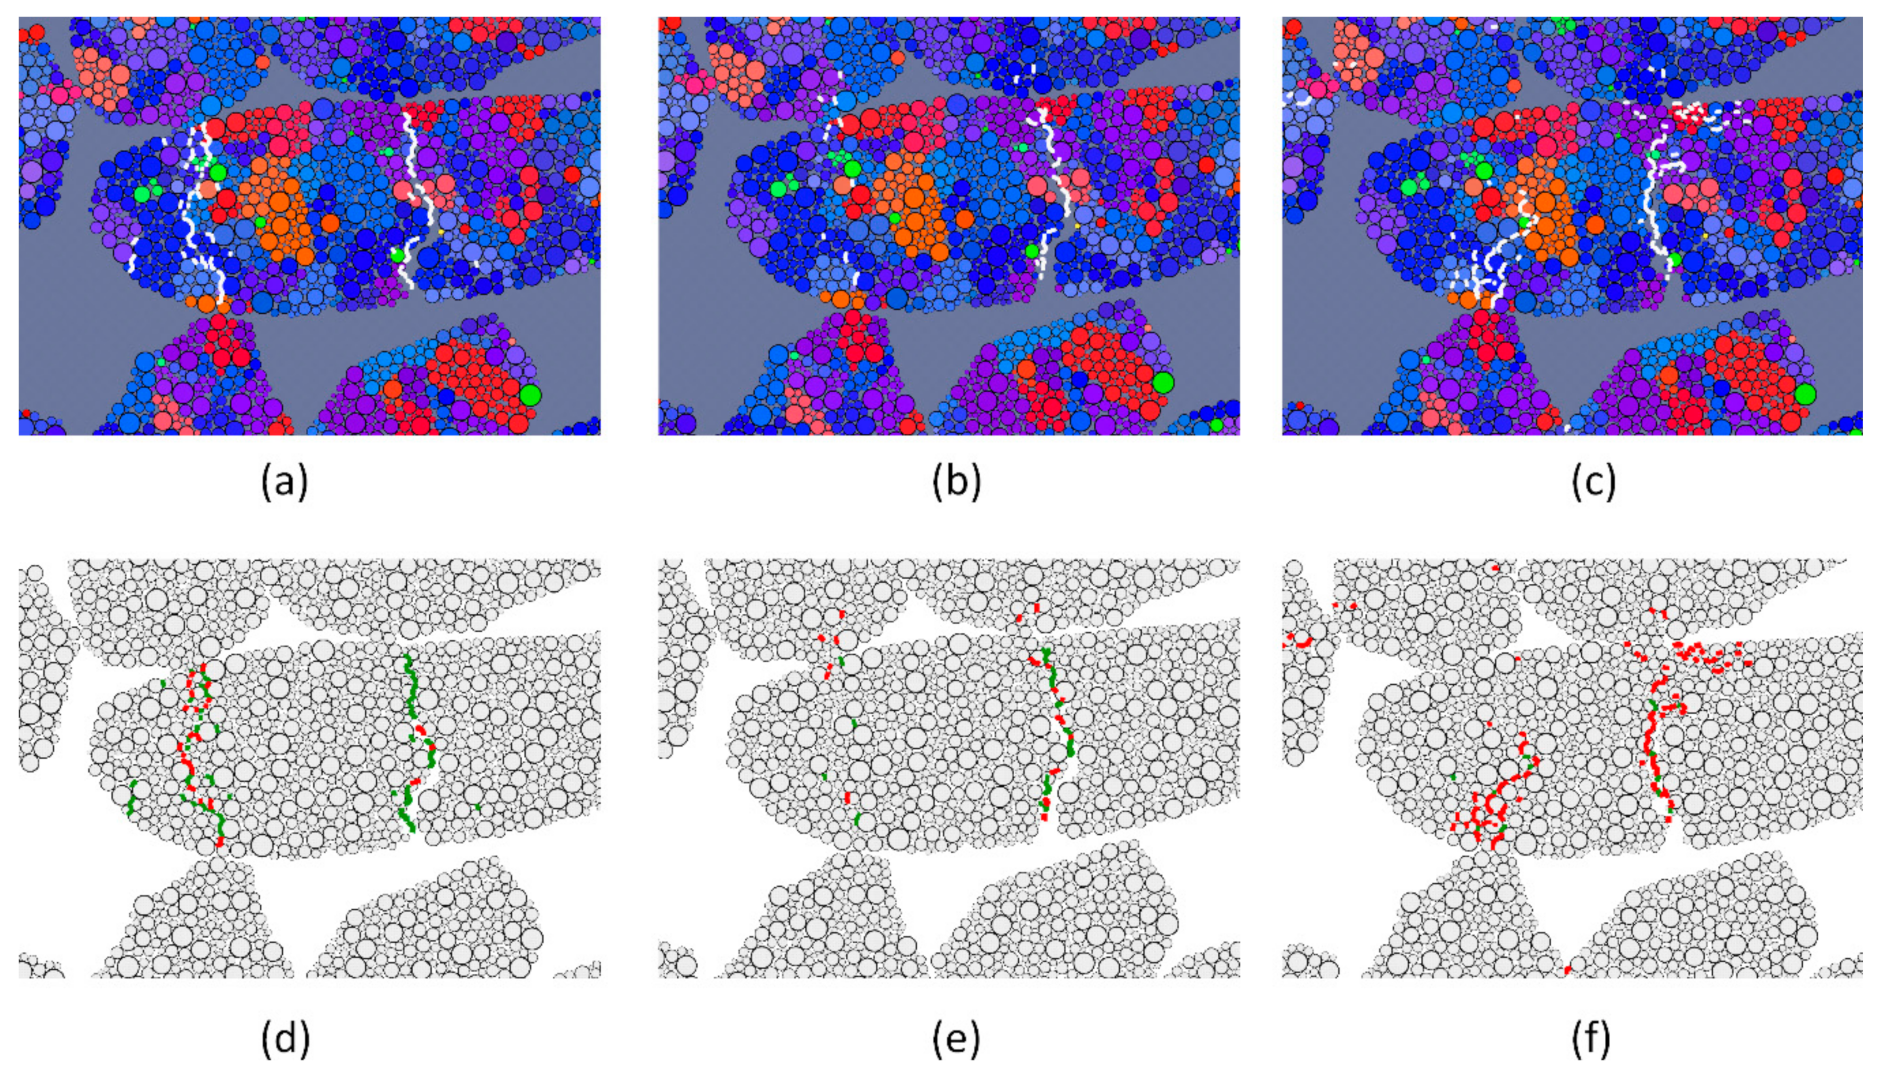
4.5. Evaluation of the Breakage Pattern in the Simulated Particle Bed Test

As the particle bed comminution progresses, distinguishing between individual cracks in the simulation becomes more difficult. Because of this limitation of the visual evaluation of the breakage pattern of the simulations, it is useful to analyze the particle bed at an early stage of the particle bed comminution. In this state, the broken bondings and the influence of the microstructure are still clearly visible.
For reasons of clarity, this evaluation process is shown at image sections of relatively large particles in both simulation setups (Figure 14 and Figure 15). The images show the effect of varying the grain boundary factor on the breakage at low and high resolution and were taken just after the large particle in the center cracked. Depending on the parameters, this happened at slightly different points in time. For reasons of clarity, the scenes of the broken particles are presented in two modes each. In the top image, the focus is on the mineral microstructure and its influence on the breakage pattern. To increase the contrast of these images, the background is colored gray, while the broken bondings are marked by white lines. The respective images below, show the same scenes, however, here the microstructure is faded out so that the crack types can be differentiated by color. For this purpose, intergranular cracks are marked by green lines and intragranular cracks are marked by red lines.
By comparing the images of the simulations with different grain boundary factors, it can be seen that the mineral microstructure has a major influence on the breakage pattern. The amount of intergranular cracks (green lines) is significantly higher at the examples with a low grain boundary factor (zBoundary = 0.6 in Figure 14a,d and Figure 15a,d). This effect occurs due to preferentially breakage along weakened structures in the simulated particle beds. This is not the case if particles with homogeneous physical properties are stressed (zBoundary = 1.0). As can be seen in Figure 14b,e and Figure 15b,e, the cracks are more random in this case. The examples in Figure 14c,f and Figure 15c,f suggest that the cracks avoid propagating along grain boundaries if those are strengthened (zBoundary = 1.4). Hence, intragranular cracks (red lines) are more dominant in this scenario.
These qualitative findings are supported by the quantitative evaluation of the data of all broken boundaries after the end of the simulations. For this reason, Table 4 shows the proportions of intergranular cracks for both simulation setups. This parameter represents the intergranular breakage as a function of the different grain boundary factors. The seven independent simulations of both setups were done with an identical particle bed structure at the beginning in order to ensure high comparability. It is noted that for the results of the simulations no distinction between small cracks is made. A crack in the simulation is just a broken bonding between two discrete elements. Therefore, the measurable resolution of the cracks is already limited by the resolution of the discrete elements. Hence, the limit for crack resolution for the whole particle bed is about 1 mm to 5 mm and the crack resolution for the detailed section is about 0.1 mm to 0.5 mm.
As can be seen, lowering the grain boundary strength (zBoundary < 1.0) increases the proportion of intergranular breakage. In contrast, if homogeneous material with no physical differences between the bondings is simulated (zBoundary = 1.0), the proportion of intragranular breakage converges to the proportion of intergranular breakage, which is 61.53 % for the simulation of the whole particle bed and 37.70 % for the more detailed simulation. In turn, if the grain boundaries are strengthened (zBoundary > 1.0), the proportion of intergranular breakage decreases further.
Despite the influence of the grain boundary strength, there is also an effect of the resolution of the discrete elements to be monitored. This size effect, however, can also be explained by the different proportions of intergranular bondings of the initial packing. The resolutions are also seen to be the main reason why the simulated amount of intergranular breakage is significantly higher than the result of the corresponding real particle bed test. It can be assumed that the discrete element size is still not sufficient to simulate the real breakage pattern (intergranular breakage = 16.96 %) with the required level of detail, even if the very filigree shattered crack structures of the real sample are ignored (intergranular breakage = 12.50 %). At the same time, these results clearly show that numerical modeling of macroscopic comminution processes of heterogeneous materials such as rocks remains a challenge.
Finally, note that comparing the real and the simulated breakage patterns based on the general proportions of inter- and intragranular cracks is only a basic approach. More detailed measurement methods are well-established tools of stochastic geometry. This can be the stereological evaluation of the specific surface area of the cracks SV or its two-dimensional pendant the specific line length LA of the cracks as well as the comparison of the fractal dimension of the real and the simulated crack structures [40]. However, to apply such approaches successfully, it is required that the discrete elements of the simulations are sufficiently small compared to the crack structures and that the resolution effect is negligible low. With the resolutions used in the simulations presented here, the results would still be dominated by the influence of the discrete element sizes, so that no additional information would be generated.

5. Conclusions

Based on the results, it can be concluded that the synthetic microstructure approach can be applied in more realistic comminution environments like particle bed comminution in principle. It is shown that it is possible to transfer a realistic synthetic microstructure to a particle filling, which is later stressed in a simplified two-dimensional DEM simulation with YADE in particle bed mode. Furthermore, the results show that the grain boundary approach can successfully be used to simulate preferential breakage along grain boundaries in such setups. However, the comparison of the simulation and the real experiment also demonstrates important limitations.
First, there are discrepancies in the particle bed characteristics of the real and the simulated experiments. Due to the restriction to two-dimensional microstructures, it is not possible to create a three-dimensional simulation, which fits exactly to the real spatial particle bed experiment. Hence, a comparison of both on a quantitative level is possible only to a limited extent.
Despite this limitation, it is shown that the resolution of the discrete elements is crucial for a detailed comparison. With the two simulation setups, it is possible to simulate the preferential breakage along grain boundaries as their strengths are reduced using the grain boundary factor zBoundary. However, due to the resolution restrictions, it is not possible to simulate the observed proportion of grain boundary breakage in the real experiment, nor to simulate the shattering of grains beyond a doubt. For doing so, the scale of the discrete elements has to be further decreased, which, however, increases the computation effort.
However, it should also be noted that it was not the intention of this study to present an exact simulation of an arbitrary realistic comminution example, but to prove the principal applicability of the synthetic microstructure approach. The reader should be aware of the fact that both limitations can be overcome if necessary. The resolution of the discrete elements could simply be further increased without any more changes. Admittedly, in this case, one should keep in mind the computational effort for such an approach.
In order to match the dimensionality of the simulated and the real experiments, the synthetic microstructure approach has to be transferred to the third dimension. This has not been done yet but should be the focus of further research.

Author Contributions

Conceptualization, M.K. and H.L.; methodology, M.K.; software, M.K.; validation, M.K.; formal analysis, M.K.; investigation, M.K.; resources, M.K.; data curation, M.K.; writing—original draft preparation, M.K.; writing—review and editing, H.L.; visualization, M.K.; supervision, H.L.; project administration, H.L.; funding acquisition, M.K. and H.L. All authors have read and agreed to the published version of the manuscript.

Funding

This study was funded by the Deutsche Forschungsgemeinschaft (DFG, German Research Foundation); grant number 320596194.

Acknowledgments

We would like to thank Thomas Frühwirt of the Institute of Geotechnics, TU Bergakademie Freiberg for doing the rock mechanics tests and three anonymous reviewers for helpful comments.

Conflicts of Interest

The authors declare no conflict of interest.

References

  1. Schönert, K. Method of Fine and very Fine Comminution of Materials Having Brittle Behavior. U.S. Patent 06/152,540, 23 May 1980. [Google Scholar]
  2. Schönert, K. A first survey of grinding with high-compression roller mills. Int. J. Miner. Process. 1988, 22, 401–412. [Google Scholar] [CrossRef]
  3. Tsoungui, O.; Vallet, D.; Charmet, J.-C. Numerical model of crushing of grains inside two-dimensional granular materials. Powder Technol. 1999, 105, 190–198. [Google Scholar] [CrossRef]
  4. Djordjevic, N.; Morrison, R. Exploratory modelling of grinding pressure within a compressed particle bed. Miner. Eng. 2006, 19, 995–1004. [Google Scholar] [CrossRef]
  5. Khanal, M.; Schubert, W.; Tomas, J. Discrete element method simulation of bed comminution. Miner. Eng. 2007, 20, 179–187. [Google Scholar] [CrossRef]
  6. Jiménez-Herrera, N.; Barrios, G.K.; Tavares, L.M. Comparison of breakage models in DEM in simulating impact on particle beds. Adv. Powder Technol. 2018, 29, 692–706. [Google Scholar] [CrossRef]
  7. Barrios, G.K.; Jiménez-Herrera, N.; Tavares, L.M. Simulation of particle bed breakage by slow compression and impact using a DEM particle replacement model. Adv. Powder Technol. 2020, 31, 2749–2758. [Google Scholar] [CrossRef]
  8. Tavares, L.M.; André, F.P.; Potapov, A.; Maliska, C. Adapting a breakage model to discrete elements using polyhedral particles. Powder Technol. 2020, 362, 208–220. [Google Scholar] [CrossRef]
  9. Herbst, J.A.; Mular, M.A.; Pate, W.T.; Qui, X. Detailed modeling of an HPGR/HRC for prediction of plant scale unit performance. In Proceedings of the SAG2011 Conference, Vancouver, BC, Canada, 25–28 September 2011. [Google Scholar]
  10. Gladky, A. Numerische Untersuchung der Beanspruchung in Gutbettwalzenmühlen mit Idealisierten Materialien. Ph.D. Thesis, Technische Universität Bergakademie Freiberg, Freiberg, Germany, 2019. [Google Scholar]
  11. Barrios, G.K.; Tavares, L.M. A preliminary model of high pressure roll grinding using the discrete element method and multi-body dynamics coupling. Int. J. Miner. Process. 2016, 156, 32–42. [Google Scholar] [CrossRef]
  12. Nagata, Y.; Tsunazawa, Y.; Tsukada, K.; Yaguchi, Y.; Ebisu, Y.; Mitsuhashi, K.; Tokoro, C. Effect of the roll stud diameter on the capacity of a high-pressure grinding roll using the discrete element method. Miner. Eng. 2020, 154, 106412. [Google Scholar] [CrossRef]
  13. Ghazvinian, E.; Diederichs, M.S.; Quey, R. 3D random Voronoi grain-based models for simulation of brittle rock damage and fabric-guided micro-fracturing. J. Rock Mech. Geotech. Eng. 2014, 6, 506–521. [Google Scholar] [CrossRef] [Green Version]
  14. Hofmann, H.; Babadagli, T.; Zimmermann, G. A grain based modeling study of fracture branching during compression tests in granites. Int. J. Rock Mech. Min. Sci. 2015, 77, 152–162. [Google Scholar] [CrossRef]
  15. Li, X.F.; Li, H.B.; Zhao, J. 3D polycrystalline discrete element method (3PDEM) for simulation of crack initiation and propagation in granular rock. Comput. Geotech. 2017, 90, 96–112. [Google Scholar] [CrossRef]
  16. Wang, X.; Cai, M. Modeling of brittle rock failure considering inter- and intra-grain contact failures. Comput. Geotech. 2018, 101, 224–244. [Google Scholar] [CrossRef]
  17. Fu, T.-F.; Xu, T.; Heap, M.J.; Meredith, P.G.; Mitchell, T.M. Mesoscopic time-dependent behavior of rocks based on three-dimensional discrete element grain-based model. Comput. Geotech. 2020, 121, 103472. [Google Scholar] [CrossRef]
  18. Li, H.; Ma, H.; Shi, X.; Zhou, J.; Zhang, H.; Daemen, J.J.K. A 3D Grain-Based Model for Simulating the Micromechanical Behavior of Salt Rock. Rock Mech. Rock Eng. 2020, 53, 2819–2837. [Google Scholar] [CrossRef]
  19. Li, X.F.; Li, H.B.; Liu, L.W.; Liu, Y.Q.; Ju, M.H.; Zhao, J. Investigating the crack initiation and propagation mechanism in brittle rocks using grain-based finite-discrete element method. Int. J. Rock Mech. Min. Sci. 2020, 127, 104219. [Google Scholar] [CrossRef]
  20. Li, X.F.; Zhang, Q.B.; Li, H.B.; Zhao, J. Grain-Based Discrete Element Method (GB-DEM) Modelling of Multi-scale Fracturing in Rocks Under Dynamic Loading. Rock Mech. Rock Eng. 2018, 51, 3785–3817. [Google Scholar] [CrossRef]
  21. Li, J.; Konietzky, H.; Frühwirt, T. Voronoi-Based DEM Simulation Approach for Sandstone Considering Grain Structure and Pore Size. Rock Mech. Rock Eng. 2017, 50, 2749–2761. [Google Scholar] [CrossRef]
  22. Tan, X.; Konietzky, H.; Chen, W. Numerical Simulation of Heterogeneous Rock Using Discrete Element Model Based on Digital Image Processing. Rock Mech. Rock Eng. 2016, 49, 4957–4964. [Google Scholar] [CrossRef]
  23. Gao, F.; Stead, D.; Elmo, D. Numerical simulation of microstructure of brittle rock using a grain-breakable distinct element grain-based model. Comput. Geotech. 2016, 78, 203–217. [Google Scholar] [CrossRef]
  24. Popov, O.; Lieberwirth, H.; Folgner, T. Properties and system parameters—Quantitative characterization of rock to predict the influence of the rock on relevant product properties and system parameters—Part 1: Application of quantitative microstructural analysis. AT Miner. Process. 2014, 55, 76–88. [Google Scholar]
  25. Popov, O.; Lieberwirth, H.; Folgner, T. Properties and system parameters—Quantitative characterization of rock to predict the influence of the rock on relevant product properties and system parameters—Part 2: Selected examples. AT Miner. Process. 2014, 55, 54–63. [Google Scholar]
  26. Unland, G.; Raaz, V. Formale Charakterisierung der Gesteine—ein Beitrag aus Sicht des Maschinenbaus. Z. Für Geol. Wiss. 1998, 26, 315–328. [Google Scholar]
  27. Klichowicz, M.; Frühwirt, T.; Lieberwirth, H. New experimental setup for the validation of DEM simulation of brittle crack propagation at grain size level. Miner. Eng. 2018, 128, 312–323. [Google Scholar] [CrossRef]
  28. Smilauer, V.; Catalano, E.; Chareyre, B.; Dorofeenko, S.; Duriez, J.; Dyck, N.; Elias, J.; Er, B.; Eulitz, A.; Gladky, A.; et al. The Yade Project; ZENODO: Genève, Switzerland, 2015. [Google Scholar] [CrossRef]
  29. DIN EN 1926:2006. Prüfverfahren für Naturstein—Bestimmung der Einachsigen Druckfestigkeit; Beuth Verlag GmbH: Berlin, Germany, 2007. [Google Scholar]
  30. Ulusay, R. The ISRM Suggested Methods for Rock Characterization, Testing and Monitoring. 2007–2014; Springer/International Society for Rock Mechanics: Cham, Switzerland, 2015; ISBN 978-3-319-07712-3. [Google Scholar]
  31. Popov, O.; Talovina, I.; Lieberwirth, H.; Duryagina, A. Quantitative Microstructural Analysis and X-Ray Computed Tomography of Ores and Rocks-Comparison of Results. Minerals 2020, 10, 129. [Google Scholar] [CrossRef] [Green Version]
  32. Fuerstenau, D.W.; Gutsche, O.; Kapur, P.C. Confined particle bed comminution under compressive loads. Int. J. Miner. Process. 1996, 44–45, 521–537. [Google Scholar] [CrossRef]
  33. Mütze, T. Geschwindigkeitseinfluss bei der Druckbeanspruchung von Gutbetten. Ph.D. Thesis, Technischen Universität Bergakademie Freiberg, Freiberg, Germany, 2011. [Google Scholar]
  34. Abouzeid, A.Z.; Seifelnassr, A.A.; Zain, G.; Mustafa, Y.S. Breakage Behavior of Quartz Under Compression in a Piston Die. Min. Metall. Explor. 2019, 36, 173–180. [Google Scholar] [CrossRef]
  35. Schwechten, D. Trocken-und Naßmahlung spröder Materialien in der Gutbett-Walzenmühle. Ph.D. Thesis, TU Clausthal, Clausthal-Zellerfeld, Germany, 1987. [Google Scholar]
  36. Haver & Boecker GmbH. Haver CpaServ Professional/Expert—Manual. Release V2.0.2; Haver & Boecker GmbH: Oelde, Germany, 2016. [Google Scholar]
  37. GenGeo. Version 1.4. Available online: http://launchpad.net/esys-particle/gengeo (accessed on 20 November 2020).
  38. Bewick, R.P.; Kaiser, P.K.; Bawden, W.F. DEM Simulation of Direct Shear: 2. Grain Boundary and Mineral Grain Strength Component Influence on Shear Rupture. Rock Mech. Rock Eng. 2014, 47, 1673–1692. [Google Scholar] [CrossRef]
  39. Yang, W.; Zhou, Z.; Pinson, D.; Yu, A. Periodic Boundary Conditions for Discrete Element Method Simulation of Particle Flow in Cylindrical Vessels. Ind. Eng. Chem. Res. 2014, 53, 8245–8256. [Google Scholar] [CrossRef]
  40. Chiu, S.N.; Stoyan, D.; Kendall, W.S.; Mecke, J. Stochastic Geometry and Its Applications; Wiley: Chichester, UK, 2013. [Google Scholar]
Figure 1. Schema for parallel real particle bed comminution and simulation in a piston die setup.
Minerals 11 00306 g001
Figure 2. Experimental setup of the particle bed test in a schematic sectional view.
Minerals 11 00306 g002
Figure 3. Schema of the experimental procedure and subsequent specimen preparation of the real particle test: (a) Setup of the particle bed test; (b) Particles break inside the particle bed; (c) Press product after removing the pot; (d) Press product is grouted with resin; (e) Slice of the center of the grouted sample; (f) Thin section of the center of the grouted sample.
Minerals 11 00306 g003
Figure 4. Material from the real particle bed test: (a) Raw granite particles of size range 8 to 12.5 mm; (b) Product directly after the particle bed test with 20 MPa just before further preparation; (c) Section through the center of the fixed specimen of the prepared particle bed.
Minerals 11 00306 g004
Figure 5. Details of the fixed particle bed: (a) Center section before thin section preparation; (b) Digitized part of the thin section; (c) Detailed view on inter- and intragranular cracks through the particles. Note that images (b) and (c) show the thin section under polarized light.
Minerals 11 00306 g005
Figure 6. Thin section of the grouted particle bed under polarized light with analysis raster: Cracks are marked by colors according to the involved mineral phases. Cracks smaller than 1 mm are not marked in this view for clarity reasons.
Minerals 11 00306 g006
Figure 7. Areas with shattered minerals after the particle bed comminution: (a) Fragments of fine shattered feldspar; (b) Fragments of coarser shattered quartz. The quartz fragments are in the center of the image and can be identified by their less textured and more bright bluish appearance.
Minerals 11 00306 g007
Figure 8. Schema of random cracks in a two-dimensional microstructure. Grain boundaries are simplified drawn with black straight lines. Random straight cracks are drawn with dashed red lines.
Minerals 11 00306 g008
Figure 9. Area with recognizable grain boundary breakages: (a) Original view on the fractured microstructure; (b) View with highlighted cracks.
Minerals 11 00306 g009
Figure 10. Procedure of creating a packing of discrete elements inside an outlining polygon of a shadow image of a real particle: (a) Shadow image of a real particle exported from the HAVER CPA; (b) Outlining Bézier spline generated with image processing methods; (c) Polygonalized outline; (d) Final packing of discrete elements in the range of 0.1 mm to 0.5 mm inside the polygonal outline.
Minerals 11 00306 g010
Figure 11. Procedure for mapping a microstructure onto a packing inside a polygonal particle in false-color mode: (a) Initial packing of discrete elements (0.1 to 0.5 mm) in the shape of a particle; (b) Random superimposition of the microstructure and the initial packing; (c) Actual mapping of the microstructural information onto the individual discrete elements of the packing; (d) Final particle with realistic shape and microstructure in YADE. For better demarcation, grains of the same material are painted in variations of the paired base color.
Minerals 11 00306 g011
Figure 12. Setup of the whole particle bed test in YADE: Configuration at the beginning of the test (a) and during the particle bed comminution (b).
Minerals 11 00306 g012
Figure 13. Setup of the detailed section of the particle bed test with periodic boundaries in YADE. The periodic boundaries are indicated by the dashed vertical lines: Configuration at the beginning of test (a) and during the particle bed comminution (b).
Minerals 11 00306 g013
Figure 14. Image sections of the simulations with low resolution showing the effect of the grain boundary factor zBoundary on the breakage pattern: zBoundary = 0.6 (a,d); zBoundary factor = 1.0 (b,e); zBoundary = 1.4 (c,f). The images in the first row (ac) show the influence of the mineral microstructure on the breakage pattern (white lines). In the images of the second row (df) the focus is on the crack type (green lines: intergranular cracks; red lines: intragranular cracks).
Minerals 11 00306 g014
Figure 15. Image sections of the simulations with high resolution showing the effect of the grain boundary factor zBoundary on the breakage pattern: zBoundary = 0.6 (a,d); zBoundary factor = 1.0 (b,e); zBoundary = 1.4 (c,f). The images in the first row (ac) show the influence of the mineral microstructure on the breakage pattern (white lines). In the images of the second row (df) the focus is on the crack type (green lines: intergranular cracks; red lines: intragranular cracks).
Minerals 11 00306 g015
Table 1. Quantitative mineralogical analysis (QMA) results for the granite from Meissen, Saxony [27].
ModePhasesPhase Related CharacteristicsRock Related Characteristics
QuartzFeldsparMica∑ Microbodies
ContentVolumetric portion (%)27703100
FabricTextureSizeMean diameter (mm)3.3071.4830.7801.973
Deviation (-)0.8280.3220.3740.465
Grain surfaceSpecific surface (mm²/mm³)3.2663.1949.7483.434
ShapeElongation (-)1.0531.1431.0881.125
Flatness (-)1.0891.051.0081.067
RoughnessDegree of roughness (%)1583111
StructureOrientationDegree of linear orientation (%)41066
Degree of areal orientation (%)4201
Degree of isotropic orientation (%)92889493
DistributionDegree of clustering (%)3168156
Space fillingDegree of space filling (%)---100
Table 2. Proportions of the various inter- and intragranular cracks in the particle bed of the test with 20 MPa load.
Crack TypeProportion (%)
All>1 mm
Intergranular cracks12.5016.96
Feldspar-Feldspar9.0512.27
Mica-Mica0.000.00
Quartz-Quartz0.000.00
Mica-Feldspar0.660.92
Mica-Quartz0.000.00
Quartz-Feldspar2.553.52
Intragranular cracks87.5083.04
Feldspar77.6872.85
Quartz8.939.64
Mica0.880.54
Table 3. Parameters for the bonding of two discrete elements of radii R1 and R2.
ParametersSymbolUnitsValues
Grain boundary factor zBoundary-0.6 to 1.4
Young’s modulus E N / m ² 50 × 10 9
Poisson ratio υ 0.25
Normal stiffnesskn N / m ² 2 · E · R 1 · R 2 R 1 · R 2
Shear stiffnessks N / m ² υ · k n
Rolling stiffnesskr N / m ² 2 · k s · R 1 · R 2
Normal strengthσn MPa 22 · z Boundary
Shear strengthσs MPa 22 · z Boundary
Rolling strengthσr MPa
Contact friction angleα rad 0.5
Densityρ kg / m ³ 2700
Table 4. Proportions of intergranular cracks of both simulation setups. The intragranular cracks are not listed since they are complementary to the intergranular cracks. Both crack types sum up to 100% for each simulation.
zBoundary (-)Intergranular Cracks (%)
Whole Particle BedDetailed Section
0.464.3746.83
0.665.0543.36
0.862.8640.37
1.060.6536.60
1.258.9434.73
1.456.8231.77
1.649.0831.09
Publisher’s Note: MDPI stays neutral with regard to jurisdictional claims in published maps and institutional affiliations.

