1. Introduction
In the coal mining industry, respirable coal mine dust (RCMD) is generated during mining operations [
1]. These airborne dust particles are comprised of a respirable fraction (<10 μm), which can be inhaled by miners and deposited in the distal airways and gas-exchange region of the lung. Overexposure to RCMD particles can cause serious health problems, including coal workers’ pneumoconiosis (CWP) [
2]. CWP is a lung disease that can be fatal in its most severe form, and progresses even after exposure is removed. Exposure to an excessive amount of crystalline silica can cause silicosis [
1,
3].
The Federal Coal Mine Health and Safety Act of 1969 established the coal mine dust standard of 2.0 mg/m
3 at the maximum 5% allowable percentage of silica. Recently, the Mine Safety and Health Administration (MSHA) in the United States set a lower respirable dust standard of 1.5 mg/m
3 for underground coal mining operations. Compliance with this standard is monitored through periodic collections of occupational dust samples. The RCMD generated in underground coal mines has many sources, including dust particles generated by coal seams and rocks adjacent to coal seams, rock dust (generally pulverized limestone dust) for the control of explosions in mines [
4], and other dust particles associated with various mining activities. Therefore, RCMD particles can be comprised of various components, such as coal, silica, aluminosilicate, calcite, dolomite, diesel particulate matter, and others [
5]. The compliance-driven approach has led to a significant reduction in incidence of lung disease associated with occupational exposure to RCMD among U.S. coal mine workers. However, since 2000, the number of cases of miners with CWP, and having 25 years or more of exposure, has continued to increase [
6]. Past studies implied that US coal miners are being exposed to excessive amounts of respirable crystalline silica [
3].
Accurate and real-time sampling is essential for compliance, daily safety checks, and dust control optimization. The conventional sampling approach uses a gravimetric-based device that collects the respirable fraction of the coal mine dust particles. This sampling device contains a battery-powered pump, a cyclone that separates the respirable (<10 μm) fraction from the total airborne dust, and a filter cassette that collects the respirable dust particles on filters. The collected filter samples are pre-weighed and post-weighed to obtain the RCMD mass collected over the total sampling period, which can be used to determine a miner’s exposure over the sampling period. Multiple gravimetric samplers might be needed to minimize the measurement errors, and the averaged data is used for reporting purposes. Various post-sampling characterizations have been conducted. For instance, quartz content is regulated by MSHA. To determine quartz content, the collected RCMD samples are heat treated to decompose organic matter and coal, and the residue minerals are analyzed using X-ray diffraction (XRD) [
7,
8]. Scanning electron microscopy (SEM) enables the characterization of individual dust particles on the filters [
9,
10]. Infrared spectroscopy can also be used for quartz analysis. This method measures the absorbance at 800 cm
−1 or 915 cm
−1 for a given sample, and obtains its quartz content by comparison to a calibration curve for standard quartz samples [
11].
A continuous personal dust monitor (CPDM) is a real-time sampler, which was originally developed by NIOSH and approved by MSHA [
12]. In the United States, a CPDM is used for compliance purposes. The CPDM uses a tapered-element oscillating microbalance (TEOM) to obtain a real-time gravimetric-based measure of respirable dust concentration. The CPDM provides coal workers with real-time information on dust concentration in each shift. This information can be used by coal workers to monitor dust exposure, and aid miners’ decision-making in reducing their exposure to RCMD by making appropriate changes to their work activities. It has been found that the results obtained from the CPDM were consistent with those obtained using the conventional gravimetric sampler [
13]. Unfortunately, the dust samples collected using a CPDM cannot be used for quartz and other analyses. Furthermore, the gravimetric data from CPDMs cannot be used to evaluate the source of dust particles in the underground coal mines.
Gathering information on potentially important factors affecting miners’ health will be essential to meet the current regulatory requirements. It was previously shown that the −200 mesh fraction of the dust particles in coal mines in the United States was about 29–37% [
14], and the percentage of nano-sized dust particles in the RCMD collected at the bolter location was over 60% [
5]. A recent study published by NIOSH showed that 10–23% of quartz dust particles were concentrated in the nano-sized fraction of RCMD particles [
15]. Information on particle size and chemical composition of RCMD particles, particularly the nano-sized fraction of RCMD particles, in underground coal mines is essential for developing dust control and mitigation strategies. It has been documented that the nano-sized particles can be more adverse to lung health than micron-sized dust particles [
16]. Herein, we surveyed a number of characterization methods for characterizing both the particle size and chemical composition of RCMD particles. The collected coal dust samples were characterized to determine both the size and composition of individual dust particles using scanning electron microscopy (SEM) and scanning transmission electron microscopy (S-TEM). The particle size distribution (PSD) of the dust particles, particularly the nano-sized fraction of the RCMD particles, was determined using dynamic light scattering (DLS) and asymmetrical flow field-flow fractionation (AsFIFFF).
2. Materials and Experimental Methods
2.1. Sampling
Coal mine dust samples from an underground coal mine were collected using gravimetric dust samplers. Dust samples were taken from a number of locations, such as at the intake, return, bolter, and miner locations. The dust sampler used a 10 mm Dorr-Oliver cyclone to separate the respirable fraction (<10 μm) from the coarse fraction (>10 μm) of the dust particles. The respirable fraction was deposited on a filter, while the coarse fraction was collected at the bottom of the cyclone. The cyclone pump operated at an air flow rate of 2 L per minute. Various filters were used, including 0.8 μm polycarbonate (PC) filters, 0.8 μm silver filters, and 5 μm PVC filters. To retain the RCMD particles, particularly the nano-sized fraction of the RCMD particles, filters with smaller pore sizes, such as the 0.8 μm PC and 0.8 μm silver filters, were preferred. The use of 0.8 μm silver filters was not ideal for identifying individual RCMD particles due to poor image contrast between the dust particles and the filter substrates. Therefore, 0.8 μm PC filters were used in this study to determinate both the particle size and chemical composition of RCMD particles. Filters were pre- and post-weighed to determine mass gain, which was used to determine dust exposure over the sampling period.
2.2. Scanning Electron Microscopy (SEM)
2.2.1. Imaging and Chemical Composition Analysis
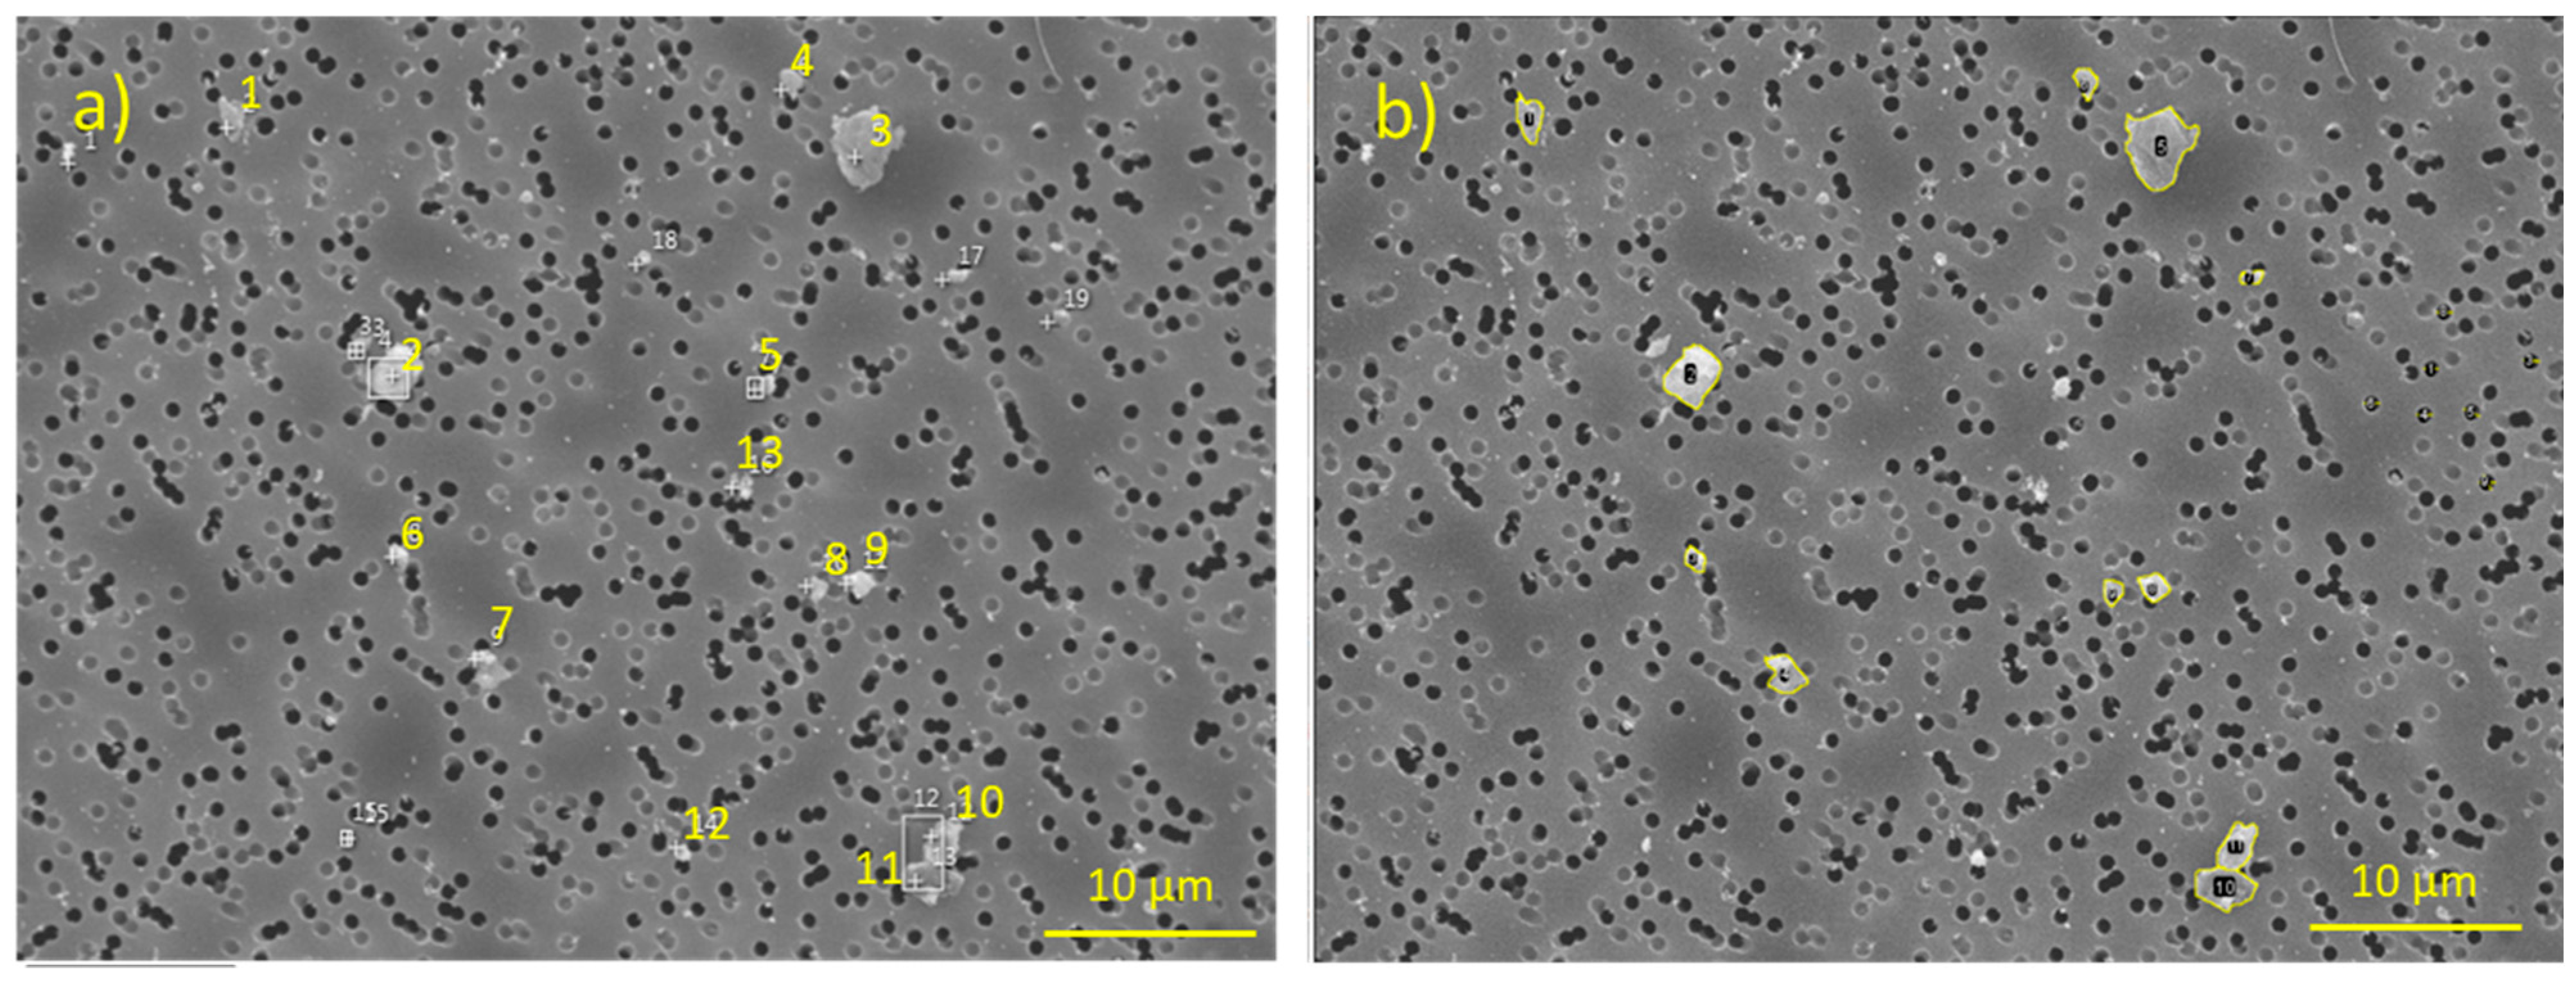
Imaging and elemental composition analyses of dust particles on the filters were conducted using scanning electron microscopy (SEM). PC filters were carefully removed from the cassette. Two 6 × 6 mm2 pieces were cut from each sample. One piece was cut from the edge, and the other piece was from near the center of the filter. This was to ensure accuracy of the results since the RCMD particles were not evenly distributed across the surface of the filter. The cut filter pieces were attached to an aluminum pin using double-sided tape. The particle size and chemical composition of individual dust particles on the filters were determined using SEM coupled with energy-dispersive X-ray spectroscopy (EDX). Prior to the SEM characterization, the filter specimens were coated with a 5–10 nm thick layer of Pt, and elemental mapping was performed in a Philips XL40 Environmental Scanning Electron Microscope (ESEM) (Amsterdam, The Netherlands) under high-vacuum conditions. Images were obtained under the back scattered electron (BSE) mode at a 15–17 kV accelerating voltage.
One issue with the use of PC filters is that the emitted X-ray signal from the substrate (i.e., the PC filter) interferes with that from the deposited coal dust particles, since the chemical compositions of both PC and the dust particles are similar. Therefore, in this study, the EDX elemental mapping was conducted through the secondary electron (SE) mode at a 10–12 kV accelerating voltage. The choice of a 10–12 kV acceleration voltage was to ensure that the EDX spectra collected at the 10–12 kV accelerating voltage reflected the actual composition of the dust particles on the surface. In addition, the EDX analysis enabled a characterization of micron-sized dust particles. For the nano-sized fraction of the dust particles, an accurate determination of their chemical composition can be challenging.
Particles were categorized into seven different types, including coal, diesel, calcite, dolomite, quartz, kaolin, illite, and others. Coal particles primarily consisted of carbon (~80% by weight). Diesel particles had the same composition as coal, but exhibited an amorphous structure. Calcite particles contained at least 3% by weight calcium (Ca), in addition to carbon and oxygen. Dolomite particles contained at least 3% by weight magnesium (Mg) and Ca combined. Quartz particles contained at least 1% by weight of silicon and no Ca and Mg. Both kaolin and illite particles were identified as aluminosilicate particles that contained at least 1% by weight of both Si and Al. The others were particles that contained heavy metals, such as iron.
2.2.2. Image Analysis
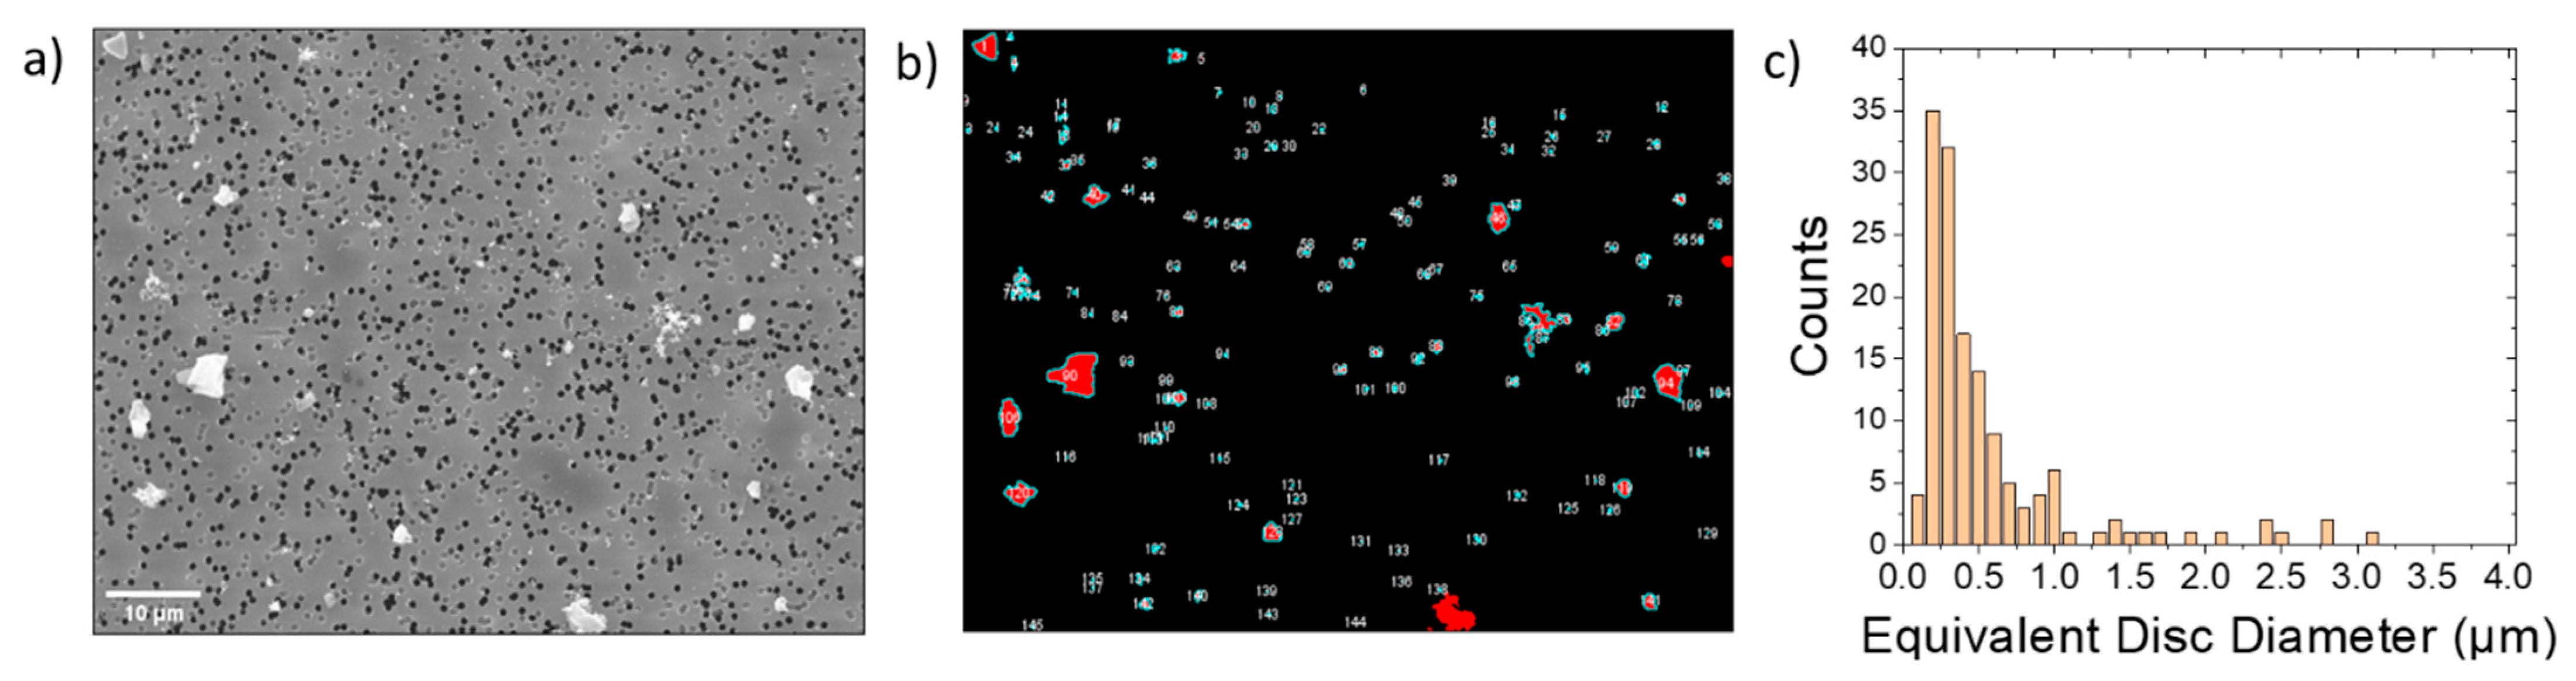
The size of individual dust particles deposited on the filter substrate was determined using FIJI software (ImageJ, National Institute of Health). The first image processing procedure was done by manually circling and enumerating particles [
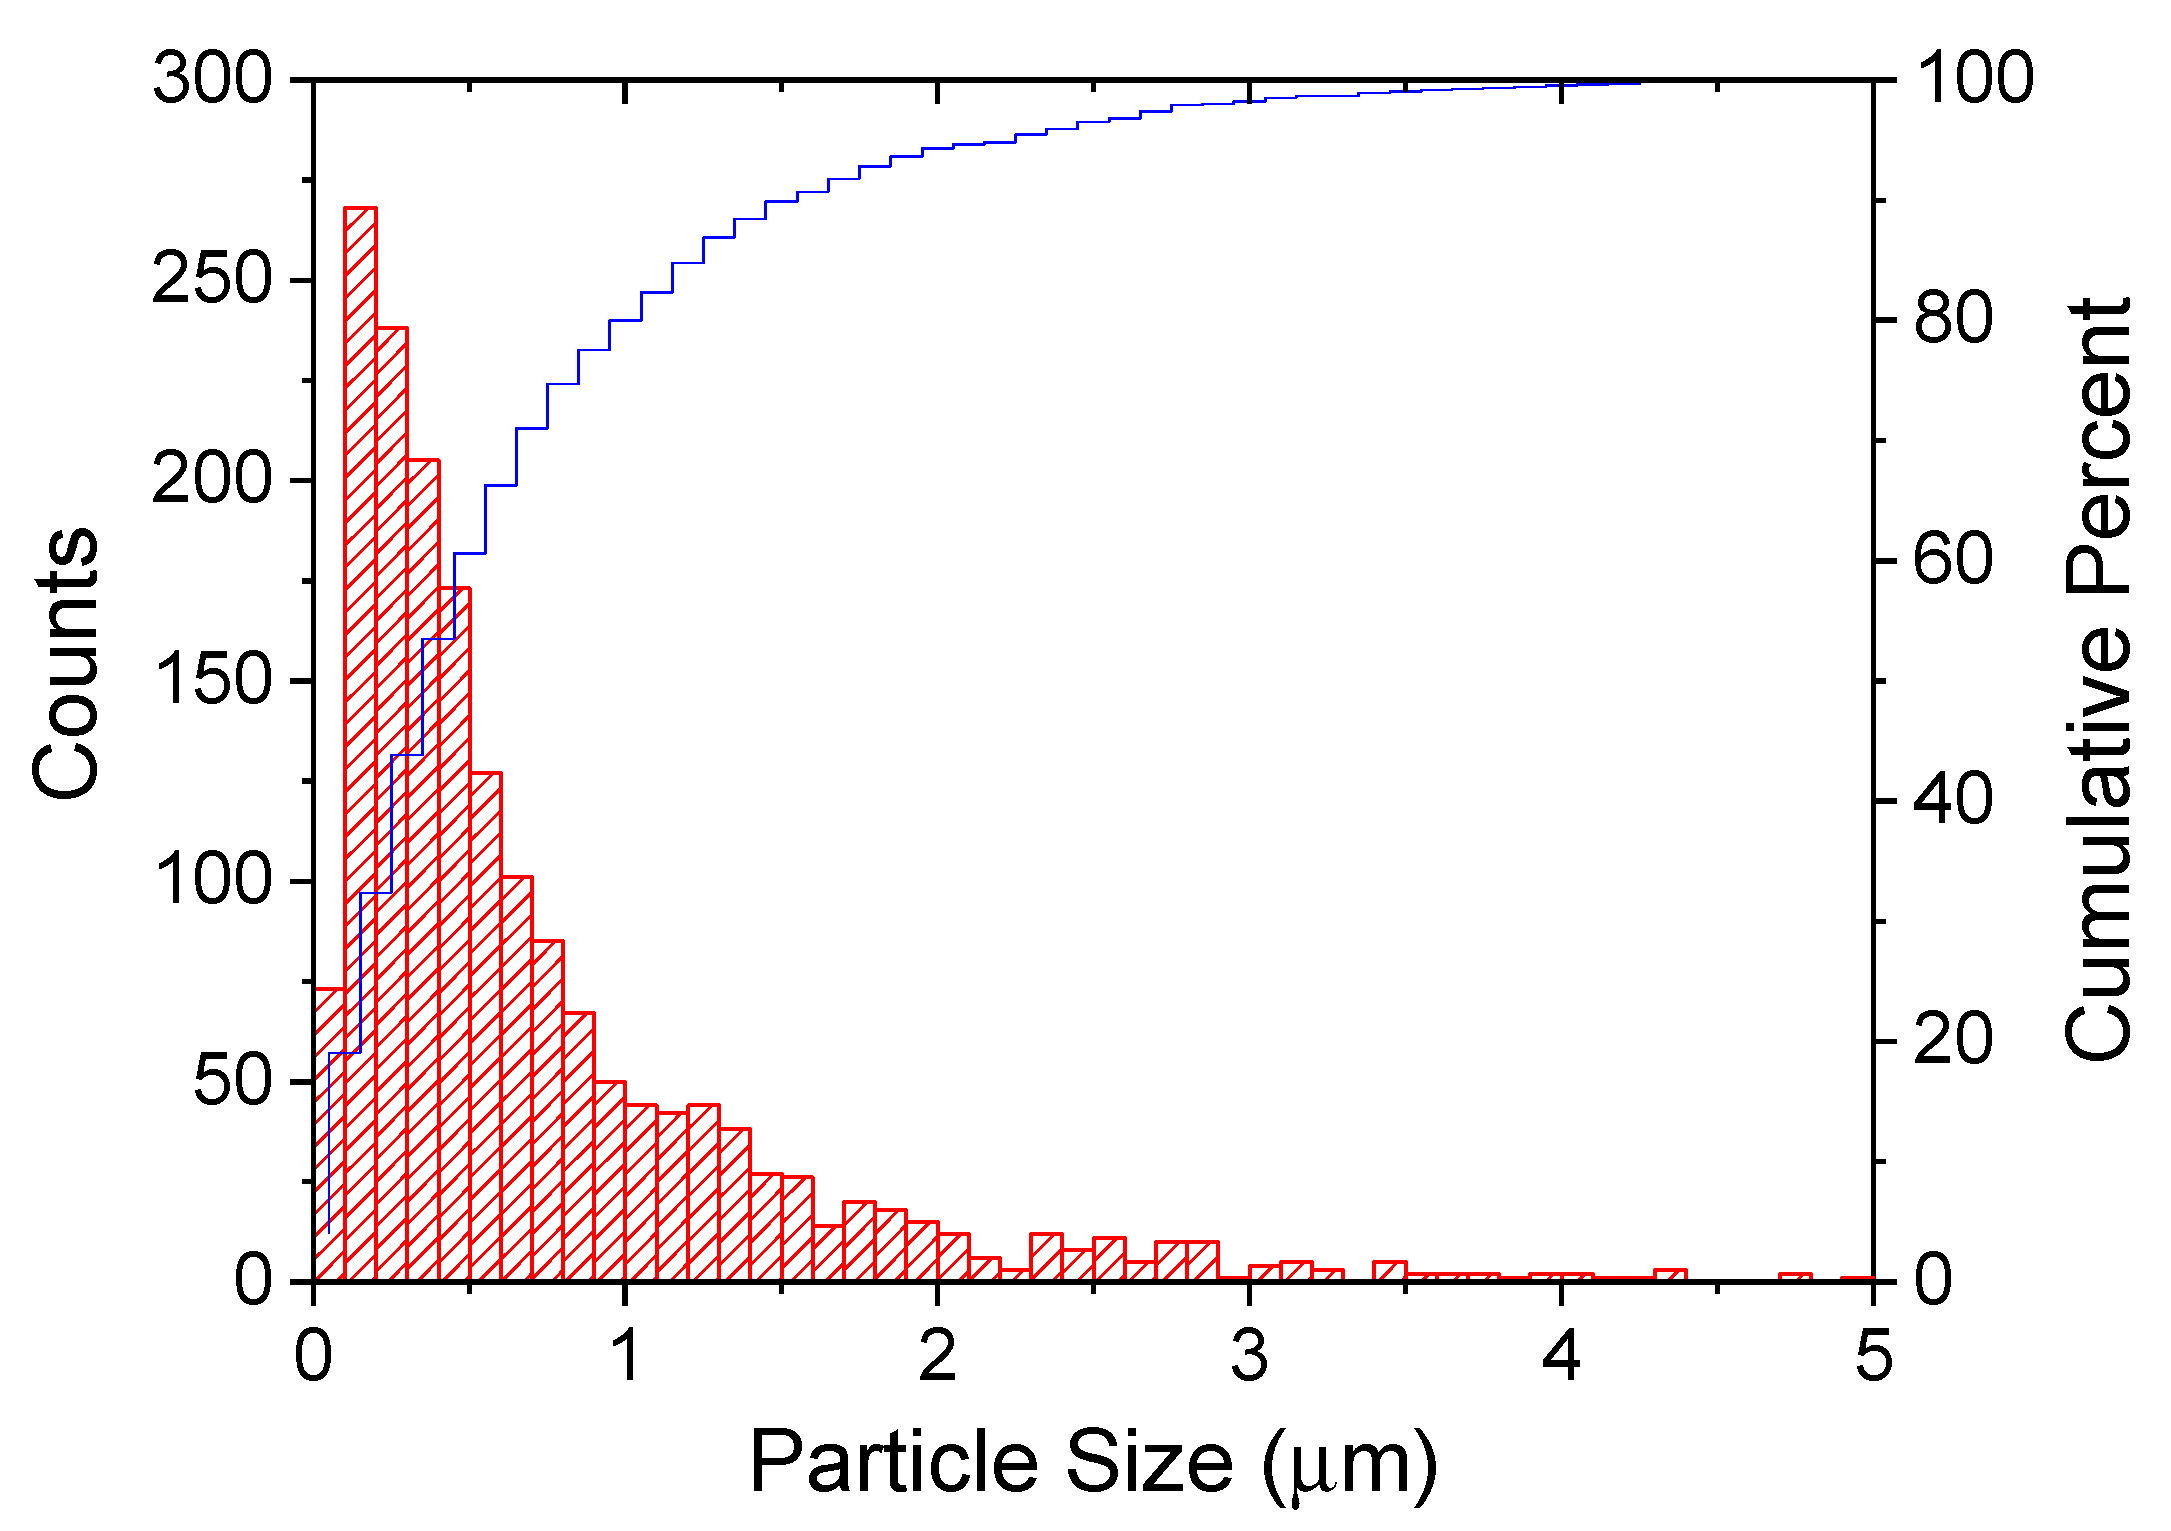
17]. The area parameter was determined, and the equivalent disc diameter was calculated from the projected particle area. Particles with different textures and shapes were detected. For aggregates of smaller particles or in cases where smaller particles were deposited on larger particles, clusters of particles with no visible boundary between particles were treated as one particle. A second image processing procedure counted dust particles with diameters of ~100 nm and above. This was achieved by thresholding the image, then selecting and numbering the particles.
2.3. Particle Size Analysis
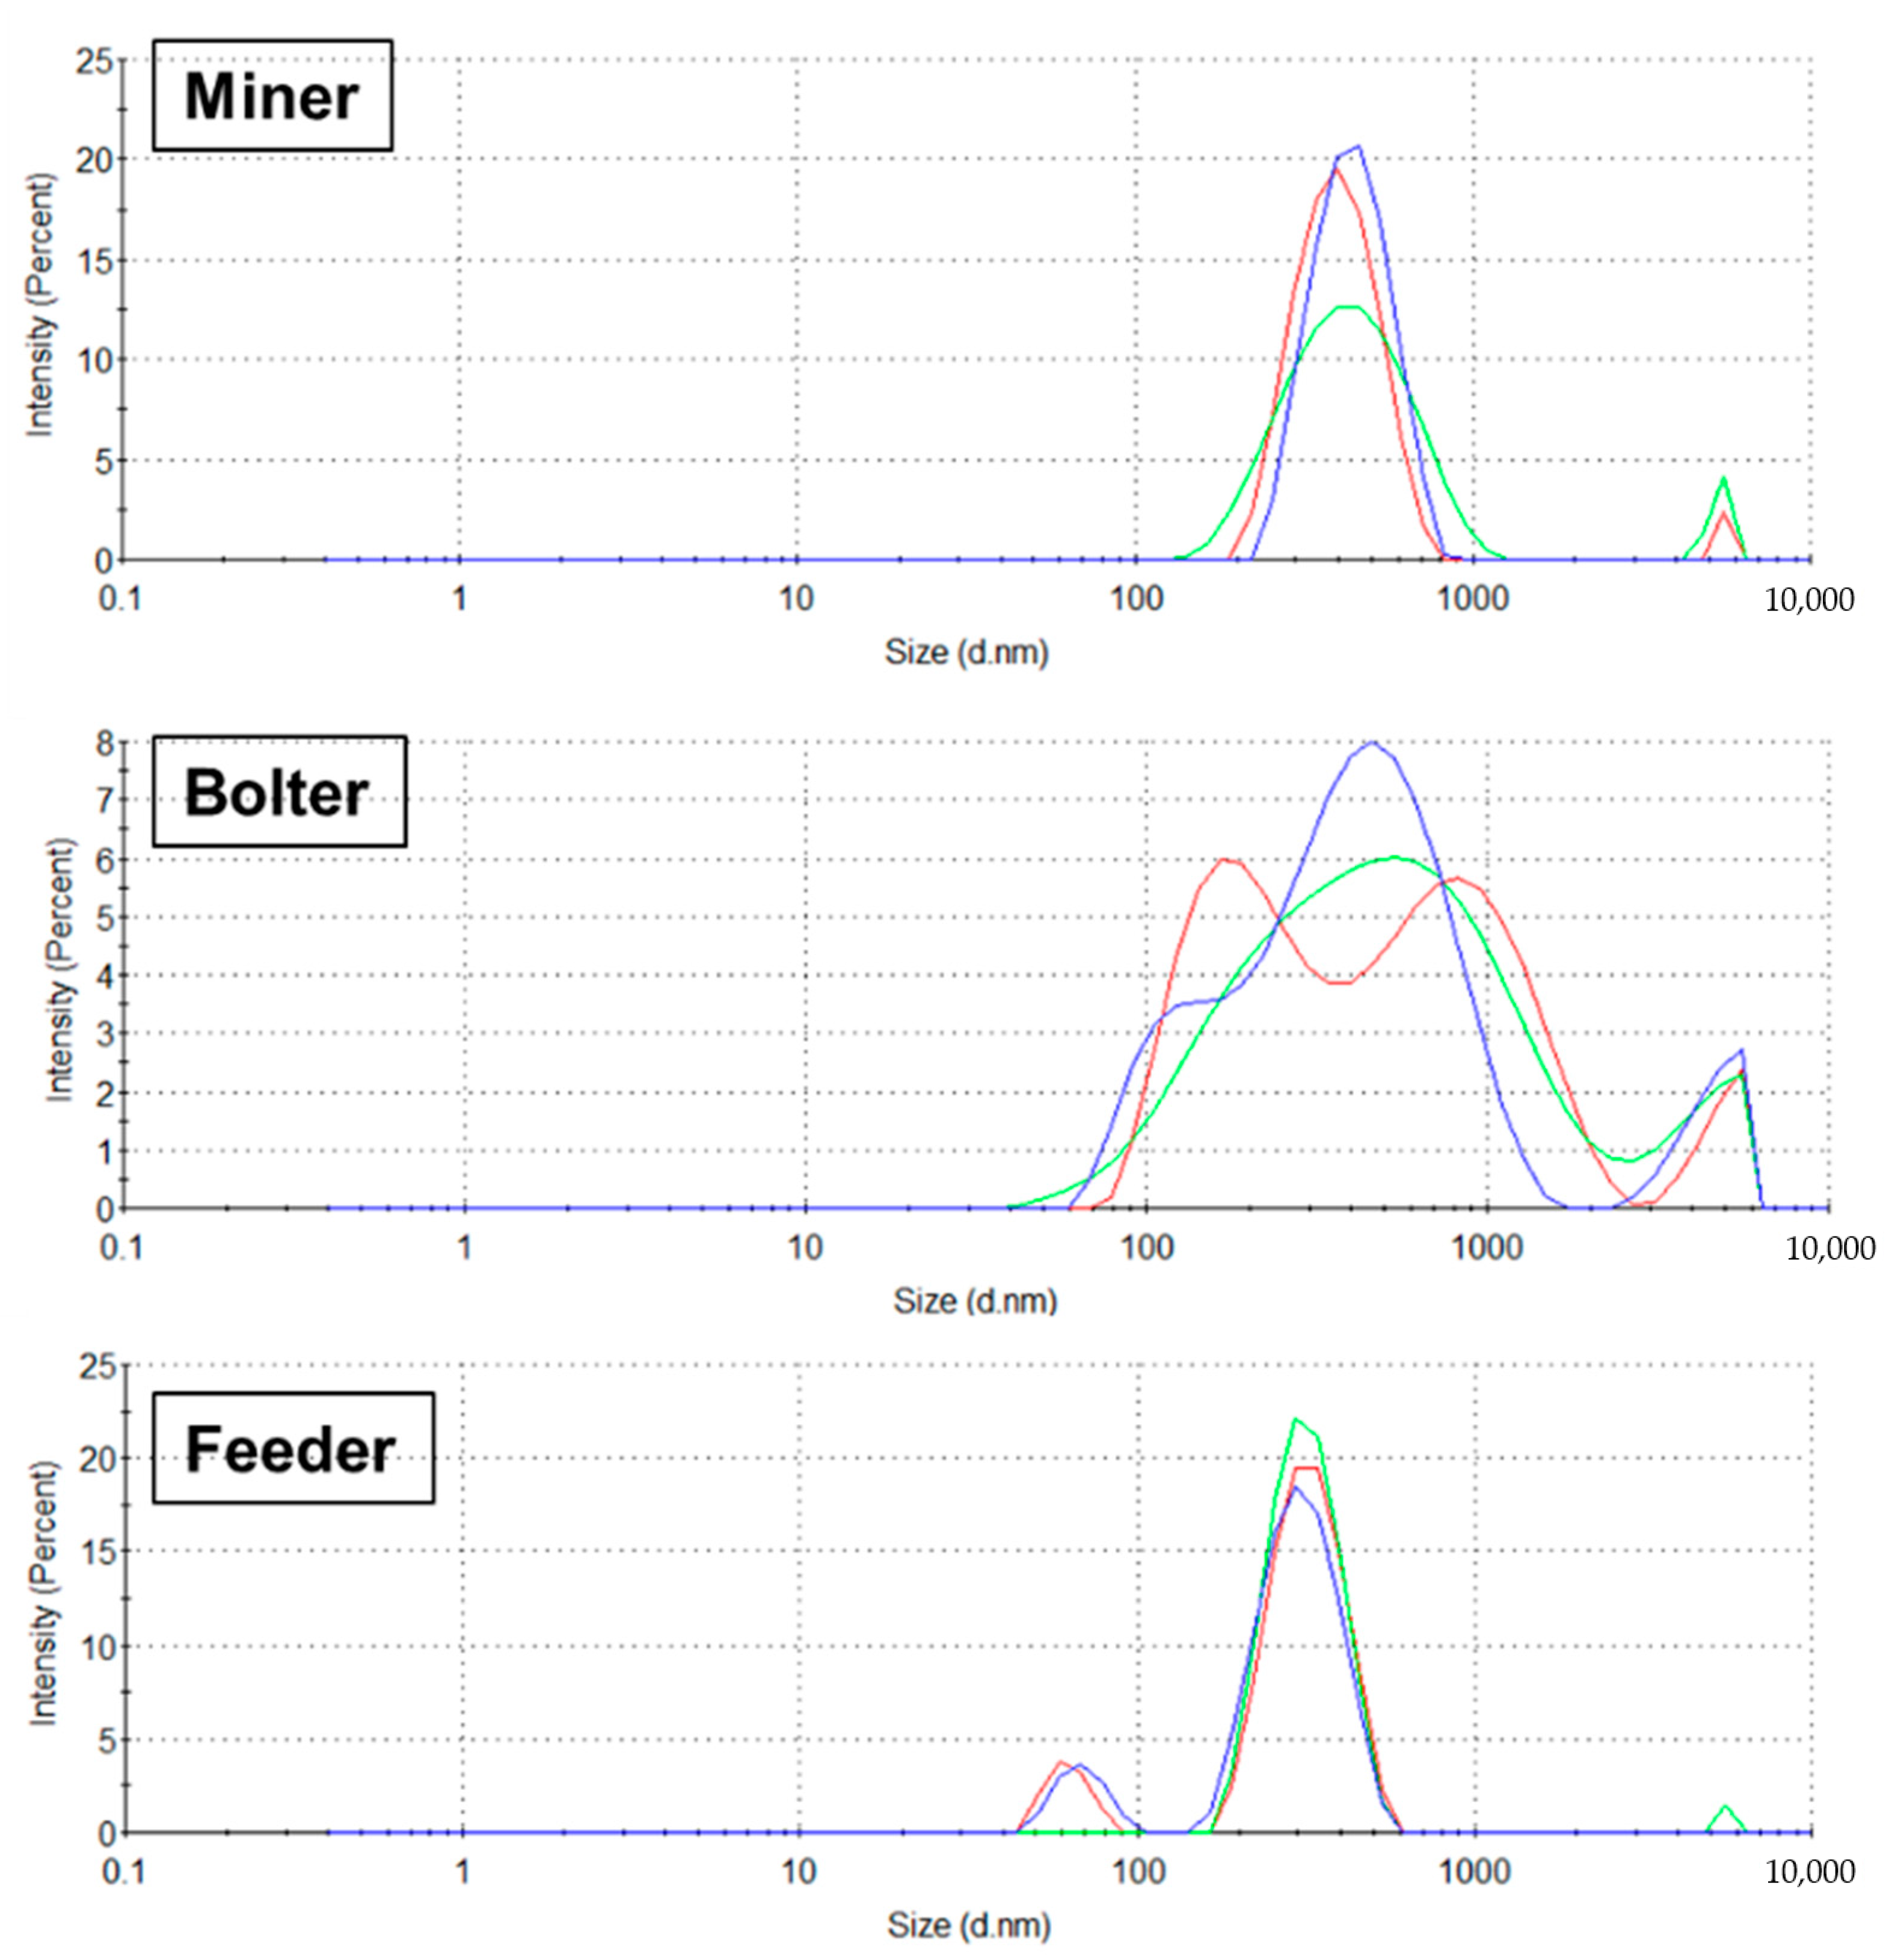
Particle size distribution of the dust samples was measured using dynamic light scattering (DLS) and asymmetrical flow field-flow fractionation (AsFlFFF). Dust particles on PC filters were first dispersed in an aqueous surfactant solution. A Zetasizer Nano instrument (Malvern, PA, USA) was used for the DLS measurements. The Zetasizer Nano yielded information on the estimated particle size distribution of nano-sized dust particles in the batch mode.
Asymmetrical flow field-flow fractionation (AsFIFFF) is a particle separation and elution technique. In AsFlFFF, the sample fractionation takes place in a thin, flat, open channel (no stationary phase) by applying an external physical force to an incoming flow of sample particles suspended in a solution. Particles are eluted by a laminar flow perpendicular to the direction of the external force, and smaller particles in the sample elute first with the faster streams of the laminar flow; and the larger particles elute later [
18]. AsFlFFF analyses were performed using a Postnova AF2000 system (Landsberg, Germany) with UV detection at 254 nm. Filter samples were suspended in 2 mL of a surfactant solution, and 100 μL samples were injected into the channel. The sample contained larger particles that were settled, and excluded from the AsFlFFF analysis during the injection step. The results obtained from the AsFlFFF and DLS procedures were compared with those obtained from the SEM image analysis.
2.4. Scanning Transmission Electron Microscopy (S-TEM)
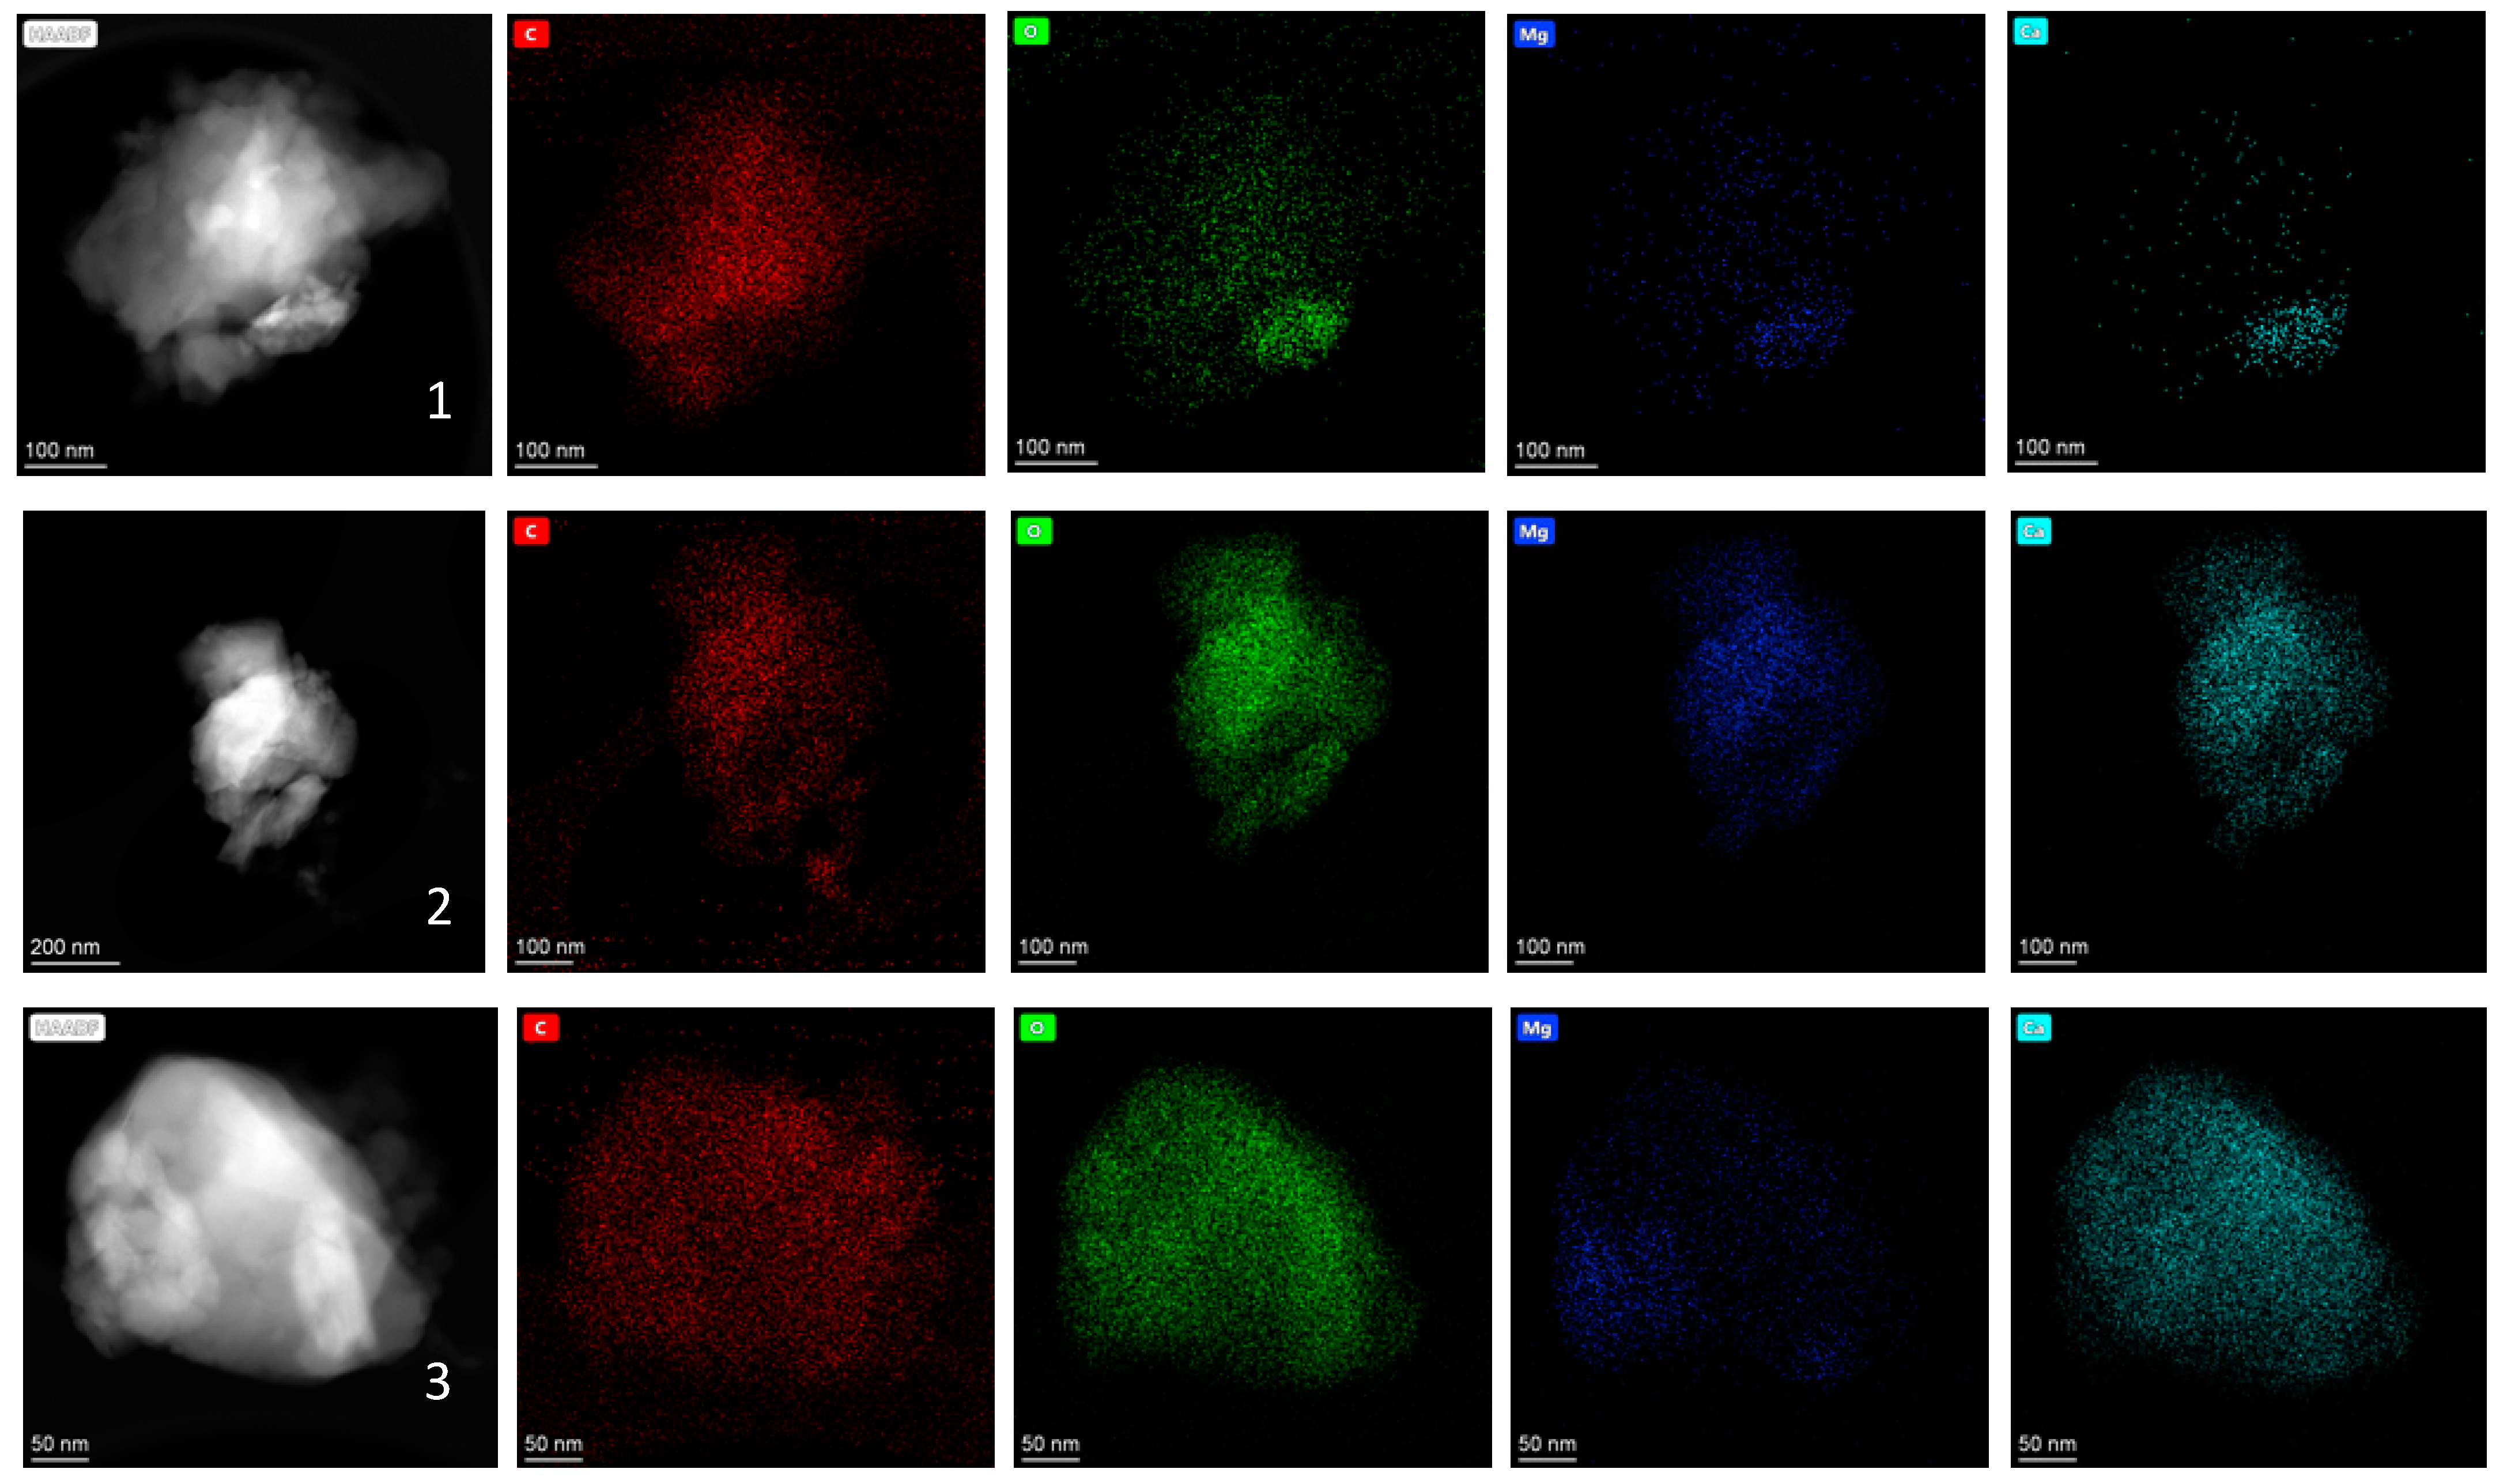
The elemental composition of the nano-sized fraction of the dust particles was determined using scanning transmission electron microscopy (Titan Themis 200 S-TEM, FEI). The electron micrographs and energy dispersive X-ray spectroscopy maps were obtained using a aberration corrected scanning transmission electron microscope operated at 200 KeV. The point resolution in the aberration-corrected mode was 0.08 nm. The microscope was fitted with a SuperXTM X-ray detector, which is a combination of four detectors for fast X-ray mapping in the STEM mode. For extremely stable (mechanical and e-beam interaction) samples, atomic resolution maps are possible. For the present experiment, nm resolution EDX maps were taken with an average beam current of 100 pA. The size of each map was 512 × 512 pixels, and a 50 µs/pixel dwell time was used for collecting the signal. All maps were generated by summing over 10 frames. The drift correction during data collection and subsequent analysis was performed using Velox software.
4. Summary and Conclusions
Characterization of respirable coal mine dust (RCMD) particles from an underground coal mine was conducted, including examination of both the micron-sized and nano-sized fractions of the respirable coal mine dust (RCMD). The dust samples were collected using the gravimetric sampling method. Individual dust particles deposited on the filter were characterized for chemical composition using scanning electron microscopy (SEM) coupled with energy-dispersive X-ray spectroscopy (EDX). The SEM images were analyzed using ImageJ image processing software to obtain the particle size distribution.
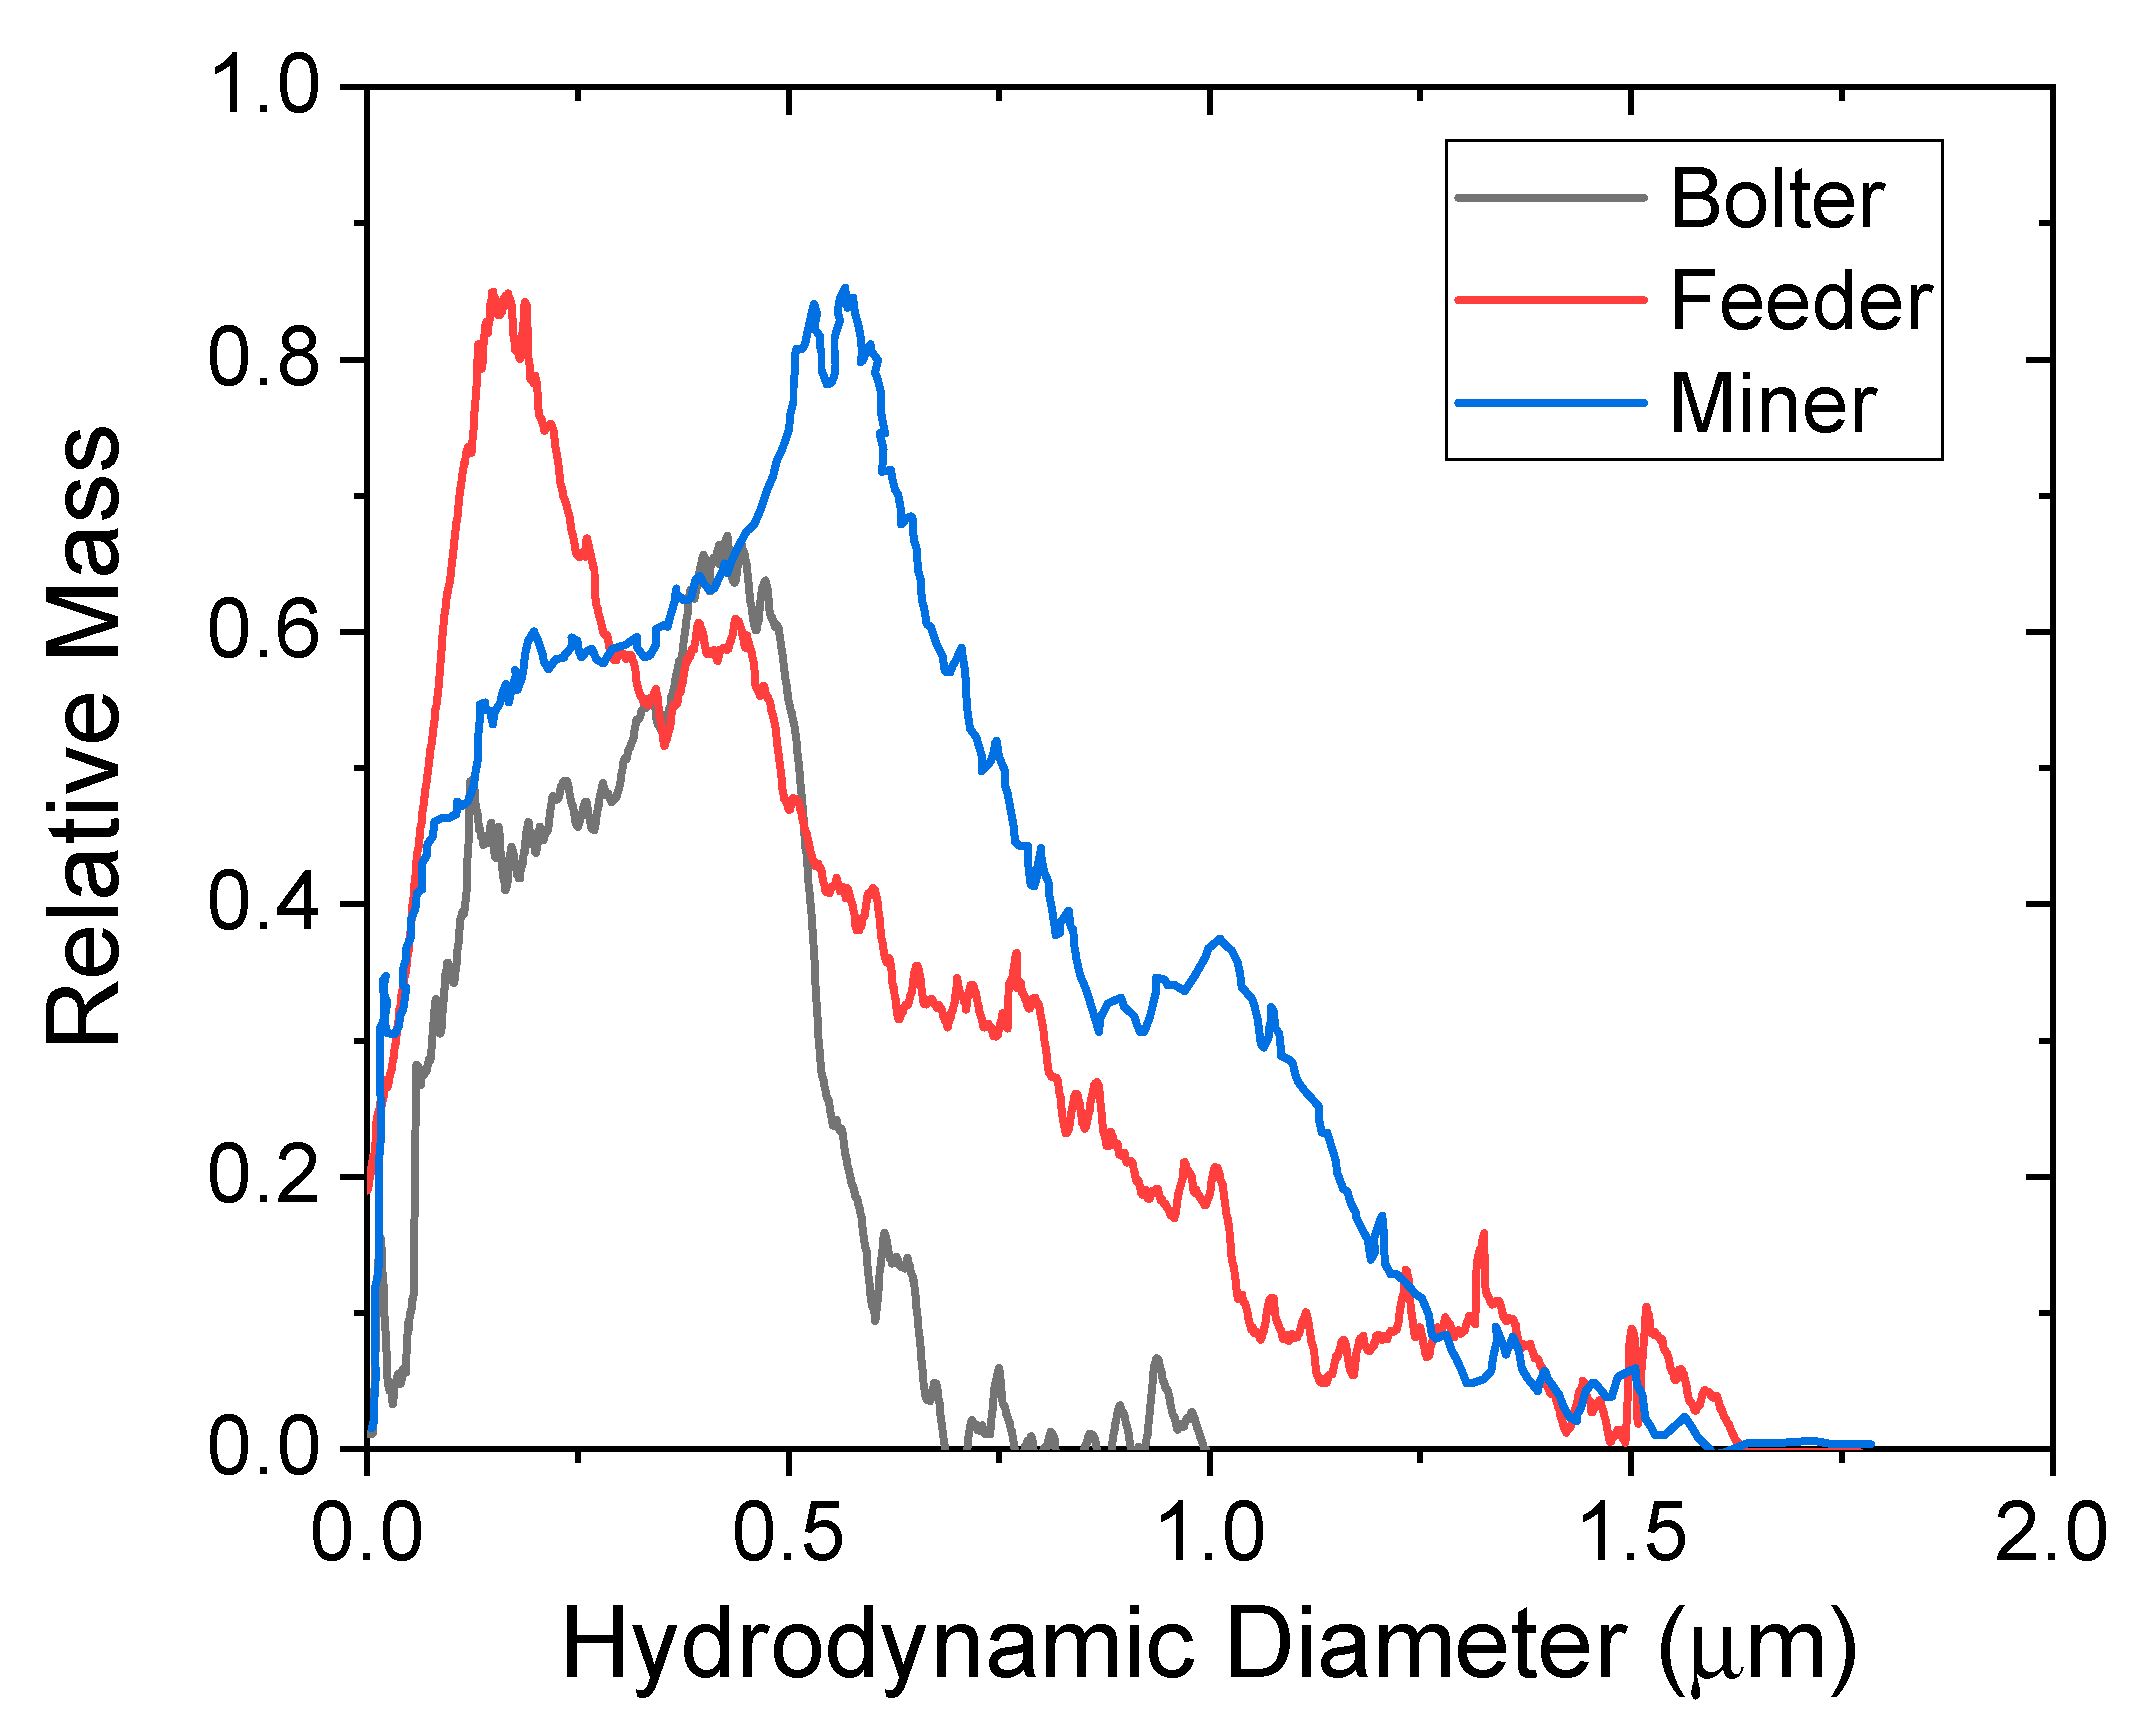
The results indicate that the RCMD samples consisted of, not only micron-sized dust particles, but also nano-sized dust particles. The composition of the micro-sized RCMD particles was closely correlated with the mining activity. The nano-sized dust particles had a mode particle size of 300–400 nm. The presence of the nano-sized dust particles was confirmed using particle size analyses, including dynamic light scattering (DLS) and asymmetrical flow field-flow fractionation (AsFlFFF). A small number of nano-sized RCMD samples were analyzed for both size and mineral composition using scanning transmission electron microscopy (S-TEM). The results show that not only diesel particles, but also coal and rock dust particles, were found in the nano-sized fraction of the RCMD. The percentage of the nano-sized fraction of RCMD particles may be site and location dependent, and a survey and detailed analyses should be conducted in the future.


 ,
, 


