
Mineralogical and Chemical Specificity of Dusts Originating from Iron and Non-Ferrous Metallurgy in the Light of Their Magnetic Susceptibility

 , , , and
Abstract
1. Introduction
2. Materials and Methods
2.1. Chemical Composition
2.2. Mineralogical Composition
2.3. Iron-Bearing Phase Identification
2.4. Magnetic Susceptibility
3. Results and Discussion
3.1. Chemical Composition
3.2. Mineral Composition
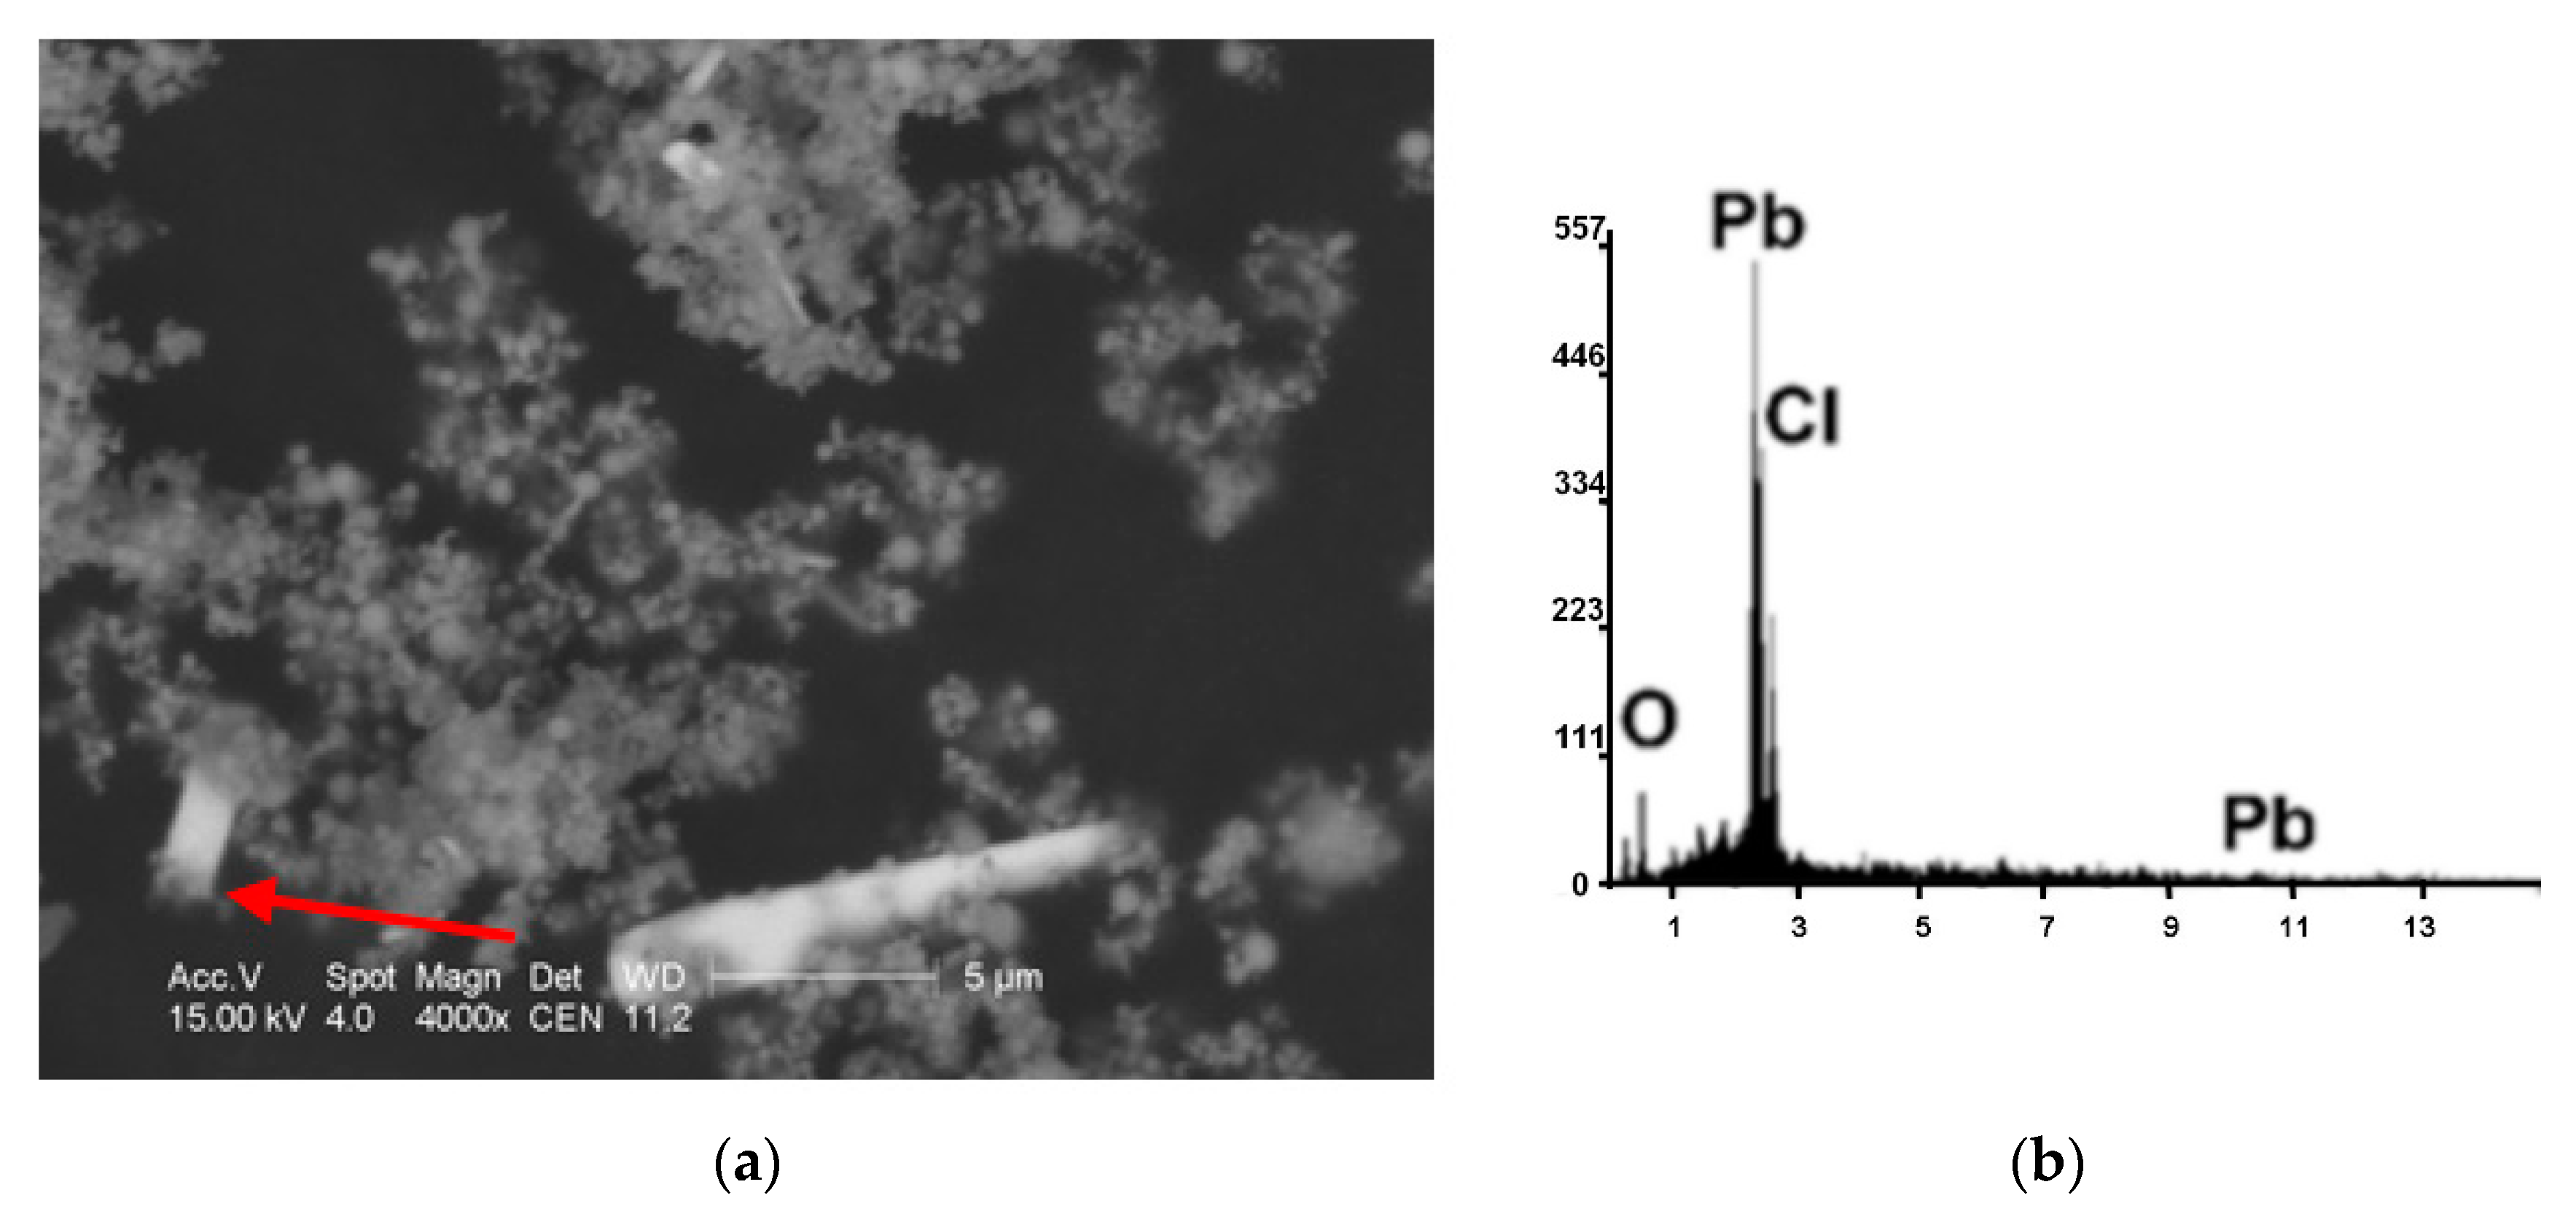
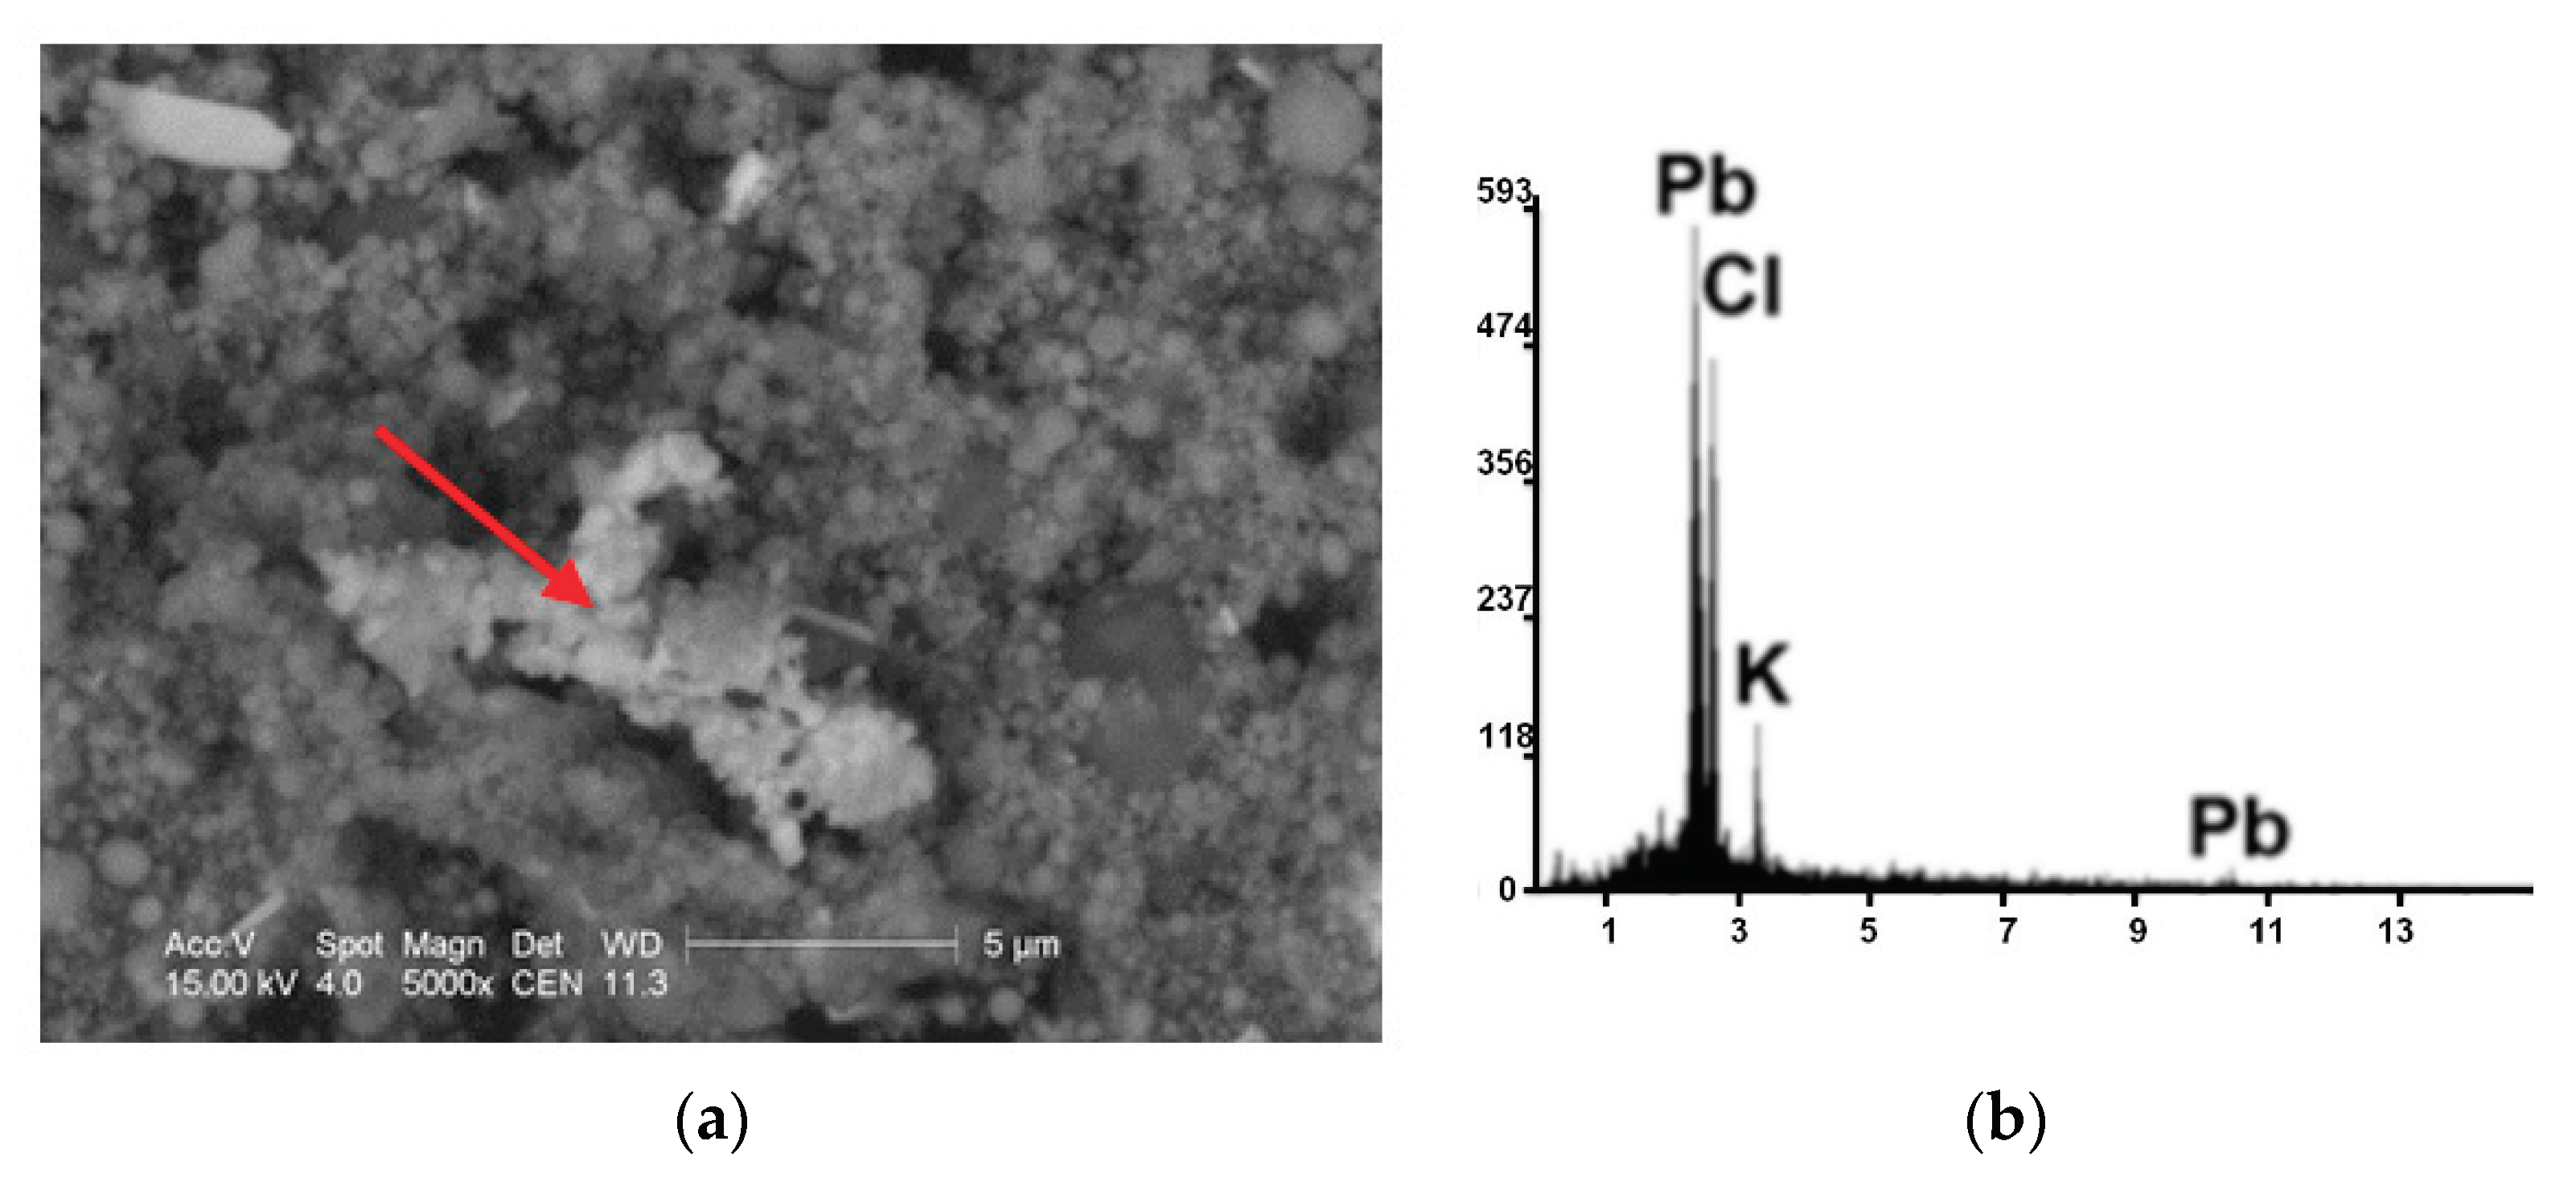
3.3. Iron-Bearing Phase Identification
3.4. Magnetic Susceptibility
4. Conclusions
Supplementary Materials
Author Contributions
Funding
Data Availability Statement
Acknowledgments
Conflicts of Interest
References
- Jabłońska, M.; Janeczek, J. Identification of industrial point sources of airborne dust particles in an urban environment by a combined mineralogical and meteorological analyses: A case study from the Upper Silesian conurbation, Poland. Atmos. Pollut. Res. 2019, 10, 980–988. [Google Scholar] [CrossRef]
- Kukier, U.; Ishak, C.F.; Sumner, M.E.; Miller, W.P. Composition and element solubility of magnetic and non-magnetic fly ash fractions. Environ. Pollut. 2003, 123, 255–266. [Google Scholar] [CrossRef]
- Gupta, S.; Dubikova, M.; French, D.; Sahajwalla, V. Characterization of the origin and distribution of the minerals and phases in metallurgical cokes. Energy Fuel 2007, 21, 303–313. [Google Scholar] [CrossRef]
- Magiera, T.; Jabłońska, M.; Strzyszcz, Z.; Rachwał, M. Morphological and mineralogical forms of technogenic magnetic particles in industrial dusts. Atmos. Environ. 2011, 45, 4281–4290. [Google Scholar] [CrossRef]
- Magiera, T.; Gołuchowska, B.; Jabłońska, M. Technogenic magnetic particles in alkaline dusts from power and cement plants. Water Air Soil Pollut. 2013, 224, 1389. [Google Scholar] [CrossRef]
- Thompson, R.; Oldfield, F. Environmental Magnetism; Allen and Unwin: London, UK, 1986; pp. 1–227. [Google Scholar]
- Catinon, M.; Ayrault, S.; Boudouma, O.; Bordier, L.; Agnello, G.; Reynaud, S.; Tissut, M. Isolation of technogenic magnetic particles. Sci. Total Environ. 2014, 475, 39–47. [Google Scholar] [CrossRef]
- Lu, S.; Yu, X.; Chen, Y. Magnetic properties, microstructure and mineralogical phases of technogenic magnetic particles (TMPs) in urban soils: Their source identification and environmental implications. Sci. Total Environ. 2016, 543, 239–247. [Google Scholar] [CrossRef]
- Cornel, R.M.; Schwertmann, U. The Iron Oxides. Structure, Properties, Reactions and Uses; VCH: New York, NY, USA, 1996. [Google Scholar]
- Zboril, R.; Mashlan, M.; Petridis, D. Iron(III) oxides from thermal processes synthesis, structural and magnetic properties, mössbauer spectroscopy characterization, and applications. Chem. Mater. 2002, 14, 969–982. [Google Scholar] [CrossRef]
- Bhattacharjee, H.; Mandal, R.M.; Kusz, J.; Hofmeister, W. Microstructural and magnetic characterization of fly ash from Kolaghat Thermal Power Plant in West Bengal, India. J. Magn. Magn. Mater. 2011, 323, 3007–3012. [Google Scholar] [CrossRef]
- Brown, P.; Jonesa, T.; BéruBé, K. The internal microstructure and fibrous mineralogy of fly ash from coal-burning power stations. Environ. Pollut. 2011, 159, 3324–3333. [Google Scholar] [CrossRef]
- Jayaranjan, M.L.D.; van Hullebusch, E.D.; Annachhatre, A.P. Reuse options for coal fired power plant bottom ash and fly ash. Rev. Environ. Sci. Biotechnol. 2014, 13, 467–486. [Google Scholar] [CrossRef]
- Petrovský, E.; Zboril, R.; Grygar, T.M.; Kotlik, B.; Novak, J.; Kapička, A.; Grison, H. Magnetic particles in atmospheric particulate matter collected at site with different level of air pollution. Stud. Geophys. Geod. 2013, 57, 755–770. [Google Scholar] [CrossRef]
- Uzarowicz, Ł.; Zagórski, Z. Mineralogy and chemical composition of technogenic soils (Technosols) developed from fly ash and bottom ash from selected thermal power stations in Poland. Soil Sci. Ann. 2015, 66, 82–91. [Google Scholar] [CrossRef]
- Kicińska, A. Chemical and mineral composition of fly ashes from home furnaces, and health and environmental risk related to their presence in the environment. Chemosphere 2019, 215, 574–585. [Google Scholar] [CrossRef] [PubMed]
- Smołka-Danielowska, D.; Kądziołka-Gaweł, M.; Krzykawski, T. Chemical and mineral composition of furnace slags produced in the combustion process of hard coal. Int. J. Environ. Sci. Technol. 2019, 16, 5387–5396. [Google Scholar] [CrossRef]
- Goodarzi, F. Characteristics and composition of fly ash from Canadian coal-fired power plants. Fuel 2006, 85, 1418–1427. [Google Scholar] [CrossRef]
- Konieczyński, J.; Stec, K. The occurrence of selected trace elements in grain fractions of dust emitted from power, coke and cement plants. Arch. Environ. Prot. 2009, 35, 3–21. [Google Scholar]
- Konieczyński, J.; Zajusz-Zubek, E. Distribution of selected trace elements in dust containment and flue gas desulphurisation products from coal-fired power plants. Arch. Environ. Prot. 2011, 37, 3–14. [Google Scholar]
- Silva, L.F.O.; Ward, C.R.; Hower, J.C.; Izquierdo, M.; Waanders, F.; Oliveira, M.L.S.; Li, Z.; Hatch, R.S.; Querol, X. Mineralogy and Leaching Characteristics of Coal Ash from a Major Brazilian Power Plant. Coal Combust. Gasif. Prod. 2010, 2, 51–65. [Google Scholar] [CrossRef]
- Gargiulo, J.D.; Chaparro, M.A. Particulate matter pollution from a small coke-burning factory: Soil magnetic screening and its relation with a simple atmospheric dispersion model. Stud. Geophys. Geod. 2016, 60, 316–331. [Google Scholar] [CrossRef]
- Gołuchowska, B.; Strzyszcz, Z.; Kusza, G. Magnetic susceptibility and heavy metal content in dust from the lime plant and the cement plant in Opole Voivodeship. Arch. Environ. Prot. 2012, 38, 7–80. [Google Scholar] [CrossRef]
- Paoli, L.; Winkler, A.; Guttová, A.; Sagnotti, L.; Grassi, A.; Lackovičová, A.; Senko, D.; Loppi, S. Magnetic properties and element concentrations in lichens exposed to airborne pollutants released during cement production. Environ. Sci. Pollut. Res. 2017, 24, 12063–12080. [Google Scholar] [CrossRef]
- Rachwał, M.; Magiera, T.; Wawer, M. Coke industry and steel metallurgy as the source of soil contamination by technogenic magnetic particles, heavy metals and polycyclic aromatic hydrocarbons. Chemosphere 2015, 138, 863–873. [Google Scholar] [CrossRef] [PubMed]
- Szumiata, T.; Rachwał, M.; Magiera, T.; Brzózka, K.; Gzik-Szumiata, M.; Gawroński, M.; Górka, B.; Kyzioł-Komisińska, J. Iron-containing phases in metallurgical and coke dust as well as in bog iron ore. Nukleonika 2017, 62, 187–195. [Google Scholar] [CrossRef]
- Czaplicka, M.; Buzek, Ł. Lead speciation in the dusts emitted from non-ferrous metallurgy processes. Water Air Soil Pollut. 2011, 218, 157–163. [Google Scholar] [CrossRef] [PubMed]
- Hleis, D.; Fernández-Olmo, I.; Ledoux, F.; Kfoury, A.; Courcot, L.; Desmonts, T.; Courcot, D. Chemical profile identification of fugitive and confined particle emissions from an integrated iron and steelmaking plant. J. Hazard. Mater. 2013, 250, 246–255. [Google Scholar] [CrossRef]
- Adamczyk, Z.; Nowińska, K. Environmental mobility of trace elements present in dusts emitted from Zn–Pb metallurgical processes. Environ. Earth Sci. 2016, 75, 956. [Google Scholar] [CrossRef]
- Omran, M.; Fabritius, T. Treatment of blast furnace sludge (BFS) using a microwave heating technique, Ironmak. Steelmak 2017, 44, 619–629. [Google Scholar] [CrossRef]
- Lv, W.; Gan, M.; Fan, X.; Ji, Z.; Chen, X.; Yao, J.; Jiang, T. Recycling utilization of zinc-bearing metallurgical dust by reductive sintering: Reaction behavior of zinc oxide. JOM 2019, 71, 3173–3180. [Google Scholar] [CrossRef]
- Stevens, J.G.; Khasanov, A.M.; Miller, J.W.; Pollak, H.; Li, Z. Mössbauer Mineral Handbook; Mössbauer Effect Data Center: Asheville, NC, USA, 2005; pp. 1–636. [Google Scholar]
- Dyar, M.D. Precision and inter-laboratory reproducibility of measurements of the Mössbauer effect in minerals. Am. Mineral. 1984, 69, 1127–1144. [Google Scholar]
- De Grave, E.; Van Alboom, A. Evaluation of Ferrous and Ferric Mössbauer Fractions. Phys. Chem. Miner. 1991, 18, 337–342. [Google Scholar] [CrossRef]
- Eeckhout, S.G.; De Grave, E. Evaluation of ferrous and ferric Mössbauer fractions. Part II. Phys. Chem. Miner. 2003, 30, 142–146. [Google Scholar] [CrossRef]
- Dyar, M.D. Optical and Mössbauer Spectroscopy of Iron in Micas. Rev. Mineral. Geochem. 2002, 46, 313–349. [Google Scholar] [CrossRef]
- Rancourt, D.G.; McDonald, A.M.; Lalonde, A.E.; Ping, J.Y. Mössbauer absorber thickness for accurate site populations in Fe-bearing minerals. Am. Mineral. 1993, 78, 1–7. [Google Scholar]
- Lecoanet, H.; Leveque, F.; Segura, S. Magnetic susceptibility in environmental applications: Comparison of field probes. Phys. Earth Planet. Inter. 1999, 115, 191–204. [Google Scholar] [CrossRef]
- Hrouda, F. A technique for the measurement of thermal changes of magnetic susceptibility of weakly magnetic rocks by the CS-2 apparatus and KLY-2 Kappabridge. Geophys. J. Int. 1994, 118, 604–612. [Google Scholar] [CrossRef]
- Anameric, B.; Komar, K.S. Direct iron smelting reduction processes, Mineral Processing and Extractive Metallurgy Review. An Int. J. 2008, 30, 1–51. [Google Scholar] [CrossRef]
- Wang, G.C. The Utilization of Slag in Civil Infrastructure Construction; Nonferrous Metal Extraction and Nonferrous Slags; Elsevier Ltd.: Amsterdam, The Netherlands, 2016; pp. 35–61. [Google Scholar] [CrossRef]
- Gheiratmand, T.; Hosseini, H.R.M.; Davami, P.; Gjoka, M.; Song, M. The effect of mechanical milling on the soft magnetic properties of amorphous FINEMET alloy. J. Magn. Magn. Mater. 2015, 381, 322–327. [Google Scholar] [CrossRef]
- Kukurugya, F.; Vindt, T.; Havlík, T. Behavior of zinc, iron and calcium from electric arc furnace (EAF) dust in hydrometallurgical processing in sulfuric acid solutions: Thermodynamic and kinetic aspects. Hydrometallurgy 2015, 154, 20–32. [Google Scholar] [CrossRef]
- Dyar, M.D.; Agresti, D.; Schaefer, M.; Grant, C.; Sklute, E. Mössbauer spectroscopy of earth and planetary materials. Annu. Rev. Earth Planet. Sci. 2006, 34, 83–125. [Google Scholar] [CrossRef]
- Górka-Kostrubiec, B.; Werner, T.; Dytłow, S.; Szczepaniak-Wnuk, I.; Jeleńska, M.; Hanc-Kuczkowska, A. Detection of metallic iron in urban dust by using high-temperature measurements supplemented with microscopic observations and Mössbauer spectra. J. Appl. Geophys. 2019, 166, 89–102. [Google Scholar] [CrossRef]
- Górka-Kostrubiec, B.; Magiera, T.; Dudzisz, K.; Dytłow, S.; Wawer, M.; Winkler, A. Integrated magnetic analyses for the discrimination of urban and industrial dusts. Minerals 2020, 10, 1056. [Google Scholar] [CrossRef]
- Hagni, A.M.; Hagni, R.D.; Demars, C. Mineralogical characteristics of electric arc furnace dusts. JOM 1991, 43, 28–30. [Google Scholar] [CrossRef]
- Jabłońska, M.; Smołka-Danielowska, D. Iron oxides particles in the air and fly ash, and their influence on the environment (preliminary studies). PGI Spec. Pap. 2008, 24, 93–98. [Google Scholar]
- Haihan, C.; Laskin, A.; Baltrusaitis, J.; Gorski, C.; Scherer, M.; Grassian, V. Coal fly ash as a source of iron in atmospheric dust. Envirol. Sci. Technol. 2012, 46, 211–212. [Google Scholar] [CrossRef]
- Jelenska, M.; Hasso-Agopsowicz, A.; Kopcewicz, B. Thermally induced transformation of magnetic minerals in soil based on rock magnetic study and Mossbauer analysis. Phys. Earth Planet. Inter. 2010, 179, 164–177. [Google Scholar] [CrossRef]
- Oliweira, M.; Waanders, F.; Silva, L.; Jasper, A.; Sampaio, C.; McHabe, D.; Hatch, R.; Hower, J. A multi analytical approach to understand chemistry of Fe-minerals in fees coal and ashes. Coal Combust. Gasif. Prod. 2011, 3, 51–62. [Google Scholar] [CrossRef]
- Fiałkiewicz-Kozieł, B.; Łokas, E.; Gałka, M.; Kołaczek, P.; De Vleeschouwer, F.; Le Roux, G.; Śmieja-Król, B. Influence of transboundary transport of trace elements on mountain peat geochemistry (Sudetes, Central Europe). Quat. Sci. Rev. 2020, 230, 106162. [Google Scholar] [CrossRef]
- Hansson, R.; Hayes, P.C.; Jak, E. Phase equilibria in the ZnO-rich area of the Fe-Zn-O system in air, Scand. J. Metall. 2004, 33, 294–304. [Google Scholar] [CrossRef]
- Papp, I.; Koleszar, P.; Kozak, M. Chemical composition and zinc leaching test of dust from electric arc furnace emissions from the Steelwork of Ózd, Hungary. Acta GGM Debrecina Geol. Geomorphol. Phys. Geogr. Series Debr. 2010, 4–5, 7–11. [Google Scholar]
- Schlüter, J.; Pohl, D.; Britvin, S. The new mineral challacolloite, KPb2Cl5, the natural occurrence of a technically known laser material. Neues Jahrb. Mineral. Abh. 2005, 182, 95–101. [Google Scholar] [CrossRef]
- Isaenko, L.I.; Dragomir, A.; McInerney, J.G.; Nikogosyan, D.N. Anisotropy of two-photon absorption in BBO at 264 nm. Opt. Commun. 2001, 198, 433–438. [Google Scholar] [CrossRef]
- Fiałkiewicz-Kozieł, B.; De Vleeschouwer, F.; Mattielli, N.; Fagel, N.; Palowski, B.; Pazdur, A.; Smieja-Król, B. Record of Anthropocene pollution sources of lead in disturbed peatlands from Southern Poland. Atmos. Environ. 2018, 179, 61–68. [Google Scholar] [CrossRef]


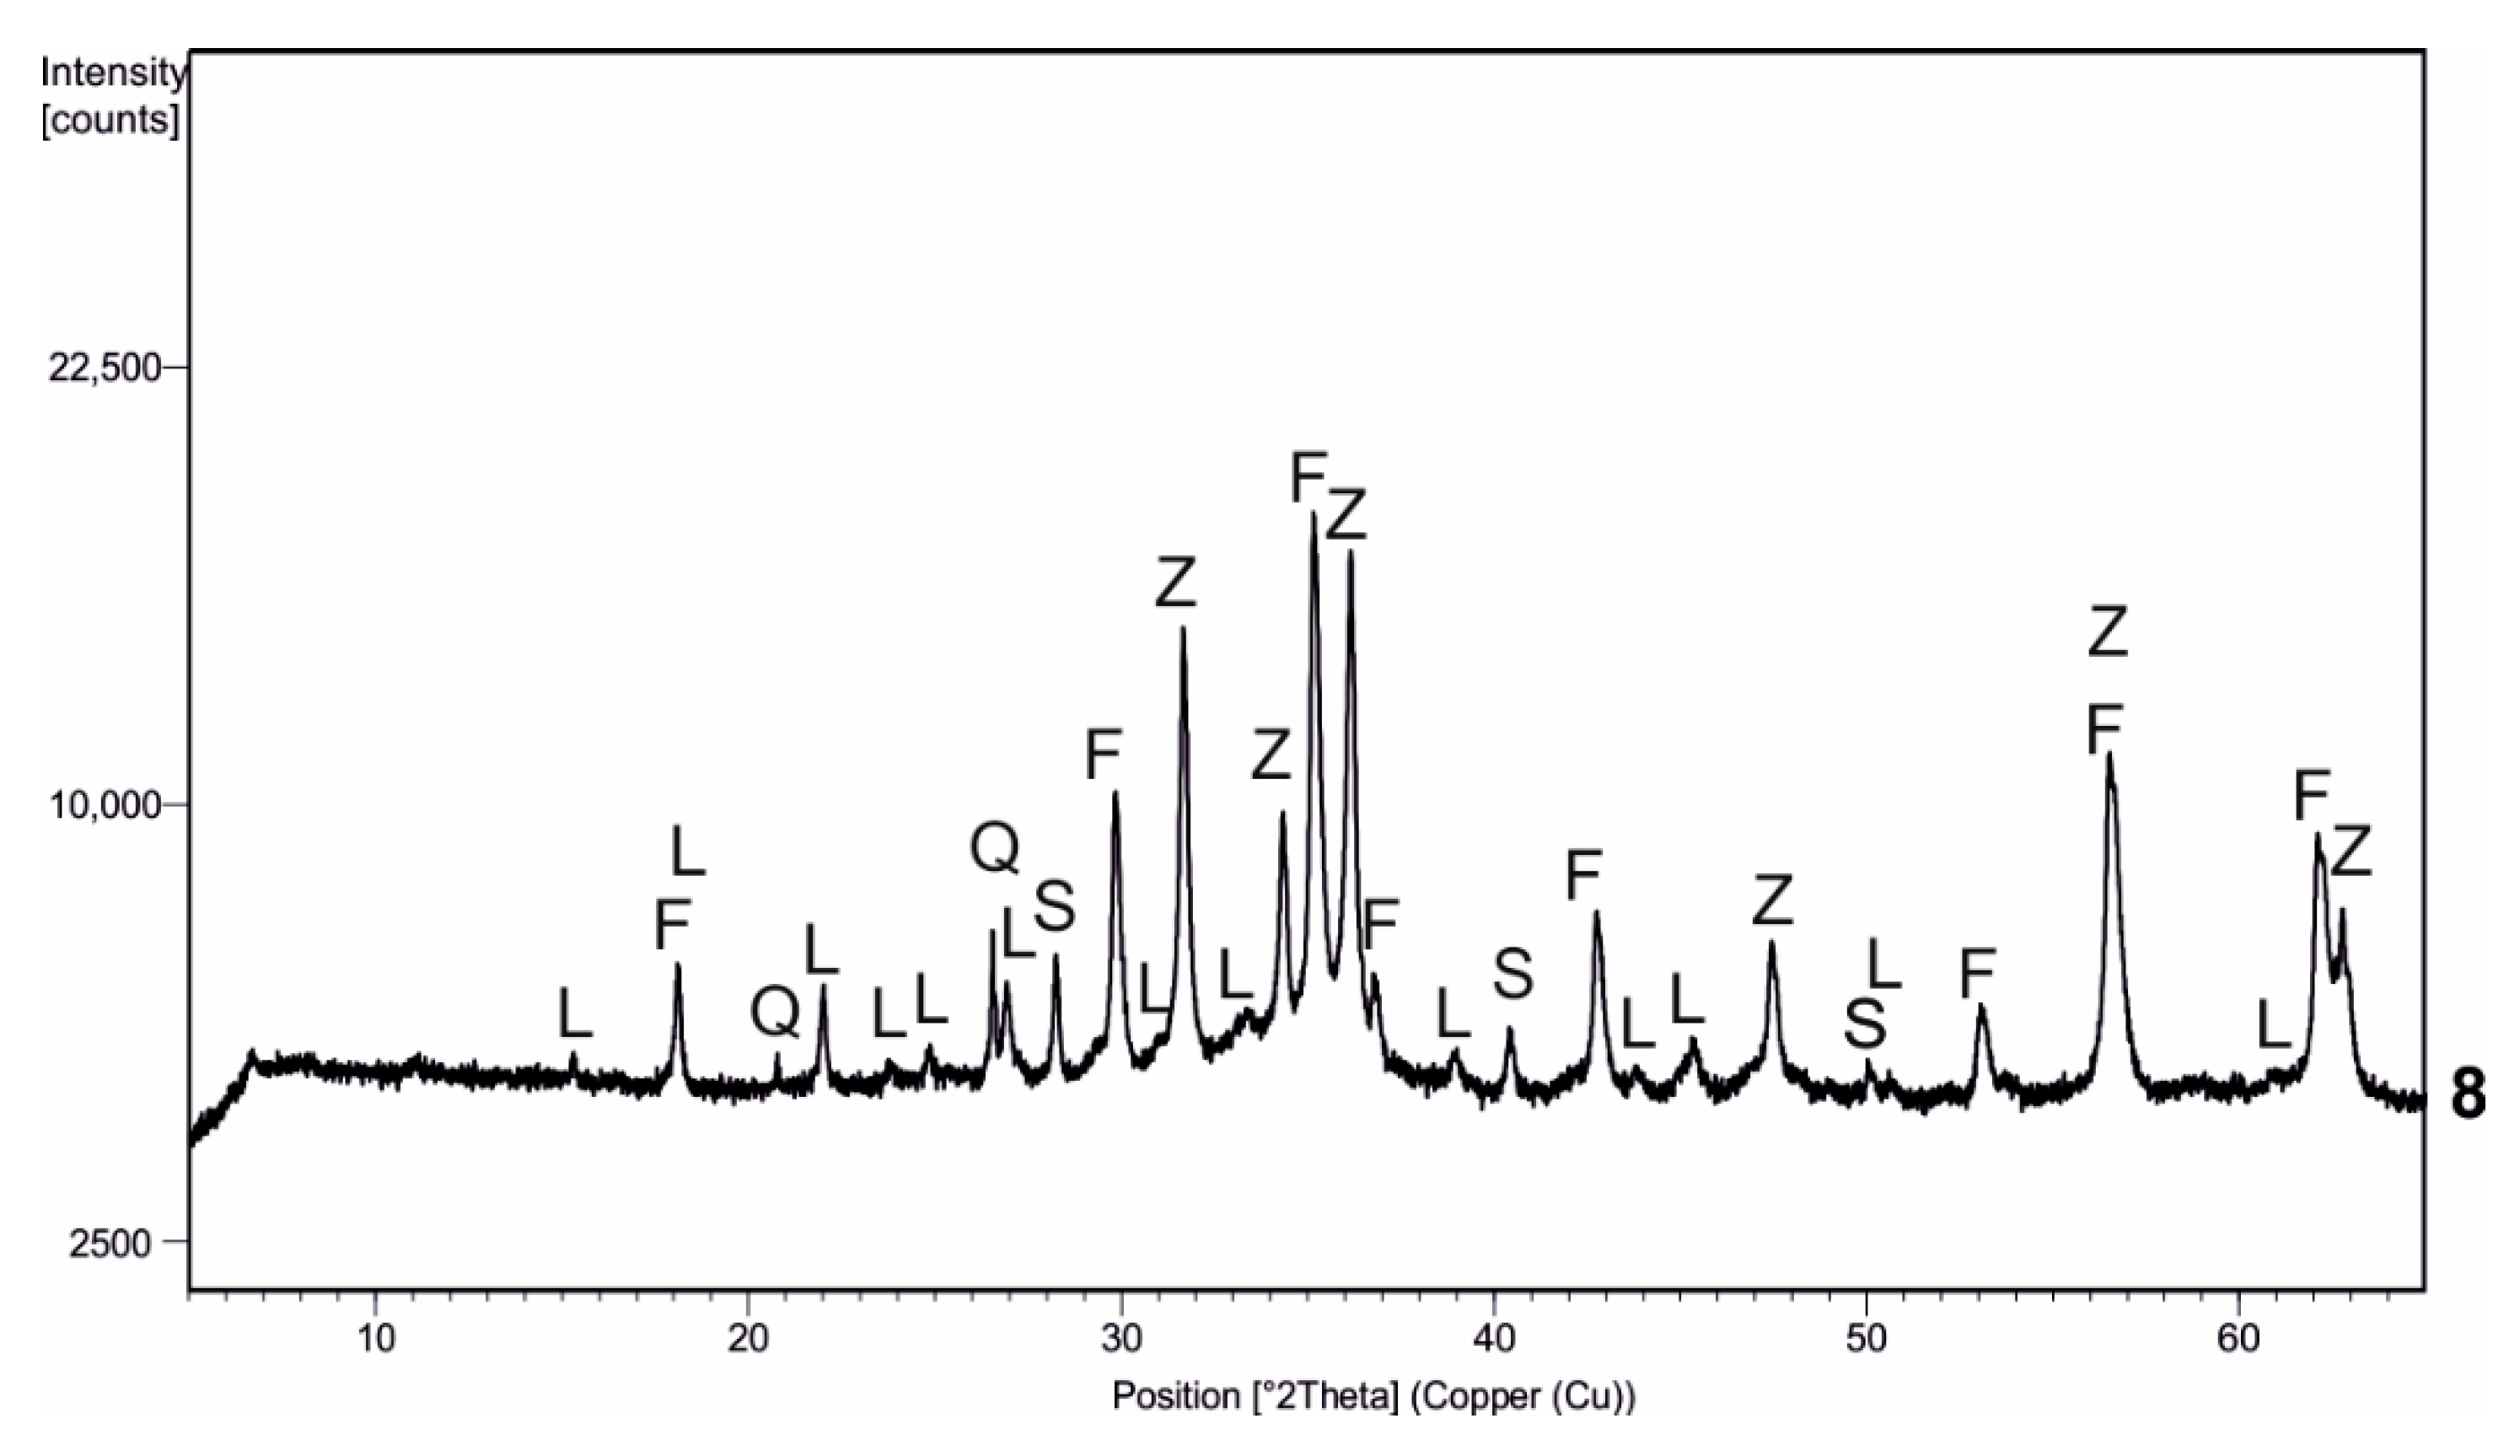
| Kind of Process | Sample No. | χ | Cd | Cu | Cr | Fe | Mn | Pb | Zn | V |
|---|---|---|---|---|---|---|---|---|---|---|
| Iron Metallurgy | ||||||||||
| ×10−8 m3/kg | mg/kg | mg/kg | mg/kg | % | % | % | % | mg/kg | ||
| scale | 7 | 4633 | 0.25 | 1087 | 123 | 73.8 | 0.6 | 0 | 0 | 16.0 |
| de-dusting dust | 8 | 9488 | 570 | 1153 | 492 | 18.4 | 1.4 | 2.5 | 2.6 | 42.9 |
| steel dust | 16 | 1604 | 930 | 2477 | 1144 | 23.3 | 2.6 | 1.9 | 2.9 | 78.6 |
| steel dust | 17 | 9099 | 420 | 694 | 331 | 2.9 | 0.7 | 1.1 | 3.2 | 2.5 |
| steel dust | 18 | 5630 | 55 | 118 | 140 | 39.2 | 1.4 | 0.2 | 1.1 | 50.4 |
| sinter dust | 20 | 1950 | 10 | 105 | 49 | 48.6 | 0.1 | 0.1 | 0 | 18.2 |
| iron-bearing sludge | 22 | 5840 | 33 | 477 | 101 | 52.8 | 0.6 | 0.2 | 1.1 | 29.4 |
| iron-bearing sludge | 23 | 4994 | 8 | 269 | 185 | 63.0 | 0.6 | 0.2 | 0.9 | 74.8 |
| Non-Ferrous Metallurgy | ||||||||||
| ×10−8 m3/kg | % | mg/kg | mg/kg | % | mg/kg | % | % | mg/kg | ||
| zinc rectification | 10 | 5 | 4.60 | 215 | 1 | 0 | 14 | 1.0 | 4.3 | 2.5 |
| lead refinery | 11 | 62 | 0.15 | 2484 | 7 | 0.2 | 3 | 3.3 | 3.2 | 2.5 |
| sinter plant | 9 | 440 | 2.80 | 4295 | 59 | 2.1 | 986 | 3.1 | 2.8 | 16.3 |
| shaft furnace | 12 | 873 | 0.47 | 1581 | 20 | 1.3 | 613 | 3.5 | 3.9 | 5.8 |
| Component | Formula | Scale | De-Dusting dust | Steel Dust | Sinter Dust | Iron-Bearing Sludge | |||
|---|---|---|---|---|---|---|---|---|---|
| Sample number: | 7 | 8 | 16 | 17 | 18 | 20 | 22 | 23 | |
| franklinite-jacobsite | (Zn,Mn2+,Fe2+)(Fe3+,Mn3+)2O4 | 30.0 | 44.5 | 52.5 | |||||
| magnetite | Fe3O4 | 48.0 | 24.5 | 27.0 | 30.0 | 37.5 | 9.5 | 9.0 | |
| hematite | Fe2 O3 | 8.5 | 46.5 | 34.0 | 23.0 | ||||
| wüstite | FeO | 43.5 | 30.0 | 39.5 | |||||
| quartz | SiO2 | 3.0 | 1.5 | 9.5 | |||||
| zincite | ZnO | 38.5 | 24.0 | 40.5 | 2.5 | ||||
| laurionite | PbClOH | 1.5 | 1.5 | 1.5 | |||||
| sylvine | KCl | 2.5 | 1.5 | 1.5 | 7.5 | ||||
| halite | NaCl | 4.0 | 3.0 | ||||||
| calcite | CaCO3 | 4.5 | 8.5 | 23.0 | 30.0 | ||||
| portlandite | Ca(OH)2 | 4.0 | |||||||
| graphite | C | 12.5 | |||||||
| srebrodolskite | Ca2(Fe3+)2O5 | 1.5 | 2.0 | ||||||
| iron | Fe | 13.0 | 19.5 | ||||||
| sum | 100 | 100 | 100 | 100 | 100 | 100 | 100 | 100 | |
| Component | Formula | Process and Sample Number | |||
|---|---|---|---|---|---|
| Zinc Rectification | Lead Refinery | Sinter Plant | Shaft Furnace | ||
| 10 | 11 | 9 | 12 | ||
| zincite | ZnO | 95.0 | 28.0 | 2.5 | 66.0 |
| gordaite | NaZn4SO4Cl(OH)6 × 6H2O | 11.5 | 2.0 | ||
| challacolloite | KPb2Cl5 | 45.0 | |||
| palmierite | K2Pb(SO4)2 | 0.5 | 3.5 | 12.5 | |
| anglesite | PbSO4 | 36.0 | 17.5 | 13.5 | |
| matlockite | PbClF | 13.5 | 1.0 | ||
| lanarkite | Pb2OSO4 | 34.0 | 2.0 | 2.0 | |
| osakaite | Zn4SO4(OH)6 × 5H2O | 2.0 | 1.5 | ||
| lahnsteinite | Zn4SO4(OH)6 × 3H2O | 1.5 | |||
| sylvine | KCl | 1.5 | |||
| galena | PbS | 2.5 | |||
| otavite | CdCO3 | 2.0 | |||
| monteponite | CdO | 3.0 | |||
| sum | 100 | 100 | 100 | 100 | |
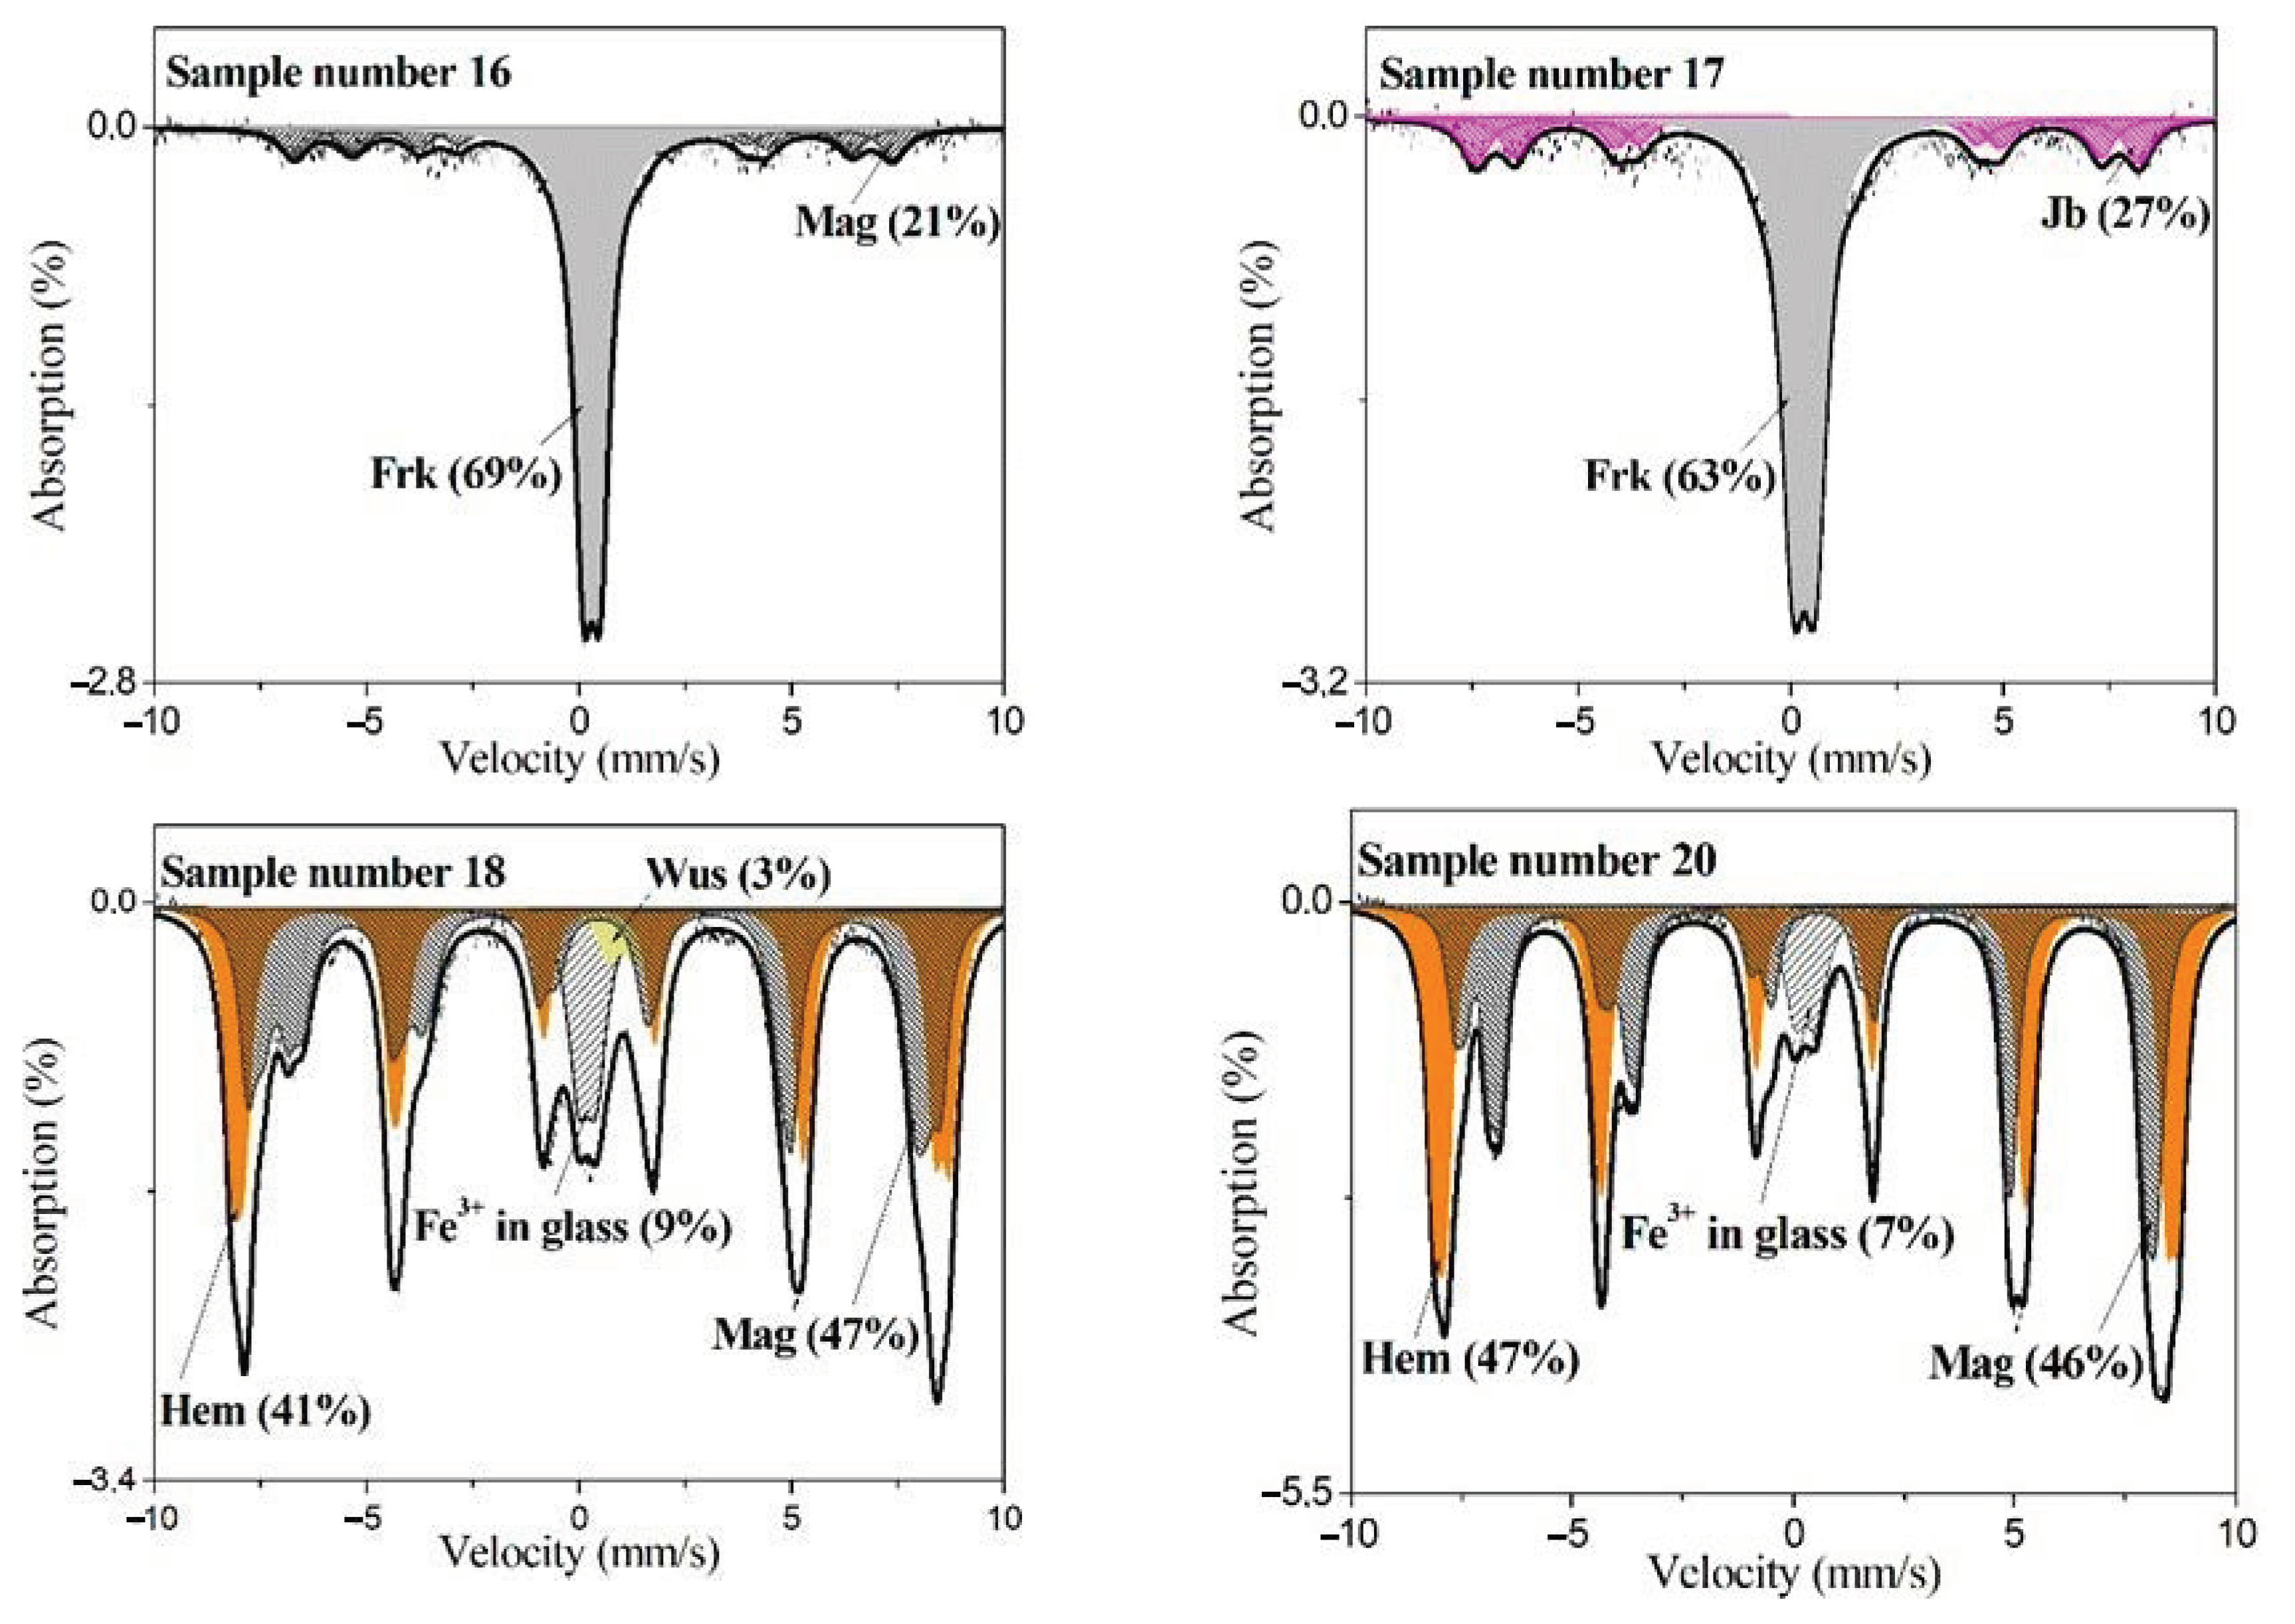
| Component | |||||||||
|---|---|---|---|---|---|---|---|---|---|
| Kind of Dust | Sample No. | Jacobsite | Franklinite | Magnetite | Hematite | Wüstite | Fe2+ in Calcite | Fe3+ in Glass | Iron |
| scale | 7 | 49 | 21 | 30 | |||||
| de-dusting dust | 8 | 78 | 22 | ||||||
| steel dust | 16 | 86 | 14 | ||||||
| 17 | 20 | 80 | |||||||
| 18 | 47 | 41 | 3 | 9 | |||||
| sinter dust | 20 | 46 | 47 | 7 | |||||
| iron-bearing sludge | 22 | 22 | 17 | 24 | 3 | 14 | 20 | ||
| 23 | 15 | 38 | 3 | 12 | 32 | ||||
Publisher’s Note: MDPI stays neutral with regard to jurisdictional claims in published maps and institutional affiliations. |
© 2021 by the authors. Licensee MDPI, Basel, Switzerland. This article is an open access article distributed under the terms and conditions of the Creative Commons Attribution (CC BY) license (http://creativecommons.org/licenses/by/4.0/).
Share and Cite
Jabłońska, M.; Rachwał, M.; Wawer, M.; Kądziołka-Gaweł, M.; Teper, E.; Krzykawski, T.; Smołka-Danielowska, D. Mineralogical and Chemical Specificity of Dusts Originating from Iron and Non-Ferrous Metallurgy in the Light of Their Magnetic Susceptibility. Minerals 2021, 11, 216. https://doi.org/10.3390/min11020216
Jabłońska M, Rachwał M, Wawer M, Kądziołka-Gaweł M, Teper E, Krzykawski T, Smołka-Danielowska D. Mineralogical and Chemical Specificity of Dusts Originating from Iron and Non-Ferrous Metallurgy in the Light of Their Magnetic Susceptibility. Minerals. 2021; 11(2):216. https://doi.org/10.3390/min11020216
Chicago/Turabian StyleJabłońska, Mariola, Marzena Rachwał, Małgorzata Wawer, Mariola Kądziołka-Gaweł, Ewa Teper, Tomasz Krzykawski, and Danuta Smołka-Danielowska. 2021. "Mineralogical and Chemical Specificity of Dusts Originating from Iron and Non-Ferrous Metallurgy in the Light of Their Magnetic Susceptibility" Minerals 11, no. 2: 216. https://doi.org/10.3390/min11020216
APA StyleJabłońska, M., Rachwał, M., Wawer, M., Kądziołka-Gaweł, M., Teper, E., Krzykawski, T., & Smołka-Danielowska, D. (2021). Mineralogical and Chemical Specificity of Dusts Originating from Iron and Non-Ferrous Metallurgy in the Light of Their Magnetic Susceptibility. Minerals, 11(2), 216. https://doi.org/10.3390/min11020216