Article

Structural and High-Pressure Properties of Rheniite (ReS2) and (Re,Mo)S2

1
Geosciences Barcelona (GEO3BCN), CSIC, 08028 Barcelona, Spain
2
Department of Semiconductor Materials Engineering, Wrocław University of Science and Technology, 50-370 Wrocław, Poland
3
Department of Physics and Materials Science, University of Luxembourg, L-4422 Belvaux, Luxembourg
4
CELLS-ALBA Synchrotron Light Facility, 08290 Barcelona, Spain
5
Department of Electronic and Biomedical Engineering, University of Barcelona, 08028 Barcelona, Spain
*
Authors to whom correspondence should be addressed.
Minerals 2021, 11(2), 207; https://doi.org/10.3390/min11020207
Submission received: 12 January 2021 / Revised: 3 February 2021 / Accepted: 13 February 2021 / Published: 16 February 2021
(This article belongs to the Special Issue First Principles Calculations of Minerals and Related Materials)

Abstract

:
Rhenium disulfide (ReS2), known in nature as the mineral rheniite, is a very interesting compound owing to its remarkable fundamental properties and great potential to develop novel device applications. Here we perform density functional theory (DFT) calculations to investigate the structural properties and compression behavior of this compound and also of the (Re,Mo)S2 solid solution as a function of Re/Mo content. Our theoretical analysis is complemented with high-pressure X-ray diffraction (XRD) measurements, which have allowed us to reevaluate the phase transition pressure and equation of state of 1T-ReS2. We have observed the 1T-to-1T’ phase transition at pressures as low as ~2 GPa, and we have obtained an experimental bulk modulus, B0, equal to 46(2) GPa. This value is in good agreement with PBE+D3 calculations, thus confirming the ability of this functional to model the compression behavior of layered transition metal dichalcogenides, provided that van der Waals corrections are taken into account. Our experimental data and analysis confirm the important role played by van der Waals effects in the high-pressure properties of 1T-ReS2.

1. Introduction

Rhenium disulfide (ReS2) is a highly interesting material from many different perspectives, including the fundamental, applied, and mineralogical points of view. In its natural form, ReS2 is known as rheniite and was first discovered forming sublimates in high-temperature fumaroles at the Kudryavy volcano, in the Kurile volcanic arc, Russia [1,2]. This mineral was subsequently found in porphyry-type mineralizations in the Pagoni Rachi and Konos prospects, in northeastern Greece [3]. Some of these sites have also yielded Re-rich molybdenites and Mo-rich rheniites [3,4], which are nice examples of ore-grade enrichment of rhenium. This element is among the most valuable metals due to its low average crustal concentration (<1 ppb). Although it is now clear that Re-rich molybdenites crystallize in the usual 2H polytype and not in the 3R polytype as previously hypothesized by some authors [5,6], a full characterization of the fundamental structural properties and stability of the (Re,Mo)S2 solid solution is still lacking.
In its synthetic form, ReS2 is a highly remarkable compound as it belongs to the family of two-dimensional (2D) layered transition metal dichalcogenide materials (TMDCs). These are MX2-type compounds where M is a transition metal atom (Mo, W, Hf, Zr, Re, ...) and X is a group-16 atom (S, Se, Te). Natural TMDCs include rheniite (ReS2), molybdenite (MoS2), tungstenite (WS2), or drysdallite (Mo(Se,S)2). Their synthetic counterparts are currently attracting a great deal of research attention due to their unusual fundamental properties and great potential to develop novel electronic and optoelectronic applications [7]. Given their layered structure, TMDCs can be obtained in monolayer form, thus resulting in remarkable optical and electronic properties arising from the 2D nature of the material.
In particular, rhenium-based TMDCs have attracted considerable research attention in the last few years owing to their large in-plane anisotropic properties, which arise from their reduced crystal symmetry and presumed 2D character even in bulk. Rheniite crystallizes in a distorted CdCl2 structure with triclinic symmetry (space group P ¯ 1 , see Figure S1a in the Supplementary Material) [8,9]. The pronounced Jahn–Teller effect and, presumably, the Peierls mechanism, prevent an ordered stacking, which results in a weakened van der Waals (vdW) interaction and decreased crystal symmetry [10,11,12]. Each molecular unit is composed of a Re atom octahedrally coordinated with sulfur atoms, giving rise to Re layers sandwiched between S atoms that dominate the vdW interaction. This particular crystal structure strongly affects the optical, vibrational and structural properties of Re-containing TMDCs. For instance, and in contrast to what is observed in other TMDCs, the Raman spectra and photoluminescence emission of bulk ReS2 are practically identical to those of the monolayer form, which led some authors to the conclusion that ReS2 and also ReSe2 mostly behave as stacked decoupled layers [13]. According to this point of view, the small interlayer coupling in ReS2-type materials might allow one to develop bulk devices that could retain the 2D functionalities of the single-layered materials.
However, angle-resolved photoemission spectroscopy (ARPES) measurements showed that there exists a significant electronic dispersion along the vdW gap [14], thus suggesting that the interlayer forces still play an important role in this compound. Moreover, high-pressure (HP) optical measurements in combination with an orbital analysis based on density functional theory (DFT) calculations have recently shown that the optical and electronic properties of ReS2 are strongly affected by interlayer interactions [15]. Despite the intriguing fundamental properties and high technological interest of Re-based TMDCs, more work is required in order to gain a full understanding of the role played by interlayer coupling on their structural properties and HP behavior.
With regard to the latter, pressure studies may be particularly informative, since compression strongly affects the weak vdW bonds between layers. Several works have studied the fundamental properties of ReS2 upon compression, experimentally or theoretically. HP X-ray diffraction (XRD) measurements allow one to effectively modulate the interlayer distance as a function of compression, and have revealed that the bulk modulus of ReS2 is significantly lower than that of other TMDCs (typically in the range 55–75 GPa [16,17,18]). The larger compressibility of ReS2 confirms that the interlayer forces are smaller relative to other layered compounds [16,19,20]. However, the range of reported bulk modulus (23–44 GPa) [8,9,10] and phase-transition pressures (6–11.3 GPa) in this compound is rather disperse [21,22,23] and, therefore, more experimental work seems necessary.
In addition, the HP phase has proven to be more difficult to identify owing to its similarity with the low-pressure phase. Both phases belong to the P ¯ 1 group but exhibit a different layer stacking configuration (see Figure S1). Most studies identify the room pressure phase as distorted-1T and the HP phase as distorted-1T’ [8,13,22,23]. We would like to mention, however, that Zhou et al. [19] showed that the ambient-pressure phase can be better symmetrized into a distorted 3R structure (space group: R 3 ¯ m ). This phase is equivalent to the 1T-phase reported in other works. Then, these authors denominate the HP phase as “distorted 1T”. On account of these assignments, supported by subsequent DFT calculations [24], both phases are also sometimes referred as P 1 ¯ and P 1 ¯ , respectively.
Raman scattering measurements have also been extensively used to study layered compounds. However, owing to the striking similarities between the 1T and 1T’ phases of ReS2, the resolution of the phase transition with pressure is not straightforward, even for this highly sensitive technique [25]. So far, high pressure Raman measurements either omitted the phase transition [13] or have provided highly scattered values, ranging from 2.5 GPa [26] up to 15 GPa [27]. Some Raman works reported transition pressures around 6–8 GPa [23], in agreement with the HP-XRD studies, which report values around 6–11.3 GPa [21,22,23]. However, it is worth noting that the previous Raman-scattering studies only considered high-frequency modes related to intralayer vibrations rather than low-frequency interlayer modes, which should be more sensitive to the layer stacking configuration. A recent first-principles study found that calculated differences between Raman frequencies and pressure coefficients in both phases should be very similar [28]. Hence, alternative techniques such as infrared spectroscopy or inelastic X-ray and neutron scattering have been proposed to better resolve the transition pressure.
DFT calculations have been widely used to understand, among others, the optical [27], electrical [19] and structural [22] properties of ReS2. DFT studies published so far have shown to be highly dependent on the particular functional used, predicting a phase transition onset between 0.1 GPa and 3 GPa, [19,22,24] far from most experimental values, around 6–11.3 GPa [21,22,23]. The poor agreement between experimental and theoretical results highlights the importance of additional experimental and theoretical works to better constrain the pressure behavior of ReS2.
The aim of the present work is to investigate the compression behavior of the low-pressure phase, i.e., (triclinic) 1T-rheniite and, by extension, of the corresponding 1T-(Re,Mo)S2 solid solution. For this purpose, we have performed DFT calculations using special quasirandom structures (SQSs) [29] to model the substitutionally random Re1−xMoxS2 alloy. Using the SQS approach, we have calculated the structural properties of 1T and 2H Re1−xMoxS2 alloys as a function of Mo molar content (x). Our results show that, at ambient pressure, the 1T (2H) phase is more energetically favorable above (below) x = 0.5. The calculations predict a reduction of the c parameter of 1T-Re1−xMoxS2 with increasing Mo content and a much smaller dependence for the rest of parameters. The bulk modulus of 1T-Re1−xMoxS2 is found not to depend very strongly on x, which can be attributed to the similar ionic radius of Re and Mo.
Given the high dispersion of experimental and theoretical bulk modulus and 1T-to-1T’ phase-transition pressure values reported in the literature for the case of pure ReS2, we complement the pressure work with additional HPXRD synchrotron experiments on synthetic material. These measurements show that the onset of the phase transition in ReS2 is as low as ~2.1 GPa. This value, to the best of our knowledge, is the lowest experimental value so far reported, in good agreement with previous theoretical predictions. The experimental bulk modulus of ReS2 is reevaluated, and the value thus obtained (B0 = 46 GPa) is in good agreement with the PBE+D3 calculations. This confirms the validity of this functional, when vdW interactions are taken into account, in order to describe the structural properties of TMDCs under high hydrostatic pressure.

2. First-Principles Calculations

Recent works testing different DFT methods against experimentally determined HP optical, vibrational and structural properties of TMDCs have concluded that the widely employed LDA functional is too simplistic. Therefore, more advanced methods including the exchange-correlation functional in the generalized gradient approximation (GGA) with vdW corrections such as Grimme’s D2 or D3 [30], Tkachenko-Scheffler [31] or meta-GGA SCAN functional [32] with rVV10 vdW functional [33], better predict the structural properties of layered materials [34,35]. In the present work we rely on the Perdew–Burke–Ernzerhof (PBE) parametrization [36] and D3 vdW correction, which has been shown to provide very good results for the HP behavior of 1T-TMDCs [34].
DFT calculations have been performed for 1T-ReS2 and for the (Re,Mo)S2 solid solution, both for the 1T and 2H structures, using the Vienna Ab-initio Simulation Package (VASP) [37]. All calculations were performed with the projector augmented waves (PAW) scheme [38], including spin-orbit interaction and vdW dispersion corrections with the D3 method [30]. The exchange-correlation energy was obtained with the PBE parametrization of GGA functional [36]. A Gaussian smearing of 0.05 eV was used for the Brillouin-zone integrations.
For the calculations on (Re,Mo)S2 structures, SQSs of different sizes were considered in order to model the substitutional random solid solution [29]. SQS determination was carried out by using ATAT software [39]. Total energy convergence was tested with respect to the size of the supercells and pair clusters radii. The supercells were not extended in the out-of-plane direction due to the weak interlayer coupling in the TMDCs. Dense Γ-centered Monkhorst−Pack grids of special k-points of different sizes were used. Energy cutoffs and k-grids were tested for pure crystals cases in order to assure the convergence of lattice constants up to 0.001 Å. Atomic positions and lattice vectors were optimized so that the interatomic forces and stress tensor components are lower than 0.002 eV/Å and 0.005 GPa, respectively.

3. Experimental Methods

For the present work, ReS2 flakes commercially obtained from HQ graphene were employed. This material, synthesized by the chemical transport growth method with Re (99.9999% purity) and S precursors, was carefully ground by using agate mortar and pestle. HP angle-dispersive powder XRD measurements were acquired at room temperature in the BL04-MSPD beamline at ALBA synchrotron facility [40]. This beamline is equipped with Kirkpatrick–Baez mirrors to focus the monochromatic X-ray beam and a Rayonix CCD detector with a 165 mm diameter active area. The XRD experiments were performed with monochromatic X-rays with a wavelength of 0.4246 Å, as determined from the absorption K-edge of Sn (29.2 keV). The sample was loaded together with tiny copper flakes in a membrane-type diamond anvil cell (DAC) with 400-µm-diameter diamond culets. A 4:1 methanol-ethanol mixture was employed as pressure transmitting medium, and the applied pressure was determined with the equation of state (EoS) of copper. For this purpose, several scans were acquired at different regions of the DAC for a given pressure, with the aim of optimizing the XRD signal from the sample or that from copper. The associate error to this pressure determination, including possible pressure gradients inside the DAC, is lower than 0.5 GPa. The sample-to-detector distance (~240 mm), along with various detector geometrical parameters of the experiment, were calibrated from XRD measurements on LaB6 callibrant using the DIOPTAS software. All the structural analyses of the XRD scans were performed with the program TOPAS 4.2 from Bruker. Experimental lattice parameters were obtained as a function of pressure with Pawley whole pattern fittings. Due to strong preferential effects, it was not possible to refine the atomic coordinates.

4. Results and Discussion

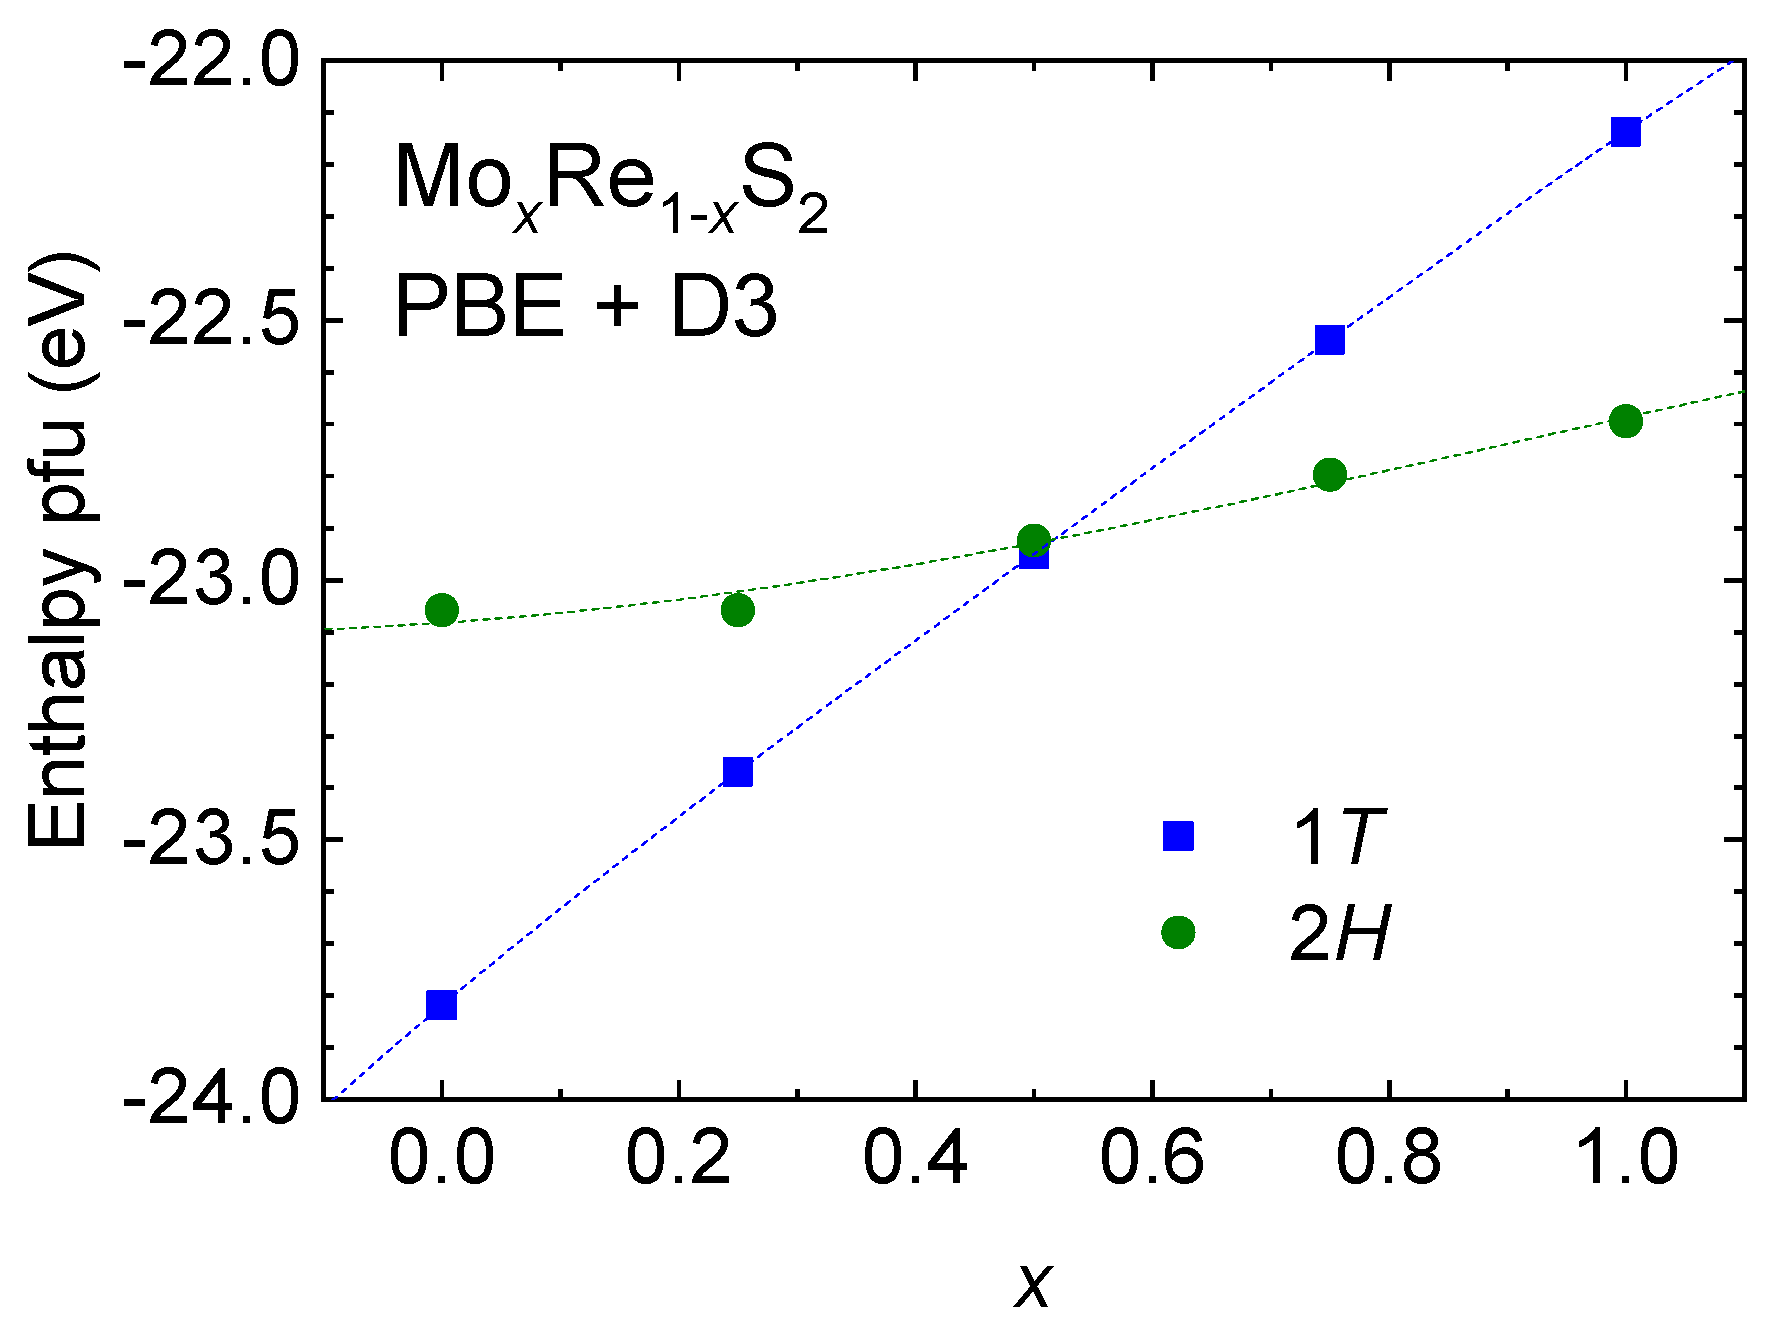
4.1. The Re1−xMoxS2 Solid Solution

We must first note that two different triclinic structures have been reported for 1T-ReS2 [8,9], with different unit cell dimensions and atoms per formula unit (pfu). Both structures are shown in Figure S1a,b. Most works rely on the simpler structure of Ref. [8], which is the case, for instance, of the work describing the properties of the mineral rheniite [2]. However, as discussed by Lamfers and co-workers [9], it cannot be ruled out that the doubling of the lattice parameter perpendicular to the ReS2 sandwiches (with one Re layer between two S layers) was overlooked in the structural determination carried out by Murray et al. in Ref [8]. This would imply that the ReS2 structure contains two inequivalent sandwiches repeated along the direction perpendicular to the sandwiches. Nevertheless, both structures are very similar and cannot be easily distinguished by standard methods like, for instance, powder XRD measurements. Here we have performed DFT calculations to evaluate the relative stability of both phases. For this purpose, we have relaxed different SQSs of different sizes and obtained the corresponding enthalpy per formula unit (pfu). As can be expected, the doubled structure by Lamfers and co-workers [9] gives slightly lower enthalpy values, as more atoms are relaxed and therefore an overall lower total energy can be achieved. However, the difference in total energy between the two structures is in all cases as low as ~5 × 10⁻⁵ eV pfu, which suggests that they are virtually equivalent from the point of view of total energy calculations. Therefore, in the present work we also rely, for the sake of avoiding too expensive computations, on the structure of 1T-ReS2 reported in Ref. [8]. It must be noted that in that work the direction perpendicular to the sandwiches corresponds to the a axis, and not to the c axis. Here we use the same setting to allow for direct comparison (see Figure S1).
Figure 1 shows the enthalpy pfu for the MoxRe1xS2 solid solution as a function of Mo molar content (x), for both the 1T and 2H structures of rheniite and molybdenite, respectively. Both curves correspond to the minimum enthalpy pfu obtained after geometrical optimization of SQSs of different sizes and pair clusters radii. As can be seen in the figure, the PBE+D3 calculations do not predict any higher stability of the 1T or 2H structure beyond the 50% alloy composition range. This result confirms the experimental and theoretical results of Ref. [41], where the structural stability and electronic structure of MoS2-ReS2 was explored.
We would like to note that we have not taken into account the configurational entropy (ΔSconf) of the different SQSs for a given composition because the DFT calculations formally correspond to zero temperature and, therefore, TΔSconf = 0. Nevertheless, using the basic definition of configurational entropy from Boltzmann equation, ΔSconf = −kB[lnx + (1 − x)·ln(1 − x)], where kB is the Boltzmann constant, it is easy to show that the maximum configurational entropy in a binary alloy like MoxRe1xS2 takes place at x = 0.5 and is equal to 0.69kB (pfu). This value is of the order of ~ 6 × 10⁻⁵ eV·K−1, while the enthalpy differences that we obtain for different SQSs at x = 0.5 are ΔH ~ 0.02 eV pfu (Figure 1 only shows minimum enthalpy values). Therefore, at a temperature of T = ΔHSconf ~ 330 K, such enthalpy differences are of the same order as the maximum configurational entropy of the alloy. However, the latter is expected to be much larger than configurational entropy differences between different, nearly-random SQSs. This implies that, in contrast to what occurs in high-entropy alloys (with a much larger number of atoms mixing in the same site), ΔSconf can be safely neglected for the purposes of this work, as it can only affect the relative stability of different SQSs at very large temperatures (T >> 330 K).
The lattice parameters resulting from the minimum-enthalpy SQSs for the 1T and 2H polytypes of bulk MoxRe1xS2 are plotted in Figure 2a,b, respectively. These two figures do not include data points for 1T-MoS2 and 2H-ReS2, respectively, because the resulting structures are not reliable (i.e., they are not stable and could only be further relaxed with a tighter geometrical optimization). For the case of the pure 1T-ReS2 and 2H-MoS2 compounds, the agreement between calculated and experimental values is excellent (see below for further discussion about 1T-ReS2; for the case of 2H-MoS2, a = 3.15 Å and c = 12.30 Å [42]). As can be seen in both figures, the PBE+D3 calculations do not predict monotonic lattice parameter variations as a function of Mo/Re content. In particular, the interlayer spacing of the 1T structure (the a parameter) is predicted to suddenly increase for x > 0.2, while the calculated c parameter of the 2H structure reaches a minimum at around x~0.75 (Figure 2). Unfortunately, there are no much experimental data regarding the lattice parameters of Re-rich MoS2 or Mo-rich ReS2. In the mineral form, a linear decrease of both a and c parameters in molybdenite has been reported as a function of Re content (Re < 0.04), with a progressive shortening of the Mo-S mean bond distance [3]. While the present calculations do not predict any significant change for the a parameter of Re-doped 2H-MoS2 (Figure 2b), the calculated reduction of the c spacing with Re concentration is also lower than that found experimentally. Taking into account the similar ionic radius of Re4+ and Mo4+ (0.63 Å vs. 0.65 Å, see for instance Ref. [3] and references therein), it seems unlikely that the uniform decrease of the unit-cell values reported by Voudouris and co-workers [3] solely corresponds to progressive substitution of Mo by Re atoms. The present PBE+D3 calculations seem to suggest that the substitutional effect on the non-axial parameter of the 2H phase is very small, while the intralayer lattice parameters of the 1T phase (b and c parameters) tend to approach each other. In turn, the non-monotonic complex behavior of the interlayer axes can be related to dispersion effects. Thus, other possible substitutional or interstitial configurations, like for instance incorporation of Mo or Re atoms into S sites, might also explain the experimental observations of Ref. [3]. With regard to the MoxRe1−xS2 alloys obtained by direct high-temperature synthesis methods in Ref. [43], no dramatic changes are observed in the lattice spacings up to x = 0.20. However, XRD patterns of the synthesized samples are highly broadened, indicating poor degrees of crystallinity that do not allow for a reliable characterization of the structural properties of the solid solution. More experimental and theoretical work is thus required to fully understand the alloying behavior of this interesting system.

4.2. 1T-ReS2 and Re1−xMoxS2 under Pressure

Next, we focus on the pressure behavior of 1T-ReS2 and the corresponding (Re,Mo)S2 solid solution. Figure 3 shows the theoretical pressure (P)-volume (V) dependence for the case of 1T-ReS2, obtained with PBE and PBE+D3 calculations. Clearly, the PBE functional without vdW corrections does not accurately predict the zero-pressure volume of ReS2 (265 Å3 vs 219.3 Å3 for the synthetic compound [8]). Also, the PBE calculations yield an anomalous compression behavior that is more evident at lower pressures (see Figure 3). A fit with a 2nd, 3rd, or even a 4th order Birch–Murnaghan (BM) EoS to the calculated P-V dependence is unable to properly adjust the PBE data along the entire 0–25 GPa pressure range. If, instead, the fit is restricted to the 0–5 GPa range, an exceedingly low bulk modulus B0 = 14.8 GPa is found by using a 2nd order BM EoS (BM-2). This value would imply a very large compressibility for this compound, much larger than that found in other TMDCs. However, this result is manifestly wrong, as it is a consequence of the fact that dispersion effects (i.e., interlayer interactions) have been neglected in the calculations, giving rise to ill-behaved compression. Only at larger pressures, when the compound becomes less compressible due to the much lower interatomic distances, the P-V dependence exhibits a better-defined behavior (see Figure 3). The fact that PBE calculations without vdW correction fail to reproduce the compression behavior of ReS2 has already been reported for other TMDCs compounds like HfS2 or MoS2 [34], thus confirming the importance of dispersion effects in ReS2.
In contrast, PBE+D3 correctly predicts both the zero-pressure value (224.9(5) Å3 vs. 219.3 Å3 for synthetic ReS2) and yields a well-defined EoS from ambient pressure up to 25 GPa (Figure 3). A fit with a 3rd-order BM EoS (BM-3) yields a zero-pressure bulk modulus B0 = 44(2) GPa, with a first derivative equal to B’ = 7.7(5). The value for B0 is in excellent agreement with recent experimental results for this compound [23] and, as will be explained below, also with our own experimental determinations. However, a careful analysis of the normalized pressure (F) vs. strain curves (f) that result from the theoretical P-V dependence obtained with PBE+D3 (see Figure S2a,b) suggests that a 4th-order BM EoS (BM-4) provides the best fit along the whole pressure range. The BM-4 fit yields a somewhat lower bulk modulus (B0 = 35.1(2) GPa) and a larger first-order derivative (B’ = 13.2(1), see also Table 1). The comparison between the PBE and PBE+D3 calculations clearly shows that vdW corrections need to be included in order to correctly describe the structural and compression properties of ReS2 and, by extension, of (Re,Mo)S2 alloys and related compounds, like for instance ReSe2 and its solid solutions.
Finally, in order to ascertain the compositional effect on the compression properties of the 1T-Re1−xMoxS2 solid solution, we have performed additional PBE+D3 calculations of the P-V dependence for the 1T phase as a function of Mo molar content (x). For x = 0.25, our calculations and subsequent BM-4 fit predict a zero-pressure bulk modulus B0 = 34.2 GPa, which is only slightly lower than that obtained for 1T-ReS2 (35.1 GPa). At intermediate compositions (x = 0.5), the resulting bulk modulus is somewhat lower (29.5 GPa), while for x = 0.75 it is again closer to that of pure ReS2 (33.8 GPa). Although more work should be carried out in order to fully understand the HP structural properties of this alloy, the present results seem to point towards a relatively small effect of Mo incorporation on the compression behavior of 1T-(Re,Mo)S2. As in the case of the lattice parameters plotted in Figure 2, this may be attributed to the similar ionic radius of both atomic species.

4.3. High-Pressure XRD of 1T-ReS2

Given the large dispersion of experimental results that can be found in the literature for the phase transition pressure of 1T-ReS2, we complement the present study with HP synchrotron XRD measurements, with the aim of better constraining the compressibility values for the low-pressure polymorph. Figure 4 shows XRD scans for different pressures, up to 4.8 GPa. The scans clearly show the expected shift to larger angles with increasing pressure for all the reflections of 1T-ReS2 (see Figure S3 in the Supplementary material for a better observation of the reflection shifts as a function of pressure). In addition, new peaks marked with asterisks show up at pressures just above 2 GPa. This can be seen more clearly in the inset of the figure for the case of the low-angle range. The appearance of these reflections can be attributed to the 1T to 1T’ phase transition. Noteworthy, the low phase-transition pressure value found in this work agrees well with previous DFT calculations [19,22,24]. With regard to experimental determinations, our results seem to confirm the observations of Ref. [26], where the structural phase transition was found around 2.5 GPa by means of Raman spectroscopy. In contrast, most experimental works have reported much larger phase transitions, typically above 5 GPa and up to 15 GPa [21,22,23,27]. The present results allow us to conclude that the onset of the phase transition for 1T-ReS2 is as low as ~2 GPa.
The coexistence of both phases and the difficulty to unambiguously differentiate them makes necessary to reevaluate the compression properties of the low-pressure 1T phase, also with the support of the PBE+D3 calculations. Figure 5 shows the P-V dependence of the low-pressure phase, up to 2.5 GPa. A fit with a BM-3 EoS in which all parameters are left as free fitting parameters turns out to give unreliable results, which is confirmed by plotting the corresponding F-f dependence (not shown). By using a BM-2, we obtain V0 = 217.8(2) Å3 and B0 = 49(2) GPa. If, instead, a BM-3 EoS is employed together with the B’ = 7.7 value obtained from the DFT calculations, which is still found to reasonably match the F-f dependence (Figure S2d), the following results are obtained: V0 = 217.9(2) Å3 and B0 = 46(2) GPa. These values are in excellent agreement with the PBE+D3 calculations (BM-3 fit, see Table 1) and also with the recent work by Saha et al. [23], who reported a similar experimental bulk modulus (B0 = 44(2) GPa), although with a much lower first derivative (B’ = 1.6(3)). In contrast, other previous works reported much lower B0 values of 23 GPa [21] and 35.6 GPa [22]. The latter is in very good agreement with the BM-4 fit to our PBE+D3 data, while our experimental bulk modulus obtained with a BM-4 is slightly larger (41.3(2) GPa, see Table 1). This value, but particularly those obtained with the BM-2 or BM-3 fits to our experimental data (Table 1), indicates that ReS2 is less compressible than suggested by previous works. Although the bulk modulus found for 1T-ReS2 is lower than those measured in other TMDCs, which are typically larger than 50 GPa, it is clear that the pressure behavior of this compound is still comparable to those materials, and determined by interlayer vdW forces. The fact that the calculations without vdW corrections fail to reproduce the compression behavior of ReS2, as already found in other 1T-TMDCs like HfS2 and MoS2 [34], further confirms the importance of dispersion effects in ReS2 and rules out the hypothesis that the layers in this material may be decoupled, at least from a structural and compressional point of view.
The good agreement between the PBE+D3 calculations and the experimental results can be additionally seen in Figure 6, where we have plotted the pressure dependence of the lattice parameters of 1T-ReS2. The calculations reproduce very nicely the compression behavior of the triclinic lattice parameters, with only a slight overestimation which is in all cases lower that ~1%. In particular, the PBE+D3 calculations correctly predict that the axial compressibility along the a axis is much larger than along the b and c axes (Figure 6). The experimental axial compressibility at ambient pressure, χx = −(1/x) x / P (x = a, b or c), for the a parameter obtained with a second-order BM EoS is equal to 0.0174 GPa−1. This value is almost one order of magnitude larger than that found for the b and c parameters (~0.0020 GPa−1 for both axes). These results show that the compression behavior of 1T-ReS2 is dominated by a highly reduced stiffness along the Re-S2 interlayer direction (a axis), which is mainly determined by the weak interlayer vdW forces. Again, this shows the important role played by dispersion interactions in 1T-ReS2.

5. Conclusions

We have presented a joint theoretical and experimental study of the structural properties and compression behavior of rheniite (ReS2) and the 1T-(Re,Mo)S2 solid solution. Our theoretical data and experimental results have shown that vdW corrections are essential in order to correctly predict with DFT calculations the HP properties of these compounds and, by extension, the compression behavior of other related materials like ReSe2 and their solid solutions.
HPXRD measurements have allowed us to determine the bulk modulus of ReS2 (B0 = 46(2) GPa), in good agreement with PBE+D3 calculations. Our experiments have allowed us to observe the 1T-to-1T’ phase transition at ~2 GPa, in agreement with previous theoretical works [19,22,24]. To our knowledge, this is the lowest experimental value reported in the literature. Further experimental work on natural or synthetic Mo-rich rheniites and Re-rich molybdenites, as those found in the Pagoni Rachi prospect [3], would be desirable in order to confirm the calculated lattice parameters, the phase stability and bulk moduli obtained in this work for the (Re,Mo)S2 solid solution.

Supplementary Materials

The following are available online at https://www.mdpi.com/2075-163X/11/2/207/s1, Figure S1: (a) Crystal structure of triclinic (distorted CdCl2 structure, s.g. P-1) of ReS2 at ambient pressure, labeled throughout this work as 1T-ReS2. This corresponds to the structure published by Murray et al. (Ref. [8] in the manuscript). (b) Crystal structure of triclinic (s.g. P-1) reported by Lamfers and co-workers (Ref. [9] in the manuscript), where the unit cell is doubled along the direction perpendicular to the ReS2 sandwiches. (c) Crystal structure of the high-pressure ReS2 phase, labelled throughout this work as 1T’-ReS2. This phase is denominated as “distorted 1T” in Ref. [19]. Figure S2. Normalized pressure (F = P/[3f (2f + 1)5/2]) vs. Eulerian strain (f = 0.5[(V/V0)−2/3 − 1]) for different equation of state (EoS) fits performed in this work using 2nd, 3rd or 4th-order Birch–Murnaghan (BM) equations of state [see Angel, R.J., Reviews in Mineralogy and Geochemistry 41, 35-59 (2000)]. (a,b) show fits to the results of PBE+D3 density functional theory (DFT) calculations up to 25 GPa, using BM-3 and BM-4, respectively. (c,d) show the corresponding F-f plots for the fits to the experimental high-pressure XRD data, using BM-2 and BM-3 (with B’ fixed to 7.7), respectively. In all the figures, the dots correspond to calculated (PBE+D3) or experimental (HP-XRD) data points, while the solid lines show the results of the EoS fits. Note that the large variations in F at low f in the case of the experimental data (c,d) arise from the large uncertainty in F due to the fact that f tends to zero when V tends to the zero-pressure volume, V0. Figure S3. High-pressure synchrotron XRD measurements of synthetic 1T-ReS2 up to ~5 GPa. (ad) show different angular regions of the scans, which allows highlighting the peak shifts with increasing pressure as well as the appearance of new reflections that can be attributed to the 1T’ phase.

Author Contributions

Conceptualization, J.I.-I., R.O. and T.W.; DFT methodology, T.W. and J.I.-I.; experimental methodology, R.O., C.P., S.H., J.L.-V., and J.I.-I.; data analysis, J.I.-I. and T.W.; resources at ALBA, C.P.; writing—original draft preparation, J.I.-I.; writing—review and editing, all authors; funding, all authors. All authors have read and agreed to the published version of the manuscript.

Funding

J.I. and C.P. acknowledge the Spanish Ministry of Science, Innovation and Universities via Grant FIS2017-2017-83295-P. T.W. acknowledges financial support from Polish Ministry of Science and Higher Education via Diamond Grant no. D\2015 002645.

Institutional Review Board Statement

Not applicable.

Informed Consent Statement

Not applicable.

Data Availability Statement

Not applicable.

Acknowledgments

The calculations were carried out with the support of the Interdisciplinary Centre for Mathematical and Computational Modelling (ICM), University of Warsaw, under grant no GB69-17. We would like to acknowledge Robert Kudrawiec for providing a subset of ReS2 samples for this work. HP-XRD experiments were performed at BL04 beamline of Alba Synchrotron (experiment number 2019023539). We also thank the XRD Lab of GEO3BCN-CSIC for support with the experimental part.

Conflicts of Interest

The authors declare no conflict of interest and the funders had no role in the design of the study; in the collection, analyses, or interpretation of data; in the writing of the manuscript, or in the decision to publish the results.

References

  1. Korzhinsky, M.A.; Tkachenko, S.I.; Shmulovich, K.I.; Taran, Y.A.; Steinberg, G.S. Discovery of a pure rhenium mineral at Kudriavy volcano. Nature 1994, 369, 51–52. [Google Scholar] [CrossRef]
  2. Znamensky, V.S.; Korzhinsky, M.A.; Steinberg, G.S.; Trachenko, S.I.; Yakushev, A.I.; Laputina, I.P.; Bryzgalov, I.A.; Samotoin, N.D.; Magazina, L.O.; Kuzmina, O.V.; et al. Rheniite, ReS2, the natural rhenium disulphide from fumaroles of of Kudryavy volcano, Iturup Island, Kurile Islands. Proc. Russ. Mineral. Soc. 2005, 134, 32–40. [Google Scholar]
  3. Voudouris, P.C.; Melfos, V.; Spry, P.G.; Bindi, L.; Kartal, T.; Arikas, K.; Moritz, R.; Ortelli, M. Rhenium-rich molybdenite and rheniite in the Pagoni Rachi Mo-Cu-Te-Ag-Au prospect, northern Greece: Implications for the re geochemistry of porphyry-style Cu-Mo and Mo mineralization. Can. Mineral. 2009, 47, 1013–1036. [Google Scholar] [CrossRef]
  4. Voudouris, P.; Melfos, V.; Spry, P.G.; Bindi, L.; Moritz, R.; Ortelli, M.; Kartal, T. Extremely re-rich molybdenite from porphyry Cu-Mo-Au prospects in northeastern Greece: Mode of occurrence, causes of enrichment, and implications for gold exploration. Minerals 2013, 3, 165–191. [Google Scholar] [CrossRef]
  5. Newberry, R.J.J. Polytypism in molybdenite (I): A non-equilibrium impurity-induced phenomenon. Am. Mineral. 1974, 64, 758–767. [Google Scholar]
  6. Newberry, R. Polytypism in molybdenite (II); Relationships between polytypism, ore deposition/alteration stages and rhenium contents. Am. Mineral. 1979, 64, 768–775. [Google Scholar]
  7. Frisenda, R.; Niu, Y.; Gant, P.; Muñoz, M.; Castellanos-Gomez, A. Naturally occurring van der Waals materials. npj 2D Mater. Appl. 2020, 4, 1–13. [Google Scholar] [CrossRef]
  8. Murray, H.H.; Kelly, S.P.; Chianelli, R.R.; Day, C.S. Structure of Rhenium Disulfide. Inorg. Chem. 1994, 33, 4418–4420. [Google Scholar] [CrossRef]
  9. Lamfers, H.J.; Meetsma, A.; Wiegers, G.A.; De Boer, J.L. The crystal structure of some rhenium and technetium dichalcogenides. J. Alloys Compd. 1996, 241, 34–39. [Google Scholar] [CrossRef]
  10. Kertesz, M.; Hoffmann, R. Octahedral vs. Trigonal-Prismatic Coordination and Clustering in Transition-Metal Dichalcogenides. J. Am. Chem. Soc. 1984, 106, 3453–3460. [Google Scholar] [CrossRef]
  11. Whangbo, M.H.; Canadell, E. Analogies between the Concepts of Molecular Chemistry and Solid-State Physics concerning Structural Instabilities. Electronic Origin of the Structural Modulations in Layered Transition-Metal Dichalcogenides. J. Am. Chem. Soc. 1992, 114, 9587–9600. [Google Scholar] [CrossRef]
  12. Choi, J.H.; Jhi, S.H. Origin of distorted 1T-phase ReS2: First-principles study. J. Phys. Condens. Matter 2018, 30, 105403. [Google Scholar] [CrossRef]
  13. Tongay, S.; Sahin, H.; Ko, C.; Luce, A.; Fan, W.; Liu, K.; Zhou, J.; Huang, Y.S.; Ho, C.H.; Yan, J.; et al. Monolayer behaviour in bulk ReS2 due to electronic and vibrational decoupling. Nat. Commun. 2014, 5, 1–6. [Google Scholar] [CrossRef] [PubMed] [Green Version]
  14. Biswas, D.; Ganose, A.M.; Yano, R.; Riley, J.M.; Bawden, L.; Clark, O.J.; Feng, J.; Collins-Mcintyre, L.; Sajjad, M.T.; Meevasana, W.; et al. Narrow-band anisotropic electronic structure of ReS2. Phys. Rev. B 2017, 96, 085205. [Google Scholar] [CrossRef] [Green Version]
  15. Oliva, R.; Laurien, M.; Dybala, F.; Kopaczek, J.; Qin, Y.; Tongay, S.; Rubel, O.; Kudrawiec, R. Pressure dependence of direct optical transitions in ReS2 and ReSe2. npj 2D Mater. Appl. 2019, 3, 20. [Google Scholar] [CrossRef] [Green Version]
  16. Nayak, A.P.; Bhattacharyya, S.; Zhu, J.; Liu, J.; Wu, X.; Pandey, T.; Jin, C.; Singh, A.K.; Akinwande, D.; Lin, J.-F. Pressure-induced semiconducting to metallic transition in multilayered molybdenum disulphide. Nat. Commun. 2014, 5, 3731. [Google Scholar] [CrossRef] [Green Version]
  17. Selvi, E.; Ma, Y.; Aksoy, R.; Ertas, A.; White, A. High pressure x-ray diffraction study of tungsten disulfide. J. Phys. Chem. Solids 2006, 67, 2183–2186. [Google Scholar] [CrossRef]
  18. Zhao, Z.; Zhang, H.; Yuan, H.; Wang, S.; Lin, Y.; Zeng, Q.; Xu, G.; Liu, Z.; Solanki, G.K.; Patel, K.D.; et al. Pressure induced metallization with absence of structural transition in layered molybdenum diselenide. Nat. Commun. 2015, 6, 1–8. [Google Scholar] [CrossRef] [Green Version]
  19. Zhou, D.; Zhou, Y.; Pu, C.; Chen, X.; Lu, P.; Wang, X.; An, C.; Zhou, Y.; Miao, F.; Ho, C.H.; et al. Pressure-induced metallization and superconducting phase in ReS2. npj Quantum Mater. 2017, 2, 1–6. [Google Scholar] [CrossRef]
  20. Wang, X.; Chen, X.; Zhou, Y.; Park, C.; An, C.; Zhou, Y.; Zhang, R.; Gu, C.; Yang, W.; Yang, Z. Pressure-induced iso-structural phase transition and metallization in WSe2. Sci. Rep. 2017, 7, 1–9. [Google Scholar] [CrossRef] [PubMed] [Green Version]
  21. Hou, D.; Ma, Y.; Du, J.; Yan, J.; Ji, C.; Zhu, H. High pressure X-ray diffraction study of ReS2. J. Phys. Chem. Solids 2010, 71, 1571–1575. [Google Scholar] [CrossRef]
  22. Wang, P.; Wang, Y.; Qu, J.; Zhu, Q.; Yang, W.; Zhu, J.; Wang, L.; Zhang, W.; He, D.; Zhao, Y. Pressure-induced structural and electronic transitions, metallization, and enhanced visible-light responsiveness in layered rhenium disulphide. Phys. Rev. B 2018, 97, 1–9. [Google Scholar] [CrossRef] [Green Version]
  23. Saha, P.; Ghosh, B.; Mazumder, A.; Glazyrin, K.; Dev Mukherjee, G. Pressure induced lattice expansion and phonon softening in layered ReS2. J. Appl. Phys. 2020, 128, 085904. [Google Scholar] [CrossRef]
  24. Zhang, J.; Sun, E.; Feng, X.; Liu, H.; Redfern, S.A.T.; Kanchana, V.; Liu, G.; Wang, H. Phase transition and superconductivity in ReS2, ReSe2 and ReTe2. Phys. Chem. Chem. Phys. 2018, 20, 29472–29479. [Google Scholar] [CrossRef] [PubMed]
  25. Liang, L.; Zhang, J.; Sumpter, B.G.; Tan, Q.H.; Tan, P.H.; Meunier, V. Low-Frequency Shear and Layer-Breathing Modes in Raman Scattering of Two-Dimensional Materials. ACS Nano 2017, 11, 11777–11802. [Google Scholar] [CrossRef]
  26. Zhuang, Y.; Dai, L.; Li, H.; Hu, H.; Liu, K.; Yang, L.; Pu, C.; Hong, M.; Liu, P. Deviatoric stresses promoted metallization in rhenium disulfide. J. Phys. D Appl. Phys. 2018, 51, aab5a7. [Google Scholar] [CrossRef]
  27. Yan, Y.; Jin, C.; Wang, J.; Qin, T.; Li, F.; Wang, K.; Han, Y.; Gao, C. Associated Lattice and Electronic Structural Evolutions in Compressed Multilayer ReS2. J. Phys. Chem. Lett. 2017, 8, 3648–3655. [Google Scholar] [CrossRef]
  28. Sheremetyeva, N.; Tristant, D.; Yoshimura, A.; Gray, J.; Liang, L.; Meunier, V. First-principles study of the thermodynamic and vibrational properties of ReS2 under pressure. Phys. Rev. B 2019, 100, 214101. [Google Scholar] [CrossRef]
  29. Zunger, A.; Wei, S.H.; Ferreira, L.G.; Bernard, J.E. Special quasirandom structures. Phys. Rev. Lett. 1990, 65, 353–356. [Google Scholar] [CrossRef] [PubMed] [Green Version]
  30. Grimme, S.; Antony, J.; Ehrlich, S.; Krieg, H. A consistent and accurate ab initio parametrization of density functional dispersion correction (DFT-D) for the 94 elements H-Pu. J. Chem. Phys. 2010, 132, 154104. [Google Scholar] [CrossRef] [PubMed] [Green Version]
  31. Tkatchenko, A.; Scheffler, M. Accurate molecular van der Waals interactions from ground-state electron density and free-atom reference data. Phys. Rev. Lett. 2009, 102, 073005. [Google Scholar] [CrossRef] [PubMed] [Green Version]
  32. Sun, J.; Ruzsinszky, A.; Perdew, J. Strongly Constrained and Appropriately Normed Semilocal Density Functional. Phys. Rev. Lett. 2015, 115, 036402. [Google Scholar]
  33. Peng, H.; Yang, Z.H.; Perdew, J.P.; Sun, J. Versatile van der Waals density functional based on a meta-generalized gradient approximation. Phys. Rev. X 2016, 6, 041005. [Google Scholar] [CrossRef] [Green Version]
  34. Ibáñez, J.; Woźniak, T.; Dybala, F.; Oliva, R.; Hernández, S.; Kudrawiec, R. High-pressure Raman scattering in bulk HfS2: Comparison of density functional theory methods in layered MS2 compounds (M = Hf, Mo) under compression. Sci. Rep. 2018, 8, 1–10. [Google Scholar] [CrossRef] [PubMed]
  35. Oliva, R.; Woźniak, T.; Dybala, F.; Tołłoczko, A.; Kopaczek, J.; Scharoch, P.; Kudrawiec, R. Valley polarization investigation of GeS under high pressure. Phys. Rev. B 2020, 101, 235205. [Google Scholar] [CrossRef]
  36. Perdew, J.P.; Burke, K.; Ernzerhof, M. Generalized gradient approximation made simple. Phys. Rev. Lett. 1996, 77, 3865–3868. [Google Scholar] [CrossRef] [Green Version]
  37. Kresse, G.; Furthmüller, J. Efficiency of ab-initio total energy calculations for metals and semiconductors using a plane-wave basis set. Comput. Mater. Sci. 1996, 6, 15–50. [Google Scholar]
  38. Kresse, G.; Joubert, D. From ultrasoft pseudopotentials to the projector augmented-wave method. Phys. Rev. B Condens. Matter Mater. Phys. 1999, 59, 1758–1775. [Google Scholar] [CrossRef]
  39. Van De Walle, A.; Tiwary, P.; De Jong, M.; Olmsted, D.L.; Asta, M.; Dick, A.; Shin, D.; Wang, Y.; Chen, L.Q.; Liu, Z.K. Efficient stochastic generation of special quasirandom structures. Calphad Comput. Coupling Phase Diagr. Thermochem. 2013, 42, 13–18. [Google Scholar] [CrossRef]
  40. Fauth, F.; Peral, I.; Popescu, C.; Knapp, M. The new material science powder diffraction beamline at ALBA synchrotron. In Proceedings of the Powder Diffraction; Cambridge University Press: Cambridge, UK, 2013; Volume 28, pp. S360–S370. [Google Scholar]
  41. Sahu, R.; Bhat, U.; Batra, N.M.; Sharona, H.; Vishal, B.; Sarkar, S.; Assa Aravindh, S.; Peter, S.C.; Roqan, I.S.; Costa, P.M.F.J.; et al. Nature of low dimensional structural modulations and relative phase stability in RexMo(W)1−xS2 transition metal dichalcogenide alloys. J. Appl. Phys. 2017, 121, 105101. [Google Scholar] [CrossRef] [Green Version]
  42. Gupta, D.; Chauhan, V.; Kumar, R. A comprehensive review on synthesis and applications of molybdenum disulfide (MoS2) material: Past and recent developments. Inorg. Chem. Commun. 2020, 121, 108200. [Google Scholar] [CrossRef]
  43. Dalmatova, S.A.; Fedorenko, A.D.; Mazalov, L.N.; Asanov, I.P.; Ledneva, A.Y.; Tarasenko, M.S.; Enyashin, A.N.; Zaikovskii, V.I.; Fedorov, V.E. XPS experimental and DFT investigations on solid solutions of Mo1−xRexS2 (0 < x < 0.20). Nanoscale 2018, 10, 10232–10240. [Google Scholar] [PubMed]
Figure 1. Enthalpy per formula unit (pfu) obtained with Perdew–Burke–Ernzerhof (PBE)+D3 density functional theory (DFT) calculations for the 1T- and 2H-MoReS2 solid solutions as a function of Mo content (x). The dotted lines are guides to the eye.
Minerals 11 00207 g001
Figure 2. (a) Lattice parameters obtained with PBE+D3 calculations for the 1T-(Re,Mo)S2 solid solution as a function of Mo content (x); (b) Lattice parameters obtained with PBE+D3 DFT calculations for the 2H-(Mo,Re)S2 solid solution as a function of Mo content (x).
Minerals 11 00207 g002
Figure 3. PBE-DFT calculations of the P-V equation of state of 1T-ReS2, with (squares) and without (solid dots) D3 van der Waals correction.
Minerals 11 00207 g003
Figure 4. High-pressure synchrotron XRD measurements of synthetic 1T-ReS2 up to ~5 GPa. The inset shows the appearance at low angles of a new reflection around 2 GPa. The asterisks indicate reflections that are not present in the zero-pressure scans and which can be attributed to the 1T’ phase.
Minerals 11 00207 g004
Figure 5. Experimental pressure dependence of the unit-cell volume of 1T-ReS2 as obtained with powder XRD measurements (solid triangles). The dashed curve corresponds to the result of a fit using a 3rd-order Birch–Murnaghan (BM) equation of state.
Minerals 11 00207 g005
Figure 6. Pressure dependence of the unit-cell parameters (a) and triclinic angles (b) of 1T-ReS2 as obtained with powder XRD measurements (solid symbols). The dashed curves show the results of DFT calculations using a PBE functional with D3 correction for van der Waals interactions.
Minerals 11 00207 g006
Table 1. Zero-pressure volume (V0), bulk modulus (B0) and the corresponding pressure derivatives (B′ and B″) for 1T-ReS2 as obtained by DFT calculations including vdW corrections (PBE + D3) and by HP-XRD measurements. The theoretical and experimental data were fitted using 3rd-order (BM-3) or 4th-order Birch–Murnaghan (BM-4) equations of states (EoS).
V03)B0 (GPa)BBEoS
PBE+D3224.9 (5)44 (2)7.7 (5)-BM-3
PBE+D3222.92 (3)35.1 (2)13.2 (1)−3.7 (1)BM-4
HP-XRD217.8 (2)49 (2)--BM-2
HP-XRD217.9 (2)46 (2)7.7 1-BM-3
HP-XRD217.9 (2)41.3 (2)13.2 1−3.7 1BM-4
1 The theoretical value for B′ (and B″) were used to fit the experimental data.
Publisher’s Note: MDPI stays neutral with regard to jurisdictional claims in published maps and institutional affiliations.

