
Mineralogical Characterization of Carreaux de Pavement from Northern Spain (Tiebas, Navarre)


Abstract
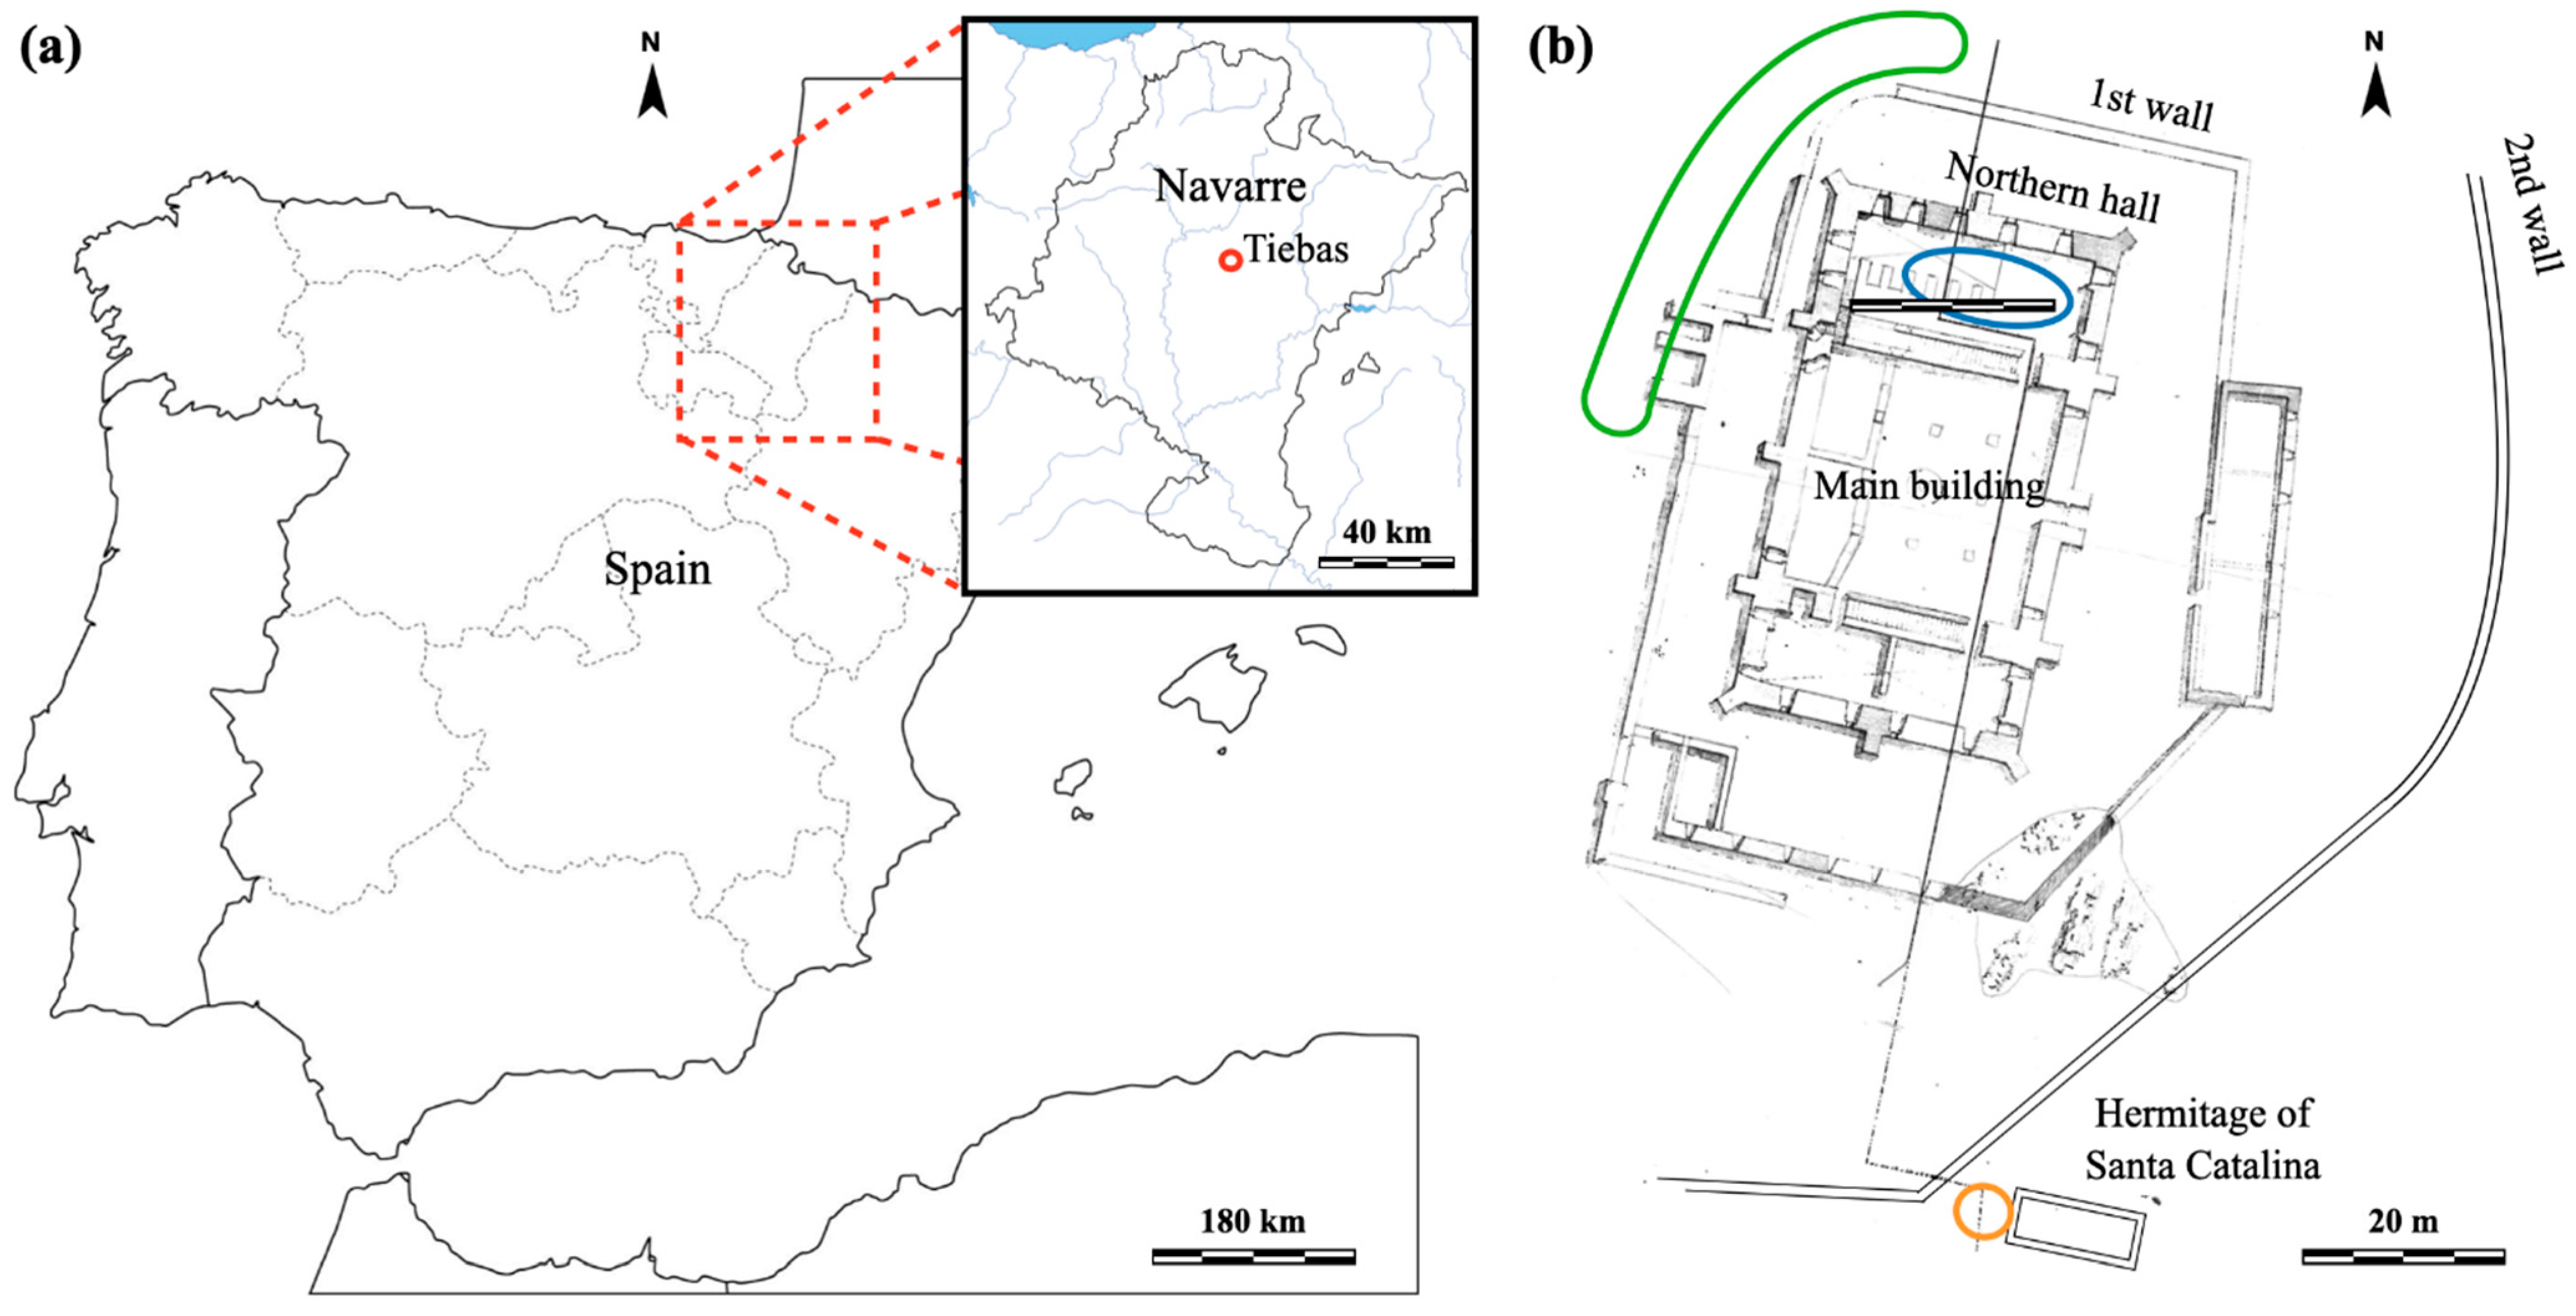
1. Introduction
2. Materials and Methods
2.1. Materials
2.2. Methods
3. Results
3.1. Naked-Eye Observation and Optical Microscopy (OM)
3.2. Colorimetry
3.3. Fourier Transform Infrared (FTIR)
3.4. Differential Thermal Analysis-Thermogravimetry Analysis (DTA-TG)
3.5. X-Ray Fluorescence (XRF) Spectroscopy
3.6. Petrographic Microscopy (PM)
3.7. X-Ray Diffraction (XRD)
3.8. Scanning Electron Microscopy Coupled with Energy Dispersive X-Ray Spectroscopy (SEM-EDS)
4. Discussion
4.1. Paste
4.2. Engobe
4.3. Glaze
5. Conclusions
Author Contributions
Funding
Data Availability Statement
Acknowledgments
Conflicts of Interest
References
- Mayer, J.; Garrigou, P. Pavement. Carreaux de sol en champagne au moyen-âge et à la renaissance. Editions du Patrimoine 2000, 4, 393–394. [Google Scholar]
- Norton, C. Carreaux de Pavement du Moyen Âge et de la Renaissance: Collections du Musée Carnavalet; Editions Paris-Musées: Paris, France, 1992. [Google Scholar]
- Cailleaux, D.; Chapelot, O. Carreaux de pavement du Moyen Âge et de la Renaissance: Catalogue des collections des Musées de Chaumont et de Saint-Dizier, Haute-Marne; Musée Municipal de Chaumont et Musée Municipal de Saint-Dizier: Chaumont et Saint-Dizier, France, 1987. [Google Scholar]
- Ramos, M. Descubrimiento de un pavimento de baldosas decoradas en el castillo-palacio de Tiebas. Trabajos de Arqueología de Navarra 2009, 21, 317–324. [Google Scholar]
- Cicuttini, B.; Merat, A.; Ben Amara, A.; Bechtel, F. Étude stylistique et technologique des carreaux de pavement du château de Lormont (Gironde, XIII–XIV siècles). In Proceedings of the Actes du 4ème Congrès International d’Archéologie Médiévale et Moderne, Paris, France, 3–8 September 2007. [Google Scholar]
- Cicuttini, B.; Ben Amara, A.; Bechtel, F. An investigation into the ceramic technology of the two-colour tiles of “Prince Noir” castle (Bordeaux, France, Thirteenth to Fourteenth Centuries AD). In Proceedings of the 37th International Symposium on Archaeometry, Siena, Italy, 12–16 May 2008; pp. 55–60. [Google Scholar]
- García, M.R. La Dinastía de Champaña en Navarra. Teobaldo I, Teobaldo II, Enrique I (1234–1274); Ediciones Trea: Gijón, Spain, 2010. [Google Scholar]
- García, M.R. Teobaldo II; Editorial Mintzoa: Pamplona, Spain, 2003. [Google Scholar]
- Castiella, A. Informe sobre los trabajos arqueológicos realizados en el Castillo de Tiebas (Navarra). Trab. Arqueol. Navar. 1998, 13, 247–286. [Google Scholar]
- Ramos, M. Excavaciones en el castillo de Tiebas (Navarra), primer informe provisional, 1998. Trab. Arqueol. Navar. 2001, 15, 167–213. [Google Scholar]
- Martínez, D.; Ruiz, F.J.; Vallejo, J.M. Algunas consideraciones en torno a unas baldosas góticas decoradas y vidriadas aparecidas en la ermita de Santa Catalina en Tiebas (Navarra). Trab. Arqueol. Navar. 2011, 23, 141–160. [Google Scholar]
- Ben Amara, A.; Gourdon-Platel, N.; Bechtel, F.; Schvoerer, M.; Bon, P. Carreaux glaçurés provenant d’un château du Duc de Berry (Mehun-sur-Yèvre, fin XIV siècle): Recherche d’indices techniques. Arch. Sci. 2005, 29, 21–34. [Google Scholar]
- Métreau, L.; Cantin, N.; Bechtel, F.; Rosen, J.; André, P. De Suscinio I à Suscinio II: Rupture ou continuité? Étude archéométrique des carreaux décorés à glaçure transparente des pavements médiévaux du château de Suscinio (Sarzeau, Morbihan). Revue Archéol. l’Ouest 2012, 29, 243–249. [Google Scholar] [CrossRef]
- Rouzeau, B.; Bocquet-Liénard, A.; Moulis, C. Les carreaux de pavement découverts à l’abbaye de Morimond (Haute-Marne): étude typologique, technique et archéométrique. Revue Archéol. l’Est 2013, 62, 343–366. [Google Scholar]
- Leon, Y.; Ben Amara, A.; Conte, P. Carreaux de pavement glaçurés du château du Haut Châlucet (Haute-Vienne, XIII–XIV s.)—Inventaire et techniques de fabrication. In Proceedings of the Actes du 4ème Congrès International d’Archéologie Médiévale et Moderne, Paris, France, 3–8 September 2007; pp. 131–152. [Google Scholar]
- De Bonis, A.; Cultrone, G.; Grifa, C.; Langella, A.; Leone, A.P.; Mercurio, M.; Morra, V. Different shades of red: The complexity of mineralogical and physico-chemical factors influencing the colour of ceramics. Ceram. Int. 2017, 43, 8065–8074. [Google Scholar] [CrossRef]
- Jordanova, N.; Jordanova, D.; Barrón, V.; Lesigyarski, D.; Kostadinova, M. Rock-magnetic and color characteristics of archaeological samples from burnt clay from destructions and ceramics in relation to their firing temperature. Archaeol. Anthropol. Sci. 2019, 11, 3595–3612. [Google Scholar] [CrossRef]
- Crupi, V.; D’Amico, S.; Denaro, L.; Donato, P.; Majolino, D.; Paladini, G.; Persico, R.; Saccone, M.; Sansotta, C.; Spagnolo, G.V.; et al. Mobile spectroscopy in archaeometry: Some case study. J. Spectros. 2018, 2018, 8295291. [Google Scholar] [CrossRef]
- Ricca, M.; Paladini, G.; Rovella, N.; Ruffolo, S.A.; Randazzo, L.; Crupi, V.; Fazio, B.; Majolino, D.; Venuti, V.; Galli, G.; et al. Archaeometric characterisation of decorated pottery from the archaeological site of Villa dei Quintili (Rome, Italy): Preliminary study. Geosciences 2019, 9, 172. [Google Scholar] [CrossRef]
- Daghmehchi, M.; Rathossi, B.; Omrani, H.; Emami, M.; Rahbar, M. Mineralogical and thermal analyses of the Hellenistic ceramics from Laodicea Temple, Iran. Appl. Clay Sci. 2018, 162, 146–154. [Google Scholar] [CrossRef]
- Medeghini, L.; Mignardi, S.; De Vito, C.; Conte, A.M. Evaluation of a FTIR data pretreatment method for principal component analysis applied to archaeological ceramics. Microchem. J. 2016, 125, 224–229. [Google Scholar] [CrossRef]
- Battcher, M.E.; Gehlken, P.L.; Steele, D.F. Characterization of inorganic and biogenic magnesian calcites by Fourier Transform infrared spectroscopy. Solid State Ion. 1997, 101, 1379–1385. [Google Scholar] [CrossRef]
- Crupi, V.; La Russa, M.F.; Venuti, V.; Ruffolo, S.; Ricca, M.; Paladini, G.; Albini, R.; Macchia, A.; Denaro, L.; Birarda, G.; et al. A combined SR-based Raman and InfraRed investigation of pigmenting matter used in wall paintings: The San Gennaro and San Gaudioso Catacombs (Naples, Italy) case. Eur. Phys. J. Plus 2018, 133, 369. [Google Scholar] [CrossRef]
- Măruţoiu, C.; Bratu, I.; Ţiplic, M.I.; Măruţoiu, V.C.; Nemeş, O.F.; Neamţu, C.; Hernanz, A. FTIR analysis and 3D restoration of Transylvanian popular pottery from the XVI-XVIII centuries. J. Archaeol. Sci. Rep. 2018, 19, 148–154. [Google Scholar] [CrossRef]
- Torrent, J.; Schwertmann, U.; Fechter, H.; Alferez, F. Quantitative relationships between soil color and hematite content. Soil Sci. 1983, 136, 354–358. [Google Scholar] [CrossRef]
- Torrent, J.; Barrón, V. The visible diffuse reflectance spectrum in relation to the color and crystal properties of hematite. Clays Clay Min. 2003, 51, 309–317. [Google Scholar] [CrossRef]
- Backes, C.J.; Cheetham, J.D.; Neff, H. The color of influence: A provenance study of hematie-based paints on early olmec carved pottery. Cambridge Univ. Press. 2012, 23, 70–92. [Google Scholar] [CrossRef]
- Pye, K.; Blott, S.J. Particle size analysis of sediments, soils and related particulate materials for forensic purposes using laser granulometry. Forens. Sci. Int. 2004, 144, 19–27. [Google Scholar] [CrossRef] [PubMed]
- Nagy, S.; Kuzmann, E.; Weiszburg, T.; Gyökeres-Tóth, M.; Riedel, M. Oxide transformation during preparation of black pottery in Hungary. J. Radioanal. Nucl. Chem. 2000, 246, 91–96. [Google Scholar] [CrossRef]
- Yin, M.; Chen, Z.; Deegan, B.; O’Brien, S. Wüstite nanocrystals: Synthesis, structure and superlattice formation. J. Mater. Res. 2007, 22, 1987–1995. [Google Scholar] [CrossRef]
- Maritana, L.; Nodarib, L.; Olivieric, L.M.; Vidale, M. Shades of black: Production technology of the black slip ware from Barikot, north-western Pakistan. J. Cult. Herit. 2020, 43, 342–355. [Google Scholar] [CrossRef]
- Benna, P.; Tribaudino, M.; Bruno, E. The structure of ordered and disordered lead feldspar (PbAl2Si2O8). Am. Min. 1996, 81, 1337–1343. [Google Scholar] [CrossRef]
- Del Valle, J. Memoria de la hoja 141 (Pamplona). Mapa Geológico de España, E.1:50.000 (MAGNA), 1st ed.; IGME: Madrid, Spain, 1974; p. 26. [Google Scholar]
- Pérez-Monserrat, E.M.; Fort, R.; López-Arce, P.; Álvarez de Buergo, M.; Varas-Muriel, M.J. Contribution of analytical techniques to determine the technologies used in the ceramic materials from the Former Workers Hospital of Maudes, Madrid (Spain). J. Eur. Ceram. Soc. 2013, 33, 479–491. [Google Scholar] [CrossRef][Green Version]
- Senvaitiene, J.; Smirnova, J.; Beganskiene, A.; Kareiva, A. XRD and FTIR characterisation of lead oxide-based pigments and glazes. Acta Chim. Sloven. 2007, 54, 185–193. [Google Scholar]
- Schabbach, L.M.; Andreola, F.; Lancellotti, I.; Barbieri, L. Minimization of Pb content in a ceramic glaze by reformulation the composition with secondary raw materials. Ceram. Int. 2011, 37, 1367–1375. [Google Scholar] [CrossRef]
- Thibodeau, A.M.; Habicht-Mauche, J.A.; Huntley, D.L.; Chesley, J.T.; Ruiz, J. High precision isotopic analyses of lead ores from New Mexico by MC-ICP-MS: Implications for tracing the production and exchange of Pueblo IV glaze-decorated pottery. J. Archaeol. Sci. 2013, 40, 3067–3075. [Google Scholar] [CrossRef]
- Di Febo, R.; Molera, J.; Pradell, T.; Melgarejo, J.C.; Madrenas, J.; Vallcorba, O. The production of a lead glaze with galena: Thermal transformations in the PbS–SiO2 system. J. Am. Ceram. Soc. 2017, 101, 2119–2129. [Google Scholar] [CrossRef]
- Tite, M.S.; Freestone, I.; Mason, R.; Molera, J.; Vendrell-Saz, M.; Wood, N. Lead glazes in antiquity—Methods of production and reasons for use. Archaeometry 2007, 40, 241–260. [Google Scholar] [CrossRef]
- Hurst, D.; Freestone, I. Lead Glazing Technique from a Medieval Klin Site at Hanley Swan, Worcestershire. Mediev. Ceram. 1996, 20, 13–18. [Google Scholar]
- Molera, J.; Pradell, T.; Salvadó, N.; Vendrell-Saz, M. Interactions between Clay Bodies and Lead Glazes. J. Am. Ceram. Soc. 2001, 84, 1120–1128. [Google Scholar] [CrossRef]
- Ben Amara, A.; Schvoerer, M. Interactions between lead glazes and bodies: Research on the mode of application of the glazing mixture. Institución Fernando el Católico. In Proceedings of the 34th International Symposium on Archaeometry, Zaragoza, Spain, 3–7 May 2006; pp. 399–404. [Google Scholar]
- Yonga, B.; Yanga, T.; Yanga, B.; Xu, B.Q.; Liua, D.C.; Zhang, W. Preparation of lead oxide from the recycled lead carbonate by vacuum T decomposition technology. Vacuum 2019, 167, 445–451. [Google Scholar] [CrossRef]


| Code | Type | Site | Glaze (color) | Thickness (mm) | Colorimetry | FTIR | DTA/TG | XRD | XRF | OM | PM | SEM/ |
|---|---|---|---|---|---|---|---|---|---|---|---|---|
| EDS | ||||||||||||
| p g e | p | p | p g e | p g e | a | p | a | |||||
| M1 | M | NH | DGre | 23.6 | ✓✓ - | ✓ | ✓ | ✓✓ - | ✓✓ - | ✓ | - | - |
| M3 | M | NH | DGre | 23.8 | ✓✓ - | ✓ | ✓ | ✓ - - | ✓ - - | ✓ | - | - |
| M5 | M | NH | DGre | 25.7 | ✓✓ - | ✓ | ✓ | ✓✓ - | ✓ - - | ✓ | - | - |
| M8 | M | LF | DGre | 24.5 | ✓✓ - | ✓ | ✓ | ✓ - - | ✓ - - | ✓ | - | - |
| M9 | M | LF | DGre | 23.2 | ✓✓ - | ✓ | ✓ | ✓ - - | ✓ - - | ✓ | - | - |
| M10 | M | LF | DGre | 25.3 | ✓✓ - | ✓ | ✓ | ✓✓ - | ✓✓ - | ✓ | - | ✓ |
| M1-15 | M | OOC | - | 23.4 | ✓ - - | ✓ | ✓ | ✓ - - | ✓ - - | ✓ | - | - |
| M1-50 | M | OOC | DGre | 22.4 | ✓✓ - | ✓ | ✓ | ✓ - - | ✓ - - | ✓ | - | - |
| M1-9 | M | OOC | LHon | 20.8 | ✓✓ - | ✓ | ✓ | ✓ - - | ✓ - - | ✓ | - | - |
| M6 | D | NH | DGre | 25.7 | ✓✓✓ | ✓ | ✓ | ✓✓ - | ✓✓ - | ✓ | - | ✓ |
| M23 | D | NH | DGre | 28.3 | ✓✓✓ | ✓ | ✓ | ✓✓ - | ✓✓ - | ✓ | - | - |
| M4 | D | NH | DGre | 24.9 | ✓✓✓ | ✓ | ✓ | ✓ - - | ✓ - - | ✓ | - | - |
| M13 | D | LF | LHon | 24.8 | ✓✓✓ | ✓ | ✓ | ✓ - ✓ | ✓ - ✓ | ✓ | - | - |
| M19 | D | LF | LGre | 23.6 | ✓✓✓ | ✓ | ✓ | ✓✓ - | ✓✓ - | ✓ | - | ✓ |
| M20 | D | LF | LGre | 24.1 | ✓✓✓ | ✓ | ✓ | ✓ - - | ✓ - - | ✓ | - | - |
| M21 | D | OOC | LHon | 25.2 | ✓✓✓ | ✓ | ✓ | ✓✓ - | ✓✓ - | ✓ | - | ✓ |
| M22 | D | OOC | LHon | 24.4 | ✓✓✓ | ✓ | ✓ | ✓✓ - | ✓✓ - | ✓ | - | ✓ |
| M1-21 | D | OOC | LHon | 25.4 | ✓✓✓ | ✓ | ✓ | ✓✓ - | ✓ - - | ✓ | - | - |
| M32 | D | LF | LHon | 22.8 | - ✓ - | - | - | - ✓ - | - ✓ - | - | - | - |
| M33 | D | LF | LHon | 22.2 | - - - | - | - | - - ✓ | - - ✓ | - | - | - |
| M1-51 | - | OOC | - | - | - - - | - | - | - - - | - - - | - | ✓ | - |
| M1-52 | - | OOC | - | - | - - - | - | - | - - - | - - - | - | ✓ | - |
| Sample | Glaze | Paste | Glaze | Engobe | ||||||
|---|---|---|---|---|---|---|---|---|---|---|
| (Color) | L* | a* | b* | L* | a* | b* | L* | a* | b* | |
| M1 | DGre | 44.4 | 22.8 | 23.6 | 39.3 | 3.6 | 6.8 | - | - | - |
| M3 | DGre | 45.5 | 16.2 | 25.3 | 42.2 | 2.9 | 4.8 | - | - | - |
| M4 | DGre | 49.6 | 16.7 | 29.1 | 42.8 | 7.7 | 8.3 | 64.5 | 7.1 | 17.7 |
| M5 | DGre | 53 | 16.2 | 28.1 | 35.6 | 10.6 | 14.7 | - | - | - |
| M6 | DGre | 45.4 | 16 | 24.2 | 37.5 | 2.7 | 7.2 | 65.6 | 6.2 | 21.1 |
| M8 | DGre | 48.3 | 17.7 | 32.7 | 37.4 | 3.5 | 8.2 | - | - | - |
| M9 | DGre | 48.4 | 17.4 | 31.4 | 36.3 | 3 | 4.8 | - | - | - |
| M10 | DGre | 50.9 | 15.5 | 28.5 | 41.9 | 3.9 | 12.7 | - | - | - |
| M23 | DGre | 45.9 | 14.5 | 23 | 34.2 | 4.3 | 9 | 62.7 | 4 | 24.7 |
| M1-50 | DGre | 53.5 | 12.8 | 31.5 | 36.1 | 0.1 | 0.5 | - | - | - |
| M19r | LGre | 61.4 | 15.1 | 37 | 49.7 | 1.8 | 21.4 | 63.1 | 1.5 | 27 |
| M19g | LGre | 55.4 | 2.2 | 12.3 | - | - | - | - | - | - |
| M20 | LGre | 49 | 5.5 | 14.6 | 41 | 2 | 12.9 | 63.4 | 1.8 | 33.4 |
| M13 | LHon | 52.5 | 14.2 | 32.1 | 47.7 | 4.7 | 14.1 | 62.3 | 4.6 | 30.3 |
| M21 | LHon | 52.6 | 17.8 | 34.8 | 48.4 | 9.7 | 23.8 | 67.5 | 7.8 | 36.9 |
| M22 | LHon | 61.4 | 15.8 | 40.9 | 38.3 | 12 | 28 | 64.5 | 6.9 | 41.2 |
| M32 | LHon | - | - | - | 45.7 | 15.4 | 25.1 | - | - | - |
| M1-9 | LHon | 54.3 | 16.2 | 36.9 | 42.3 | 7.5 | 22.4 | - | - | - |
| M1-15 | - | 46.6 | 16.2 | 30 | - | - | - | - | - | - |
| M1-21 | LHon | 55.9 | 16.8 | 33.9 | 44.2 | 9.2 | 29.7 | 62.3 | 5 | 35.9 |
| Sample | Pb(Mα)/Si | Al(Kα)/Si | Fe(Kα)/Si | K(Kα)/Si | Ca(Kα)/Si | Cu(Kα)/Si |
|---|---|---|---|---|---|---|
| M1 glz DGre | 1.1575 | 0.1109 | 0.3958 | 0.1004 | 0.4005 | 0.0157 |
| M10 glz DGre | 1.8962 | 0.0987 | 0.3264 | 0.0741 | 0.1933 | 0.1743 |
| M6 glz DGre | 0.9807 | 0.1187 | 0.3195 | 0.0852 | 0.0672 | 0.0142 |
| M23 glz LGre | 0.9333 | 0.1458 | 0.2244 | 0.1063 | 0.0799 | 0.0151 |
| M19 glz LHon | 0.6613 | 0.1 | 0.1556 | 0.0916 | 0.1365 | 0.0111 |
| M21 glz LHon | 1.4357 | 0.119 | 0.7653 | 0.0962 | 0.3346 | 0.0195 |
| M22 glz LHon | 2.1813 | 0.1416 | 0.4187 | 0.1128 | 0.3807 | 0.0209 |
| M32 glz LHon | 2.5358 | 0.1003 | 0.2036 | 0.0791 | 0.118 | 0.0217 |
| Paste mean | 0.0113 | 0.1368 | 0.6726 | 0.1326 | 0.1459 | 0.0077 |
| Engobe mean | 0.9472 | 0.1706 | 0.2749 | 0.121 | 0.118 | 0.0145 |
| Sample | Q | C | H | KF | D | G | M | Sample | Q | C | H | KF | D | G | M |
|---|---|---|---|---|---|---|---|---|---|---|---|---|---|---|---|
| M1 | +++ | ++ | + | + | nd | + | nd | M13 | +++ | + | + | + | + | + | nd |
| M3 | +++ | + | + | nd | + | + | nd | M19 | +++ | + | + | + | nd | + | + |
| M5 | +++ | + | + | + | + | + | nd | M20 | +++ | + | + | + | nd | nd | + |
| M6 | +++ | ++ | + | + | + | nd | nd | M1.15 | +++ | nd | + | + | + | nd | nd |
| M23 | +++ | + | + | + | + | + | nd | M1-50 | +++ | + | + | + | nd | + | + |
| M4 | +++ | + | + | + | + | + | + | M1-9 | +++ | + | + | + | + | nd | + |
| M8 | +++ | ++ | + | + | + | nd | nd | M21 | +++ | + | + | + | + | + | + |
| M9 | +++ | ++ | + | + | + | nd | nd | M22 | +++ | + | + | + | + | nd | + |
| M10 | +++ | + | + | + | + | + | nd | M1-21 | +++ | + | + | + | + | nd | + |
Publisher’s Note: MDPI stays neutral with regard to jurisdictional claims in published maps and institutional affiliations. |
© 2021 by the authors. Licensee MDPI, Basel, Switzerland. This article is an open access article distributed under the terms and conditions of the Creative Commons Attribution (CC BY) license (http://creativecommons.org/licenses/by/4.0/).
Share and Cite
Ruiz-Ardanaz, I.; Lasheras, E.; Durán, A. Mineralogical Characterization of Carreaux de Pavement from Northern Spain (Tiebas, Navarre). Minerals 2021, 11, 153. https://doi.org/10.3390/min11020153
Ruiz-Ardanaz I, Lasheras E, Durán A. Mineralogical Characterization of Carreaux de Pavement from Northern Spain (Tiebas, Navarre). Minerals. 2021; 11(2):153. https://doi.org/10.3390/min11020153
Chicago/Turabian StyleRuiz-Ardanaz, Iván, Esther Lasheras, and Adrián Durán. 2021. "Mineralogical Characterization of Carreaux de Pavement from Northern Spain (Tiebas, Navarre)" Minerals 11, no. 2: 153. https://doi.org/10.3390/min11020153
APA StyleRuiz-Ardanaz, I., Lasheras, E., & Durán, A. (2021). Mineralogical Characterization of Carreaux de Pavement from Northern Spain (Tiebas, Navarre). Minerals, 11(2), 153. https://doi.org/10.3390/min11020153