Article

Quantitative Analyses of Urinary Uranium by µ-PIXE

National Institute of Radiological Sciences, National Institutes for Quantum and Radiological Science and Technology 4-9-1 Anagawa, Inage, Chiba 263-8555, Japan
*
Author to whom correspondence should be addressed.
Minerals 2021, 11(2), 147; https://doi.org/10.3390/min11020147
Submission received: 31 December 2020 / Revised: 26 January 2021 / Accepted: 28 January 2021 / Published: 31 January 2021
(This article belongs to the Special Issue Understanding Uranium Toxicity)

Abstract

:
Simple methods for the determination of elements in biological fluids have been developed. It is important to quantify the accidental incorporation of radionuclides during the decommissioning work at nuclear power plants. Herein, we proposed the simple preparations and determination methods of uranium concentrations in urine for microbeam scanning particle induced X-ray emission (µ-PIXE) analysis in a rat model. A droplet (1 µL) of mixed solution of urine treated with a five-fold amount of concentrated nitric acid was placed on polypropylene film coated with perfluoroalkoxy alkanes (PFA) and dried at room temperature. The µ-PIXE imaging analysis revealed that successful condensation with homogeneous distribution of uranium in the specimen was achieved using by PFA coating. Uranium concentrations in the urine collected from uranium-injected rats were quantified. The obtained results were consistent with those determined by inductively coupled plasma mass spectrometry.

1. Introduction

Fundamental knowledge is required to estimate the accidental exposure of nuclear fuels, including uranium (U) and fission products, during the decommissioning work at the Fukushima Daiichi Nuclear Power Plants [1]. Uranium is considered to be a chemical toxic and radiological toxic element that accumulates in the kidneys [2] and bones [3] after the exposure, where it has the potential to subsequently impact the metabolism. Urine is one of the best body fluids for monitoring the U exposure, because the quantification of urinary U reflects the amount of U taken into the body and/or the amount of remaining U. Various methods for the detection of urinary uranium with a small volume by a simple sample preparation have been developed [1,4,5], including alpha spectrometry [6], neutron activation analysis (NAA) [7], fission-track analysis (FTA) [8], total reflection X-ray fluorescence (TXRF) [9], and inductively coupled plasma mass spectrometry (ICP-MS) [10,11,12,13]. The limit of detection by alpha spectrometry is approximately 1 mBq of 238U (80 ng) in urine sample, although a counting time of approximately one day is required to achieve this sensitivity [14]. Higher sensitivity is attained by NAA using a neutron source such as a nuclear reactor for the sample irradiation. FTA and TXRF are used as rather simple analytical methods when preconcentration of sample solutions is sufficient. Currently, concentrations in the parts per billion range have been achieved by ICP-MS [15]. However, sophisticated methodologies are required for sample purification to separate U from inorganic and organic matrix for these analytical methods. As a result, it takes hours to yield better detection limits.
Particle induced X-ray emission (PIXE) analysis is suitable for small amounts of biological samples [16,17,18]. Trace elements in liquid samples such as drinking water, river water, blood, and body fluids have been measured dropped on analytical film and dried up [19,20]. Combined with microbeam scanning to PIXE (µ-PIXE), local quantification of thin section standard sample has been performed with spatial resolution at the µm scale [21,22,23,24]. Recently, U accumulated in the micro region of rat kidney tubules was quantified [24]. µ-PIXE analysis of the dropped specimen shows that the diameter of the drop trace and the homogeneity of the elements depend on the composition and physical properties of the drop solution. In our previous study, yttrium (Y), used as a simulated U, was added in the urine, and the concentration of Y was measured based on the count of Y-Kα line. The specimen was prepared by using solution in the mixture of urine and acid [25]. By applying the µ-PIXE analysis to the quantification of U in urine, the homogeneity of U in the specimen can be evaluated, and U concentration can be measured based on the X-ray fluorescence spectroscopy.
Herein, the properties of the droplets of the urine drop specimen were evaluated to simply and quickly quantify the U in biological fluids using µ-PIXE. Uranium in urine sample collected by administering U to rats was quantified based on the calibration line of urine sample. Obtained values were compared with those measured using ICP-MS.

2. Materials and Methods

µ-PIXE measurements using two kinds of specimens were performed, i.e., a specimen based on 0.1 M HNO3 containing no urine, and that of concentrated HNO3 containing 20% urine to evaluate the uniformity of U in the specimens and to quantify the U.

2.1. Preparation for Uranium Specimens Using 0.1 M Nitric Acid

Specimens containing a known concentration of U were prepared using 0.1 M nitric acid (HNO3). The 0.1 M HNO3 was prepared from concentrated HNO3 (68%, ultrapure analytical grade, Tama Chemicals Co. Ltd, Kawasaki, Japan). Uranium acetate (depleted uranium, Wako Pure Chemicals Industries, Tokyo, Japan) was dissolved into 0.1 M HNO3 as a stock solution (100 ppm). The solutions of 1, 5, 10, and 50 µg/g U in 0.1 M HNO3 were prepared using 0.1 M HNO3 and U stock solution. One µL of U standard solution was dropped on polypropylene film (RIGAKU Co. Ltd, Tokyo, Japan) of 6 µm thickness. At least three specimens were prepared at each standard solution. Tips of the micro-pipet were changed each time after the dropping. The droplet was dried in the desiccator with silica gel for one night.

2.2. Preparation for Uranium Specimens Using Mixed Solutions of Urine with Nitric Acid

Uranium specimens of the urine and concentrated HNO3 mixtures were prepared. Uranium acetate was dissolved into concentrated HNO3 as a stock solution (100 ppm). The standard solutions of 0, 1, 5, 10, and 50 µg/g U were prepared using urine of untreated rats (see Section 2.3), concentrated HNO3, and uranium stock solution for the calibration curve. Here, volume of urine was 20% in concentrated HNO3. The standard solutions were maintained at room temperature for 24 h before the preparation of the droplet on the sheet. The droplet was dried in the desiccator with silica gel for a night. One µL of U standard solutions containing urine were dropped on polypropylene film coated tetrafluoroethylene perfluoroalkyl vinyl ether copolymer (PFA, FC-115, Fine Chemical Japan Co. Ltd, Tokyo, Japan). The PFA coating was performed 12 h prior to its use. At least three specimens were prepared at each standard sample. Tips of the micro-pipet were changed each time subsequent to the dropping. The sample solution was dropped on the sheet coated via PFA owing to its high-water repellency. Two or five µL droplets containing U were also prepared to study the effect of counting on the volume.
Uranium specimen of urine samples collected by administering U to rats was treated with five-fold HNO3 to be 20% urine in concentrated HNO3. Concentration of uranium in urine was also determined by ICP-MS (Agilent 7500a, Yokogawa Analytical Systems, Inc., Tokyo, Japan). For the ICP-MS measurement, the urine of 0.1 mL was digested with 0.5 mL of concentrated HNO3 at 90 °C for 30 min using a microwave oven. Each resulting specimen was diluted with ultrapure water, and the U concentration was determined [26].

2.3. Animal Experiments

Urine samples were collected from Wistar male rats (10 weeks old; CLEA Japan). The animals were acclimated to the controlled temperature (22 ± 2 °C), humidity (50 ± 10%), and day/night cycle environment (light 7:00–19:00) for a week prior initiating the study. As a control urine sample, urine was obtained from the rats in metabolic cages for 24 h. As a toxic animal model early after exposure [27], uranyl acetate was dissolved in saline and administered to the animals through subcutaneous injection at 0.5 and 4 mg kg−1 body weight. Urine was obtained from four animals per group in a metabolic cage for five hours after the administration. Collected urine samples were stored in the freezer at −80 °C. All experimental procedures were approved by the Animal Care Committee of the National Institutes for Quantum and Radiological Science and Technology (No. 18-0005, May 2018).

2.4. µ-PIXE Measurement

µ-PIXE analysis was performed at National Institute of Radiation Science, Japan, using a Model OM-2000 microbeam scanning PIXE system (Oxford Microbeams Ltd., UK) with a CdTe detector (XR-100TCdTe, Amptek, active area: 25 mm2, USA) and Si(Li) detector (GRESHAM Sirius80, active area: 80 mm2, UK) [28]. Energy resolution of Si(Li) and CdTe detectors is 256 and 438 eV (full-width half maximum: FWHM), respectively, at 13.6 keV U Lα X-ray. X-ray spectrum, µ-PIXE images, and calculation of total counts of X-ray intensity for target element using a Gaussian fitting were performed using the OMDAQ data acquisition system (Oxford Microbeams Ltd., UK). Elemental images were constructed using the intensity data of the U-Lα line (12.88–14.21 keV) and U-Lβ1 line (16.83–17.77 keV) through a CdTe detector. The data was obtained by scanning the specimens under the following conditions: proton energy, 3.0 MeV; integrated current, 0.2 μC; spatial resolution, 1 × 1 μm.

3. Results and Discussion

3.1. Uranium Distribution and Concentration Dependence of U Specimen Prepared Using HNO3

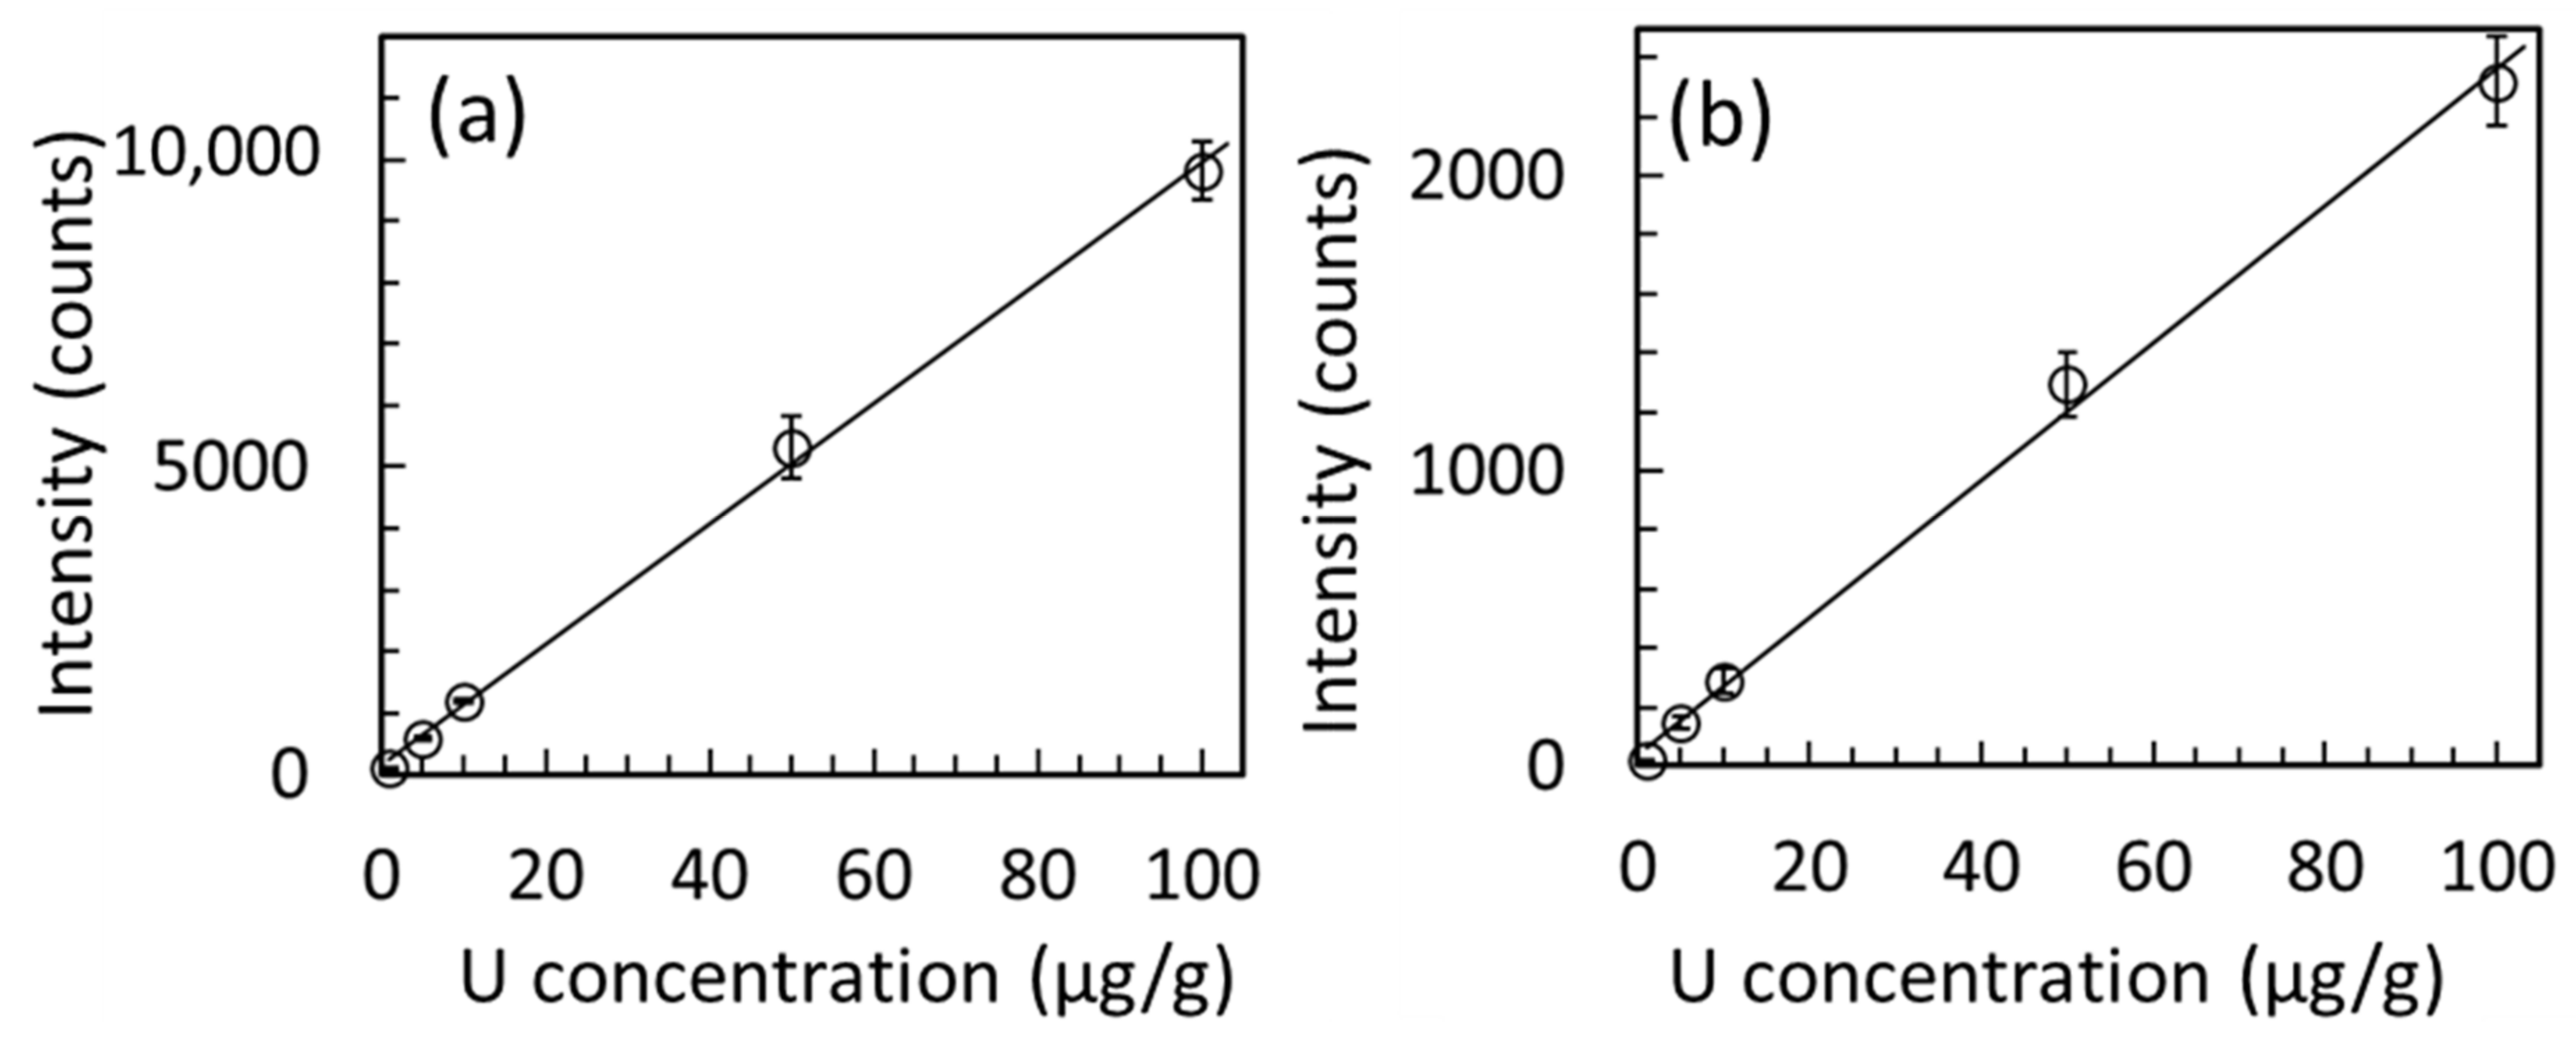
µ-PIXE measurements were performed to evaluate the uniformity of U distribution in the specimen and to quantify the U from the counts of U-Lα and U-Lβ1 lines. First, µ-PIXE measurements were performed on a specimen based on U standard specimen based on 0.1 M HNO3 containing no urine. When 1 μL of 0.1 M HNO3 containing U was dropped on a polypropylene film, the diameter of the droplet was approximately 3 mm at the time of dropping; however, it reduced to almost 0.1 mm at the time of drying. Curve 1 in Figure 1a shows the µ-PIXE spectra of 0.1 M HNO3 solution containing 50 µg/g of U. Here, the intensity in Figure 1a represents the sum of the counts of the droplet measured on 256 × 256 pixel. The X-ray fluorescence peaks corresponding to U-Mα, U-Ll, U-Lα, U-Lβ2, U-Lβ1, and U-Lγ1 lines at 3.17, 11.62, 13.61, 16.42, 17.22, and 20.25 keV, respectively, were observed. There were no significant intensities observed at U-Lα and U-Lβ1 lines in the absence of U (curve 2). Figure 1b shows the images obtained from U-Lα and U-Lβ1 lines. The elemental distribution was not uniform, and U was found to be close to the center. It is believed that this occurred when the droplets dried, the droplet began to dry from the water around the droplets and U was concentrated in the center. The X-ray intensity was calculated using area irradiated and net count results of plotting the U-Lα and U-Lβ1 lines against the concentration of 1–100 µg/g (Figure 2 and Table 1); the slopes of the regression lines are 98.0 (R2 = 0.998) and 23.2 (R2 = 0.997), respectively. Here, U-Lβ2 line at 16.42 keV overlapping with zirconium (Zr)-Kα line at 15.78 keV was not employed to measure the U concentration in this study, because Zr was one of the materials in the metallic sample holder.

3.2. Quantification of U in Urine Collected from U Injected Rats

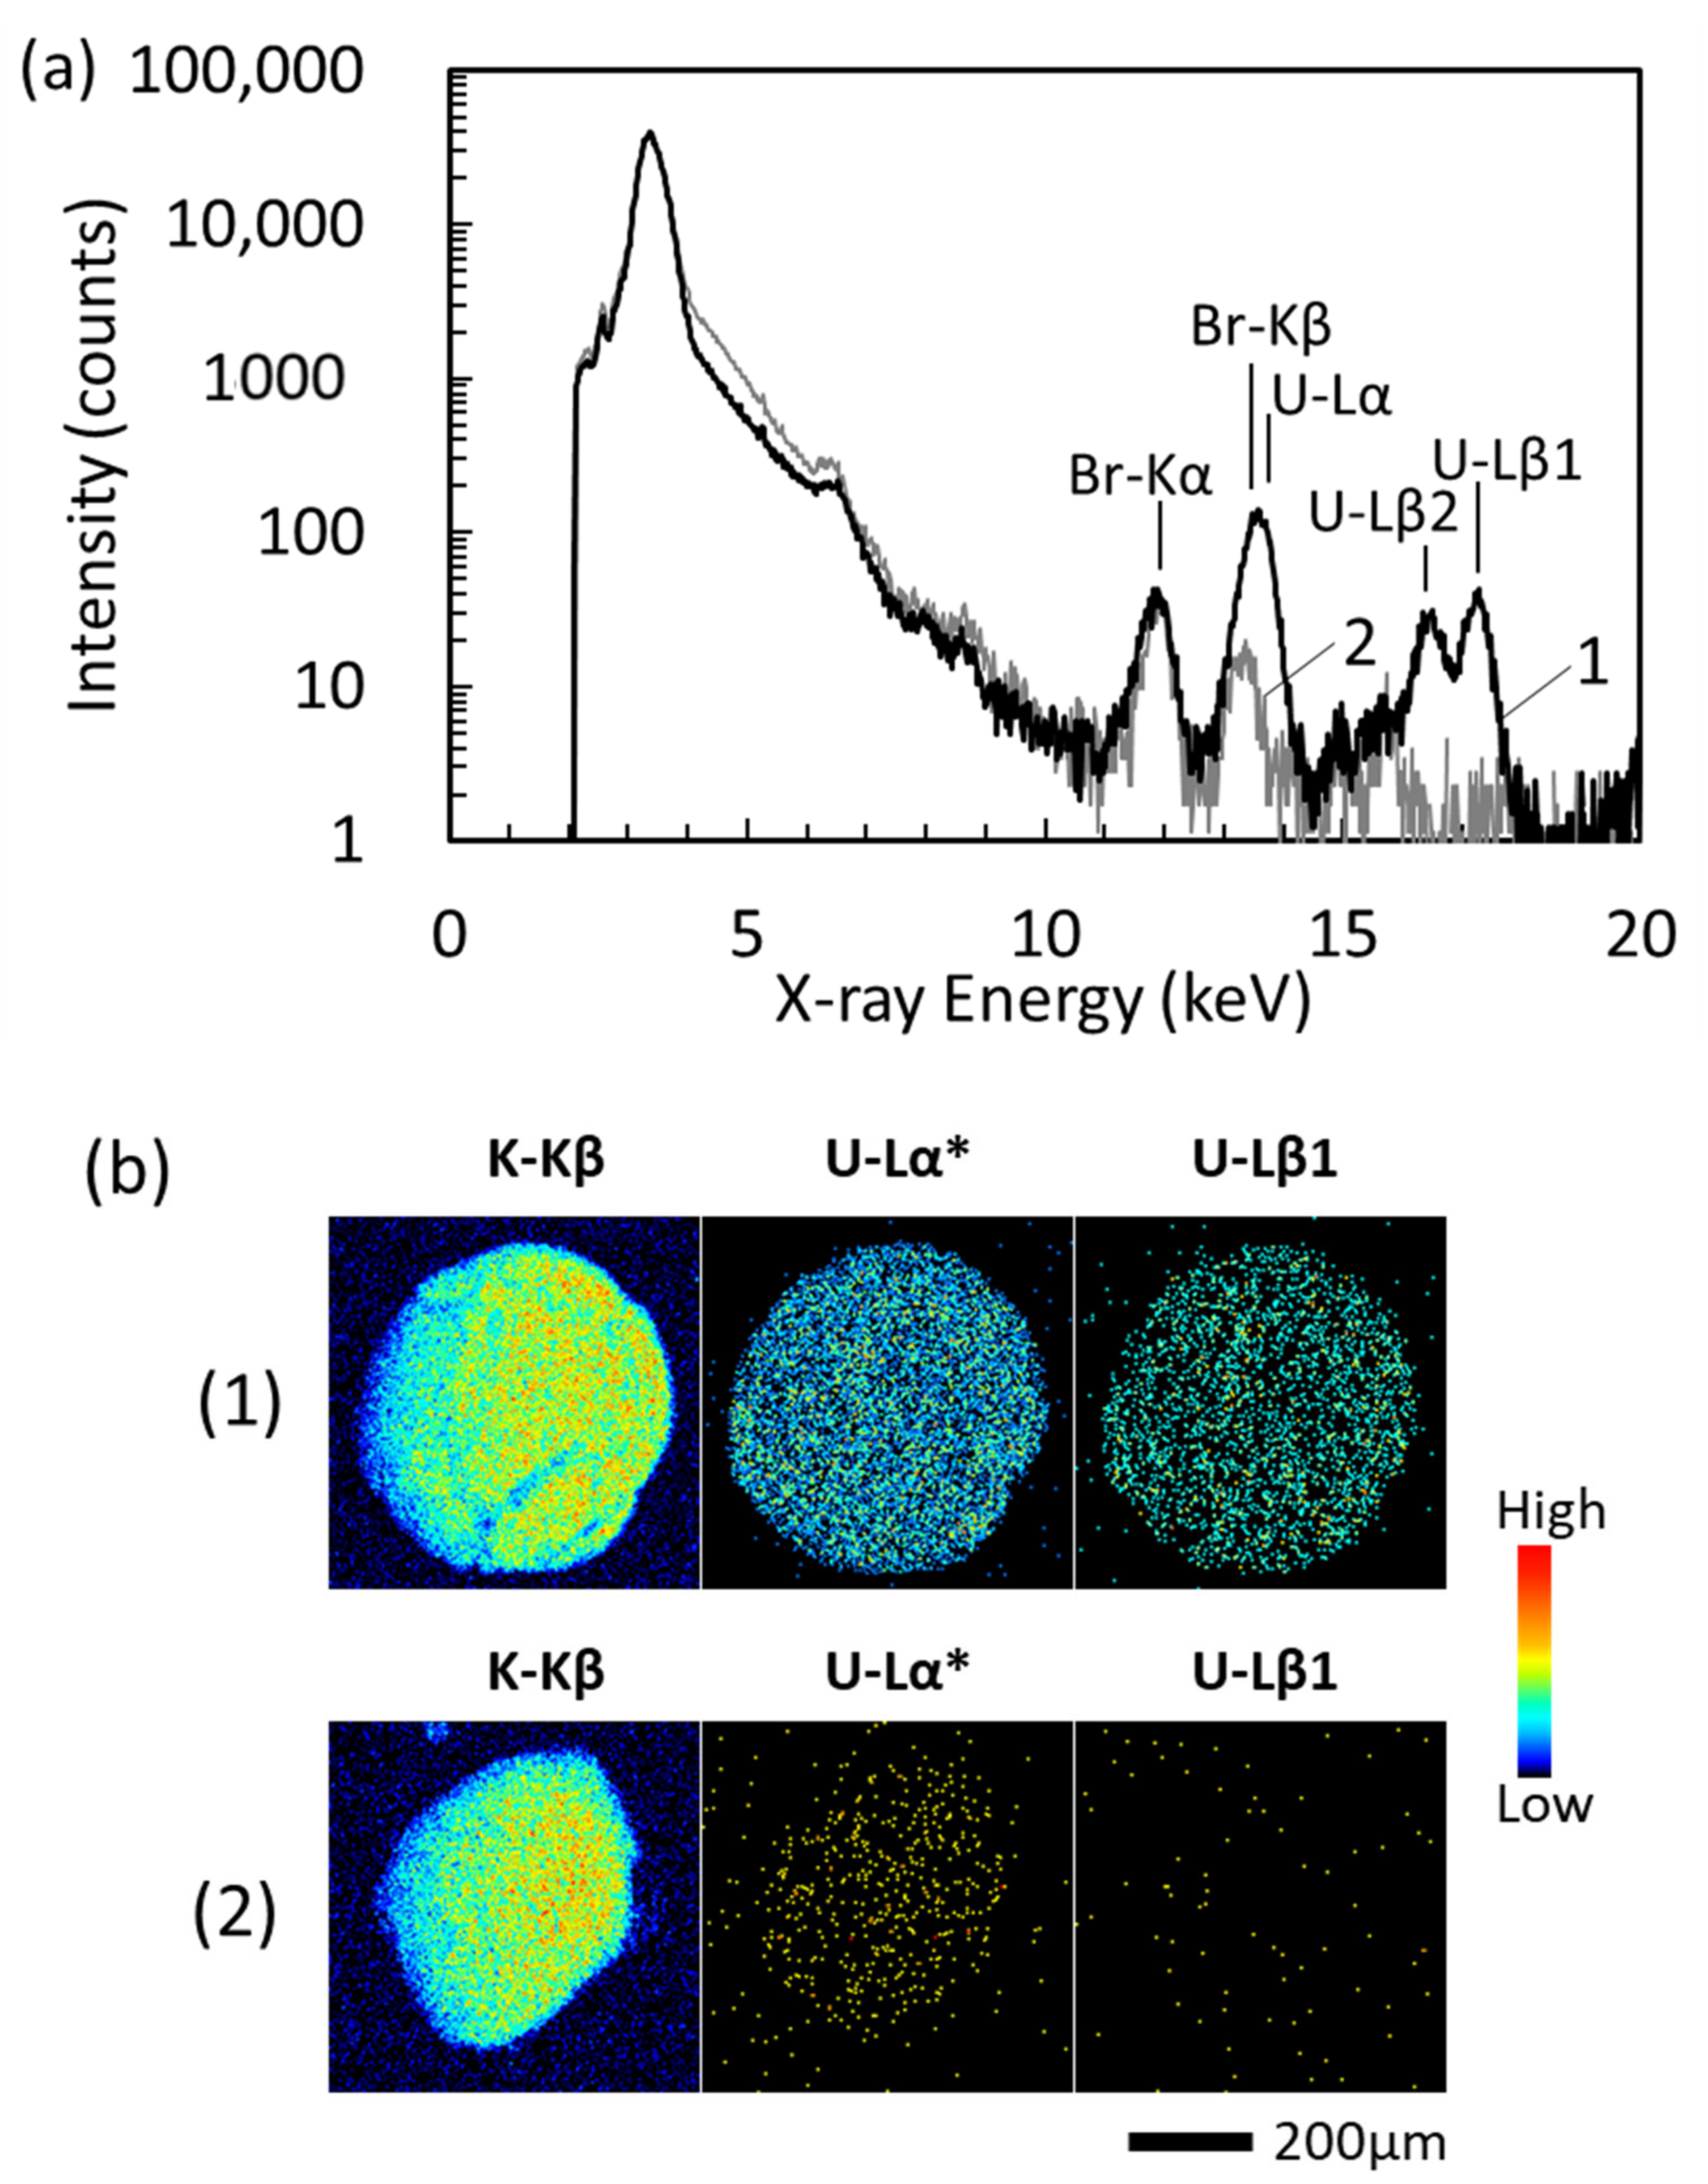
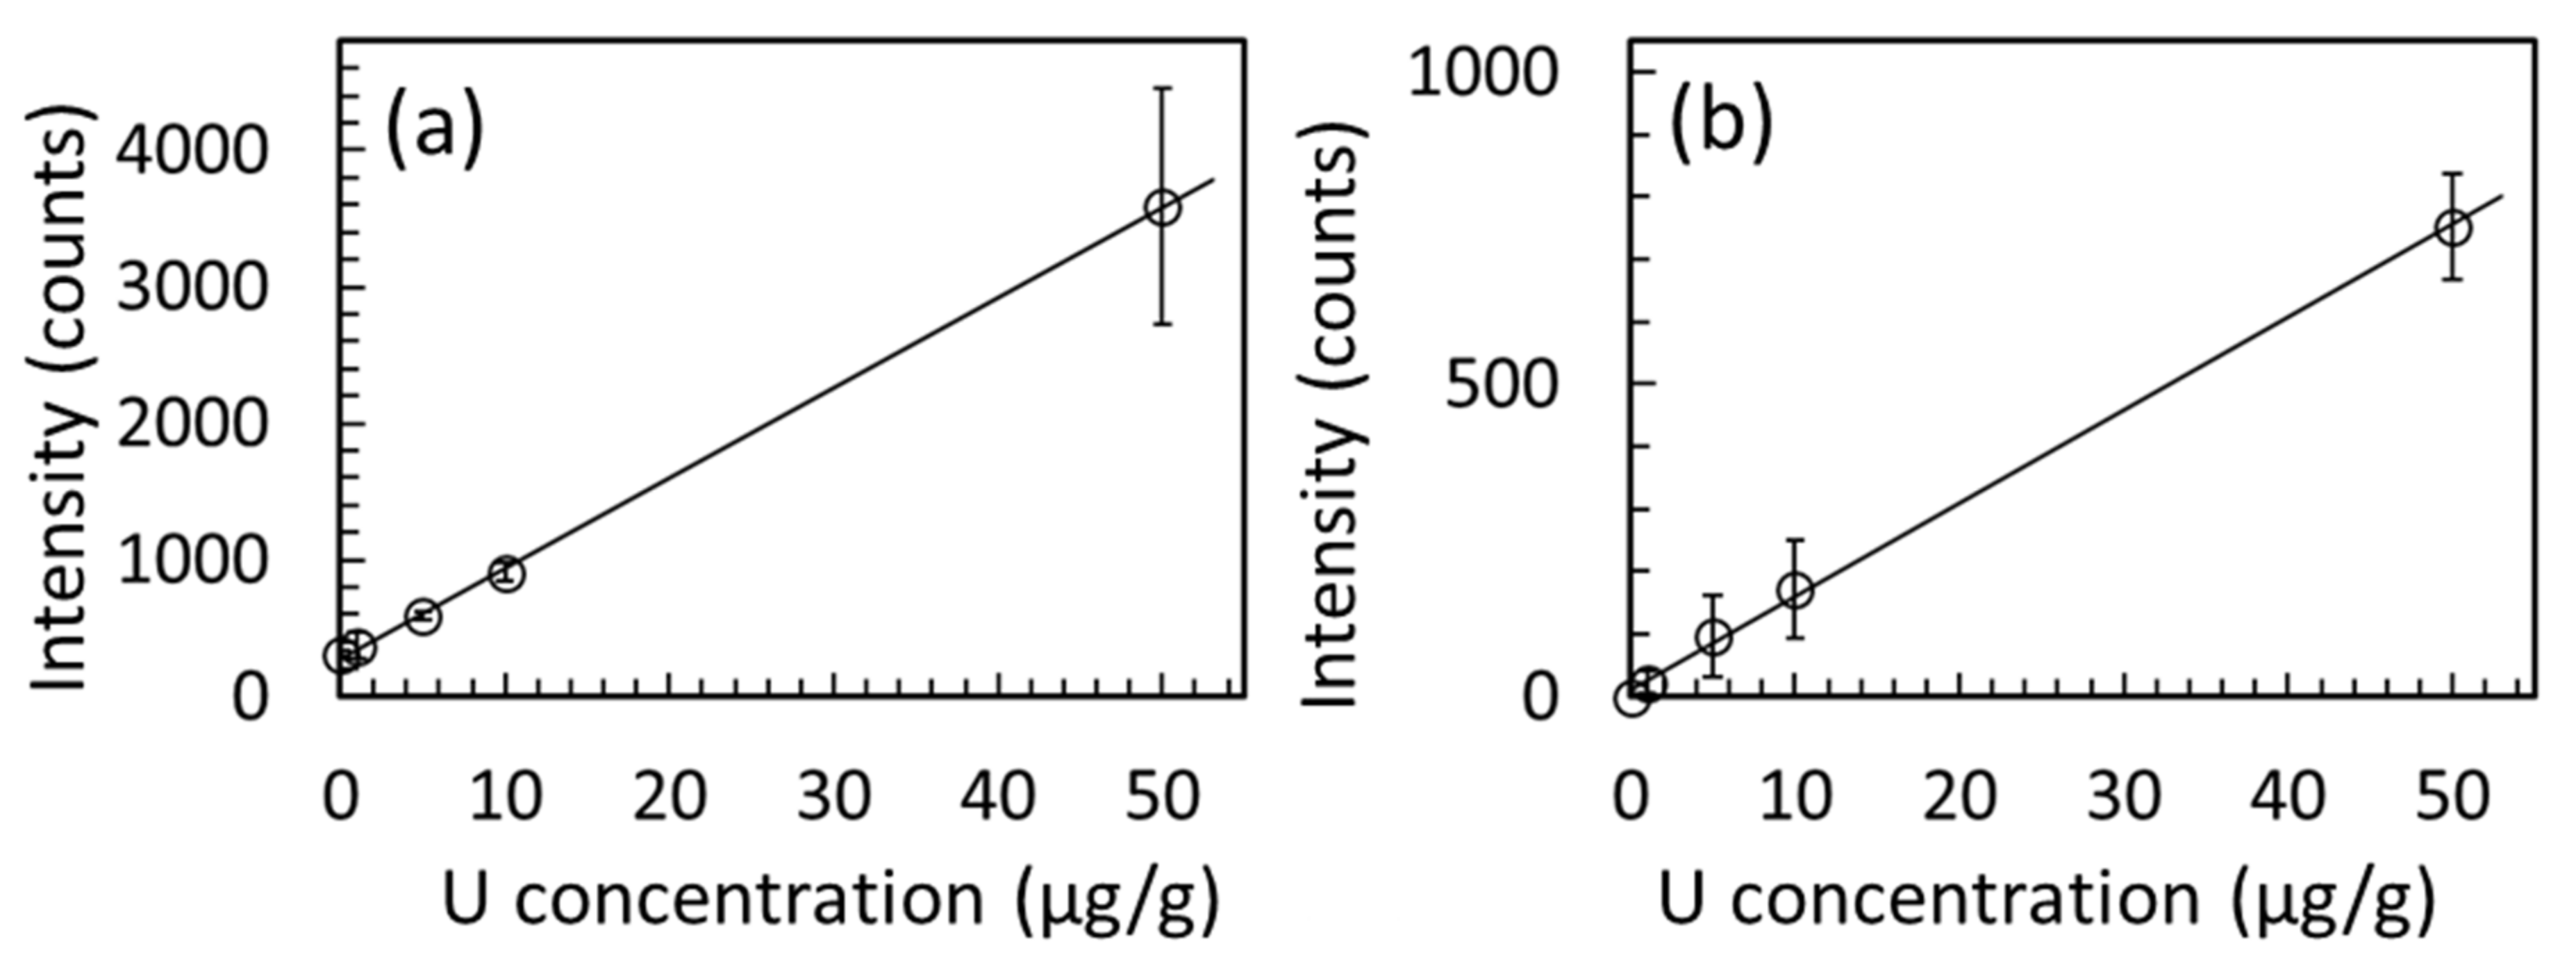
µ-PIXE measurement was performed for the measurement of U in urine. When 1 μL urine without HNO3 dropped onto the non PFA-coated polypropylene film and then dried, the shape of the drop was completely different from that in 0.1 M HNO3. The surface of the drop was rough, and its diameter was approximately 1.5 mm [25]. It was considered that the surface tension of the droplets decreased owing to urea and organic substances in urine. When urine was diluted five-fold with concentrated HNO3, the drop size was reduced to a diameter of approximately 0.7 mm. This was because the organic components contained in urine were decomposed by the HNO3. Furthermore, when samples were dropped on a PFA-coated film, the diameter of the dried drop reduced to approximately 0.5 mm. Curve 1 in Figure 3a is the µ-PIXE spectrum of the specimen containing 50 µg/g U. In addition of U-Lα, U-Lβ1, and U-Lβ2 lines, Br-Kα line at 11.92 keV was observed as endogenous elements in the urine. Note that U-Lα line overlaps with Br-Kβ line at 13.29 keV, which was observed in urine specimen without U (curve 2 in Figure 3a). On the other hand, rubidium (Rb) was supposed to be another element that Rb-Kα line at 13.39 keV could overlap with U-Lα line; however, it was thought that counts of Rb are not significant, because no Rb-Kβ line at 14.96 keV was also observed. It is reported that concentration of Br in urine is 3–6 µg/g, which is about five to ten times higher than that of Rb [19,29,30]. Imagings of U-Lα and U-Lβ1 lines measured with CdTe detector in Figure 3a and K-Kβ line measured with Si(Li) detector in Figure A1 (see Appendix A) of the specimen containing 50 µg/g uranium were shown in Figure 3b1. Here, the K-Kβ line was shown as an example of the main elements of urine. From the imaging results, U appears to be almost uniformly distributed without any extreme bias in element distribution. It is considered that this is owing to the water being vaporized and the reduction in droplets size due to the PFA coating. When the droplets reached the saturated solubility of the matrix including organic and inorganic components, they virtually dried up at the same time. These mechanisms are different from the droplet in the lower concentration of matrix, such as 0.1 M HNO3 (Figure 1b). Some counts corresponding to the Br-Kβ line were observed in the image of U-Lα line in the absence of U (Figure 3b2), although the counts at U-Lβ1 line were negligible. Figure 4 and Table 2 show the counts of detected U-Lα and U-Lβ1 lines against the amount of U in urine. The slope and intercept of the regression lines of U-Lα and U-Lβ1 lines were 65.9 and 285 (R2 = 0.999) and 14.9 and 12.6 (R2 = 0.999), respectively. A linear relationship was observed between 0 and 50 µg/g; however, counts at the U-Lα line were significant at 0 µg/g U owing to the presence of Br in urine.
Uranium in urine sample obtained by exposure of rat to U was quantified. Figure 5a is the µ-PIXE spectrum obtained from the urine of the 4 mg/kg U. Imaging of U-Lβ1 line was clearly observed. It was confirmed that the homogeneity of uranium in the image of Figure 5b was similar with that of standard specimens in Figure 3b. The U concentrations in one urine sample selected from each group (0.5 and 4 mg/kg U) were calculated based on the calibration curves by U-Lβ1 lines. For comparison, the results measured by ICP-MS are also shown in Table 3. When compared with the ICP-MS results, the values at the high and low doses determined by the U-Lβ1 line were close to those determined by ICP-MS within the margin of error. It was confirmed that the other elements did not disturb the intensity of the U-Lβ1 line by the U administration to rats.
To improve the accuracy of uranium determination, the effect of counting on the volume of droplets was investigated. As a result of measurement of 1, 2, and 5 µL droplets containing 50 µg/g U, which were prepared using urine and concentrated HNO3 mixture, the counts increased linearly depending on the volume dropped. Detection of lower concentration of U in urine is to be attained by using 5 µL droplets.

4. Conclusions

Uranium concentration in the urine samples ranging in several µL was determined with a simple method using µ-PIXE analysis. Concentrated HNO3 and film coated by PFA were employed to decompose organic matrices and increase the hydrophobicity of the film, resulting in a decreased area of the droplet specimen. Based on the calibration curve of U-Lβ1 line, U in urine sample collected from U administered rats was quantified without chemical separation of elements contained in urine. It was noted that Br should be considered when U concentration is determined using the U-Lα line owing to the overlapping with U-Lα and Br-Kβ lines. The method could be applied to preliminary bio-monitoring of multi elements including U in liquid samples such as urine and blood serum in acute internal exposure to nuclear accidents.

Author Contributions

Conceptualization: A.U. and S.H.-T.; methodology: A.U.; formal analysis: A.U.; investigation: A.U. and I.T.; resources: M.O. and I.T.; data curation: A.U.; writing—original draft preparation: A.U.; writing—review and editing: A.U. and S.H.-T.; visualization: M.O.; project administration: H.I. and S.H.-T.; funding acquisition: S.H.-T. All authors have read and agreed to the published version of the manuscript.

Funding

This work was partially supported by a Grant-in-Aid for Scientific Research (19H05775) from the Japan Society for the Promotion of Science.

Institutional Review Board Statement

All procedures on animal experimental were approved by the Animal Care Committee of the National Institutes for Quantum and Radiological Science and Technology (No. 18-0005, May 2018).

Acknowledgments

The µ-PIXE experiments were conducted at National Institute of Radiological Sciences (NIRS)-electrostatic Accelerator Facility of National Institutes for Quantum and Radiological Science and Technology (QST) (Proposal No. 19PJ05). We thank T. Matsuda, H. Iso, and Y. Higuchi (Department of Accelerator and Medical Physics, NIRS) for their technical support of PIXE measurement. We thank T. Hamano and T. Shiino (Department of Research Planning and Promotion, NIRS), and Y. Uematsu (Department of Engineering and Safety, NIRS) for their assistance of the experimental procedure including nuclear fuel materials. We also thank H. Yoshida (Tokyo Nuclear Co. Ltd.) for the monitoring of radioactive contamination during the study.

Conflicts of Interest

The authors declare no conflict of interest.

Appendix A

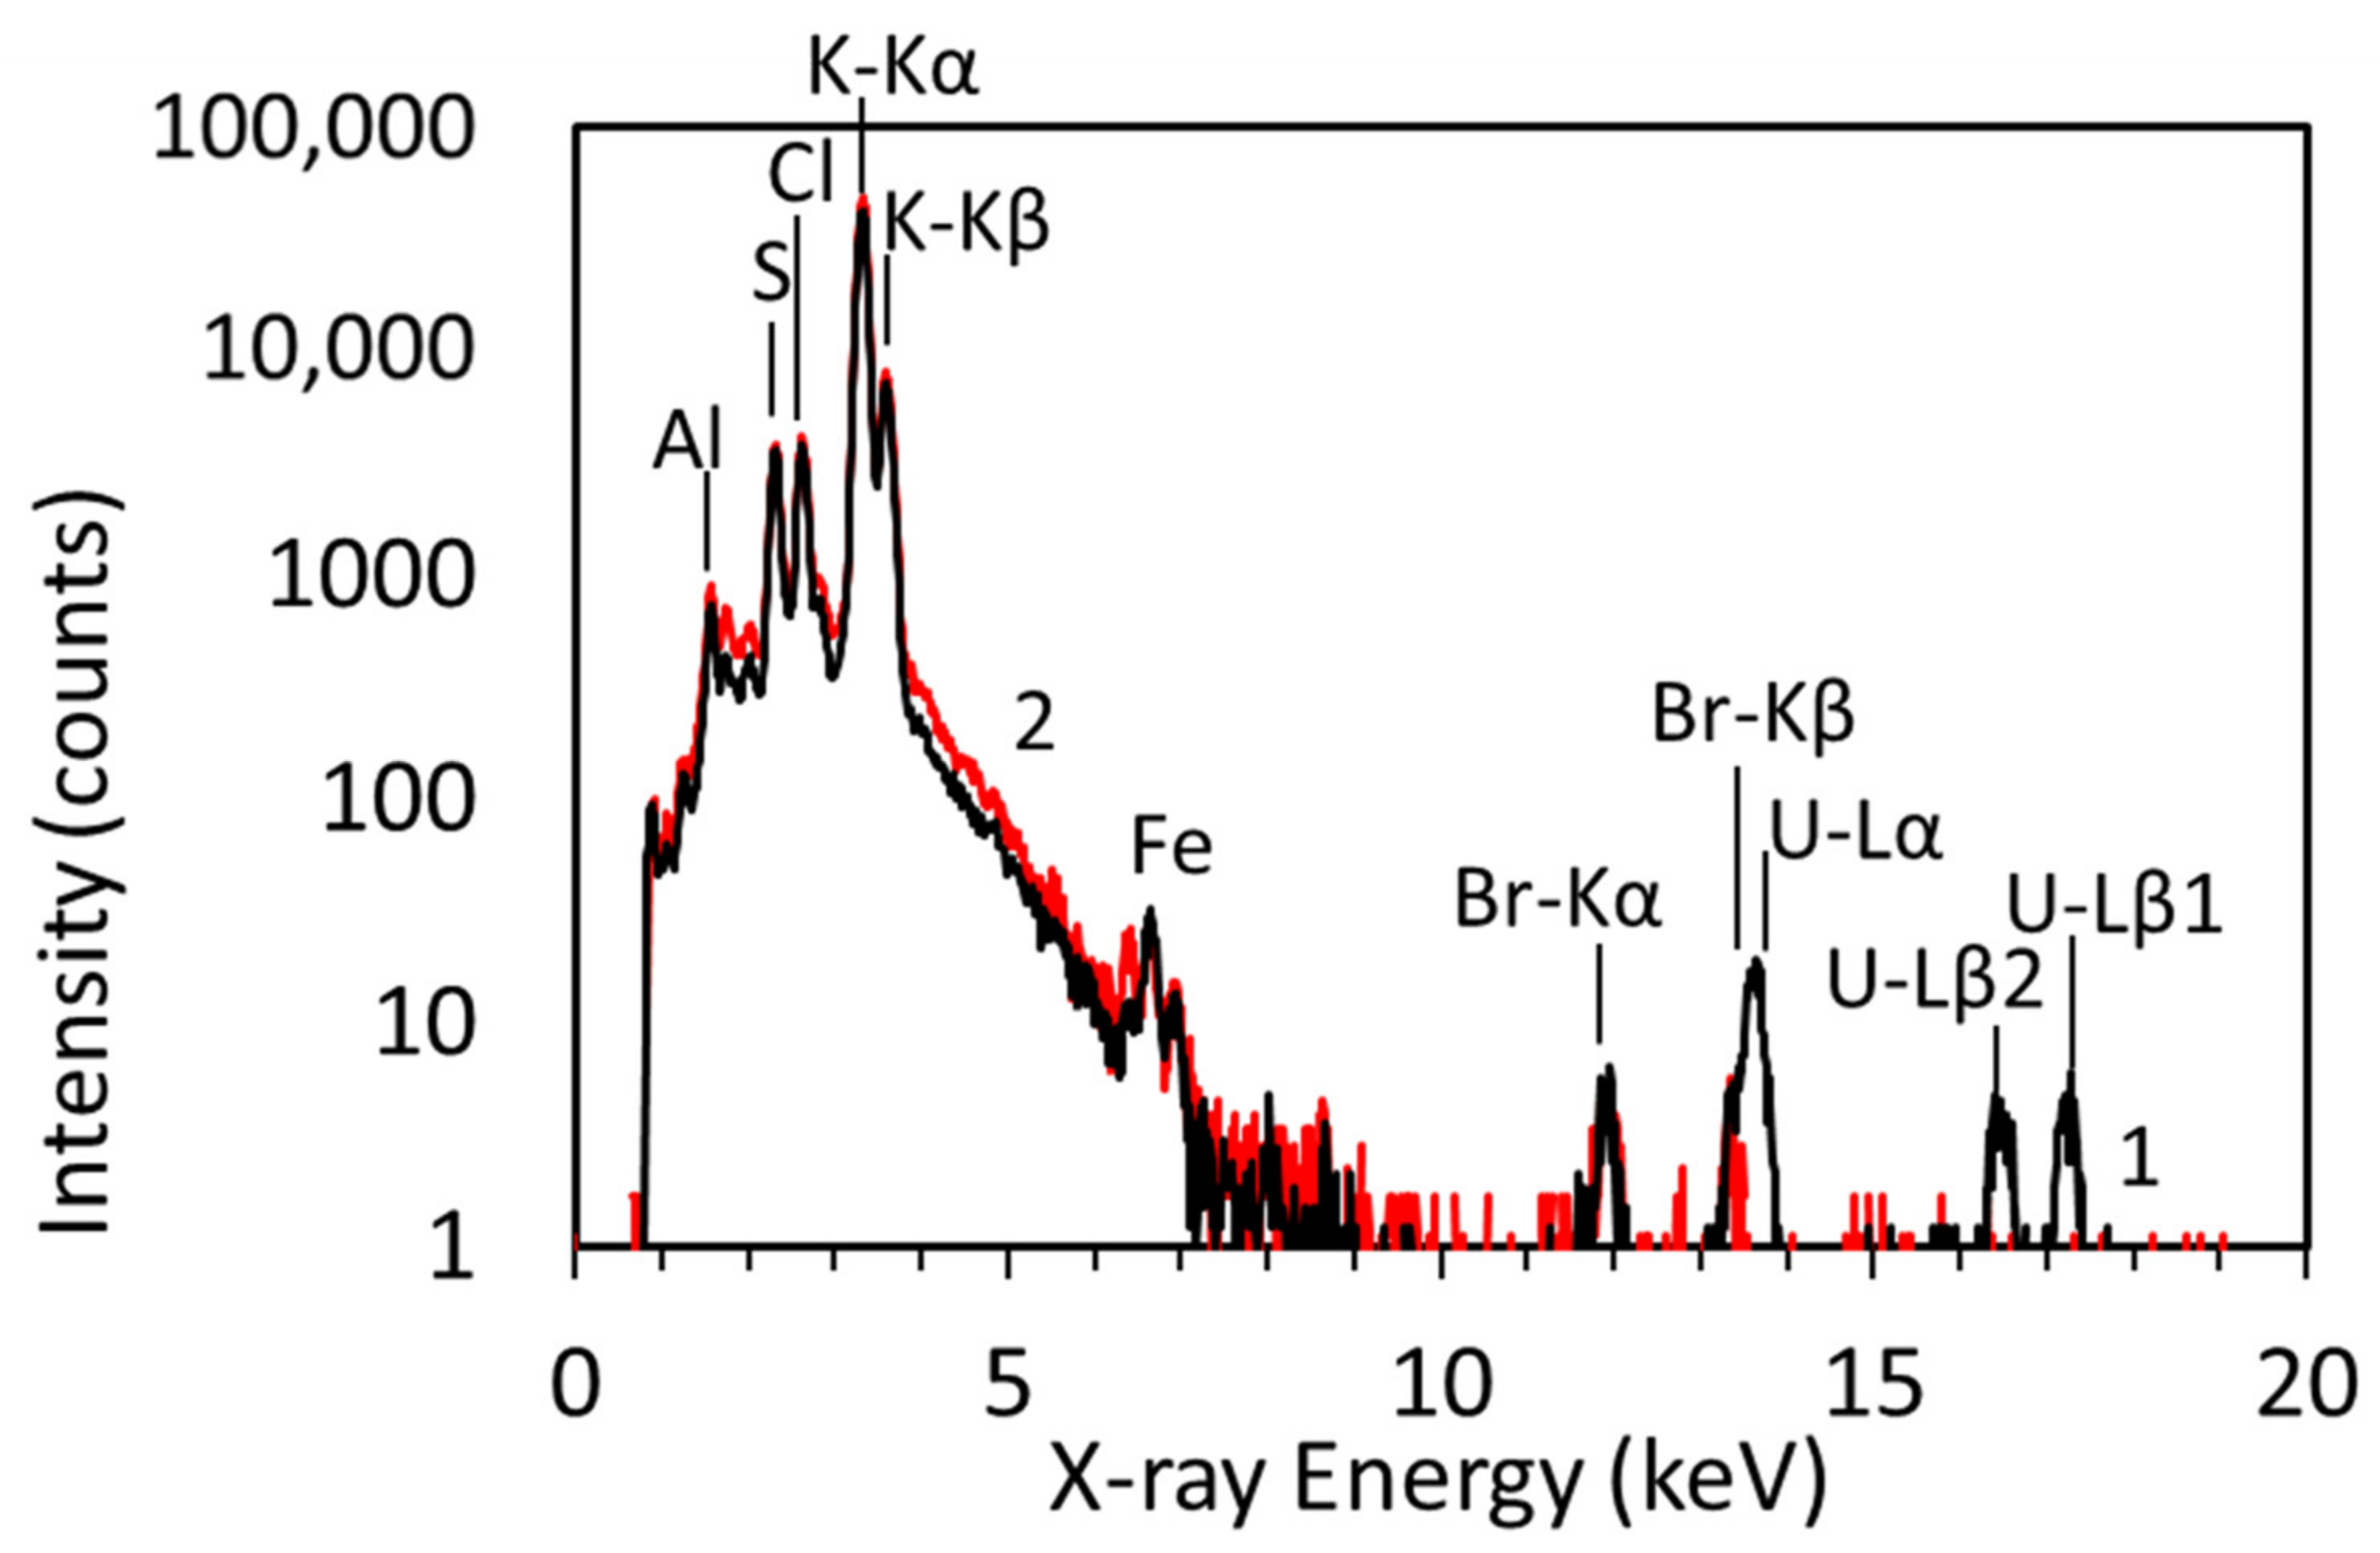
Figure A1. µ-PIXE spectra of specimens prepared using 1 µL droplet of mixed solutions of urine treated with five-fold by HNO3 containing 50 µg/g U for curve 1 (black line) and that without U for curve 2 (red line). Si(Li) detector was used for the measurements.
Minerals 11 00147 g0a1

References

  1. Thakur, P.; Ward, A.L. An overview of analytical methods for in vitro bioassay of actinides. Health Phys. 2019, 116, 694–714. [Google Scholar] [CrossRef] [PubMed]
  2. Leggett, R.W. The behavior and chemical toxicity of U in the kidney: A reassessment. Health Phys. 1989, 57, 365–383. [Google Scholar] [CrossRef] [PubMed]
  3. Vidaud, C.; Bourgeois, D.; Meyer, D. Bone as target organ for metals: The case of f-elements. Chem. Res. Toxicol. 2012, 25, 1161–1175. [Google Scholar] [CrossRef] [PubMed]
  4. UNSCEAR. Biological Effects of Selected Internal Emitters-Uranium. ANNEX D. 2016. Available online: https://www.unscear.org/unscear/en/publications/2016.html (accessed on 31 January 2021).
  5. Ivanenko, N.B.; Ganeev, A.A.; Solovyev, N.D.; Moskvin, L.N. Determination of trace elements in biological fluids. J. Anal. Chem. 2011, 66, 784–799. [Google Scholar] [CrossRef]
  6. Israelsson, A.; Pettersson, H. Measurements of (234)U and (238)U in hair, urine, and drinking water among drilled bedrock well water users for the evaluation of hair as a biomonitor of uranium intake. Health Phys. 2014, 107, 143–149. [Google Scholar] [CrossRef] [Green Version]
  7. Byrne, A.R.; Benedik, L. Uranium content of blood, urine and hair of exposed and non-exposed persons determined by radiochemical neutron-activation analysis, with emphasis on quality-control. Sci. Total. Environ. 1991, 107, 143–157. [Google Scholar] [CrossRef]
  8. Moorthy, A.R.; Schopfer, C.J.; Banerjee, S. Plutonium from atmospheric weapons testing-fission-track analysis of urine samples. Anal. Chem. 1988, 60, A857–A860. [Google Scholar] [CrossRef]
  9. Zarkadas, C.; Karydas, A.G.; Paradellis, T. Determination of uranium in human urine by total reflection X-ray fluorescence. Spectrochim Acta B 2001, 56, 2505–2511. [Google Scholar] [CrossRef]
  10. Karpas, Z.; Halicz, L.; Roiz, J.; Marko, R.; Katorza, E.; Lorber, A.; Goldbart, Z. Inductively coupled plasma mass spectrometry as a simple, rapid, and inexpensive method for determination of uranium in urine and fresh water: Comparison with LIF. Health Phys. 1996, 71, 879–885. [Google Scholar] [CrossRef]
  11. Karpas, Z.; Paz-Tal, O.; Lorber, A.; Salonen, L.; Komulainen, H.; Auvinen, A.; Saha, H.; Kurttio, P. Urine, hair, and nails as indicators for ingestion of uranium in drinking water. Health Phys. 2005, 88, 229–242. [Google Scholar] [CrossRef]
  12. Muikku, M.; Puhakainen, M.; Heikkinen, T.; Ilus, T. The mean concentration of uranium in drinking water, urine, and hair of the occupationally unexposed Finnish working population. Health Phys. 2009, 96, 646–654. [Google Scholar] [CrossRef] [PubMed]
  13. Sahoo, S.K.; Kristsananuwat, R.; Fukushi, M. Actinide analysis in biological materials. Radiat. Emerg. Med. 2012, 1, 22–26. [Google Scholar]
  14. Lee, Y.K.; Bakhtiar, S.N.; Akbarzadeh, M.; Lee, J.S. Sequential isotopic determination of strontium, thorium, plutonium, uranium, and americium in bioassay samples. J. Radioanal Nucl. Chem. 2000, 243, 525–533. [Google Scholar] [CrossRef]
  15. Oeh, U.; Andrasi, A.; Bouvier-Capely, C.; de Carlan, L.; Fischer, H.; Franck, D.; Hollriegl, V.; Li, W.B.; Ritt, J.; Roth, P.; et al. Implementation of bioassay methods to improve assessment of incorporated radionuclides. Radiat. Prot. Dosim. 2007, 125, 444–448. [Google Scholar] [CrossRef] [PubMed]
  16. Ito, J.; Futatsugawa, S.; Saitoh, Y.; Ojima, F.; Sera, K. Application of a powdered-internal-standard method to plant and seaweeed samples. Int. J. PIXE 2005, 15, 27–39. [Google Scholar] [CrossRef]
  17. Yoshitomi, T.; Yaginuma, N.; Iso, H.; Ishikawa, T.; Imaseki, H.; Homma-Takeda, S. Mercury distribution by micro pixe analysis in stenopsyche marmorata exposed to mercuric chloride. Int. J. PIXE 2008, 18, 69–75. [Google Scholar] [CrossRef]
  18. Yukawa, M.; Aoki, K.; Iso, H.; Kodama, K.; Imaseki, H.; Ishikawa, Y. Determination of the metal balance shift induced in small fresh water fish by X-ray irradiation using PIXE analysis. J. Radioanal Nucl. Chem. 2007, 272, 345–352. [Google Scholar] [CrossRef]
  19. Sera, K.; Miura, Y.; Futatsugawa, S. Application of a standard-free method to quantitative analysis of urine samples. Int. J. PIXE 2001, 11, 149–158. [Google Scholar] [CrossRef]
  20. Kennedy, V.J.; Augusthy, A.; Varier, K.M.; Magudapathy, P.; Panchapakesan, S.; Nair, G.M. Trace element analysis of mineral water samples by PIXE and ICP-MS. Int. J. PIXE 1998, 8, 11–18. [Google Scholar] [CrossRef]
  21. Homma-Takeda, S.; Iso, H.; Ito, M.; Suzuki, K.; Harumoto, K.; Yoshitomi, T. Evaluation of pressed powders and thin section standards for multi-elemental analysis by conventional and micro-pixe analysis. Int. J. PIXE 2010, 20, 21–28. [Google Scholar] [CrossRef]
  22. Homma-Takeda, S.; Suzuki, K.; Harumoto, K.; Yoshitomi, T.; Iso, H.; Ishikawa, T.; Konishi, T.; Oikawa, M. Evaluation of thin section standards for local analysis of light elements by micro-pixe analysis. Int. J. PIXE 2011, 21, 25–30. [Google Scholar] [CrossRef]
  23. Suzuki, T.; Kawasaki, T.; Takao, K.; Harada, M.; Nogami, M.; Ikeda, Y. A study on selective precipitation ability of cyclic urea to U (VI) for developing reprocessing system based on precipitation method. J. Nucl. Sci. Technol. 2012, 49, 1010–1017. [Google Scholar] [CrossRef] [Green Version]
  24. Homma-Takeda, S.; Numako, C.; Kitahara, K.; Yoshida, T.; Oikawa, M.; Terada, Y.; Kokubo, T.; Shimada, Y. Phosphorus localization and its involvement in the formation of concentrated uranium in the renal proximal tubules of rats exposed to uranyl acetate. Int. J. Mol. Sci. 2019, 20, 4677. [Google Scholar] [CrossRef] [PubMed] [Green Version]
  25. Uehara, A.; Oikawa, M.; Tanaka, I.; Ishihara, H.; Homma-Takeda, S. Sample preparation for the elemental analysis in biological fluids by micro-PIXE. Adv. X-Ray Chem. Anal. 2020, 51, 81–90. [Google Scholar]
  26. Homma-Takeda, S.; Terada, Y.; Nakata, A.; Sahoo, S.K.; Yoshida, S.; Ueno, S.; Inoue, M.; Iso, H.; Ishikawa, T.; Konishi, T.; et al. Elemental imaging of kidneys of adult rats exposed to uranium acetate. Nucl. Instrum. Meth. B 2009, 267, 2167–2170. [Google Scholar] [CrossRef]
  27. Homma-Takeda, S.; Kitahara, K.; Suzuki, K.; Blyth, B.J.; Suya, N.; Konishi, T.; Terada, Y.; Shimada, Y. Cellular localization of uranium in the renal proximal tubules during acute renal uranium toxicity. J. Appl. Toxicol. 2015, 35, 1594–1600. [Google Scholar] [CrossRef]
  28. Oikawa, M.; Suya, N.; Konishi, T.; Ishikawa, T.; Hamano, T.; Homma-Takeda, S. Micro-PIXE analysis system at NIRS-electrostatic accelerator facility for various applications. Int. J. PIXE 2015, 25, 217–225. [Google Scholar] [CrossRef]
  29. Abuku, S.; Tanaka, S.; Seki, Y.; Imamiya, S. Determination of bromide ions in total blood, plasma and urine by ion chromatography with amperometric detection. Jpn. J. Hyg. 1989, 44, 945–952. [Google Scholar] [CrossRef] [Green Version]
  30. Goulle, J.P.; Mahieu, L.; Castermant, J.; Neveu, N.; Bonneau, L.; Laine, G.; Bouige, D.; Lacroix, C. Metal and metalloid multi-elementary ICP-MS validation in whole blood, plasma, urine and hair: Reference values. Forensic. Sci. Int. 2005, 153, 39–44. [Google Scholar] [CrossRef]
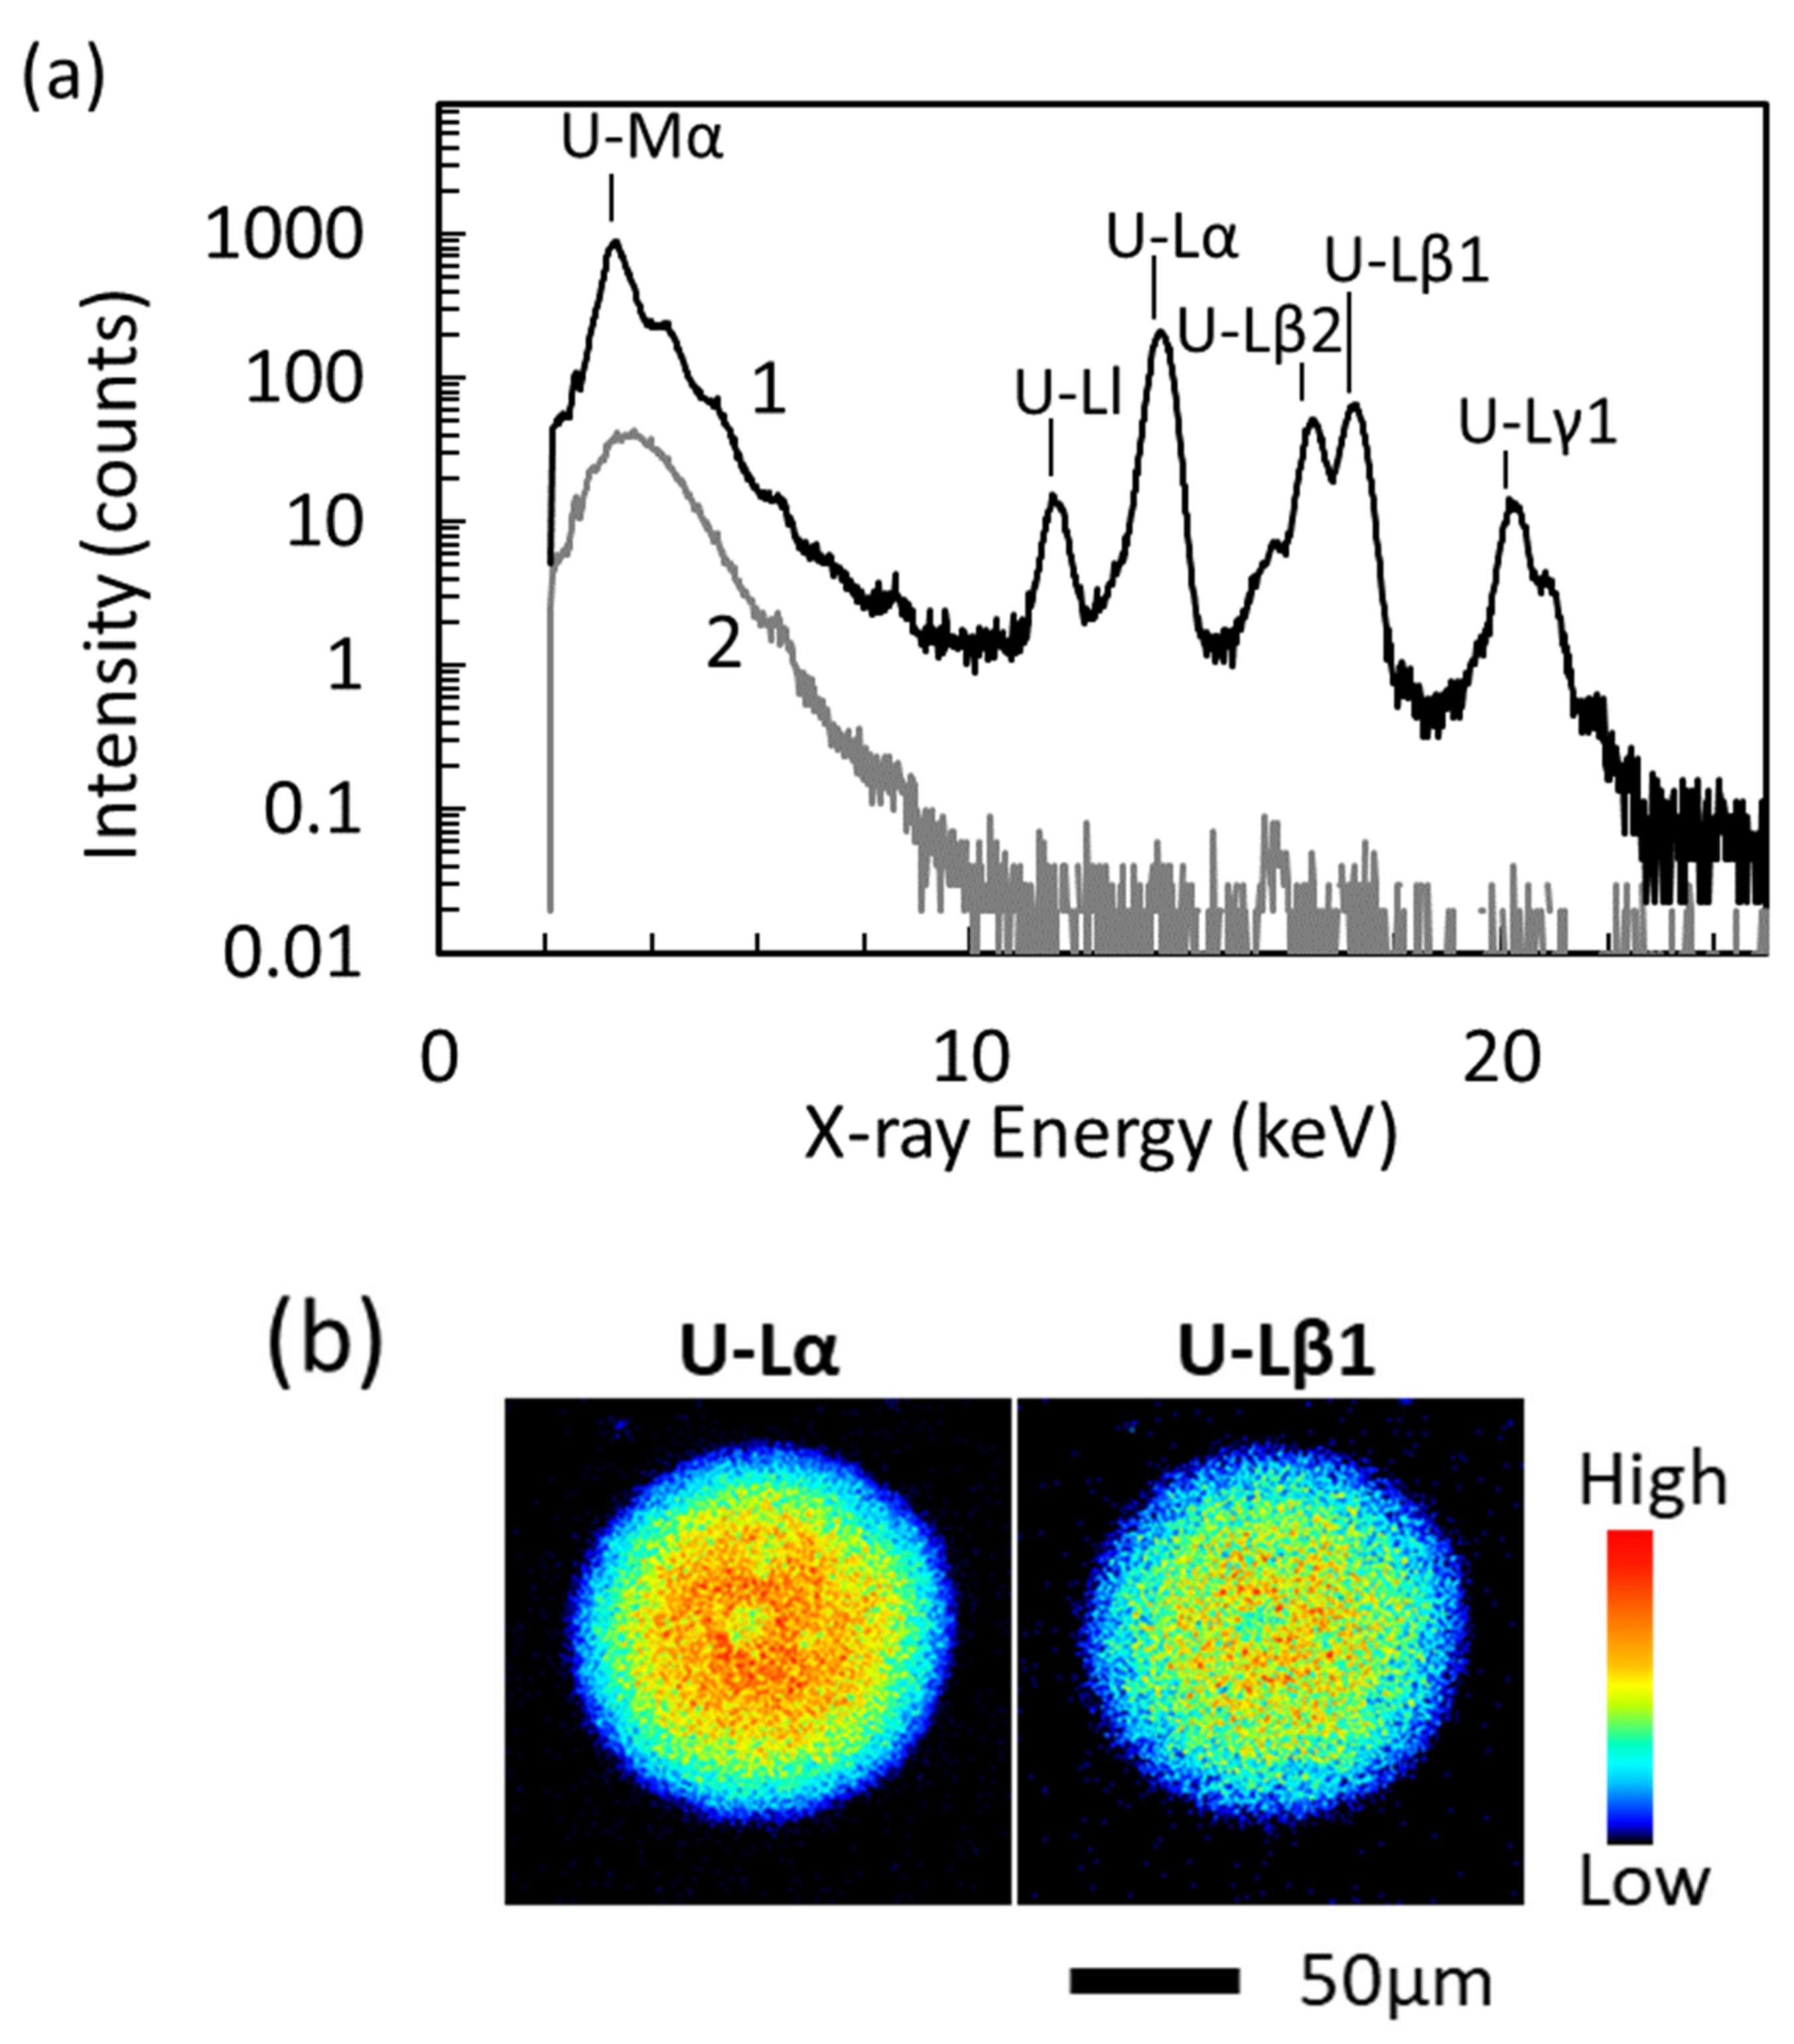
Figure 1. (a) µ-PIXE spectra of 1 µL of 50 µg/g U in 0.1M HNO3 for curve 1 and that of blank for curve 2. (b) U images at U-Lα and U-Lβ1 lines.
Minerals 11 00147 g001
Figure 2. Calibration lines of 1–100 µg/g U in 0.1 M HNO3. Horizontal axis: U concentration (µg/g); vertical axis: X-ray intensity in the analyzed area of (a) U-Lα (12.8–14.2 keV) and (b) U-Lβ1 (16.8–17.8 keV) lines. Each point represents the mean and standard deviation of data from three specimens.
Minerals 11 00147 g002
Figure 3. (a) µ-PIXE spectra of specimens prepared using 1 µL droplet of mixed solutions of urine treated with five-foldHNO3 containing 50 µg/g U for curve 1 and that without U for curve 2. (b) X-ray imaging of K-Kβ by Si(Li) detector, U-Lα, and U-Lβ1 lines by CdTe detector in the presence (1) and absence (2) of U. *Imaging of U-Lα line expresses sum of the counts at U-Lα and Br-Kβ lines.
Minerals 11 00147 g003
Figure 4. Calibration lines of 1–50 µg/g U in mixed solutions of urine treated with five-fold HNO3. Horizontal axis, U concentration (µg/g); vertical axis, X-ray intensity of (a) U-Lα (12.8–14.2 keV) and (b) U-Lβ1 (16.8–17.8 keV) lines. Each point is mean and error of data from three positions per specimen. Note that count of U-Lα (12.8–14.2 keV) line overlaps with counts at Br-Kβ line.
Minerals 11 00147 g004
Figure 5. (a) µ-PIXE spectra of specimens prepared using 1 µL droplet of mixed solutions of urine treated with five-fold HNO3. The urine was collected for five hours after 4 mg/kg U administration to rats. (b) X-ray imaging of K-Kα line by Si(Li), U-Lα, and U-Lβ1 lines by CdTe detector. *Imaging of U-Lα line expresses sum of the counts at U-Lα and Br-Kβ lines.
Minerals 11 00147 g005
Table 1. X-ray intensity of U-Lα and U-Lβ1 lines in 1 µL of U standard in 0.1 M HNO3.
U Concentration *
(µg/g)
U-Lα lineU-Lβ1 line
Intensity
(Counts ± SD)
RSD (%)Intensity
(Counts ± SD)
RSD (%)
1103 ± 5519 ± 421
5579 ± 407148 ± 2114
101191 ± 474286 ± 4415
505322 ± 515101294 ± 1109
1009811 ± 48252321 ± 1517
* µ-PIXE measurements were performed on three specimens for one concentration. Each point represents the mean and standard deviation of data from three specimens.
Table 2. X-ray intensity of U-Lα and U-Lβ1 lines in 1µL of mixed solutions of urine treated five-fold HNO3.
U Concentration *
(µg/g)
U-Lα lineU-Lβ1 line
Intensity
(Counts ± SD)
RSD (%)Intensity
(Counts ± SD)
RSD (%)
0311 ± 21700
1375 ± 952523 ± 1878
5589 ± 31597 ± 6466
10913 ± 627172 ± 7946
503589 ± 86924753 ± 8511
* µ-PIXE measurements were performed on three specimens for one concentration. Each point represents the mean and standard deviation of data from three specimens.
Table 3. Uranium concentration in urine administration specimens determined by calibration line of U-Lβ1 line.
Administration
U (mg/kg)
U Concentration (µg/g)
U-Lβ1 Line *ICP-MS
0.518.5 ± 12.514.1 **
450.7 ± 9.053.9 **
* PIXE measurements were performed on three specimens for one concentration. ** values determined by ICP-MS.
Publisher’s Note: MDPI stays neutral with regard to jurisdictional claims in published maps and institutional affiliations.