Article

Algae in Acid Mine Drainage and Relationships with Pollutants in a Degraded Mining Ecosystem

1
Campus de Gualtar, Institute of Earth Sciences-Pole of University of Minho, University of Minho, 4710-057 Braga, Portugal
2
CERNAS/QRural, Polytechnic Institute of Castelo Branco and Institute of Earth Sciences-Pole of University of Évora, University of Évora, 7000-345 Évora, Portugal
3
Department of Vegetal Biology (Botany Unit), Faculty of Biology, University of Barcelona, 08014 Barcelona, Spain
4
Departament of Edaphology and Agricultural Chemistry, Faculty of Biology, University of Santiago de Compostela, 15782 Santiago de Compostela, Spain
*
Author to whom correspondence should be addressed.
Minerals 2021, 11(2), 110; https://doi.org/10.3390/min11020110
Submission received: 7 December 2020 / Revised: 11 January 2021 / Accepted: 19 January 2021 / Published: 22 January 2021
(This article belongs to the Special Issue Pollutants in Acid Mine Drainage)

Abstract

:
Acid mine drainage represents an extreme environment with high concentrations of potentially toxic elements and low pH values. These aquatic habitats are characterised by harsh conditions for biota, being dominated by acidophilic organisms. The study site, São Domingos mine, located in one of the largest metallogenetic provinces in the world, the Iberian Pyrite Belt, was closed without preventive measures. To identify the algae species and understand the relationships with abiotic parameters of the ecosystem, water and biological material were collected and analysed. Digital terrain models were obtained with an unmanned aerial vehicle for geomorphological and hydrologic characterisation of the mine degraded landscape. The results show two types of algal colours that seem to represent different degrees of photosynthetic activity. Optical and scanning electron microscopy revealed 14 taxa at the genus level, divided into eight classes. The genus Mougeotia is the most abundant multicellular algae. With respect to unicellular algae, diatoms are ubiquitous and abundant. Abiotic analyses expose typical features of acid mine drainage and support an inverse relationship between chemical contamination and biological diversity. Factorial correspondence analysis indicates three groups of attributes and samples by their relationship with specific toxic elements. This analysis also suggests a close association between Spirogyra and Pb, together composing a structurally simple ecosystem. The highest contamination in the river system is related to the hydrologic patterns obtained from photogrammetric products, such as the digital surface model and flow map accumulation, indicating the input of leachates from the section having the finest sulfide-rich wastes. Information about the algae community and their association with flow patterns of toxic elements is a relevant tool from a biomonitoring perspective.

1. Introduction

Acid mine drainage (AMD), typical of sulfide environments, is promoted by mining activities and often presents features of extreme degree of pollution [1,2]. Usually, the affected systems show high concentrations of potentially toxic elements (PTE), low pH and presence of iron colloids, causing water turbidity and nutrient deficiency. These characteristics contribute to stress conditions that affect biota by inducing a reduction in biodiversity [3]. Therefore, these environments are dominated mostly by prokaryotes and eukaryotes that are acidophilic and acid-tolerant, composing a structurally simple ecosystem [4]. These organisms play important roles in safeguarding primary production and can be divided into two groups: chemoautotrophic (mainly bacteria) and photoautotrophic (such as acidophilic algae). Both interfere with the mobility of dissolved chemical species in the aquatic medium. It is known from scientific literature that algae have mechanisms to avoid toxic effects, exhibiting tolerance to metals [2,5]. Furthermore, some algae, namely the diatoms, which are known for their ability to survive in different types of metal-polluted waters [6,7], can be used in monitoring processes. Some species have optimal growth limits under acidic conditions and therefore they are good markers of contamination generated by AMD [8]. In line with that, the European Water Framework Directive (WFD, European Commission 2000) introduced ecological criteria for determination of water quality, reinforcing the importance of ecological indicators for the study of human impact in water bodies. Thus, studies of biotic systems in acidified waters have been undertaken in various regions of the world [9], and also in the Iberian Pyrite Belt (IPB) [4,7,10,11], including the São Domingos mining area [12].
Since contamination and rehabilitation processes based on ecological procedures are paramount, it is crucial to have a thorough knowledge of these extreme survival communities in AMD. So, the objectives of this research study are to investigate and identify the community of algal flora in the aquatic ecosystem that receives the drainage from São Domingos mining area and correlate it to abiotic features. For this, hydrochemical properties as well as hydrological and geomorphological characteristics are fundamental and will be considered. Photogrammetric products and statistical tools, such as factorial correspondence analysis, are used to determine possible relationships between algae distribution and flow patterns of potentially toxic elements. In this way, this study intends to contribute to the development of biomonitoring plans that could be applied in abandoned mining sites with AMD contamination.

2. Materials and Methods

2.1. Study Area

São Domingos mine, characterized by sulfide deposits, is located in the south of Portugal, and is part of the IPB Metallogenic Province (Figure 1). It represents a typical scenario of mining contamination by old exploitations in the IPB. Mining started in pre-Roman times and ended in 1966 when it was abandoned without rehabilitation measures. This area tends to be characterized by its low pH and extremely high concentrations of heavy metals, mainly Cu, Fe, and Zn but also rich in other less abundant elements that are burdensome to the environment such as Sb, As, Hg, and Pb [13]. Infrastructure including ore-processing plants and machinery are abandoned through the study area, leading to different types of wastes disseminated through the mining complex [14]. Specifically, the mining area is covered by two streams: São Domingos and Mosteirão streams. The Chança River, primary effluent of Guadiana River, especially its water dam is the final receptor of the acidic discharges (Figure 1). The intense red-orange colour associated with high concentrations of iron and deposition of ochre-precipitates is characteristic of São Domingos waters [15].
With a typical Mediterranean climate, the region has two distinct seasons: a wet period, from November to March, and a dry period, from May to September. The annual average air temperature is 17.6 °C, and annual precipitation is 559 mm, with hot summers (30 °C) and cold winters (12 °C) [16].

2.2. Geomorphological Characterization

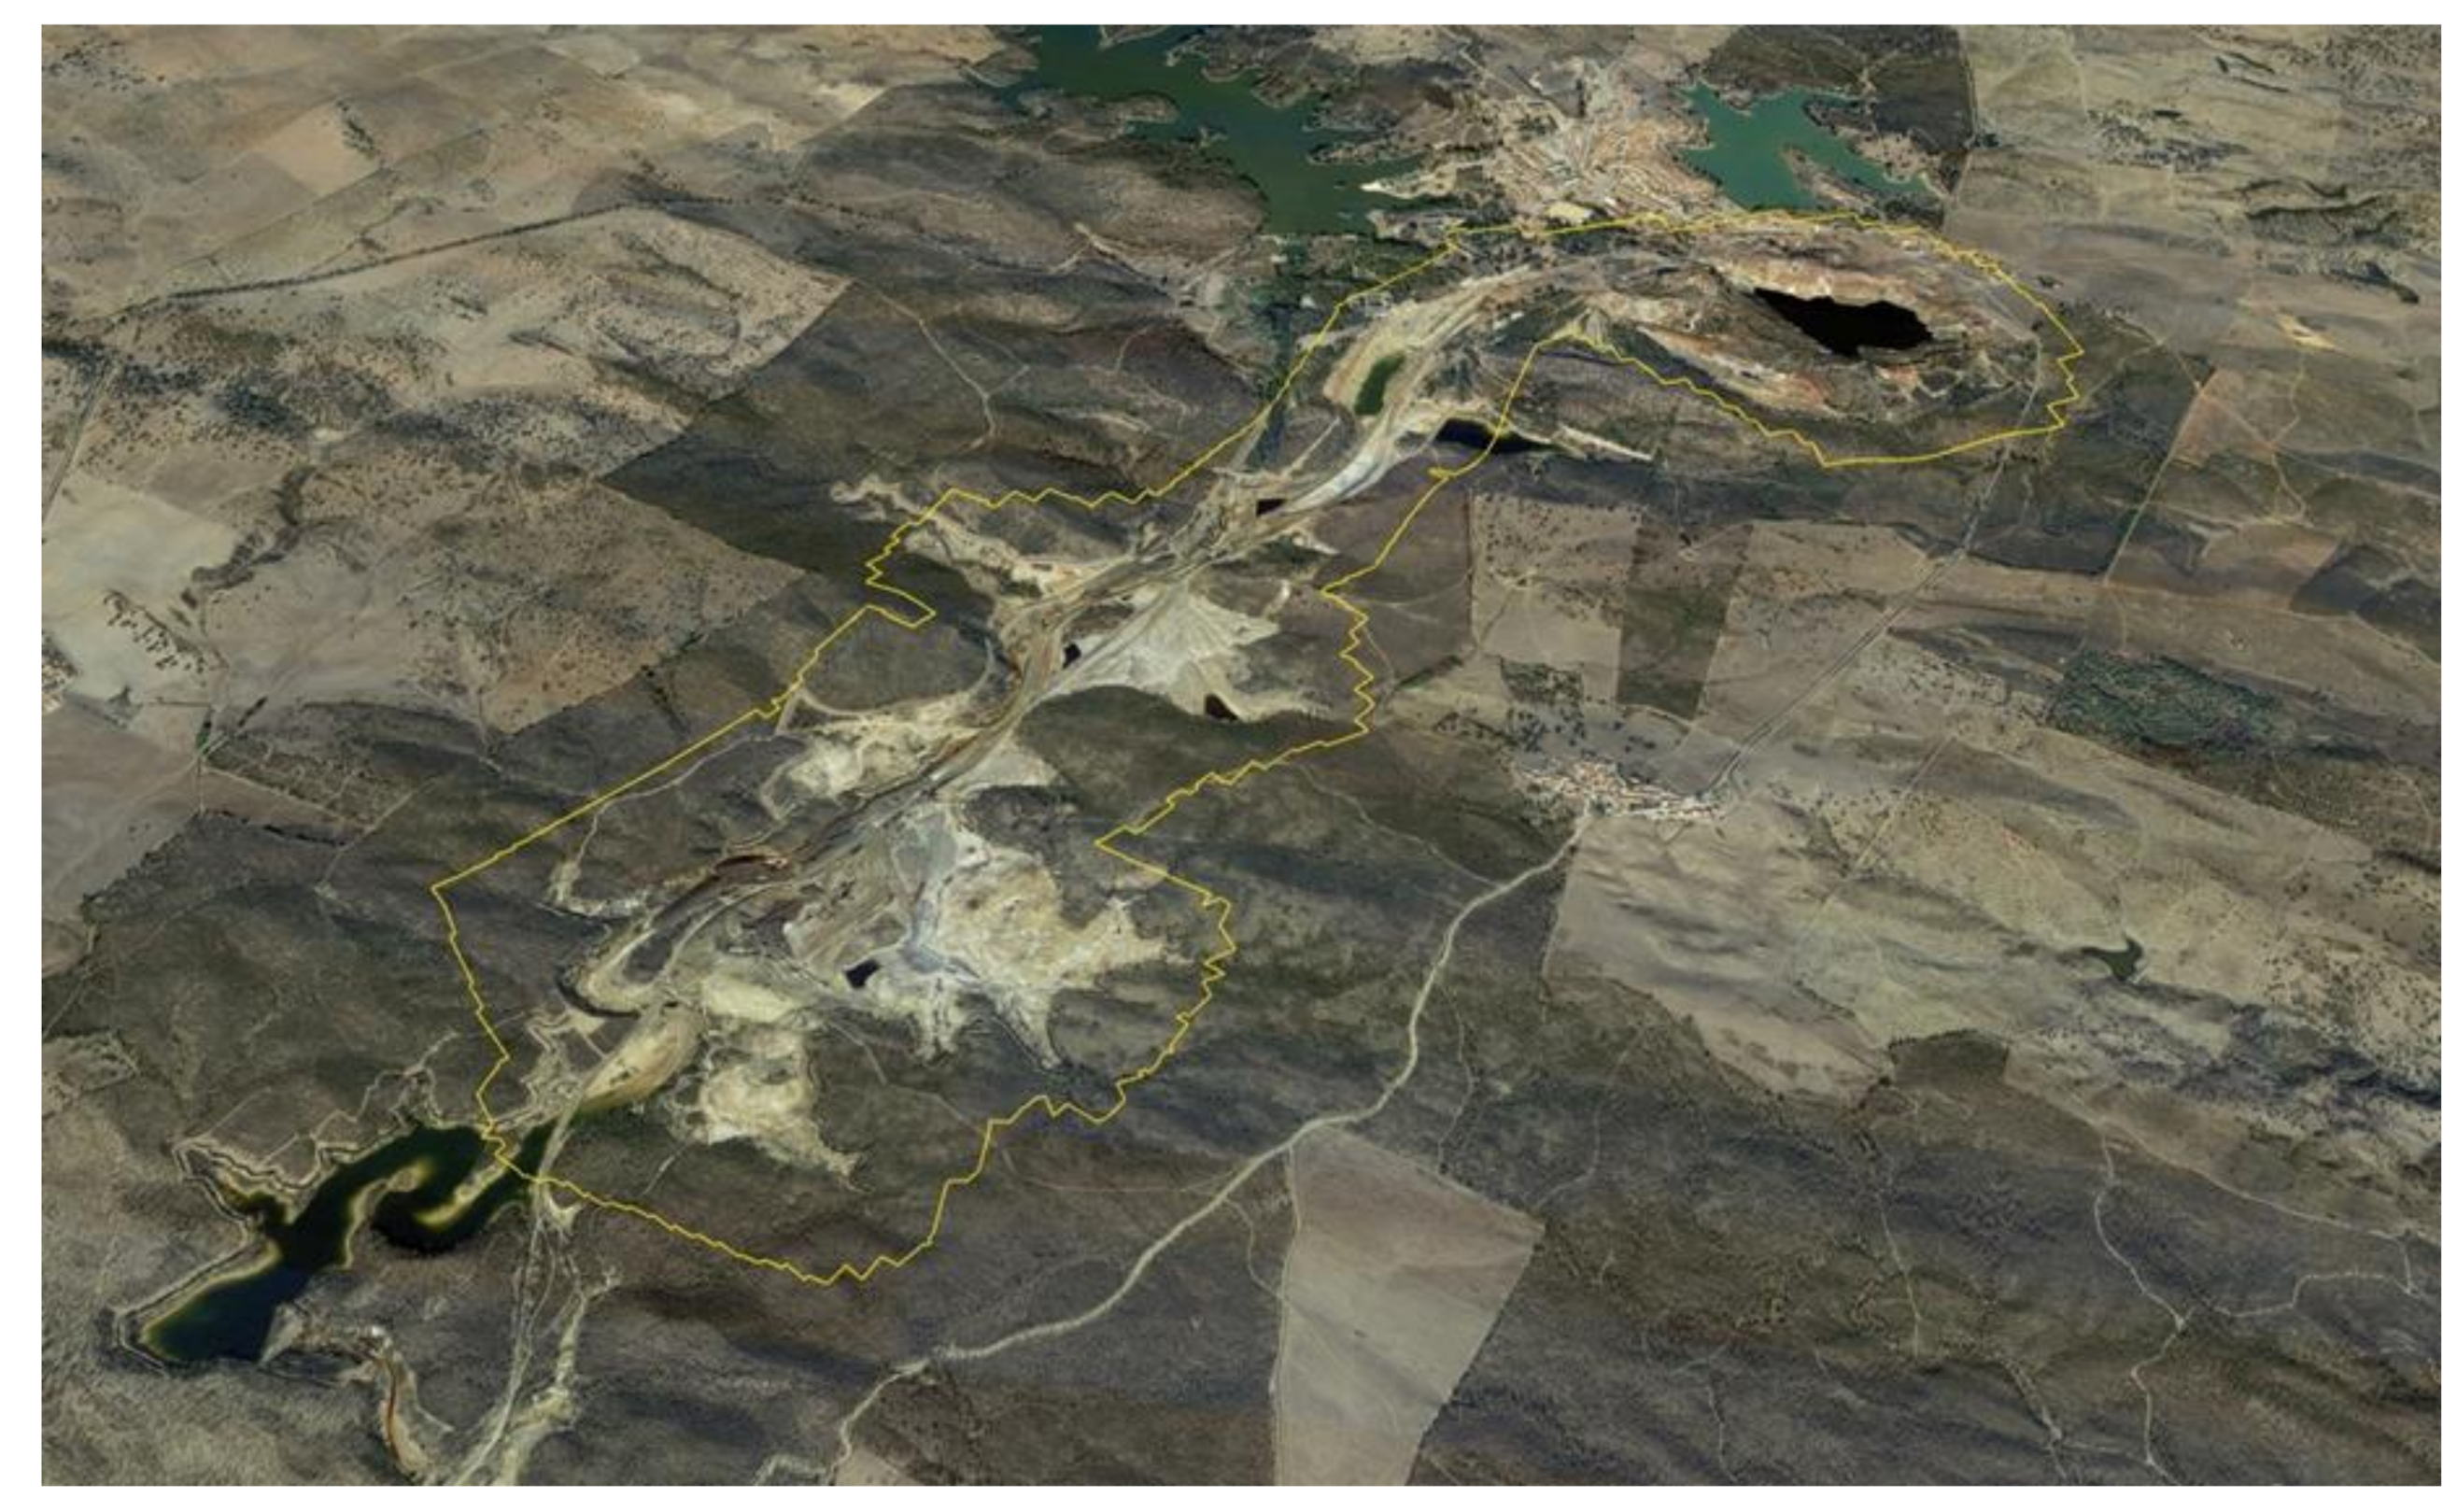
In order to make the geomorphological characterization of the area, a survey campaign was conducted using an unmanned aerial vehicle (UAV). In total, an area of 3,813,157.52 m2 was surveyed, with a maximum width of 1.58 km and a maximum length of 4.12 km (Figure 2).
The unmanned aerial vehicle used was a Phantom 4 Pro®, DJi™, Shenzhen, Guangdong, China. Due to the limited battery life for each flight, a total of five flights were performed to ensure photogrammetric coverage of the entire area (Figure 2). Each flight was performed at 150 m high, with flight paths in parallel rows, using a front overlap of 75% and a side overlap of 70%. This was done using the MapPilot® flight planning application from Maps made Easy™, which has the functionality of keeping the UAV flight at a constant altitude relative to the topographic surface, using NASA’s SRTM altitude models. The final photogrammetric products obtained were a digital surface model (DSM) and an orthophotomap, with a ground sampling distance (GSD) of 4.1 cm/pixel. The photogrammetric processing was performed using the Metashape® application from Agisoft™. In this work no ground control points were collected using GNSS equipment due to the difficulty of safe access to some areas included in the survey, which would allow a centimetric accuracy of the photogrammetric products [17]. However, the purpose of this work does not require such high precision. Thus, to ensure sub-metric accuracy of the photogrammetric products, GCPs were collected from survey grade products, with the latitude and longitude extracted from the 2015 orthophotomaps produced by the Portuguese General Directorate of the Territory, with a ground sampling distance of 10 cm/pixel, and the altitude extracted from topographic surveys carried out by the Portuguese army to produce the official Portuguese topographic cartography. A total of 9 GCPs were used, evenly distributed throughout the area, allowing the production of photogrammetric products (DSM and orthophotomap) with average errors of 0.36 m in x axis, 0.17 m in y axis and 0.10 m in z axis, with the RMS error being 0.41 m.
The morphological analysis of the terrain was done using the open-source GIS application Quantum GIS. The hydrological analysis, namely the runoff patterns and flow accumulation, was done using the “r.terraflow” routine [18,19], included in the GRASS processing module of Quantum GIS. A detailed description of the flow accumulation calculation can be found at https://grass.osgeo.org/grass78/manuals/r.terraflow.html.

2.3. Water Sampling and Analytical Methods

Samples were collected in the hydrological year of 2016–2017 (monthly from October to September), at eight different locations according to the scheme shown in Figure 1. Determination of pH, temperature (°C), and electrical conductivity (EC µS/cm, at 25 °C) were recorded on-site, operating a portable meter Thermo Scientific Orion. Two sterilized polyethylene containers were used at each point to store superficial water: one was filled with 0.45 µm filtered water and acidified with concentrated acid nitric to obtain a pH < 2, in order to prevent metals precipitation and bacterial growth during transportation to the laboratory; the other was collected to be used for the remaining analyses.
The sulfate was determined by the turbidimetric method [20] and total acidity and alkalinity were analysed by volumetric determination [21]. Concentrations of selected elements (Al, Mn, Fe, As, Cu, Zn, Cr, Ni, Co, Cd, Pb, Mg, Ca, K) were obtained by inductively coupled plasma optical or mass spectrometry (ICP-OES/MS). These analyses were performed at Activation Laboratory, Lda (Actlabs, Ancaster, ON, Canada), including duplicate samples and blanks to check precision, whereas accuracy was obtained by using certified standards. All the reagents used were of analytical grade or of Suprapur quality (Merck, Darmstadt, Germany). The standard solutions were Merck AA Certificate. Milli-Q water was used in all the experiments.

2.4. Algae Community—Sampling and Identification

With the purpose of studying and identifying the algae community, sampling, treatment, and analyses of phytoplankton were performed according with European Committee for Standardization norms (2003). Algae were collected at the same time and place that the water samples. Specifically, samples were taken based on the macroscopic presence of algae and to study their diversity. They were obtained by scraping the substrates and by dredging the water surface through a polyethylene container. At each site, two samples were taken: one represents in vivo and the other was preserved with Kew solution immediately after collection. Subsequently, they were accommodated in a portable refrigerator at 4 °C to avoid degradation, being analysed when arrived to the laboratory. Taxonomic identification was achieved by optical microscopy (Leica Microscope DMRB with UEYE coupled camera) and scanning electronic microscopy (SEM) (Evo LS15 Zeiss) based on morphological features.

2.5. Statistical Analysis

Factorial correspondence analysis (FCA) was applied to dataset in order to find possible relationships between the variables and the samples. FCA belongs to a group of factorial extraction methods whose primary goal is to uncover the underlying pattern of relationships within a dataset. The aggregation of standardized parameters was developed by Benzécri at the beginning of the 1970s [22,23]. This is done by rearranging the data into a smaller number of uncorrelated ‘‘components” or ‘‘factors” that are extracted from the data by statistical transformations. Such transformations involve diagonalizing the same type of variable similarity matrix, such as a correlation or variance-covariance matrix. Each factor describes a certain amount of the statistical variance of the analysed data and is interpreted according to the intercorrelated variables. The main advantage of FCA is that symmetry is given to the data matrix [23], enabling the simultaneous study of correlations within and between variables and samples. A detailed discussion of the theory underlying the FCA is beyond the scope of this article, but its application in this matter is rather straightforward. For computation purposes, ANDAD version 7.12, CVRM/IST: Lisboa, Portugal [24] was used.

3. Results and Discussion

3.1. Photogrammetric Products

Through a survey using the UAV, high-resolution images of the area that borders the São Domingos stream were obtained. Figure 3 shows the digital surface model and an example of the typical pattern of surface flow accumulation in one of the most affected sections of the surveyed area.
The area is morphologically dominated by a V-shaped valley, more or less open, which talweg constitutes the bottom of the São Domingos stream. The mining waste deposits with contaminants, resulting from mining activity, are predominantly on the east side of the stream. These deposits are exposed to precipitation and can be easily mobilized by surface run-off in the direction of the talweg, which means that the flow is mainly in the direction of the riverbed of São Domingos stream. Topographic blockages to surface runoff are usually small elevations made up of the waste deposits or acidic lagoons. The section illustrated in Figure 3 has one of these lagoons, which is completely covered by sulfate efflorescences during dry season. This is a section of special interest, due to the presence of large amounts of fine sulfide-rich wastes and due to this lagoon, cyclically subject to the dissolution of the sulfates blooms.
The preferential flow accumulation in acidic lagoons and in São Domingos stream is notorious. Considering that all the topography along the valley is convergent to the São Domingos stream, the surface run-off and the underground run-off will invariably lead to inputs of contaminants in the stream. As surveyed, this stream has a maximum elevation of 133.378 m and a minimum of 85.819 m, with an extension of 3148.6 m. These values correspond to an average slope of the talweg of 2.73%. This slope leads to a general drainage of the São Domingos stream basin in the direction of the Chança dam. As an example, the P5 and P8 sampling sites receive the leachates from the areas most affected by the presence of very fine wastes.

3.2. Water Physical-Chemical Characterization

The statistical summary of the hydrochemical parameters are presented in Table 1. The results show that the lowest pH average is 2.5, found at P5. On the other hand, P11 represents the sampling point with the highest average pH value (4.0). The same pattern can be observed consistently for electrical conductivity (EC) and sulfate, which have higher values for P5 (4035 μS/cm and 3155 mg/L, respectively) and lower values for P11 (741 μS/cm and 301 mg/L, respectively). Between these two sites, there is a decrease in sulfate concentration, reflecting a reduction of contamination, as a function of attenuation processes, such as dilution and the development of mineralogical neoformations. Specifically, efflorescences of Fe and Al-sulfates and precipitation of jarosite, the most abundant iron hydroxysulfate in this system, are the main mineralogical control factors [15].
Of the metals, Fe, Al, and Zn presented the highest concentrations, with Fe achieving maximum of 801 mg/L in P5. The dominance of these metals has been reported in other AMD affected sites around the world [25,26,27]. According to Soyol-erdene et al. [28], the high concentrations obtained for Al and Mg can be explained by the abundant dissolution of host felsic rocks, allowed by the strong acidity of the medium. As observed for in situ parameters (pH and EC), the selected PTE present higher concentrations in P5, followed by P8 (Table 1) in dry season. A previous study [3] indicated the highest amount of chlorophyll in these two sampling points, leading us to believe that algae present mechanisms that confer them tolerance and even preference to toxic factors. As mentioned before, the contact of water with the different types of mining wastes disposed around the acidic lagoons [29], explains the highest contamination, as observed by the flow accumulation map (Figure 3).

3.3. Algae Community Study

3.3.1. Field Evidence

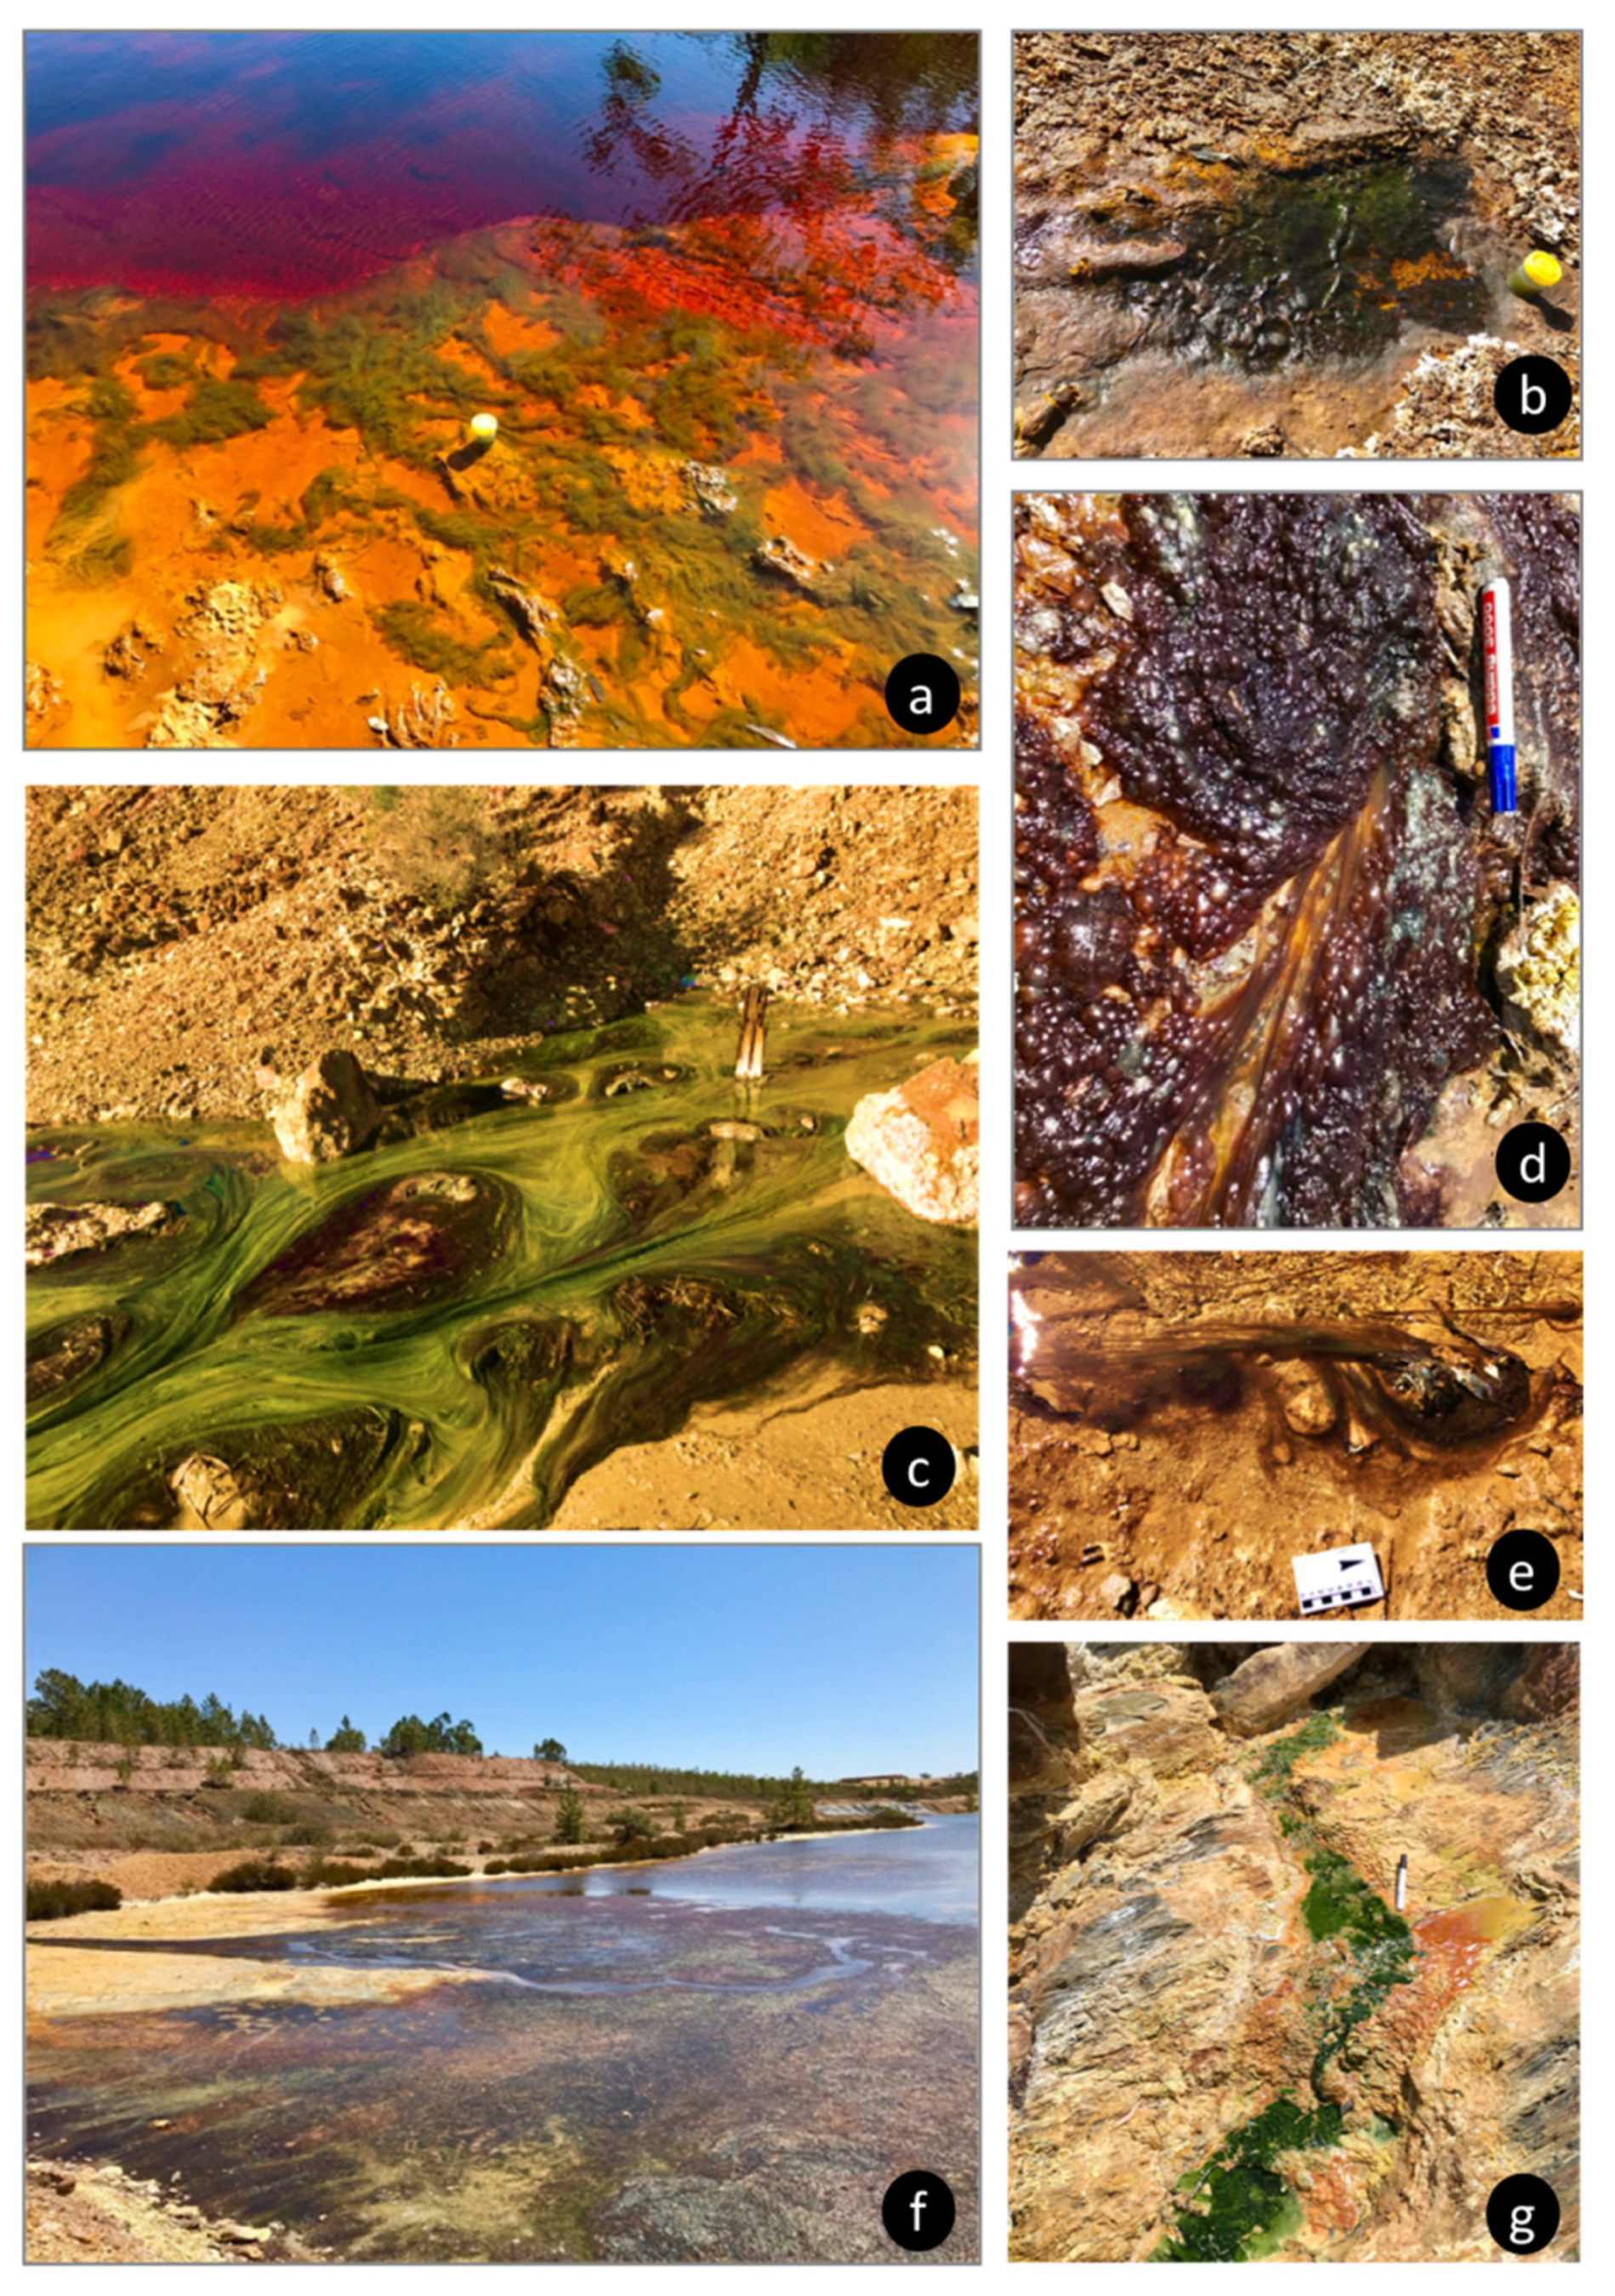
AMD systems represent harsh conditions where only a small number of specialized alga can develop [6]. In this way, as reported by [10] in previous studies conducted at IPB, two distinct types of algal colours were observed in São Domingos mine: green and brown-purplish (Figure 4). The first was the most abundant type occupying the majority of sampling points, where the water flow was low (Figure 4a,b). They were attached to fixed materials, such as twigs and rocks, presenting long filaments that trailed along the water. According to [3], abiotic characteristics such a lotic or lentic environment, are factors with important influence on algae fixation and colonization. The same observations were realized by [30]. The filamentous brown-purplish algae blooms (Figure 4c) are more evident at P3, where the water flow is low. In Figure 4d it is possible to observe a detail of gaseous effervesce formation, which are oxygen bubbles from photosynthesis.
It is possible that these distinctive colours indicate different species and/or different degrees of algae activity. According to Gomes et al. [3], in this case, brown-purplish algae seems to exhibit clear senescent properties and algae with fresh biomass presents green colour. With excess nutrients and favourable temperature, phytoplankton can multiply rapidly, forming a bloom (Figure 4f). In this case, the water turns greenish briefly, from one to two days, depending on the temperature, and becomes brownish when the plankton depletes the nutrients and begins to die. However, in the middle of these filamentous algae, diatoms can also occur, that present a golden or brownish colour, and are also designated by gold algae, contributing to this appearance [10]. Often, algal blooms hold suspended particles, which give them ochre shades (Figure 4e). According to Valente and Gomes [6], this phenomenon can be explained by the dense community of algae that often acts as a barrier for iron oxyhydroxide precipitates.
No important differences in the macroscopic appearance of algae were observed during the monthly sampling, leading us to observe that the same type of algae inhabits in certain locations at São Domingos mine, regardless of the season. However, it was possible to observe that the occurrence of filamentous species is higher during the dry summer months, when most physicochemical parameters are extreme, especially in P3 and P5. These results are in accordance with [3,11], that revealed the same pattern. When the conditions are more extreme, higher photosynthetic production rates were analysed, following the exuberance of the blooms.

3.3.2. Identification by Optical Microscopy

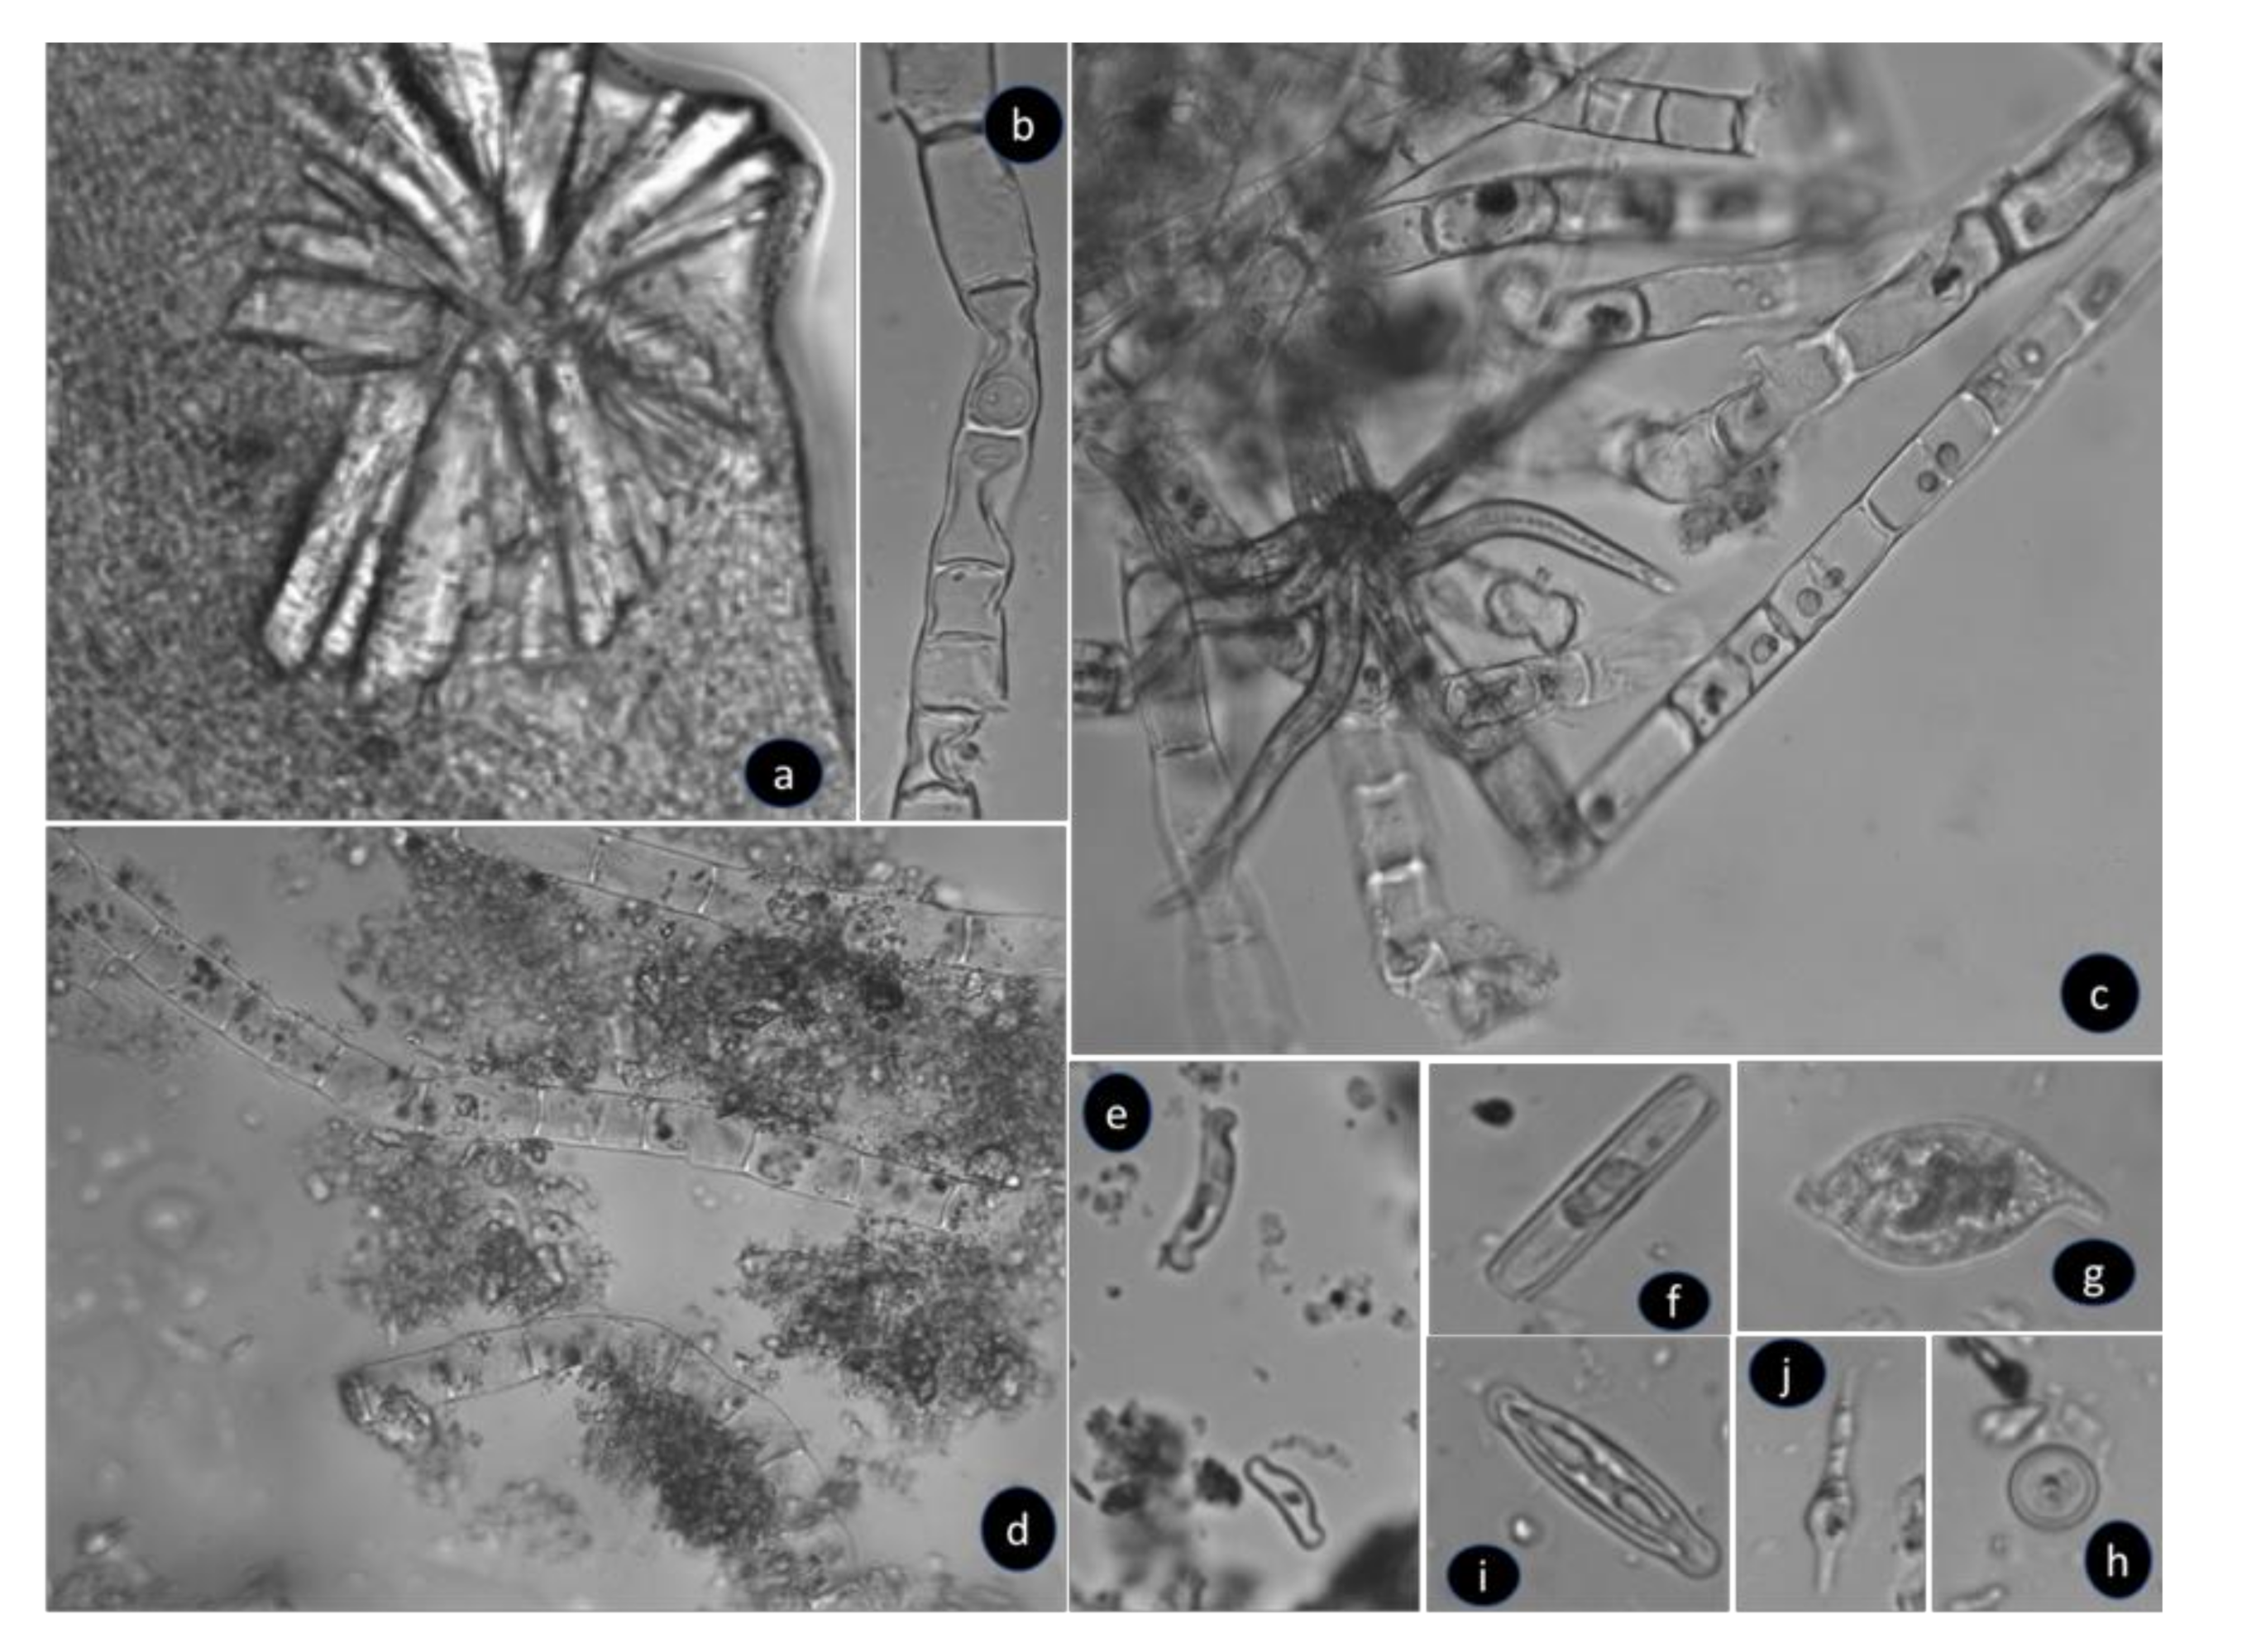
Figure 5 shows photomicrographs of several genera of multi and unicellular algae found at different sampling sites. Figure 5a shows large crystals in interface with algal filaments. The same effect was previously reported by Valente et al. [31]. Figure 5d further exposes the interaction of algae and sediments, which supply soluble elements and compounds, fundamental for photosynthesis processes. Moreover, it is possible that elements such as metals may be retained by salt efflorescences [15].
The multicellular algae, mostly belonging to the genus Mougeotia in P3, were quite degraded (Figure 5b). This assumption was made by the absence of cellular organelles within the cells, which provides senescence properties, and gives the brown-purplish colour due to the lack of chlorophyll.
In this previous Figure 5d, it is also visible algae from the Ulothrix genus. Despite presenting organelles, it seems to show already some signs of oxidative stress. The remaining images show different unicellular algae, representing mainly diatom species. Figure 5g exhibits a single cell of Euglena mutabilis. This alga is commonly reported in AMD. However, it was rarely observed in this study.

3.3.3. Mineral-Algae Interactions (SEM Study)

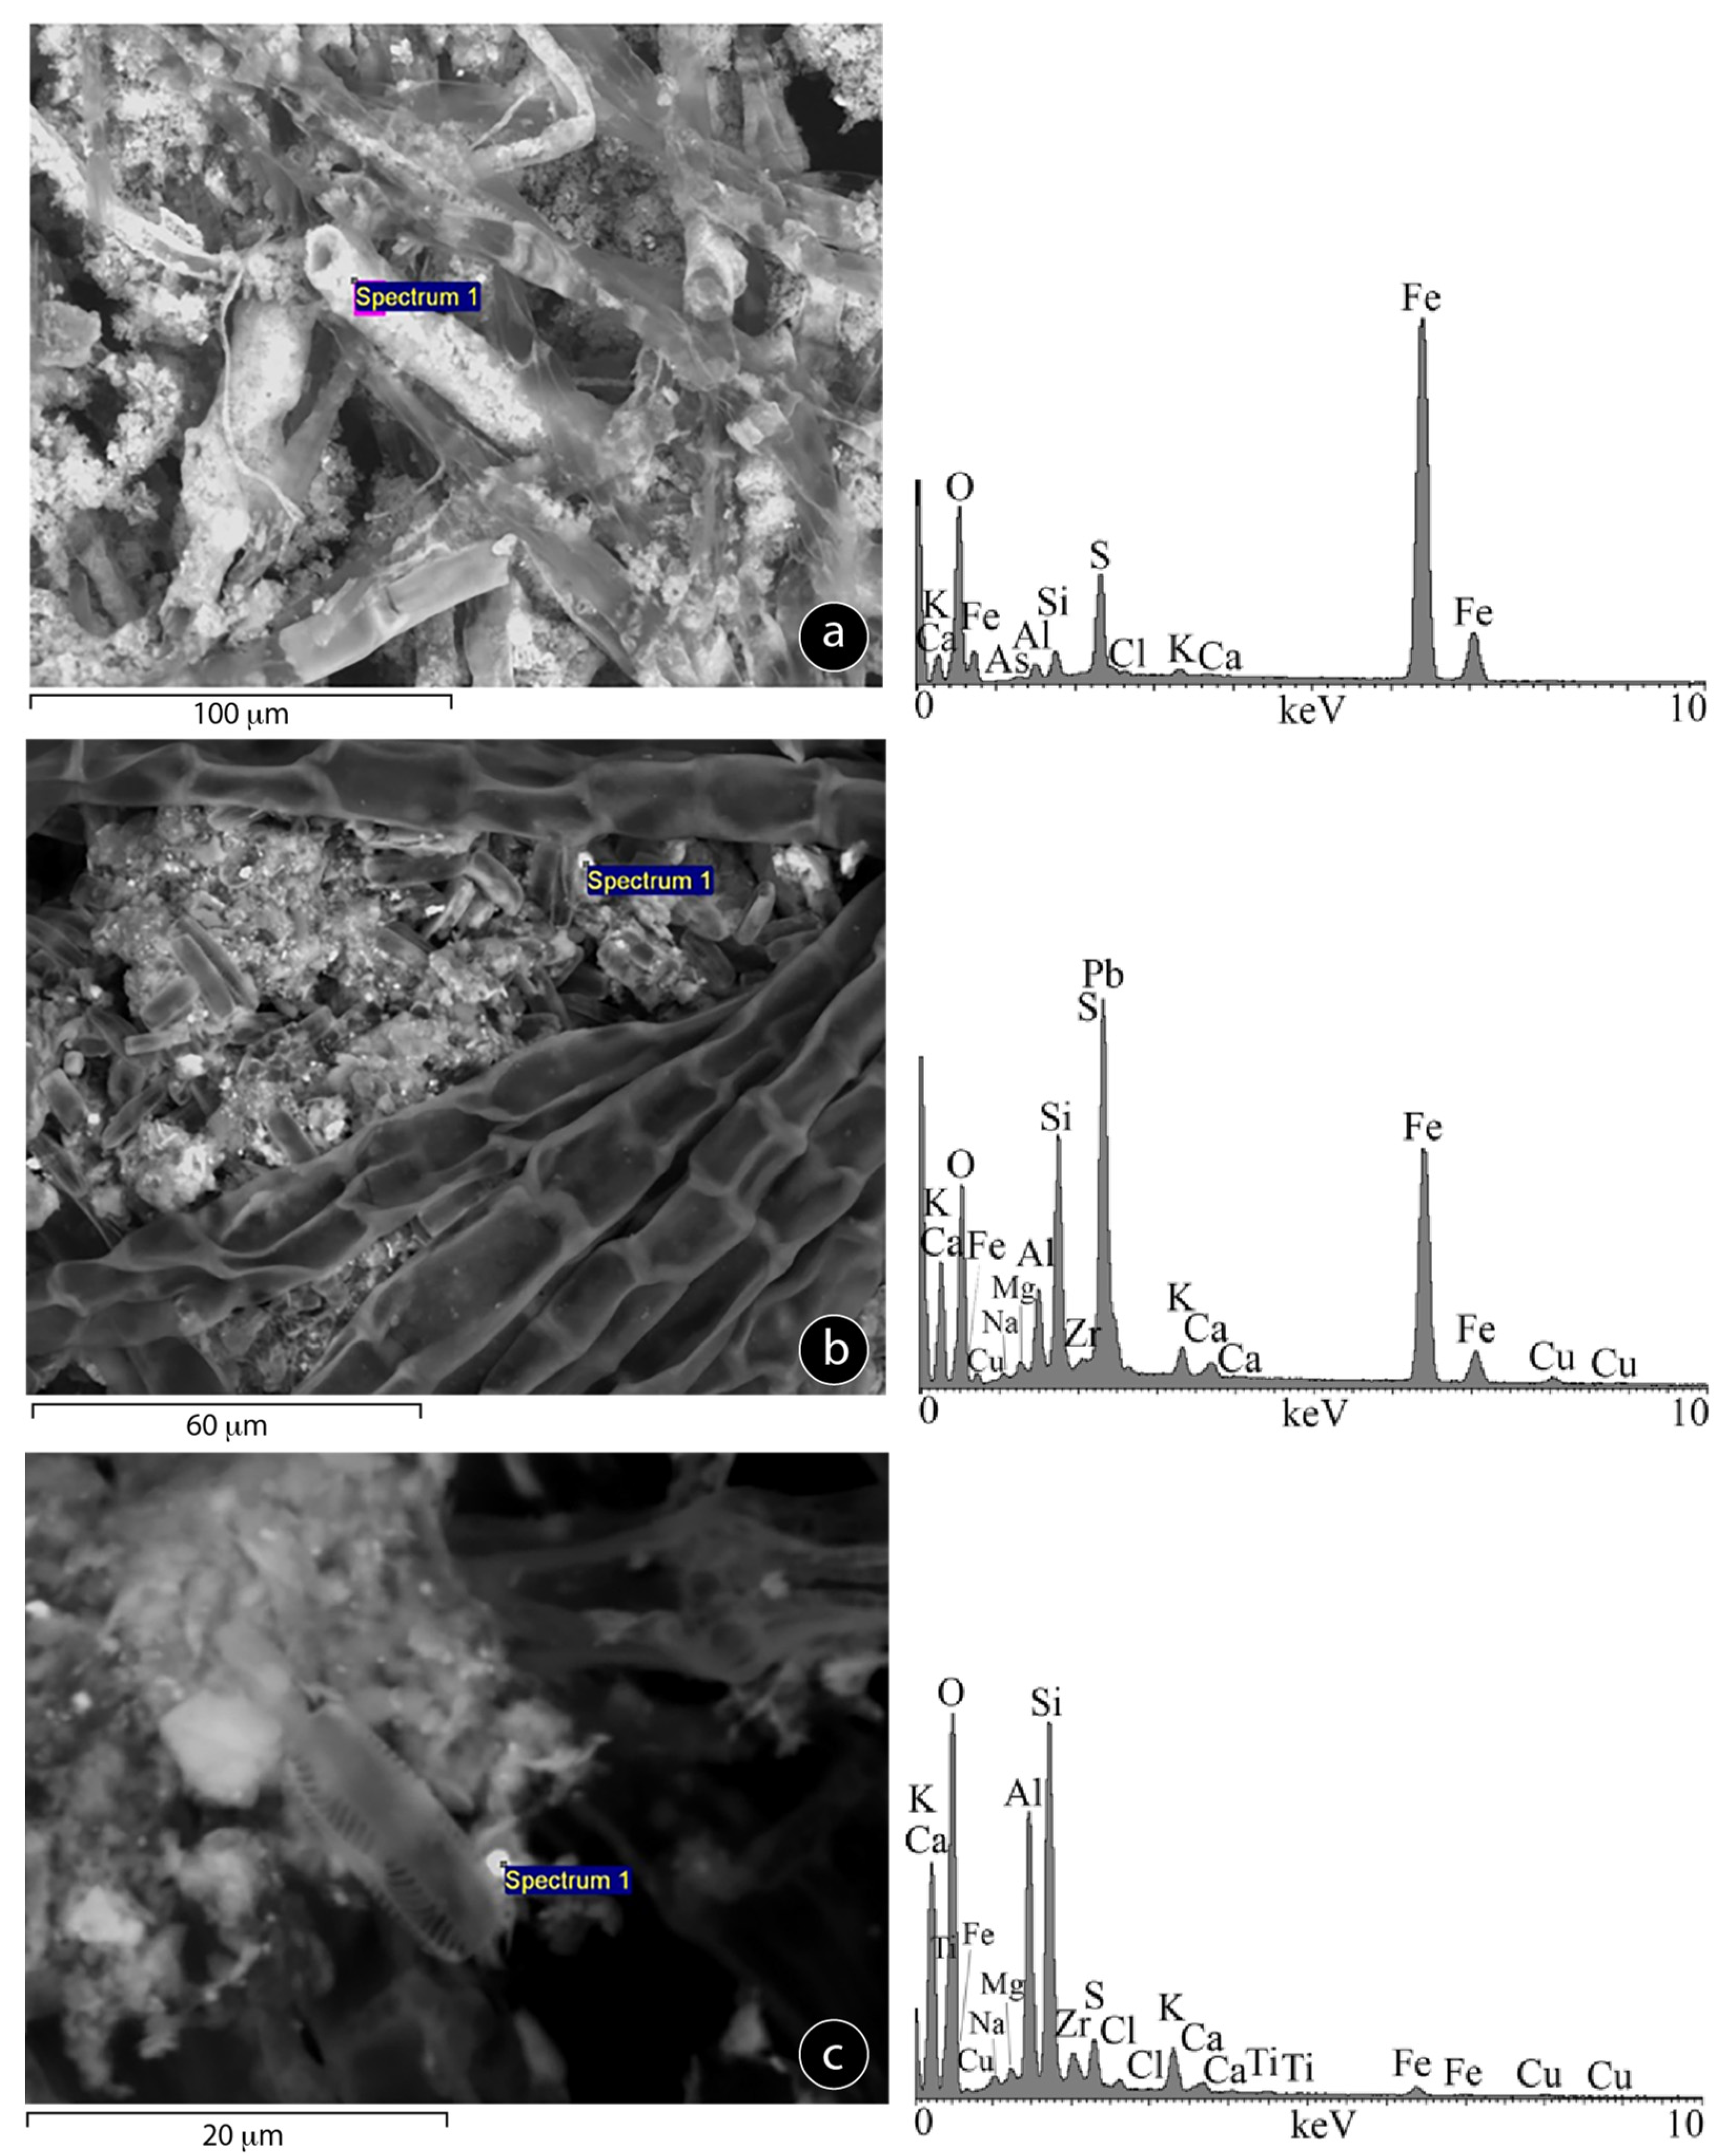
Observations in SEM (Figure 6) show communities of pioneer species forming dense biofilm networks, holding sediment particles able to retain metals in the clay size fraction [32]. The presence of Fe, S, and Al is common (Figure 6a,b), revealing the relationship between acidophilic algae and iron oxyhydroxides and hydroxysulfates. Tubular mineral formations (Figure 6a) were often observed in association with the algae (Figure 6a). These hollow iron-rich tubes, also reported by Valente et al. [33], could be indicative of aquatic insects or biogenic iron-precipitates [34,35], confirming the contribution of acidophilic organisms in biomineralisation processes.
In accordance, several studies reported the absorption of metals by algae, and in some cases, this occurs external to the cells using precipitation as a protective mechanism [8]. Also, this suggests that these species can even use the referred inorganic components as propellants of photosynthesis production. According to Prygiel and Coste [36], some elements such as silica have importance related to the increase of diatom biomass, as it supports the formation of the silica carapace that surrounds the whole cell, called frustule (Figure 6c).
The autotrophic organisms promote the increase of organic matter, which further leads to colonization by other species. So, the established cycle formed in the dependence of these communities can influence the characteristics of the water ecosystem. In this way, they can represent the first stage of biological stabilization and reverse the processes through natural attenuation of the AMD effects [37,38]. Therefore, this acidophilic colonization could contribute to remediation processes through the stabilization/absorption/adsorption of some PTE.

3.3.4. Spatial Distribution of Algae Taxa

Table 2 presents an inventory with a relative abundance of the observed taxa. The communities of algae were represented by 14 taxa at the genus level, and were divided into eight classes: Chlorophyceae (Mougeotia, Spirogyra, and Chlamydomonas); Ulvophyceae (Klebsormidium); Euglenophyceae (Euglena); Bacillariophyceae (Pinnularia, Eunotia, Navicula and Cyclotella); Chlorophyceae (Characium); Chrysophyceae (Dinobryon); Ulothricophyceae (Oedogonium and Ulothrix) and Trebouxiophyceae (Chlorella). These results are in agreement with those found by [12] in São Domingos, that were based on the genera Eunotia, Pinnularia, Euglena, Chlamydomonas, and Ulothrix.
The sites with the greatest diversity of acidophilic species are P3 and P11. Therefore, the more acidic/contaminated the site, the less biological diversity it presents. A decrease in biodiversity with the increase of acidity was also observed by other authors [12]. It should also be noted that these points represent lentic environments, and as mentioned above, they have great importance in algae retention, while P6 and P9 are characterised by being lotic environments.
The diatoms are the group with major representation, being detected in all points, highlighting the best adaptation to the range of pH values, and to the variety of concentration of metals and sulfate. Diatoms are than followed by multicellular algae Mougeotia and Spirogyra.
Bacteria (without identification) were seen in large number in P3, P9, and P11. They were spherical and stick-shaped with high mobility. These organisms are known to stimulate contamination [12].
The presence of typically indicative Euglena mutabilis was only rarely detected in P3 and P10. According to Valente [8], they are usually found floating in the water, or colonizing ochre products in streambeds and acidic pools. Amils et al. [1] suggest that Euglena may not survive in extremely acidic environments, such as São Domingos mine. These results are in accordance with the present observations, as Euglena was only detected at least contaminated sites. Nonetheless, [39] reveals that Euglena mutabilis is common in small acidic water bodies and is frequently abundant in waters contaminated by heavy metals, with low pH. They can also be found in unpolluted to moderately polluted water, being acidobiont.
The scarcity of Euglena mutabilis in São Domingos may also be related to the nature of the mineralogical substrate. Indeed, [6] suggests that this alga is preferentially associated with the hydroxysulfate schwertmannite, which in turn is rarely identified in this ecosystem.
Despite the extreme hydrochemical conditions observed in São Domingos, when compared with other geomicrobiological works carried out in AMD regions [37], the obtained results indicate a considerable variability in terms of algae taxa.

3.3.5. Relationships between Hydrochemistry, Sample Location and Algae

Factorial correspondence analysis (FCT) was used as multivariate statistical tool to find potential relationships between abiotic and biotic features of the ecosystem. The mean concentration in each sampled point of the analysed hydrochemical attributes (columns) together with the eight samples (rows) was used as active individuals (Table 1) and so, the ones used for the new factorial components’ construction. The biological variables (Algae) were recodified, from zero to three, regarding the correspondent abundance (Table 2) in each sampled point. Figure 7 shows the results of the application of FCT.
The screen plot and the table in Figure 7 indicate that the first two axes are controlled by 88% of the total variance. The projection of the attributes and samples in the factorial plan highlights an association in three main groups. The first one is explained by the second Factor (F2) while the second and third groups are explained by the first Factor (F1), respectively negative and positive coordinates.
Group 1 comprises the sample P4, which distances itself from all others and shows affinity with the concentrations in Zn and Mn. Group 2 includes the samples P5, P6, P8, and P9, which show affinities with Fe, As, Cd, Cu, Co, and Al. Group 3 contains the sample P3, displaying affinity with Cr, Pb, K, and Ca. The supplementary projection of the algae indicates a clear overlap with group 3, mainly concerning to the diatoms Pinnularia, Navicula, and Eunotia, as well as with the filamentous algae Spirogyra and Mougeotia. These two algae, and especially Spirogyra, when projected, are very close to Pb that is more significant in P3. No relationships are observable between the other algae and the associated chemical composition or with any of the other samples.
These associations reflect the spatial distribution of the samples and the algae communities. For example, P4 (Figure 1 and Figure 3) is the only point located on the east bank of the stream, away from the remaining sampling sites. Due to its location, this lagoon receives drainage from waste-dumps very enriched in jasper, with a particular geochemical signature, marked here by the elements Zn and Mn. Group 2 proposes evidence of the effect of drainage from the largest accumulations of very fine sulfide-rich wastes, located near points P5 to P9, as shown by the patterns of surface flow observed in Figure 3. Thus, the affinity with the elements from the oxidative dissolution of sulfides (e.g., Fe, As, Cu) is justified. The extremely acidic conditions in this section of the mining complex facilitate the dissolution of the host rocks, explaining the joining of Al. The projection of Ni indicates its similar influence over groups 1 and 2. The same is observable for Mg (abundant from dissolution of ubiquitous host rocks), which affects groups 1 and 3, as well as the samples P10 and P11.
P10 and P11 are the furthest samples from the primary sources of sulfides. The projection of these samples in the factorial plan highlights the effect of this downstream location (Figure 1) and then stressing the geochemical dynamics of the system concerning the fate the elements. Therefore, regarding the chemical composition, these samples are distant (Figure 7) relatively to the elements of group 2, mobilized from sulfides, upstream. These elements are retained along the river stream, so that in P10 and P11 only some proximity to elements such as K, Ca and Mg is verified. P3 is also a particular site, since it is a water reservoir that receives drainage from several emergences and waste-dumps with a complex-mixed composition (including, phylites, slag, gossan, and sulfide mineralized blocks). This seems to result in a particular geochemical signature in the AMD that highlights a close relationship between Pb and the algae Spirogyra. This result points to the possibility of using Spirogyra as a bioindicator for the presence of Pb.

4. Conclusions

Aquatic habitats in the São Domingos mining area show ecological evidence of AMD contamination, namely blooms of acidophilic algae. Field observations show a variety of colours, which are related not only to the abiotic properties of the system, but also to the state of the algae communities. Algae senescence was detected by the brown-purplish colour, indicative of photosynthetic pigments loss, as well as of all the cellular organelles. The study revealed 14 taxa at the genus level, divided into eight classes. The diatoms represent the most common group of unicellular algae, whereas the genus Mougeotia prevails in multicellular algae.
SEM observations show mineral-algae interactions, namely through the presence of tubular iron-rich precipitates that could result from biogenic contribution. The present study also points out the scarcity of schwertmannite as being responsible for the rarity of Euglena mutabilis, which is very common in other AMD systems.
Thus, the ecological manifestations are in accordance with the hydrochemical, mineralogical, and hydrologic features of the system. The sites P5 and P8 receive the drainage from proximal highly reactive fine wastes and, consequently, they present the highest concentration of sulfate and PTE. The highest algae variability was observed at intermediate points concerning chemical contamination, coinciding also with lentic environments (P3 and P11). Nevertheless, the more acid/contaminated the site, the lesser is the algal diversity. Therefore, drainage flowing from the finest accumulation of sulfide wastes appears to control the development, maintenance, and proliferation of acidophilic algae.
The results obtained through factorial correspondence analysis showed an association between the location of the samples, their chemistry and the distribution and diversity of algal communities. Moreover, they suggest a close relationship between Spirogyra and Pb. These results should help to establish long-term monitoring protocols, applicable during and after environmental rehabilitation of the mining complex and respective river system.

Author Contributions

Conceptualization, P.G. and T.V.; data curation, P.G., T.V., R.H., N.F.-A., J.P., and F.M.; formal analysis, T.A., R.H., N.F.-A., and F.M.; funding acquisition, T.V.; investigation, P.G., T.V., T.A., R.H., N.F.-A., J.P., and F.M.; methodology, P.G., T.V., T.A., and R.H.; supervision, T.V.; visualization, J.P.; writing—original draft, P.G., T.V., T.A., R.H., N.F.-A., J.P., and F.M. All authors have read and agreed to the published version of the manuscript.

Funding

This work was funded by FCT (Fundação para a Ciência e Tecnologia) by the research fellowship under the POCH (Programa Operacional Capital Humano) supported by the European Social Fund and National Funds of MCTES (Ministério da Ciência, Tecnologia e Ensino Superior) with reference SFRH/BD/108887/2015. This work was co-funded by FCT through projects UIDB/04683/2020, UIDP/04683/2020 and Nano-MINENV 029259 (PTDC/CTA-AMB/29259/2017).

Institutional Review Board Statement

Not applicable.

Informed Consent Statement

Not applicable.

Data Availability Statement

Not applicable.

Acknowledgments

Patrícia Gomes acknowledges FCT (Science and Technology Foundation, Portugal) by the research fellowship under the POCH (Programa Operacional Capital Humano) supported by the European Social Fund and National Funds of MCTES (Ministério da Ciência, Tecnologia e Ensino Superior) with reference SFRH/BD/108887/2015. This work was co-funded by FCT through projects UIDB/04683/2020, UIDP/04683/2020 and Nano-MINENV 029259 (PTDC/CTA-AMB/29259/2017). The authors are grateful to the three anonymous reviewers and to the academic editor for their valuable contributions to improving the manuscript.

Conflicts of Interest

The authors declare no conflict of interest.

References

  1. Gomes, P.; Valente, T. Physical and chemical conditions for colonization by Euglena mutabilis: Case studies in two acid mine drainage sites. In Proceedings of the IMWA: Mine Water: Technological and Ecological Challenges, Perm, Russia, 15–19 July 2019; Wolkersdorfer, C., Khayrulina, E., Polyakova, S., Bogush, A., Eds.; International Mine Water Association: Wendelstein, Germany, 2019; pp. 419–424. [Google Scholar]
  2. Gross, W. Ecophysiology of algae living in highly acidic environments. Hydrobiology 2000, 433, 31–37. [Google Scholar] [CrossRef]
  3. Gomes, P.; Valente, T.; Geraldo, D.; Ribeiro, C. Photosynthetic pigments in acid mine drainage: Seasonal patterns and associations with stressful abiotic characteristics. Chemosphere 2020, 239, 124774. [Google Scholar] [CrossRef]
  4. Valente, T.; Rivera, M.J.; Almeida, S.F.P.; Delgado, C.; Gomes, P.; Grande, A.; de la Torre, M.L.; Santisteban, M. Characterization of water reservoirs affected by acid mine drainage: Geochemical, mineralogical, and biological (diatoms) properties of the water. Environ. Sci. Pollut. Res. 2015, 23, 6002–6011. [Google Scholar] [CrossRef]
  5. Lessmann, D.; Fyson, A.; Nixdorf, B. Phytoplankton of the extremely acidic mining lakes of Lusatia (Germany) with pH ≤ 3. Hydrobiology 2000, 433, 123–128. [Google Scholar] [CrossRef]
  6. Valente, T.; Gomes, C.L. The role of two acidophilic algae as ecological indicators of acid mine drainage sites. J. Iber Geol. 2007, 33, 283–294. [Google Scholar]
  7. Luís, A.T.; Durães, N.; de Almeida, S.F.P.; da Silva, E.F. Integrating geochemical (surface waters, stream sediments) and biological (diatoms) approaches to assess AMD environmental impact in a pyritic mining area: Aljustrel (Alentejo, Portugal). J. Environ. Sci. 2016, 42, 215–226. [Google Scholar] [CrossRef]
  8. Valente, T. Modelos de Caracterização de Impacte Ambiental para Escombreiras Reactivas-Equilíbrio e Evolução de Resíduos de Actividade Extractiva. Ph.D. Thesis, University of Minho, Braga, Portugal, 2004; 301p. [Google Scholar]
  9. Levings, C.D.; Varela, D.E.; Mehlenbacher, N.M.; Barry, K.L.; Piercey, G.E.; Guo, M.; Harrison, P.J. Effect of an acid mine drainage effluent on phytoplankton biomass and primary production at Britannia Beach, Howe Sound, British Columbia. Mar. Pollut. Bull. 2005, 50, 1585–1594. [Google Scholar] [CrossRef]
  10. Sabater, S.; Buchaca, T.; Cambra, J.; Catalan, J.; Guasch, H.; Ivorra, N.; Munõz, I.; Navarro, E.; Real, M.; Romaní, A. Structure and function of benthic algal communities in an extremely acid river. J. Phycol. 2003, 39, 481–489. [Google Scholar] [CrossRef] [Green Version]
  11. Amils, R.; Gonzalez-Toril, E.; Aguilera, A.; Rodríguez, N.; Fernandez-Remolar, D.; Gomez, F.; García-Moyano, A.; Malki, M.; Oggerin, M.; Sanchez-Andrea, I.; et al. From Río Tinto to mars. The terrestrial and extraterrestrial ecology of acidophiles. Adv. Appl Microbiol. 2011, 77, 41–70. [Google Scholar] [CrossRef]
  12. Wolowski, K.; Turnau, K.; Henriques, F.S. The algal fora of an extremely acidic, metal-rich drainage pond of São Domingos pyrite mine (Portugal). Cryptogam. Algol. 2008, 29, 313–324. [Google Scholar]
  13. Tavares, M.T.; Abreu, M.M.; Vairinho, M.M.; Sousa, A.J.; Quental, L. Comportamento geoquímico de alguns elementos vestigiais na envolvente das Minas de S.; Domingos, Alentejo: Áreas da Tapada e do Telheiro. Rev. Ciências Agrárias 2009, 32, 182–194. [Google Scholar]
  14. Quental, L.; Sousa, A.J.; Marsh, S.; Abreu, M.M. Identification of materials related to acid mine drainage using multi-source spectra at S. Domingos Mine, southeast Portugal. Int J. Remote Sens. 2013, 34, 1928–1948. [Google Scholar] [CrossRef] [Green Version]
  15. Gomes, P.; Valente, T.; Grande, J.A.; Cordeiro, M. Occurrence of sulphate efflorescences in São Domingos mine. Comun. Geol. 2017, 104, 83–89. [Google Scholar]
  16. Abreu, M.; Tavares, M.T.; Batista, M.J. Potential Use of Erica andevalensis and Erica australis in Phytoremediation of Sulphide Mine Environments: São Domingos, Portugal. J. Geochem. Explor. 2008, 96, 210–222. [Google Scholar] [CrossRef] [Green Version]
  17. Gonçalves, J.A.; Henriques, R. UAV photogrammetry for topographic monitoring of coastal areas. ISPRS J. Photogramm. Remote Sens. 2015, 104, 101–111. [Google Scholar] [CrossRef]
  18. Arge, L.; Chase, J.S.; Halpin, P.N.; Toma, L.; Vitter, J.S.; Urban, D.; Wickremesinghe, R. Flow computation on massive grids. Proc. ACM Work Adv. Geogr. Inf. Syst. 2001, 82–87. [Google Scholar] [CrossRef]
  19. Arge, L.; Chase, J.S.; Halpin, P.N.; Toma, L.; Vitter, J.S.; Urban, D.; Wickremesinghe, R. Flow computation on massive grid terrains. GeoInformatica Int. J. Adv. Comput. Sci. Geogr. Inf. Syst. 2003, 7, 283–313. [Google Scholar]
  20. AWWA. Standard Methods for the Examination of Water and Wastewater, 18th ed.; American Public Health Association: Washington, DC, USA, 1992. [Google Scholar]
  21. ASTM Committee on Standards. Standard Practice for Cleaning Laboratory Glassware, Plasticware and Equipment Used in Microbiological Analysis; American Society for Testing and Materials: West Conshohocken, PN, USA, 1992; Volume 5. [Google Scholar]
  22. Benzécri, J.P. L’Analyse des Correspondences. Cah. Anal. Données 1977, 2, 125–142. [Google Scholar]
  23. Pereira, H.G.; Brito, M.G.; Albuquerque, T.; Ribeiro, J. Geostatistical Estimation of a Summary Recovery Index for Marble Quarries, Geostatistics Troia’92; Kluwer Academic Publishers: Dordrecht, The Netherlands, 1993; Volume 2. [Google Scholar]
  24. Sousa, P.; Sousa, J. ANDAD, Version 7.12 Copyright; CVRM/IST: Lisboa, Portugal, 2000. [Google Scholar]
  25. Robbins, E.I.; Rodgers, T.M.; Alpers, C.N.; Nordstrom, D.K. Ecogeochemistry of the subsurface food web at pH 0–2.5 in Iron Mountain, California, U.S.A. Hydrobiology 2000, 433, 15–23. [Google Scholar] [CrossRef]
  26. Robbins, E.I.; Anderson, J.E.; Podwysocki, M.H.; Nord, G.L. Seasonal variations in spectral reflectance of microbial flocculates, precipitates, and oil-like films associated with neutral and acidic mine drainage. In Environmental Monitoring and Biodiagnostics of Hazardous Contaminants; Healy, M., Wise, D.L., Moo-Young, M., Eds.; Springer: Dordrecht, The Netherlands, 2001. [Google Scholar] [CrossRef]
  27. Anderson, J.E.; Robbin, E.I. Spectral reflectance and detection of iron-oxide precipitates associated with acidic mine drainage. Photogramm. Eng. Remote Sens. 1998, 64, 1201–1208. [Google Scholar]
  28. Soyol-Erdene, T.O.; Valente, T.; Grande, J.A.; de la Torre, M.L. Mineralogical controls on mobility of rare earth elements in acid mine drainage environments. Chemosphere 2018, 205, 317–327. [Google Scholar] [CrossRef] [PubMed]
  29. Cordeiro, M. Caracterização ambiental do complexo mineiro de São Domingos–Cartografia de Infra-Estruturas e Impacte Sobre o Meio Hídrico. Master’s Thesis, University of Minho, Braga, Portugal, 2017; 84p. [Google Scholar]
  30. Smucker, N.J.; Vis, M.L. Acid mine drainage affects the development and function of epilithic biofilms in streams. J. N. Am. Benthol. Soc. 2011, 30, 728–738. [Google Scholar] [CrossRef]
  31. Valente, T.; Gomes, P.; Pamplona, J.; de la Torre, M.L. Natural stabilization of mine waste-dumps—Evolution of the vegetation cover in distinctive geochemical and mineralogical environments. J. Geochem. Explor. 2012, 123, 152–161. [Google Scholar] [CrossRef]
  32. Gomes, P.; Valente, T.; Sequeira Braga, M.A.; Grande, J.A.; de la Torre, M.L. Enrichment of trace elements in the clay size fraction of mining soils. Environ. Sci. Pollut. Res. 2016, 23, 6039–6045. [Google Scholar] [CrossRef] [PubMed] [Green Version]
  33. Valente, T.; Antunes, I.M.; Sequeira Braga, M.A.; Neiva, A.; Santos, A.; Moreno, F. Mobility control of uranium and other potentially toxic elements in mine waters by ochre-precipitates. In Proceedings of the IMWA: Mine Water: Technological and Ecological Challenges, Perm, Russia, 15–19 July 2019; Wolkersdorfer, C., Khayrulina, E., Polyakova, S., Bogush, A., Eds.; International Mine Water Association: Wendelstein, Germany, 2019; pp. 458–462. [Google Scholar]
  34. Peng, X.; Chen, S.; Xu, H. Formation of biogenic sheath-like Fe oxyhydroxides in a near-neutral pH hot spring: Implications for the origin of microfossils in high-temperature, Fe-rich environments. J. Geophys. Res. Biogeosci. 2013, 118, 1397–1413. [Google Scholar] [CrossRef]
  35. Ishihara, H.; Hashimoto, H.; Taketa, E.; Suzuki, T.; Mandai, K.; Kunoh, H.; Takada, J. Silicon-Rich, Iron Oxide Microtubular Sheath Produced by an Iron-Oxidizing Bacterium, Leptothrix sp. Strain OUMS1, in Culture. Minerals 2014, 4, 565–577. [Google Scholar] [CrossRef] [Green Version]
  36. Prygiel, J.; Coste, M. Guide Méthodologique pour la Mise en Oeuvre de l’Indice Biologique Diatomées NF T 90–354; Agence de l’eau Artois Picardie: Douai, France, 2000; p. 340. [Google Scholar]
  37. Freitas, A.P.P.; Schneider, I.A.H.; Schwartzbold, A. Biosorption of heavy metals by algal communities in water streams affected by the acid mine drainage in the coal-mining region of Santa Catarina state, Brazil. Miner. Eng. 2011, 24, 1215–1218. [Google Scholar] [CrossRef]
  38. Kumar, R.N.; McCullough, C.D.; Lund, M.A.; Larranaga, S.A. Assessment of factors limiting algal growth in acidic pit lakes-a case study from Western Australia, Australia. Environ. Sci. Pollut. Res. 2015, 23, 5915–5924. [Google Scholar] [CrossRef]
  39. Wolowski, K. Phylum Euglenophyta. In Freshwater Algal Flora of the British Isles; John, D.M., Whitton, B.A., Brook, A.J., Eds.; Cambridge University Press: Cambridge, UK, 2002; pp. 144–179. [Google Scholar]
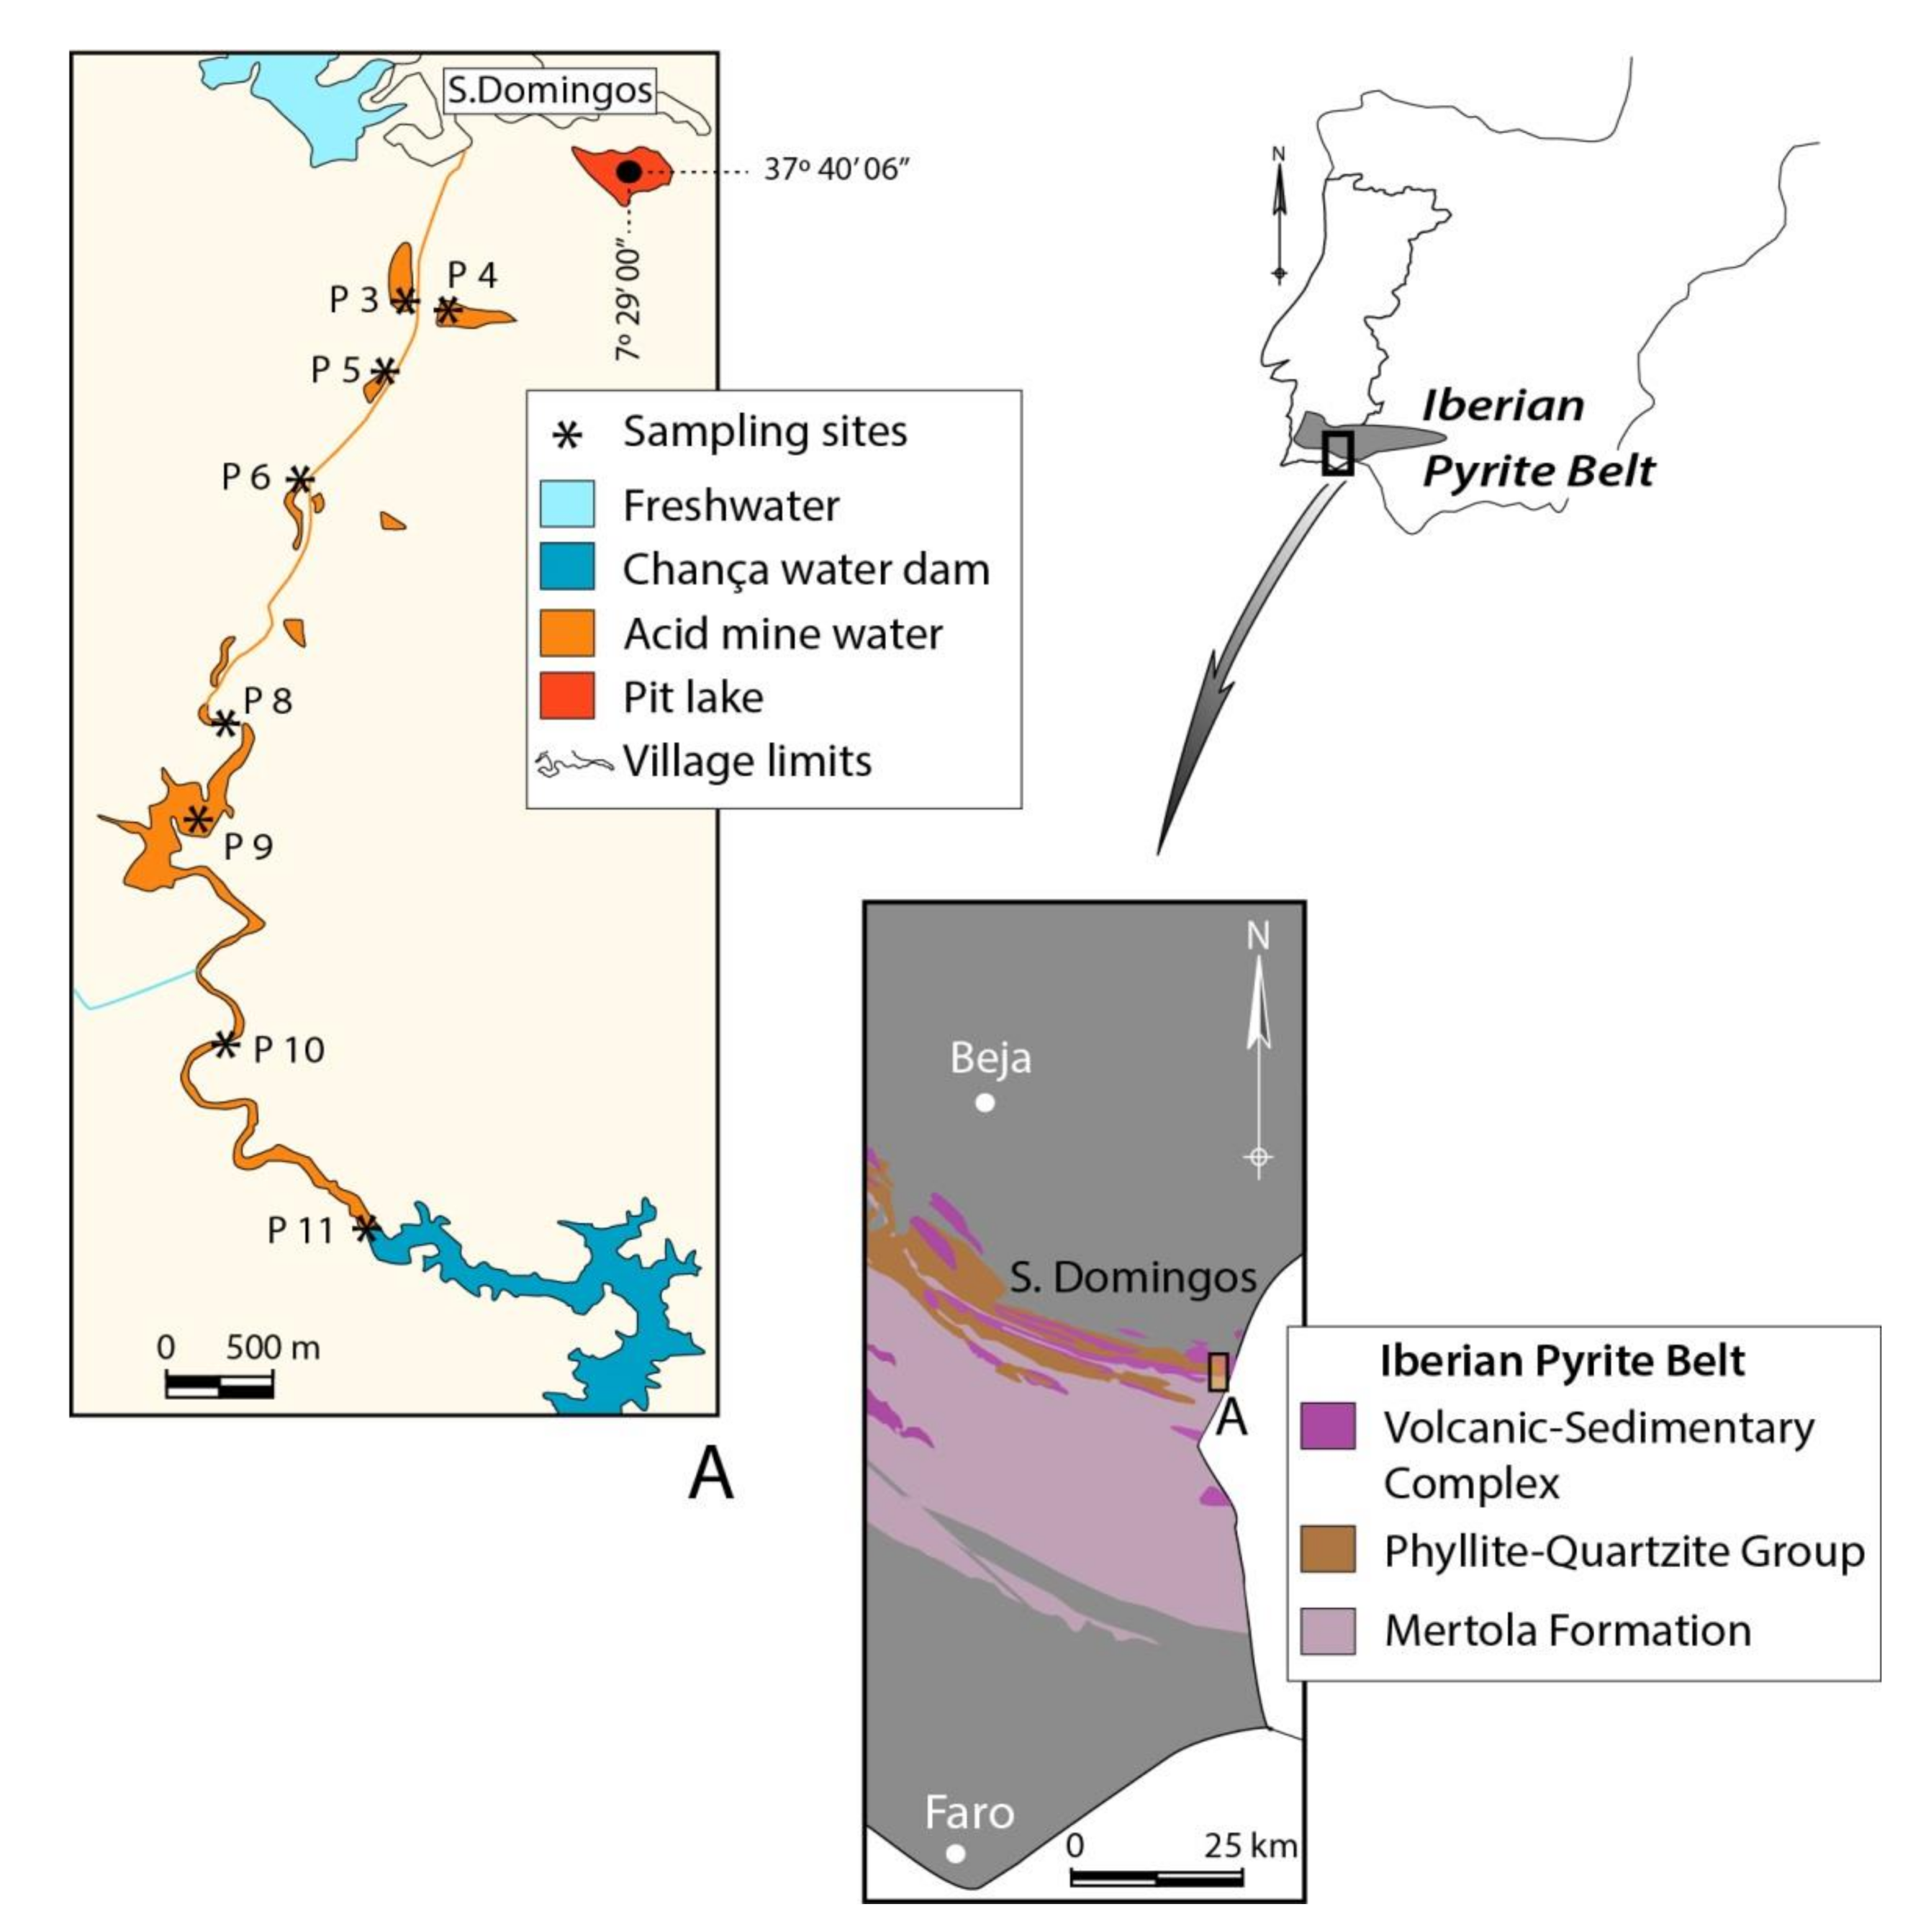
Figure 1. Map of the study area with representation of the geological context and the river system, with location of the sampling points. Adapted from [3].
Minerals 11 00110 g001
Figure 2. Aerial view of the São Domingos mining area. The yellow line represents the boundaries of the section surveyed by the UAV (Imagery from Google Earth). Location approximately at coordinates 37.65965 lat., −7.50506 long. (WGS 84).
Minerals 11 00110 g002
Figure 3. Digital Surface Model of the surveyed area obtained by UAV (upper); Section of the flow accumulation map (lower image) in the area with the finest sulfide wastes. In the lower part of the figure, the blue lines are flow lines of surface runoff and the blue continuous zones are areas of flow accumulation. Coordinates in WGS 84.
Minerals 11 00110 g003
Figure 4. (a) Macroscopic observations of intense red-orange colour, reddish-yellow iron-precipitates and the presence of typical green algae observed in waters channels; (b) detail of small green algae in the sediment; (c) presence of layer brown-purplish intercalated with green algae filaments; (d) purplish brown colour of senescent algae with oxygen bubbles; (e) algae filaments with brown shades in low water course (P5); (f) bloom of algae patches, coexisting with efflorescent salts, and covering the surface bed at P3; (g) green algae located on rocky substrate in a small seep.
Minerals 11 00110 g004
Figure 5. Photomicrographs including potentially identified algae at Sao Domingos mine. (a) unidentified radiating crystals formed around biological material, showing mineral-algae interaction; (b) Mougeotia sp. image without membrane organelles; (c) radial structure (possible plant hair) overlapping on algae filaments; (d) Ulothrix sp. with loss of membrane organelles and surrounded by sediment; (e) Eunotia exigua; (f) Pinnularia sp.; (g) Euglena mutabilis; (h) Cyclotella sp.; (i) Pinnularia sp.; (j) Euglena mutabilis (?). All images are from P3 sampling point, with the exception of image (b) from P11. Magnification 40×, except (b,g,i) which are 100×.
Minerals 11 00110 g005
Figure 6. SEM (ES) micrographs and EDS analysis showing the relation between acidophilic algae and iron oxyhydroxides and hydroxysulfates. (a) Interconnection between algal filaments and iron cylindrical tubes; (b) multicellular and unicellular algae in the sediment; (c) Intergrowth morphology of Pinnularia sp. in sediment bearing Si and Al.
Minerals 11 00110 g006
Figure 7. Factorial correspondence analysis output between abiotic and biotic features of the ecosystem. Moug—Mougeotia; Ulot—Ulothrix; Spir—Spirogyra; Kleb—Klebsormidium; Eugl—Euglena; Pinn—Pinnularia; Euno—Eunotia; Navi—Navicula; Oedo—Oedogonium; Chla—Chlamydomonas; Char—Characium; Dino—Dinobryon; Chlol—Chlorella; Cycl—Cyclotella; Bact—Bacteria.
Minerals 11 00110 g007
Table 1. Statistical summary of parameters analysed monthly across the hydrological year. Min = Minimum; Max = Maximum; EC = electrical conductivity (μS/cm); all concentrations are in mg/L.
Samples pHEC T °CSO4−2 AlAsCaCrCuFeKMgMnNiCoZnCdPb
P3Mean2.72877.223.31608.3148.8580.07593.4090.07112.72171.2603.68471.8197.5640.1970.6697.1090.0280.030
Min2.3228.016.2661.567.8720.02644.8170.0305.75019.6771.28132.7843.0390.1000.3193.2650.0140.005
Max3.54378.029.62760.5251.0000.160163.0000.10022.200170.0008.380169.00014.7000.4831.30010.8550.0410.051
P4Mean2.72654.823.31728.2135.5850.08159.2660.0631.66095.8304.071117.75822.6140.3401.02563.7780.0850.017
Min2.3310.014.5552.342.3060.01519.7840.0200.58929.0842.33339.0606.9960.0560.34220.5500.0500.011
Max34230.031.32600.4199.0730.240105.0000.1003.210160.0076.190189.00034.2650.7381.55596.0760.1180.030
P5Mean2.54034.723.23155.3288.8851.506101.6350.12132.429253.1371.393105.46015.5840.3091.27762.0800.3730.102
Min2.1251.013.7865.74.8300.06114.8420.0400.3813.0200.6008.4400.5940.0500.3340.9770.0330.020
Max2.86943.030.06564.9675.0006.260205.0000.28583.900801.0002.262252.00037.2001.0403.020199.0001.3000.286
P6Mean31734.823.21001.983.4930.84950.8650.0629.42770.6644.86947.3385.0650.1290.38919.8370.0990.289
Min2.6117.315.668.21.7570.0039.6390.0010.3780.9951.9668.3740.1650.0330.0770.5950.0020.031
Max44320.031.92955.1354.4469.49886.9000.11948.057459.5778.400108.10411.3460.3601.479155.8830.8190.626
P8Mean2.83392.722.22498.0211.1610.119117.3070.10316.886220.4074.78581.23210.7370.2070.89531.6970.0800.307
Min2.2181.914.758.50.0750.06010.4800.0500.1661.2010.4218.5540.1620.1000.1000.6870.0040.011
Max4.77320.035.15731.9497.0000.299256.0000.17138.000499.00029.142170.38924.1520.4991.91382.0000.1941.181
P9Mean2.91728.722.4836.467.1960.10847.5040.0627.09066.3515.82533.8743.6990.0990.33610.8480.0440.407
Min2.4204.016.8110.44.8090.02113.7240.0200.5904.6762.4839.7810.6660.0480.0691.5440.0110.152
Max3.53186.030.21641.5131.3660.27986.4560.10013.343166.92029.14363.8817.3550.1370.65223.4910.0800.765
P10Mean2.93199.520.32055.2103.2020.113195.0220.0606.80367.2404.123181.31612.6840.1760.56315.9950.0720.135
Min2.4185.78.0151.39.7410.03016.0880.0201.1441.7790.10011.3630.6130.0620.0611.9440.0190.005
Max3.78598.026.26753.2310.7740.320658.0000.10015.791303.57411.000651.02642.8000.6381.77045.8520.2040.477
P11Mean4740.820.5300.626.5020.06752.2330.0532.32114.2315.79033.5372.7990.0710.1474.1030.0190.129
Min2.9168.712.658.40.1000.00715.8330.0030.0190.3301.33010.5000.1400.0050.0030.0420.0020.001
Max6.31527.028.4790.098.5700.149130.1370.10011.02378.50129.14573.2189.8030.1090.43412.6160.0540.393
Table 2. Taxonomic classification of the identified material in the effluent collected through the year. +++ very abundant ++ abundant + isolated specimens.
GenusP3P4P5P6P8P9P10P11
Mougeotia sp.+++++++++ +++
Ulothrix sp.++ +
Spirogyra sp.+ +++ +
Klebsormidium sp.+ +
Euglena mutabilis+ +
Pinnularia sp.++++++++++++++++++++++++
Eunotia exigua++++++++++++++++++++++++
Navicula sp.++++++++++++++++++++++++
Oedogonium++
Chlamydomonas sp. +++
Characium sp. +
Dinobryon sp. +++
Chlorella sp.+
Cyclotella sp.+
Bacteria+++ +++ +++
Publisher’s Note: MDPI stays neutral with regard to jurisdictional claims in published maps and institutional affiliations.