Abstract
Mixed-layer illite-smectite (I-S) from a new set of Pennsylvanian-aged Illinois Basin underclays, identified as paleosols, are investigated to assess the impact of (1) regional diagenesis across the basin and (2) the extent to which ancient environments promoted illitization during episodes of soil formation. Interpretations from Reichweite Ordering and Δ° 2θ metrics applied to X-ray diffraction patterns suggest that most I-S in Illinois Basin paleosols are likely the product of burial diagenetic processes and not ancient soil formation processes. Acid leaching from abundant coal units and hydrothermal brines are likely diagenetic mechanisms that may have impacted I-S in Pennsylvanian paleosols. These findings also suggest that shallowly buried basins (<3 km) such as the Illinois Basin may still promote clay mineral alteration through illitization pathways if maximum burial occurred in the deep past and remained within the diagenetic window for extended periods of time. More importantly, since many pedogenic clay minerals may have been geochemically reset during illitization, sources of diagenetic alteration in the Illinois Basin should be better understood if Pennsylvanian paleosol minerals are to be utilized for paleoclimate reconstructions.
1. Introduction
Mixed-layered, interstratified, or interlayed clay minerals possess two or more layer types or mineral components that are vertically stacked along the direction perpendicular to (001) [1,2]. Mixed-layer clay minerals likely represent intermediate products of reactions involving discrete, end-member clay minerals and may be 2:1 or 1:1 and di- or trioctahedral [3,4]. Although there are many clay mineral transformations [5], smectite to illite (e.g., [6,7]), smectite to chlorite (e.g., [8,9]), serpentine/chlorite to chlorite (e.g., [10,11]), and smectite to glauconite (e.g., [12,13]) are attributed to occur during low-temperature (≥50 °C) early diagenesis. The most ubiquitous evidence of these reactions in sedimentary basins is mixed-layered illite-smectite (I-S) [2,3,6,14] and may be used to assess maximum burial and a basin’s thermal evolution.
This was demonstrated in studies of pelitic sediments from the U.S. Gulf of Mexico region, which recognized patterns of diagenesis in offshore wells by observing decreasing abundances of potassium-feldspar and smectite and increasing abundances of I-S and discrete illite with increasing burial depth [6,7,15,16,17,18,19,20]. This pattern was attributed to high temperatures, ≥100 °C [21,22,23], and pressures experienced during deep burial (>3 km) diagenesis, i.e., mesogenesis [24], with available K+ sourced from the dissolution of K-feldspars and/or micas [25], a process defined as illitization. Smectite illitization is characterized by the collapse of the smectite 2:1 expansible interlayer into a 12-fold coordination of basal tetrahedral oxygen anions around a K+ interlayer cation as other, exchangeable, hydrated cations (e.g., Mg2+, Ca2+, Na+) are expelled from the interlayer to form illite (Figure 1) [26].
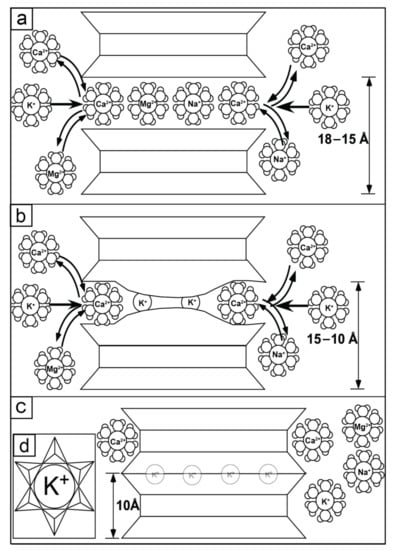
Figure 1.
Model of the stages of smectite illitization. (a) A cross-sectional view of an expandable 2:1 phyllosilicate at the onset of illitization. Hydrous clay minerals, i.e., smectite, readily exchange aqueous cations such as Ca2+, Mg2+, Na+, and K+, all in six-fold coordination with water molecules, in the interlayer space at this stage. Due to dehydration and replacement of Si4+ by Al3+ in the tetrahedral sheet, K+ becomes the preferred interlayer cation to balance the change in layer charge. Note that smectite has a layer spacing of 15–18 Å. (b) Illitization progresses during continued K+ fixation to the surface of tetrahedral sheet in the interlayer space while exchangeable hydrous cations, Ca2+, Mg2+, and Na+ are expelled from the interlayer. This intermediate stage between discrete smectite and discrete illite is called interstratified or mixed-layer illite-smectite (I-S). Note that the interlayer space begins to decrease, leading to a layer spacing for I-S of 10–15 Å. (c) As illitization is completed, there is a full conversion from smectite to the non-hydrous, 2:1 species illite. Illite is characterized by a total collapse of the interlayer space and removal of cations except for K+. Note that illite has a layer spacing of 10 Å. (d) A map view of the illite tetrahedral sheet, equivalent to the final stage of illitization as expressed in part C. K+ is the interlayer cation now in 12-fold coordination with oxygen anions that are part of the silicate tetrads. Note that the apical oxygens of the tetrads are pointing into the page, through the field of view, and the basal surface of the tetrad is represented by the 2-D viewing surface.
Although illitization was initially recognized as occurring during deep-burial diagenesis, hereafter referred to as “diagenesis/diagenetic illitization,” similar sorts of mineralogical transformations also were subsequently found to occur during low-temperature, shallow-burial, or soil formation, i.e., eogenesis, hereafter referred to as “pedogenesis/pedogenic illitization” [3,7,24,27]. During pedogenesis, illitization is due to fluctuating climatic conditions, characterized by distinct wetting and drying cycles [27]. This alteration primarily occurs in seasonal climates where redox conditions fluctuate between Fe(II) and Fe(III) valence states, wherein reduction of Fe(II) dominates during wet phases and oxidation of Fe(III) dominates during dry phases (Figure 1b–d) [28,29,30,31,32,33].
X-ray diffraction (XRD) has been used to evaluate illitization, by studying I-S. These studies have found that the proportion of smectite in I-S superstructures is greater if the XRD peak at the I-S (001/002) position is closer to the discrete smectite peak, around 15 Å (5.2° 2θ Cu-Kα radiation). Furthermore, as illitization progresses, the XRD I-S (001/002) peak migrates toward smaller dimensions (i.e., higher ° 2θ values; [23]). There are two primary XRD pattern analyses that have been proposed as a means of distinguishing between diagenetic and pedogenic I-S: Reichweite ordering and % illite in I-S, derived from Δ° 2θ measurements. Reichweite Ordering analyses of smectite illitization have determined that ordered mixed layered illite-smectite clay minerals are solely a result of deep-burial diagenesis [7,34,35]. Subsequent studies of illite-smectite occurrences suggest that randomly ordered, mixed-layered illite-smectite minerals may result primarily from pedogenic illitization, though occasionally from diagenetic illitization [27]. If a sample contains 0–60% illite in I-S, the clay is likely the product of pedogenic illitization, promoted through wetting and drying in seasonal climates [27] (see Figure 1 for illitization and I-S schematic). If a sample contains >60% illite in I-S, the clay is considered to likely result only from non-pedogenic illitization or diagenetic overprinting of pedogenic illitization during deep burial diagenesis (mesogenesis [24]) or hydrothermal alteration [1,7,27,36]. In sum, both Reichweite Ordering and % illite in I-S XRD-based proxies may provide genetic origin information for I-S identified in argillaceous rocks.
The Illinois Basin (IB) is known for its characteristic Pennsylvanian cyclothemic stratigraphy [37], which notably contains underclays, identified as fossil soils, hereafter referred to as paleosols, that formed at a tropical paleolatitude (0° ± 5°; Figure 2 [38]). Attention has been given to IB paleosols following other Pennsylvanian-aged studies, which suggest a shift toward a drier, seasonal climate from the middle to upper Pennsylvanian, defined as the Desmoinesian–Missourian (Moscovian–Kasimovian; Figure 2) in the tropics. Evidence to support aridification in the IB at this time includes floral [39,40,41] and faunal shifts (e.g., [42]), increased vertic and calcic paleosol features [43,44], and increased paleotemperatures derived from pedogenic mineral proxies [45]. However, [45] (p. 391) note that some IB paleosol phyllosilicate samples show signs of diagenetic overprinting along the western margin and deep interior of the basin, because geochemical compositions of those minerals correspond to crystallization temperatures ranging from 44 − 55 ± 3 °C, which is abnormally high to represent typical soil temperatures (e.g., [46]). However, there are little data to provide sufficient insights into the effects of possible diagenesis on non-coal bearing Pennsylvanian-aged strata, specifically paleosols, across the entire basin. Therefore, before continuing with further geochemical, proxy-based research on Pennsylvanian paleoclimate, a rigorous assessment of the impact of diagenesis on IB paleosols should be addressed on a basin-wide scale.
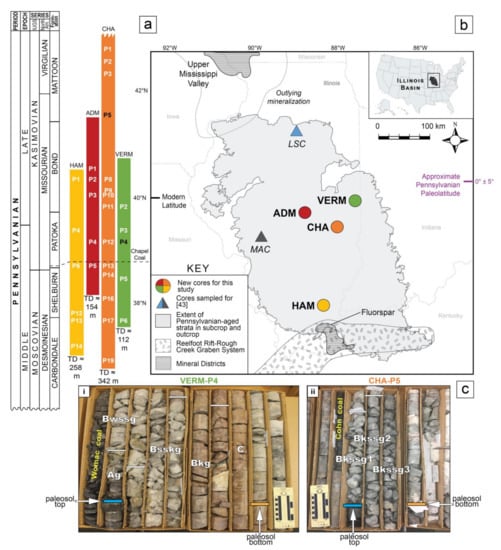
Figure 2.
(a) Stratigraphic position of cores and paleosols identified in the Illinois Basin (IB) for this study. The cores include the Illinois State Geological Survey (ISGS) #1 City of Charleston (CHA), ISGS-Archer-Daniels-Midland, Borehole MMV-04B (ADM), the Materials Service Corps #F-72-8 (VERM), and the American Coal Company Borehole 7510-20 (HAM). P(#) notation indicates the paleosol identification number collected from the corresponding core, as well as its relative stratigraphic position (see Table 1). P(#)s denoted in black are depicted in Figure 2c herein. TD = total depth of the core from the surface, in meters. The Chapel Coal (dashed horizontal line) is delineated for reference. IUGS = nomenclature for geologic time terms reported by the International Union of Geological Sciences. North Am. = nomenclature for geologic time terms utilized in North America. (b) Map of the IB showing geographic locations of cores sampled for this study. Core locations represented by colored circles are the focus of methods, results, and discussion for this work. Core locations represented by colored triangles are sites studied in [43] (p. 607) that have complementary Δ° 2θ data incorporated into the discussion of this work (data on Reichweite Ordering from the Lone Star Cement Company #TH-1 (LSC) and Monterey Coal Company Mac 1 #CBM4 (MAC) cores and are not included in this paper). Map modified after [43] (p. 607). Paleolatitudinal information from [38] (p. 33–39). Mineral districts and Reelfoot-Rift-Rough Creek Graben depiction modelled after [47] (p. 258). (c) Core photos with horizon identifiers based on modern soil classification of soil horizons applied to paleosols [48,49]. All core boxes are 2 feet or ~0.6 m long. Paleosols are named after the IB pedotype scheme developed by [43] (p. 610–622). (i) Paleosol 4 from the VERM core classified as a gleyed calcic Vertisol due to the presence of wedge shaped peds, slickensides, carbonate nodules, mottling, and Fe- and/or Mn- oxide minerals (in order of descending importance). (ii) Paleosol 5 from the CHA core, classified as a gleyed vertic Calcisol due to the presence of pedogenic carbonates, wedge shaped peds, slickensides, and drab matrix colors. Paleosol characteristics are not discussed further in this paper, see [50] (p.79) for corresponding classifications for this sample set.
This study attempts to identify mixed-layer illite-smectite within the clay-size fractions of the IB paleosol profiles to differentiate between pedogenic, or authigenic products of soil weathering, and diagenetic, or authigenic products of post-pedogenic alteration, clay minerals. This is achieved by XRD determination of Reichweite Ordering and Δ° 2θ illitization values and consideration of the impact of possible diagenetic mechanisms in the IB, which may inform the significance and meaning of the paleosol mineral fraction for the purposes of paleoclimatic and diagenetic reconstruction of the Pennsylvanian strata of the IB.
2. Materials and Methods
2.1. Samples
Bulk paleosol matrix samples (n = 140) were collected from four cores in the IB (Figure 2). Cores include Illinois State Geological Survey (ISGS) #1 City of Charleston (CHA), ISGS-Archer-Daniels-Midland, Borehole MMV-04B (ADM), the Materials Service Corps #F-72-8 (VERM), and the American Coal Company Borehole 7510-20 (HAM). All cores were previously logged using sedimentological and stratigraphic frameworks employed by ISGS geologists that provides basin-wide correlations with other cores. Once paleosol profiles were identified and divided into horizons (sensu [48]), matrix samples were taken in 10–20 cm intervals. Paleosols were classified based on the [49] (p. 130–133) paleosol classification scheme. Note paleosol identifications are listed for reference in Table 1 but will not be discussed in detail here (Figure 2c; see [50] (p. 79) for more information on paleosol classification associated with this samples set). It should be noted that coals, or Histosols [49] (p. 131), were not sampled for this study, but their stratigraphic position was noted. Furthermore, the Shelburn Formation (Fm.) in the VERM core was removed from the ISGS Core Repository and therefore could not be sampled for this study. Once samples were identified, cores were correlated using laterally extensive overlying coal and limestone units, or members, to evaluate lateral differences in penecontemporaneous rock units near the Desmoinesian–Missourian Boundary (Figure 2).

Table 1.
Sample details from Illinois Basin paleosols.
2.2. X-ray Diffraction Analyses
Sixty-four bulk matrix samples were individually suspended in deionized water and disaggregated by aqueous ultrasonic agitation. Samples were isolated to the <2.0 µm equivalent spherical diameter size fraction by centrifugation [51]. Sixteen of these 64 samples were subject to further centrifugation to isolate the <0.2 µm equivalent spherical diameter clay fraction, which may contain primarily authigenic clay minerals (e.g., [45,52]). The <2.0 and <0.2 µm fractions were suspended in DI water and prepared as oriented aggregates on filter membrane peels and transferred to cleaned glass slides [53]. Samples were subject to ethylene glycol (EG) solvation at 60 °C for 8 h, enhancing peak intensity of mixed-layer clay minerals that otherwise could be indistinguishable from background or interference with neighboring peaks [1,54,55]. Step-scan analyses of the samples were performed using a Rigaku Ultima III X-ray Diffractometer at Southern Methodist University with Cu-Kα radiation over a range of 2 to 30° 2θ, and a step scan size of 0.04° 2θ per 1 s.
2.3. Reichweite Ordering
Reichweite Ordering was developed to identify ordered versus randomly ordered clay minerals [56]. Ordering in this particular mineralogical sense is dependent on the number of interactions between neighboring layers in a clay mineral and whether they show a pattern that permits X-ray data to predict a repetitive relationship(s), or interaction, of crystallographic form across the d00l axis [2]. Randomly ordered interstratifications (R0) show no interaction between layers. Based upon observation, ordered interstratifications are ordered by nearest-neighbor (R1) interlayers and thrice nearest neighbors (R3). The identifiable difference between R1 and R3 ordering is the amount of illite in the sample, which tends to increase with increasing ordering value (i.e., R3 ordered I-S has more % illite in mixed-layer illite-smectite than R1 ordered I-S or R0 randomly ordered I-S [1,25,36]). Ordering can be identified by examining X-ray diffraction patterns, generated by Cu-Kα radiation, between 5 and 9° 2θ. If there is an X-ray diffraction pattern from 2:1 phyllosilicate mineral with a peak closer to 5° 2θ, the mineral in the sample likely is randomly interstratified I-S. If a similar sample exhibits an XRD pattern with a peak closer to 9° 2θ, the sample is considered to be ordered and there is a predictable, repeating, long-distance pattern of layering of illite-type and smectite-type layers in the sample. The intensity of a peak is higher for R3 ordered minerals due to overall greater crystallinity and long-range order, than R1 ordered minerals. It should be noted that when identifying peaks from an XRD pattern, an error of ±0.02–0.08° 2θ should be expected [57].
2.4. Δ° 2θ
X-ray diffraction Δ° 2θ measurement of phyllosilicate minerals is used to identify interstratified clay mineral thicknesses of samples solvated by EG [57]. The following equation is used to estimate the Δ° 2θ value of EG pretreated, mixed-layer illite-smectite samples:
where illite (002)/smectite (003) represents the XRD pattern peak position of the composite interstratified I-S (002) phase of illite and (003) phase of smectite, respectively; both of which occur near 16° 2θ (using Cu-Kα radiation [57]). Illite (001)-smectite (002) represents the XRDpattern peak position of the composite interstratified I-S (001) phase of illite and the (002) phase of smectite, respectively; both of which occur near 9° 2θ (using Cu-Kα radiation [57]). As mentioned, peak positions in an XRD pattern have an error of ±0.02–0.08° 2θ, which contributes to a variable uncertainty of the reported Δ° 2θ value [57]. This Δ° 2θ EG solvation method allows for the requisite sensitivity of XRD peak positions that is necessary in order to assess compositional changes between illite-smectite superstructure minerals. This reflects the fact that the Δ° 2θ EG solvation methods cause all X-ray diffraction peaks to be displaced in the same direction, thus not impacting the measured Δ° 2θ value [1]. Ultimately, the calculated Δ° 2θ data can be used to estimate the percent illite in I-S [1].
Δ° 2θ = [illite (002)/smectite (003)] − [illite (001)/smectite (002)]
3. Results
Sixty-four samples were chosen for isolation of the <2.0 μm fraction prior to XRD analysis from among the 140 samples collected from VERM, ADM, CHA, and HAM (Figure 2) paleosol profiles in order to better understand trends in I-S interlayering across the IB. Of those 64 samples selected, eight samples were removed from further analysis because they lacked a sufficient clay-sized fraction of materials for analysis, leaving 56 total samples (Table 2). Of those 56, 3 samples exhibited no XRD detectable I-S, leaving a total of 53 samples for an assessment of I-S of the <2.0 μm fraction from amongst the four cores from the IB (Table 2). Sixteen samples were chosen for isolation of the <0.2 μm fraction prior to XRD analysis. Of those 16, three samples exhibited no XRD detectable I-S, leaving a total of 13 samples for assessment of the <0.2 μm fraction from amongst the four cores in the IB (Table 3).
Table 2.
Results of XRD analysis the <2.0 μm clay-sized fraction of Illinois Basin paleosol matrices.
Table 3.
Results of XRD analysis of the <0.2 μm clay-sized fraction of Illinois Basin paleosol matrices.
3.1. Clay Mineralogy
XRD peaks of interest for this work are located near 15 Å (5° 2θ Cu-Kα) for discrete smectite (001), 10 Å (9° 2θ) for discrete illite (001) or mica, 17.5 Å (9.8° 2θ) for I-S (001/002), 5.2 Å (17.5°2θ) for I-S (002/003), and 5 Å (17.8° 2θ) for discrete illite (002) or mica (Figure 3, Figure 4, Figure 5, Figure 6 and Figure 7) [1,58]. I-S may replace traditional discrete smectite peaks in low-angle reflections, i.e., ~5–8° 2θ (Figure 3, Figure 4, Figure 5, Figure 6 and Figure 7). Peaks associated with chlorite (14.2, 7.1, 4.74, and 3.53 Å), kaolinite (7.16 and 3.18 Å), and quartz (4.26 and 3.35 Å) are also distinguishable in XRD patterns of the <2.0 μm fractions (Figure 3, Figure 4, Figure 5 and Figure 6) and the <0.2 μm fractions though to a lesser extent (Figure 7).
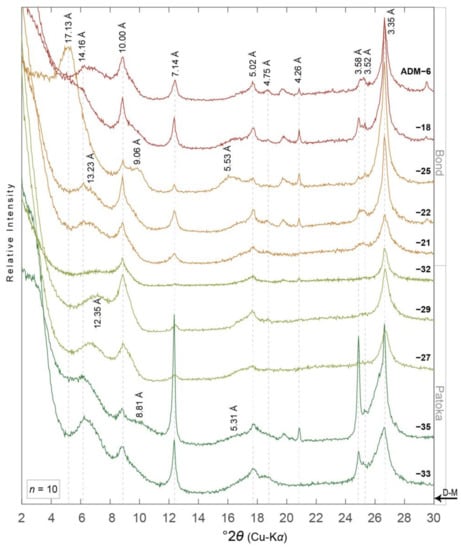
Figure 3.
XRD patterns of ethylene glycol saturated oriented aggregates of the <2.0 µm equivalent spherical diameter clay-sized fraction from paleosols in the Illinois State Geological Survey (ISGS) -Archer-Daniels-Midland, Borehole MMV-04B (ADM) core (n = 10). Diffraction patterns are organized with respect to their relative stratigraphic position, i.e., ADM-33 and ADM-6 are stratigraphically the lowest and highest samples, respectively. D-spacing information for minerals discussed herein are noted vertically and in angstroms (Å). Diffraction patterns are colored to correspond with paleosol type, i.e., dark green = gleyed Vertisol (Pedotype C [43,44]), light green = gleyed calcic Vertisol (Pedotype D), ochre = gleyed vertic Calcisol (Pedotype E), and red = calcic Vertisol (Pedotype G). D-M = Desmoinesian–Missourian boundary. Core location noted in Figure 2. See Table 1 and Table 2 for more details.
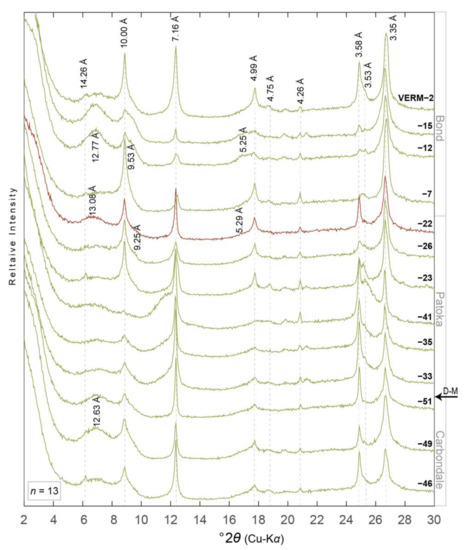
Figure 4.
XRD patterns of ethylene glycol saturated oriented aggregates of the <2.0 µm equivalent spherical diameter clay- sized fraction from paleosols in the Materials Service Corps #F-72-8 (VERM) core (n = 13). Diffraction patterns are organized with respect to their relative stratigraphic position, i.e., VERM-46 and VERM-2 are stratigraphically the lowest and highest samples, respectively. D-spacing information for minerals discussed herein are noted vertically and in angstroms (Å). Diffraction patterns are colored to correspond with paleosol type, i.e., light green = gleyed calcic Vertisol (Pedotype D [43,44]) and red = calcic Vertisol (Pedotype G). D-M = Desmoinesian–Missourian boundary. Core location noted in Figure 2. See Table 1 and Table 2 for more details.
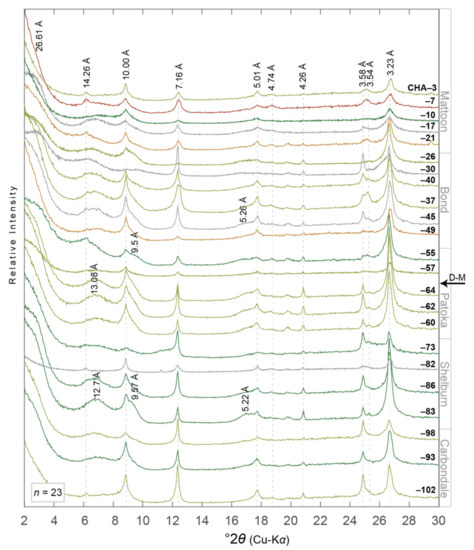
Figure 5.
XRD patterns of ethylene glycol saturated oriented aggregates of the <2.0 µm equivalent spherical diameter clay- sized fraction from paleosols in the Illinois State Geological Survey (ISGS) #1 City of Charleston (CHA) core (n = 23). Diffraction patterns are organized with respect to their relative stratigraphic position, i.e., CHA-102 and CHA-3 are stratigraphically the lowest and highest samples, respectively. D-spacing information for minerals discussed herein are noted vertically and in angstroms (Å). Diffraction patterns are colored to correspond with paleosol type, i.e., grey = gleyed Protosol (Pe-dotype B [43,44]), dark green = gleyed Vertisol (Pedotype C), light green = gleyed calcic Vertisol (Pedotype D), ochre = gleyed vertic Calcisol (Pedotype E), and red = calcic Vertisol (Pedotype G). D-M = Desmoinesian–Missourian boundary. Core location noted in Figure 2. See Table 1 and Table 2 for more details.
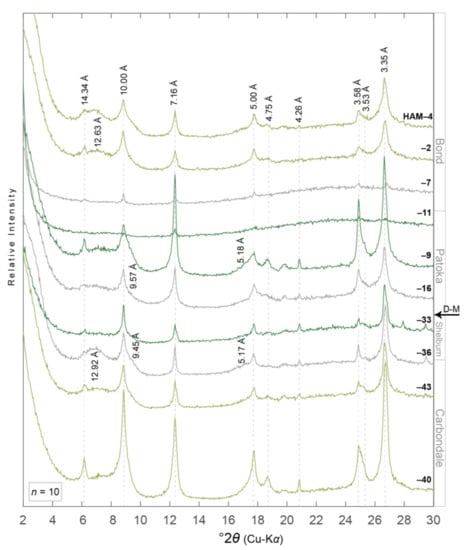
Figure 6.
XRD patterns of ethylene glycol saturated oriented aggregates of the <2.0 µm equivalent spherical diameter clay-sized fraction from paleosols in the American Coal Company Borehole 7510-20 (HAM) core (n = 10). Diffraction patterns are organized with respect to their relative stratigraphic position, i.e., HAM-40 and HAM-4 are stratigraphically the lowest and highest samples, respectively. D-spacing information for minerals discussed herein are noted vertically and in angstroms (Å). Diffraction patterns are colored to correspond with paleosol type, i.e., grey = gleyed Protosol (Pedotype B [43,44]), dark green = gleyed Vertisol (Pedotype C), and light green = gleyed calcic Vertisol (Pedotype D). Desmoinesian–Missourian boundary. Core location noted in Figure 2. See Table 1 and Table 2 for more details.
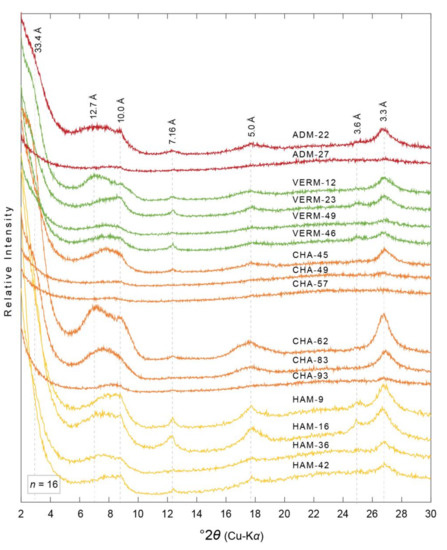
Figure 7.
XRD patterns of ethylene glycol saturated oriented aggregates of the <0.2 µm equivalent spherical diameter clay-sized fraction from select paleosols in the ADM, VERM, CHA, and HAM cores. Diffraction patterns are organized with respect to their relative stratigraphic position, i.e., HAM-40 and HAM-4 are stratigraphically the lowest and highest samples, respectively, from the HAM core. D-spacing information for minerals discussed herein are noted vertically and in angstroms (Å). Diffraction patterns are colored to correspond to core, i.e., red = ADM, green = VERM, orange = CHA, yellow = HAM. Core location noted in Figure 2. See Table 1 and Table 3 for more details.
In general, XRD patterns display similar mineral compositions for all <2.0 and <0.2 µm fractions of paleosol samples in each of the four cores, though peak intensity is variable throughout the dataset (Figure 3, Figure 4, Figure 5, Figure 6 and Figure 7). The general mineralogy of paleosol matrix samples does not have any strong dependence on paleosol type or sampling location (Figure 2, Figure 3, Figure 4, Figure 5 and Figure 6). Furthermore, there are not significant changes in mineralogy across the Desmoinesian–Missourian boundary in the <2.0 μm fraction (Figure 3, Figure 4, Figure 5 and Figure 6). XRD peakedness is strong at 7.15 and 3.58 Å, associated with kaolinite (001) and (002), respectively (Figure 3, Figure 4, Figure 5 and Figure 6). Peakedness is poor around most other peaks, possibly indicating a prevalence of small crystal size, i.e., clay minerals, and/or poor crystallinity. For example, the peak around 3.35 Å can be associated with quartz (001), illite (003), mica (003), and, to a lesser extent, smectite (004), but due to the high intensity, broadness of the peak at half height, and the presence of multiple equidistant peaks in the pattern, it possibly represents both clay and nonclay minerals.
The Bond Fm. contains the most prominent peaks of I-S in the (001/002) and (002/003) positions in the ADM, VERM, and CHA cores compared to other formations (Figure 3, Figure 4, Figure 5 and Figure 6). The ADM core contains some of the broadest I-S peaks at low angles, i.e., 5–8° 2θ, indicating greatest expansibility or amount of smectite in I-S (e.g., ADM-25; Figure 3). The HAM core contains the weakest intensity peaks of I-S at all reflection angles (Figure 6); though peaks for chlorite have a higher intensity in the HAM core compared to the other three cores (Figure 3, Figure 4, Figure 5 and Figure 6).
3.2. Reichweite Ordering
Reichweite Ordering results from XRD patterns of the <2.0 µm fraction of IB paleosol matrices indicate that I-S possess random and ordered interstratification (Table 2; Figure 8), though ordered I-S exists only as R1 and not long-range order (R3). Samples without observable I-S, and thus no Reichweite Order, are noted relative to depth for reference (Figure 8). The VERM and HAM cores contain I-S with only R1 ordering, whereas the ADM and CHA cores contain both R0 and R1 ordering. The Bond Fm. contains the greatest number of I-S samples with random interstratification (n = 4) in the CHA and ADM cores compared to the Carbondale (n = 0), Shelburn (n = 1), Patoka (n = 1), and Mattoon Fms. (n = 1; Table 1 and Table 2). There is only one sample from the Desmoinesian Shelburn Fm. that contains R0 ordering (CHA-73), and the remaining samples with R0 ordering are from Missourian strata (Table 1 and Table 2; Figure 6 and Figure 8).
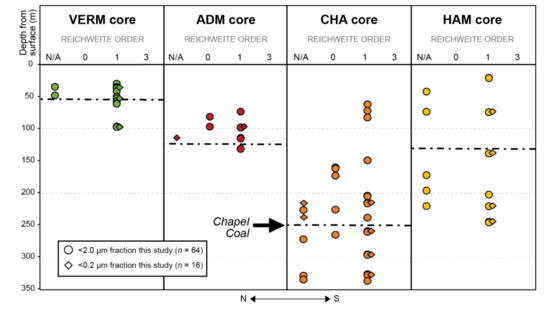
Figure 8.
Reichweite Ordering values relative to stratigraphic position for each <2.0 μm (circles) and <0.2 μm (diamonds) equivalent spherical diameter clay-sized fraction of paleosol samples from the the Materials Service Corps #F-72-8 (VERM; green; <2.0 μm, n = 13; <0.2 μm. n = 4), Illinois State Geological Survey (ISGS)-Archer-Daniels-Midland, Borehole MMV-04B (ADM; red; <2.0 μm, n = 10; <0.2 μm, n = 2), ISGS #1 City of Charleston (CHA; orange; <2.0 μm, n = 20; <0.2 μm, n = 6), and the American Coal Company Borehole 7510-20 (HAM; yellow; <2.0 μm, n = 10; <0.2 μm, n = 4) cores associated with colored circles in of the IB map (Figure 2). The northernmost core is on the far left and the southernmost core is on the far right. The Chapel Coal (black dashed lines) is delineated for reference in each core to demonstrate stratigraphic control. Samples classified as N/A did not have any noticeable interstratification of illite-smectite visible in XRD patterns and therefore could not provide any ordering or illitization information (see Table 2 and Table 3 for tabulated Reichweite Ordering values).
Reichweite Ordering results from the XRD patterns of the <0.2 μm fraction of IB paleosol matrices (Figure 7) indicate that I-S possesses only R1 ordered interstratification (Table 3; Figure 8). Generally, the Reichweite Order is the same for a given sample regardless of the size fraction (Table 2 and Table 3; Figure 3, Figure 4, Figure 5, Figure 6, Figure 7 and Figure 8). The exceptions are two samples from the CHA core and one sample from the ADM core, where I-S is not detectable. In sum, R1 ordering is the most common Reichweite Order amongst all cores and size fractions sampled for this work (Table 2 and Table 3; Figure 8). Since R1 is usually the product of diagenetic illitization [7,34,35], the Reichweite Ordering results presented herein suggest that most of the I-S in the sample set has been impacted by deep burial diagenesis.
3.3. Δ° 2θ Analyses
Δ° 2θ data derived from the <2.0 and <0.2 µm fractions of IB paleosol matrices from the ADM, VERM, CHA, and HAM cores have a range of 6.2 to 8° 2θ. When converted to % illite layers in I-S, the range is from 42% to 82% (Table 2 and Table 3; Figure 9). The ADM core possess most of the samples that contain <60% illite in I-S, and these were collected from <140 m core depth (Table 1, Table 2 and Table 3; Figure 9a). The HAM and CHA cores contain the deepest samples, many recovered from depths exceeding 150 m core depth (Table 1; Figure 9a). Twenty-nine samples from >150m core depth in the HAM and CHA cores contain >60% illite in I-S, as opposed to two samples that are <60% illite in I-S (Table 1, Table 2 and Table 3; Figure 9a). Stratigraphically, the % illite in I-S from these samples have varying percentages (Table 1 and Table 2; Figure 9b). For example, samples collected within ±10 m from the Chapel Coal from the VERM (n = 3), HAM (n = 1), CHA (n = 4), and ADM (n = 2) cores have a range from 52% to 80% illite in I-S in the <2.0 μm (Table 1 and Table 2; Figure 9b) whereas the <0.2 μm fraction has a range of 64–80% illite in I-S from the CHA (n = 1), HAM (n = 1), and VERM (n = 1) cores (Table 1 and Table 3; Figure 9b). Moreover, the lowest % illite in I-S values are from the Bond (42%) and Patoka Fms. (52%), while the highest % illite in I-S value is from the Carbondale Fm. (82%; Table 1 and Table 2; Figure 9b). In sum, since % illite in I-S superstructures that is >60% is usually the product of diagenetic illitization [1,7,27,36], the Δ° 2θ data % illite in I-S data presented suggest that most of the I-S in the sample set herein are products of deep burial diagenesis.
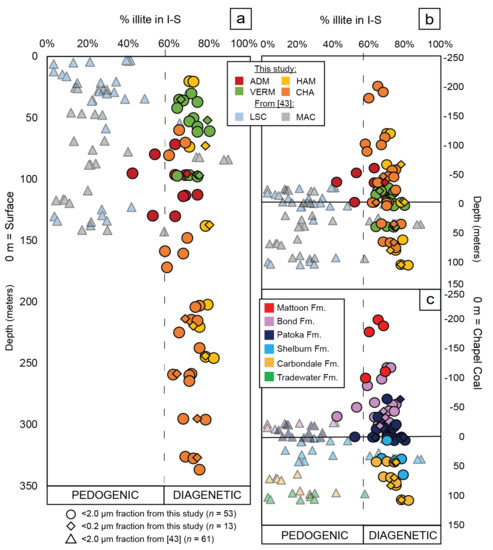
Figure 9.
Δ°2θ values were calculated from Equation (1) and converted to % illite in illite-smectite superstructures [1] for each <2.0 μm (circles, this study; triangles from [43]) and <0.2 μm (diamonds, this study) clay-sized fraction of paleosol samples taken from the Materials Service Corps #F-72-8 (VERM; green; <2.0 μm, n = 13; <0.2 μm, n = 4), Illinois State Geological Survey (ISGS)-Archer-Daniels-Midland, Borehole MMV-04B (ADM; red; <2.0 μm n = 10; <0.2 μm, n = 1), ISGS #1 City of Charleston (CHA; orange; <2.0 μm, n = 22; <0.2 μm, n = 4), the American Coal Company Borehole 7510-20 (HAM; yellow; <2.0 μm, n = 8; <0.2 μm, n = 4), the Lone Star Cement Company #TH-1 (LSC; blue; <2.0 μm, n = 32 [43]), and the Monterey Coal Company, Mac 1 #CBM4 (MAC; grey; <2.0 μm, n = 31 [43]) cores. Samples that have <60% illite in I-S are interpreted to result from pedogenic illitization [27], whereas samples >60% are interpreted to result from diagenetic illitization [7]. See Table 2 and Table 3 for tabulated data. (a) % illite in I-S relative to depth form the surface, where 0 m represents the top of each core. Each core is color coded to the map in Figure 2b. (b) % illite in I-S is plotted relative to stratigraphic position in the basin, where the 0 m datum is equivalent to the location of the Chapel Coal in each core. The Chapel Coal, of the lowermost Patoka Fm (Figure 2a) is shown as stratigraphic data to the depth measurements. Each data point color follows the legend in part a. (c) This is the same plot as part b, except each sample point is color coded towards the formation from which it was sampled, including: the Mattoon (red; <2.0 μm, n = 5), Bond (lilac; <2.0 μm, n = 26; <0.2 μm, n = 3), Patoka (navy; <2.0 μm, n = 35; <0.2 μm, n = 4), Shelburn (turquoise; <2.0 μm, n = 25; <0.2 μm, n = 1), Carbondale (ochre; <2.0 μm, n = 17; <0.2 μm, n = 5), and Tradewater Formations (green; <2.0 μm, n = 8).
4. Discussion
4.1. Provenance and Detrital Components of Illinois Basin Paleosols
Provenance studies of the IB indicate that Pennsylvanian strata are composed of intrabasinal derived, reworked Mississippian strata and extrabasinal sediments [59]. Extrabasinal sediments contain detrital zircon signatures associated with the Neoproterozoic, Grenville, Granite-Rhyolite, and Yavapai-Mazatzal basement terranes [59,60,61,62]. Pennsylvanian-aged back-fill of fluvially incised paleo-valleys indicate intrabasinal sediment sources while paleoflow indicators in crossbedding, indicate a south-southwest trend during fluvial deposition [63,64]. In sum, it is likely that extrabasinal IB sediments were likely derived from eastern Laurentia, possibly as the Appalachian Mountains began to uplift. Moreover, using these data, parent material is characterized as felsic in order to evaluate findings on Pennsylvanian detrital rocks and weathering products within the IB.
Sedimentary petrology of Pennsylvanian units [65,66] and underclays or paleosols [43,44,45,67,68,69,70,71] indicate the presence of quartz, kaolinite, illite and/or mica, chlorite, and I-S. Feldspar, pyrite, and muscovite are common accessory minerals. Many of the major minerals identified in previous studies are corroborated in XRD patterns presented herein of both the <2.0 and <0.2 μm clay-sized fractions (Figure 3, Figure 4, Figure 5, Figure 6 and Figure 7).
The <0.2 µm fraction likely contains only kaolinite, I-S, and illite (Figure 7). From sedimentary petrology (e.g., [72]), stable isotope (δD and δ18O; e.g., [73]), and radio isotope studies (K-Ar; e.g., [74]) of clay minerals, it is likely that finer size fractions (<0.1 or <0.2 µm) of sedimentary rocks, including paleosols, are composed dominantly of authigenic clay minerals or crystallites. The lack of chlorite in the <0.2 µm clay-sized fraction diffraction patterns suggests that its presence in coarser-sized fractions may be a detrital component of IB paleosols. Due to the broadness of the peak and the decrease and intensity around 3.35 Å when comparing samples from the <2 µm and <0.2 µm (Figure 3, Figure 4, Figure 5, Figure 6 and Figure 7), it is likely that quartz is also a detrital mineral-grain component. Due to the scope of this study on I-S, only mica and illite type phyllosilicates will be discussed further.
Differentiating between mica, specifically muscovite, and illite using XRD is challenging because they have nearly identical sharp, peak patterns at 10, 5, and 3.35 Å associated with crystallographic d(hkl) planes (001), (002), and (003), respectively (Figure 3, Figure 4, Figure 5 and Figure 6). Genetically, micas are frequently detrital components of soils and paleosols whereas illite can be detrital, pedogenic, and/or diagenetic components [72,75,76,77,78]. However, pedogenic mica has been documented in some soil environments where there is K+ or NH4+ to promote transformation from vermiculite to mica [79,80], though micas frequently weather to other clay minerals such as smectite or vermiculite as soil formation continues [81]. It is also possible that micas may be products of late-stage diagenesis in the epizone (e.g., [82]), at higher temperatures than what is expected during diagenesis (around 300 °C, [83,84] in the metamorphic window). Therefore, although pedogenic and diagenetic micas may be part of these paleosol clay-sized fractions, illite is a more likely candidate to be associated with the XRD peaks around 10 and 5Å observed in IB paleosols (Figure 3, Figure 4, Figure 5, Figure 6 and Figure 7).
Regardless of its exact origin, since the <0.2 µm clay-sized fraction is suspected to be dominated by authigenic clay minerals, any mica/illite peaks from XRD patterns of the <0.2 µm fraction of paleosol matrices reported herein (Figure 7) are likely authigenic illite (and/or mica). Moreover, when considering the XRD results of <2.0 (Figure 3, Figure 4, Figure 5 and Figure 6) and <0.2 μm (Figure 7) clay-sized fractions, including results from Reichweite Ordering and % illite in I-S for <2.0 and <0.2 μm clay-sized fractions (Table 2 and Table 3; Figure 8 and Figure 9), the XRD pattern analyses produce similar results. Therefore, since the <0.2 μm fraction is generally considered to be authigenic, it is possible that much of the I-S and illite (and/or mica) in the analogous <2.0 μm fraction is also authigenic.
Thus, for the remainder of the discussion, I-S analyzed herein is considered to be only authigenic, so that the probability of I-S genesis in the ancient soil formation versus the deep burial diagenetic environments in the IB may be assessed. The abundances of detrital and diagenetic illite and I-S in IB paleosol fractions will be explored in future research.
4.2. Origins of Authigenic I-S From Illinois Basin Strata
4.2.1. Pennsylvanian Paleosols
By comparing Reichweite Ordering and % illite in I-S results, we can verify whether both methods conclusively identify deep-burial diagenesis as the primary process responsible for illitization and I-S in IB paleosols. Although 17% of samples studied herein display no evidence for I-S, both Reichweite Ordering and % illite in I-S proxies agree that a majority of samples have I-S, though the percentages for genetic origins are unequal (Figure 8, Figure 9 and Figure S1a, Supplementary Materials). When considering the results from each method for each sample, 81% of samples agree that I-S in that sample is the results of deep-burial diagenesis while only 6% of samples agree that I-S in that sample is the results of pedogenesis (Figure S1c). However, 13% of samples produce conflicting results such that Reichweite Ordering or % illite in I-S yield a pedogenic origin while the other method yields a diagenetic origin (Figure S1b,c). Since there is an expected error of ±0.02–0.08° 2θ while identifying peaks [57], any % illite in I-S value within 60% ± 5% should also be suspect (Table 2; Figure S1b). This result suggests that although these proxies are generally corroborative (87%; Figure S1c), they should not be used independently to determine genetic origins of I-S or there may be some conflicting results.
Considering the results of Reichweite Ordering and % illite in I-S superstructure measurements presented herein, samples from the ADM, CHA, VERM, and HAM cores have been impacted by deep burial diagenetic processes. This implication can be tested by comparing this dataset to comparable data collected from penecontemporaneous IB paleosols, originally reported by [43] (p. 625–631), from the Lone Star Cement Company #TH-1 (LSC) and Monterey Coal Company Mac 1 #CBM4 (MAC) cores (Figure 2b). Note, there are no comparable Reichweite Ordering data from the samples collected from the LSC or MAC cores therefore only % illite in I-S data will be discussed, the aforementioned provision that using only data to assess illitization processes notwithstanding for this particular comparison.
The % illite in I-S data collected from the LSC and MAC cores range from 3% to 89% (Figure 9a,b) [43], which covers a larger range than the dataset presented herein (42–82%; Table 2). Moreover, the samples were recovered from shallower core depths, 3.05-142.64 m [43], compared to 20.2–336.7 m for samples collected from the ADM, CHA, VERM, and HAM cores (Figure 9a; Table 2). This follows because the depth of the Pennsylvanian strata in the IB is greater in the south and the interior where the CHA and HAM cores were drilled, relative to their occurrence at shallower depths in the northern (LSC) or western basin margin (MAC; Figure 2 [85,86]). Regardless of these differences, the data from all six cores indicate that % illite in I-S increases with depth, but the % illite in I-S is more variable between 0 and 150 m (3–89%) compared to the data >150 m which are between 58–82% (Figure 9a). Stratigraphically, since all the formations contain variable % of illite in I-S in each core, there is no clear, basin-wide pattern to suggest homogenous preservation of exclusively low-temperature, pedogenetic illitization in these data (Figure 9b,c). Rather, the “rule” across the IB for I-S crystal properties is indicative of deep-burial diagenesis.
As stated in the introduction, illitization in the pedogenic environment may be promoted by fluctuating redox conditions and concomitant wet-dry cycles [27,28,29,30,32,33]. Since seasonality and thus changing redox states were likely promoted during the transition from the middle to upper Pennsylvanian in this region [43,44,45,87], we would expect to see increasing % illite in I-S from the lower formations, i.e., Tradewater, Carbondale, and Shelburn, to the upper formations, i.e., Patoka, Bonda, and Mattoon (Figure 2a), and % illite in I-S should be <60% [27] if illitization was primarily promoted during pedogenesis. However, the composite % illite in the I-S dataset of the ADM, VERM, CHA, HAM, MAC, and LSC cores rejects this hypothesis (Figure 9a–c).
The variability in % illite in I-S could be attributed to heterogenous temperatures during diagenetic illitization in the IB. This is a common conclusion from diagenetic clay mineral studies because sedimentary basins have spatially and temporally variable subsidence, uplift, erosion, and heat flow (e.g., [88]). Since illitization is likely dependent on kinetic conditions, its occurrence is in part temperature dependent, and thus should increase with increasing burial depth [3,23,89,90,91]. Still, according to vitrinite reflectance data collected from Pennsylvanian coals, the IB likely experienced a shallow burial, with a maximum depth of ~1–3 km [92,93,94,95], where the northern IB was buried to a lesser extent than the southern IB. Still, these trends of high % illite in I/S and R1 ordering are seen across all cores in the basin.
4.2.2. Devonian-Pennsylvanian Siliciclastic Rocks
To compare the potential impact of diagenesis on older rock units in the IB we can consider also previous studies of I-S in other clastic rocks from different lithologies (i.e., not paleosol profiles) from the IB. In siliciclastics however, there is not the issue of differentiating between I-S developed in the pedogenic or diagenetic environments. For instance, [66] (p. 358–361) studied I-S in the Devonian-Mississippian-aged New Albany shale of the IB, finding that that % illite in I-S is between 80–95% and increased with depth to 1 km. However, % illite in I-S was unchanged between 1 and 2.5 km, and total concentration of stochiometric illite became more abundant within this same region of deeper burial [66]. This is significant because the New Albany Shale % illite in I-S values are similar to values found herein, even though the New Albany shale is older (and deeper) than Pennsylvanian paleosols investigated in this study.
Similarly, studies of the Pennsylvanian-aged Browning Sandstone and Purington Shale (Tradewater−Carbondale Fms.) also possess I-S with <10% smectite [96,97], consistent with findings presented herein and [43,66] (p. 358–361). In both Pennsylvanian clastic studies, the lack of substantial burial of the IB coupled with advanced stages of diagenetic maturity may indicate low-temperature, time-dependent, or protracted, diagenesis, which drives illitization processes [96,97]. Although, the importance of temperature and time to the illitization reaction is debatable [90,91].
Considering the consistent signatures of deep-burial diagenesis recorded in I-S clay minerals from various stratigraphic intervals in the IB, I-S may record influence(s) of variable heat flow sources associated with tectonic and burial changes in the IB after Pennsylvanian deposition, pedogenesis, and burial.
4.3. Potential Sources of Alteration in Pennsylvanian Phyllosilicates
The results from this work suggest that I-S in IB paleosols has primarily formed following pedogenesis, during shallow to deep burial (Figure 8 and Figure 9). We can now consider how non-pedogenic signatures in Pennsylvanian-aged paleosols were acquired in the IB, acknowledging that the stability of most pedogenic phyllosilicates wanes around ~50–200 °C [7,20,98] and undergoes mineralogical, diagenetic changes. Both temperature change and water/rock interactions will be discussed here to assess the probability of diagenetic alteration of original paleosol phyllosilicates.
4.3.1. Coals and Acid Leaching
Some of the Pennsylvanian paleosols studied herein are underclays, or argillaceous rocks that formed before, and stratigraphically beneath, a coal bed [37,67,68]. Although not the focus of this work, kaolinite was identified in the XRD patterns (Figure 3, Figure 4, Figure 5, Figure 6 and Figure 7) of these paleosol underclays. If kaolinite formed during pedogenic weathering in the Pennsylvanian period, we would expect it to form under humid conditions in well-drained soils [78]. However, it is also possible that acidic fluids leaching from overlying peats could have spurred hydrolytic reactions to form kaolinite in underlying paleosols during shallow burial, a suggestion by previous underclay mineralogy studies [43,69,71,99].
Similarly, it has been suggested that organic acids may impact illitization by increasing the rate of smectite, K-feldspar, and muscovite dissolution, promoting the availability of K and Al cations into the illite layers [27,100,101]. [71] (p. 425) studied the underclay paleosols of the Herrin Coal from the Carbondale Fm. from IB cores in the southwestern part of the basin and found that I-S expandability decreased and ordered I-S increased relative to randomly interstratified I-S as depth below coal increased, demonstrating the relation between in situ acid leaching and illitization. Similarly, there are 26 samples from the <2.0 μm and 9 samples from the <0.2 μm clay-sized fractions analyzed herein that are from paleosols directly underlying coal seams (Figure 10 and Table 4). When comparing the depth of these samples below the coal seam, % illite in I-S increases with increasing depth, though there is some scatter (Figure 10). These data may support the conclusions of [71] (p. 429) such that proximity to coal seams and thus acid leaching may instigate some illitization possibly through fixation of not only K+, but also NH4+. This may have occurred shortly after soil formation, concurrent with coal forming swamps, or after burial of the soil, now paleosol. However, the other 27 samples of the <2.0 μm fraction of paleosols in this study display >60% illite in I-S (Figure 9 and Table 2) even though they are not sampled from paleosols beneath coals. Therefore, there may be multiple mechanisms influencing post-pedogenic illitization processes within the IB paleosol profiles.
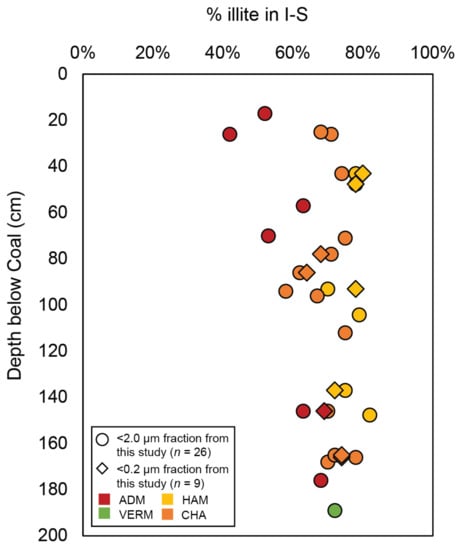
Figure 10.
% illite in I-S of the <2.0 and <0.2 μm clay-sized fraction of paleosol matrices relative to depth below coal seam for paleosols directly underlying coals (ntot = 35). See Table 4 for tabulated data and information about specific IB coals.
Table 4.
Paleosols samples and their overlying coal seams.
4.3.2. The Geothermal Gradient
Another common trigger of phyllosilicate alteration in any sedimentary basin is during shallow to deep burial, as mentioned in the previous section. In sedimentary basins, the average geothermal gradient is about 30 °C/km [102]. Since IB vitrinite reflectance data from Pennsylvanian coals supports a maximum burial depth of around 1–3 km, there was likely a regional geothermal gradient between 20 and 23.5 °C/km in the IB [92,93,94,95]. A more recent study modelled vitrinite reflectance and basin analysis to suggest that the geothermal gradient may have been 30–50 °C/km in the Pennsylvanian strata during maximum burial, though this might not be solely due to burial but also hydrothermal fluid flow [103]. Therefore, it is possible that temperatures during maximum burial were 70–150 °C, which may have facilitated diagenetic alteration of Pennsylvanian phyllosilicates [66].
Depth of burial is perhaps the most typical explanation for I-S in sedimentary basins, which was proposed in the initial studies of Eocene-Pleistocene-aged sediment cores from the U.S. Gulf Coast, where illitization was found to have occurred as depth of burial increased [6,7,15,16,17,18,19,20]. However, the work in the Gulf Coast, suggested that illitization promoted during burial occurs at depths >3 km and temperatures >100 °C, yet the data presented herein suggest that signals of illitization and burial diagenesis can be detected at maximum burial depths <3 km and potentially temperatures well below <100 °C. This is an important comparison between the IB and the U.S. Gulf Coast, which are relatively old and young basins, respectively, highlighting the significance of time as a process during burial diagenesis. Therefore, this work may indicate that signatures of illitization may not be dependent merely on depth of burial but the timing and duration of geologic history in which these processes have occurred.
It should also be noted that there must be sufficient abundances of K+ in the system, likely at the expense of K-bearing minerals such as K-feldspar and mica, to promote potassium fixation during diagenetic illitization [7]. Typical silicate weathering reactions include hydrogen ions and water as reactants to form clay minerals, such as kaolinite, silica while releasing K+ [104]. The problem with applying this weathering scheme to the IB is the minimal K-feldspar in IB siliciclastic rocks compared to quartz, though some sandstones are micaceous [65,105]. Perhaps more importantly, a closed system model of burial without a fluid interaction may not trigger this weathering reaction. Therefore, due to variable quantities of K-bearing minerals and no fluid flow, the impact of the depth of burial mechanism to prompt illitization in Pennsylvanian paleosols is unclear.
4.3.3. Intrusive Activity
It is possible that igneous intrusions may have altered the sedimentary strata in the IB. During the Ouachita orogeny, reactivation of faults in the Reelfoot Rift-Rough Creek Graben area led to emplacement of magma in the southern portion of the basin in the Permian (272–270 Ma [106,107]). It is likely that heat was conductively transferred from these magmatic intrusions into IB sedimentary strata. Other studies on the effects of igneous intrusions on clay minerals in sedimentary basins find similar % illite in I-S values to those reported herein. For example, the North Sea has values between 65–95% illite in I-S as stratigraphic position relative to the granitic basement increases [108]. In fact, in the IB, thermal maturity calculations of kerogen from coals, and bounding units, in the southern portion of the basin indicate regional diagenesis and contact metamorphism of IB strata that was concomitant with Permian-age intrusive magmatism, supporting this hypothesis [109,110,111,112,113]. It should be noted that this intrusive activity may have led to liberation of volatiles into permeable coals [111]. However, intrusive magmatism and subsequent conductive, and to some extent advective, heat flow is expected to have a regional, rather than basin wide, impact [111]. Also, similarly to the argument for the depth of burial, the lack of a definite K+ source and limited fluid availability may weaken the viability of this diagenetic illitization mechanism in Pennsylvanian paleosols across the IB.
4.3.4. Hydrothermal Brines
There is also evidence for topographically derived long-range brine migration in the IB strata, originating south of the IB near the Ouachita orogeny, and propagating north [114,115,116,117]. This brine migration is also suspected to have triggered the mineralization of the Upper Mississippi Valley and Fluorspar mineral districts during the Permian [115,116,117,118,119,120]. Fluid inclusion measurements from these mineral district yield temperatures between 50–170 °C [121,122,123]. Moreover, these briny fluids are hypothesized to be potassic due to evidence of authigenic K-feldspar overgrowths, K-leaching, and authigenic illite and I-S in sandstone aquifers [119,124,125,126,127,128]. Therefore, due to elevated temperatures and potassium availability, it is possible that illitization could be promoted in the IB due to these long-range, hydrothermal brines. However, most evidence for advective heat flow by brine migration through the IB is focused on the Cambrian and Ordovician siliciclastic strata [120,125,129,130,131,132,133] and Precambrian basement [124,127]. For instance, [133] (p. 1096–1102) found that ore-bearing fluids may have formed some or all of illite or I-S in Ordovician Maquoketa group of the IB. Therefore, it is necessary to constrain possible pathways to Pennsylvanian strata to assess viability of this illitization mechanism for paleosols.
Studies of hydrothermal advective activity in the Pennsylvanian strata is limited to the effects on coals. This includes fluid inclusions in coal minerals, including sphalerite and pyrite [134] and the relation between vitrinite reflectance and hydrothermal fluid flow modelling [47,103,135]. In fact, the model from [103] (p. 1810–1821) notes that the strata at or just below the Absaroka unconformity, near the Mississippian–Pennsylvanian boundary, may have acted as an aquifer for fluid flow during the hypothesized Permian long range brine migration. It is also possible that faults and fractures associated with the Reelfoot Rift-Rough Creek Graben area, the La Salle Anticline, the Wabash Valley Fault Zone, the Sandwich Fault Zones, or Plum River Fault Zone [136] may provide conduits to the Pennsylvanian stratigraphy. Since the possible impact of advective heat flow on the Pennsylvanian strata is limited to regional studies, the effects of hydrothermally motivated diagenesis across the basin remains unclear.
4.4. Implications for Pennsylvanian Paleoclimate Reconstructions from the Illinois Basin
Although the I-S XRD data and subsequent analyses presented herein may not precisely ascertain which diagenetic mechanism(s) discussed here were specifically responsible for mineralogical alteration of Pennsylvanian paleosols, these varying and well-documented mechanisms highlight the many ways by which diagenetic alteration may have occurred in the IB. More importantly, since the Pennsylvanian strata has likely been impacted by post-pedogenic diagenesis, any geochemical-based paleoclimate study derived from the Pennsylvanian rock units may need to be re-evaluated. This is because paleoclimate studies frequently rely on the elemental and stable isotopic composition of non-altered paleosol clay minerals (e.g., [45]) or pedogenic carbonates (e.g., [137]). However, temperature stability of many subaerially or pedogenically formed clay minerals and carbonates wanes at temperatures ~50–200 °C [7,20,98]. This work has highlighted that this temperature range was likely sustained during burial, hydrothermal fluid flow, and/or conductive heat flow from intrusive magmatism in the IB. If pedogenic minerals geochemically exchange under either solid-state or dissolution/crystallization conditions [26,138,139,140], some or all of the original Pennsylvanian geochemical signature of soil formation preserved in the paleosol may be compromised. More specifically, this means that results of geochemical studies of altered clay minerals would provide insights on conditions involved during mineral transformation during diagenesis rather than Pennsylvanian soil formation. Therefore, recognition of I-S in paleosols is not inherently indicative of ancient soil formation processes, especially in ancient and shallow sedimentary basins, and should be evaluated more carefully before geochemical paleoclimate reconstruction studies are initiated.
5. Conclusions
By assessing the Reichweite ordering and % illite in I-S superstructures of illite-smectite mineralogical intergrades from IB paleosols, this study attempts to understand the post-Pennsylvanian history and diagenetic impact on clay minerals originally formed during pedogenesis. This study finds that deep-burial diagenesis is a more probable source of illitization in IB paleosols than a pedogenic origin for these mineralogical phases. The conclusions arrived at herein are further supported by previous studies of diagenetic I-S in non-paleosol rocks in the IB and a comprehensive discussion of the many possible mechanisms that may have promoted circumstances conducive to illitization during post-pedogenic diagenesis. In fact, it is likely that acid leaching from coal seams and hydrothermal fluid flow models provide enough evidence to support diagenetic illitization in observed in IB Pennsylvanian paleosols. Though the geothermal gradient determined by the depth of maximum basin burial and intrusive igneous activity may also have an impact on illitization if there is enough potassium available to promote fixation. It is possible that potassium is sourced from the weathering of mica group minerals since there are low abundances of K-feldspar compared to quartz in the basin. This study also highlights the importance of understanding time in diagenetic processes, specifically when in the geologic past the basin formed and was subject to diagenesis and the duration of diagenesis. These results are significant for future studies seeking to reconstruct paleoenvironments using geochemical proxies from shallowly buried sedimentary basins due to the many possible diagenetic mechanisms that may impact the preservation of a paleo-proxy in an ancient basin’s history.
Future work will attempt to identify illite polytypes and trace the K-Ar composition to differentiate between detrital and diagenetic I-S in IB paleosols. Future work also seeks to measure crystallization temperatures of phyllosilicates using δD and δ18O stable isotope proxies on a basin-wide scale to further assess possible illitization mechanisms and the impacts of diagenesis on Pennsylvanian-aged paleosols in the IB.
Supplementary Materials
The following are available online at https://www.mdpi.com/2075-163X/11/2/108/s1, Figure S1: Comparing data from Reichweite Ordering and % illite in I-S derived from Δ° 2θ for samples from the <2.0 μm clay-sized fraction of the ADM, VERM, HAM, and CHA cores. Recall, Reichweite Ordering data is not available for LSC and MAC cores.
Author Contributions
Contributions to the manuscript from first author J.A.M. include: Project design, identification of the main science question, funding acquisition, fieldwork, sample preparation, laboratory work, interpretation of results, and manuscript writing. Contributions from second author N.J.T. include: Analytical design, interpretation of results, contributions to text, and overall text editing. Contributions from third author N.A.R. include: Assistance during fieldwork, interpretation of results, consultation during manuscript writing, and overall text editing. All authors have read and agreed to the published version of the manuscript.
Funding
This study was funded by the Institute for the Study of Earth and Man at Southern Methodist University.
Institutional Review Board Statement
Not applicable.
Informed Consent Statement
Not applicable.
Data Availability Statement
Data is contained within the article or Supplementary Material.
Acknowledgments
This work would not have been possible without the collaboration of the Illinois State Geological Survey. Specifically, thank you to Scott Elrick, W. John Nelson, and Bob Mumm. J.A.M. would like to thank T. Scott Myers and Roy Beavers for assistance in the laboratory. The authors would like to thank Crayton Yapp for thoughtful and constructive discussions throughout the stages of this work. This manuscript benefited from the commentary of three anonymous reviewers.
Conflicts of Interest
The authors declare no conflict of interest. The funders had no role in the design of the study; in the collection, analyses, or interpretation of data; in the writing of the manuscript, or in the decision to publish the results. The views expressed in this article are those of the authors and do not necessarily represent the views or policies of the U.S. Environmental Protection Agency.
References
- Moore, D.; Reynolds, R. X-ray Diffraction and the Identification and Analysis of Clay Minerals; Oxford University Press: Oxford, UK; New York, NY, USA, 1997. [Google Scholar]
- Reynolds, R.C. Interstratified Clay Minerals. In Crystal Structures of Clay Minerals and Their X-ray Identification; Brindley, G.W., Brown, G., Eds.; Monograph; Mineralogical Society: London, UK, 1980; pp. 249–303. [Google Scholar]
- Środoń, J. Nature of Mixed-Layer Clays and Mechanisms of Their Formation and Alteration. Annu. Rev. Earth Planet. Sci. 1999, 27, 19–53. [Google Scholar] [CrossRef]
- Velde, B.B.; Meunier, A. The Origin of Clay Minerals in Soils and Weathered Rocks; Springer Science & Business Media: Berlin, Germany, 2008. [Google Scholar]
- MacEwan, D.M.C.; Ruiz-Amíl, A. Interstratified Clay Minerals. In Soil Components: Vol. 2: Inorganic Components; Gieseking, J.E., Ed.; Springer: Berlin/Heidelberg, Germany, 1975; pp. 265–334. [Google Scholar] [CrossRef]
- Weaver, C.E. The Distribution and Identification of Mixed-Layer Clays in Sedimentary Rocks. Am. Mineral. 1956, 41, 202–221. [Google Scholar]
- Hower, J.; Eslinger, E.V.; Hower, M.E.; Perry, E.A. Mechanism of Burial Metamorphism of Argillaceous Sediment: 1. Mineralogical and Chemical Evidence. Geol. Soc. Am. Bull. 1976, 87, 725–737. [Google Scholar] [CrossRef]
- Sudo, T. Long Spacing at about 30 Å, Confirmed from Certain Clays from Japan. Clay Miner. Bull. 1954, 2, 193–203. [Google Scholar] [CrossRef]
- Bettison-Varga, L.; Mackinnon, I.D.R. The Role of Randomly Mixed-Layered Chlorite/Smectite in the Transformation of Smectite to Chlorite. Clays Clay Miner. 1997, 45, 506–516. [Google Scholar] [CrossRef]
- Reynolds, R.C.; DiStefano, M.P.; Lahann, R.W. Randomly Interstratified Serpentine/Chlorite: Its Detection and Quantification by Powder X-ray Diffraction Methods. Clays Clay Miner. 1992, 40, 262–267. [Google Scholar] [CrossRef]
- Hillier, S. Pore-Lining Chlorites in Siliciclastic Reservoir Sandstones: Electron Microprobe, SEM and XRD Data, and Implications for Their Origin. Clay Miner. 1994, 29, 665–679. [Google Scholar] [CrossRef]
- Thompson, G.R.; Hower, J. The Mineralogy of Glauconite. Clays Clay Miner. 1975, 23, 289–300. [Google Scholar] [CrossRef]
- Buatier, M.D.; Ouyang, K.; Sanchez, J.P. Iron in Hydrothermal Clays from the Galapagos Spreading Centre Mounds: Consequences for the Clay Transition Mechanism. Clay Miner. 1993, 28, 641–655. [Google Scholar] [CrossRef]
- Merriman, R.J. Clay Minerals and Sedimentary Basin History. Eur. J. Mineral. 2005, 17, 7–20. [Google Scholar] [CrossRef]
- Burst, J.F. Postdiagenetic Clay Mineral Environmental Relationships in the Gulf Coast Eocene. Clays Clay Miner. 1957, 6, 327–341. [Google Scholar] [CrossRef]
- Burst, J.F. Diagenesis of Gulf Coast Clayey Sediments and Its Possible Relation to Petroleum Migration. AAPG Bull. 1969, 53, 73–93. [Google Scholar] [CrossRef]
- Powers, M.C. Fluid-Release Mechanisms in Compacting Marine Mudrocks and Their Importance in Oil Exploration. AAPG Bull. 1967, 51, 1240–1254. [Google Scholar] [CrossRef]
- Perry, E.; Hower, J. Burial Diagenesis in Gulf Coast Pelitic Sediments. Clays Clay Miner. 1970, 18, 165–177. [Google Scholar] [CrossRef]
- Perry, E.A.; Hower, J. Late-Stage Dehydration in Deeply Buried Pelitic Sediments. AAPG Bull. 1972, 56, 2013–2021. [Google Scholar] [CrossRef]
- Boles, J.R.; Franks, S.G. Clay Diagenesis in Wilcox Sandstones of Southwest Texas; Implications of Smectite Diagenesis on Sandstone Cementation. J. Sediment. Res. 1979, 49, 55–70. [Google Scholar] [CrossRef]
- Foscolos, A.E.; Powell, T.G.; Gunther, P.R. The Use of Clay Minerals and Inorganic and Organic Geochemical Indicators for Evaluating the Degree of Diagenesis and Oil Generating Potential of Shales. Geochim. Cosmochim. Acta 1976, 40, 953–966. [Google Scholar] [CrossRef]
- Powell, T.G.; Foscolos, A.E.; Gunther, P.R.; Snowdon, L.R. Diagenesis of Organic Matter and Fine Clay Minerals: A Comparative Study. Geochim. Cosmochim. Acta 1978, 42, 1181–1197. [Google Scholar] [CrossRef]
- Hoffman, J.; Hower, J. Clay Mineral Assemblages as Low Grade Metamorphic Geothermometers: Application to the Thrust Faulted Disturbed Belt of Montana, USA; Society of Economic Paleontologists and Mineralogist: Broken Arrow, OK, USA, 1979. [Google Scholar]
- Morad, S.; Ketzer, J.M.; De Ros, L.F. Spatial and Temporal Distribution of Diagenetic Alterations in Siliclastic Rocks: Implications for Mass Transfer in Sedimentary Basins. Sedimentology 2000, 47, 95–120. [Google Scholar] [CrossRef]
- Środoń, J.; Eberl, D.D. Illite. In Micas; Bailey, S.W., Ed.; Reviews in Mineralogy; Mineralogical Society of America: Washington, DC, USA, 1984; pp. 495–544. [Google Scholar]
- Inoue, A.; Kohyama, N.; Kitagawa, R.; Watanabe, T. Chemical and Morphological Evidence for the Conversion of Smectite to Illite. Clays Clay Miner. 1987, 35, 111–120. [Google Scholar] [CrossRef]
- Eberl, D.D.; Środoń, J.; Northrop, H.R. Potassium Fixation in Smectite by Wetting and Drying. ACS Symp. Ser. 1986, 323, 296–326. [Google Scholar] [CrossRef]
- Robinson, D.; Wright, V.P. Ordered Illite-Smectite and Kaolinite-Smectite: Pedogenic Minerals in a Lower Carboniferous Paleosol Sequence, South Wales? Clay Miner. 1987, 22, 109–118. [Google Scholar] [CrossRef]
- Deconinck, J.F.; Strasser, A.; Debrabant, P. Formation of Illitic Minerals at Surface Temperatures in Purbeckian Sediments (Lower Berriasian, Swiss and French Jura). Clay Miner. 1988, 23, 91–103. [Google Scholar] [CrossRef]
- Berkgaut, V.; Singer, A.; Stahr, K. Palagonite Reconsidered: Paracrystalline Illite-Smectites From Regoliths on Basic Pyroclastics. Clays Clay Miner. 1994, 42, 582–592. [Google Scholar] [CrossRef]
- Righi, D.; Velde, B.; Meunier, A. Clay Stability in Clay-Dominated Soil Systems. Clay Miner. 1995, 30, 45–54. [Google Scholar] [CrossRef]
- Gilg, H.A.; Weber, B.; Kasbohm, J.; Frei, R. Isotope Geochemistry and Origin of Illite-Smectite and Kaolinite from the Seilitz and Kemmlitz Kaolin Deposits, Saxony, Germany. Clay Miner. 2003, 38, 95–112. [Google Scholar] [CrossRef]
- Huggett, J.M.; Cuadros, J. Low-Temperature Illitization of Smectite in the Late Eocene and Early Oligocene of the Isle of Wight (Hampshire Basin), U.K. Am. Mineral. 2005, 90, 1192–1202. [Google Scholar] [CrossRef]
- Bethke, C.M.; Altaner, S.P. Layer-By-Layer Mechanism of Smectite Illitization and Application to a New Rate Law. Clays Clay Miner. 1986, 34, 136–145. [Google Scholar] [CrossRef]
- Bethke, C.M.; Vergo, N.; Altaner, S.P. Pathways of Smectite Illitization. Clays Clay Miner. 1986, 34, 125–135. [Google Scholar] [CrossRef]
- Altaner, S.P.; Bethke, C.M. Interlayer Order in Illite/Smectite. Am. Mineral. 1988, 73, 766–774. [Google Scholar]
- Weller, J.M. Cyclical Sedimentation of the Pennsylvanian Period and Its Significance. J. Geol. 1930, 38, 97–135. [Google Scholar] [CrossRef]
- Domeier, M.; Van der Voo, R.; Torsvik, T.H. Paleomagnetism and Pangea: The Road to Reconciliation. Tectonophysics 2012, 514–517, 14–43. [Google Scholar] [CrossRef]
- Cecil, C.B.; DiMichele, W.A.; Elrick, S.D. Middle and Late Pennsylvanian Cyclothems, American Midcontinent: Ice-Age Environmental Changes and Terrestrial Biotic Dynamics. C. R. Geosci. 2014, 346, 159–168. [Google Scholar] [CrossRef]
- Pfefferkorn, H.W.; Gastaldo, R.A.; DiMichele, W.A.; Phillips, T.L. Pennsylvanian Tropical Floras from the United States as a Record of Changing Climate. In Resolving the Late Paleozoic Ice Age in Time and Space; Fielding, C.R., Frank, T.D., Isbell, J.L., Eds.; Special Paper; Geological Society of America: Boulder, CO, USA, 2008; pp. 305–316. [Google Scholar]
- Phillips, T.L.; Peppers, R.A.; Avcin, M.J.; Laughnan, P.F. Fossil Plants and Coal: Patterns of Change in Pennsylvanian Coal Swamps of the Illinois Basin. Science 1974, 184, 1367–1369. [Google Scholar] [CrossRef] [PubMed]
- Sahney, S.; Benton, M.J.; Ferry, P.A. Links between Global Taxonomic Diversity, Ecological Diversity and the Expansion of Vertebrates on Land. Biol. Lett. 2010, 6, 544–547. [Google Scholar] [CrossRef] [PubMed]
- Rosenau, N.A.; Tabor, N.J.; Elrick, S.D.; Nelson, W.J. Polygenetic History of Paleosols in Middle–Upper Pennsylvanian Cyclothems of the Illinois Basin, USA: Part 1. Characterization of Paleosol Types and Interpretation of Pedogenic Processes. J. Sediment. Res. 2013, 83, 606–636. [Google Scholar] [CrossRef]
- Rosenau, N.A.; Tabor, N.J.; Elrick, S.D.; Nelson, W.J. Polygenetic History of Paleosols In Middle–Upper Pennsylvanian Cyclothems of the Illinois Basin, U.S.A.: Part 2. Integrating Geomorphology, Climate, and Glacioeustasy. J. Sediment. Res. 2013, 83, 637–668. [Google Scholar] [CrossRef]
- Rosenau, N.A.; Tabor, N.J. Oxygen and Hydrogen Isotope Compositions of Paleosol Phyllosilicates: Differential Burial Histories and Determination of Middle–Late Pennsylvanian Low-Latitude Terrestrial Paleotemperatures. Palaeogeogr. Palaeoclimatol. Palaeoecol. 2013, 392, 382–397. [Google Scholar] [CrossRef]
- Berrisford, P.; Dee, D.P.; Poli, P.; Brugge, R.; Fielding, M.; Fuentes, M.; Kållberg, P.W.; Kobayashi, S.; Uppala, S.; Simmons, A. The ERA-Interim Archive Version 2.0; ERA Report Series; ECMWF: Reading, UK, 2011; p. 23. [Google Scholar]
- Rowan, E.L.; Goldhaber, M.B.; Hatch, J.R. Regional Fluid Flow as a Factor in the Thermal History of the Illinois Basin: Constraints from Fluid Inclusions and the Maturity of Pennsylvanian Coals. AAPG Bull. 2002, 86, 257–277. [Google Scholar] [CrossRef]
- Soil Survey Staff. Soil Taxonomy: A Basic System of Soil Classification for Making and Interpreting Soil Surveys, 2nd ed.; Agriculture Handbook; Natural Resources Conservation Service: Washington, DC, USA; U.S. Department of Agriculture: Washington, DC, USA, 1999; Volume 436.
- Mack, G.H.; James, W.C.; Monger, H.C. Classification of Paleosols. Geol. Soc. Am. Bull. 1993, 105, 129–136. [Google Scholar] [CrossRef]
- McIntosh, J.A. An Analysis of Mixed-Layer Clay Minerals and Major Element Geochemical Trends in Middle-Upper Pennsylvanian-Aged Paleosols as a Proxy for Characterizing Basin-Wide Diagenetic Patterns and the Paleoenvironment of the Illinois Basin, USA. Master’s Thesis, Southern Methodist University, Dallas, TX, USA, 2018. [Google Scholar]
- Jackson, M.L. Soil Chemical Analysis: Advanced Course; University of Wisconsin—Madison Libraries Parallel Press: Madison, WI, USA, 2005. [Google Scholar]
- Tabor, N.J.; Montañez, I.P. Oxygen and Hydrogen Isotope Compositions of Permian Pedogenic Phyllosilicates: Development of Modern Surface Domain Arrays and Implications for Paleotemperature Reconstructions. Palaeogeogr. Palaeoclimatol. Palaeoecol. 2005, 223, 127–146. [Google Scholar] [CrossRef]
- Kinter, E.B.; Diamond, S. A New Method for Preparation and Treatment of Oriented-Aggregate Specimens of Soil Clays for x-Ray Diffraction Analysis. Soil Sci. 1956, 81, 111–120. [Google Scholar] [CrossRef]
- Brindley, G.W. Ethylene Glycol and Glycerol Complexes of Smectites and Vermiculites. Clay Miner. 1966, 6, 237–259. [Google Scholar] [CrossRef]
- Mosser-Ruck, R.; Devineau, K.; Charpentier, D.; Cathelineau, M. Effects of Ethylene Glycol Saturation Protocols on Xrd Patterns: A Critical Review and Discussion. Clays Clay Miner. 2005, 53, 631–638. [Google Scholar] [CrossRef]
- Jadgozinski, H. Eindimensionale Fehlordnung in Kristallen Und Ihr Einfluss Auf Die Röntgeninterferenzen. I. Berechnung Des Fehlordnungsgrades Aus der Röntgenintensitäten. Acta Crystallogr. 1949, 2, 201–207. [Google Scholar] [CrossRef]
- Środoń, J. Precise Identification of Illite/Smectite Interstratifications by X-ray Powder Diffraction. Clays Clay Miner. 1980, 28, 401–411. [Google Scholar] [CrossRef]
- Brindley, G.W.; Brown, G. Crystal Structures of Clay Minerals and Their X-ray Identification; The Mineralogical Society of Great Britain and Ireland: London, UK, 1982. [Google Scholar]
- Kissock, J.K.; Finzel, E.S.; Malone, D.H.; Craddock, J.P. Lower–Middle Pennsylvanian Strata in the North American Midcontinent Record the Interplay between Erosional Unroofing of the Appalachians and Eustatic Sea-Level Rise. Geosphere 2018, 14, 141–161. [Google Scholar] [CrossRef]
- Eriksson, K.A.; Campbell, I.H.; Palin, J.M.; Allen, C.M.; Bock, B. Evidence for Multiple Recycling in Neoproterozoic through Pennsylvanian Sedimentary Rocks of the Central Appalachian Basin. J. Geol. 2004, 112, 261–276. [Google Scholar] [CrossRef]
- Becker, T.P.; Thomas, W.A.; Samson, S.D.; Gehrels, G.E. Detrital Zircon Evidence of Laurentian Crustal Dominance in the Lower Pennsylvanian Deposits of the Alleghanian Clastic Wedge in Eastern North America. Sediment. Geol. 2005, 182, 59–86. [Google Scholar] [CrossRef]
- Becker, T.P.; Thomas, W.A.; Gehrels, G.E. Linking Late Paleozoic Sedimentary Provenance in the Appalachian Basin to the History of Alleghanian Deformation. Am. J. Sci. 2006, 306, 777–798. [Google Scholar] [CrossRef]
- Potter, P.E.; Siever, R. Sources of Basal Pennsylvanian Sediments in the Eastern Interior Basin 1. Cross-Bedding. J. Geol. 1956, 64, 225–244. [Google Scholar] [CrossRef]
- Archer, A.W.; Greb, S.F. An Amazon-Scale Drainage System in the Early Pennsylvanian of Central North America. J. Geol. 1995, 103, 611–627. [Google Scholar] [CrossRef]
- Willman, H.B.; Atherton, E.; Buschbach, T.C.; Collinson, C.W.; Frye, J.C.; Hopkins, M.E.; Lineback, J.A.; Simon, J.A. Handbook of Illinois Stratigraphy; Illinois State Geological Survey: Champaign, IL, USA, 1975. [Google Scholar]
- Gharrabi, M.; Velde, B. Clay Mineral Evolution in the Illinois Basin and Its Causes. Clay Miner. 1995, 30, 353–364. [Google Scholar] [CrossRef]
- Grim, R.E.; Allen, V.T. Petrology of the Pennsylvanian Underclays of Illinois. GSA Bull. 1938, 49, 1485–1514. [Google Scholar] [CrossRef]
- Schultz, L.G. Petrology of Underclays. GSA Bull. 1958, 69, 363–402. [Google Scholar] [CrossRef]
- Parham, W.E. Lateral Clay Mineral Variations in Certain Pennsylvanian Underclays. Clays Clay Miner. 1963, 12, 581–602. [Google Scholar] [CrossRef]
- Parham, W.E. Lateral Variations of Clay Mineral Assemblages in Modern and Ancient Sediments. In Proceedings of the International Clay Conference, Jerusalem, Israel, 20–24 June 1966; Volume 1, pp. 135–145. [Google Scholar]
- Rimmer, S.; Eberl, D.D. Origin of an Underclay as Revealed by Vertical Variations in Mineralogy and Chemistry. Clays Clay Miner. 1982, 30, 422–430. [Google Scholar] [CrossRef]
- Wilson, M.D.; Pittman, E.D. Authigenic Clays in Sandstones; Recognition and Influence on Reservoir Properties and Paleoenvironmental Analysis. J. Sediment. Res. 1977, 47, 3–31. [Google Scholar] [CrossRef]
- Yeh, H.-W. D/H Ratios and Late-Stage Dehydration of Shales during Burial. Geochim. Cosmochim. Acta 1980, 44, 341–352. [Google Scholar] [CrossRef]
- Clauer, N.; Środoń, J.; Francu, J.; Šucha, V. K-Ar Dating of Illite Fundamental Particles Separated from Illite-Smectite. Clay Miner. 1997, 32, 181–196. [Google Scholar] [CrossRef]
- Southard, A.R.; Miller, R.W. Parent Material-Clay Relations in Some Northern Utah Soils. Soil Sci. Soc. Am. J. 1966, 30, 97–101. [Google Scholar] [CrossRef]
- Huang, W.-L.; Bishop, A.M.; Brown, R.W. The Effect of Fluid/Rock Ratio on Feldspar Dissolution and Illite Formation under Reservoir Conditions. Clay Miner. 1986, 21, 585–601. [Google Scholar] [CrossRef]
- Sheldon, N.D.; Tabor, N.J. Quantitative Paleoenvironmental and Paleoclimatic Reconstruction Using Paleosols. Earth Sci. Rev. 2009, 95, 1–52. [Google Scholar] [CrossRef]
- Tabor, N.J.; Myers, T.S. Paleosols as Indicators of Paleoenvironment and Paleoclimate. Annu. Rev. Earth Planet. Sci. 2015, 43, 333–361. [Google Scholar] [CrossRef]
- Nettleton, W.D.; Nelson, R.E.; Flach, K.W. Formation of Mica in Surface Horizons of Dryland Soils. Soil Sci. Soc. Am. J. 1973, 37, 473–478. [Google Scholar] [CrossRef]
- Ross, G.J.; Phillips, P.A.; Culley, J.L.R. Transformation of Vermiculite to Pedogenic Mica by Fixation of Potassium and Ammonium in a Six-Year Field Manure Application Experiment. Can. J. Soil Sci. 2011. [Google Scholar] [CrossRef]
- Fanning, D.S.; Keramidas, V.Z.; El-Desoky, M.A. Micas. In Minerals in Soil Environments; John Wiley & Sons, Ltd.: Hoboken, NJ, USA, 1989; pp. 551–634. [Google Scholar] [CrossRef]
- Hunziker, J.C.; Frey, M.; Clauer, N.; Dallmeyer, R.D.; Friedrichsen, H.; Flehmig, W.; Hochstrasser, K.; Roggwiler, P.; Schwander, H. The Evolution of Illite to Muscovite: Mineralogical and Isotopic Data from the Glarus Alps, Switzerland. Contr. Mineral. Petrol. 1986, 92, 157–180. [Google Scholar] [CrossRef]
- Kübler, B. Anchimetamorphisme et Schistosite. Bull. Cent. Rech. Explor. Product. 1967, 1, 259–278. [Google Scholar]
- Kübler, B.; Jaboyedoff, M. Illite Crystallinity. Comptes Rendus de l’Académie des Sciences. Earth Planet. Sci. 2000, 331, 75–89. [Google Scholar] [CrossRef]
- Kolata, D.R.; Nelson, W.J. Basin-Forming Mechanisms of the Illinois Basin. In Interior Cratonic Basins; American Association of Petroleum Geologists: Tulsa, OK, USA, 1990; pp. 287–292. [Google Scholar]
- Kolata, D.R.; Nelson, J.W. Tectonic History of the Illinois Basin; American Association of Petroleum Geologists: Tulsa, OK, USA, 1990. [Google Scholar]
- Montañez, I.P.; McElwain, J.C.; Poulsen, C.J.; White, J.D.; DiMichele, W.A.; Wilson, J.P.; Griggs, G.; Hren, M.T. Climate, PCO2 and Terrestrial Carbon Cycle Linkages during Late Palaeozoic Glacial-Interglacial Cycles. Nat. Geosci. 2016, 9, 824–828. [Google Scholar] [CrossRef]
- Pollastro, R.M. Considerations and Applications of the Illite/Smectite Geothermometer in Hydrocarbon-Bearing Rocks of Miocene to Mississippian Age. Clays Clay Miner. 1993, 41, 119–133. [Google Scholar] [CrossRef]
- McCubbin, D.G.; Patton, J.W. Burial Diagenesis of Illite/Smectite, a Kinetic Model: Abstract. AAPG Bull. 1981, 65, 956. [Google Scholar]
- Pytte, A.M.; Reynolds, R.C. The Thermal Transformation of Smectite to Illite. In Thermal History of Sedimentary Basins; Naeser, N.D., McCulloh, T.H., Eds.; Springer: New York, NY, USA, 1989; pp. 133–140. [Google Scholar]
- Velde, B.; Vasseur, G. Estimation of the Diagenetic Smectite to Illite Transformation in Time-Temperature Space. Am. Mineral. 1992, 77, 967–976. [Google Scholar]
- Altschaeffl, A.G.; Harrison, P.W. Estimation of a Minimum Depth of Burial for a Pensylvanian Underclay. J. Sediment. Res. 1959, 29, 178–185. [Google Scholar] [CrossRef]
- Damberger, H.H. Coalification Pattern of the Illinois Basin. Econ. Geol. 1971, 66, 488–494. [Google Scholar] [CrossRef]
- Cobb, J.C. Geology and Geochemistry of Sphalerite in Coal; Illinois State Geological Survey: Champaign, IL, USA, 1981; p. 204. [Google Scholar]
- Cluff, R.M.; Byrnes, A.P. Lopatin Analysis of Maturation and Petroleum Generation in the Illinois Basin; American Association of Petroleum Geologists: Tulsa, OK, USA, 1991. [Google Scholar]
- Moore, D.M. Diagenesis of the Purington Shale in the Illinois Basin and Implications for the Diagenetic State of Sedimentary Rocks of Shallow Paleozoic Basins. J. Geol. 2000, 108, 553–567. [Google Scholar] [CrossRef]
- Moore, D.M. Mineralogy and Diagenesis of the Pennsylvanian Browning Sandstone on the Western Shelf of the Illinois Basin. Ill. State Geol. Surv. Circ. 2003, 561, 20. [Google Scholar]
- Bjorkum, P.A.; Gjelsvik, N. An Isochemical Model for Formation of Authigenic Kaolinite, K-Feldspar and Illite in Sediments. J. Sediment. Res. 1988, 58, 506–511. [Google Scholar] [CrossRef]
- Huddle, J.W.; Patterson, S.H. Origin of Pennsylvanian Underclay and Related Seat Rocks. Geol. Soc. Am. Bull. 1961, 72, 1643–1660. [Google Scholar] [CrossRef]
- Small, J.S. Morphological Changes Associated with the Smectite to Illite Reaction: An Experimental Investigation of the Effect of Organic Acid Anions. Clay Miner. 1994, 29, 539–554. [Google Scholar] [CrossRef]
- Hover, V.C.; Peacor, D.R.; Walter, L.M. Relationship between Organic Matter and Authigenic Illite Smectite in Devonian Black Shales, Michigan and Illinois Basins, USA; Society of Economic Paleontologists and Mineralogist: Broken Arrow, OK, USA, 1996. [Google Scholar]
- Frey, M. Very Low-Grade Metamorphism of Clastic Sedimentary Rocks. In Low Temperature Metamorphism; Frey, M., Ed.; Blackie & Son: Glasgow, UK, 1987; pp. 9–58. [Google Scholar]
- Mariño, J.; Marshak, S.; Masterlerz, M. Evidence for Stratigraphically Controlled Paleogeotherms in the Illinois Basin Based on Vitrinite-Reflectance Analysis: Implications for Interpreting Coal-Rank Anomalies. AAPG Bull. 2015, 99, 1803–1825. [Google Scholar] [CrossRef]
- Bjørlykke, K. Clay Mineral Diagenesis in Sedimentary Basins — a Key to the Prediction of Rock Properties. Examples from the North Sea Basin. Clay Miner. 1998, 33, 15–34. [Google Scholar] [CrossRef]
- Potter, P.E.; Glass, H.D. Petrology and Sedimentation of the Pennsylvanian Sediments in Southern Illinois: A Vertical Profile; Illinois State Geological Survey Report of Investigations 204; Illinois State Geological Survey: Urbana, IL, USA, 1958; p. 72. [Google Scholar]
- Brannon, J.C.; Podosek, F.A.; McLimans, R.K. Alleghenian Age of the Upper Mississippi Valley Zinc–Lead Deposit Determined by Rb–Sr Dating of Sphalerite. Nature 1992, 356, 509–511. [Google Scholar] [CrossRef]
- Chesley, J.T.; Halliday, A.N.; Kyser, T.K.; Spry, P.G. Direct Dating of Mississippi Valley-Type Mineralization; Use of Sm-Nd in Fluorite. Econ. Geol. 1994, 89, 1192–1199. [Google Scholar] [CrossRef]
- Smart, G.; Clayton, T. The Progressive Illitization of Interstratified Illite-Smectite from Carboniferous Sediments of Northern England and Its Relationship to Organic Maturity Indicators. Clay Miner. 1985, 20, 455–466. [Google Scholar] [CrossRef]
- Hower, J.C.; Fiene, F.L.; Wild, G.D.; Helfrich, C.T. Coal Metamorphism in the Upper Portion of the Pennsylvanian Sturgis Formation in Western Kentucky. GSA Bull. 1983, 94, 1475–1481. [Google Scholar] [CrossRef]
- Mastalerz, M.; Schimmelmann, A. Isotopically Exchangeable Organic Hydrogen in Coal Relates to Thermal Maturity and Maceral Composition. Org. Geochem. 2002, 33, 921–931. [Google Scholar] [CrossRef]
- Schimmelmann, A.; Mastalerz, M.; Gao, L.; Sauer, P.E.; Topalov, K. Dike Intrusions into Bituminous Coal, Illinois Basin: H, C, N, O Isotopic Responses to Rapid and Brief Heating. Geochim. Cosmochim. Acta 2009, 73, 6264–6281. [Google Scholar] [CrossRef]
- Cao, X.; Chappell, M.A.; Schimmelmann, A.; Mastalerz, M.; Li, Y.; Hu, W.; Mao, J. Chemical Structure Changes in Kerogen from Bituminous Coal in Response to Dike Intrusions as Investigated by Advanced Solid-State 13C NMR Spectroscopy. Int. J. Coal Geol. 2013, 108, 53–64. [Google Scholar] [CrossRef]
- Quaderer, A.; Mastalerz, M.; Schimmelmann, A.; Drobniak, A.; Bish, D.L.; Wintsch, R.P. Dike-Induced Thermal Alteration of the Springfield Coal Member (Pennsylvanian) and Adjacent Clastic Rocks, Illinois Basin, USA. Int. J. Coal Geol. 2016, 166, 108–117. [Google Scholar] [CrossRef]
- Bethke, C.M. Hydrologic Constraints on the Genesis of the Upper Mississippi Valley Mineral District from Illinois Basin Brines. Econ. Geol. 1986, 81, 233–249. [Google Scholar] [CrossRef]
- Bethke, C.M.; Marshak, S. Brine Migrations across North America-The Plate Tectonics of Groundwater. Annu. Rev. Earth Planet. Sci. 1990, 18, 287–315. [Google Scholar] [CrossRef]
- Garven, G.; Ge, S.; Pearson, M.A.; Sverjensky, D.A. Genesis of Stratabound Ore Deposits in the Midcontinent Basins of North America; 1, The Role of Regional Groundwater Flow. Am. J. Sci. 1993, 293, 497–568. [Google Scholar] [CrossRef]
- Plumlee, G.S.; Goldhaber, M.B.; Rowan, E.L. The Potential Role of Magmatic Gases in the Genesis of Illinois-Kentucky Fluorspar Deposits; Implications from Chemical Reaction Path Modeling. Econ. Geol. 1995, 90, 999–1011. [Google Scholar] [CrossRef]
- Odom, I.E.; Willand, T.N.; Lassin, R.J. Paragenesis of Diagenetic Minerals in the St. Peter Sandstone (Ordovician), Wisconsin and Illinois; Society of Economic Paleontologists and Mineralogist: Broken Arrow, OK, USA, 1979; pp. 425–443. [Google Scholar]
- Fishman, N.S. Basin-Wide Fluid Movement in a Cambrian Paleoaquifer: Evidence from the MT. Simon Sandstone, Illinois and Indiana; Society of Economic Paleontologists and Mineralogist: Broken Arrow, OK, USA, 1997. [Google Scholar]
- Pitman, J.K.; Goldhaber, M.B.; Spöetl, C. Regional Diagenetic Patterns in the St. Peter Sandstone: Implications for Brine Migration in the Illinois Basin; U.S. Government Printing Office: Washington, DC, USA, 1997.
- McLimans, R.K. Geological, Fluid Inclusion, and Stable Isotope Studies of the Upper Mississippi Valley Zinc-Lead District, Southwest Wisconsin. Ph.D. Thesis, Pennsylvanian State University, State College, PA, USA, 1977. [Google Scholar]
- Richardson, C.K.; Pinckney, D.M. The Chemical and Thermal Evolution of the Fluids in the Cave-in-Rock Fluorspar District, Illinois; Mineralogy, Paragenesis, and Fluid Inclusions. Econ. Geol. 1984, 79, 1833–1856. [Google Scholar] [CrossRef]
- Richardson, C.K.; Rye, R.O.; Wasserman, M.D. The Chemical and Thermal Evolution of the Fluids in the Cave-in-Rock Fluorspar District, Illinois; Stable Isotope Systematics at the Deardorff Mine. Econ. Geol. 1988, 83, 765–783. [Google Scholar] [CrossRef]
- Duffin, M.E.; Lee, M.; Klein, G.D.; Hay, R.L. Potassic Diagenesis of Cambrian Sandstones and Precambrian Granitic Basement in UPH-3 Deep Hole, Upper Mississippi Valley, U.S.A. J. Sediment. Res. 1989, 59, 848–861. [Google Scholar] [CrossRef]
- Pitman, J.K.; Spötl, C. Origin and Timing of Carbonate Cements in the St. Peter Sandstone, Illinois Basin: Evidence for a Genetic Link to Mississippi Valley-Type Mineralization; Society of Economic Paleontologists and Mineralogist: Broken Arrow, OK, USA, 1996. [Google Scholar]
- Chen, Z.; Riciputi, L.R.; Mora, C.I.; Fishman, N.S. Regional Fluid Migration in the Illinois Basin: Evidence from in Situ Oxygen Isotope Analysis of Authigenic K-Feldspar and Quartz from the Mount Simon Sandstone. Geology 2001, 29, 1067–1070. [Google Scholar] [CrossRef]
- Sutton, S.J.; Maynard, J.B.; Sutton, S. Basement Unconformity Control on Alteration, St. Francois Mountains, SE Missouri. J. Geol. 1996, 104, 55–70. [Google Scholar] [CrossRef]
- Stueber, A.M.; Walter, L.M. Origin and Chemical Evolution of Formation Waters from Silurian-Devonian Strata in the Illinois Basin, USA. Geochim. Cosmochim. Acta 1991, 55, 309–325. [Google Scholar] [CrossRef]
- Hay, R.L.; Lee, M.; Kolata, D.R.; Matthews, J.C.; Morton, J.P. Episodic Potassic Diagenesis of Ordovician Tuffs in the Mississippi Valley Area. Geology 1988, 16, 743–747. [Google Scholar] [CrossRef]
- Grathoff, G.H.; Moore, D.M. Illite Polytype Quantification Using Wildfire© Calculated X-ray Diffraction Patterns. Clays Clay Miner. 1996, 44, 835–842. [Google Scholar] [CrossRef]
- Hyodo, A.; Kozdon, R.; Pollington, A.D.; Valley, J.W. Evolution of Quartz Cementation and Burial History of the Eau Claire Formation Based on in Situ Oxygen Isotope Analysis of Quartz Overgrowths. Chem. Geol. 2014, 384, 168–180. [Google Scholar] [CrossRef]
- Denny, A.C.; Kozdon, R.; Kitajima, K.; Valley, J.W. Isotopically Zoned Carbonate Cements in Early Paleozoic Sandstones of the Illinois Basin: Δ18O and Δ13C Records of Burial and Fluid Flow. Sediment. Geol. 2017, 361, 93–110. [Google Scholar] [CrossRef]
- Grathoff, G.H.; Moore, D.M.; Hay, R.L.; Wemmer, K. Origin of Illite in the Lower Paleozoic of the Illinois Basin: Evidence for Brine Migrations. GSA Bull. 2001, 113, 1092–1104. [Google Scholar] [CrossRef]
- Whelan, J.F.; Cobb, J.C.; Rye, R.O. Stable Isotope Geochemistry of Sphalerite and Other Mineral Matter in Coal Beds of the Illinois and Forest City Basins. Econ. Geol. 1988, 83, 990–1007. [Google Scholar] [CrossRef]
- Hower, J.C.; Gayer, R.A. Mechanisms of Coal Metamorphism: Case Studies from Paleozoic Coalfields. Int. J. Coal Geol. 2002, 50, 215–245. [Google Scholar] [CrossRef]
- Treworgy, J.D. Structural Features in Illinois—A Compendium; Illinois State Geological Survey: Champaign, IL, USA, 1981; Circular 519; p. 22. [Google Scholar]
- Cerling, T.E. The stable isotopic composition of modern soil carbonate and its relationship to climate. Earth Planet. Sci. Lett. 1984, 71, 229–240. [Google Scholar] [CrossRef]
- O’Neil, J.R.; Kharaka, Y.K. Hydrogen and Oxygen Isotope Exchange Reactions between Clay Minerals and Water. Geochim. Cosmochim. Acta 1976, 40, 241–246. [Google Scholar] [CrossRef]
- Yeh, H.-W.; Savin, S.M. Mechanism of Burial Metamorphism of Argillaceous Sediments: 3. O-Isotope Evidence. GSA Bull. 1977, 88, 1321–1330. [Google Scholar] [CrossRef]
- Sheppard, S.M.F.; Gilg, H.A. Stable Isotope Geochemistry of Clay Minerals. Clay Miner. 1996, 31, 1–24. [Google Scholar] [CrossRef]
Publisher’s Note: MDPI stays neutral with regard to jurisdictional claims in published maps and institutional affiliations. |
© 2021 by the authors. Licensee MDPI, Basel, Switzerland. This article is an open access article distributed under the terms and conditions of the Creative Commons Attribution (CC BY) license (http://creativecommons.org/licenses/by/4.0/).