Article

Automated Indicator Mineral Analysis of Fine-Grained Till Associated with the Sisson W-Mo Deposit, New Brunswick, Canada

by
H. Donald Lougheed
1,*,
M. Beth McClenaghan
2,
Daniel Layton-Matthews
1,
Matthew I. Leybourne
1,3 and
Agatha Natalie Dobosz
1
1
Department of Geological Sciences and Geological Engineering, Queen’s University, Kingston, ON K7L 3N6, Canada
2
Geological Survey of Canada, 601 Booth St., Ottawa, ON K1A 0E8, Canada
3
Department of Physics, Engineering Physics & Astronomy, Arthur B. McDonald Canadian Astroparticle Physics Research Institute, Queen’s University, Kingston, ON K7L 3N6, Canada
*
Author to whom correspondence should be addressed.
Minerals 2021, 11(2), 103; https://doi.org/10.3390/min11020103
Submission received: 1 November 2020 / Revised: 12 January 2021 / Accepted: 15 January 2021 / Published: 21 January 2021
(This article belongs to the Special Issue Mineral Exploration in Weathered and Covered Terrains)

Abstract

:
Exploration under thick glacial sediment cover is an important facet of modern mineral exploration in Canada and northern Europe. Till heavy mineral concentrate (HMC) indicator mineral methods are well established in exploration for diamonds, gold, and base metals in glaciated terrain. Traditional methods rely on visual examination of >250 µm HMC material. This study applies mineral liberation analysis (MLA) to investigate the finer (<250 µm) fraction of till HMC. Automated mineralogy (e.g., MLA) of finer material allows for the rapid collection of precise compositional and morphological data from a large number (10,000–100,000) of heavy mineral grains in a single sample. The Sisson W-Mo deposit has a previously documented dispersal train containing the ore minerals scheelite, wolframite, and molybdenite, along with sulfide and other accessory minerals, and was used as a test site for this study. Wolframite is identified in till samples up to 10 km down ice, whereas in previous work on the coarse fraction of till it was only identified directly overlying mineralization. Chalcopyrite and pyrite are found up to 10 km down ice, an increase over 2.5 and 5 km, respectively, achieved in previous work on the coarse fraction of the same HMC. Galena, sphalerite, arsenopyrite, and pyrrhotite are also found up to 10 km down ice after only being identified immediately overlying mineralization using the >250 µm fraction of HMC. Many of these sulfide grains are present only as inclusions in more chemically and robust minerals and would not be identified using optical methods. The extension of the wolframite dispersal train highlights the ability of MLA to identify minerals that lack distinguishing physical characteristics to aid visual identification.

1. Introduction

Indicator mineral methods applied to sediment samples are important exploration tools for diamonds [1] and gold [2,3,4,5,6] in glaciated terrain. More recently, the potential of indicator minerals to aid in porphyry copper [7,8,9], magmatic Ni–Cu–platinum group elements (PGE; [6,10]), carbonate-hosted Pb-Zn [11], and volcanogenic massive sulfide (VMS) exploration [12,13] has also been demonstrated.
Using current sampling protocols, a large till or stream-sediment sample (10–20 kg) is necessary to recover detectable and meaningful numbers of indicator mineral grains for analysis [14]. Indicator minerals are recovered from these large samples at specialized commercial laboratories using a combination of sizing, density, and magnetic concentration methods to reduce the volume of material into a nonferromagnetic heavy mineral concentrate, (HMC), for examination. The resulting HMC is composed of dense mineral grains (specific gravity (SG) >3.2) and the degree of abrasion and wear on the grains can be used to infer the transport distance of certain minerals (e.g., [3,15,16]). Mineral associations can be observed in composite grains and the degree of physical liberation of interlocked minerals (e.g., kelyphite rims on Cr-rich garnet in kimberlite dispersal trains) can also indicate the distance of transport [1]. The coarse fraction (250–2000 µm; medium to very coarse sand) of the HMC is visually examined using a binocular microscope to identify and count indicator mineral species [6,17]. Current methods focus on the medium to coarse sand-sized HMC fraction because it is the most cost-effective to recover and visually examine. The method is well established, having been used in mineral exploration and research for more than 30 years.
Developments in rapid scanning electron microscopy (SEM) such as mineral liberation analysis (MLA) or quantitative evaluation of minerals by scanning electron microscope (QEMSCAN) over the past 10 years now make it possible to also examine and analyze the fine, <250 µm, HMC fraction of sediment samples using automated technologies [18,19]. Automated mineralogy provides the potential for the identification and use of additional indicator minerals that traditional visual examination of the 250–2000 µm HMC fraction does not allow. An automated mineralogy method, MLA, was tested by Lougheed et al. [13] using four archived Geological Survey of Canada (GSC) HMCs from till samples collected around the upper-amphibolite–facies Izok Lake volcanogenic massive sulfide deposit. Results indicated that MLA of the <250 µm HMC of till allowed the detection of both ore and alteration indicator minerals, with a notable increase in the areal extent of detectable sulfide dispersal down ice of Cu-Pb-Zn mineralization. The study reported here applies similar MLA methods by analyzing five archived till HMC samples collected around the granite-hosted Sisson W-Mo deposit in eastern Canada (Figure 1).

2. Geological Background

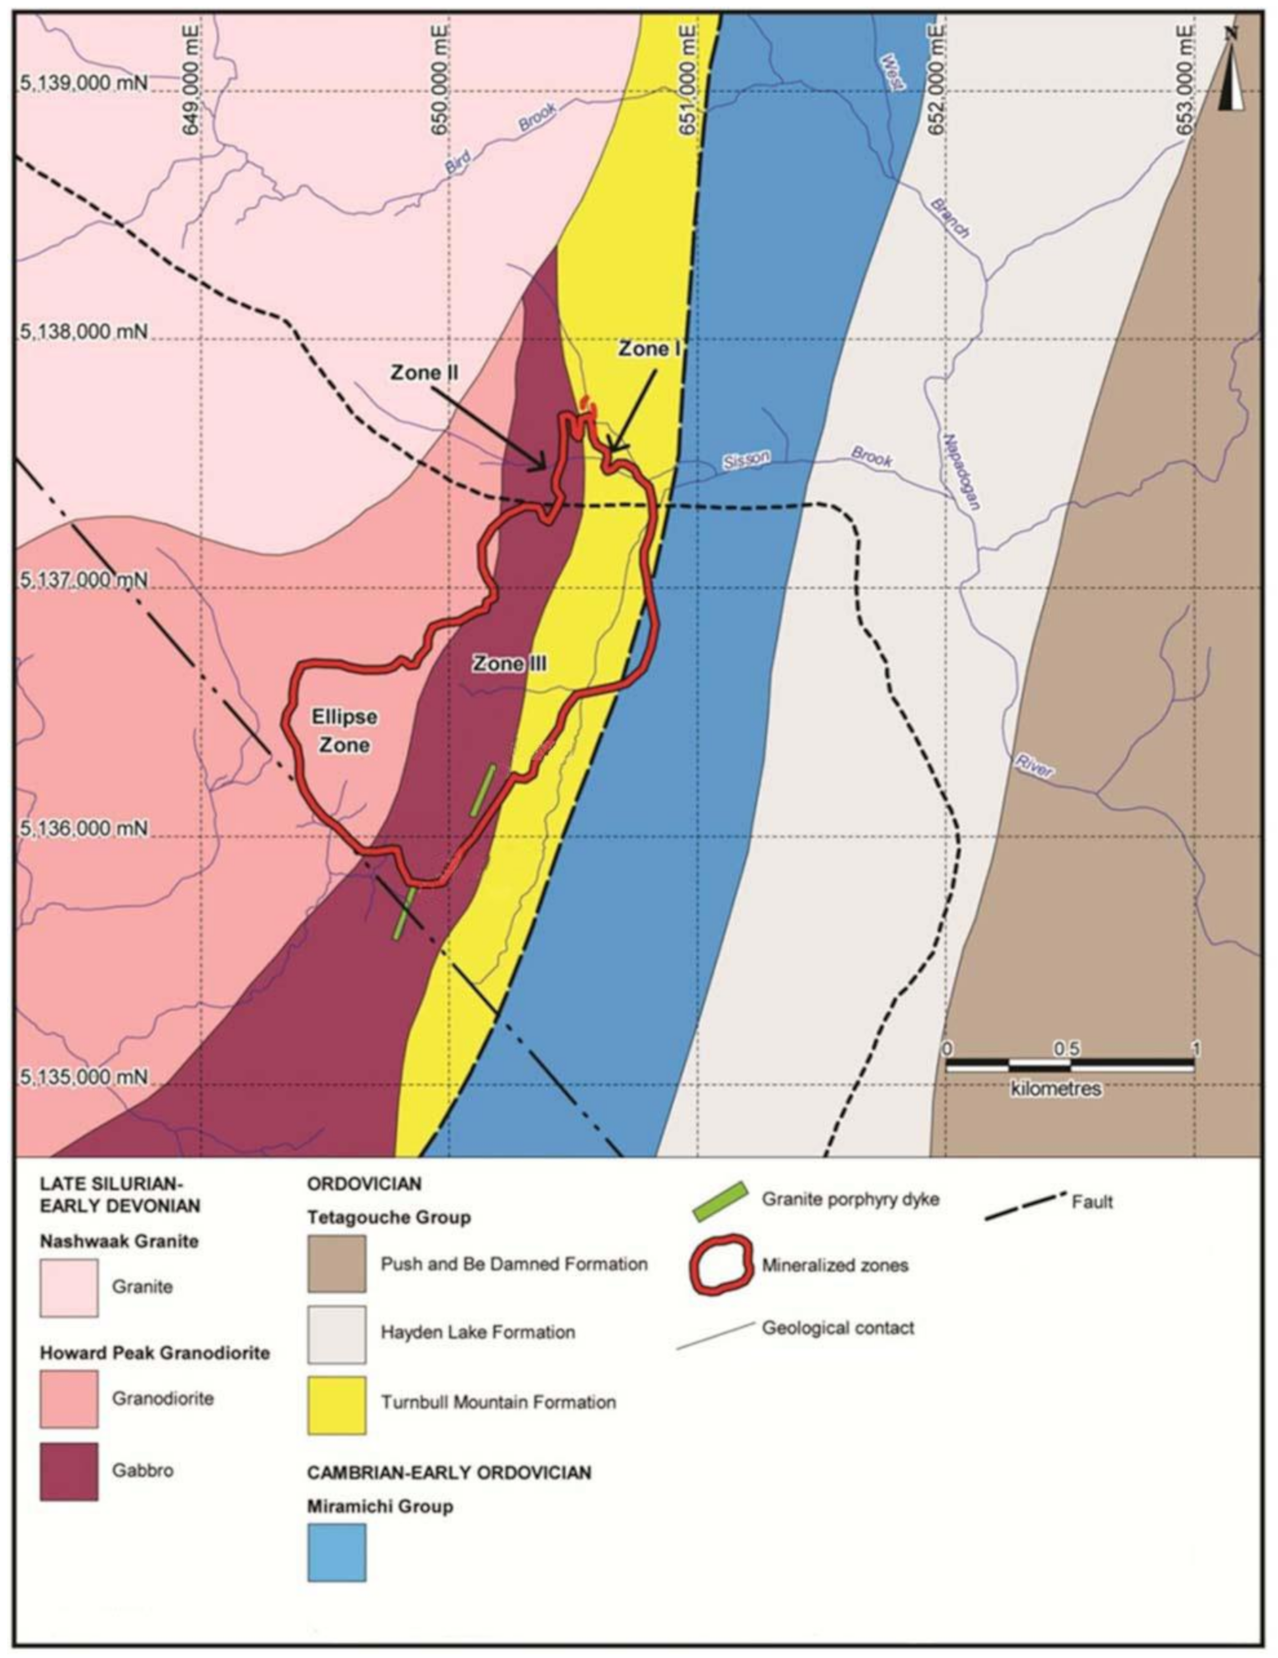
2.1. Bedrock and Deposit Geology

The sub-greenschist facies Sisson deposit is a granite-related W-Mo deposit located in west-central New Brunswick (Figure 1) on the eastern margin of a belt of plutonic rocks emplaced during the Acadian Orogeny (Late Silurian to Early Devonian) and underlying the Miramichi Highlands [22]. Two Acadian plutons are spatially related to the Sisson deposit: the Howard Peak granodiorite and the Nashwaak granite [23]. Mineralization at the Sisson deposit is hosted within the intensely sheared and cataclastized eastern margin of the Howard Peak granodiorite, where it is in contact with Cambrian to Early Ordovician volcanic and sedimentary rocks [24]. The deposit is closely associated with felsic rocks emplaced into clastic sedimentary rocks of the Cambrian to Early Ordovician Miramichi Group, volcanic and sedimentary rocks of the Ordovician Tetagouche Group, and deformed Ordovician plutonic rocks [25]. The regional host rocks were later intruded by a felsic dyke swarm and a distinctively younger Late Devonian porphyritic felsic dyke [26]. The Late Devonian porphyry dykes have been interpreted as originating from the same source as the mineralizing fluids at Sisson, related to a deeply emplaced stock [27,28,29]. Zircon U-Pb dating places the emplacement of the dykes at 364.5 ± 1.3 Ma [22], making it very close in age to the Mount Pleasant volcanic complex (370.4 ± 2 Ma by Re-Os dating of molybdenite), which is responsible for the polymetallic Sn-W-Mo-Bi-In Mount Pleasant deposit 85 km to the south [30].
The Sisson deposit is hosted in four mineralized zones (Figure 2). Zones I and II are structurally controlled, wide (>10 m) and approximately 100 m along strike length [24]. Zone I is hosted within a thinly-bedded sequence of dark grey siltstone and tuff (Turnbull Mountain Formation) and zone II is hosted in gabbroic rocks (Howard Peak Granodiorite); both zones are associated with quartz veins in a highly silicified shear zone. Zone III, the main ore resource for the deposit, is hosted by sheared and silicified gabbroic rocks of the Howard Peak pluton, with associated cataclastically deformed granitic dykes that likely represent apophyses of the Nashwaak pluton [22,31]. The Ellipse Zone extends to the northwest from the southwest corner of Zone III and is hosted within both the quarz diorite and gabbro phases of the Howard Peak Granodiorite. Mineralization in zones I and II primarily consists of wolframite and chalcopyrite, concentrated primarily in late stockworks, whereas zone III is composed of scheelite and molybdenite, which occur in early and late veins and stockworks [24,29].
Hydrothermal alteration is pervasive throughout a large area surrounding the deposit, and mineralization is concentrated in the immediate vicinity of veins and fractures [27]. Several hydrothermal features contribute to the ore and alteration mineralogy of the deposit and are summarized in Table 1. Sodic-calcic, biotite, and biotite-sulfide alteration are early-stage, unmineralized and pervasive, in contrast to calc-silicate alteration (thought to be endoskarn) which is of unknown age, contains scheelite, is only identified at depths below 300 m [30]. Vein mineralogy varies between several generations, with scheelite and molybdenite present in both early and late-stage veins and stockworks. Pyrite and pyrrhotite are present in both early and late-stage veins and as part of the alteration surrounding the deposit. Wolframite, along with assorted sulfides (arsenopyrite, chalcopyrite, galena, sphalerite), is found primarily in late-stage stockworks. Rennie et al. [32] reported resource estimates for the deposit of 383,000,000 t at 0.069 wt.% WO3 and 0.023 wt.% Mo (proven) and an additional 178,000,000 t at 0.065 wt.% WO3 and 0.020 wt.% Mo (probable). Table 2 contains a list of minerals previously identified in the deposit.

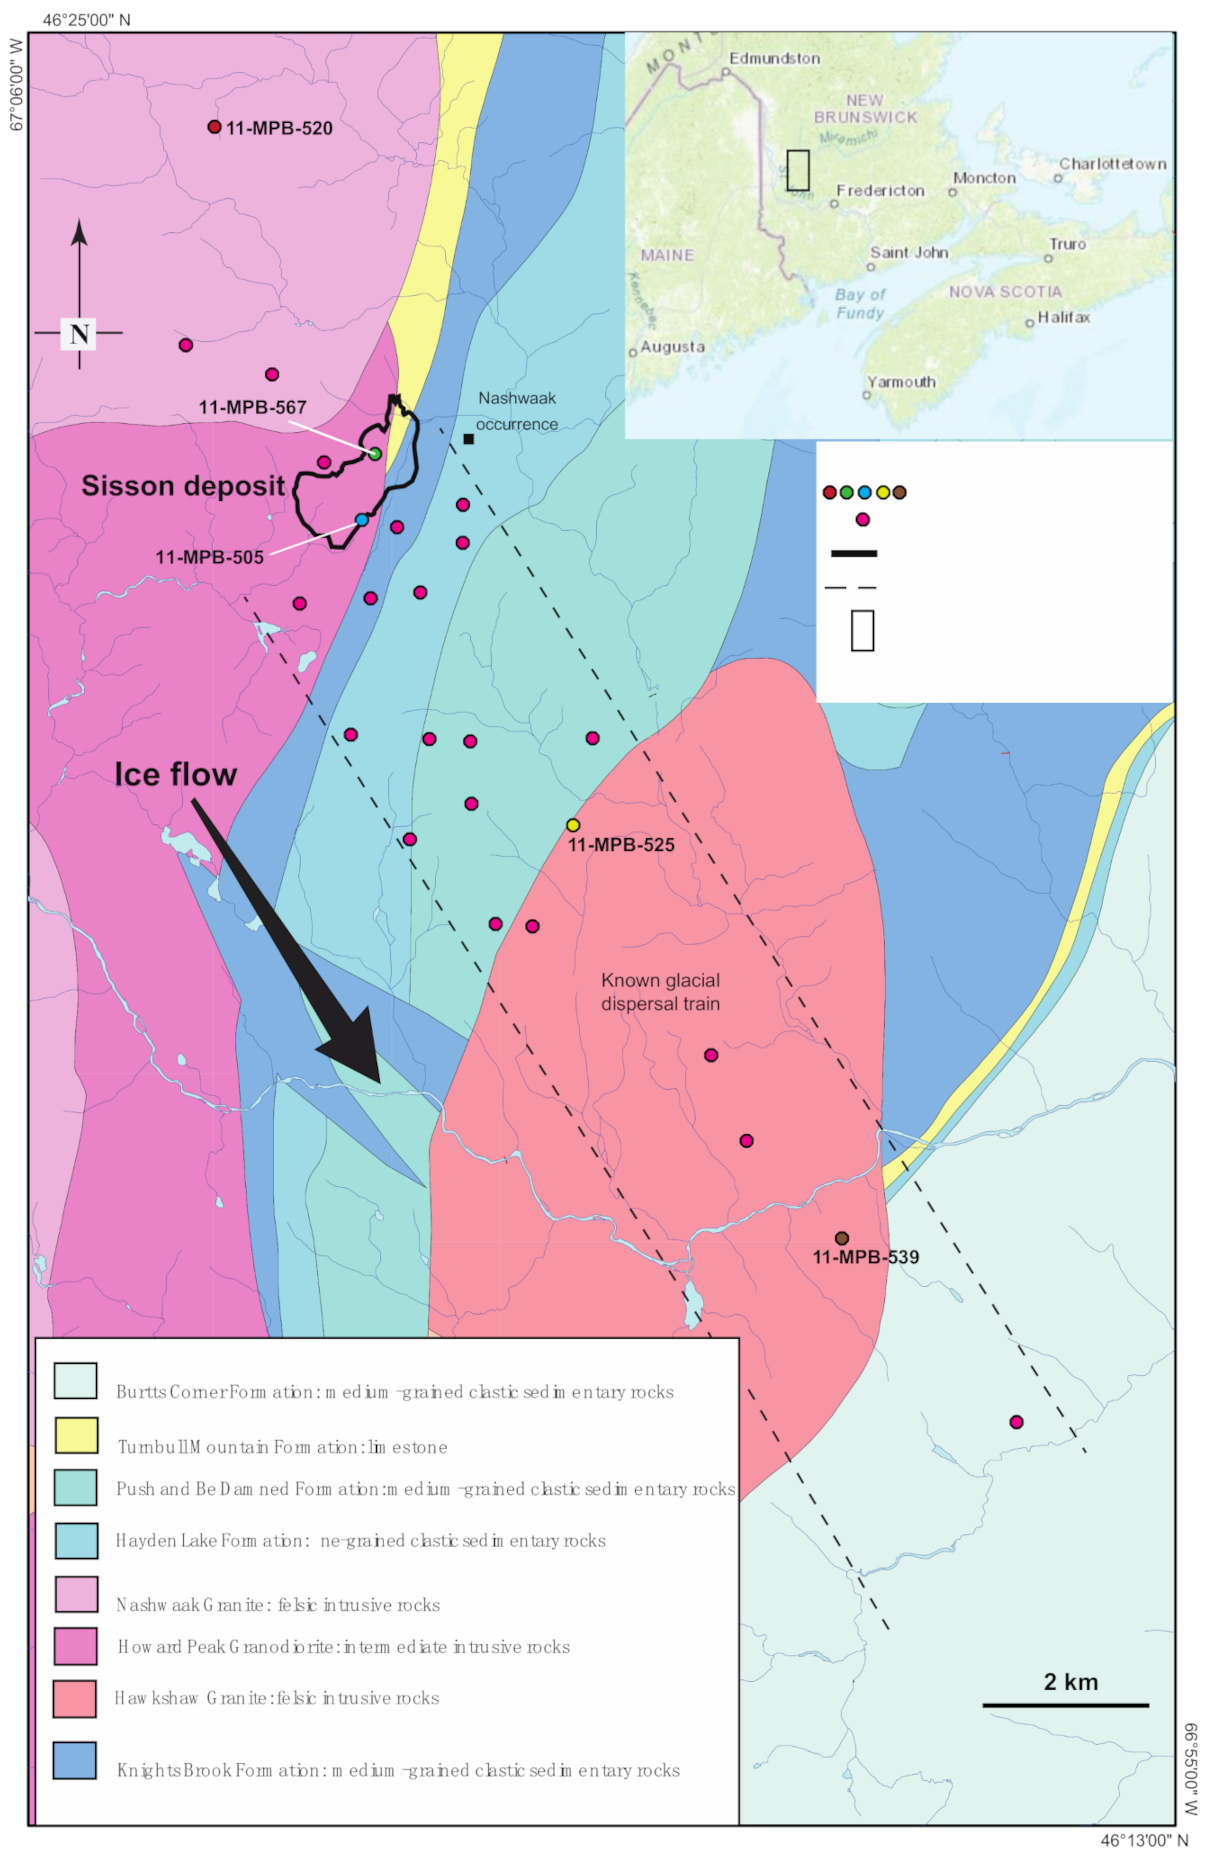
2.2. Surficial Geology

Mineralization subcrops beneath the local till cover. Bedrock outcrops in the area are rare due to a nearly continuous till cover that varies from <2 to 20 m in thickness. Most of this thick till cover is a sandy lodgment till deposited by southeast glacial flow during the early Wisconsinan. This till may have been reworked by subsequent south-southwest glacial flow during the middle to late Wisconsinan [33]. A discontinuous, thin (<2 m), sandy ablation till overlies the early Wisconsinan till in places [24,33,34], but this was avoided during till sampling.

2.3. Previous Surficial Geochemical and Indicator Mineral Studies

Reconnaissance-scale surface till geochemical surveys carried out in the region identified a 30 km-long glacial dispersal train extending southeast of the Sisson deposit. The train was defined by various combinations of W, Mo, As, Bi, Cu, F, Pb, and Sn contents in several different size fractions of till matrix [20,33,35,36,37]. Till indicator mineral studies carried out by McClenaghan et al. [20,38,39,40,41] combined with stream-sediment indicator mineral data [21,41] indicate that the 250–2000 µm HMC fraction of sediment contains the ore minerals scheelite, wolframite, and molybdenite, along with sulfide and Bi-bearing minerals. Scheelite was found in till samples collected at least 10 km down ice of mineralization, whereas the other ore minerals were only found in till samples immediately overlying mineralization. Scheelite and wolframite were recovered from the 250 to 2000 µm HMC fraction of stream sediment samples collected at least 4 km downstream of the north end of the deposit, and 5 km to the southeast, downstream from the southeast–trending glacial dispersal train.

3. Methods and Materials

3.1. Samples

Five till samples collected in 2011 by McClenaghan et al. [38,40,41,42] were chosen for this study based on their locations relative to mineralization (Figure 1) and the reported indicator mineral content in the 250 to 2000 µm HMC fraction. Sample 11-MPB-520 is the farthest up ice till sample available (4 km from mineralization) and was chosen to represent background values compared to down ice sample locations. Till samples 11-MPB-505 and 11-MPB-567 overlie mineralization: sample 11-MPB-505 overlies the Ellipse zone and sample 11-MPB-567 overlies zone III. Samples 11-MPB-525 and 11-MPB-539 (4.3 and 10 km down ice of mineralization, respectively) represent proximal and distal down ice samples, respectively, within the known glacial dispersal train. Previous work identified the ore mineral scheelite in the coarse (250–2000 µm) HMC fraction of till from each of these overlying and down ice sites [38,40,41,42].

3.2. Sample Processing

Sisson till samples were processed at Overburden Drilling Management Ltd. (ODM), Ottawa, Ontario, at the time of the initial GSC heavy mineral studies to recover >3.2 SG HMCs. Density concentration of samples was carried out using a combination of wet screening and shaking table, followed by heavy liquid separation (methyl iodide) at 3.2 SG, acid-washing, and ferromagnetic separation to produce a coarse (250–2000 µm), nonferromagnetic HMC (>3.2 SG) fraction. This coarse fraction was visually examined, and indicator minerals were counted, with results reported by McClenaghan et al. [40,41]. The archived by-product of sample processing was the nonferromagnetic, <250 µm HMC fraction that is the basis of our study.

3.3. Sieving

The <250 µm HMC fraction of each sample was too large to be mounted in its entirety, and the range of grain sizes within the samples was too great for the grains to be uniformly exposed in a polished section; therefore, the <250 µm HMC fraction was dry sieved into four smaller size fractions—185 to 250, 125 to 185, 64 to 125, and <64 µm—at the Queen’s Facility for Isotope Research (QFIR). The 64 to 125 µm fraction consists of very fine sand and the <64 µm fraction consists of silt- to clay-sized grains. The two coarsest fractions (125–185 and 185–250 µm) together represent the fine-sand fraction. The samples were sieved using single-use, nylon-screened sieves following the procedures developed by Lougheed et al. [13,43,44]. Sieving of the five Sisson samples produced 20 subsamples. The mass of each subsample and related fractions produced during processing at the QFIR, and analyzed in this study, is presented in Table 3.

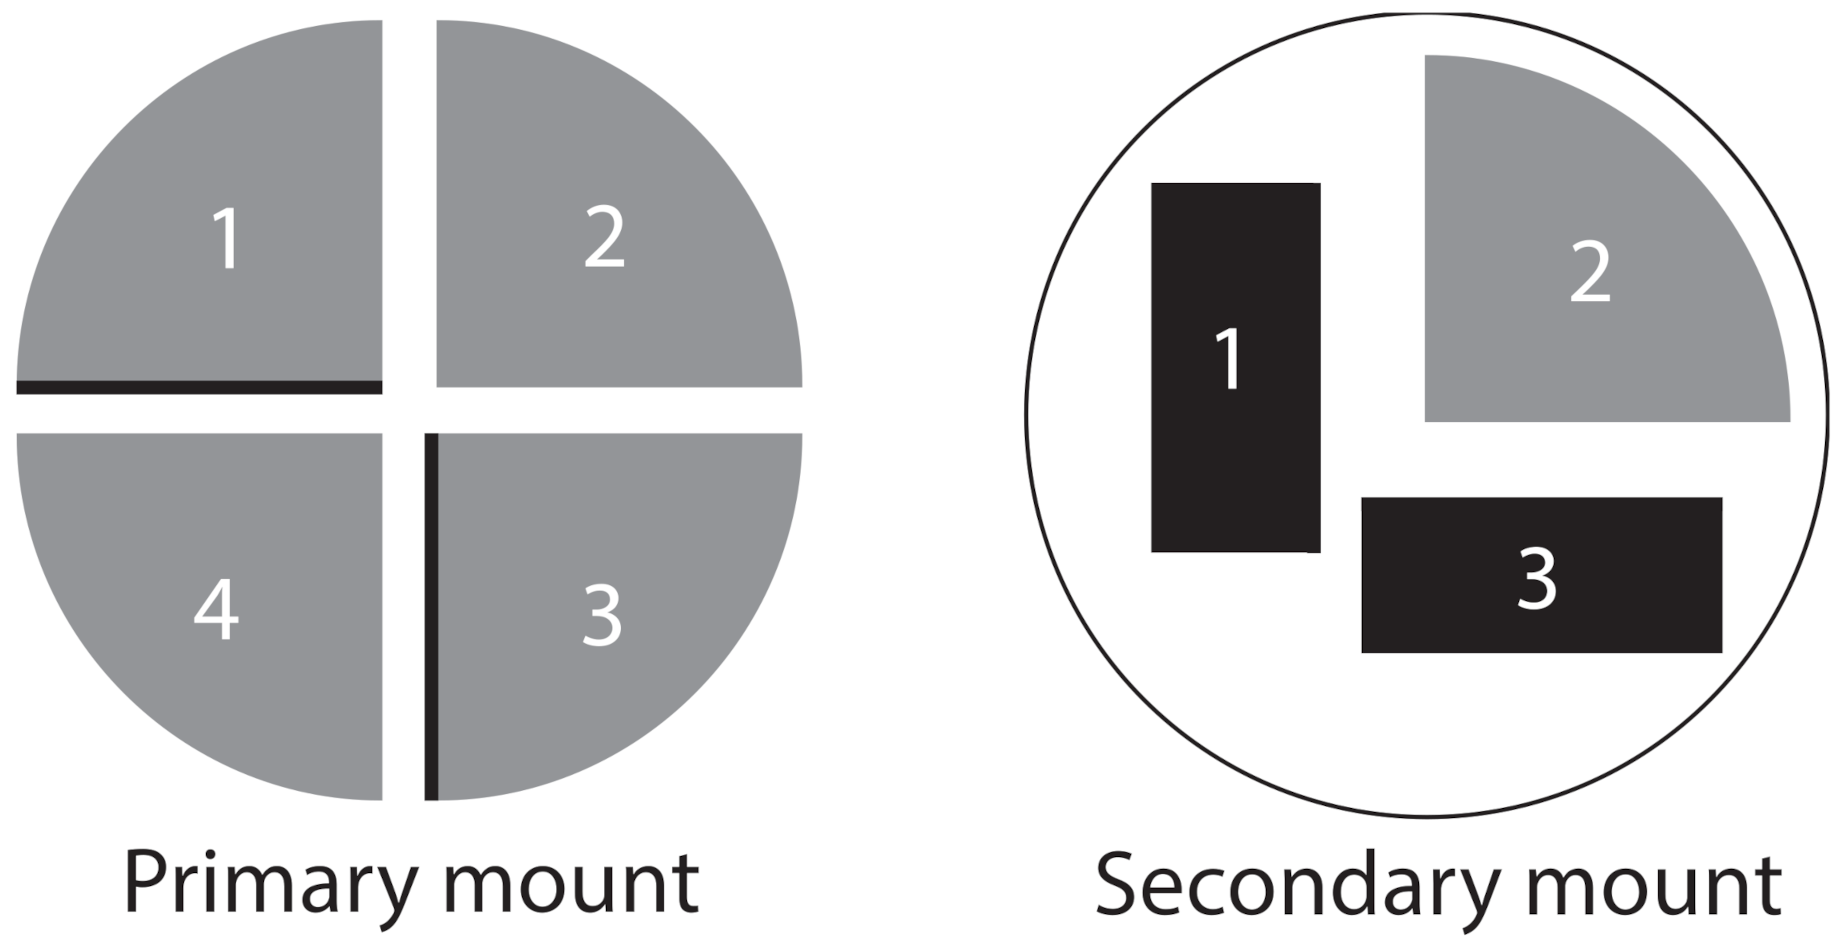
3.4. Epoxy Mounting of Mineral Grains

The grain-mounting methods used are based on those used by Lougheed et al. [13], who modified the methods of Blaskovich [45]. Following the method described in detail by Lougheed et al. [13], we mixed the entirety of each subsample with vacuum-evacuated epoxy, poured it into a 25 mm plastic ring mould, and allowed it to cure. Each primary mount was then vertically quartered, and one quarter was archived for future reference. The other three quarters were remounted together in a second plastic ring mould—one quarter with its base face down and the other two, diagonally opposite quarters from the primary mount, with one cut vertical facet face down (Figure 3)—and set with epoxy and cured for 12 h. Thus, a secondary epoxy mount containing one basal and two vertical sections was prepared for each subsample. This method was used to prepare 5 of 20 subsamples (the 185–250 µm HMC fractions) from the Sisson deposit.
After MLA of vertical and basal slabs of quartered epoxy mounts, Lougheed et al. [13] concluded that mounting a consistent mass of sample as a near-monolayer grain mount and using this basal surface for MLA is the optimal mounting method to determine the mineralogy of till HMCs. The ‘consistent mass’ method described in Lougheed et al. [13] was used to prepare 15 of the 20 subsamples (the <65, 65–125, and 125–185 µm fractions) of the Sisson deposit samples. Analysis of the five 185–250 µm Sisson deposit subsamples was limited to the one quarter of the basally mounted surface. These samples allowed comparison between the detection of indicator minerals using the entire basal surface of a mount (506.71 mm2) versus only one quarter (126.68 mm2) of that area.

3.5. Mineral Liberation Analysis and Electron Microprobe Methods

All sample mounts examined in this study were carbon-coated prior to MLA. Grain mounts were analyzed in a Field Electron and Ion Company (FEI) Thermo Scientific™ Quanta™ 650 field-emission gun environmental scanning electron microscope (Thermo Fisher Scientific, Waltham, MA, USA) equipped with dual EDS detectors operating under high vacuum at QFIR. Operating conditions included a beam current of 10 nA, an accelerating voltage of 25 kV, and a spot size of 6 µm. Backscattered electron image brightness and contrast were standardized to an Au imaging standard. Magnification was set to 250 × and each basal quarter contained between 75 and 210 frames for analysis, whereas each vertical section contained between 100 and 200 frames. Analysis of the one-quarter, basal surface slab (slab 2 in Figure 3) of each 185–250 µm fraction grain mount took between 35 min and 2.5 h. The basal quarter sections (slab 2 in Figure 3) contained between 5000 and 50,000 grains; this range reflects the exponential increase in the number of grains that can be mounted with decreasing grain size [13,46]. Scans of Sisson sample basal (whole) sections took between 3 and 4 h per sample, with each mount containing between 20,000 and 300,000 grains. Postprocessing data analysis was performed using MLA Image Processing and Dataview software (version 3.1.4.686, FEI, Hillsboro, OR, USA). Areas obscured by charging effects were removed from the false-color maps and each remaining grain was classified using a mineral reference library constructed from spectra from the FEI reference library and gathered over several years at QFIR.
Microprobe analysis of Bi-bearing mineral grains was carried out using a JEOL JXA-8230 electron microprobe (JEOL Ltd., Akishima, Tokyo, Japan) equipped with five two-crystal wavelength dispersive spectrometers and 1 energy dispersive spectrometer (SDD). Analysis was carried out with an accelerating potential of 15 kV, a beam current of 10 nA, and a beam diameter of 5 µm. Standards used were: hematite (Fe), galena (Pb), digenite (Cu), scheelite (W), loellingite (As), stibnite (Sb), bismuthinite (Bi, Te), synthetic ZnSe (Se), altaite (Te).

4. Results

Figure 4 charts the most abundant minerals identified in each size fraction of each sample, which together comprise 50% of the minerals present in the Sisson deposit samples. These include calcic amphibole, titanite, rutile, quartz, and biotite. Table 4 and Table 5 detail the abundance of key sulfide, ore and alteration indicator minerals at each site. Biotite, titanite, and Fe-oxide minerals are all present in greater proportional abundance in till from sites overlying and down ice of mineralization (11-MPB-505, 11-MPB-567, 11-MPB-525, and 11-MPB-539) than in up ice sample 11-MPB-520.

4.1. Ore Minerals

Scheelite is present in varying amounts in the <250 µm HMC fraction of samples overlying and down ice of mineralization at the Sisson deposit (Table 4, Figure 5), as liberated and composite grains. The proportion of liberated and composite scheelite grains varies between the size fractions of each sample with no obvious pattern (Table 6). No scheelite is identified in the <250 µm fraction of up ice sample 11-MPB-520. Scheelite is present in all size fractions examined in samples 11-MPB-505, 11-MPB-567, and 11-MPB-525. Scheelite is not present in the 185 to 250 µm fraction of sample 11-MPB-539, the most distal down ice sample, but is present in the three finer size fractions. The highest abundance of scheelite (10.416 normalized grains per 1000 grains) occurs in the <64 µm fraction of sample 11-MPB-567, which overlies zone III mineralization.
Wolframite is present in varying amounts in samples overlying and down ice of mineralization (Table 4, Figure 5), and it occurs as liberated and composite grains (Table 6). The proportion of liberated and composite wolframite grains varies between the size fractions of each sample with no obvious pattern (Table 6). Wolframite abundance is highest in samples 11-MPB-505 and 11-MPB-567 (0.025–0.291 normalized grains per 1000 grains). In down ice samples, wolframite abundance decreases with increasing distance from mineralization.
Molybdenite is only present in samples 11-MPB-505 and 11-MPB-567 (Table 4, Figure 5), where it occurs as liberated and composite grains (Table 6). In sample 11-MPB-505, overlying the Ellipse zone mineralization, molybdenite is only present in composite grains. In sample 11-MPB-567, overlying zone III mineralization, molybdenite is primarily present as liberated grains (73.74%–99.44% liberation), except for the 125–185 µm fraction (15% liberation). The abundance of molybdenite is very low (0.005 normalized grains per 1000 grains) in sample 11-MPB-505, and greater (0.145–0.422 normalized grains per 1000 grains) in sample 11-MPB-567.

4.2. Accessory Indicator Minerals

4.2.1. Bismuth Minerals

Several bismuth minerals (bismuthinite, bismutite, joseite, and native bismuth) were previously identified visually (and confirmed by SEM) in the 250–2000 µm HMC fraction of Sisson bedrock, till, and stream-sediment samples by McClenaghan et al. [21,38,40,42]. Of the five samples examined in this study, only sample 11-MPB-567 was reported by McClenaghan et al. [38] to contain bismuth minerals (2 grains/10 kg) in the 250 to 2000 µm HMC fraction. Bismuthinite, bismutite, and joseite were not contained in the QFIR MLA mineral reference library at the time of analysis, and therefore any minerals containing significant amounts of bismuth had a high likelihood of being classified simply as “Native Bismuth”, and this category is henceforth referred to as “bismuth-bearing minerals”.
Bismuth-bearing minerals are present in the <250 µm HMC fraction of all five till samples that we examined (Table 4) as liberated grains, composite grains, or both (Table 6). Bismuth minerals are only present in composite grains in the coarsest two size fractions (125–185 and 185–250 µm) that we examined, and discrete bismuth mineral grains (45.22%–89.35% liberation) are observed in the <64 and 64 to 125 µm size fractions. The bismuth-bearing minerals identified in the up ice sample (11-MPB-520) are only present as fully liberated grains. Bismuth abundance is highest in sample 11-MPB-567 (0.143–0.297 normalized grains per 1000 grains), which overlies zone III mineralization, with the exception of the 125 to 185 µm fraction of distal down ice sample 11-MPB-539 (0.356 normalized grains per 1000 grains). A minor amount of bismuth-bearing grains (0.017 normalized grains per 1000 grains) was identified in the <64 µm fraction of sample 11-MPB-520, the only fraction from that sample to contain bismuth minerals.
Analysis of bismuth-bearing grains using EMPA indicates that the grains are heterogenous mixtures of extremely fine-grained material of varying Bi content. One grain, from sample 11-MPB-567 collected overlying Zone III mineralization, was confirmed to be joseite-B (Bi4Te2S).

4.2.2. Sulfide Minerals

Chalcopyrite, arsenopyrite, sphalerite, pyrite, pyrrhotite, and galena were identified visually in the 250 to 2000 µm HMC fraction of bedrock, till, and stream-sediment samples from the Sisson deposit by McClenaghan et al. [21,38,40,42]. However, only chalcopyrite and pyrite were reported in the 250 to 2000 µm HMC fraction of the five till samples we examined in this study. The 250 to 500 µm fraction of till from sample 11-MPB-567 contained eight grains of chalcopyrite per 10 kg and 217 grains of pyrite per 10 kg, and the 500 to 2000 µm fraction contained two chalcopyrite grains per 10 kg. The 250–500 µm fraction of sample 11-MPB-505, overlying the Ellipse zone, contained one grain per 10 kg of chalcopyrite.
In our study, chalcopyrite abundance is highest (0.355 normalized grains per 1000 grains) in sample 11-MPB-567 (Table 5, Figure 6). Chalcopyrite abundance is lower (0.014–0.048 normalized grains per 1000 grains) in the proximal down ice sample (11-MPB-525) but increases (0.017–0.113 normalized grains per 1000 grains) in the distal down ice sample (11-MPB-539). Chalcopyrite abundance is 0.027 normalized grain per 1000 grains in the 125–185 µm fraction of up ice sample 11-MPB-520.
In our study, arsenopyrite was identified in the <250 µm fraction of all samples overlying and down ice of mineralization (Table 5, Figure 6). No arsenopyrite is identified in till up ice of mineralization (sample 11-MPB-520). Arsenopyrite abundance is highest in till from sample 11-MPB-567 (0.426 normalized grains per 1000 grains) and decreases in samples successively down ice (0.015–0.066 normalized grains per 1000 grains).
Pyrite was identified in the <250 µm fraction of all samples studied (Table 5, Figure 6). Pyrite abundance is highest (2.997–14.625 normalized grain per 1000 grains) in sample 11-MPB-567. The next highest abundance (0.092–0.507 normalized grains per 1000 grains) occurs in distal sample 11-MPB-539, followed by proximal till sample 11-MPB-525 (0.066–0.404 normalized grains per 1000 grains). The lowest abundance of pyrite (0.017–0.259 normalized grains per 1000 grains) was identified in up ice sample 11-MPB-520.
Pyrrhotite was identified in the <250 µm fraction of all samples studied (Table 5, Figure 6). Pyrrhotite abundance is highest (0.297–3.195 normalized grains per 1000 grains) in sample 11-MPB-567. The next highest abundance (0.133–0.893 normalized grains per 1000 grains) occurs in distal sample 11-MPB-539, followed by proximal till sample 11-MPB-525 (0.174–0.556 normalized grains per 1000 grains). The lowest abundance of pyrrhotite (0.066–0.117 normalized grains per 1000 grains) was identified in up ice till sample 11-MPB-520.
Sphalerite was identified in the <250 µm fraction of all samples studied (Table 5, Figure 6). Sphalerite abundance is highest (0.004–0.056 normalized grains per 1000 grains) in distal down ice sample 11-MPB-539 and occurs at 0.005 to 0.044 normalized grains per 1000 grains in fractions of the two samples overlying mineralization (11-MPB-505 and 11-MPB-567). Sphalerite was identified in one fraction (64–125 µm) of up ice sample 11-MPB-520 (0.047 normalized grains per 1000 grains).
Galena was identified in samples overlying mineralization and down ice of the deposit, and none was identified in the up ice background sample (Table 5, Figure 6). It is most abundant in sample 11-MPB-567 (0.172–0.555 normalized grains per 1000 grains), with the highest abundance observed in the less than 64 µm fraction. In the two down ice samples, galena is most abundant (0.152–0.169 normalized grains per 1000 grains) in the 185–250 µm fraction.
Sulfide minerals are primarily present as part of composite grains in all samples (Table 6), with the exception of sample 11-MPB-567, in which sulfide mineral liberation ranges between 0% and 98.27%. Discrete grains of galena are identified in the 185–250 µm fraction of both down ice samples, representing a transport distance of at least 10 km for liberated galena grains.

5. Conclusions

5.1. Ore Minerals

Scheelite is resistant to both physical and chemical weathering, and its presence in the coarse (250–2000 µm) fraction of till at Sisson was reported in all samples observed by this study. The presence of scheelite in the fine (<250 µm) fraction of till from these same samples was therefore expected. It is present in all samples and no conclusions can be drawn concerning the relative terminal transport distance of scheelite in these fractions. It should be noted that no scheelite is identified in the 185–250 µm fraction of till from the most distal sample site, 11-MPB-539. Scheelite grains are easily and rapidly identified in the coarse (250–2000 µm) fraction of till HMC using short-wave UV light, and therefore at the transport distance observed by this study of the <250 µm fraction does not offer any advantages in the quantification of scheelite over traditional optical sorting.
Wolframite was not identified in the coarse (250–2000 µm) fraction of till HMC of any of the samples observed by this study. Wolframite can be difficult to identify visually owing to its nondescript black color and lack of distinguishing physical characteristics. The identification of wolframite in the fine (<250 µm) fraction of till using MLA highlights a significant advantage of automated mineralogical methods over manual sorting. The abundance of both scheelite and wolframite decreases very little between the till samples overlying and 10 km down ice of mineralization, suggesting that (1) the high resistance to physical and chemical weathering of both these minerals leads to excellent retention in till and/or (2) there are unidentified regional sources of these minerals contributing grains to till.

5.2. Accessory Minerals

5.2.1. Sulfide Minerals

Chalcopyrite, arsenopyrite, pyrite, sphalerite, and galena were all previously identified in the coarse (250–2000 µm) fraction of till from Sisson, but only chalcopyrite and pyrite were identified in that fraction for the samples studied here. Pyrrhotite was not previously identified in any till samples, likely because discrete grains are removed from the HMC by paramagnetic separation during the concentration process. Previous maximum sulfide grain glacial dispersal was 2.5 km for chalcopyrite and 5 km for pyrite, and all other sulfide minerals were only identified in samples collected overlying mineralization [42].
This study identified all of the above-mentioned sulfide minerals in the <250 µm fraction of each sample analyzed (Table 5), and Table 6 illustrates that these sulfide minerals are predominantly present as components of composite grains. The exception to this is sample 11-MPB-567, collected overlying Zone III mineralization in which sulfide grain liberation ranges between 13.13%–98.27%, likely reflecting the presence of un- and lightly-weathered sulfide grains in the till. The ability to quantify inclusions exposed by polishing proves to be effective at extending the detectable dispersal train of sulfide minerals to at least 10 km down ice of the deposit (Figure 6). This adds to the work by Lougheed et al. [13] on the Izok Lake volcanogenic massive sulfide deposit, confirming that sulfide detection is enhanced by analyzing till sourced from both massive sulfide and vein-hosted mineralization using automated mineralogy methods. Increased detection distance of sulfide inclusions presents a larger exploration target for regional exploration programs, whereas the variation in the degree of sulfide mineral liberation serves to refine larger targets towards their mineralized source.
Pyrite was detected in up ice sample 11-MPB-520. Pyrite commonly found in unmineralized terranes, and Figure 6 demonstrates that pyrite abundance in down ice till samples is comparable to the values up ice, and therefore pyrite abundance alone is a poor exploration tool in a regional context. Pyrite grains located in samples collected immediately overlying mineralization are found to be intergrown with pyrrhotite, arsenopyrite, and chalcopyrite, indicating that they are related to mineralization, but these associations are not identified in grains analyzed from the down ice till samples. Sources containing anomalous pyrite abundance (above regional background) will still be observable in MLA results due to the demonstrated precision of the technique when detecting fine sulfide inclusions, but anomalous pyrite abundance will need to be identified in conjunction with other indicator minerals to be significant in an exploration context.

5.2.2. Bismuth Minerals

Bismuth-bearing minerals are a good indicator of late-stage hydrothermal fluid flow, such as that that formed the Sisson deposit, owing to the low temperature of precipitation for native bismuth and related Bi-bearing minerals [46]. Thus, the presence of Bi-bearing minerals in till represents a potential exploration target regardless of the specific composition of the Bi-bearing mineral. The attempts to identify the precise mineralogy of the Bi-bearing minerals in the <250 µm fraction of till HMC did not yield reliable results as the “grains” were primarily composed of extremely fine-grained heterogenous mixtures. The one exception to this was a grain of joseite-B (Bi4Te2S) identified in the <64 µm fraction of sample 11-MPB-567, overlying zone III mineralization. Joseite was previously identified in bedrock samples from the Sisson deposit [42].
The MLA classification algorithm will place grains containing major-element concentrations of bismuth into the “Native Bismuth” category, as the presence of the bismuth peak will heavily influence the similarity of the spectra to the native bismuth reference, which only contains the detectable bismuth energy peaks. The mineral reference library entry for “Native Bismuth” could be re-categorized as “Bi-bearing Mineral”, becoming a catch-all for minerals where bismuth is a large portion of the composition. The ability to control the specificity of mineral composition that is recognized by the mineral reference library is a strength of automated mineralogical techniques but highlights the necessity for library construction tailored to the needs of each project. If elements of interest are known for a particular project, sparse phase liberation (SPL) analysis can also be utilized to perform rapid runs that only analyze grains containing user-defined concentrations of user-defined elements.

5.3. Unknown Minerals

When MLA encounters a mineral spectrum that does not match any reference spectra contained in the mineral reference library within the user-specified tolerance level, it is designated as “Unknown”. Unknown minerals are assigned a false color in the grain map, and they can be sorted and viewed as a group. The unknown mineral content (area %) in the <250 µm fraction till HMC from Sisson was high (1%–2.8% or 100–150 grains per 1000 grains, Figure 4) compared to the standard acceptable number used by the QFIR (<1%). When these unknown grains are organized and viewed as a group in MLA it is evident that they are predominantly one homogenous population that displays, consisting complex exsolution intergrowth textures. Examination of these grains using EDS indicates that they are ilmenite and another Fe-bearing oxide phase. Complex intergrowth textures are difficult to analyze with MLA and the increased time necessary to effectively separate the two (or more) minerals into the appropriate bins would be prohibitive for a project such as this, particularly when neither mineral is of interest for exploration. In the scope of this study, this large number of unknown grains of similar physical appearance is acceptable. Unknown grains should be evaluated on a project-by-project basis with particular attention paid to differentiating mineral phases that represent true unknowns from unknown phases resulting from textural effects.

5.4. Variation in Sulfide Mineral Abundance

A previous study by Lougheed et al. [13] utilized automated mineralogy on a similar size fraction of till HMC from down ice of the Izok Lake Zn-Pb-Cu VMS deposit in Nunavut, Canada. Given that the Izok Lake deposit is a massive sulfide deposit and the sulfide minerals at Sisson are predominantly vein-hosted, it could be expected that the relative abundance of sulfide grains in till from Izok Lake would be higher than that observed in till from Sisson. However, normalized indicator mineral counts for sulfides are higher in the Sisson samples than in those collected down ice of Izok Lake [13].
The differences in sulfide mineral species and abundances identified in till overlying the Izok Lake and Sisson mineralization can be explained by the differences between each deposit: (1) nature of the mineralization; (2) sample proximity to mineralization; (3) the grade of mineralization that subcropped and was exposed to glacial erosion; (4) the areal extent of subcropping mineralization; (5) till thickness; (6) preglacial weathering of bedrock and post-glacial weathering of till; and (7) complexity of ice flow directions.
The highest abundance of sulfide minerals observed are in till samples collected directly overlying mineralization at Sisson (sample 11-MPB-567). This sample contains the greatest abundance of chalcopyrite (0.9579 grains per 1000 total grains, 185–250 µm fraction), pyrite (15.8808 grains per 1000 total grains, 185–250 µm fraction), and galena (0.5547 grains per 1000 total grains, <64 µm fraction). Sphalerite is the exception, with the highest abundance observed in proximal till sample 09-MPB-058 from Izok Lake (8.09 grains per 1000 total grains, 185–250 µm fraction). This difference in sphalerite counts between deposits is due to sphalerite being the main ore mineral in the Izok Lake deposit and only an accessory mineral in the Sisson deposit.
The geometry of glacial dispersal trains varies and is dictated by the directions of ice flow in multiple generations of glaciation, the interaction between till and uneroded subsurface, and mixing between multiple generations of till [47]. At Izok Lake, the indicator mineral dispersal train is a palimpsest fan-shaped pattern produced by two ice flow events that trended NW and SW of the deposit [48]. Although the Sisson region has undergone several glacial events, the dispersal train has predominantly been shaped by SE flow during the Early Wisconsinan (with some possible minor reworking in the Middle to Late Wisconsinan) resulting in a narrow dispersal train that extends to the SE of the deposit [33]. The indicator minerals in till down ice of Izok Lake deposit have been spread over a greater area, which likely influenced the comparative concentration of indicator minerals in till. Furthermore, the greater number of transport events may have resulted in grains from Izok Lake being subjected to increased physical weathering when compared to till from Sisson, further reducing the preservation of soft or brittle sulfide mineral grains.

5.5. Exploration Applications of Automated Mineralogy

Commercial heavy mineral laboratories typically offer multi-commodity optical indicator mineral identification for about $350/sample (Averill pers. comm). Costs for automated mineral identification for individual samples, including epoxy mounting, polishing, MLA and data analysis are typically in the range of $500–$1000/sample, depending on the specifics of each project. The increased relative cost of automated mineralogical analysis precludes it from replacing optical sorting outright, but the method does allow for more precise and sensitive analysis of till HMC samples. The analysis of polished sections provides the benefit of revealing all minerals, including those present as inclusions in other grains, which is a significant advantage in the detection of sulfide grains [13].
Samples benefit from increased precision using automated mineralogy due to the increased precision in counting minerals present in relatively high abundance (epidote, Fe-oxide) or commonly mistaken for other minerals [13]. For example, thousands to tens of thousands of epidote grains are present in <250 µm grain mounts prepared for this study [13]. The time to count all of these grains manually in the >250 µm fraction is prohibitive; instead they are typically estimated to within ± 10% [9]. Automated mineralogy enables a user to rapidly generate precise counts, to the grain, a vast improvement over the 100–1000 grain precision using visual estimation techniques. Automated mineralogy further benefits from increased sensitivity; the ability to detect inclusions of sulfides in other grains, which are usually transported farther down ice than discrete sulfide grains based on the work of this study and that of Lougheed et al. [13]. Increased precision and sensitivity can help in regional-scale surveys, where the reduced sample numbers reduce overall cost, and also in targeted local surveys, where the increased cost is warranted to better define the geometry of the dispersal train and refine targeting. The modal mineralogy identified using MLA better represents the established pathfinder element suite (W, Mo, As, Bi, Cu, F, Pb, and Sn) than the mineralogy described using visual sorting by including arsenopyrite (As) and galena (Pb) to a greater distance down ice.

5.6. Recommendations for Future Applications

Polished grain mounts prepared from <250 µm HMC present >100,000 grains for analysis, and an important benefit of automated mineralogical methods like MLA is the generation of a false-color grain map that can be queried and reorganized by mineral, grain shape, or grain size. This organizational capability represents a powerful tool for research and exploration as grains of interest can be rapidly located, inspected, and bookmarked for revisiting at a later date. Further, these grains serve as targets for other diagnostic tools (e.g., EMPA, laser ablation inductively coupled plasma mass spectrometry (LA-ICPMS)).
The coordinate reference system used by MLA is centered on the microscope stage, and not the individual grain mount, and therefore the x and y coordinates assigned to each mineral grain are not directly transferrable to another analytical instruments. If several points (at least three) can be identified in both the MLA coordinate system and the corresponding coordinate system on the other analytical instrument, a translation algorithm can be applied to convert the MLA coordinate system to the target coordinate system [49]. The addition of several easily located and identifiable reference points to each epoxy grain mount greatly facilitates the process of translation between coordinate reference systems. These reference points can be dense (e.g., copper bead) markers embedded into the epoxy of each grain mount, easily located in BSE due to their high brightness. There is the potential for these embedded markers to be disturbed during the epoxy evacuation process as the escaping air bubbles cause the epoxy to froth and redistribute the sediment grains along the bottom surface. Reference points can also be etched onto the surface of each mount following polishing. The most accurate method would be to use a laser to etch the smallest point possible and a larger, more easily located laser etching immediately alongside the smaller one. This method, although accurate, is time consuming and requires expensive equipment. A simpler, cheaper method would be to etch marks along the edge of each mount with a diamond scribe or similar instrument and use the tip of each etching as a reference point.
Another important consideration is the establishment of “rotational North” for each mount. This can be accomplished by etching the side or top of each grain mount and ensuring alignment between this mark and the known “North” for each instrument the sample is loaded into. Ensuring that each grain mount is prepared with these known reference points will enable the use of MLA grain maps as powerful targeting tools for other analytical techniques and instruments. This targeting utility is particularly well-suited to application with the SPL analysis settings within MLA. SPL runs only perform EDS analysis on grains that register above a user-established greyscale value, or grains containing a defined elemental peak of interest. These runs are more targeted and are therefore faster and less expensive than the whole-surface XBSE runs employed by this study.

6. Conclusions and Future Research

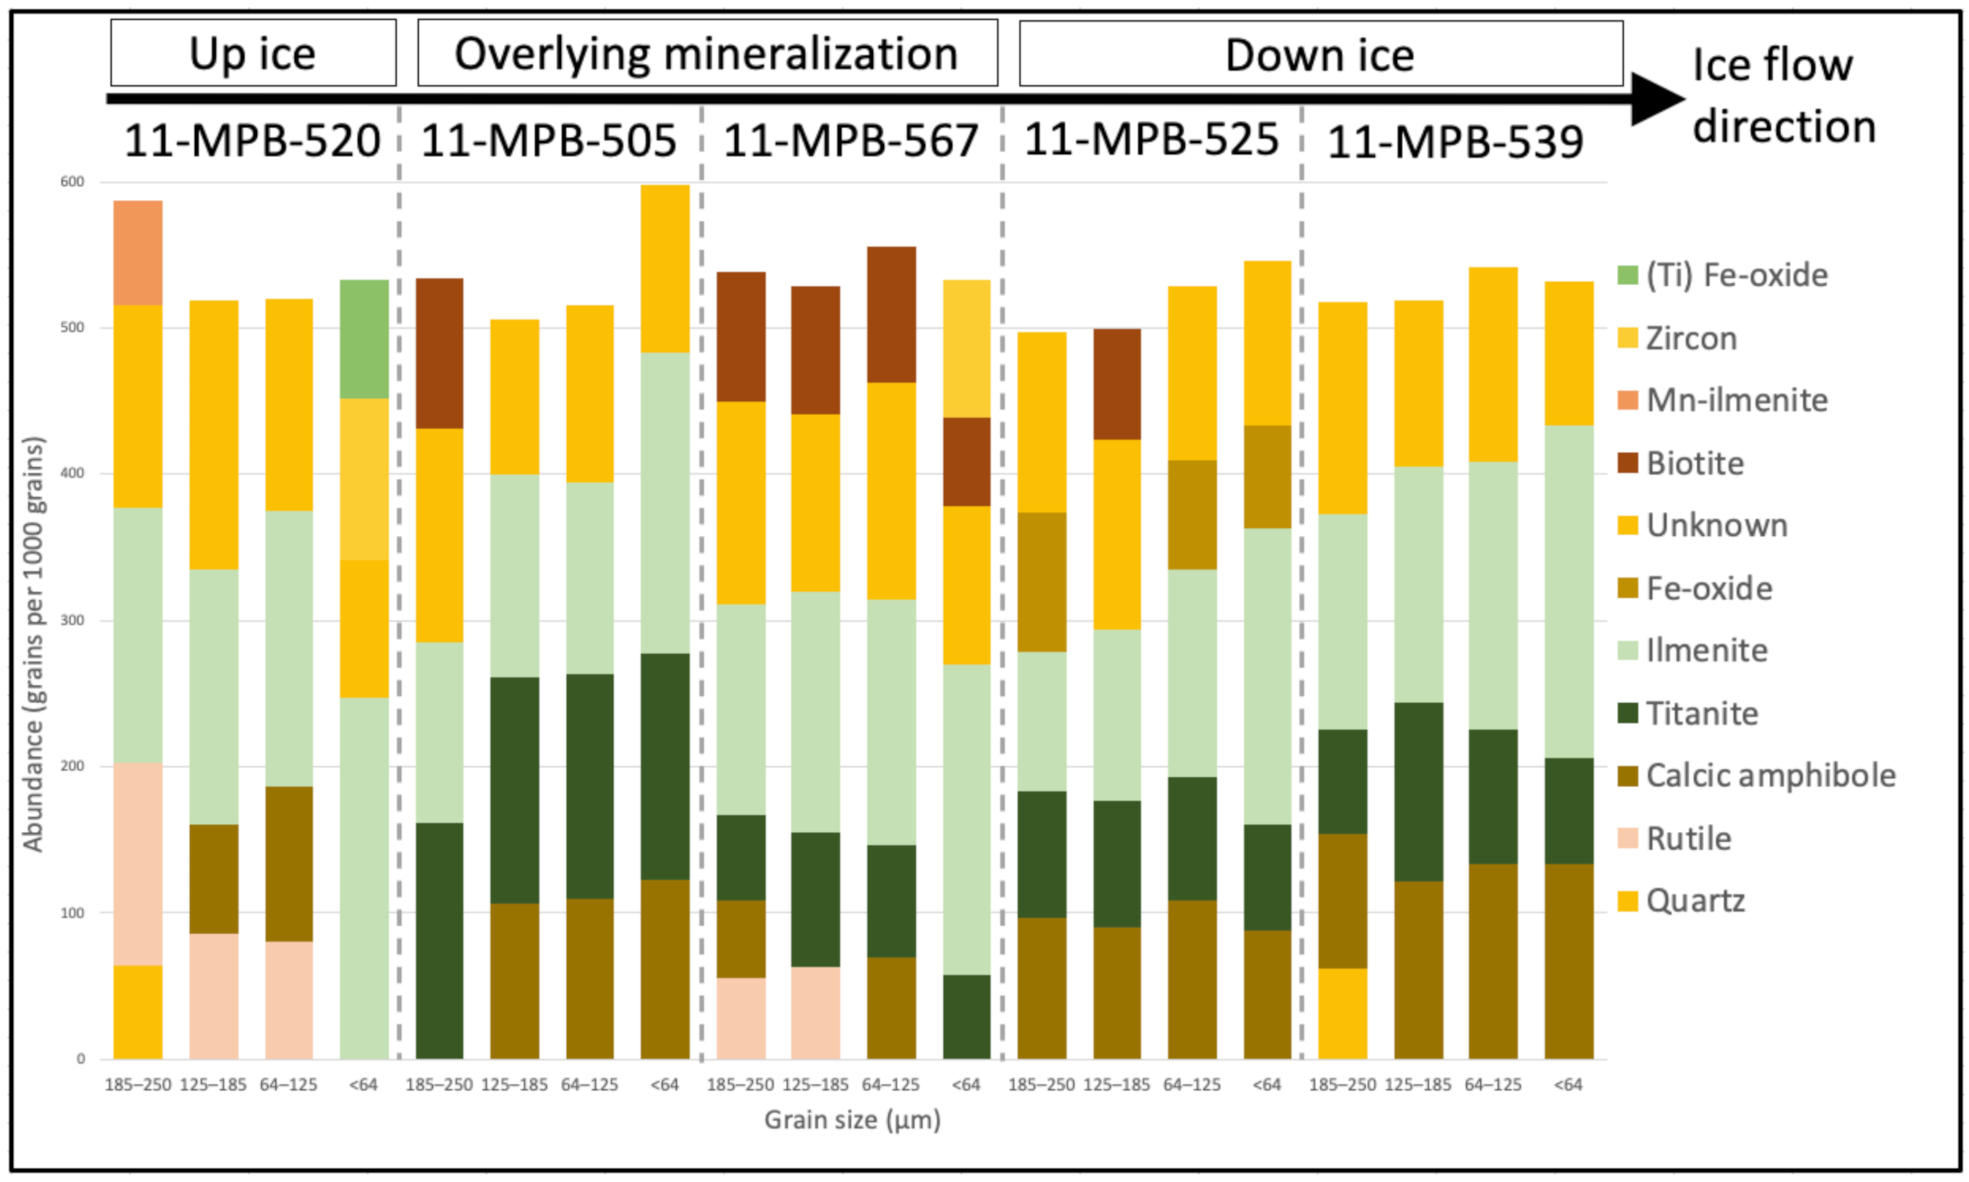
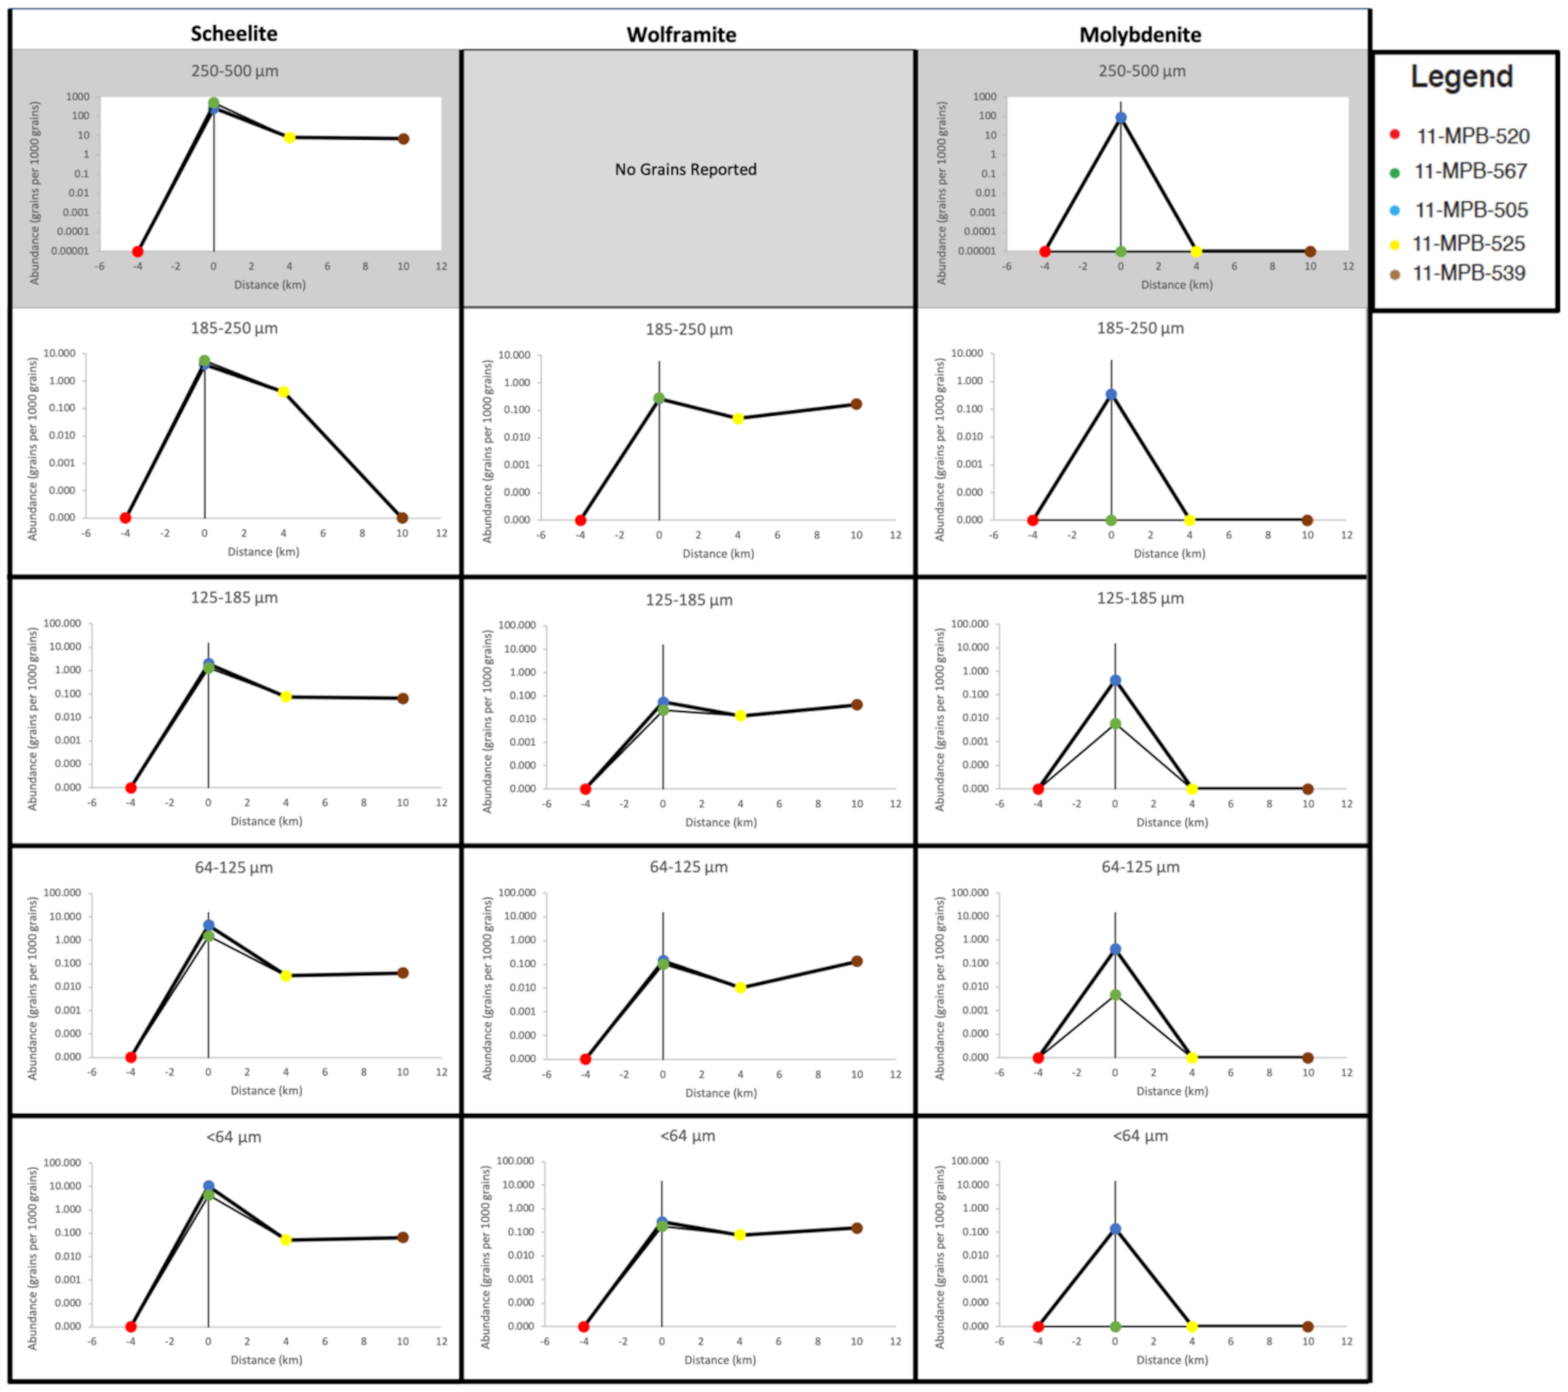
  • All indicator minerals previously identified in the coarse (>250 µm) fraction of till by visual sorting are identified in the <250 µm fraction using MLA, many to a greater distance down ice of mineralization than in the coarse fraction. The ore mineral wolframite, previously only identified immediately overlying mineralization, is identified up to 10 km down ice of mineralization.
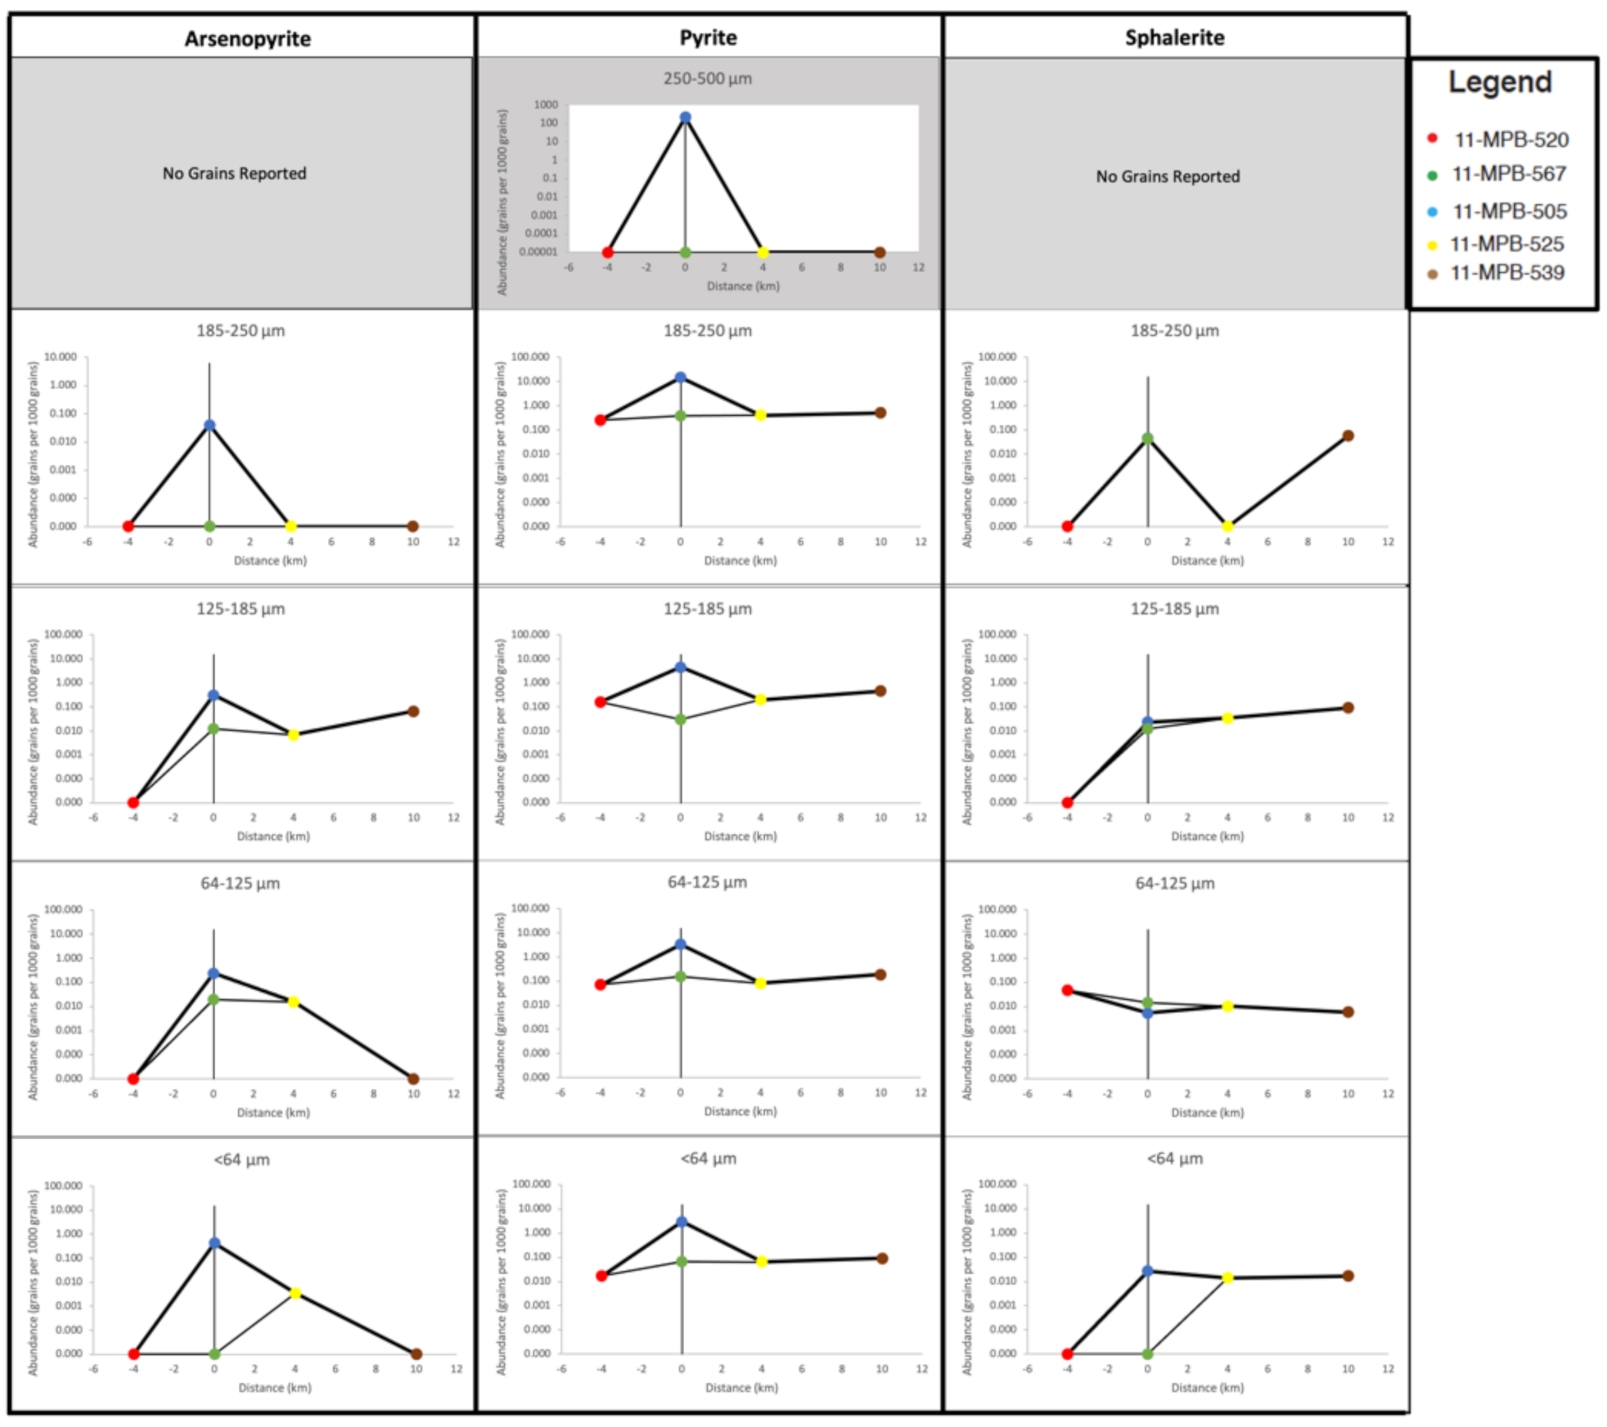
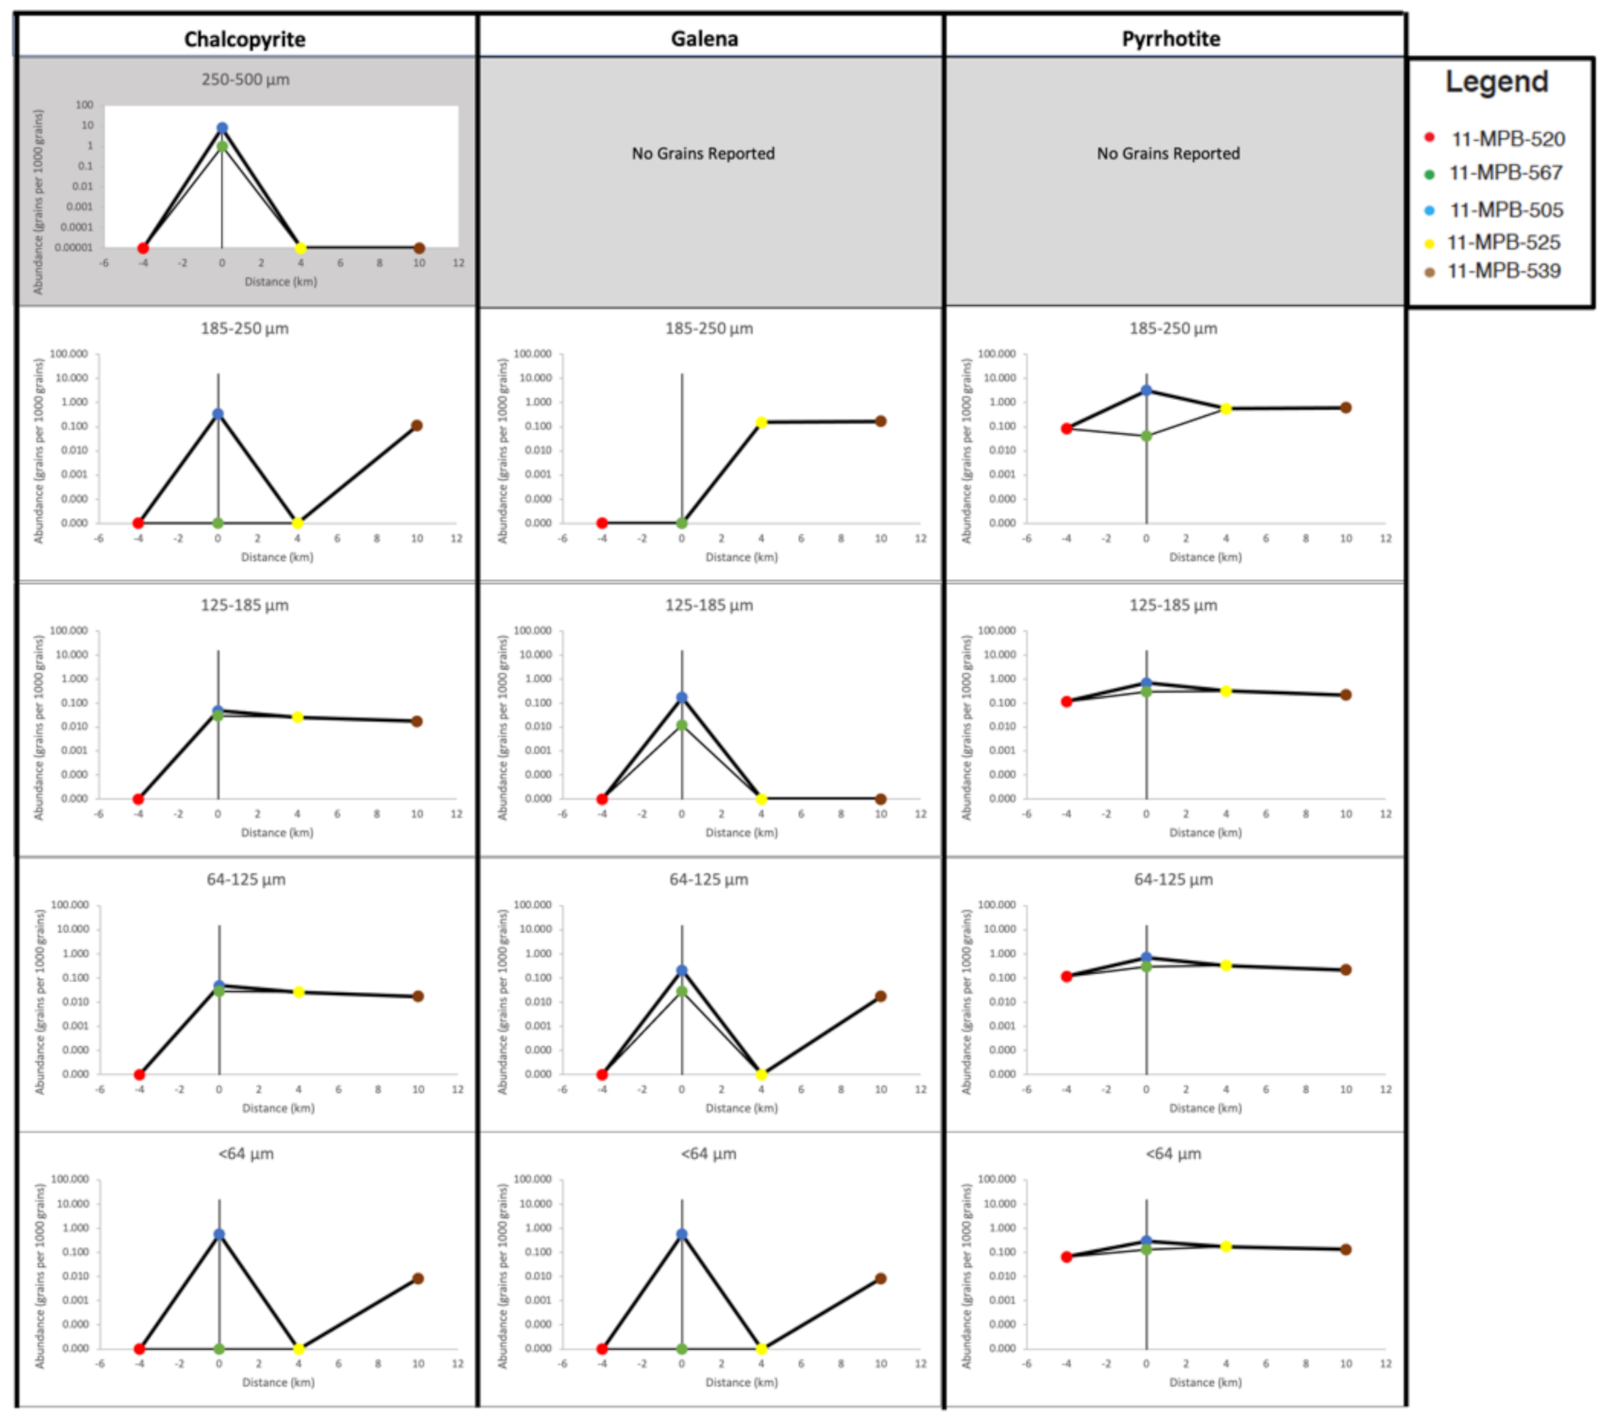
  • Sulfide minerals are primarily present in down ice samples as inclusions in composite grains, highlighting the utility of analyzing polished surfaces for identifying minerals that are poorly preserved as discrete grains. The increased ratio of liberated to composite sulfide grains increases in the immediate vicinity of mineralization, serving as a potential tool for refining exploration targets.
  • The indicator mineral suite identified using MLA contains more minerals that better define the pathfinder element suite for the Sisson deposit than previous work, at a greater distance down ice of mineralization. Arsenopyrite (As), previously only identified overlying mineralization, is present in all down ice till samples analyzed. Galena (Pb) was not previously identified in any till samples but was identified in the fine fraction of each till sample observed by this study. A more complete representation of established pathfinder element suites can facilitate the identification of dispersal trains for a wide range of deposit types and commodities using indicator mineralogy.
  • Automated mineralogy can rapidly identify targets for additional examination using other analytical instruments, but care must be taken to ensure reference points are included during grain mount preparation to ensure simple and accurate translation of MLA coordinates to other instrument coordinate systems.
  • Automated mineralogy can identify populations of grains containing an element of interest, via targeted SPL analysis or by the inclusion of a mineral reference library entry containing only peaks for that element. Bi-bearing minerals were successfully identified in all samples down ice of mineralization using the inclusion of a native bismuth reference library entry, and follow-up EMPA analysis did not identify the minerals present, as most of the grains are a heterogenous mixture of extremely fine-grained minerals. In this case, gathering these grains together into a “Bi-bearing” category, rather than identifying each mineral species present, is the most practical for exploration purposes.

Author Contributions

Conceptualization, H.D.L., M.B.M., and D.L.-M.; methodology, H.D.L., D.L.-M., and A.N.D.; software, H.D.L. and A.N.D.; validation, D.L.-M., M.B.M., and M.I.L.; formal analysis, H.D.L.; investigation, H.D.L.; resources, M.B.M.; data curation, H.D.L.; writing—original draft preparation, H.D.L.; writing—review and editing, H.D.L., D.L.-M., M.B.M., and M.I.L.; visualization, H.D.L.; supervision, D.L.-M., M.B.M., and M.I.L.; project administration, H.D.L.; funding acquisition, D.L.-M. and M.B.M. All authors have read and agreed to the published version of the manuscript.

Funding

This research was funded by the Geological Survey of Canada through its Targeted Geoscience Initiative.

Institutional Review Board Statement

Not applicable.

Informed Consent Statement

Not applicable.

Data Availability Statement

The data generated by this project represent multiple files @ 100’s of GB each and are not practical to share/distribute.

Acknowledgments

The authors would like to thank Brian Joy for performing EMPA analysis, Jan Peter for careful edits of an early version of the manuscript.

Conflicts of Interest

The authors declare no conflict of interest.

References

  1. McClenaghan, M.B.; Kjarsgaard, B.A. Indicator mineral and surficial geochemical exploration methods for kimberlite in glaciated terrain: Examples from Canada. In Mineral Deposits of Canada: A Synthesis of Major Deposit-Types, District Metallogeny, the Evolution of Geological Provinces, and Exploration Methods; Goodfellow, W.D., Ed.; Special Publication No. 5; Geological Association of Canada, Mineral Deposits Division: St. John’s, NL, Canada, 2007; pp. 983–1006. [Google Scholar]
  2. Averill, S.A.; Zimmerman, J.R. The riddle resolved—The discovery of the Partridge Gold Zone using sonic drilling in glacial overburden at Waddy Lake, Saskatchewan. In CIM Bulletin; Canadian Institute of Mining, Metallurgy and Petroleum: Westmount, QC, Canada, 1984; Volume 77, p. 88. [Google Scholar]
  3. Averill, S.A. The application of heavy indicator mineralogy in mineral exploration with emphasis on base metal indicators in glaciated metamorphic and plutonic terrains. Geol. Soc. Spec. Publ. 2001, 185, 69–81. [Google Scholar] [CrossRef]
  4. Averill, S.A. Discovery and delineation of the Rainy River Gold Deposit using glacially dispersed gold grains sampled by deep overburden drilling: A 20 year odyssey. In New Frontiers for Exploration in Glaciated Terrain; Paulen, R.C., McClenaghan, M.B., Eds.; Open File 7374; Geological Survey of Canada: Ottawa, ON, Canada, 2013; pp. 37–46. [Google Scholar]
  5. Averill, S.A. The Blackwater gold-spessartine-pyrolusite dispersal trains, British Columbia, Canada: Influence of sampling depth on indicator mineralogy and geochemistry. Geochem. Explor. Environ. Anal. 2017, 17, 43–60. [Google Scholar] [CrossRef]
  6. McClenaghan, M.B.; Cabri, L.J. Review of gold and platinum group element (PGE) indicator minerals methods for surficial sediment sampling. Geochem. Explor. Environ. Anal. 2011, 11, 251–263. [Google Scholar] [CrossRef]
  7. Hashmi, S.; Ward, B.C.; Plouffe, A.; Leybourne, M.I.; Ferbey, T. Geochemical and mineralogical dispersal in till from the Mount Polley Cu-Au porphyry deposit, central British Columbia, Canada. Geochem. Explor. Environ. Anal. 2015, 15, 234–249. [Google Scholar] [CrossRef]
  8. Kelley, K.D.; Eppinger, R.G.; Lang, J.; Smith, S.M.; Fey, D.L. Porphyry Cu indicator minerals in till as an exploration tool: Example from the giant Pebble porphyry Cu-Au-Mo deposit, Alaska, USA. Geochem. Explor. Environ. Anal. 2011, 11, 321–334. [Google Scholar] [CrossRef]
  9. Plouffe, A.; Ferbey, T.; Hashmi, S.; Ward, B.C. Till geochemistry and mineralogy: Vectoring towards Cu porphyry deposits in British Columbia, Canada. Geochem. Explor. Environ. Anal. 2016, 16, 213–232. [Google Scholar] [CrossRef]
  10. Averill, S.A. Viable indicator minerals in surficial sediments for two major base metal deposit types: Ni-Cu-PGE and porphyry Cu. Geochem. Explor. Environ. Anal. 2011, 11, 279–291. [Google Scholar] [CrossRef]
  11. McClenaghan, M.B.; Paulen, R.C. Application of Till Mineralogy and Geochemistry to Mineral Exploration. In Past Glacial Environments, 2nd ed.; Menzies, J., Van der Meer, J., Eds.; Elsevier: Amsterdam, The Netherlands, 2018; pp. 689–751. [Google Scholar]
  12. McClenaghan, M.B.; Paulen, R.C.; Layton-Matthews, D.; Hicken, A.K.; Averill, S.A. Glacial dispersal of gahnite from the Izok Lake Zn-Cu-Pb-Ag VMS deposit, northern Canada. Geochem. Explor. Environ. Anal. 2015, 15, 333–349. [Google Scholar] [CrossRef]
  13. Lougheed, H.D.; McClenaghan, M.B.; Layton-Matthews, D.; Leybourne, M. Exploration Potential of Fine-Fraction Heavy Mineral Concentrates from Till Using Automated Mineralogy: A Case Study from the Izok Lake Cu–Zn–Pb–Ag VMS Deposit, Nunavut, Canada. Minerals 2020, 10, 310. [Google Scholar] [CrossRef] [Green Version]
  14. Plouffe, A.; McClenaghan, M.B.; Paulen, R.C.; McMartin, I.; Campbell, J.E.; Spirito, W.A. Processing of unconsolidated glacial sediments for the recovery of indicator minerals: Protocols used at the Geological Survey of Canada. Geochem. Explor. Environ. Anal. 2013, 13, 303–313. [Google Scholar] [CrossRef]
  15. DiLabio, R.N.W. Glacial dispersal trains. In Glacial Indicator Tracing; Kujansuu, R., Saarnisto, M., Eds.; AA Balkema: Rotterdam, The Netherlands, 1990; pp. 109–122. [Google Scholar]
  16. Layton-Matthews, D.; Hamilton, C.; McClenaghan, M.B. Mineral chemistry: Modern techniques and applications to exploration. In Application of Indicator Mineral Methods to Mineral Exploration; McClenaghan, M.B., Plouffe, A., Layton-Matthews, D., Eds.; Open File 7553; Geological Survey of Canada: Ottawa, ON, Canada, 2014; pp. 9–18. [Google Scholar]
  17. McClenaghan, M.B. Overview of common processing methods for recovery of indicator minerals from sediment and bedrock in mineral exploration. Geochem. Explor. Environ. Anal. 2011, 11, 265–278. [Google Scholar] [CrossRef]
  18. Layton-Matthews, D.; Hamilton, C.; McClenaghan, M. Modern techniques and applications of mineral chemistry to exploration. In Application of Indicator Mineral Methods to Bedrock and Sediments; McClenaghan, M., Layton-Matthews, D., Eds.; Open File 8345; Geological Survey of Canada: Ottawa, ON, Canada, 2017; pp. 10–24. [Google Scholar]
  19. Lehtonen, M.; Lahaye, Y.; O’Brien, H.; Lukkari, S.; Marmo, J.; Sarala, P. Novel Technologies for Indicator Mineral-Based Exploration; Geological Survey of Finland: Espoo, Finland, 2015; Volume 57, pp. 23–62. [Google Scholar]
  20. Fyffe, L.R.; Thorne, K.; Dunning, G.R.; Martin, D.A. U-Pb Geochronology of the Sisson Brook Granite Porphyry, York County, West-Central New Brunswick; Minerals, Policy, and Planning Division, New Brunswick Department of Natural Resources: Fredericton, NB, Canada, 2007; pp. 35–54. [Google Scholar]
  21. Fyffe, L.R.; Pajari Jr, G.E.; Cherry, M.E. The Acadian Plutonic Rocks of New Brunswick: Maritime Sediments and Atlantic Geology, v. 17; GeoRef: McLean, VA, USA, 1981. [Google Scholar]
  22. Fyffe, L.R.; Thorne, K.G. Polymetallic Deposits of Sisson Brook and Mount Pleasant, New Brunswick, Canada; Lands, Minerals and Petroleum Division, New Brunswick Department of Natural Resources: Fredericton, NB, Canada, 2010. [Google Scholar]
  23. Van Staal, C.R. Dunnage and Gander zones, New Brunswick: Canadian Appalachian Region; Guidebook 91-2; Minerals, Policy, and Planning Division, New Brunswick Natural Resources and Energy: Fredericton, NB, Canada, 1991. [Google Scholar]
  24. Zhang, W.; Lentz, D.R.; Thorne, K.G.; McFarlane, C.R.M. Mineralogical, petrological, and petrogenetic analysis of felsic intrusive rocks at the Sisson Brook W-Mo-Cu deposit, west-central New Brunswick. Acta Geol. Sin. (English edition) 2013, 87, 831–834. [Google Scholar]
  25. Mann, R. Report on Diamond Drilling at Sisson Brook; Unpublished Company Report; Kidd Creek Mines Ltd.: Fredericton, NB, Canada, 1980; pp. 1–36. [Google Scholar]
  26. Nast, H.J. The Geology and Petrochemistry of the Sisson Brook W-Cu-Mo Deposit. Ph.D. Thesis, McGill University, Montreal, NB, Canada, August 1985. [Google Scholar]
  27. Nast, H.J.; Williams-Jones, A.E. The role of water-rock interaction and fluid evolution in forming the porphyry-related Sisson Brook W-Cu-Mo deposit, New Brunswick. Econ. Geol. 1991, 86, 302–317. [Google Scholar] [CrossRef]
  28. Thorne, K.G.; Fyffe, L.R.; Creaser, R.A. Re-Os Geochronological Constraints on the W-Mo Mineralizing Event in the Mount Pleasant Caldera Complex: Implications for the Timing of Subvolcanic Magmatism and Caldera Development; Atlantic Geology: New Wolfville, NS, Canada, 2013. [Google Scholar]
  29. Zhang, W.; Lentz, D.R.; Thorne, K.G.; McFarlane, C. Geochemical characteristics of biotite from felsic intrusive rocks around the Sisson Brook W–Mo–Cu deposit, west-central New Brunswick: An indicator of halogen and oxygen fugacity of magmatic systems. Ore Geol. Rev. 2016, 77, 82–96. [Google Scholar] [CrossRef] [Green Version]
  30. Rennie, D.W.; Friedman, D.; Gray, J.; Bolu, M.; Pozder, S.; Greskovich, G. Canadian National Instrument 43-101 Technical Report on the Sisson Project; NI 43-101 Technical Report; Northcliff Resources: Vancouver, BC, Canada, 2013. [Google Scholar]
  31. Seaman, A.A.; McCoy, S.M.; Martin, G.L. Multiple Wisconsinan tills in the Sisson Brook exploration trench of Geodex Minerals Ltd., York County, west-central New Brunswick. In Geological Investigations in New Brunswick for 2007; Martin, G.L., Ed.; Minerals, Policy, and Planning Division, New Brunswick Department of Natural Resources: Fredericton, NB, Canada, 2007; pp. 1–34. [Google Scholar]
  32. Stea, R.R.; Seaman, A.A.; Pronk, T.; Parkhill, M.A.; Allard, S.; Utting, D. The Appalachian Glacier Complex in Maritime Canada. In Developments in Quaternary Sciences; Elsevier: Amsterdam, The Netherlands, 2011; Volume 15, pp. 631–659. [Google Scholar]
  33. Snow, R.J.; Coker, W.B. Overburden geochemistry related to W-Cu-Mo mineralization at Sisson Brook, New Brunswick, Canada: An example of short-and long-distance glacial dispersal. J. Geochem. Explor. 1987, 28, 353–368. [Google Scholar] [CrossRef]
  34. Lamothe, M. Pleistocene Stratigraphy and Till Geochemistry of the Miramichi Zone, New Brunswick; Bulletin No. 433; Geological Survey of Canada, Energy, Mines and Resources: Ottawa, ON, Canada, 1992. [Google Scholar]
  35. Seaman, A.A. Follow up Till Geochemistry, Coldstream (NTS21J/06) Map Area and Part of the Adjacent Napadogan (NTS 21J/07) Map Area, York and Carleton Counties; Open File 2003-11; New Brunswick Department of Natural Resources: Fredericton, NB, Canada, 2003; p. 103. [Google Scholar]
  36. McClenaghan, M.B.; Parkhill, M.A.; Seaman, A.A.; Pronk, A.G.; Pyne, M.; Rice, J.M.; Hashmi, S. Till Geochemical Signatures of the Sisson W-Mo Deposit; Open File 7430; Geological Survey of Canada: Ottawa, ON, Canada; Fredericton, NB, Canada, 2013. [Google Scholar]
  37. McClenaghan, M.B.; Parkhill, M.A.; Averill, S.A.; Pronk, A.G.; Seaman, A.A.; Boldon, R.; McCurdy, M.W.; Rice, J.M. Indicator Mineral Abundance Data for Bedrock, Till, and Stream Sediment Samples from the Sisson W-Mo Deposit; Open File 7386; Geological Survey of Canada: Ottawa, ON, Canada; Fredericton, NB, Canada, 2013. [Google Scholar]
  38. McClenaghan, M.B.; Seaman, A.A.; Parkhill, M.A.; Pronk, A.G. Till geochemical signatures associated with the Sisson W-Mo deposit, New Brunswick, Canada. Atl. Geol. 2014, 50, 116–137. [Google Scholar] [CrossRef] [Green Version]
  39. McClenaghan, M.B.; Parkhill, M.A.; Pronk, A.G.; Seaman, A.A.; McCurdy, M.W.; Poulin, R.S.; McDonald, A.M.; Kontak, D.J.; Leybourne, M.I. Till, stream sediment, and stream water geochmemical signatures of intrusion-hosted Sn-W deposits; examples from the Sisson W-Mo and Mount Pleasant Sn-W-Mo-Bi-In deposits, New Brunswick. In TGI-4 Intrusion Related Mineralization Project: New Vectors to Buried Porphyry-Style Mineralisation; Rogers, N., Ed.; Open File 7843; Geological Survey of Canada: Ottawa, ON, Canada, 2015. [Google Scholar]
  40. McClenaghan, M.B.; Parkhill, M.A.; Pronk, A.G.; Seaman, A.A.; McCurdy, M.W.; Boldon, R.; Leybourne, M.I.; Rice, J.M. Geochemical and Indicator Mineral Data for Stream Sediments and Water Around the Sisson W-Mo Deposit, New Brunswick, (NTS 21-J/06, 21-J/07); Open File 7756; Geological Survey of Canada: Ottawa, ON, Canada, 2015. [Google Scholar]
  41. McClenaghan, M.B.; Parkhill, M.A.; Pronk, A.G.; Seaman, A.A.; McCurdy, M.W.; Leybourne, M.I. Indicator mineral and geochemical signatures associated with the Sisson W–Mo deposit, New Brunswick, Canada. Geochem. Explor. Environ. Anal. 2017, 17, 297–313. [Google Scholar] [CrossRef]
  42. McClenaghan, M.B.; Parkhill, M.A.; Seaman, A.A.; Pronk, A.G.; Averill, S.; Rice, J.M.; Pyne, M. Indicator Mineral Signatures of the Sisson W-Mo Deposit, New Brunswick: Part 2 Till; Open File 7467; Geological Survey of Canada: Ottawa, ON, Canada, 2014. [Google Scholar]
  43. Lougheed, H.D.; McClenaghan, M.B.; Layton-Matthews, D. Mineral markers of base metal mineralization: Progress report on the identification of indicator minerals in the fine heavy mineral fraction. In Targeted Geoscience Initiative: 2017 Report of Activities; Rogers, N., Ed.; Open File 8373; Geological Survey of Canada: Ottawa, ON, Canada, 2018; Volume 2, pp. 101–108. [Google Scholar]
  44. Lougheed, H.D.; McClenaghan, M.B.; Layton-Matthews, D.; Leybourne, M.I. Evaluation of Single-Use Nylon Screened Sieves for Use with Fine-Grained Sediment Samples; Open File 8613; Geological Survey of Canada: Ottawa, ON, Canada, 2019; p. 14. [Google Scholar]
  45. Blaskovich, R.J. Characterizing Waste Rock Using Automated Quantitative Electron Microscopy. Master’s Thesis, University of British Columbia, Vancouver, BC, Canada, 2013. [Google Scholar]
  46. Lide, D.R. CRC Handbook of Chemistry and Physics: A Ready-Reference Book for Chemical and Physical Data; CRC Press: Boca Raton, FL, USA, 2004. [Google Scholar]
  47. Klassen, R.A. Glacial history and ice flow dynamics applied to drift prospecting and geochemical exploration. In Proceedings of the Exploration 97: Fourth Decennial International Conference on Mineral Exploration, Toronto, ON, Canada, 14–18 September 1997; pp. 221–232. [Google Scholar]
  48. Paulen, R.C.; McClenaghan, M.B.; Hicken, A.K. Regional and local ice-flow history in the vicinity of the Izok Lake Zn–Cu–Pb–Ag deposit, Nunavut. Can. J. Earth Sci. 2013, 50, 1209–1222. [Google Scholar] [CrossRef]
  49. Nittler, L.R. Quantitative Isotopic Ratio Ion Imaging and Its Application to Studies of Preserved Stardust in Meteorites. Ph.D. Thesis, Washington University, Saint Louis, MO, USA, 1996. [Google Scholar]
Figure 1. Location of the five studied till samples (yellow dots) and the geology surrounding the Sisson granite-hosted W-Mo deposit, New Brunswick. Red dots indicate location of till samples collected by the Geological Society of Canada in 2011 [20]. Modified from McClenaghan et al. [21].
Minerals 11 00103 g001
Figure 2. Simplified geological map of the Sisson deposit, displaying the zones of mineralization and associated contacts. Modified from Rennie et al. [30].
Minerals 11 00103 g002
Figure 3. Mounting schematic displaying the basal surface of the two mounting stages. The primary grain mount was quartered, and three quarters were reoriented and made into a second mount to display one basal surface and two cross-sectional surfaces for analysis. Cross-sectional surfaces are indicated in black.
Minerals 11 00103 g003
Figure 4. Mineral abundance (normalized to grains per 1000 grains) for the most abundant minerals comprising 50% of the less than 250 µm fraction of till heavy-mineral concentrates, for the 185 to 250, 125 to 185, 64 to 125, and less than 64 µm fractions of five till samples from the Sisson granite-hosted W-Mo deposit, New Brunswick. Labels above denote the position of each sample relative to massive sulfide mineralization, and the black arrow denotes the direction of ice flow. Sample locations relative to mineralization: 11-MPB-520: 4 km up ice; 11-MPB-567 and 11-MPB-505: overlying mineralization; 11-MPB-525: 4 km down ice; 11-MPB-539: 10 km down ice.
Minerals 11 00103 g004
Figure 5. Grain abundance (normalized to grains per 1000 grains) of key ore minerals in the 185 to 250, 125 to 185, 64 to 125, and less than 64 µm heavy-mineral concentrate (HMC) fractions (mineral liberation analysis; this study) of five samples from the Sisson deposit, New Brunswick (log-scaled, y-axis). The x-axis of each is a scaled representation in the direction of ice flow (black arrow). The location of mineralization is denoted by a grey line, and two trendlines depict the inferred decay in indicator mineral abundance along the dispersal train extending from the deposit, taking into account the two separate paths across mineralization (samples 11-MPB-505 and 11-MPB-567).
Minerals 11 00103 g005
Figure 6. Grain abundance (normalized to grains per 1000 grains) of key sulfide indicator minerals in the 185 to 250, 125 to 185, 64 to 125, and less than 64 µm heavy-mineral concentrate (HMC) fractions (mineral liberation analysis; this study) of five samples from the Sisson deposit, New Brunswick (log-scaled, y-axis). The x-axis of each is a scaled representation in the direction of ice flow (black arrow). The location of mineralization is denoted by a grey line, and two trendlines depict the inferred decay in indicator mineral abundance along the dispersal train extending from the deposit, taking into account the two separate paths across mineralization (samples 11-MPB-505 and 11-MPB-567).
Minerals 11 00103 g006aMinerals 11 00103 g006b
Table 1. Hydrothermal features associated with the mineralization at Sisson and the associated indicator minerals for each. Features are listed in order of decreasing age within each type, with the exception of calc-silicate alteration for which no age has been established.
Hydrothermal FeaturesTypeScheeliteWolframiteMolybdeniteChalcopyritePyritePyrrhotiteArsenopyriteGalenaSphaleriteBi-Minerals
Early sodic-calcic alterationAlterationXXXXminorminorXXXX
Early Biotite and biotite-sulphide alterationAlterationXXXXXXXX
Calc-silicate alterationAlterationXXXminorXXXX
Quartz-scheeliteVeinXminorXminorminorXXXX
Quartz-molybdenite/quartz-feldsparVeinXXXXXX
Quartz shear and sulphide-richVeinXX
CarbonateVeinminorXXXXXXXX
Table 2. Potential indicator minerals of the Sisson W-Mo deposit, as reported by McClenaghan et al. [21] and this study. Yellow shaded “possible” minerals could potentially be present as part of the “Bi-mineral” population identified by MLA.
MineralFormulaSpecific GravityHardnessPreviously Reported in BedrockPreviously Reported in Till HMCPreviously Reported in Stream HMCReported in Till HMC by This Study
ScheeliteCaWO45.9–6.14–5YesYesYesYes
Wolframite(Fe,Mn)WO47.1–7.54.5YesYesYesYes
MolybdeniteMoS25.51YesYesYesYes
PyriteFeS256.5YesYesYesYes
ChalcopyriteCuFeS24.1–4.33.5YesYesYesYes
Sphalerite(Zn,Fe)S3.9–4.23.5–4YesYesYesYes
GalenaPbS7.2–7.62.5YesYesNoYes
PyrrhotiteFe(1−x)S (x = 0–0.17)4.6–4.73.5–4YesNoNoYes
ArsenopyriteFeAsS6.15YesYesYesYes
BismuthiniteBi2S36.8–7.22NoYesNoPossible
BismutiteBi2(CO3)O274NoYesNoPossible
Native BiBi9.7–9.82–2.5YesYesNoPossible
JoseiteBi3(S,Te)38.12NoYesNoYes
Table 3. Sample processing weights indicating the individual mass of each size fraction following sieving of the <250 µm HMC.
SampleFraction (mm)Weight (g)Total (g)
11-MPB-5050.185–0.2504.79931.66
0.125–0.1857.902
0.064–0.12514.329
<0.0644.63
11-MPB-5200.185–0.2501.6910.356
0.125–0.1852.909
0.064–0.1254.282
<0.0641.475
11-MPB-5250.185–0.2504.5637.412
0.125–0.1859.537
0.064–0.12516.265
<0.0647.05
11-MPB-5390.185–0.2503.7723.056
0.125–0.1855.734
0.064–0.1259.837
<0.0643.715
11-MPB-5670.185–0.2502.69212.483
0.125–0.1853.779
0.064–0.1254.821
<0.0641.191
Table 4. Abundance of alteration- and ore-related indicator minerals in five till sample up- and down ice of the Sisson W-Mo deposit. Mineral abundance data are reported in two ways: (1) number of indicator mineral grains per total grains, normalized to 1000 grains; (2) minerals by 2-dimensional percentage area they take up on the polished mount surface. Also included are grain counts from the coarse (250 to 500 µm) heavy mineral fraction of the same sample obtained by visual grain picking that have been normalized to a 10 kg of sample mass (data from McClenaghan et al. [42]).
ScheeliteWolframiteMolybdeniteBismuth Minerals
Sample NumberDistance from MineralizationSize Fraction (µm)Grain Count (Norm.)Proportion (Area %)Grain Count (Norm.)Proportion (Area %)Grain Count (Norm.)Proportion (Area %)Grain Count (Norm.)Proportion (Area %)
11-MPB-520Up ice background185–2500.0000.000.0000.000.0000.000.0000.00
125–1850.0000.000.0000.000.0000.000.0000.00
64–1250.0000.000.0000.000.0000.000.0000.00
<640.0000.000.0000.000.0000.000.0170.00
250–500 *0NA0NA0NA0NA
11-MPB-505Ellipse overlying185–2505.5702.010.2910.020.0000.000.0420.00
125–1851.3120.560.0250.020.0060.000.0290.00
64–1251.5340.370.1000.010.0050.000.0330.00
<644.1850.500.1830.030.0000.000.0670.00
250–500 *515NA0NA0NA0NA
11-MPB-567Zone III overlying185–2504.0821.600.2660.050.3550.100.0000.00
125–1851.9521.190.0550.020.4220.170.2970.00
64–1254.3161.220.1430.030.4070.100.1430.00
<6410.4161.340.2810.030.1450.020.2030.02
250–500 *261NA0NA87NA2NA
11-MPB-5254 km down ice185–2500.4040.080.0500.070.0000.000.0000.00
125–1850.0760.020.0140.010.0000.000.1240.00
64–1250.0310.000.0100.000.0000.000.0820.00
<640.0520.000.0760.010.0000.000.0760.01
250–500 *8NA0NA0NA0NA
11-MPB-53910 km down ice185–2500.0000.000.1690.100.0000.000.0000.00
125–1850.0660.010.0410.030.0000.000.3550.01
64–1250.0400.000.1330.020.0000.000.0460.00
<640.0670.000.1540.020.0000.000.0750.00
250–500 *7NA0NA0NA0NA
* McClenaghan et al. [42]. NA: not applicable, Norm.: normalized.
Table 5. Abundance of ore indicator minerals in five till sample up- and down ice of the Sisson W-Mo deposit. Mineral abundance data are reported in two ways: (1) number of indicator mineral grains per total grains, normalized to 1000 grains; (2) minerals by 2-dimensional percentage area they take up on the polished mount surface. Also included are grain counts from the coarse (250 to 500 µm) heavy mineral fraction of the same sample obtained by visual grain picking that have been normalized to a 10 kg of sample mass (data from McClenaghan et al. [42]).
ArsenopyritePyriteSphaleriteChalcopyriteGalenaPyrrhotite
Sample NumberDistance from MineralizationSize Fraction (µm)Grain Count (Norm.)Proportion (Area %)Grain Count (Norm.)Proportion (Area %)Grain Count (Norm.)Proportion (Area %)Grain Count (Norm.)Proportion (Area %)Grain Count (Norm.)Proportion (Area %)Grain Count (Norm.)Proportion (Area %)
11-MPB-520Up ice background185–2500.0000.000.2590.010.0000.000.0000.000.0000.000.0860.00
125–1850.0000.000.1610.000.0000.000.0270.000.0000.000.1070.00
64–1250.0000.000.0700.000.0470.000.0000.000.0000.000.1170.00
<640.0000.000.0170.000.0000.000.0000.000.0000.000.0660.00
250–500 *0NA0NA0NA0NA0NA0NA
11-MPB-505Ellipse overlying185–2500.0000.000.3740.000.0420.000.0000.000.0000.000.0420.00
125–1850.0120.000.0310.000.0120.000.0060.000.0120.000.5150.00
64–1250.0190.000.1520.000.0140.000.0290.000.0280.000.2990.00
<640.0000.000.0670.000.0170.000.0000.000.0000.000.1330.00
250–500 *0NA0NA0NA1NA0NA0NA
11-MPB-567Zone III overlying185–2500.0400.1814.6250.940.0440.000.3550.010.0000.003.1950.02
125–1850.3120.124.6070.390.0230.000.1640.020.1720.022.5850.02
64–1250.2380.053.3020.310.0050.000.0480.000.2110.040.6970.01
<640.4260.052.9970.320.0160.000.0270.000.5550.060.2970.01
250–500 *0NA217NA0NA8NA0NA0NA
11-MPB-5254 km down ice185–2500.0000.000.4040.000.0000.000.0000.000.1510.000.5560.00
125–1850.0070.010.2000.000.0350.000.0480.000.0000.000.4630.01
64–1250.0150.000.0820.000.0100.000.0260.000.0000.000.3230.00
<640.0030.000.0660.000.0070.000.0140.000.0000.000.1740.00
250–500 *0NA0NA0NA0NA0NA0NA
11-MPB-53910 km down ice185–2500.0000.000.5070.010.0560.000.1130.000.1690.000.6190.00
125–1850.0660.000.4550.000.0910.000.0910.000.0000.000.8930.00
64–1250.0000.000.1850.000.0060.000.0170.000.0170.000.2190.00
<640.0000.000.0920.000.0040.000.0170.000.0080.000.1330.00
250–500 *0NA0NA0NA0NA0NA0NA
* McClenaghan et al. [42]. NA: not applicable, Norm.: normalized.
Table 6. The proportion (area per cent) of ore and sulfide minerals in till samples from the Sisson deposit, New Brunswick, present as either liberated grains or as a component of a composite particle.
Size Fraction (µm)ArsenopyriteChalcopyriteGalenaPyriteSphaleritePyrrhotiteScheeliteWolframiteMolybdeniteMolybdenite
Sample NumberDistance from MineralizationLiberated (Area %)Composite Area (%)Liberated (Area %)Composite Area (%)Liberated (Area %)Composite Area (%)Liberated (Area %)Composite Area (%)Liberated (Area %)Composite Area (%)Liberated (Area %)Composite Area (%)Liberated (Area %)Composite Area (%)Liberated (Area %)Composite Area (%)Liberated (Area %)Composite Area (%)Liberated (Area %)Composite Area (%)
11-MPB-520Up ice background185–2500.000.000.00100.000.000.000.00100.000.000.000.00100.000.000.000.000.000.000.000.000.00
125–1850.000.000.00100.000.000.000.00100.000.000.000.00100.000.000.000.000.000.000.000.000.00
64–1250.000.000.000.000.000.000.00100.000.00100.000.00100.000.000.000.000.000.000.000.000.00
<640.000.000.000.000.000.000.00100.000.000.000.00100.000.000.000.000.000.000.00100.000.00
11-MPB-505Ellipse overlying185–2500.000.000.000.000.000.000.00100.000.00100.000.00100.0098.081.927.3392.670.000.000.00100.00
125–1850.00100.000.00100.000.00100.000.00100.000.00100.000.00100.0059.9740.030.2699.740.00100.000.00100.00
64–1250.00100.000.00100.000.00100.000.00100.000.00100.000.00100.0045.5854.4217.4782.530.00100.000.00100.00
<640.000.000.000.000.000.000.00100.000.00100.000.00100.0097.522.4889.9410.060.000.000.00100.00
11-MPB-567Zone III overlying185–2500.3099.700.00100.000.000.0013.1386.870.00100.000.00100.0078.8321.1767.2332.7799.440.560.000.00
125–18549.1250.8865.6934.3152.4447.5623.5776.430.00100.000.00100.0064.3935.6127.5172.4915.8584.150.00100.00
64–12573.8526.1554.8945.1127.9672.0442.3557.650.00100.000.00100.0089.4410.5677.8122.1973.7426.2638.7361.27
<6485.6714.3396.573.4358.3641.6465.8334.1798.271.7361.6138.3982.2217.7877.9622.0474.6625.3463.3036.70
11-MPB-5254 km down ice185–2500.000.000.000.0051.4348.570.00100.000.000.000.00100.0095.824.180.00100.000.000.000.000.00
125–1850.00100.000.00100.000.000.000.00100.000.00100.000.00100.0055.0344.97100.000.000.000.000.00100.00
64–1250.00100.000.00100.000.000.000.00100.000.00100.0064.2135.7987.0712.9331.2668.740.000.000.00100.00
<640.00100.000.00100.000.000.000.00100.000.00100.000.00100.0052.3347.6733.5466.460.000.0045.2254.78
11-MPB-53910 km down ice185–2500.000.000.00100.0011.2988.710.00100.000.00100.000.5299.480.000.0085.3914.610.000.000.000.00
125–1850.00100.000.00100.000.000.003.5496.460.00100.0010.1089.9055.2744.7333.6566.350.000.000.00100.00
64–1250.000.000.00100.000.00100.000.00100.000.00100.0014.3885.6296.463.5466.5733.430.000.0089.3510.65
<640.000.000.00100.000.00100.0047.1352.870.00100.0048.2051.8094.875.1383.1016.900.000.0068.1431.86
Publisher’s Note: MDPI stays neutral with regard to jurisdictional claims in published maps and institutional affiliations.

