Article

Strain Localization at Constant Strain Rate and Changing Stress Conditions: Implications for Plate Boundary Processes in the Upper Mantle

1
Department of Geology and Geophysics, Texas A&M University, College Station, TX 77843, USA
2
School of Geosciences, The University of Sydney, Sydney, NSW 2006, Australia
3
Department of Geoscience, University of Wisconsin-Madison, Madison, WI 53706, USA
4
Department of Earth Sciences, Vrije Universiteit Amsterdam, 1081 HV Amsterdam, The Netherlands
5
Department of Earth Sciences, Utrecht University, 3508 TC Utrecht, The Netherlands
*
Author to whom correspondence should be addressed.
Minerals 2021, 11(12), 1351; https://doi.org/10.3390/min11121351
Submission received: 19 September 2021 / Revised: 24 November 2021 / Accepted: 24 November 2021 / Published: 30 November 2021

Abstract

:
We present results from a natural deformed shear zone in the Turon de Técouère massif of the French Pyrenees that directly addresses the processes involved in strain localization, a topic that has been investigated for the last 40 years by structural geologists. Paleopiezometry indicates that differential stresses are variable both spatially across the zone, and temporally during exhumation. We have, however, also calculated strain rate, which remains constant despite changes in stress. This result appears to be at odds with recent experimental deformation on monophase (olivine) rocks, which indicate that strain localization occurs dominantly as a result of constant stress. We hypothesize that in the Turon de Técouère massif—and many natural shear zones—strain localization occurs as a result of reactions, which decrease the grain size and promote the activation of grain size sensitive deformation mechanisms. From a tectonics perspective, this study indicates that the deformation rate in a particular plate boundary is relatively uniform. Stress, however, varies to accommodate this deformation. This viewpoint is consistent with deformation at a plate boundary, but it is not the typical way in which we interpret strain localization.

1. Introduction

Shear zones localize deformation, particularly at high temperatures and at deeper lithospheric levels. Despite the extensive research on shear zones, open questions remain regarding the causes of strain localization. There are a variety of dynamic intrinsic and extrinsic factors that could lead strain to localize in shear zones. Intrinsic factors—which are often interrelated—include: (1) grain-size reduction [1,2,3,4]; (2) organization, growth, and interconnection of a weak phase [5,6,7]; (3) development of anisotropy that facilitates movement [8,9,10]; (4) reactions associated with mineralogical changes [11,12]; and (5) shear heating [13,14]. These intrinsic factors can act in tandem and there is evidence that all of them can occur in specific places. Extrinsic factors for strain localization include: (1) propagation of brittle earthquakes into the ductile realm [15,16,17,18]; (2) deformation associated with continued focused displacements along plate margins [19,20]; (3) magmatism and/or fluid flux through a shear zone [21,22]; and (4) material heterogeneities that occur on a large scale relative to the shearing, such that deformation localizes on the edge of rigid domains [9,23].
The application of experimental deformation to understand natural deformation has been extremely successful, providing the basic constraints of quantitative rock rheology. This approach, however, has some limitations when attempting to understand strain localization. Monomineralic rocks, particularly those consisting of olivine [24], do not often exhibit strain localization. Experiments that occurred under constant strain rate exhibited homogenous deformation [25]. Further, although laboratory experiments of monomineralic olivine did not show any evidence of localization under constant strain rate conditions, they could localize strain under constant stress [26]. This inference—of no localization under constant strain rate conditions—needs to be tested in naturally deformed rocks, which are usually polymineralic and heterogeneous.
In this contribution, we analyze strain localization in the Turon de Técouère ultramafic massif, located in the French portion of the Pyrenees Mountains. This ultramafic massif was affected by extension along a Cretaceous plate boundary, as constrained by new 40Ar/39Ar data on amphibole presented in this contribution, prior to being uplifted during Late Cretaceous–Miocene Pyrenean orogeny. We provide rheological constraints from a strain gradient preserved across the ultramafic massif, and at a range of temperature conditions. Our results indicate that deformation in olivine-rich rocks can localize at constant strain rate and varying stress conditions. Strain localization is imposed by displacement along the plate boundary and is dominantly facilitated by preexisting rock heterogeneities and reactions. This finding challenges models for strain localization along plate boundaries that assume constant stress conditions or are based solely on intrinsic mechanisms.

2. Geological Background

2.1. Pyrenees

The Pyrenees mountains record the Late Cretaceous-Miocene collision of the Iberian Peninsula with the European continent; the orographic expression continues westward as the Cantabrian mountains (Figure 1A). The deep crustal structure is well characterized through a series of NS-oriented seismic studies, spaced out in an EW arrangement, that were conducted about 30 years ago [27,28]. From these studies, the Iberian peninsula is interpreted to have subducted below the European lithosphere [29,30,31,32,33,34] (Figure 1B). The lack of a fully developed subduction system below the European side suggests that only a small oceanic basin existed between the two sides, although other workers have used mantle tomography to suggest a larger ocean basin existed and the subducting slab has become detached [35]. Either interpretation is consistent with plate reconstructions, depending on what approach is used [34,36,37,38]. Contractional deformation in the Pyrenees appears to have proceeded in two distinct pulses [39], in part recognized by the sedimentation patterns both in Spain [40,41] and France, and the adjacent Aquitaine Basin [42,43]. The first phase of contraction occurred in the Late Cretaceous (Campanian-Maastrichtian) whereas the second phase started in the Eocene and continued through the Miocene, with a time of relative stability during the Paleocene [39].
Hyperextension of the lithosphere between the Iberian Peninsula and the European continent is inferred to have resulted in the extreme thinning of continental crust, formation of oceanic lithosphere, and deformation of that oceanic lithosphere [34,45,46,47,48,49]. This extension occurred prior to Pyrenean contraction that started in the Late Cretaceous. The peridotites of the Pyrenees are interpreted as exposed parts of the mantle lithosphere that were exhumed as a result of extensional shearing. These mantle sections are interpreted to have been exhumed locally to the base of the seafloor during the Cretaceous [47,50], although the mantle is locally overlain by highly extended and deformed lower continental crust [49]. This deformation occurred in the mid-Cretaceous (Albian–Turonian) [51]. There is evidence for variation in the timing of exhumation within the Pyrenees mountains, even over relatively small (<10 km) distances [48,49]. Significant serpentinization occurred within the peridotite complex when adjacent to major extensional deformation zones, but also locally away from them [48]. Serpentinization is, however, not ubiquitous within the peridotites [12,52].
During the Cretaceous exhumation event, gabbroic rocks with crystallization ages of 113 (Albian)–85 Ma (Coniacian) were intruded [53,54]. These gabbros exhibit cooled margins against some of the peridotite bodies.

2.2. Turon de Técouère

Turon de Técouère (Figure 1C,D) is one of approximately 40 peridotite bodies exposed in the Northern Pyrenean Zone. The peridotite bodies yield field, microstructural, compositional, and age data that suggest a complex tectonic history [12,52,55,56,57,58,59,60,61]. The oldest event suggested by these data is Paleozoic (?) partial melting, initially in the garnet-lherzolite stability field, associated with asthenospheric uplift beneath the Pyrenees [60]. This event was followed by high-temperature ductile deformation in the spinel-lherzolite stability field [60], possibly in the late Paleozoic [61]. A second, middle Cretaceous magmatic stage [47,50,53,62,63] is related to rifting in the North Pyrenean realm and possibly associated transcurrent movements along the North Pyrenean Fault [27,61]. This mid-Cretaceous rifting was responsible for the development of mylonitic microstructures in some of the peridotite bodies, including Turon de Técouère [48,49,61].
The Triassic-Jurassic sediments may be the upper plate of a detachment fault that exhumed the mantle peridotites [50]. The Turon de Técouère peridotite is suggested to be part of a tectonic assemblage, including slices of crustal basement, mantle rocks, and sheared pre-Albian sediments [50]. This assemblage now occurs in the hanging wall of a later thrust fault, which placed the Triassic-Jurassic sequences and peridotite bodies over Cretaceous sediments to the south [50].
The Turon de Técouère peridotite is about 600 m across (Figure 1C,D) and is composed of spinel- and plagioclase-bearing lherzolite. The entire massif displays some degree of mylonitization. The southwest portion of the exposed body is composed of protomylonites (~40% matrix), whereas mylonites (~80% matrix) make up the northeast portion. A layer, about 25–40 m thick, of ultramylonites (~90% matrix) transects the mylonite domain at a low angle. Ultramylonites are also present as veins in the mylonites (Figure 1D).
Details of the microstructures and processes of strain localization along this shear zone have been described previously [12,64]. The mylonites at Turon de Técouère formed by a reaction-dominated deformation event [12]. The fine-grained matrix was produced by neocrystallization as a result of a continuous net-transfer reaction written as:
orthopyroxene1 + clinopyroxene1 + spinel1 + plagioclase1 + olivine1 = orthopyroxene2 + clinopyroxene2 + spinel2 + plagioclase2 + olivine2
Changes in mineral chemistry, from porphyroclast compositions to matrix compositions, are consistent with this reaction occurring while temperatures were decreasing ([12]; Figure 11 and Tables 1–3). This continuous reaction was associated with the transition from the medium-pressure spinel lherzolite metamorphic facies to the low-pressure plagioclase lherzolite facies at pressures around 0.5–1 GPa. Geothermometry based on composition of matrix grains that formed during the reaction yielded temperatures between 850 and 750 °C, while olivine and pyroxene porphyroclasts yielded temperatures of ~1000 °C [12]. Olivine and pyroxene grains in polycrystalline porphyroclasts also yield temperatures of ~1000 °C, and deformed by dislocation creep accommodated dynamic recrystallization during an earlier, high temperature deformation event [64].
Veins of pargasitic amphibole, up to 2 cm thick, occur in at least two localities within the protomylonite domain and display the mylonitic deformation [12] (Figure 1D). Within the mylonite and ultramylonite domains, amphibole is observed in only trace amounts, perhaps as remnants of veins disrupted during deformation. Optical and transmission electron (TEM) microscopy revealed no primary fluid inclusions [12,61]. These observations suggest that the amphibole growth occurred prior to mylonitization and that H2O present during amphibole growth was consumed in the amphibole-forming reaction. Therefore, deformation along this shear zone likely occurred in an H2O-deficient environment [12]. Similar amphibole veins occur in the Lherz massif where they cross-cut the peridotite foliation.

3. Methods

3.1. Samples and Thin Section Preparation

We analyzed representative samples from each of the three mylonitic domains (protomylonite: 95TT37; mylonite: PTT9; and ultramylonite: PTT1 and PTT2) of the Turon de Técouère peridotite. Thin sections were cut perpendicular to foliation and parallel to lineation. Dislocations and subgrain boundaries in olivine were decorated using the oxidation-decoration technique [65]. Ultrahigh polished thin sections were prepared for electron backscatter diffraction (EBSD) analysis. Thin section preparation involved polishing with diamond suspensions on 6, 3, and 1 μm polishing pads, followed by 90 min of polishing with colloidal silica suspension (0.06 μm) on a high nap pad. Thin sections were carbon coated to reduce charging.

3.2. Scanning Electron Microscopy and Electron Backscatter Diffraction Analysis

Crystallographic orientations of constituent phases were analyzed by electron backscatter diffraction (EBSD) mapping using a Philips XL30 scanning electron microscope (SEM) with a field emission gun (FEG) and an Oxford Instruments Nordlys Max2 EBSD detector housed at the EM square facility at Utrecht University. Typical SEM operating conditions were an accelerating voltage of 30 kV and working distance of 21 mm. In a selected protomylonite (95TT37) and an ultramylonite sample (PTT2), we created large-area maps, and we also collected data from higher resolution maps focusing on specific areas of interest within these samples. Mapping was performed at a step size of 8 µm for the large area maps and 0.7–0.8 µm for the more detailed EBSD maps. EBSD data were collected using the Oxford Instruments AZtecHKL (version 3A) acquisition and analysis software.
Post-acquisition data treatment involved processing of EBSD maps using the HKL Channel5 software package. Processing included: (1) removal of isolated single pixels differing by more than 10° from their neighbors (i.e., wild spikes); and (2) assignment of the average orientation of neighboring pixels to non-indexed pixels with a minimum of eight nearest neighbors. This operation was iterated until no new pixels were filled and was repeated for non-indexed pixels with decreasing number of nearest neighbors as low as five. The Kuwahara filter was applied for noise reduction [66].
Microstructural maps were constructed from the post-processed EBSD datasets using the MTEX MATLAB toolbox (version 5.5) for textural analysis. For grain reconstruction, a misorientation angle of 10° was used to define the lower limit of grain boundaries [67]. One point per grain data (i.e., mean crystallographic orientation of each grain) were calculated for the reconstructed grains and the orientations of crystallographic axes were plotted on equal area, lower-hemisphere projections. The crystallographic preferred orientation (CPO) data were plotted in the fabric reference frame defined by the foliation and lineation observed in the field. Misorientation axes were calculated for correlated misorientation angles between 2° and 10° and their distributions were plotted relative to the olivine crystal reference framework.
Grain size was determined from EBSD maps and using the image processing software ImageJ on diagrams produced by tracing grain boundaries on SEM images of thin sections decorated by the oxidation-decoration process, which reveals grain boundaries in addition to dislocations in olivine. Olivine grain size was analyzed using the equivalent circular diameter method from both EBSD and ImageJ data. We used the open-source GrainSizeTools script [68] to construct grain size distributions of the number- and area-weighted equivalent circular diameters. To convert between the mean of the equivalent circular diameter on a two-dimensional section and the mean grain size in three dimensions, a scaling factor of 1.2 was used [69].

3.3. Paleopiezometry

We applied three different types of paleopiezometers to estimate differential stress in the three types of mylonite. Specifically, we used the dislocation density in an olivine paleopiezometer of [70] in porphyroclasts and fine-grained polyphase matrix bands. Two subgrain size paleopiezometric relationships for dry olivine were applied to porphyroclasts with decorated subgrain boundaries [71,72]. Subgrain sizes and dislocation densities were measured from thin sections decorated using the oxidation-decoration technique [65]. Subgrains were measured using the light microscope to match the method used in the paleopiezometers applied. Dislocation densities were measured using images obtained from backscattered imaging on the Philips XL30 SEM, and are reported in [12]. Dislocation densities were measured as number/area on images from thin sections oriented perpendicular to foliation and parallel to lineation. The dislocation density and subgrain size paleopiezometers were applied to representative samples from the three types of mylonites (see Table 1). Finally, the olivine recrystallized grain size paleopiezometric relationship of [73], which includes the data of [72], was used to estimate differential stress in polycrystalline porphyroclasts and olivine-rich recrystallized bands in the ultramylonite.

3.4. 40Ar/39Ar Dating

In order to help constrain the tectonic setting of the shearing, we analyzed amphibole veins from two ultramafic massifs using 40Ar/39Ar laser-probe experiments. One sample (VU20-A3-PTT32; 43°03′51″ N, 0°29′41″ W) was taken from the Turon de Técouère peridotite and the second sample (VU20-A13-PLZ24; 42°48′14″ N, 1°22′18″ W) from the Lherz peridotite. The closure temperature for 40Ar/39Ar in amphiboles is 550–600° [74]. Following detailed microstructural observations, mineral separation of the amphiboles was performed using techniques described by [75,76]. The ANU laboratory standard biotite GA1550, with the measured K-Ar age of 97.9 Ma, was used to calculate the J factor. System blanks were measured between every 5–6 unknown values. The analysis was conducted at the argon laserprobe facility at the Vrije Universiteit, Amsterdam. An 18 W continuous argon ion laser, a low-volume gas purification line with Zr-AL and Fe-V-Zr gettering, and a Mass Analyser Products Ltd. 215-50 noble gas spectrometer [77] were used for the analyses.

4. Results

4.1. Microstructure and Grain Size within Mylonitic Domains

Microstructural observations and grain size analyses are described from representative samples from each of the mylonitic domains—protomylonite, mylonite, and ultramylonite—observed within the Turon de Técouère peridotite. Protomylonites contain porphyroclasts (0.35–2.5 cm) of single grains of olivine, orthopyroxene, clinopyroxene, and spinel (Figure 2A and Figure 3A). The porphyroclasts are separated by thin, anastomosing, fine-grained (1–350 µm) polyphase bands that make up ~40% of the rock volume and are composed of the same minerals as the porphyroclasts, in addition to ~1% plagioclase (Figure 2A, Figure 3A and Figure 4A). The mean olivine grain size analyzed varies between different fine-grained polyphase bands from 3 to 5 μm (Figure 4B and Figure S1a Supplementary Materials). The olivine porphyroclasts display relatively smooth undulatory extinction and/or very closely spaced subgrain boundaries (Figure S2). The foliation in the protomylonites is defined by elongate porphyroclasts and the anastomosing fine-grained bands (Figure 2A and Figure 3A).
The mylonites exhibit an increase in the presence of fine-grained polyphase bands to approximately 80% of the rock volume (Figure 2B). Porphyroclasts in the mylonites consist of deformed single grains of similar minerals and size to the protomylonites; a few porphyroclasts are surrounded by a margin of smaller polygonal grains of 20–350 µm in diameter. The mean olivine grain size in the polyphase matrix is 3 μm (Figure S1).
The ultramylonites are composed of 90% fine-grained polyphase matrix (Figure 2C and Figure 5A,B). Olivine grains in the polyphase matrix range in size from 2 to 25 µm, and show a mean grain size of 3–5.5 μm (Figure 5E and Figure S1a), similar to the polyphase bands in the protomylonite and mylonite. Grains in the polyphase matrix exhibit straight and aligned grain and phase boundaries (Figure 5B). Single-grain porphyroclasts within the ultramylonites are finer-grained (up to 3 mm) than in the mylonites and protomylonites (0.35–2.5 cm), and more elongate. Lozenge-shaped polycrystalline porphyroclasts, 1–5 mm in diameter, are common in the ultramylonites (Figure 6A, e.g., area C). These polycrystalline porphyroclasts are composed of intermediate-size (20–200 µm) olivine grains or pyroxene grains that locally show polygonal grain shapes. The mean olivine grain size in the polycrystalline porphyroclasts is 68 μm (Figure 5C). The olivine-rich polycrystalline porphyroclasts frequently contain some orthopyroxene and spinel grains of the same grain size as the olivine. The polycrystalline porphyroclasts are rare in the mylonites and were not observed in the protomylonites. Narrow olivine-rich, fine-grained recrystallized bands are present in the ultramylonites (Figure 6A, area D). Olivine in the recrystallized domains ranges from 20 to 80 μm in diameter, and shows a mean grain size of 42 μm (Figure 5D).

4.2. Olivine Crystallographic Preferred Orientations and Low-Angle Misorientations

Crystallographic orientations of olivine were determined for a representative protomylonite and ultramylonite. We plot the CPO data and misorientation data distinguished by grain populations, based on the size and type of grains.

4.2.1. Protomylonite

The examination of the microstructures in the EBSD map (Figure 3A) and the area-weighted grain size distribution of olivine (Figure 3B) led us to distinguish two types of grains: grains coarser than 350 µm are likely porphyroclasts, or remnant, olivine grains, whereas grains finer than 350 µm were likely produced during deformation and reaction (Figure 3B). We therefore plot the CPOs of these two populations of grains separately.
The coarser grains (d > 350 µm) show a concentration of olivine [100] axes subparallel to the lineation, [010] axes near the foliation plane at high angle to the lineation, and [001] axes at a high angle to the foliation (Figure 3C). This distribution of crystallographic axes is consistent with an E-type CPO pattern for olivine [80]. CPO intensity in the coarser olivine grains is relatively weak, as suggested by the low values of the J- and M-index (J = 3.04, M = 0.06), in addition to the distribution of uncorrelated misorientation angles, which follows the theoretical distribution for untextured olivine (Figure 3C). Olivine misorientation angles show a predominance of low-angle (2–10°) misorientations (Figure 3C), consistent with the plethora of low-angle boundaries present in olivine porphyroclasts (Figure 3A and Figure S2). The misorientation axes distribution plot shows a maximum at the [010] axis (Figure 3C), which combined with the E-type CPO in the coarser grains, suggests operation of the (001) [100] olivine slip system.
The finer grains (d < 350 µm) in the protomylonite have very low J- and M-index values (J = 1.04, M = 0.003), consistent with the coincidence between the observed and theoretical distribution of uncorrelated misorientation angles for untextured olivine (Figure 3D). As within the coarse olivine grains, low-angle (2–10°) misorientation angles dominate, but at a lower frequency compared to the coarser grains. Despite the very weak olivine texture, [100] axes show a primary concentration within the plane of foliation at a high angle to the lineation, similar to the [100] axes of the B-type CPO pattern [81] and a secondary concentration near the lineation (Figure 3D). The [010] axes exhibit two maxima, a primary within the plane of foliation at a high angle to the lineation, and a secondary at high angle to the foliation. The [001] axes also show two maxima, a primary cluster at high angle to the foliation, and a secondary cluster subparallel to the lineation (Figure 3D). The low-angle misorientation axes are primarily concentrated near the [010] axis, which combined with the crystallographic axes distributions, suggests activity of the (001) [100] slip system in olivine. The low concentration of low-angle misorientation axes around the [100] axis, indicates that the [100] axis maximum within the foliation and at high angle to the lineation is not the result of dislocation creep in fine-grained olivine.
Detailed analysis of a fine-grained (mean d = 4.8 µm) polyphase band (Figure 3A and Figure 4) yielded results that agree with the observations from the finer grains of the large area map. Olivine exhibits a very weak crystallographic texture with [100] axes near the foliation plane at high angle to the lineation, and [001] axes at a high angle to the foliation (Figure 4C). Low-angle misorientation axes are scattered between the three crystallographic axes, which combined with the weak CPO, suggests limited activity of olivine slip systems, and therefore, limited intragrain deformation.

4.2.2. Ultramylonite

Olivine porphyroclasts in the ultramylonite rocks are much finer than in the protomylonite rocks (Figure 2C and Figure 5A). For the purposes of our crystallographic analyses, we defined olivine porphyroclast as any grain significantly coarser (>150 µm) than the matrix grains (<20 µm; Figure 5E). Therefore, some grains that we have considered “porphyroclasts” may be remnants from “polycrystalline porphyroclasts” that have been separated by deformation and are now isolated within the fine-grained matrix. As a result, the number of olivine porphyroclasts in the ultramylonite is much higher than in the protomylonite. These isolated olivine porphyroclasts show a weak crystallographic preferred orientation (J = 1.68, M = 0.02), with [100] axes at a low angle (~15°) to the lineation, random distributions of [010] axes, and [001] axes at a high angle to the foliation (Figure 6B). Low-angle misorientation axes in the porphyroclasts are concentrated around the [010] axis, which combined with the observed CPO suggests activation of the (001) [100] olivine slip system (Figure 6B).
Olivine grains within a polycrystalline porphyroclast (Figure 6A, area C), composed predominantly of olivine with minor orthopyroxene, show similar CPO to recrystallized olivine in fine-grained, olivine-rich bands (Figure 6A, area D). Olivine [100] axes exhibit a point maximum at intermediate to low angle (30–15°) to the lineation, [010] axes show a maximum within or near the foliation, at a high angle to the lineation, and [001] axes are at a high angle to the foliation (Figure 6C,D). These distributions of olivine crystallographic axes are consistent with an E-type CPO pattern, similar to the CPO in the porphyroclasts of the protomylonite (Figure 3C). The fine-grained, olivine-rich bands show a weaker CPO (J = 1.37, M = 0.02) and lower frequency of low-angle misorientations compared to the polycrystalline porphyroclasts (J = 3.89, M = 0.1) (Figure 6C,D). Low-angle misorientation axes in both the polycrystalline porphyroclasts and the fine-grained olivine-rich bands are dispersed between the [010] and [001] axes, which suggests operation of the {0kl} [100] olivine slip systems (Figure 6C,D).
Olivine grains mixed in a polyphase layer with orthopyroxene and clinopyroxene show only a weak CPO (J = 1.55, M = 0.02). Olivine [100] axes form a weak point maximum within the foliation, and perpendicular to the lineation (Figure 6E). The distribution of [100] axes is similar to the one in the finer-grained domains of the protomylonite (Figure 4C), and is consistent with the [100] axes of a B-type CPO pattern; however, the [010] axes show a weaker concentration at high angle to the lineation, and [001] axes show no obvious preferred orientation (Figure 6E). The low-angle misorientation axes are distributed between the three crystallographic axes and show a weak concentration around [010] (Figure 6E). The limited concentration of low-angle misorientation axes near [100] suggests limited contribution of dislocation creep to the development of the [100] maximum at a high angle to the lineation in the olivine CPO.

4.3. Olivine Subgrain Size and Dislocation Density

For the three different types of mylonites, we measured subgrain sizes in olivine porphyroclasts (Figures S1 and S2; Table 1). Subgrain walls are rare in matrix grains, which are generally finer than the average subgrain size within the studied porphyroclasts. The mean size of the subgrains within porphyroclasts increases from 6.4 µm within the protomylonites to 8.7 and 9.5 µm, within the mylonites and ultramylonites, respectively (Figure S1; Table 1).
The dislocation density data were previously reported in [12], and are also presented here (Table 1) for completeness, as these data are the basis for the new differential stress estimations, presented in Section 4.4. Porphyroclasts reveal higher dislocation densities than matrix grains. Matrix grains exhibit either heterogeneous distribution of dislocations, or contain no dislocations, especially at grain sizes <5 µm. Below, we report the average dislocation densities, measured as number of lines intersecting a unit area. Only grains that contained dislocations were taken into consideration. Dislocation densities in the porphyroclasts and matrix grains of the protomylonites are an order of magnitude higher than the porphyroclasts and matrix grains of the mylonites and ultramylonites (Table 1). The average dislocation density in the porphyroclasts of the protomylonites is 1.17 × 10¹³/m2, whereas densities in the porphyroclasts of the mylonite and ultramylonite (including the polycrystalline porphyroclasts) are 2.85 × 10¹²/m2 and 3.35 × 10¹²/m2, respectively. The average dislocation density in the matrix grains of the protomylonite is 8.21 × 10¹²/m2, whereas the matrix grains in the mylonite and ultramylonite have average densities of 8.46 × 10¹¹/m2 and 6.77 × 10¹¹/m2, respectively.

4.4. Differential Stress

We estimated differential stresses in the Turon de Técouère peridotite tectonites using experimentally determined paleopiezometric relationships for dynamically recrystallized grain size [72,73], subgrain size [71,72], and dislocation density [70]. Below, we present the stresses for each type of mylonite (Table 1).

4.4.1. Protomylonites

Stresses in the protomylonites were estimated from the analysis of subgrain sizes in the porphyroclasts and dislocation densities in the porphyroclasts and matrix grains. Porphyroclasts yielded stresses of 229–281 MPa and 634 MPa based on subgrain sizes and dislocation densities, respectively. The large range of estimated stresses for olivine subgrain sizes reflects the differences between the two paleopiezometric relationships applied (Table 1). Differential stresses estimated from the dislocation densities of the matrix grains are 478 MPa.

4.4.2. Mylonites

The differential stresses recorded in the mylonites are lower than those in the protomylonites. Subgrain sizes in the porphyroclasts yielded stresses of 168–176 MPa, and stresses based on dislocation densities were 226 MPa. The dislocation densities in the matrix grains yielded stresses of 89 MPa, which are lower than the stresses in the porphyroclasts.

4.4.3. Ultramylonites

The differential stresses in the ultramylonites were constrained from the analysis of: (1) subgrain size and dislocation density in the porphyroclasts; (2) recrystallized grain size in the polycrystalline porphyroclasts; (3) recrystallized grain size in fine-grained, olivine-rich bands; and (4) dislocation density in the matrix grains. Subgrain sizes and dislocation densities in the porphyroclasts yielded stresses of 154–156 MPa and 250 MPa, respectively (Table 1). Significantly lower stresses were estimated from the recrystallized grains making up the polycrystalline porphyroclasts (59 MPa) and the fine-grained, olivine-rich domains (83–88 MPa). As there are very few subgrain walls within matrix grains, and subgrains within porphyroclasts are generally coarser than the matrix grain size, we used dislocation densities to estimate differential stresses within the ultramylonite matrix grains. Within the matrix, coarser grains (>5 µm) tend to have dislocations and finer grains (<5 µm) do not. The dislocation densities that we report are average densities within those grains that contain dislocations and may, therefore, represent a maximum stress. Average dislocation densities in matrix grains of the present-day ultramylonite yielded stresses of 70 MPa (Table 1).

4.5. 40Ar/39Ar Analysis of Hornblende

The amphibole from both the Turon de Técouère and Lherz peridotites showed well-behaved plateau ages (Figure 7; Tables S1 and S2, Supplementary Materials). The Turon de Técouère peridotite gave a weighted mean plateau date of 127.30 ± 6.7 (2σ) Ma on sample VU20-A3-PTT32. The Lherz peridotite yielded a weighted mean plateau date of 104.23 ± 1.57 Ma (2σ) on sample VU20-A13-PLZ24. The dates are distinct from one another, with the Turon de Técouère sample being distinctively older. Because both of these massifs deformed above the closure temperature of hornblende (~550 °C), the 40Ar/39Ar analyses provide a minimum age constraint on cessation of deformation.

5. Discussion

5.1. Deformation History of Ultramafic Massifs in Chainons Bernais Region of Northern Pyrenees

These new amphibole ages from the ultramafic massifs—~127 Ma from Turon de Técouère and ~104 Ma from Lherz—provide information on this section of the northern Pyrenees. These ages are similar to other dates constraining deformation and exhumation of ultramafic rocks in sections of the north Pyrenees. The Urdach lhzerzolite, for example, is located ~12 km WNW of the Turon de Técouère peridotite was studied by [48]. Unlike the Turon de Técouère peridotite, the Urdach lhzerzolite is serpentinized and surrounded by deformed and attenuated crustal material. A major shear zone is interpreted by [48,49] to occur at the crust–mantle boundary; this contact is visible at the Saraille massif ~10 km west of Turon de Técouère. Zircon U/Pb dates of 112.9 ± 1.6 Ma and 109.4 ± 1.2 Ma were obtained from metasomatized material along a detachment zone along the crust–mantle contact [48]. A plateau age of 105.2 ± 0.5 Ma was obtained on muscovite on a gneiss in the Urdach massif using the 40Ar/39Ar technique [82]. The assumed closure temperature for argon in muscovite is ~350–400 °C [83]. It is argued that the muscovite must pre-date deformation [82], suggesting that mylonitic deformation occurred between 105 and 100 Ma. These dates are generally consistent with the 112–92 Ma timing of metasomatic fluids within the Pyrenees [84,85].
Together, these new dates reveal a coherent tectonic history. The amphiboles within the Turon de Técouère occur in mylonitized veins that cross-cut the protomylonite section, which deformed at temperatures higher than 650 °C. Because the amphiboles record cooling through ~550 °C, these results provide a minimum date (~127 Ma) on the termination of shearing at mantle depths. Recent geochronology suggests that deformation occurred by ~110 Ma, or at least ~105 Ma [48,82]. The pattern can be interpreted as general exhumation associated with extension, with deformation starting at ~127 Ma or earlier. It is permissive that extensional deformation was continuous from mantle depths at ~127 Ma to surface depths at ~100 Ma [48,49].
These constraints are broadly consistent with numerical models. Hyper-extended margins typically occur in amagmatic settings with relatively slower spreading rates (<10 mm/year) [86]. In models of slow spreading centers, any particular shear zone appears active for a maximum of 3 m.y., but with strain rates of 10−12 s−1 [87].
An important result, in terms of regional tectonics, is that the extensional deformation must have started earlier than is previously interpreted. The initiation of extensional deformation is considered to be Albian (113.0–100.5 Ma), based on the presence of flysch [48,49]. However, the 40Ar/39Ar geochronology from Turon de Técouère suggests that it must have initiated prior to 127 Ma (Aptian or earlier).
Finally, it is worth noting that the amphiboles dated from the Lherz peridotite occurred in an amphibole-rich vein, which is the same feature that provided an older date in the Turon de Técouère peridotite. Yet, the dated vein in the Lherz massif is 23 m.y. younger (~104 Ma) than the vein in the Turon de Técouère peridotite. We address two options for how to explain these data. First, the difference in dates between the two massifs may record along-strike variations in extensional deformation. Second, the Ar-Ar age of the Lherz sample may reflect re-setting during metamorphism around 100–105 Ma. This interpretation is supported by mylonitic deformation that occurred between 105 and 100 Ma at Lherz [82]. Thus, although petrological studies from Lherz indicate that the amphibole veins intruded under shallow mantle conditions, the Mesozoic sediments around Lherz were metamorphosed up to amphibolite facies after crustal emplacement of the peridotites, which likely reset the 40Ar/39Ar age. If this resetting occurred, it did not occur at the Turon de Técouère peridotite.

5.2. Deformation History of Peridotites along the Turon de Técouère Shear Zone

The deformation microstructures and compositions of the Turon de Técouère peridotite suggest that deformation took place as a result of changing deformation mechanisms over time, as temperatures and pressures decreased from conditions of ~1000 °C at ~1.0 GPa to ~750 °C at ~0.5 GPa [12]. Here, we describe the deformation microstructures, and associated deformation mechanisms, that reflect the stress supporting networks during each of the different stages of deformation (Figure 8). In the next section, we tie these microstructures to the inferred temperature–stress–strain rate path that the Turon de Técouère rocks followed during exhumation.
The following three points are important for understanding the structural evolution of the Turon de Técouère shear zone:
1.
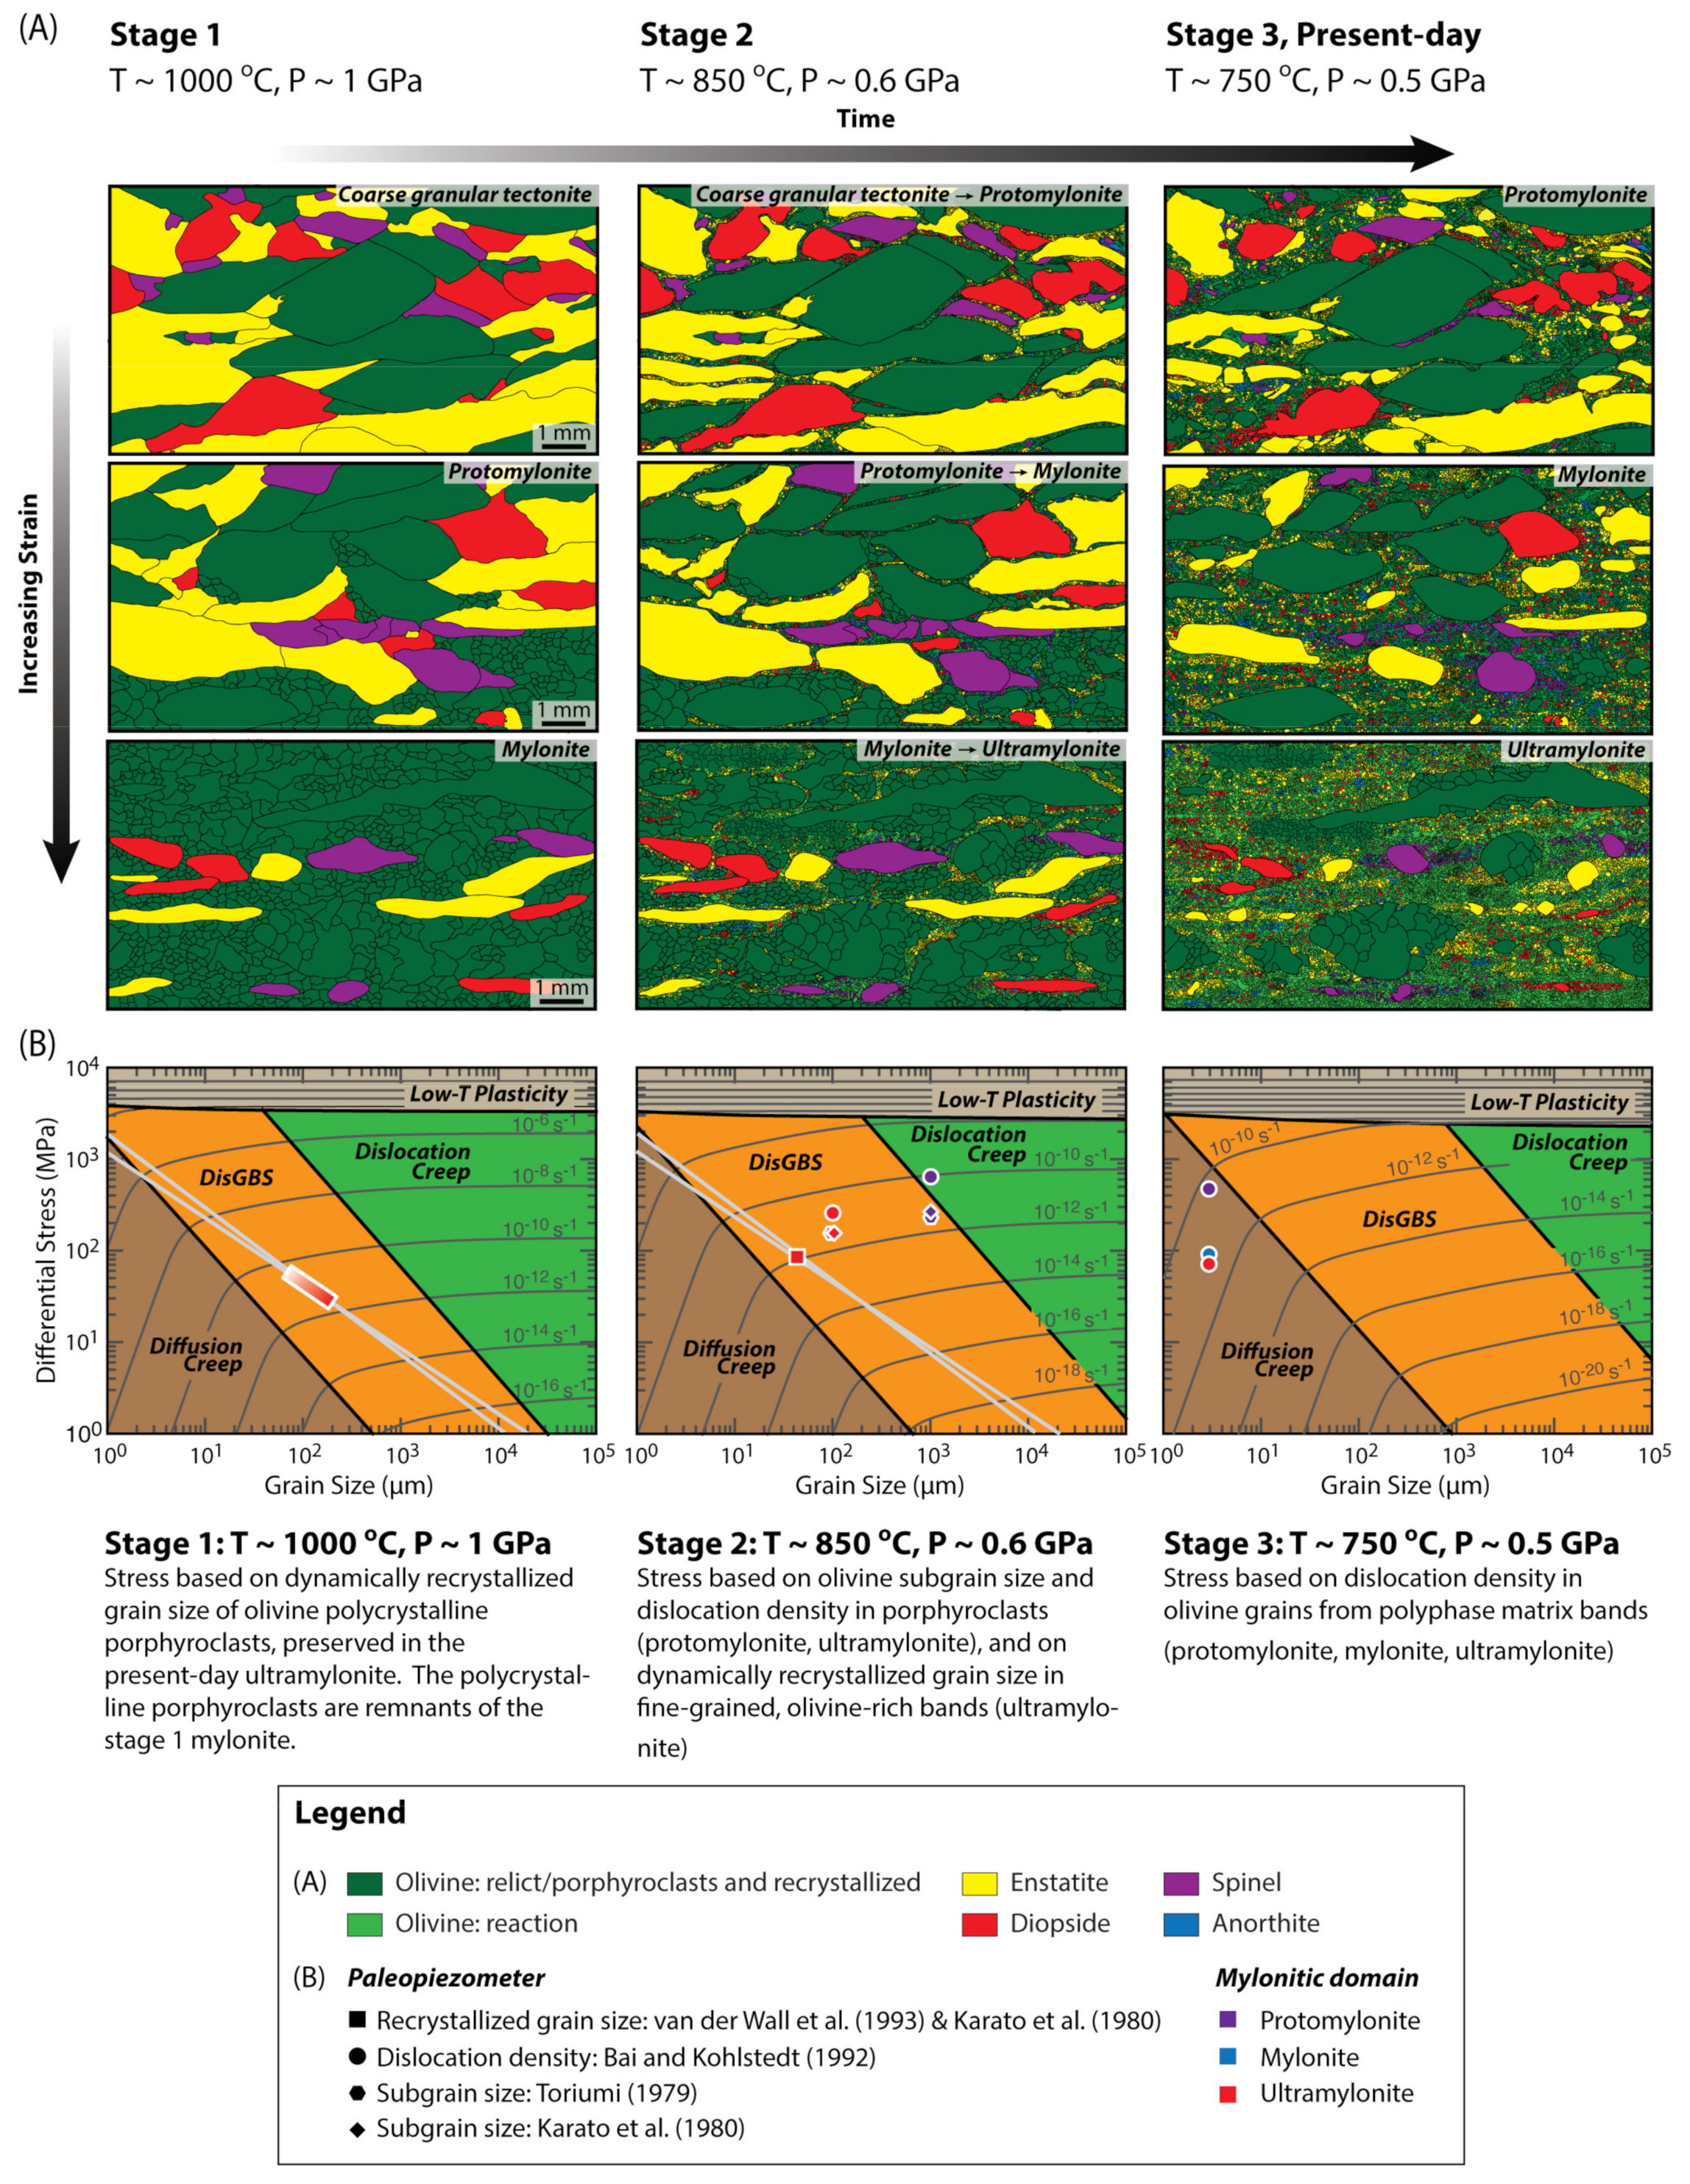
During Stage 1 (~1000 °C), a transition in grain size occurred across the zone from a coarse granular tectonite (preserved in the present-day protomolyonite domain) to a mylonite (preserved in polycrystalline porphyroclasts in the present-day ultramylonite domain) reflecting a strain gradient across the shear zone (Figure 8A, Stage 1). In this context, the present-day ultramylonite formed along a pre-existing, fine-grained mylonite [64].
2.
During Stage 2 (~850 °C), grain size reduction by reaction was active throughout the shear zone (Figure 8A, Stage 2) resulting in the development of the fine-grained (~3 µm) polyphase matrix. This reaction-involved deformation progressed faster in the finer-grained domains of the shear zone [64], i.e., the mylonite of Stage 1.
The present-day microstructural transitions observed in the Turon de Técouère peridotite reflect deformation that was influenced by the pre-existing grain size heterogeneity across the shear zone. The present-day ultramylonite, mylonite, and protomylonite domains (Figure 8A, Stage 3) correspond to pre-existing mylonite, protomylonite, and coarse-granular tectonite domains, respectively (Figure 8A, Stage 1).
Deformation microstructures and geothermometry suggest that the earliest microstructures preserved within the Turon de Técouère periodotite massif are the cm-scale porphyroclasts within the present-day protomylonites (~1000 °C; [12]). The polycrystalline porphyroclasts (20–200 µm grain size within clasts; ~1000 °C; [12]) observed within the present-day ultramylonite domain suggest that the cm-scale porphyroclasts underwent dynamic recrystallization accommodated dislocation creep.
Olivine (20 to 80 μm) in the narrow olivine-rich bands that are observed locally in the ultramylonites display a similar CPO (type E) as the grains that make up the polycrystalline porphyroclasts (Figure 6C,D), suggesting that the two types of grains formed during the same deformation stage. The olivine porphyroclasts of the present-day protomylonite (Figure 3C) and ultramylonite (Figure 6B) also show an E-type CPO. The similarity in the CPO between the remnant and recrystallized grains indicates that olivine may have formed by subgrain rotation recrystallization. The finer grain sizes in the olivine-rich bands, relative to the grains that make up the polycrystalline porphyroclasts, suggest that the former may have formed later during this stage and at lower temperatures. This result implies that the early stage of deformation dominated by dynamic recrystallization continued as temperatures decreased to <1000 °C.
The next stage of deformation involved grain size reduction by continuous reaction, producing the very fine-grained (2 to 25 µm; mean grain size of 3 μm) polyphase matrix observed in all domains (Figure 8A, Stage 2). Geothermometry of matrix grains from all types of mylonites indicates that the continuous reaction that resulted in the development of the matrix grains took place at temperatures of approximately 750–850 °C [12]. This reaction may have begun at higher temperatures; evidence for higher temperatures may have been lost as a result of resetting of compositions during subsequent deformation.
Olivine grains in the polyphase matrix of the protomylonite display a very weak crystallographic preferred orientation, unrelated to dislocation creep. However, as the protomylonites contain <40% matrix (Figure 8A, Stage 2), deformation was likely controlled by the porphyroclasts [2,8]. Within the ultramylonites, the olivine grains of the mixed polyphase matrix also show only a weak CPO; [100] axes are consistent with a B-type CPO pattern, but the low concentration of low-angle misorientation axes near [100] suggest limited contribution of dislocation creep to the development of the [100] maximum at high angle to the lineation (Figure 6E). The multiple maxima per crystallographic axis (e.g., [100] and [001]) and the overlap in the orientation of maxima of different crystallographic axes (e.g., [100] and [010]) indicate that the olivine CPO of the polyphase matrix is more complicated.
The fine-grained (2 to 25 µm grain size) matrix, the grain and phase boundary alignments, the weak CPO, and the relative lack of dislocations within matrix grains suggest that deformation of the matrix took place by grain-size sensitive creep. Therefore, we infer that as the reaction continued and the percentage of fine-grained matrix increased, there was a change in the dominant deformation mechanism from dislocation creep in porphyroclasts to grain-size sensitive creep in the fine-grained matrix. This change in deformation mechanism resulted in weakening and strain localization in the present-day mylonite and ultramylonite domains.

5.3. Temperature–Stress–Strain Rate Path

We constructed deformation mechanism maps in the differential stress–grain size space at selected temperatures (1000, 850, and 750 °C) to describe the temperature–stress–strain-rate history. The deformation mechanism maps were constructed using flow laws for olivine from [88,89] (Figure 8B).
A few assumptions, outlined below, are necessary to apply paleopiezometric relationships, and in constructing and using deformation mechanism maps to interpret the deformation history of the rocks. First, the rheology of polyphase rocks (~53% olivine, 24% orthopyroxene, and 13% clinopyroxene) is characterized by the rheology of olivine alone, although with a caveat. Deformation experiments on olivine-orthopyroxene aggregates show that the two-phase aggregates are weaker than olivine [90,91,92] or influence the strength of aggregates as a function of the ratio of phases, strain, and grain size [93,94]. In the experiments of [92], the olivine-orthopyroxene aggregates deform by diffusion creep and olivine [100] axes align at high angle to the lineation within the foliation plane. The deformation mechanism and olivine CPO are similar to the polyphase matrix bands in the Turon de Técouère shear zone.
Based on the microstructural and mineralogical observations and geothermometry outlined above, we infer that the percentage of fine-grained polyphase matrix increased with increasing strain, over time, and with decreasing temperatures. Further, different deformation mechanisms dominated at different times (and different temperatures) during the deformation history of the shear zone. Therefore, as described below, we use different microstructures, representing evidence for different deformation mechanisms, to interpret the flow stresses and temperatures at different stages in the deformation history (Table 1).

5.3.1. Stage 1: ~1000 °C

Deformation at 1000 °C was dominated by dynamic recrystallization in a mylonitic domain (the present-day ultramylonite domain). This deformation resulted in dynamically recrystallized grains (20–200 µm), observed in the present-day ultramylonite domain as polycrystalline porphyroclasts. Using the mean grain size (68 μm) of dynamically recrystallized olivine and the estimated stress of 58 MPa, a strain-rate of 10−11 to 10−10·s−1 was obtained (Figure 8B, Stage 1). The stress and strain rate in the polycrystalline porphyroclasts are likely overestimates. The polycrystalline porphyroclasts were affected by limited recrystallization during Stage 2, which likely decreased olivine grain size. We suggest that the largest grains (~200 µm) of the olivine grain size distribution (Figure 5C) are more representative for the microstructure of the former mylonite in Stage 1. Thus, the inferred stresses and strain rates in Stage 1 were likely closer to 26 MPa and 10−12·s−1, respectively.

5.3.2. Stage 2: ~850 °C

Two grain size reduction processes were active at 850 °C: (1) dynamic recrystallization; and (2) reaction. Dynamic recrystallization led to the formation of the fine-grained (20 to 80 μm) olivine rich bands that are observed locally within the present-day ultramylonite domain. It is possible that the development of these fine-grained bands started at higher temperatures and continued at 850 °C. Reaction to the fine-grained matrix (2–25 µm) began at approximately 850 °C. We assume that at 850 °C there was very little fine-grained matrix present (Figure 8B, Stage 2), and deformation was controlled by the porphyroclasts (cm-scale) within the present-day protomylonite domain, and by the polycrystalline porphyroclasts (20–200 µm) and the fine-grained olivine rich bands (20 to 80 μm) within the present-day ultramylonite domain. Thus, dislocation creep and dislocation accommodated grain boundary sliding were the dominant deformation mechanisms in the present-day protomylonites, mylonites, and ultramylonites (Figure 8B). To estimate strain rates at 850 °C, we used the differential stresses from the: (1) grain size of the fine-grained olivine rich bands in the ultramylonite (83–88 MPa); (2) dislocation densities and subgrain sizes within the porphyroclasts in the protomylonite (261–343 MPa); and (3) dislocation densities and subgrain sizes within the porphyroclasts in the ultramylonite (154–156 MPa) (Table 1).
The deformation mechanism maps at 850 °C suggest that the strain rates were similar for both the protomylonite and ultramylonite. Estimated strain rates in the ultramylonite were 10−12 to 10−11·s−1 and in the protomylonite were 10−12 to 10−10·s−1 (Figure 8B). The significant range in the estimated strain rates is due to the uncertainty in the estimated stresses from the use of paleopiezometers calibrated to different microstructures (recrystallized grain size, subgrain size, dislocation density), and from the use of different calibrations of the subgrain size paleopiezometer. Notably, variations in strain rates considering an individual piezometer are less.
We plotted stresses for the protomylonites and ultramylonites, only, on the deformation mechanism map at 850 °C. Within the mylonites, porphyroclasts are typically surrounded by a margin of smaller (20–200 µm) grains, suggesting that the dynamic recrystallization that resulted in the polycrystalline porphyroclasts observed within the ultramylonite domain also occurred within the mylonite domain [64]. We cannot know to what extent the dynamic recrystallization resulted in grain size reduction to the 20 to 200 µm grains within the mylonite domain because of overprinting by the reaction dominated event that led to the very fine-grained (2–25 µm) matrix. Therefore, we do not know the percentage of rock that was composed of the 20–200 µm grains at 850 °C and, hence, if the strength of the mylonites at Stage 2 was predominantly controlled by the porphyroclasts or by the 20–200 µm grains. However, dislocation densities and subgrain sizes within the porphyroclasts and dislocation densities within the matrix grains of the mylonites are similar to those within the ultramylonites (Table 1) indicating that stresses within the mylonites were similar to stresses within the ultramylonites. Therefore, we can suggest that at 850 °C, the strength of the mylonites was most likely controlled by the 20–200 µm grains.

5.3.3. Stage 3: ~750 °C

Geothermometry [12,60] suggests that the reaction that produced the fine-grained matrix ceased at approximately ~750 °C. The reaction dominated event took place primarily in the ultramylonite domain because of the pre-existing finer-grain size (20–200 µm grains) [64]. Therefore, we assume that: (1) at 750 °C, the present-day ultramylonite domain was composed of an approximately 90% fine-grained matrix, which is the matrix that currently exists; and (2) the strength of the ultramylonite was controlled by the strength of the fine-grained matrix [2,6,8]. Similarly, the fine-grained polyphase matrix controlled the strength of the protomylonite and mylonite at 750 °C. At 750 °C, stresses of 478 MPa in the protomylonite yield strain rates between 10−11 and 10−10·s−1, 89 MPa in the mylonite, and 70 MPa in the ultramylonite yield strain rates between 10−12 and 10−11·s−1 (Figure 8B).

5.3.4. Strain Rate and Stress Evolution

The data from the Turon de Técouère shear zone suggest that strain rates were relatively constant or decreased a small amount (Figure 8B) over time (and with decreasing temperature), despite different deformation mechanisms dominating at different times during the deformation history of the shear zone. The observed range in strain rates, it should be noted, result in part from the application of different piezometers; variations in strain rates considering an individual piezometer are less. Differential stress shows an initial increase between 1000 and 850 °C, from 26–58 MPa to 83–634 MPa. This stress increase likely represents transient strengthening due to cooling. Subsequently, differential stress decreases between 850 and 750 °C, from 83–634 MPa to 70–478 MPa (Figure 8B). This stress decrease was the result of reaction and formation of fine-grained polyphase matrix that deformed by grain-size sensitive creep.

5.4. Localization as a Result of Grain-Size Sensitive Deformation Processes

Consideration of the temperature–stress–strain-rate path that the Turon de Técouère peridotites followed (Figure 8B) suggests that the localization of strain into the ultramylonite domain took place as a result of lower stresses within this domain compared to the protomylonite domain. The lower stresses in the ultramylonite were due to two grain-size sensitive deformation mechanisms that dominated at different times in the deformation history: (1) dislocation accommodated grain boundary sliding; and (2) diffusion accommodated grain boundary sliding.
The deformation mechanism map at 850 °C (Figure 8B) suggests that strain rates within the protomylonite domain (10−12–10−10·s−1) were similar to strain rates within the ultramylonite (and mylonite) domains (10−12–10−11·s−1). Stresses in the ultramylonite domain (85–250 MPa), however, were lower than the protomylonite domain (261–634 MPa). The lower stresses may be a result of dislocation accommodated grain boundary sliding within the ultramylonite domain, due to the finer grain size (20–200 µm). These lower stresses, relative to stresses in the protomylonite domain, led to strain localization. This result is similar to results published by [95], suggesting that shear localization occurred in a peridotite shear zone as a result of grain-size reduction caused by dynamic recrystallization.
Reaction occurring at 850–750 °C resulted in a second episode of weakening and localization within the present-day ultramylonite domain. Reaction produced a fine-grained matrix (2–25 µm grain size), resulting in a change in the dominant deformation mechanism from dislocation creep in the porphyroclasts and polycrystalline porphyroclasts to grain size sensitive (diffusion) creep in the fine-grained matrix, resulting in weakening and strain localization.

5.5. Constant Strain-Rate Localization at a Plate Boundary

We interpret that the deformation in the Turon de Técouère massif occurred at a plate boundary based on two lines of reasoning. First, the strain rates are so rapid that they must occur at a plate boundary. For example, mantle xenoliths from below the Calaveras fault in the San Andreas fault system of California record strain rates of 8.1 × 10⁻¹⁵ to 5.0 × 10⁻¹³·s−1 [96], which are significantly slower than the strain rates inferred for the Turon de Técouère massif of 10−12 to 10−10 s−1. The elevated strain rates are particularly relevant, as the plate boundary is assumed to have divergence rates of only 0.5 cm/year [61]. Second, other examples of deformed ultramafic rocks in the region are interpreted to occur along the plate boundary, as exhibited by other outcrops in the region that preserve Early Cretaceous sedimentary rocks directly overlying highly sheared lower crustal and ultramafic rocks [48,49].
The rock record in the Turon de Técouère massif indicates that stresses vary while strain rates remain relatively constant. Yet, the strain clearly localized into the ultramylonite section through time. Thus, we interpret that strain localization occurred at constant strain rate conditions. These results are seemingly at odds with the lack of strain localization in homogeneous material noted in experimental deformation [24,26]. We do not question the results of these high-quality experiments, but we do question their strict applicability to the natural world. As noted by multiple authors, stress is heterogeneous in both magnitude and in orientation of principle directions, at a variety of scales [97]. These variations can be due to either: (1) heterogeneous material properties that experience bulk homogeneous deformation [9,98,99]; or (2) deformation zones where the strain rate is fixed and the stress becomes the dependent variable [100], consistent with the interpretations described above. The latter case describes plate boundaries. In these cases, there are two options for what ultimately controls the strength. The classic lithospheric strength profile considers that the strength of the strongest layer controls the mechanical response [101]. Away from that layer, the material must deform at the strain rates imposed by the strongest lithospheric layer. An important implication of our results is that the stress distribution with depth does not follow the distribution predicted by the lithospheric strength profiles. Despite the fact that the strain rate remained constant during exhumation, stress increased as the massif exhumed from 1000 to 850 °C, and then stress decreased during exhumation at 750 °C. An alternative is to consider a system-scale behavior, where no single material property or lithospheric layer solely controls the behavior [97]. In this model, the mechanical response at plate boundaries is a non-linear interaction of the mechanical responses of different mechanical behaviors [102].
The presence of constant strain-rate deformation at an exposed plate boundary in the Turon de Técouère massif indicates that strain can localize under these conditions. The key question becomes: What are the first-order factors driving strain localization? Time-dependent reactions are a critical feature at the Turon de Técouère massif [12]. There are two possible collaborating factors that facilitate these reactions, an intrinsic factor based on total amount of material heterogeneity (e.g., grain size and composition) and an extrinsic factor, based on finite strain (e.g., causing grain size changes during progressive deformation). The strength of studying natural deformation to understand strain localization is that it inherently reflects the extrinsic factors. The continuing challenge is to determine the relative importance of these intrinsic and extrinsic factors in different tectonic settings and in different geological materials. Our study emphasizes the role of reactions, material heterogeneity, and finite strain in causing strain localization of naturally deformed rocks.

6. Conclusions

A natural deformed shear zone in Turon de Técouère massif of the French Pyrenees occurred during the mid-Cretaceous, associated with hyperextension between the Iberian peninsula and the European continental margin offshore of southwestern France. An 40Ar/39Ar date of 127.30 ± 6.70 Ma was obtained on amphiboles within veins that cross-cut the dominant foliation within the Turon de Técouère massif. A second 40Ar/39Ar date of 104.23 ± 1.57 Ma was obtained on amphiboles formed within similar veins of the Lherz massif. Both dates are consistent with the interpretation that deformation occurred during this extensional event during the Early to mid-Cretaceous.
The microstructures record deformation during lowering deformation temperatures (1000, 850, and 750 °C), which we sub-divide into three stages for ease of presentation. For each stage, we characterize stresses through the use of paleopiezometers for olivine. The first stage, which occurred at 1000 °C, indicates stresses of ~ 60 MPa and strain-rates of 10−11 to 10−10 to s−1 (Figure 8B). The second stage, at 850 °C, indicates stresses of 83 to 634 MPa and strain-rates of 10−12 to 10−10·s−1. The third and final stage, at 750 °C, indicates stresses of 70 to 478 MPa and strain rates of 10−12 to 10−11·s−1. The data indicate that the strain rate remains constant, or possibly decreased a small amount, despite the changes in stress.
These results are consistent with other studies of naturally deformed systems along plate margins, which record variations in stress magnitudes and/or principal directions. In contrast, the strain rate remains similar. This situation is consistent with deformation along a plate margin, in which the rocks accommodate the displacements and displacement rates imposed by the plate boundaries. These displacement rates constrain strain rates, as long as the plate motion rates, the zone of overall deformation, and kinematics of deformation remain relatively fixed. This viewpoint, however, is not the typical way in which we interpret strain localization, which is typically attributed to inherently static material properties. Rather, the role of time-dependent reactions [12] and material arrangement [9] are first-order controls on understanding the process of strain localization. The time dependency is constrained by the kinetics of deformation mechanisms and also by the finite strain that rearranges the phases and facilitate reactions. Material heterogeneity, reactions, and finite strain are critical parameters to understanding strain localization in naturally deformed rocks.

Supplementary Materials

The following are available online at https://www.mdpi.com/article/10.3390/min11121351/s1, Figure S1: Grain size distributions for olivine in the fine-grained polyphase matrix, and subgrain size distributions for olivine porphyroclasts, Figure S2: Photomicrographs of decorated subgrains in olivine porphyroclasts, Table S1: 40Ar/39Ar analytical data for sample VU20-A3-PTT32 (Turon de Técouère), Table S2: 40Ar/39Ar analytical data for sample VU20-A13-PLZ24 (Lherz).

Author Contributions

Conceptualization, J.N., V.C., B.T. and M.R.D.; Data curation, J.N., V.C. and M.R.D.; Formal analysis, J.N., V.C., J.R.W. and W.M.L.; Funding acquisition, J.N., V.C., B.T. and M.R.D.; Investigation, J.N., V.C. and M.R.D.; Methodology, J.N., V.C. and M.R.D.; Project administration, J.N. and M.R.D.; Validation, J.N., V.C., B.T. and J.R.W.; Visualization, V.C.; Writing–original draft, J.N., V.C. and B.T.; Writing–review & editing, J.N., V.C., B.T., J.R.W., W.M.L. and M.R.D. All authors have read and agreed to the published version of the manuscript.

Funding

This research was funded by a NWO-Pionier subsidy to M.R.D.; U.S. National Science Foundation grant EAR-1629840 awarded to B.T. and V.C.; and a Marie Curie International Outgoing Fellowship (PIOF-GA-2012–329183) and a research support grant from the University of Sydney (Australia) awarded to V.C.

Data Availability Statement

Requests for the EBSD data sets can be made by contacting the corresponding author. The EBSD data will also become available at StraboMicro.

Acknowledgments

We dedicate this paper to the memory of our friend and colleague, Reinoud L.M. Vissers, for his important contributions to field-based studies of shear localization in mantle rocks. The authors thank Ellen M Nelson for providing assistance with figures, tables, and references. We acknowledge the facilities and technical assistance of the EM square facility at Utrecht University, and of Sydney Microscopy & Microanalysis, the University of Sydney node of Microscopy Australia. We thank three anonymous reviewers for their constructive comments.

Conflicts of Interest

The authors declare no conflict of interest.

References

  1. Kirby, S.H.; Kronenberg, A.K. Rheology of the lithosphere: Selected topics. Rev. Geophys. 1987, 25, 1219–1244. [Google Scholar] [CrossRef] [Green Version]
  2. Rutter, E.H.; Brodie, K.H. Experimental “syntectonic” dehydration of serpentinite under conditions of controlled pore water pressure. J. Geophys. Res. 1988, 93, 4907–4932. [Google Scholar] [CrossRef]
  3. Braun, J.; Chery, J.; Poliakov, A.; Mainprice, D.; Vauchez, A.; Tomassi, A.; Daignieres, M. A simple parameterization of strain localization in the ductile regime due to grain size reduction: A case study for olivine. J. Geophys. Res. 1999, 104, 25167–25181. [Google Scholar] [CrossRef]
  4. Montési, L.G.J.; Hirth, G. Grain size evolution and the rheology of ductile shear zones; from laboratory experiments to postseismic creep. Earth Planet. Sci. Lett. 2003, 211, 97–110. [Google Scholar] [CrossRef]
  5. Shea, W.T., Jr.; Kronenberg, A.K. Strength and anisotropy of foliated rocks with varied mica contents. J. Struct. Geol. 1993, 15, 1097–1121. [Google Scholar] [CrossRef]
  6. Handy, M.R. Rheological pathways in shear zones. Terra Abstr. 1990, 2, 14. [Google Scholar]
  7. Toy, V.G.; Newman, J.; Lamb, W.; Tikoff, B. The role of pyroxenites in formation of shear instabilities in the mantle; evidence from an ultramafic ultramylonite, Twin Sisters Massif, Washington. J. Petrol. 2010, 51, 55–80. [Google Scholar] [CrossRef] [Green Version]
  8. Jordan, P. The rheology of polymineralic rocks: An approach. Geol. Rundschau 1988, 77, 285–294. [Google Scholar] [CrossRef]
  9. Goodwin, L.B.; Tikoff, B. Competency contrast, kinematics, and the development of foliations and lineations in the crust. J. Struct. Geol. 2001, 24, 1065–1085. [Google Scholar] [CrossRef]
  10. Tommasi, A.; Knoll, M.; Vauchez, A.; Signorelli, J.W.; Thoraval, C.; Loge, R. Structural reactivation in plate tectonics controlled by olivine crystal anisotropy. Nat. Geosci. 2009, 2, 423–427. [Google Scholar] [CrossRef]
  11. Drury, M.R.; Vissers, R.L.M.; Van der Wal, D.; Hoogerduijn Strating, E.H. Shear localisation in upper mantle peridotites. Pure Appl. Geophys. 1991, 137, 439–460. [Google Scholar] [CrossRef]
  12. Newman, J.; Lamb, W.M.; Drury, M.R.; Vissers, R.L.M. Deformation processes in a peridotite shear zone: Reaction-softening by an H2O-deficient, continuous net transfer reaction. Tectonophysics 1999, 303, 193–222. [Google Scholar] [CrossRef]
  13. Ogawa, M. Shear instability in a viscoelastic material as the cause of deep focus earthquakes. J. Geophys. Res. 1987, 92, 13801–13810. [Google Scholar] [CrossRef]
  14. Regenauer-Lieb, K.; Yuen, D.A.; Branlund, J. The initiation of subduction; criticality by addition of water? Science 2001, 294, 578–580. [Google Scholar] [CrossRef] [Green Version]
  15. Trepmann, C.A.; Stöckhert, B. Quartz microstructures developed during non-steady state plastic flow at rapidly decaying stress and strain rate. J. Struct. Geol. 2003, 25, 2035–2051. [Google Scholar] [CrossRef]
  16. Regan, S.P.; Williams, M.L.; Leslie, S.; Mahan, K.H.; Jercinovic, M.J.; Holland, M.E. The Cora Lake shear zone, Athabasca granulite terrane, an intraplate response to far-field orogenic processes during the amalgamation of Laurentia. Can. J. Earth Sci. 2014, 51, 877–901. [Google Scholar] [CrossRef] [Green Version]
  17. Campbell, L.R.; Menegon, L. Transient high strain rate during localized viscous creep in the dry lower continental crust (Lofoten, Norway). J. Geophys. Res. Solid Earth 2019, 124, 10240–10260. [Google Scholar] [CrossRef]
  18. Chatzaras, V.; Tikoff, B.; Kruckenberg, S.C.; Titus, S.J.; Teyssier, C.; Drury, M.R. Stress variations in space and time within the mantle section of an oceanic transform zone: Evidence for the seismic cycle. Geology 2020, 48, 569–573. [Google Scholar] [CrossRef]
  19. Norris, R.J. Strain localisation within ductile shear zones beneath active faults: The Alpine Fault contrasted with the adjacent Otago fault system, New Zealand. Earth Planets Space 2004, 56, 1095–1101. [Google Scholar] [CrossRef] [Green Version]
  20. Ford, H.A.; Fischer, K.M.; Lekic, V. Localized shear in the deep lithosphere beneath the San Andreas Fault system. Geology 2014, 42, 295–298. [Google Scholar] [CrossRef]
  21. Austrheim, H. Eclogitization of lower crustal granulites by fluid migration through shear zones. Earth. Planet. Sci. Lett. 1987, 81, 221–232. [Google Scholar] [CrossRef]
  22. Tikoff, B.; St. Blanquat, M. Transpressional deformation and changing kinematics in the Late Cretaceous Sierra Nevada magmatic arc, California. Tectonics 1997, 16, 442–459. [Google Scholar] [CrossRef]
  23. Schmalzle, G.; Dixon, T.; Malservisi, R.R. Govers Strain accumulation across the Carrizo segment of the San Andreas Fault, California: Impact of laterally varying crustal properties. J. Geophys. Res. 2006, 111, B05403. [Google Scholar] [CrossRef] [Green Version]
  24. Bystricky, M.; Kunze, K.; Burlini, L.; Burg, J.P. High shear strain of olivine aggregates: Rheological and seismic consequences. Science 2000, 290, 1564–1567. [Google Scholar] [CrossRef] [Green Version]
  25. Paterson, M.S. Localization in rate-dependent shearing deformation, with application to torsion testing. Tectonophysics 2007, 445, 273–280. [Google Scholar] [CrossRef]
  26. Hansen, L.N.; Zimmerman, M.E.; Dillman, A.M.; Kohlstedt, D.L. Strain localization in olivine aggregates at high temperature: A laboratory comparison of constant-strain-rate and constant-stress boundary conditions. Earth Planet. Sci. Lett. 2012, 333–334, 134–145. [Google Scholar] [CrossRef]
  27. ECORS Pyrenees Team. The ECORS deep reflection seismic survey across the Pyrenees. Nature 1988, 331, 508–511. [Google Scholar] [CrossRef]
  28. Choukroune, P. ECORS team. The ECORS Pyrenean deep seismic profile reflection data and the overall structure of an orogenic belt. Tectonics 1989, 8, 23–39. [Google Scholar] [CrossRef]
  29. Roure, F.; Choukroune, P.; Berastegui, X.; Munoz, J.A.; Villien, A.; Matheron, P.; Bareyt, M.; Seguret, M.; Camara, P.; Deramond, J. ECORS deep seismic data and balanced cross sections; geometric constraints on the evolution of the Pyrenees. Tectonics 1989, 8, 41–50. [Google Scholar] [CrossRef]
  30. Muñoz, J.A. Evolution of a continental collision belt: ECORS Pyrenees crustal balanced cross-section. In Thrust Tectonics; McClay, K.R., Ed.; Chapman and Hall: London, UK, 1992; pp. 235–246. [Google Scholar]
  31. Pulgar, J.A.; Gallart, J.; Fernandez Viejo, G.; Perez Estaun, A.; Alvarez Marron, J.; Alonso, J.L.; Gallastegui, J.; Marcos, A.; Bastida, F.; Aller, J.; et al. Seismic image of the Cantabrian Mountains in the western extension of the Pyrenees from integrated ESCIN reflection and refraction data. Tectonophysics 1996, 264, 1–19. [Google Scholar] [CrossRef]
  32. Teixell, A. Crustal structure and orogenic material budget in the west-central Pyrenees. Tectonics 1998, 17, 395–406. [Google Scholar] [CrossRef]
  33. Gallastegui, J. Estructura cortical de la cordillera y margen continental Cantábricos: Perfiles ESCI N. Trab. Geol. 2000, 22, 3–234. [Google Scholar]
  34. Teixell, A.; Labaume, P.; Ayarza, P.; Espurt, N.; de Saint Blanquat, M.; Lagabrielle, Y. Crustal structure and evolution of the Pyrenean-Cantabrian Belt; a review and new interpretations from recent concepts and data. Tectonophysics 2018, 724–725, 146–170. [Google Scholar] [CrossRef] [Green Version]
  35. Vissers, R.L.M.; van Hinsbergen, D.J.J.; van der Meer, D.G.; Spakman, W. Cretaceous slab break-off in the Pyrenees; Iberian Plate kinematics in paleomagnetic and mantle reference frames. Gondwana Res. 2016, 34, 49–59. [Google Scholar] [CrossRef] [Green Version]
  36. Vissers, R.L.M.; Meijer, P.T. Mesozoic rotation of Iberia; subduction in the Pyrenees? Earth Sci. Rev. 2012, 110, 93–110. [Google Scholar] [CrossRef]
  37. Vissers, R.L.M.; van Hinsbergen, D.J.J.; Meijer, P.T.; Piccardo, G.B. Kinematics of Jurassic ultra-slow spreading in the Piemonte Ligurian Ocean. Earth Planet. Sci. Lett. 2013, 380, 138–150. [Google Scholar] [CrossRef]
  38. Barnett-Moore, N.; Hosseinpour, M.; Maus, S. Assessing discrepancies between previous plate kinematic models of Mesozoic Iberia and their constraints. Tectonics 2016, 35, 1843–1862. [Google Scholar] [CrossRef]
  39. Dielforder, A.; Frasca, G.; Brune, S.; Ford, M. Formation of the Iberian-European convergent plate boundary fault and its effect on intraplate deformation in Central Europe. Geochem. Geophys. 2019, 20, 2395–2417. [Google Scholar] [CrossRef]
  40. Verges, J.; Munoz, J.A.; Martinez, A.; McClay, K.R. South Pyrenean fold-and-thrust belt: Role of foreland evaporitic levels in thrust geometry. In Thrust Tectonics; Chapman and Hall: London, UK, 1992. [Google Scholar]
  41. Lopez-Blanco, M.; Marzo, M.; Burbank, D.W.; Verges, J.; Roca, E.; Anadon, P.; Pina, J.; Steel, R.J. Tectonic and climatic controls on the development of foreland fan deltas; Montserrat and Sant Llorenc del Munt systems (middle Eocene, Ebro Basin, NE Spain). Sediment. Geol. 2000, 138, 17–39. [Google Scholar] [CrossRef] [Green Version]
  42. Desegaulx, P.; Brunet, M.F. Tectonic subsidence of the Aquitaine Basin since Cretaceous times. Bull. Soc. Geol. Fr. 1990, 6, 295–306. [Google Scholar] [CrossRef]
  43. Ford, M.; Hemmer, L.; Vacherat, A.; Gallagher, K.; Christophoul, F. Retro-wedge foreland basin evolution along the ECORS line, eastern Pyrenees, France. J. Geol. Soc. Lond. 2016, 173, 419–437. [Google Scholar] [CrossRef] [Green Version]
  44. Corre, B. La Bordure Nord de la Plaque Ibérique à l’Albo- Cénomanien. Architecture d’une Marge Passive de Type Ductile (Chaînons Béarnais, Pyrénées Occidentales). Ph.D. Thesis, Rennes 1 University, Rennes, France, 2017. [Google Scholar]
  45. Lagabrielle, Y.; Bodinier, J. Submarine reworking of exhumed subcontinental mantle rocks; field evidence from the Lherz peridotites, French Pyrenees. Terra Nova 2008, 20, 11–21. [Google Scholar] [CrossRef]
  46. Jammes, S.; Manatschal, G.; Lavier, L.; Masini, E. Tectono-sedimentary evolution related to extreme crustal thinning ahead of a propagating ocean: Example of the western Pyrenees. Tectonics 2009, 28, TC4012. [Google Scholar] [CrossRef]
  47. Lagabrielle, Y.; Labaume, P.; de Saint Blanquat, M. Mantle exhumation, crustal denudation, and gravity tectonics during Cretaceous rifting in the Pyrenean realm (SW Europe); insights from the geological setting of the lherzolite bodies. Tectonics 2010, 29, TC4012. [Google Scholar] [CrossRef]
  48. Lagabrielle, Y.; Asti, R.; Fourcade, S.; Corre, B.; Poujol, M.; Uzel, J.; Labaume, P.; Clerc, C.; Lafay, R.; Picazo, S.; et al. Mantle exhumation at magma-poor passive continental margins: Part I, 3D architecture and metasomatic evolution of a fossil exhumed mantle domain (Urdach Lherzolite, north-western Pyrenees, France. Bull. Soc. Geol. Fr. 2019, 190, 8. [Google Scholar] [CrossRef]
  49. Lagabrielle, Y.; Asti, R.; Fourcade, S.; Corre, B.; Labaume, P.; Uzel, J.; Clerc, C.; Lafay, R.; Picazo, S. Mantle exhumation at magma-poor passive continental margins; Part II, Tectonic and metasomatic evolution of large-displacement detachment faults preserved in a fossil distal margin domain (Saraille lherzolites, northwestern Pyrenees, France). Bull. Soc. Géol. Fr. 2019, 190, 14. [Google Scholar] [CrossRef]
  50. De Saint Blanquat, M.; Bajolet, F.; Grand’Homme, A.; Proietti, A.; Zanti, M.; Boutin, A.; Clerc, C.; Lagabrielle, Y.; Labaume, P. Cretaceous mantle exhumation in the central Pyrenees: New constraints from the peridotites in eastern Ariège (North Pyrenean zone, France). Comptes Rendus Geosci. 2016, 348, 268–278. [Google Scholar] [CrossRef] [Green Version]
  51. Schärer, U.; de Parseval, P.; Polvé, M.; St Blanquat, M. Formation of the Trimouns talc-chlorite deposit (Pyrenees) from persistent hydrothermal activity between 112 and 97 Ma. Terra Nova 1999, 11, 30–37. [Google Scholar] [CrossRef]
  52. Le Roux, V.; Bodinier, J.L.; Tommasi, A.; Alard, O.; Dautria, J.M.; Vauchez, A.; Riches, A.J.V. The Lherz spinel lherzolite: Refertilized rather than pristine mantle. Earth Planet. Sci. Lett. 2007, 259, 599–612. [Google Scholar] [CrossRef] [Green Version]
  53. Golberg, J.-M.; Maluski, H.; Leyreloup, A.-F. Petrological and age relationship between emplacement of magmatic breccia, alkaline magmatism, and static metamorphism in the North Pyrenean Zone. Tectonophysics 1986, 129, 275–290. [Google Scholar] [CrossRef]
  54. Montigny, R.; Azambre, B.; Rossy, M.; Thuizat, R.; Banda, E.; Wickham, S.M. K-Ar study of Cretaceous magmatism and metamorphism in the Pyrenees; age and length of rotation of the Iberian Peninsula. Tectonophysics 1986, 129, 257–273. [Google Scholar] [CrossRef]
  55. Polvé, M.; Allègre, C.J. Orogenic lherzolite complexes studied by 87Rb-87Sr; a clue to understand the mantle convection processes? Earth Planet. Sci. Lett. 1980, 51, 71–93. [Google Scholar] [CrossRef]
  56. Loubet, M.; Allègre, C.J. Trace elements in orogenic lherzolites reveal the complex history of the upper mantle. Nature 1982, 298, 809–814. [Google Scholar] [CrossRef]
  57. Conquéré, F.; Fabriès, J. Chemical disequilibrium in spinel-lherzolites from Ariege (French Pyrenees). Terra Cognita 1982, 2, 241. [Google Scholar]
  58. Nicolas, A. Novel type of crust produced during continental rifting. Nature 1985, 315, 112–115. [Google Scholar] [CrossRef]
  59. Bodinier, J.L.; Vasseur, G.; Vernieres, J.; Dupuy, C.; Fabries, J. Mechanisms of mantle metasomatism; geochemical evidence from the Lherz orogenic peridotite. J. Petrol. 1990, 31, 597–628. [Google Scholar] [CrossRef]
  60. Fabriès, J.; Lorand, J.-P.; Bodinier, J.-L.; Dupuy, C. Evolution of the upper mantle beneath the Pyrenees: Evidence from orogenic spinel lherzolite massifs. J. Petrol. 1991, 2, 55–76. [Google Scholar] [CrossRef]
  61. Vissers, R.L.M.; Drury, M.R.; Newman, J.; Fliervoet, T.F.; Mainprice, D.; Boudier, F.; Bouchez, J. Mylonitic deformation in upper mantle peridotites of the North Pyrenean Zone (France): Implications for strength and strain localization in the lithosphere. Tectonophysics 1997, 279, 303–325. [Google Scholar] [CrossRef]
  62. Verschure, R.H.; Hebeda, E.H.; Boelrigh, N.A.; Priem, H.N.A.; Lallemant, A.H.G. K/Ar age of hornblende from hornblendite vein in the alpine ultramafic mass of the Etang de Lers (Ariège), French Pyrénées. Leidse Geol. Meded. 1967, 42, 59–60. [Google Scholar]
  63. Albarède, F.; Michard-Vitrac, A. Age and significance of the North Pyrenean metamorphism. Earth Planet. Sci. Lett. 1978, 40, 327–332. [Google Scholar] [CrossRef]
  64. Newman, J.; Drury, M.R. Control of shear zone location and thickness by initial grain size variations in upper mantle peridotites. J. Struct. Geol. 2010, 32, 832–842. [Google Scholar] [CrossRef]
  65. Kohlstedt, D.L.; Goetze, C.; Durham, W.B.; Vander Sande, J. New technique for decorating dislocations in olivine. Science 1976, 191, 1045–1046. [Google Scholar] [CrossRef] [PubMed]
  66. Humphreys, F.J. Review Grain and subgrain characterisation by electron backscatter diffraction. J. Mater. Sci. 2001, 36, 3833–3854. [Google Scholar] [CrossRef]
  67. Bachmann, F.; Hielscher, R.; Schaeben, H. Grain detection from 2d and 3d EBSD data—Specification of the MTEX algorithm. Ultramicroscopy 2011, 111, 1720–1733. [Google Scholar] [CrossRef]
  68. Lopez-Sanchez, M.; Llana-Funez, S. An evaluation of different measures of dynamically recrystallized grain size for paleopiezometry or paleowattometry studies. Solid Earth 2015, 6, 475–495. [Google Scholar] [CrossRef] [Green Version]
  69. Underwood, E. Quantitative Stereology; Addison-Wesley: Reading, MA, USA, 1970. [Google Scholar]
  70. Bai, Q.; Kohlstedt, D.L. High-temperature creep of olivine single crystals: 2, Dislocation structures. Tectonophysics 1992, 206, 1–29. [Google Scholar] [CrossRef]
  71. Toriumi, M. Relation between dislocation density and subgrain size of naturally deformed olivine in peridotites. Contrib. Mineral. Petrol. 1979, 68, 181–186. [Google Scholar] [CrossRef]
  72. Karato, S.; Toriumi, M.; Fujii, T. Dynamic recrystallization of olivine single crystals during high-temperature creep. Geophys. Res. Lett. 1980, 7, 649–652. [Google Scholar] [CrossRef]
  73. Van der Wal, D.; Chopra, P.; Drury, M.; Gerald, J.F. Relationships between dynamically recrystallized grain-size and deformation conditions in experimentally deformed olivine rocks. Geophys. Res. Lett. 1993, 20, 1479–1482. [Google Scholar] [CrossRef]
  74. Harrison, T.M. Diffusion of 40Ar in hornblende. Contrib. Mineral. Petrol. 1980, 78, 324–331. [Google Scholar] [CrossRef]
  75. Lips, A.L.W.; White, S.H.; Wijbrans, J.R. 40Ar/39Ar laser-probe direct dating of discrete deformational events: A continuous record of Early Alpine tectonics in the Pelagonian Zone, NW Aegean area, Greece. Tectonophysics 1998, 298, 133–153. [Google Scholar] [CrossRef]
  76. Lips, A.L.W.; Wijbrans, J.R.; White, S.H. New insights from 40Ar/39Ar laser-probe dating of white mica fabrics from the Pelion Massif, Pelagonian Zone, Internal Hellenides, Greece: Implications for the timing of metamorphic episodes and tec- tonic events in the Aegean region. Geol. Soc. Lond. Spec. Publ. 1999, 156, 457–474. [Google Scholar] [CrossRef]
  77. Wijbrans, J.R.; Pringle, M.S.; Koppers, A.A.P.; Scheveers, R. Argon geochronology of small samples using the Vulcaan argon laser probe. Proc. K. Ned. Akad. Wet. 1995, 98, 185–218. [Google Scholar]
  78. Brey, G.P.; Köhler, T. Geothermobarometry in four-phase lherzolites II. New thermobarometers, and practical assessment of existing thermobarometers. J. Petrol. 1990, 31, 1353–1378. [Google Scholar] [CrossRef]
  79. Balhaus, C.; Berry, R.F.; Green, D.H. High pressure experimental calibration of the olivine–orthopyroxene–spinel oxygen geobarometer: Implications for the oxidation state of the upper mantle. Contrib. Mineral. Petrol. 1991, 107, 27–40. [Google Scholar] [CrossRef]
  80. Katayama, I.; Jung, H.; Karato, S. New type of olivine fabric from deformation experiments at modest water content and low stress. Geology 2004, 32, 1045–1048. [Google Scholar] [CrossRef] [Green Version]
  81. Jung, H.; Karato, S. Effects of water on dynamically recrystallized grain-size of olivine. J. Struct. Geol. 2001, 23, 1337–1344. [Google Scholar] [CrossRef]
  82. Asti, R.; Lagabrielle, Y.; Fourcade, S.; Corre, B.; Monie, P. How do continents deform during mantle exhumation? Insights from the northern Iberia inverted paleopassive margin, western Pyrenees (France). Tectonics 2019, 38, 1666–1693. [Google Scholar] [CrossRef]
  83. Harrison, T.M.; Célérier, J.; Aikman, A.B.; Hermann, J.; Heizler, M.T. Diffusion of 40Ar in muscovite. Geochim. Cosmochim. Acta 2009, 73, 1039–1051. [Google Scholar] [CrossRef]
  84. Poujol, M.; Boulvais, P.; Kosler, J. Regional-scale Cretaceous albitization in the Pyrenees; evidence from in situ U-Th-Pb dating of monazite, titanite and zircon. J. Geol. Soc. Lond. 2010, 167, 751–767. [Google Scholar] [CrossRef]
  85. Boutin, A.; de Saint Blanquat, M.; Poujol, M.; Boulvais, P.; de Parseval, P.; Rouleau, C.; Robert, J.F. Succession of Permian and Mesozoic metasomatic events in the eastern Pyrenees with emphasis on the Trimouns talc-chlorite deposit. Int. J. Earth Sci. 2015, 105, 747–770. [Google Scholar] [CrossRef]
  86. Sibuet, J.-C.; Srivastava, S.P.; Spakman, W. Pyrenean orogeny and plate tectonics. J. Geophys. Res. 2004, 109, B08104. [Google Scholar] [CrossRef] [Green Version]
  87. Bickert, M.; Cannat, M.; Tommasi, A.; Jammes, S.; Lavier, L. Strain localization in the root of detachment faults at a melt-starved mid-ocean ridge: A microstructural study of abyssal peridotites from the Southwest Indian Ridge. Geochem. Geophys. Geosyst. 2021, 22, e2020GC009434. [Google Scholar] [CrossRef]
  88. Evans, B.; Goetze, C. The temperature variation of hardness of olivine and its implication for polycrystalline yield stress. J. Geophys. Res. 1979, 84, 5505–5524. [Google Scholar] [CrossRef]
  89. Hansen, L.N.; Zimmerman, M.E.; Kohlstedt, D.L. Grain boundary sliding in San Carlos olivine: Flow law parameters and crystallographic-preferred orientation. J. Geophys. Res. 2011, 116, B08201. [Google Scholar] [CrossRef]
  90. McDonnell, R.D.; Peach, C.J.; vanRoermund, H.L.M.; Spiers, C.J. Effect of varying enstatite content on the deformation behavior of fine-grained synthetic peridotite under wet conditions. J. Geophys. Res. Atmos. 2000, 105.B6, 13535–13553. [Google Scholar] [CrossRef]
  91. Ji, S.; Wang, Z.; Wirth, R. Bulk flow strength of forsterite-enstatite composites as a function of forsterite content. Tectonophysics 2001, 341, 69–93. [Google Scholar] [CrossRef]
  92. Sundberg, M.; Cooper, R.F. Crystallographic preferred orientation produced by diffusional creep of harzburgite; effects of chemical interactions among phases during plastic flow. J. Geophys. Res. 2008, 113, B12208. [Google Scholar] [CrossRef]
  93. Tasaka, M.; Zimmerman, M.E.; Kohlstedt, D.L.; Stünitz, H.; Heilbronner, R. Rheological weakening of olivine + orthopyroxene aggregates due to phase mixing: Part 2. Microstructural development. J. Geophys. Res. Solid Earth 2017, 122, 7597–7612. [Google Scholar] [CrossRef] [Green Version]
  94. Tasaka, M.; Zimmerman, M.E.; Kohlstedt, D.L. Rheological weakening of olivine + orthopyroxene aggregates due to phase mixing: Effects of orthopyroxene volume fraction. J. Geophys. Res. Solid Earth 2020, 125, e2020JB019888. [Google Scholar] [CrossRef]
  95. Jin, D.; Karato, S.; Obata, M.; Rutter, E.H.; Boriani, A.; Brodie, K.H.; Burlini, L.; Treagus, S.H. Mechanisms of shear localization in the continental lithosphere; inference from the deformation microstructures of peridotites from the Ivrea Zone, northwestern Italy. J. Struct. Geol. 1998, 20, 195–209. [Google Scholar] [CrossRef]
  96. Chatzaras, V.; Tikoff, B.; Newman, J.; Withers, A.C.; Drury, M.R. Mantle strength of the San Andreas fault system and the role of mantle-crust feedbacks. Geology 2015, 43, 891–894. [Google Scholar] [CrossRef]
  97. Rebaï, S.; Philip, H.; Taboada, A. Modem tectonic stress field in the Mediterranean region: Evidence for variation in stress directions at different scales. Geophys. J. Int. 1992, 110, 106–140. [Google Scholar] [CrossRef] [Green Version]
  98. Handy, M.R. Flow laws for rocks containing two non-linear viscous phases: A phenomenological approach. J. Struct. Geol. 1994, 16, 287–301. [Google Scholar] [CrossRef]
  99. Newman, J. The influence of grain size and grain size distribution on methods for estimating paleostresses from twinning in carbonates. J. Struct. Geol. 1994, 16, 1589–1601. [Google Scholar] [CrossRef]
  100. Tikoff, B.; Wojtal, S.F. Displacement control of geologic structures. J. Struct. Geol. 1999, 21, 959–967. [Google Scholar] [CrossRef]
  101. Bürgmann, R.; Dresen, G. Rheology of the lower crust and upper mantle: Evidence from rock mechanics, geodesy, and field observations. Annu. Rev. Earth Planet. Sci. 2008, 36, 531–567. [Google Scholar] [CrossRef] [Green Version]
  102. Montési, L.G.J.; Zuber, M.T. A unified description of localization for application to large-scale tectonics. J. Geophys. Res. 2002, 107, ECV 1-1–ECV 1-21. [Google Scholar] [CrossRef]
Figure 1. (A) Tectonic map of the Pyrenean-Cantabrian orogenic belt indicating the location of Chaînons Béarnais-Jaca section line. The black box shows the location of the Turon de Técouère massif and the red circle the location of the Lherz massif. NPZ = North Pyrenean Zone; NPF = North Pyrenean Fault (B) The lithospheric-scale Chaînons Béarnais-Jaca geological section modified from [34]. The location of the exhumed peridotite bodies is shown on the cross section. (C) Geological map of the Chaînons Béarnais [44] and location of the Turon de Técouère peridotite massif. (D) Structural map of Turon de Técouère showing distribution of main mylonitic domains, modified after [12]. The locations of the studied samples are plotted on the map.
Minerals 11 01351 g001
Figure 2. Typical microstructures in the Turon de Técouère peridotite. In all photomicrographs lineation is parallel to the top edge and foliation is normal to the photomicrograph. (A) Protomylonite 95TT37. (B) Mylonite PTT9. (C) Ultramylonite PTT1. The white rectangle in A shows the location of the EBSD map in Figure 3A. (D) Pressure–temperature conditions of deformation (modified from [12]). Temperatures are based on the compositions of co-existing pyroxenes [78] and olivine + spinel [79]. S1, S2, and S3 correspond to stages 1, 2, and 3 (for more information see text and Figure 8). Ol: olivine; Opx: orthopyroxene; Cpx: clinopyroxene; Sp: spinel.
Minerals 11 01351 g002
Figure 3. Microstructure results from the present-day protomylonite. (A) Combined EBSD phase and inverse pole figure (IPF) map illustrating the microstructure of the protomylonite. The inverse pole figure map of olivine crystallographic axis orientation is colored relative to the lineation, which is parallel to the upper edge of the map (IPF-X coloring). Black lines correspond to grain boundaries. Black areas correspond to zero solutions (not-indexed domains). Step size is 8 μm. (B) Area- weighted distribution of olivine grain size from the map in (A). Olivine porphyroclasts tend be larger than 350 μm, whereas olivine grains in polyphase bands tend to be smaller than 350 μm (see text for more information). (C) Crystallographic preferred orientation (CPO), low-angle misorientation axes distribution, and misorientation angles distribution for olivine porphyroclasts. (D) Similar to (C) for olivine in the polyphase bands.
Minerals 11 01351 g003
Figure 4. Microstructure results from a polyphase band in the present-day protomylonite. The location of the EBSD map is shown in Figure 3A. (A) Combined EBSD phase and inverse pole figure (IPF) map illustrating the microstructure of the polyphase band. The inverse pole figure map of olivine crystallographic axis orientation is colored relative to the lineation, which is parallel to the upper edge of the map (IPF-X coloring). Black lines correspond to grain boundaries. Black areas correspond to zero solutions (not-indexed domains). Step size is 0.8 μm. (B) Frequency distribution of olivine grain size calculated as the equivalent circular diameter from the map in (A). (C) Crystallographic preferred orientation (CPO), distribution of low-angle misorientation axes, and misorientation angles distribution for olivine in the polyphase band.
Minerals 11 01351 g004
Figure 5. Microstructure results from the present-day ultramylonite. (A) Combined EBSD phase and inverse pole figure (IPF) map illustrating the microstructure of the polyphase band. The inverse pole figure map of olivine crystallographic axis orientation is colored relative to the lineation, which is parallel to the upper edge of the map (IPF-X coloring). Black lines correspond to grain boundaries. Black areas correspond to zero solutions (not-indexed domains). Step size is 8 μm. (B) Detail of the map in (A). Step size is 0.7 μm. (CE) Frequency distributions of olivine grain size for olivine in polycrystalline porphyroclasts (C), fine-grained olivine rich bands in the polyphase matrix (D), and olivine in the polyphase matrix (E).
Minerals 11 01351 g005
Figure 6. Crystallographic preferred orientation (CPO) and misorientation results from the present-day ultramylonite. (A) Combined EBSD phase and inverse pole figure (IPF) map illustrating the microstructure of the polyphase band. The inverse pole figure map of olivine crystallographic axis orientation is colored relative to the lineation, which is parallel to the upper edge of the map (IPF-X coloring). Black lines correspond to grain boundaries. Black areas correspond to zero solutions (not-indexed domains). Step size is 8 μm. (B) CPO, distribution of low-angle misorientation axes, and misorientation angles distribution for olivine porphyroclasts from (A). (C) Same as (B) for olivine in the polycrystalline porphyroclast from area (C). (D). Same as (B) for olivine in a fine-grained, olivine-rich band from area (D). (E) Same as (B) for olivine in the polyphase matrix in area (E).
Minerals 11 01351 g006
Figure 7. 40Ar/39Ar ages plotted vs. the amount of 39Ar for amphibole veins from the Lherz and Turon de Técouère peridotite bodies. Results are presented with 2σ analytical errors. 40Ar/39Ar data are presented in Tables S1 and S2.
Minerals 11 01351 g007
Figure 8. (A) Microstructural evolution of Turon de Técouère peridotite as temperatures and pressures decreased from conditions of ~1000 °C at ~1.0 GPa to ~750 °C at ~0.5 GPa. The coarse granular tectonite, protomylonite, and mylonite domains of Stage 1 evolved into the present-day (Stage 3) protomylonite, mylonite, and ultramylonite, respectively. (B) Olivine deformation mechanism maps constructed using the flow laws of [88,89]. We used the piezometric calibrations of [72,73] (grey lines), to show the relationship between recrystallized grain size and differential stress (in Stage 1 and 2). The symbols plotted on the maps correspond to the stresses estimated by the different paleopiezometers and to the mean grain size of the load-bearing microstructure.
Minerals 11 01351 g008
Table 1. Paleostress estimates.
Mylonite TypeDislocation DensitySubgrain SizeGrain Size
Density (m2)Stress (MPa)Ndsg (μm)Stress (MPa)d (μm)Stress (MPa)
BK92T79KTF80WCDG93KTF80
Protomylonite–95TT37
Porphyroclasts1.17 × 101363410576.4229281103--
Matrix8.21 × 1012478----3.2--
Mylonite–PTT9
Porphyroclasts2.85 × 10122263048.7168176---
Matrix8.46 × 101189----3.3--
Ultramylonite–PTT1, PTT2
Porphyroclasts3.35 × 10122502179.5154156102--
Polycrystalline porphyroclasts------685859
Fine-grained olivine-matrix------428388
Matrix6.77 × 101170----3.1--
N: number of subgrains measured; dsg: subgrain size; d: grain size; BK92: dislocation density in olivine paleopiezometer of [70]; T79: subgrain size paleopiezometer of [71]; KTF80: subgrain size and recrystallized grain size paleopiezometers of [72]; WCDG93: recrystallized grain size paleopiezometer of [73].
Publisher’s Note: MDPI stays neutral with regard to jurisdictional claims in published maps and institutional affiliations.

