Figure 1.
(
A,
B) Structure map showing the location of the Tarim Basin and Shunnan (SN) area (modified from [
30]). Dashed rectangle denotes the location of the study area. (
C) Palaeogeographic setting of the Shunnan area (study area) during the deposition of Lower Yingshan Formation (modified from Jiao, 2016; Zhang, 2016; Xiao, 2019) [
19,
31,
32]. (
D) Generalized stratigraphic column from the Lower Ordovician to Upper Ordovician (modified from Northwest Oilfield Company of SINOPEC).
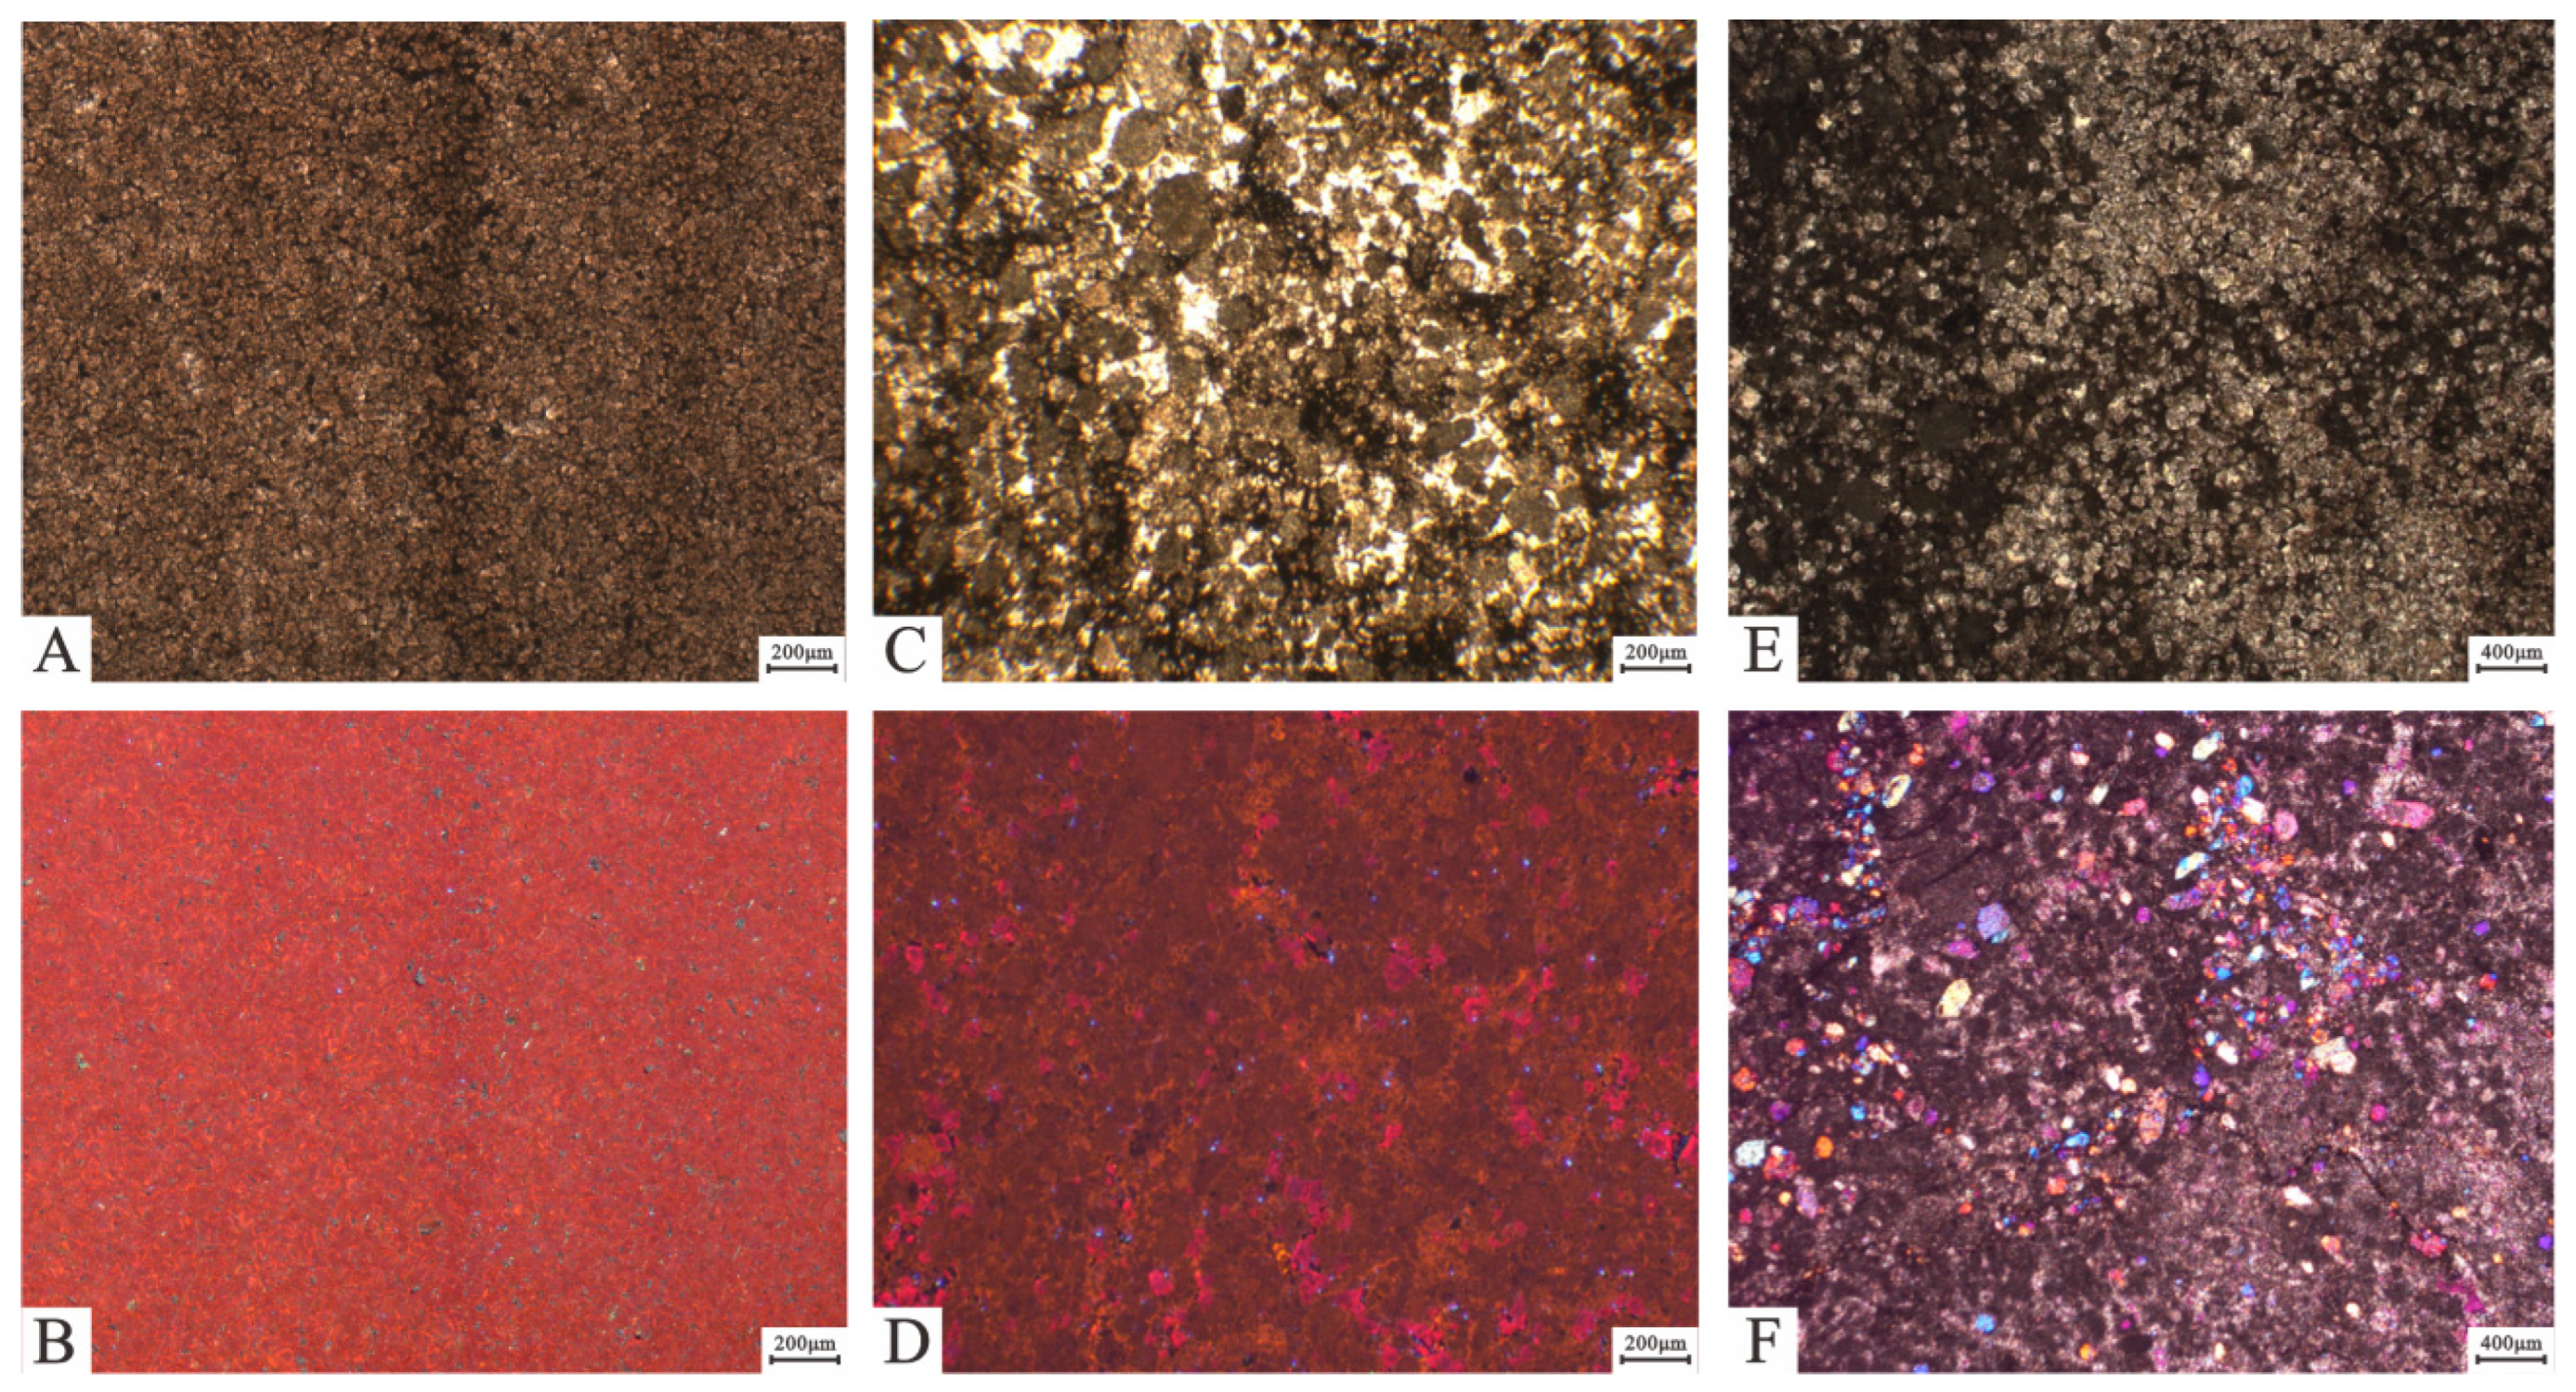
Figure 2.
Characteristics of powder crystal dolomite under plane-polarized light (PPL), cross-polarized light (CPL), and cathode luminescence (CL). (A) Powder crystalline dolomite with euhedral-subhedral structure. Well GL3, PPL, 6238.11 m. (B) Same view of (A) under CL, with dolomites showing dark orange-red. (C) Powder crystal dolomites showing speckled distribution in grainstones. Well GL3, PPL, 6162.58 m. (D) Same view of (C) under CL, powder crystal dolomites showing dark orange-red. (E) Powder crystal dolomites showing patchy distribution in packstones. Well GL3, PPL, 6163.63 m. (F) Hemihedral granular and short columnar anhydrites showing third-order purple to blue color (yellow arrows). Well SN5-1, CPL, 7007.16 m.
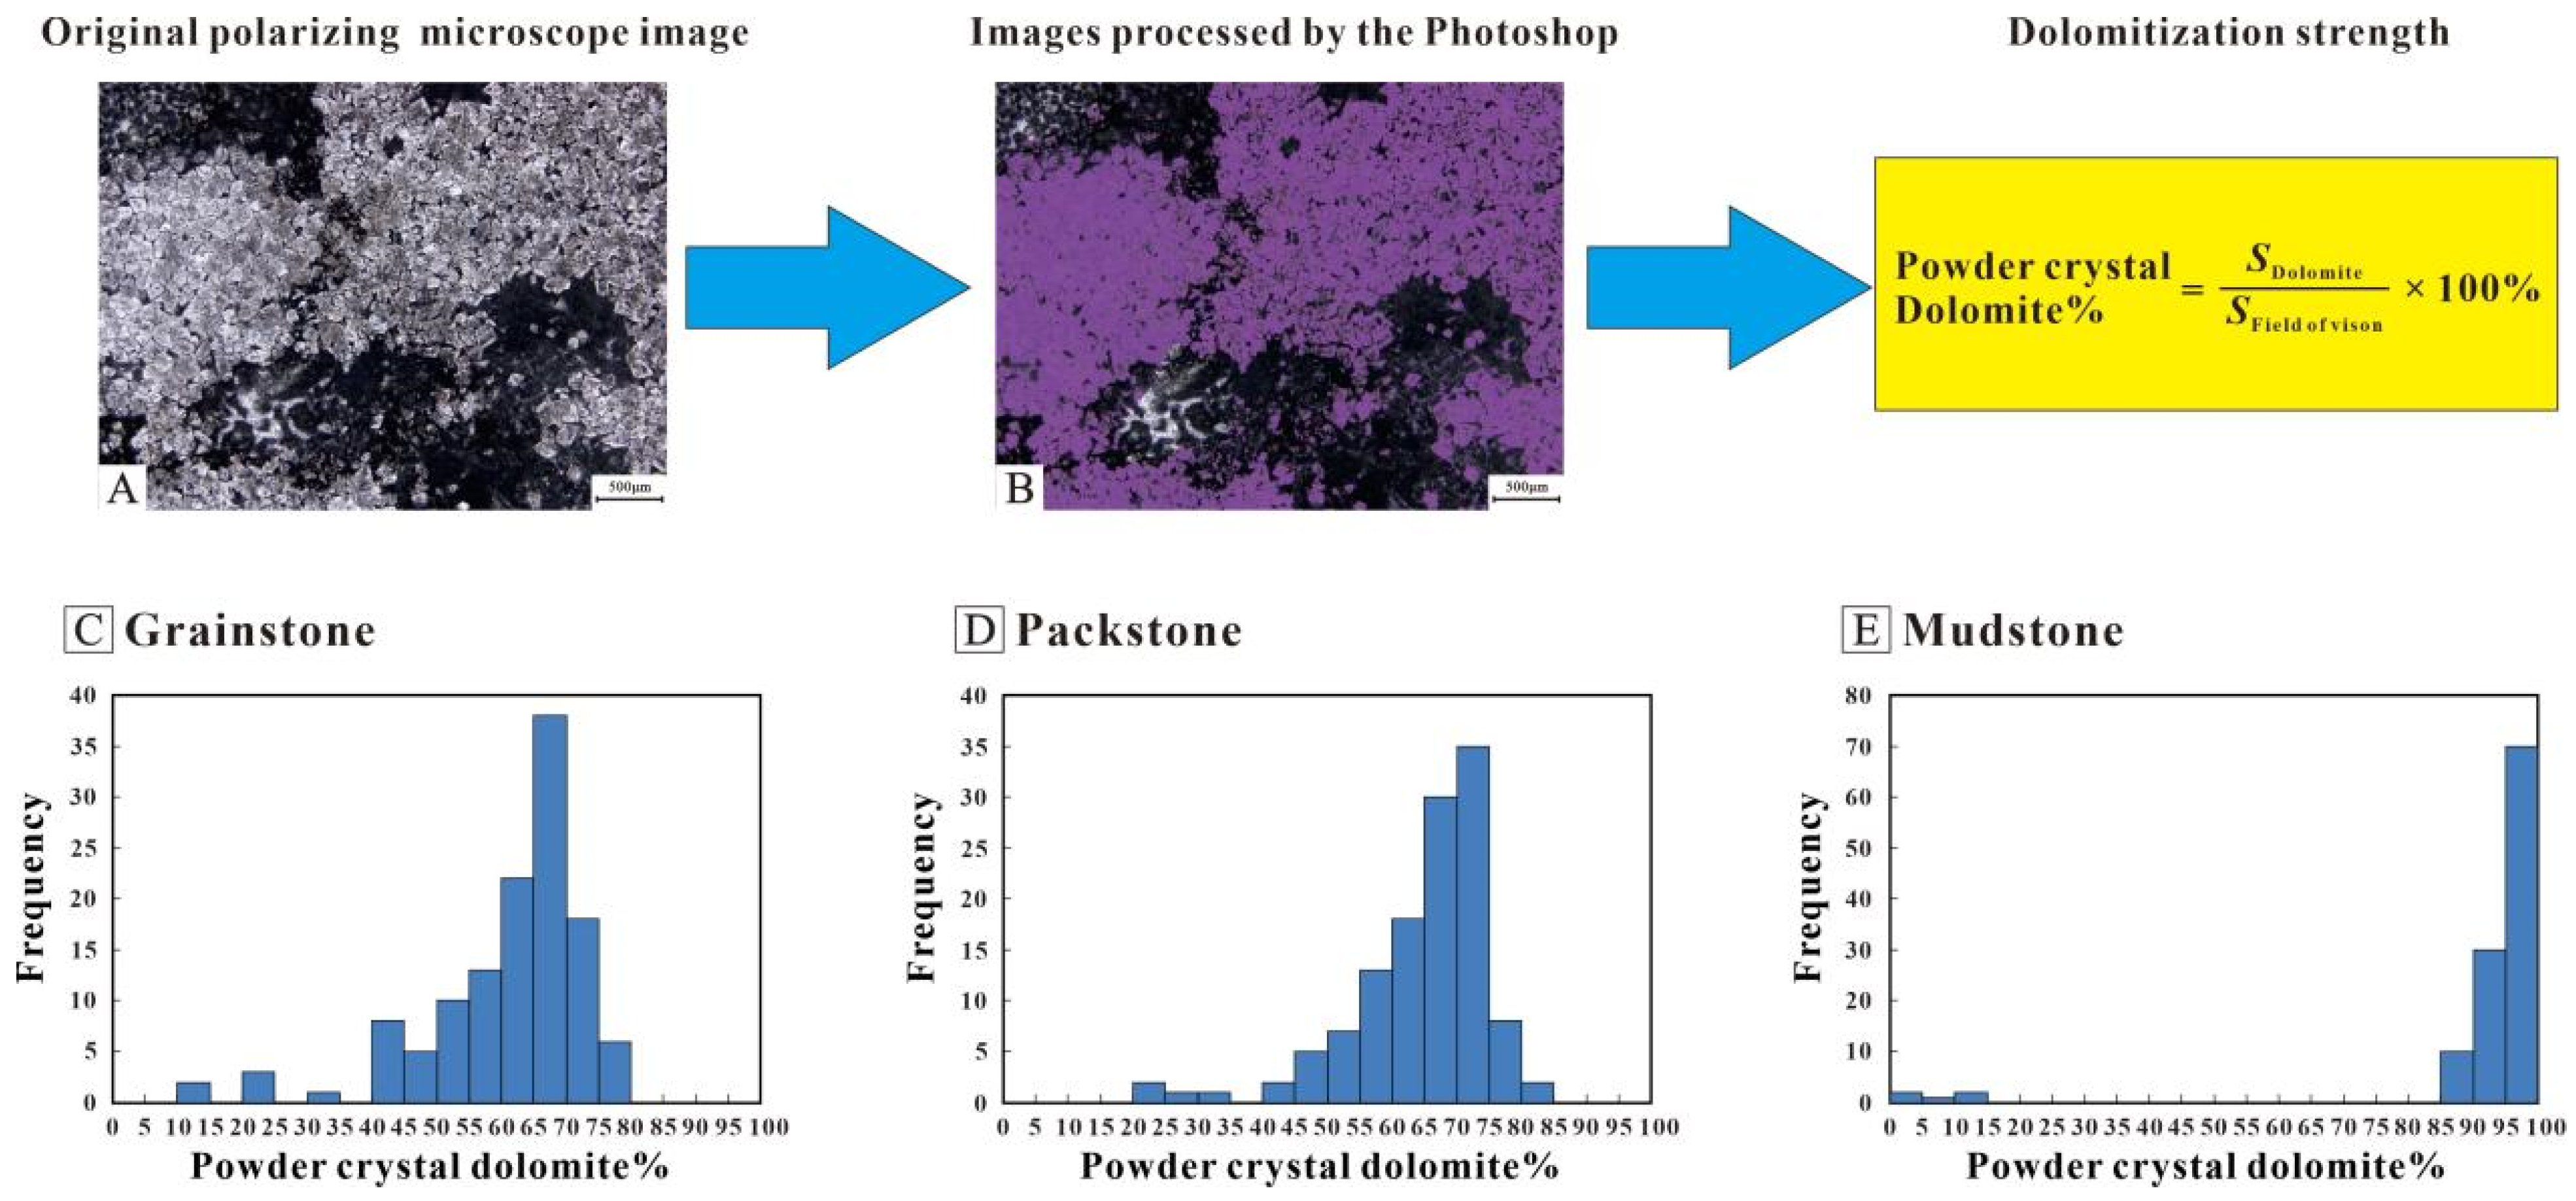
Figure 3.
Powder crystal dolomite content statistics. (A) Original images under PPL. (B) Images processed by Photoshop, the powder crystal dolomite showing purple in order to compute area. Sdolomite represents the area in purple, while the SField of vision represents the area of field of vision under polarized microscope. (C) The content distribution of powder crystal dolomite in grainstones. (D) The content distribution of powder crystal dolomite in packstones. (E) The content distribution of powder crystal dolomite in mudstones.
Figure 4.
Carbon and oxygen isotope characteristics of powder crystal dolomite and micritic limestone. The blue rectangle represents Early Ordovician marine carbonate rocks.
Figure 4.
Carbon and oxygen isotope characteristics of powder crystal dolomite and micritic limestone. The blue rectangle represents Early Ordovician marine carbonate rocks.
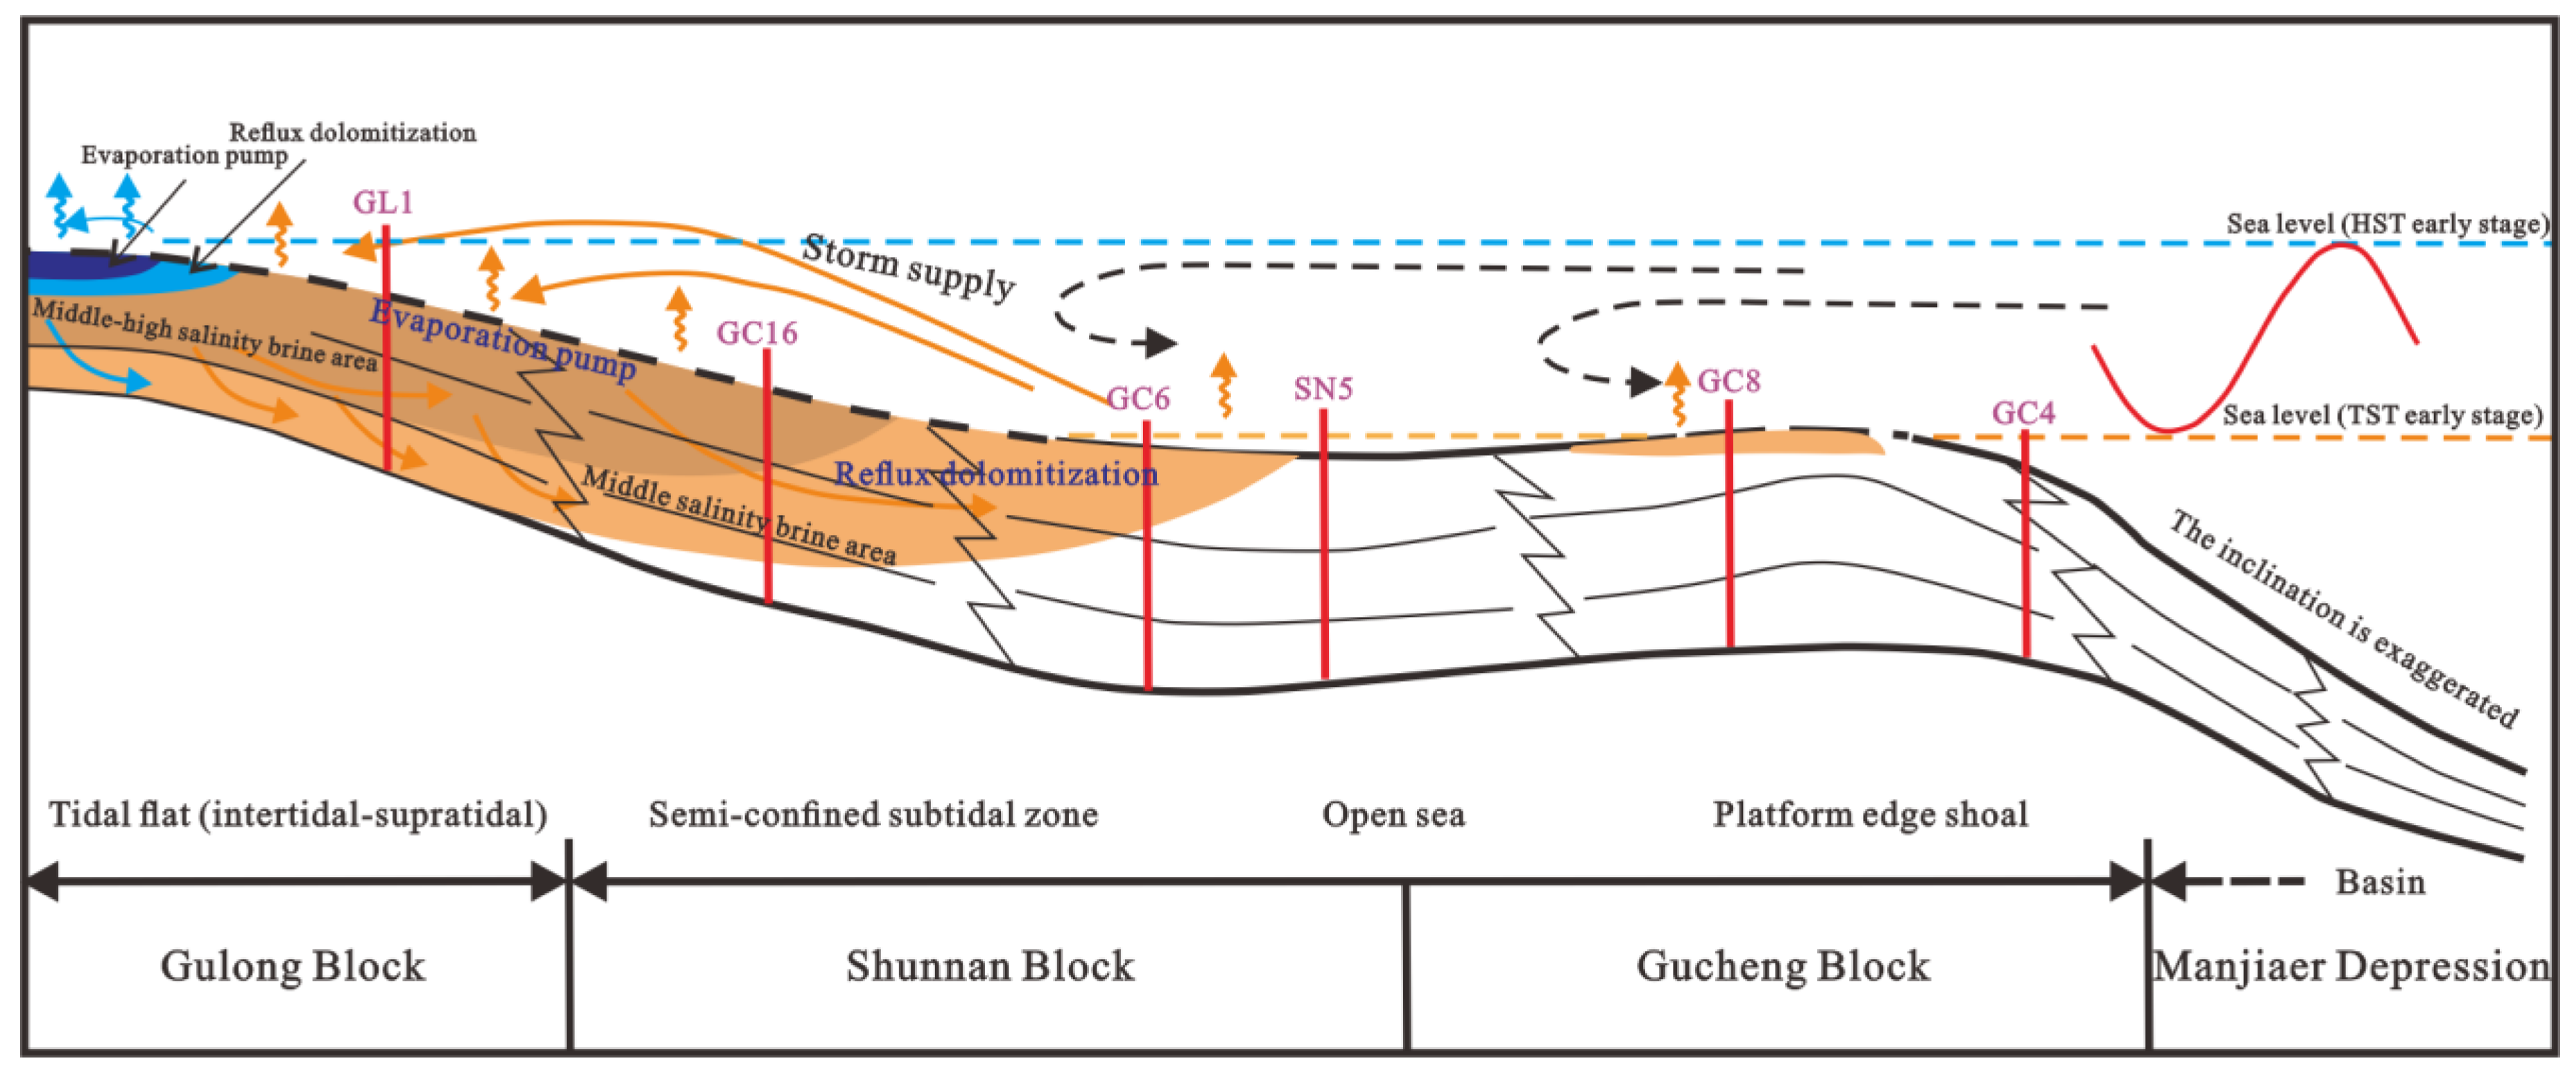
Figure 5.
Reflux dolomitization model of Lower Yingshan Formation in Shunnan area, Tarim Basin (modified from Northwest Oilfield Company of SINOPEC).
Figure 5.
Reflux dolomitization model of Lower Yingshan Formation in Shunnan area, Tarim Basin (modified from Northwest Oilfield Company of SINOPEC).
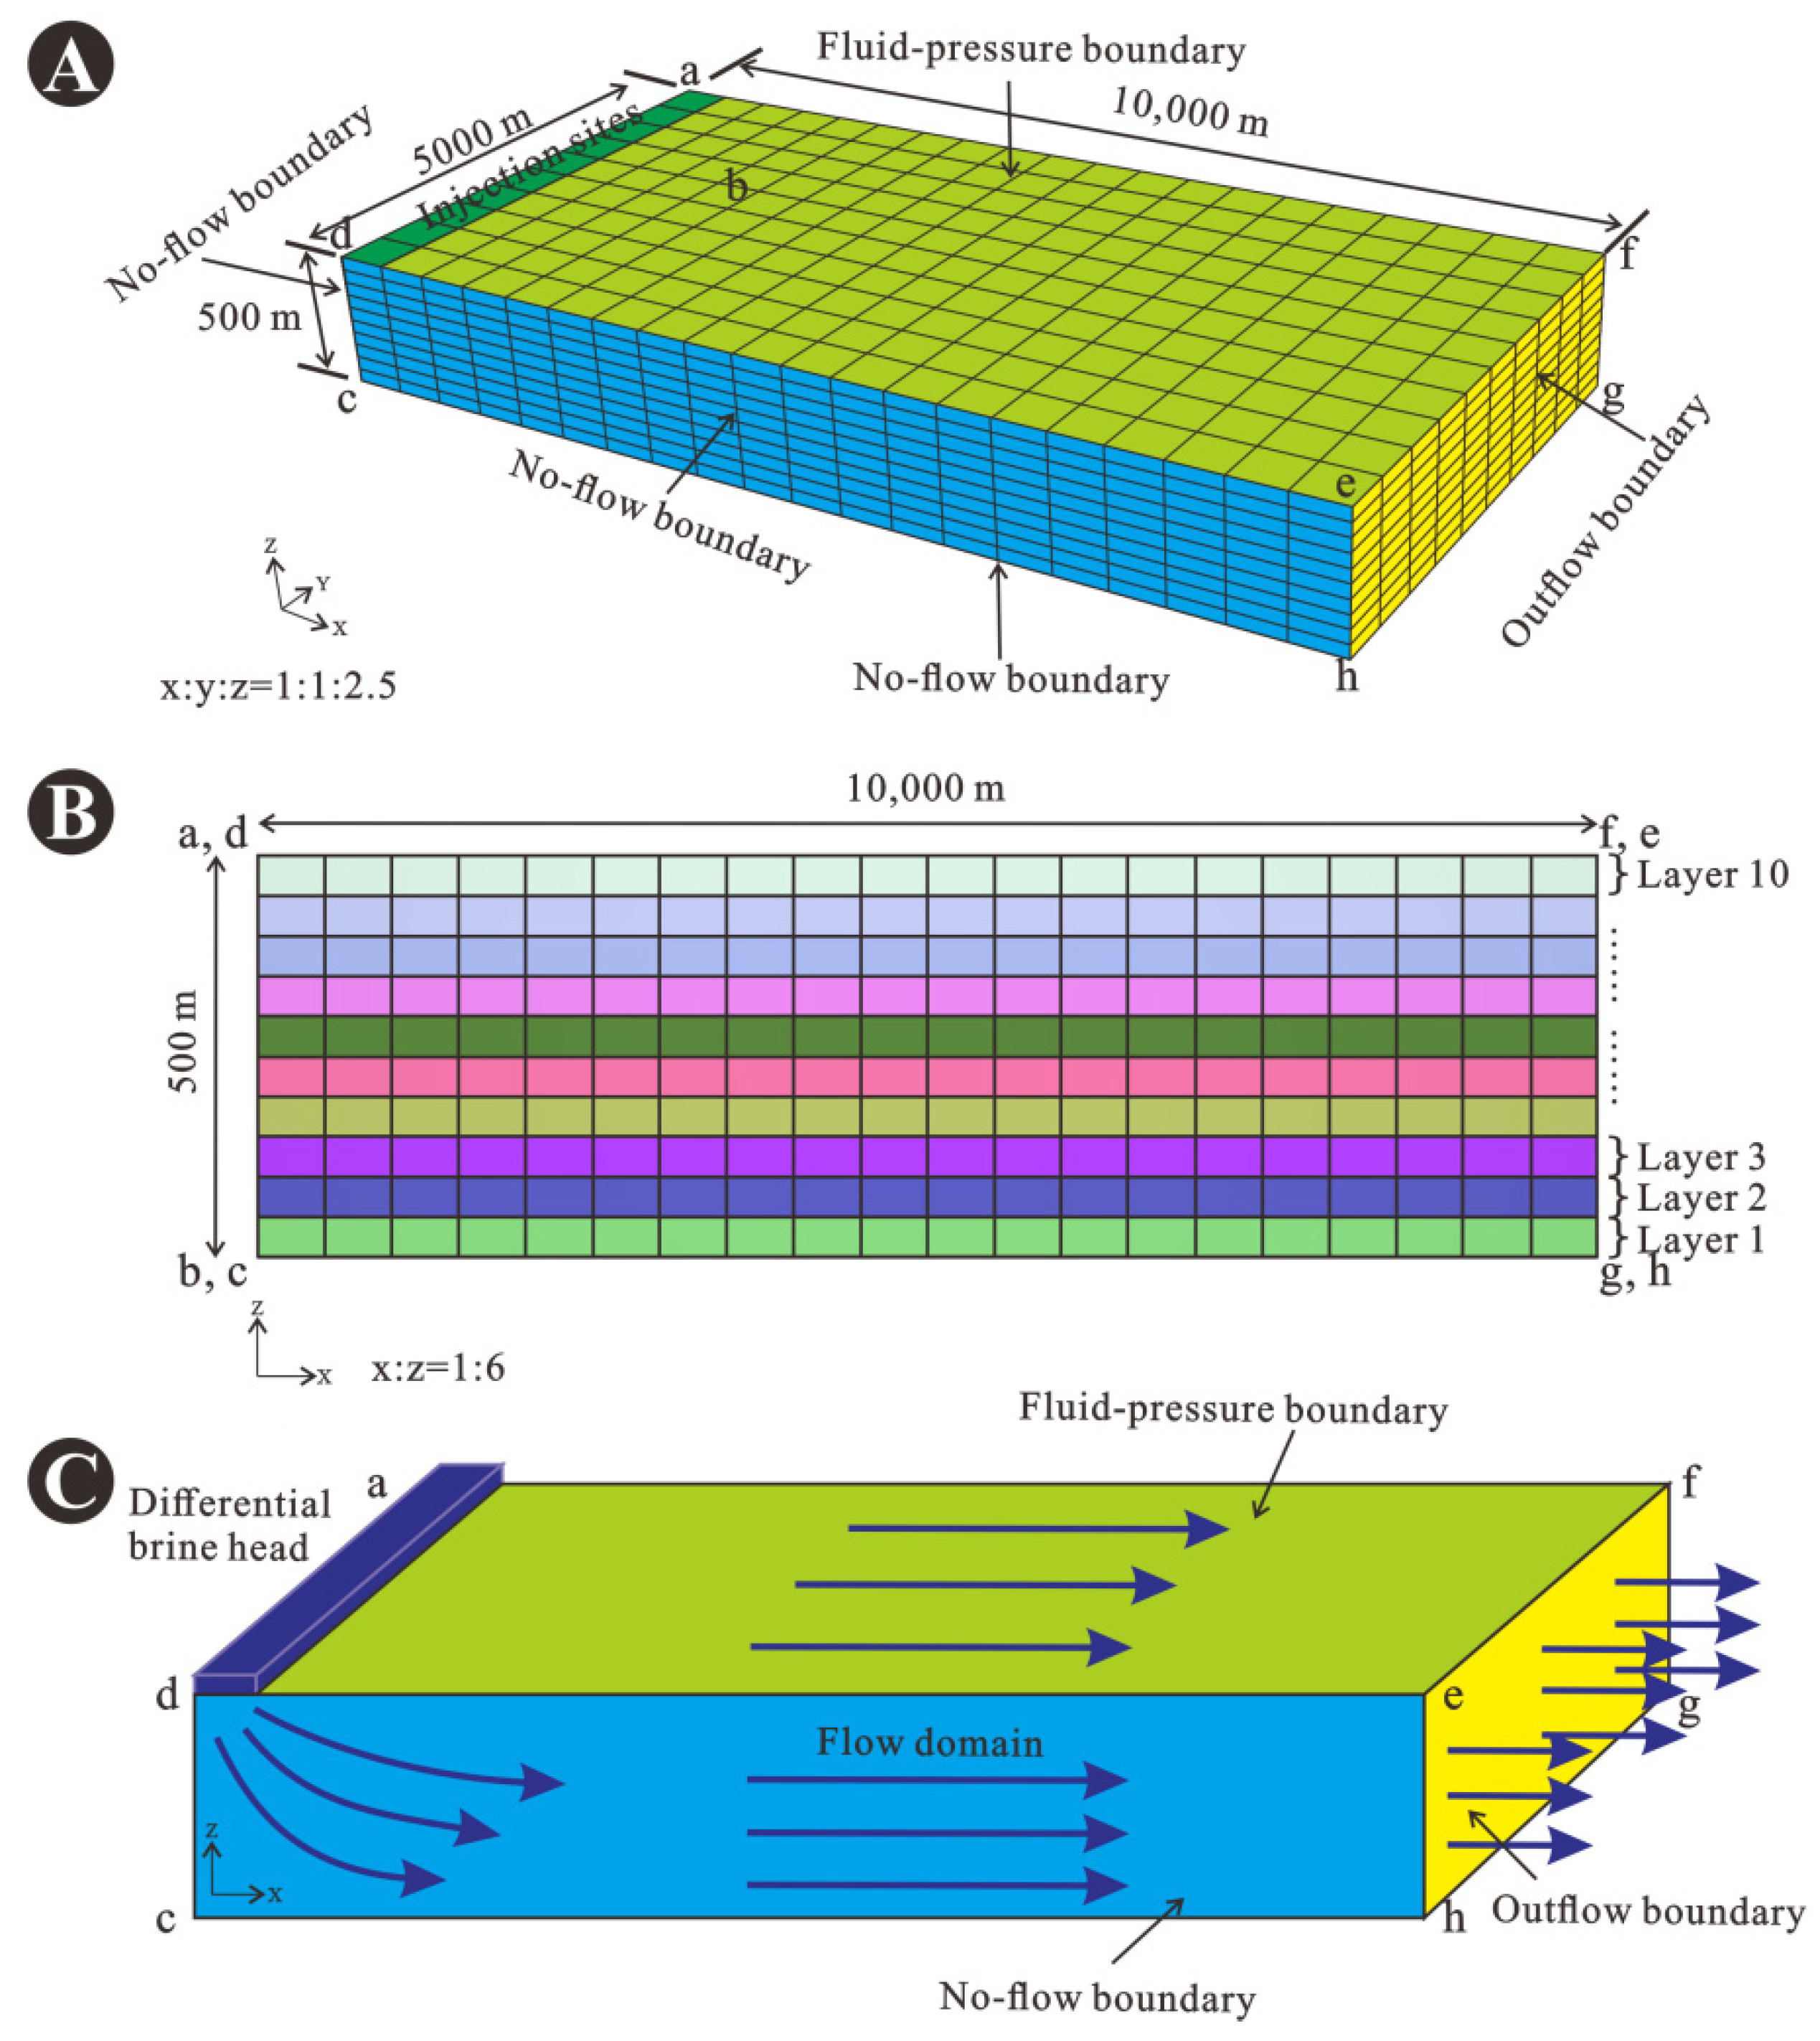
Figure 6.
(A) Three-dimensional image of the standard model grid representing the carbonate platform in the Shunnan area, the lower case letters a to h represent the eight vertices of the model. (B) Two-dimensional image of the finely gridded model, which was divided into 10 layers in the z-axis direction. (C) Hydrological representation of the mode.
Figure 7.
The cells selected to analyze the effect of reflux dolomitization on different locations. The coordinates of the three cells: Cell 1 (250, 250, −475), Cell 1601 (250, 250, −75), and Cell 19 (9250, 250, −475). The lower letters a to h represent the eight vertices of the model in
Figure 6.
Figure 7.
The cells selected to analyze the effect of reflux dolomitization on different locations. The coordinates of the three cells: Cell 1 (250, 250, −475), Cell 1601 (250, 250, −75), and Cell 19 (9250, 250, −475). The lower letters a to h represent the eight vertices of the model in
Figure 6.
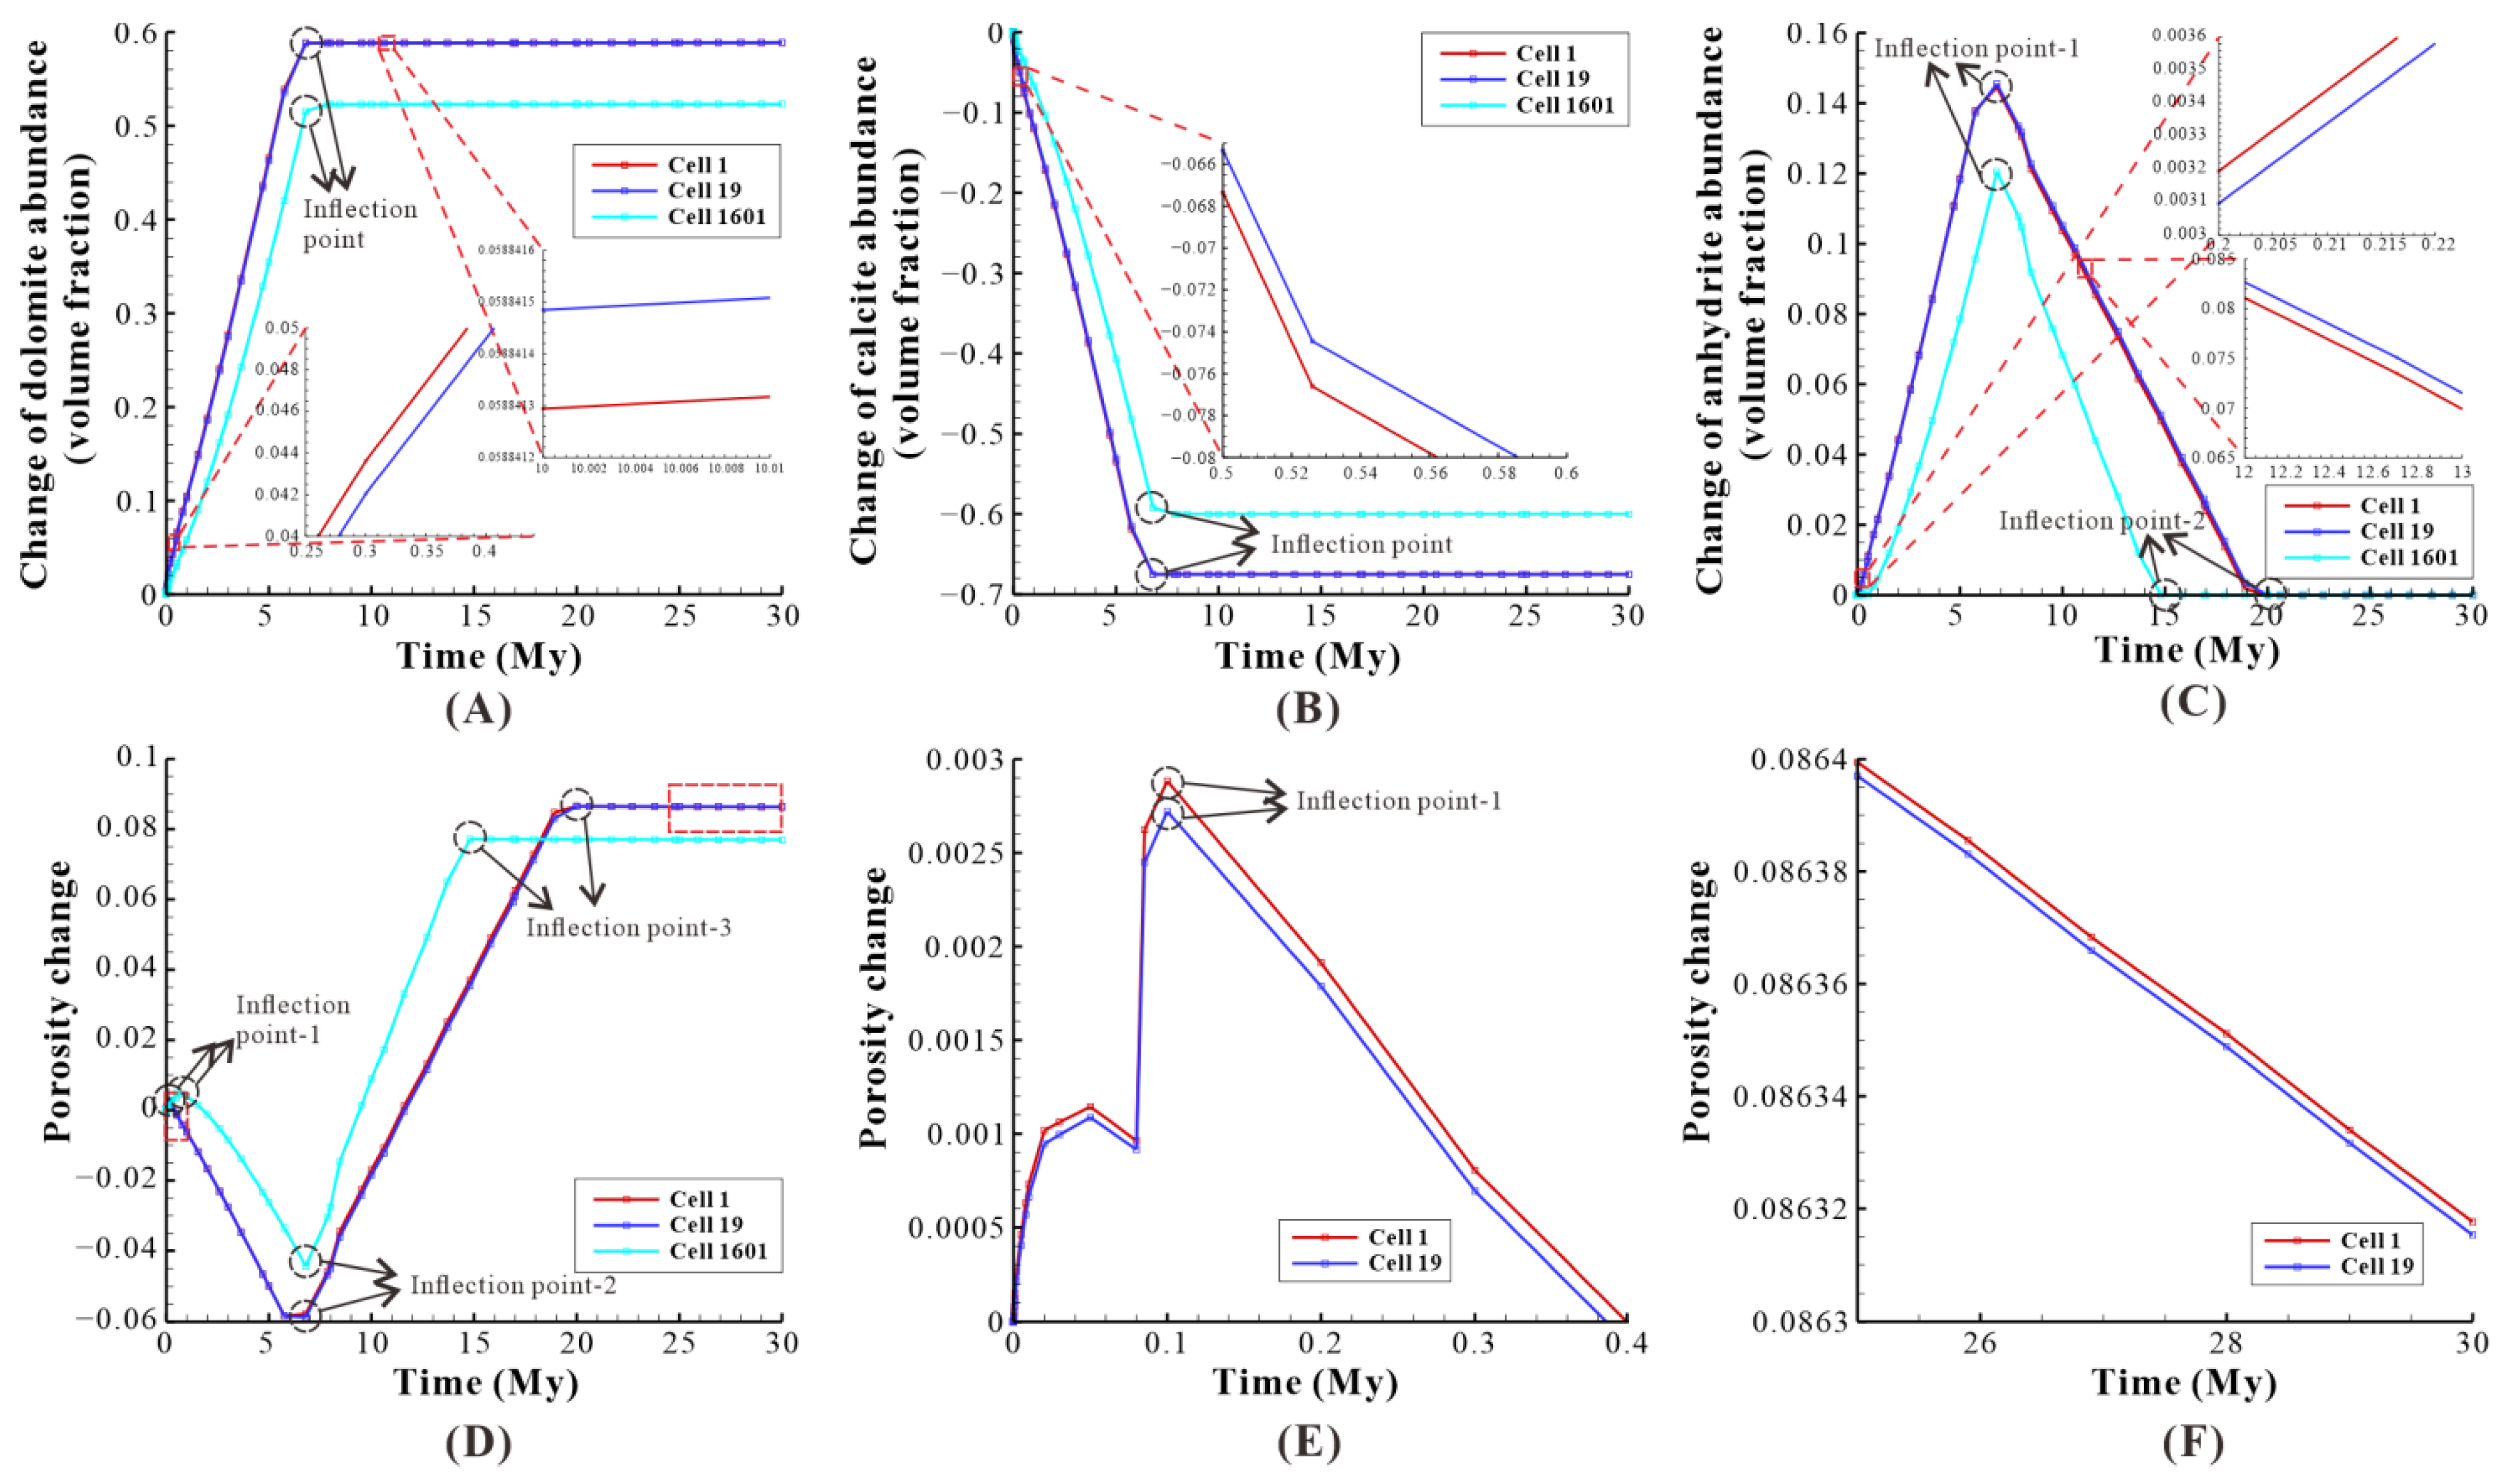
Figure 8.
The effect of reflux dolomitization on the three cells of the model: a case study of baseline. (A) The change of dolomite abundance of the three cells, with the red dotted rectangle representing local magnification; (B) The change of calcite abundance of the three cells, with the red dotted rectangle representing local magnification; (C) The change of anhydrite abundance of the three cells, with the red dotted rectangle representing local magnification; (D) The porosity change of the three cells, with the red dotted rectangles representing local magnification; (E,F) correspond to the first red dotted rectangle and second red dotted rectangle, respectively.
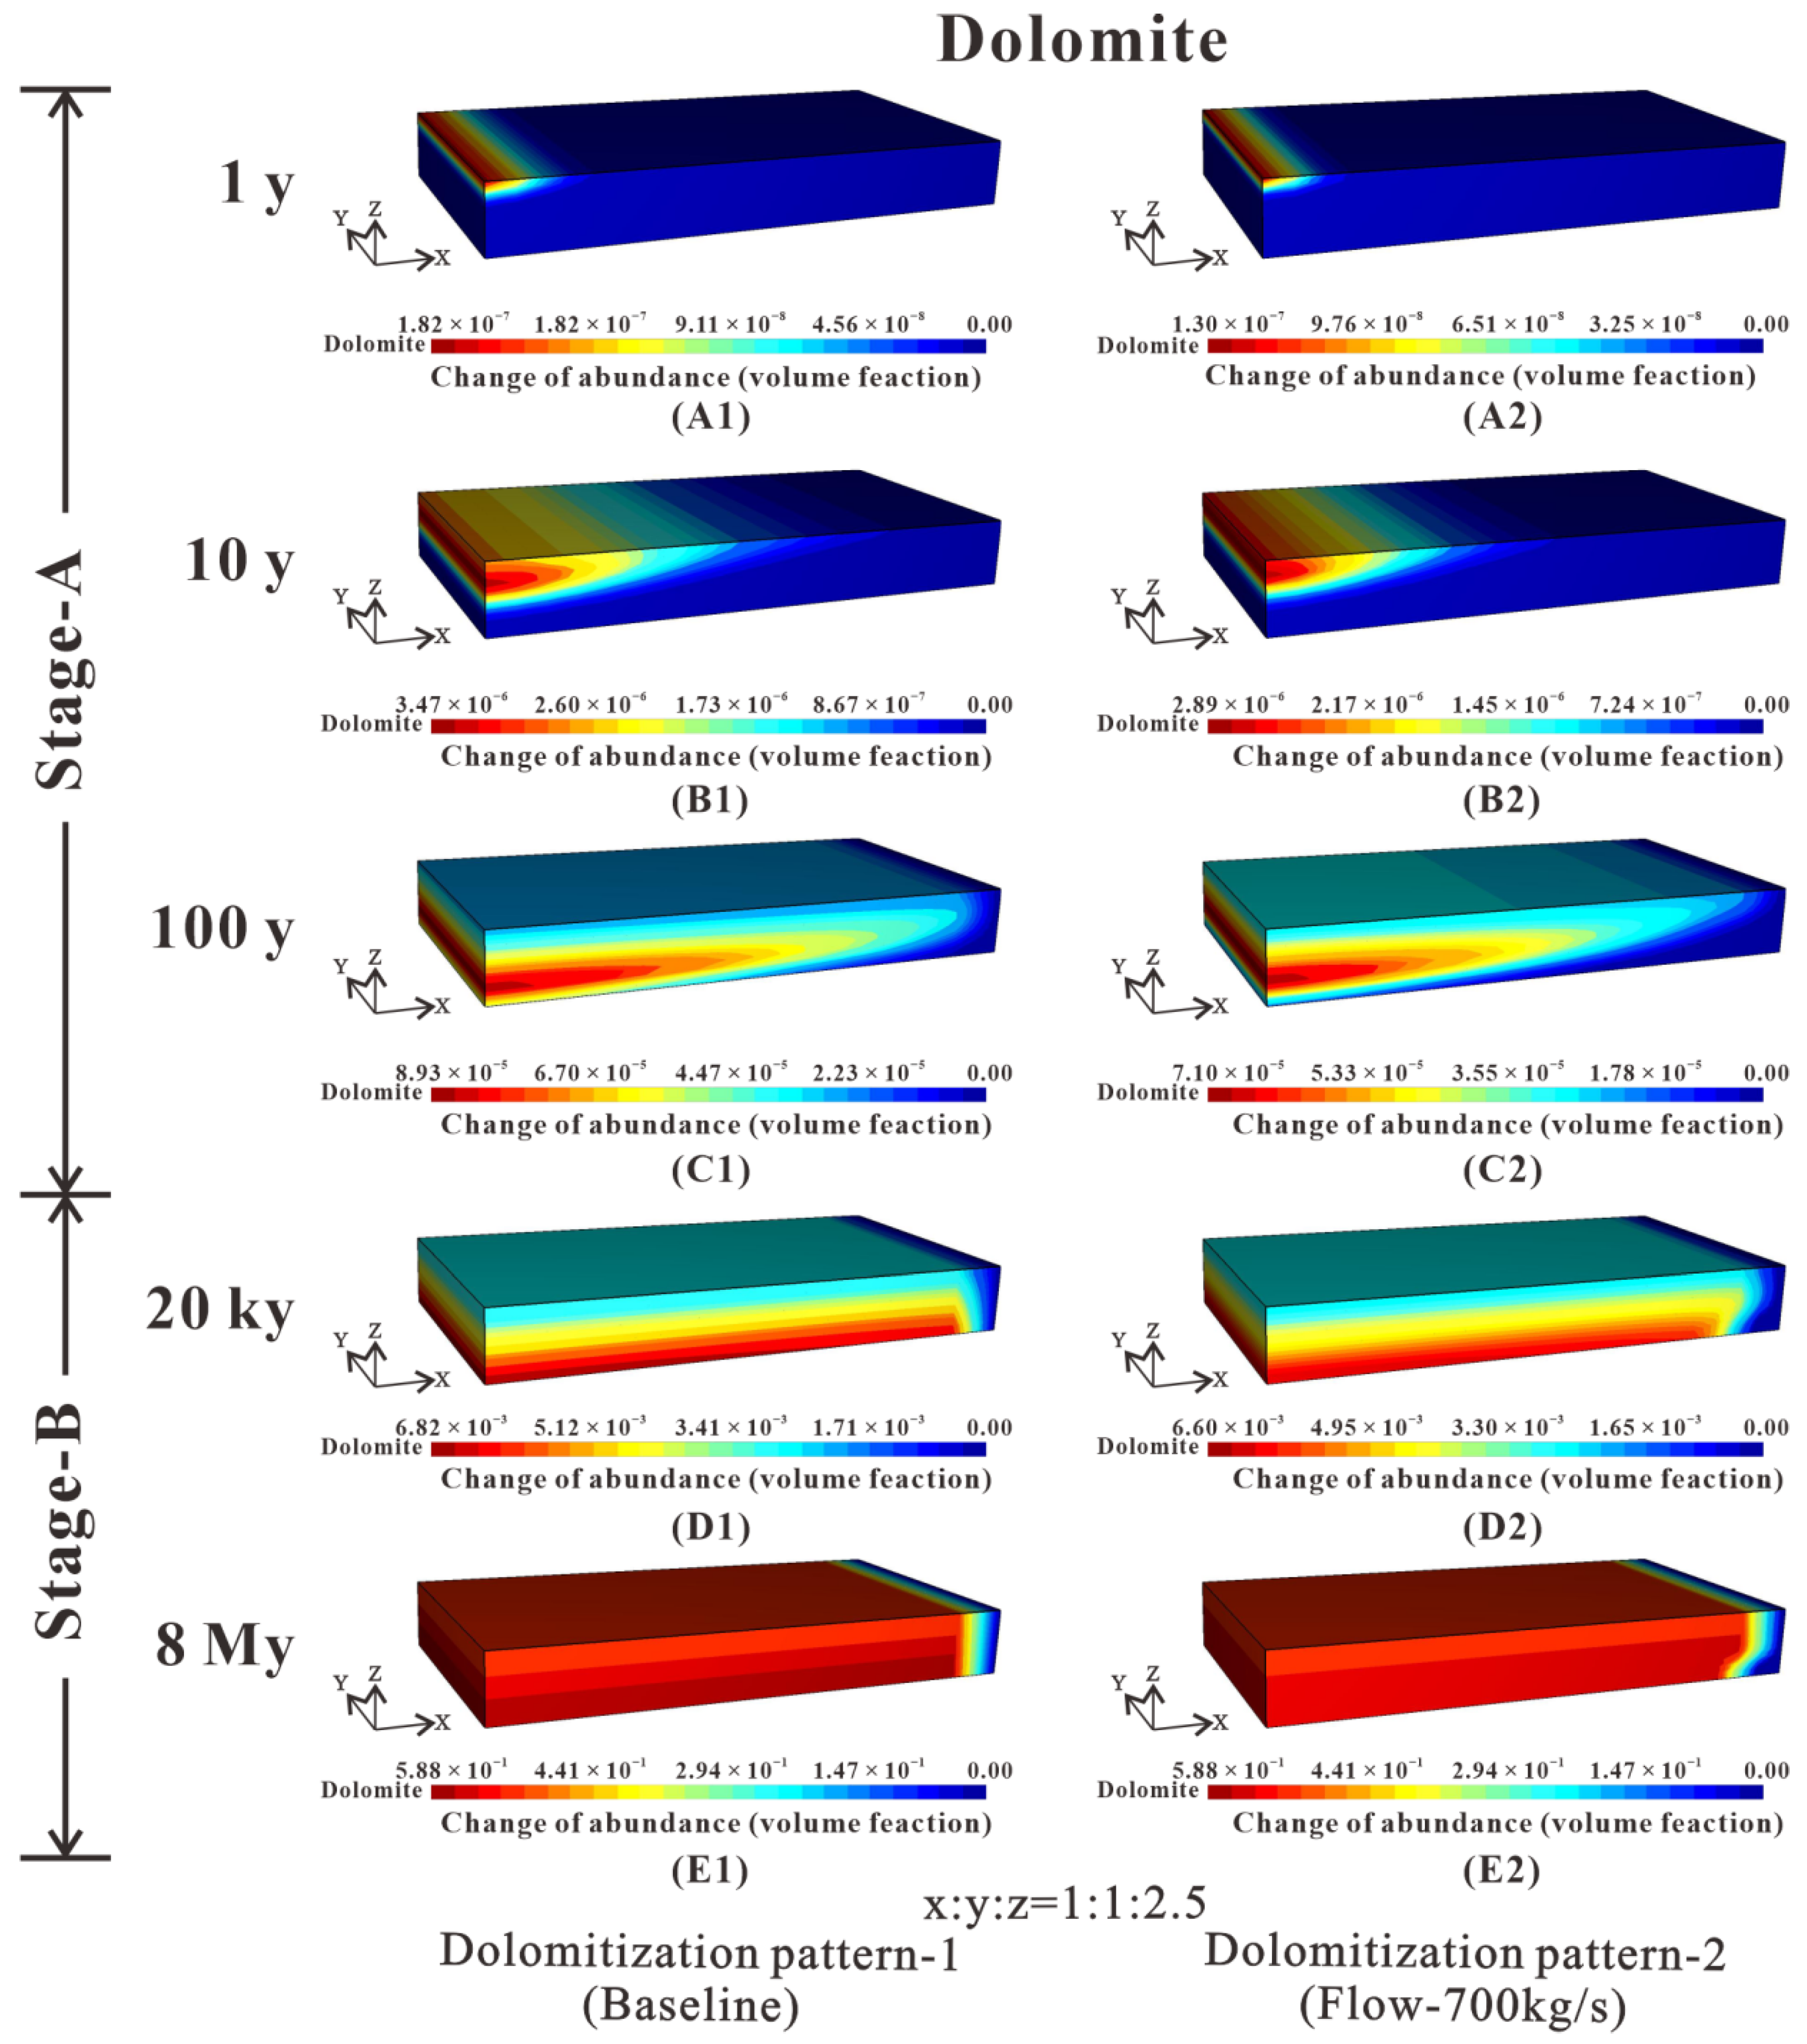
Figure 9.
Temporal and spatial evolution of dolomite abundance (volume %) change for three-dimensional block simulation at 1 y, 10 y, 100 y, 20 ky, and 8 My. According to the shape evolution of the dolomite front, two different dolomitization patterns are distinguished. Besides, based on the distribution of dolomite through time, two stages are found in both dolomitization patterns. (A1) Dolomite abundance distribution of the baseline in 1 y. (A2) Dolomite abundance distribution of the flow-700 kg/s in 1 y. (B1) Dolomite abundance distribution of the baseline in 10 y. (B2) Dolomite abundance distribution of the flow-700 kg/s in 10 y. (C1) Dolomite abundance distribution of the baseline in 100 y. (C2) Dolomite abundance distribution of the flow-700 kg/s in 100 y. (D1) Dolomite abundance distribution of the baseline in 20 ky. (D2) Dolomite abundance distribution of the flow-700 kg/s in 20 ky. (E1) Dolomite abundance distribution of the baseline in 8 My. (E2) Dolomite abundance distribution of the flow-700 kg/s in 8 My.
![Minerals 11 01340 g009]()
Figure 10.
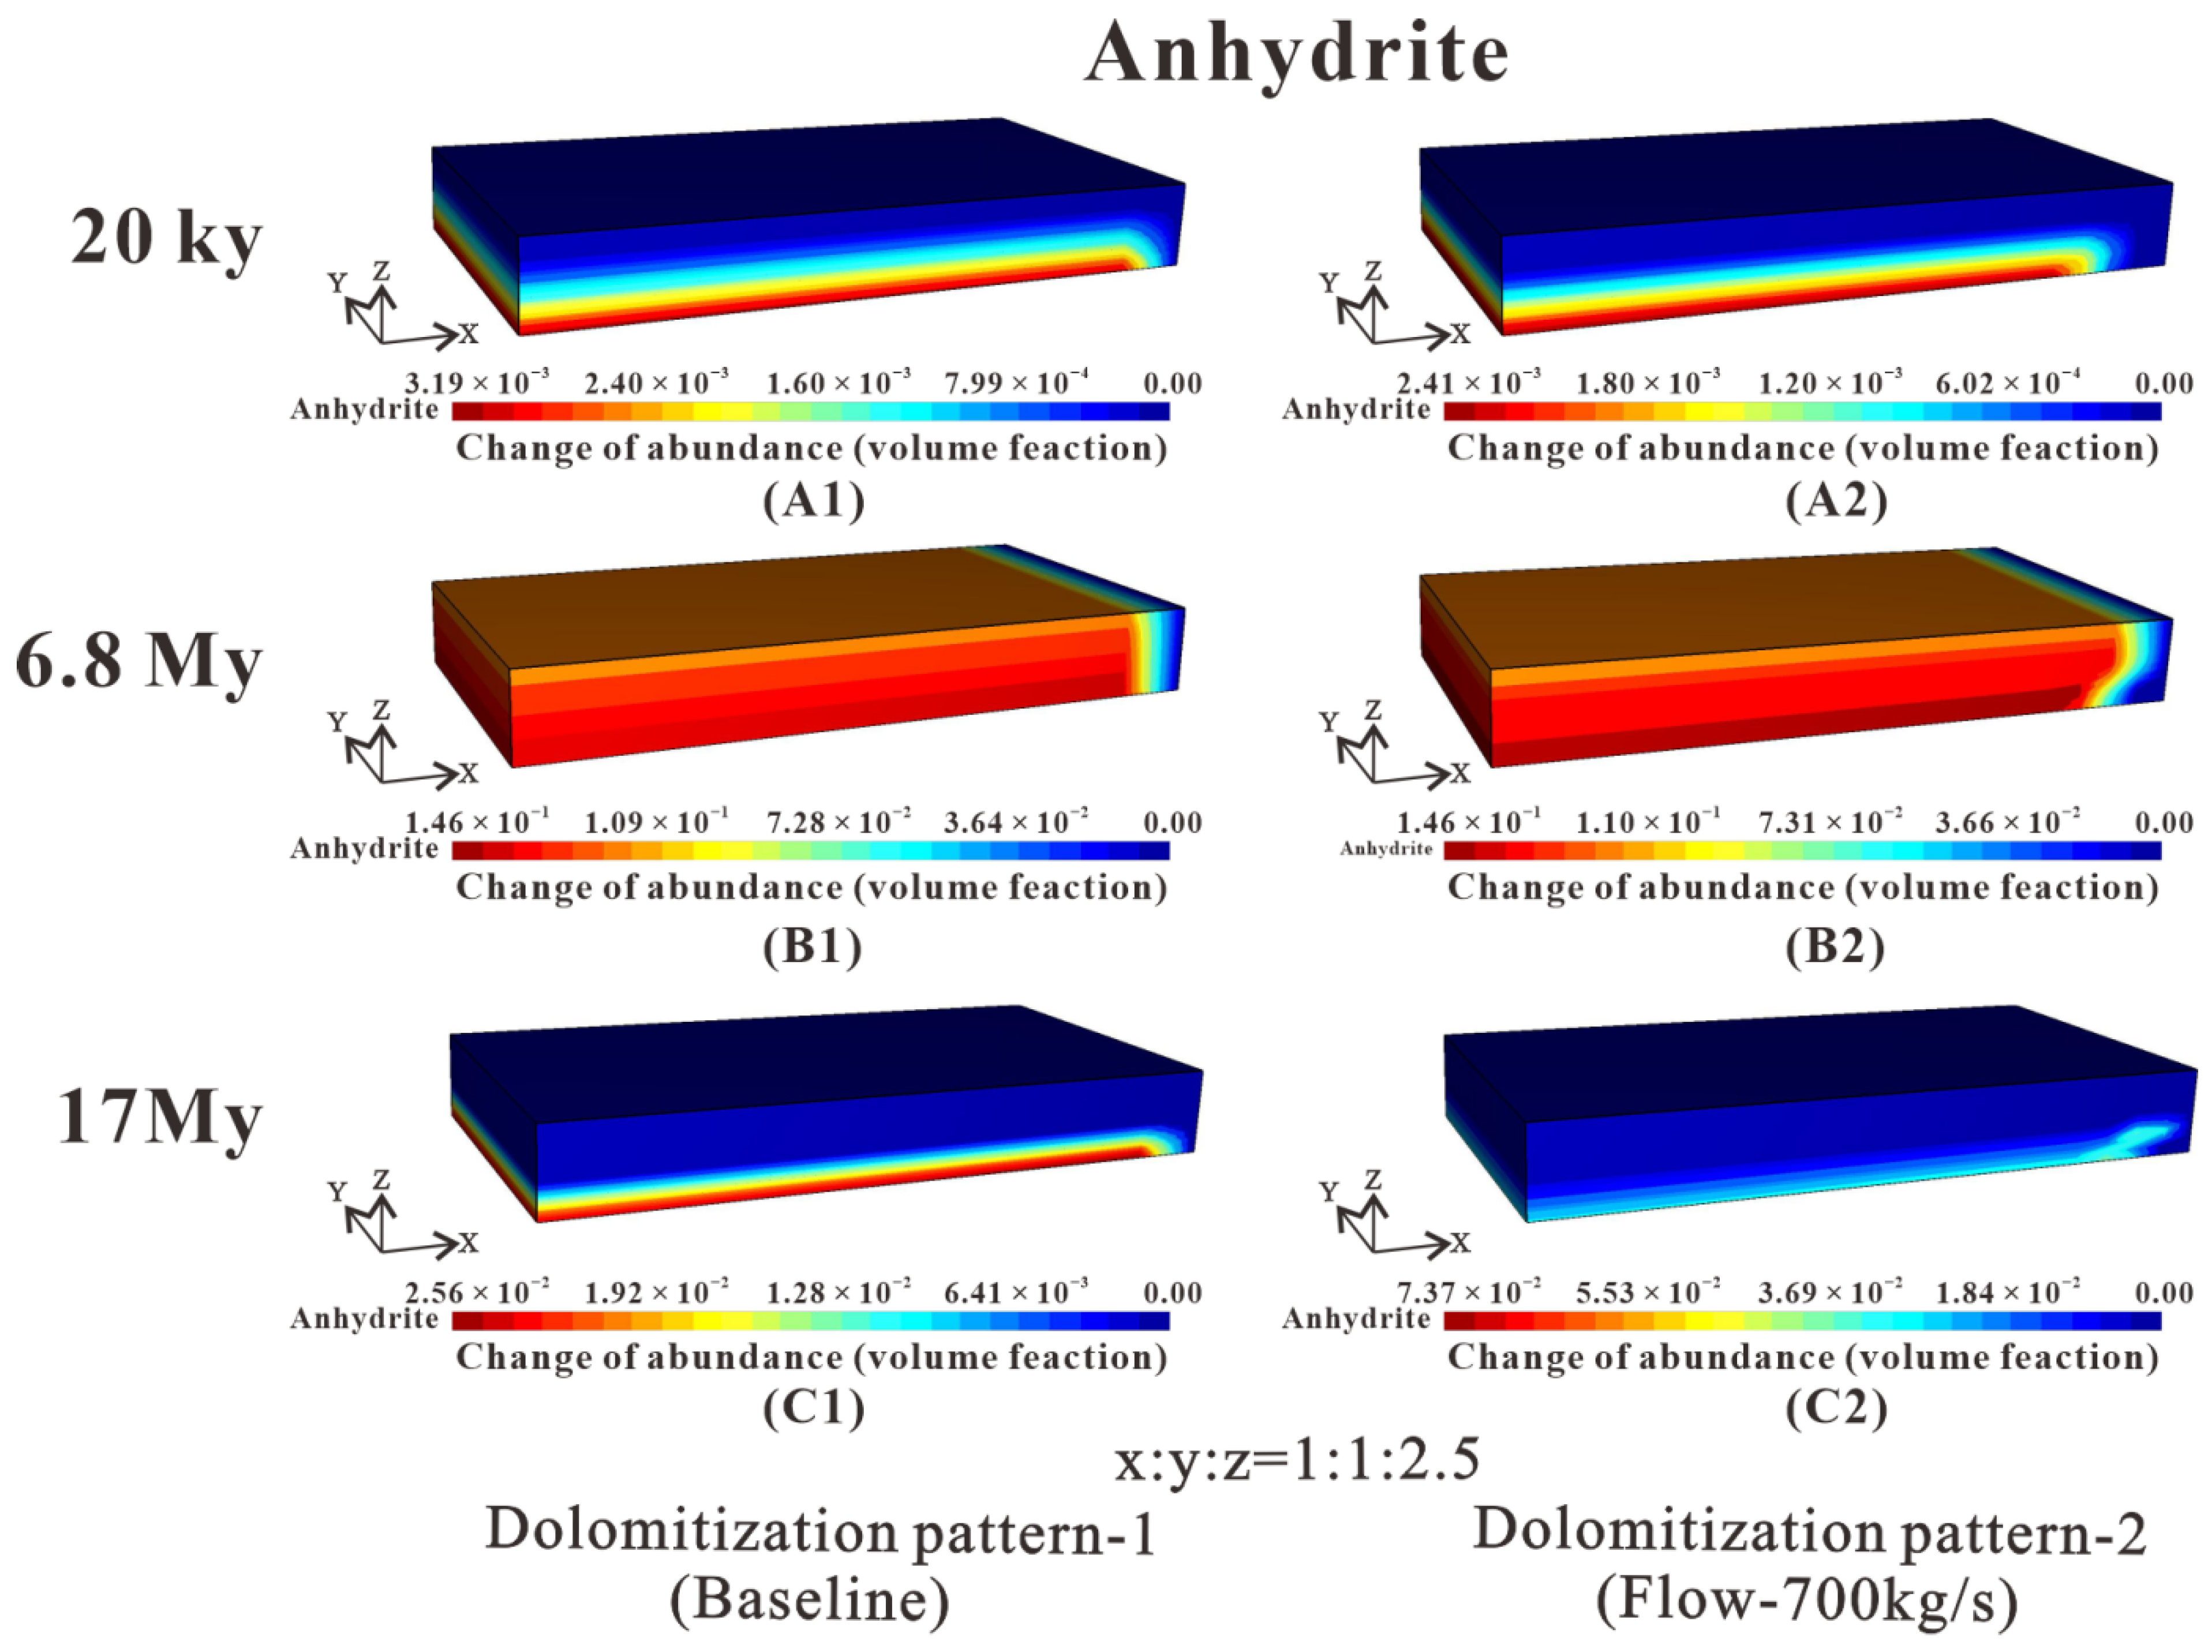
Temporal and spatial evolution of anhydrite abundance (volume %) change for three-dimensional block simulation at 20 ky, 8 My, and 17 My. According to the shape evolution of the anhydrite front, two different dolomitization patterns are distinguished. (A1) Anhydrite abundance distribution of the baseline in 20 ky. (A2) Anhydrite abundance distribution of the flow-700 kg/s in 20 ky. (B1) Anhydrite abundance distribution of the baseline in 6.8 My. (B2) Anhydrite abundance distribution of the flow-700 kg/s in 6.8 My. (C1) Anhydrite abundance distribution of the baseline in 17 My. (C2) Anhydrite abundance distribution of the flow-700 kg/s in 17 My.
Figure 10.
Temporal and spatial evolution of anhydrite abundance (volume %) change for three-dimensional block simulation at 20 ky, 8 My, and 17 My. According to the shape evolution of the anhydrite front, two different dolomitization patterns are distinguished. (A1) Anhydrite abundance distribution of the baseline in 20 ky. (A2) Anhydrite abundance distribution of the flow-700 kg/s in 20 ky. (B1) Anhydrite abundance distribution of the baseline in 6.8 My. (B2) Anhydrite abundance distribution of the flow-700 kg/s in 6.8 My. (C1) Anhydrite abundance distribution of the baseline in 17 My. (C2) Anhydrite abundance distribution of the flow-700 kg/s in 17 My.
Figure 11.
Temporal and spatial evolution of porosity and permeability (m2) change at 100 y, 20 ky, 8 My, 17 My, and 25 My in the baseline simulation. (A1) Porosity change distribution in 10 y. (A2) Permeability change distribution in 10 y. (B1) Porosity change distribution in 100 y. (B2) Permeability change distribution in 100 y. (C1) Porosity change distribution in 20 ky. (C2) Permeability change distribution in 20 ky. (D1) Porosity change distribution in 6.8 My. (D2) Permeability change distribution in 6.8 My. (E1) Porosity change distribution in 17 My. (E2) Permeability change distribution in 17 My. (F1) Porosity change distribution in 25 My. (F2) Permeability change distribution in 25 My.
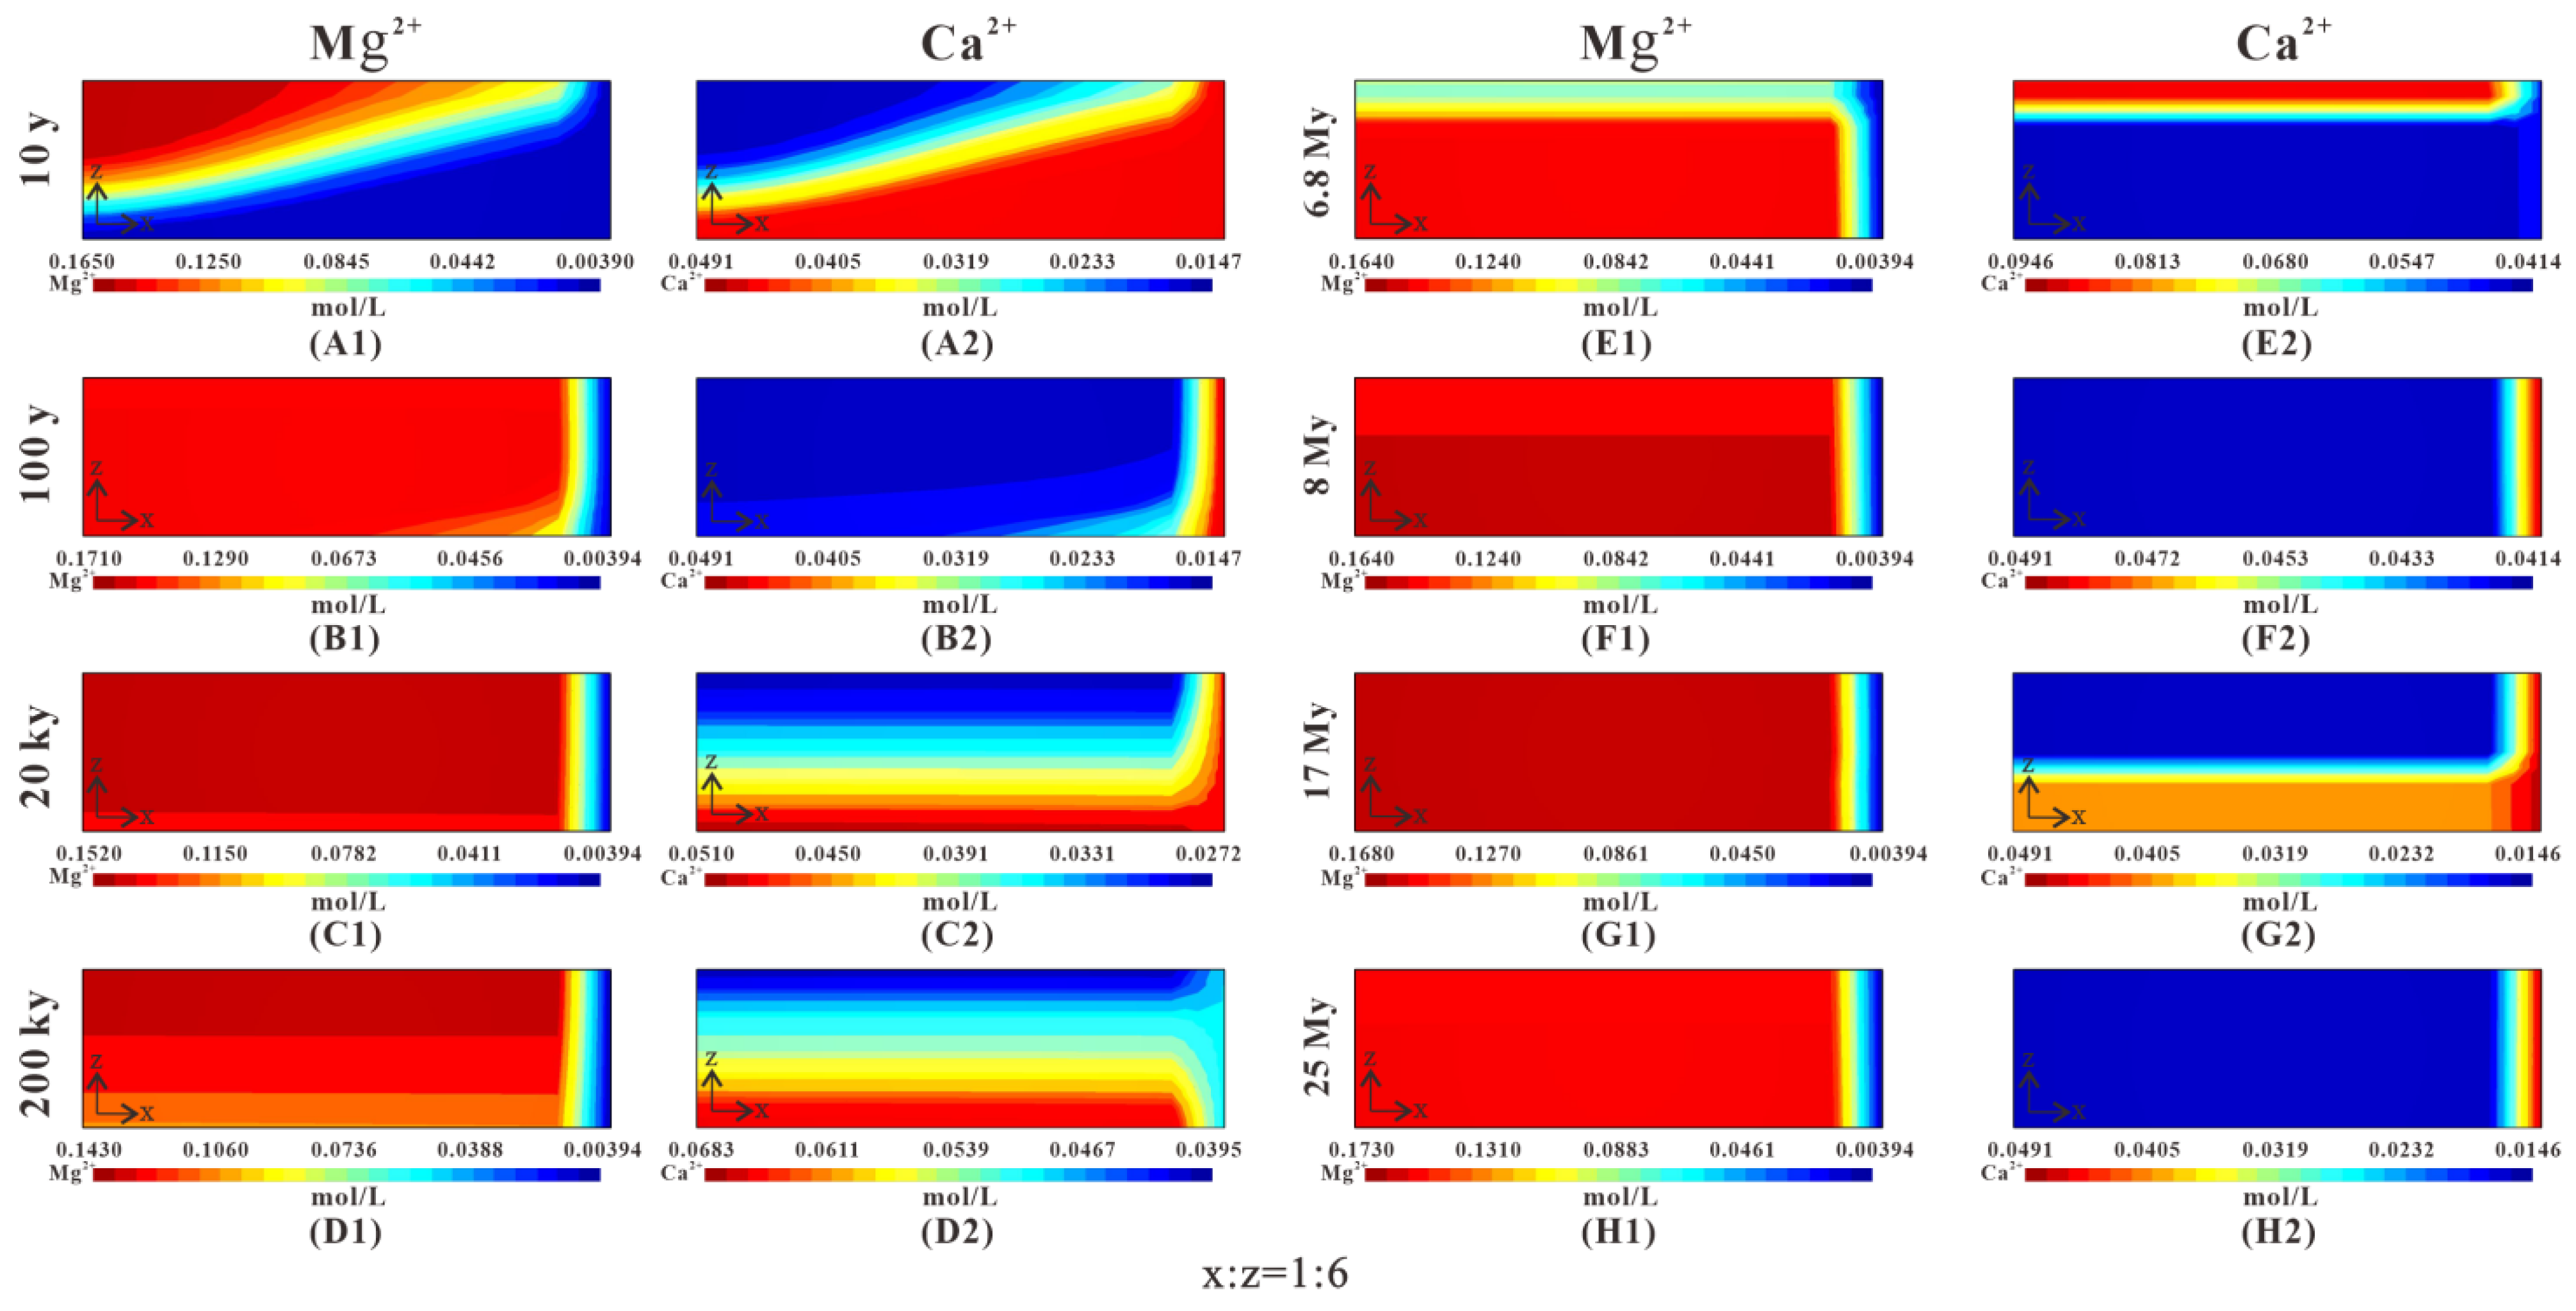
Figure 12.
Temporal and spatial evolution of fluid compositions: Mg2+ and Ca2+ at 10 y, 100 y, 20 ky, 200 ky, 6.8 My, 8 My, 17 My, and 25 My in the baseline simulation. (A1) Mg2+ concentration distribution in 10 y; (A2) Ca2+ concentration distribution in 10 y. (B1) Mg2+ concentration distribution in 10 y. (B2) Ca2+ concentration distribution in 100 y. (C1) Mg2+ concentration distribution in 20 ky. (C2) Ca2+ concentration distribution in 20 ky. (D1) Mg2+ concentration distribution in 200 ky. (D2) Ca2+ concentration distribution in 200 ky. (E1) Mg2+ concentration distribution in 6.8 My. (E2) Ca2+ concentration distribution in 6.8 My. (F1) Mg2+ concentration distribution in 8 My. (F2) Ca2+ concentration distribution in 8 My. (G1) Mg2+ concentration distribution in 17 My. (G2) Ca2+ concentration distribution in 17 My. (H1) Mg2+ concentration distribution in 25 My. (H2) Ca2+ concentration distribution in 25 My.
Figure 13.
Comparison of dolomite and anhydrite abundance change and porosity change after 5 My for rock fabrics of “grainstone” (baseline), “packstone” (Case 1), and “mudstone” (Case 2). (A1–A3) show the dolomite abundance change. (B1–B3) show the anhydrite abundance change. (C1–C3) show the porosity change.
Figure 14.
Comparison of dolomite and anhydrite abundance change and porosity change after 5 My for RSA of 100 cm2/g (Case 3), 1000 cm2/g (baseline), and 10,000 cm2/g (Case 4). (A1–A3) show the dolomite abundance change. (B1–B3) show the anhydrite abundance change. (C1–C3) show the porosity change.
Figure 14.
Comparison of dolomite and anhydrite abundance change and porosity change after 5 My for RSA of 100 cm2/g (Case 3), 1000 cm2/g (baseline), and 10,000 cm2/g (Case 4). (A1–A3) show the dolomite abundance change. (B1–B3) show the anhydrite abundance change. (C1–C3) show the porosity change.
Figure 15.
Comparison of dolomite and anhydrite abundance change and porosity change after 5 My for geothermal gradient of 1.80 °C/100 m (Case 5), 2.10 °C/100 m (baseline) and 2.68 °C/100 m (Case 6). (A1–A3) show the dolomite abundance change. (B1–B3) show the anhydrite abundance change. (C1–C3) show the porosity change.
Figure 16.
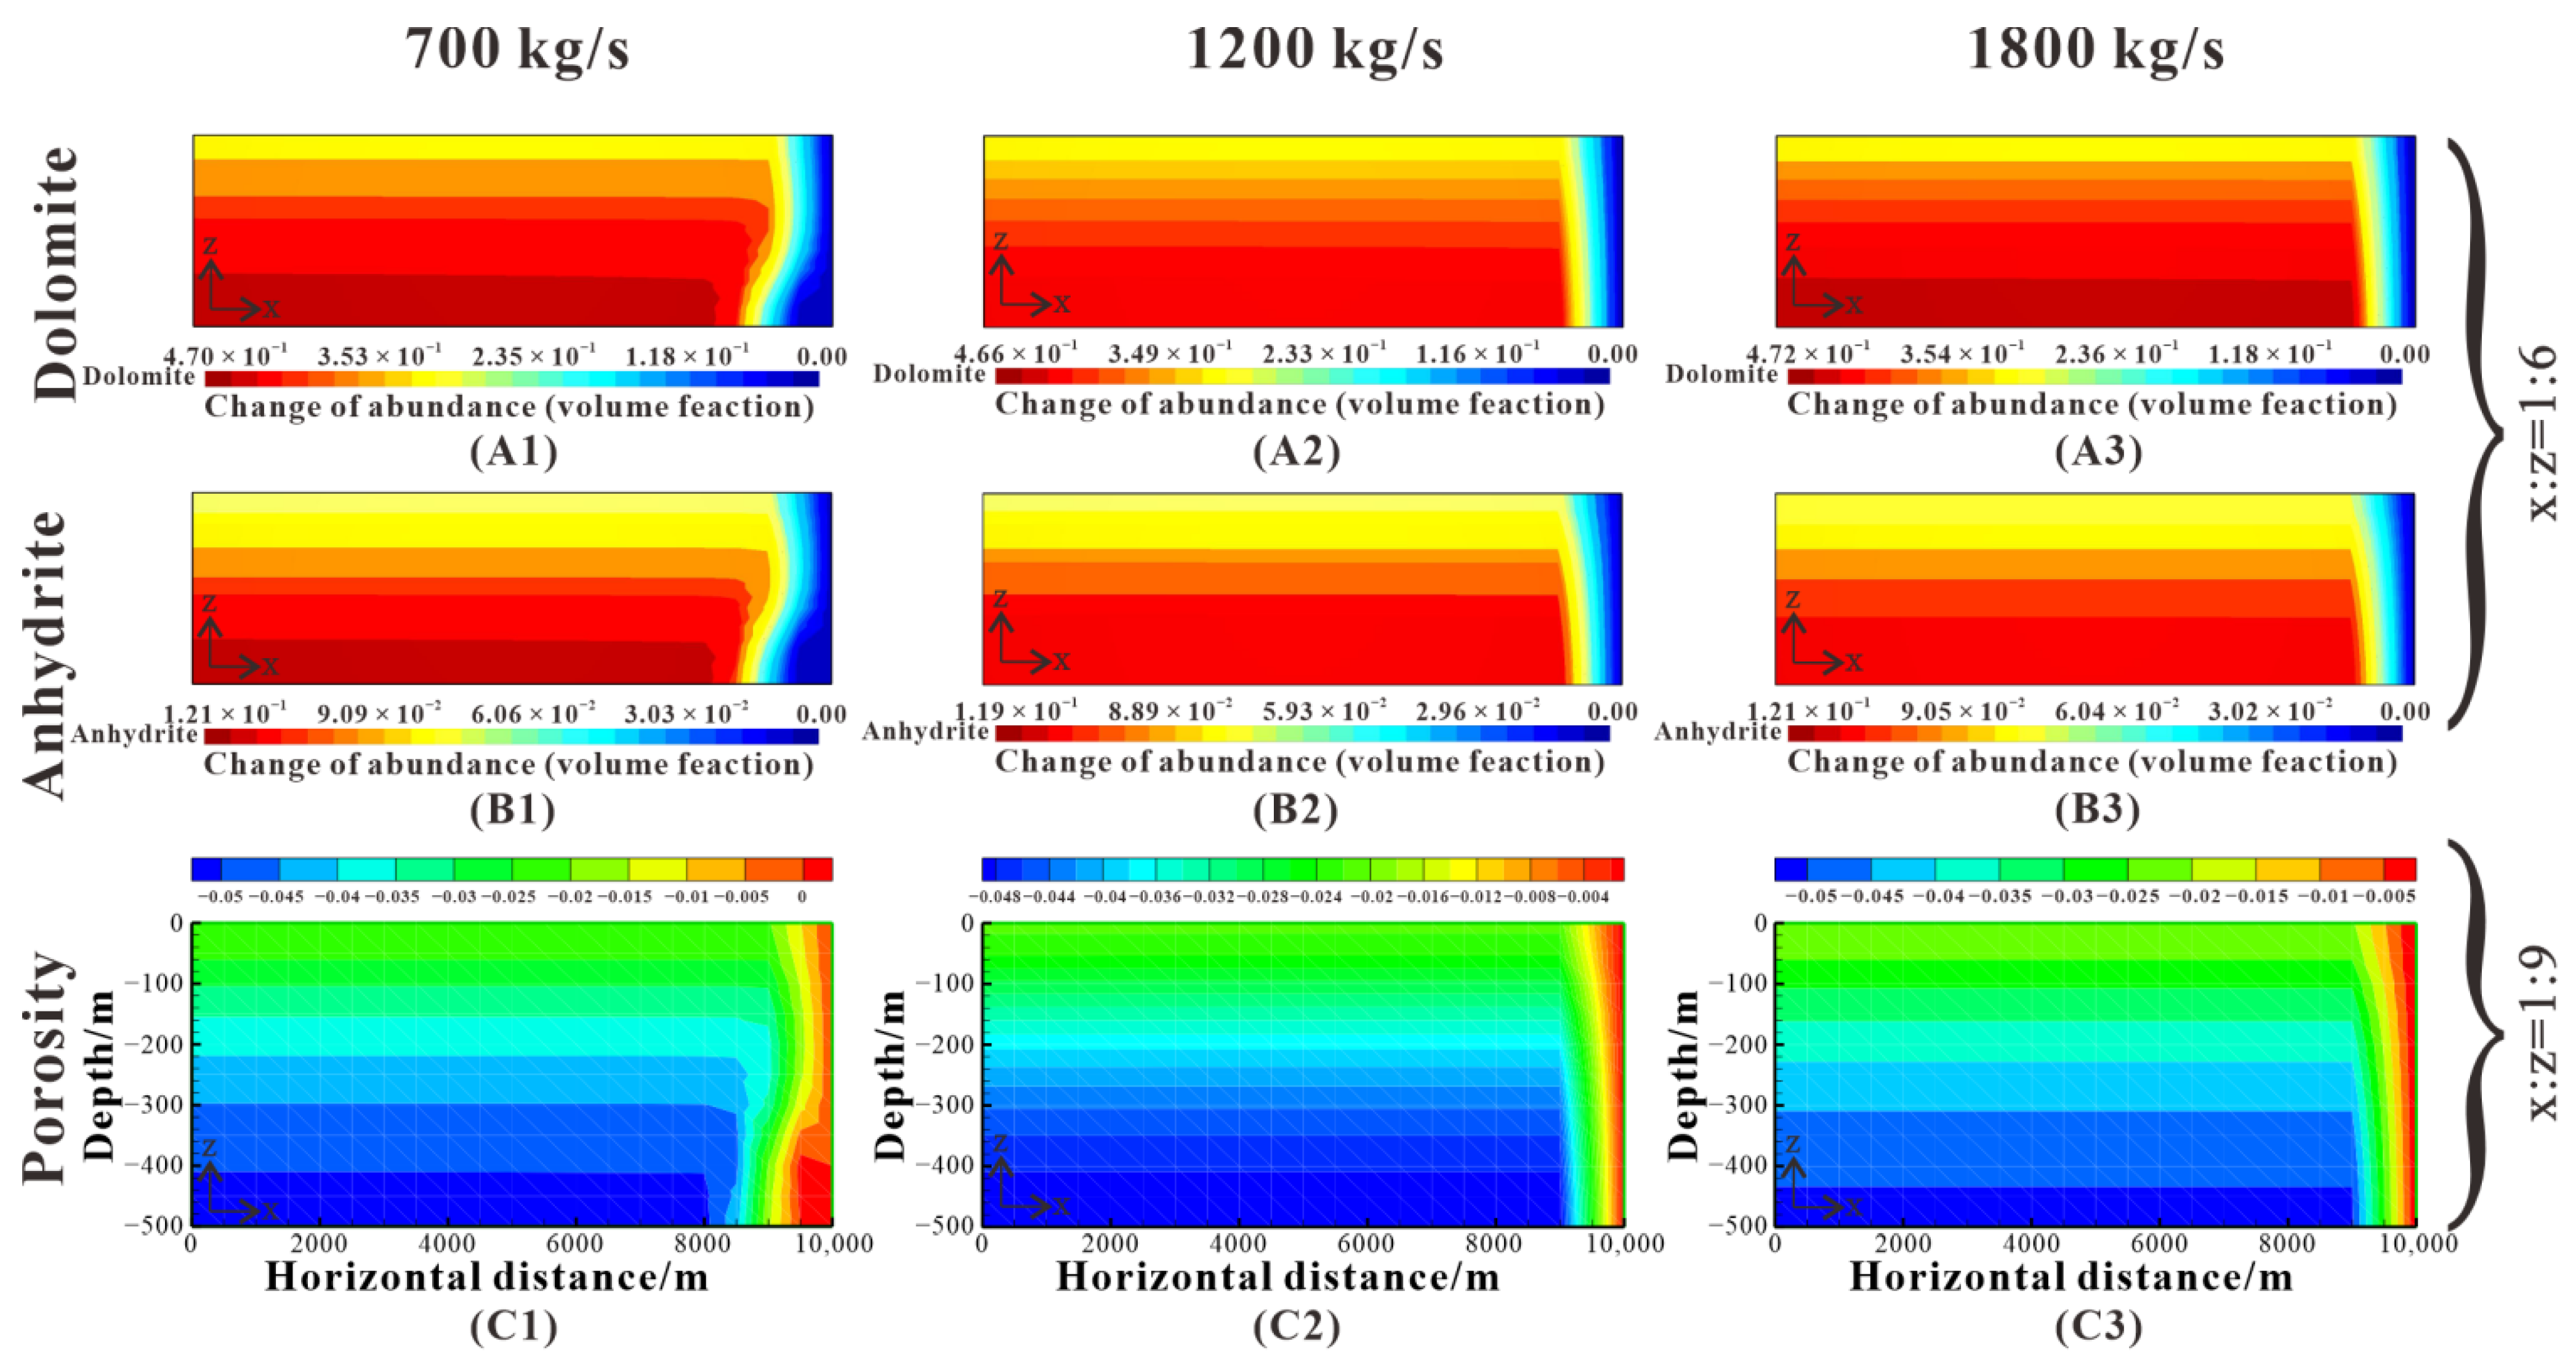
Comparison of dolomite and anhydrite abundance change and porosity change after 5 My for injection rate of 700 kg/s (Case 7), 1200 kg/s (baseline), and 1800 kg/s (Case 8). (A1–A3) show the dolomite abundance change. (B1–B3) show the anhydrite abundance change. (C1–C3) show the porosity change.
Figure 16.
Comparison of dolomite and anhydrite abundance change and porosity change after 5 My for injection rate of 700 kg/s (Case 7), 1200 kg/s (baseline), and 1800 kg/s (Case 8). (A1–A3) show the dolomite abundance change. (B1–B3) show the anhydrite abundance change. (C1–C3) show the porosity change.
Figure 17.
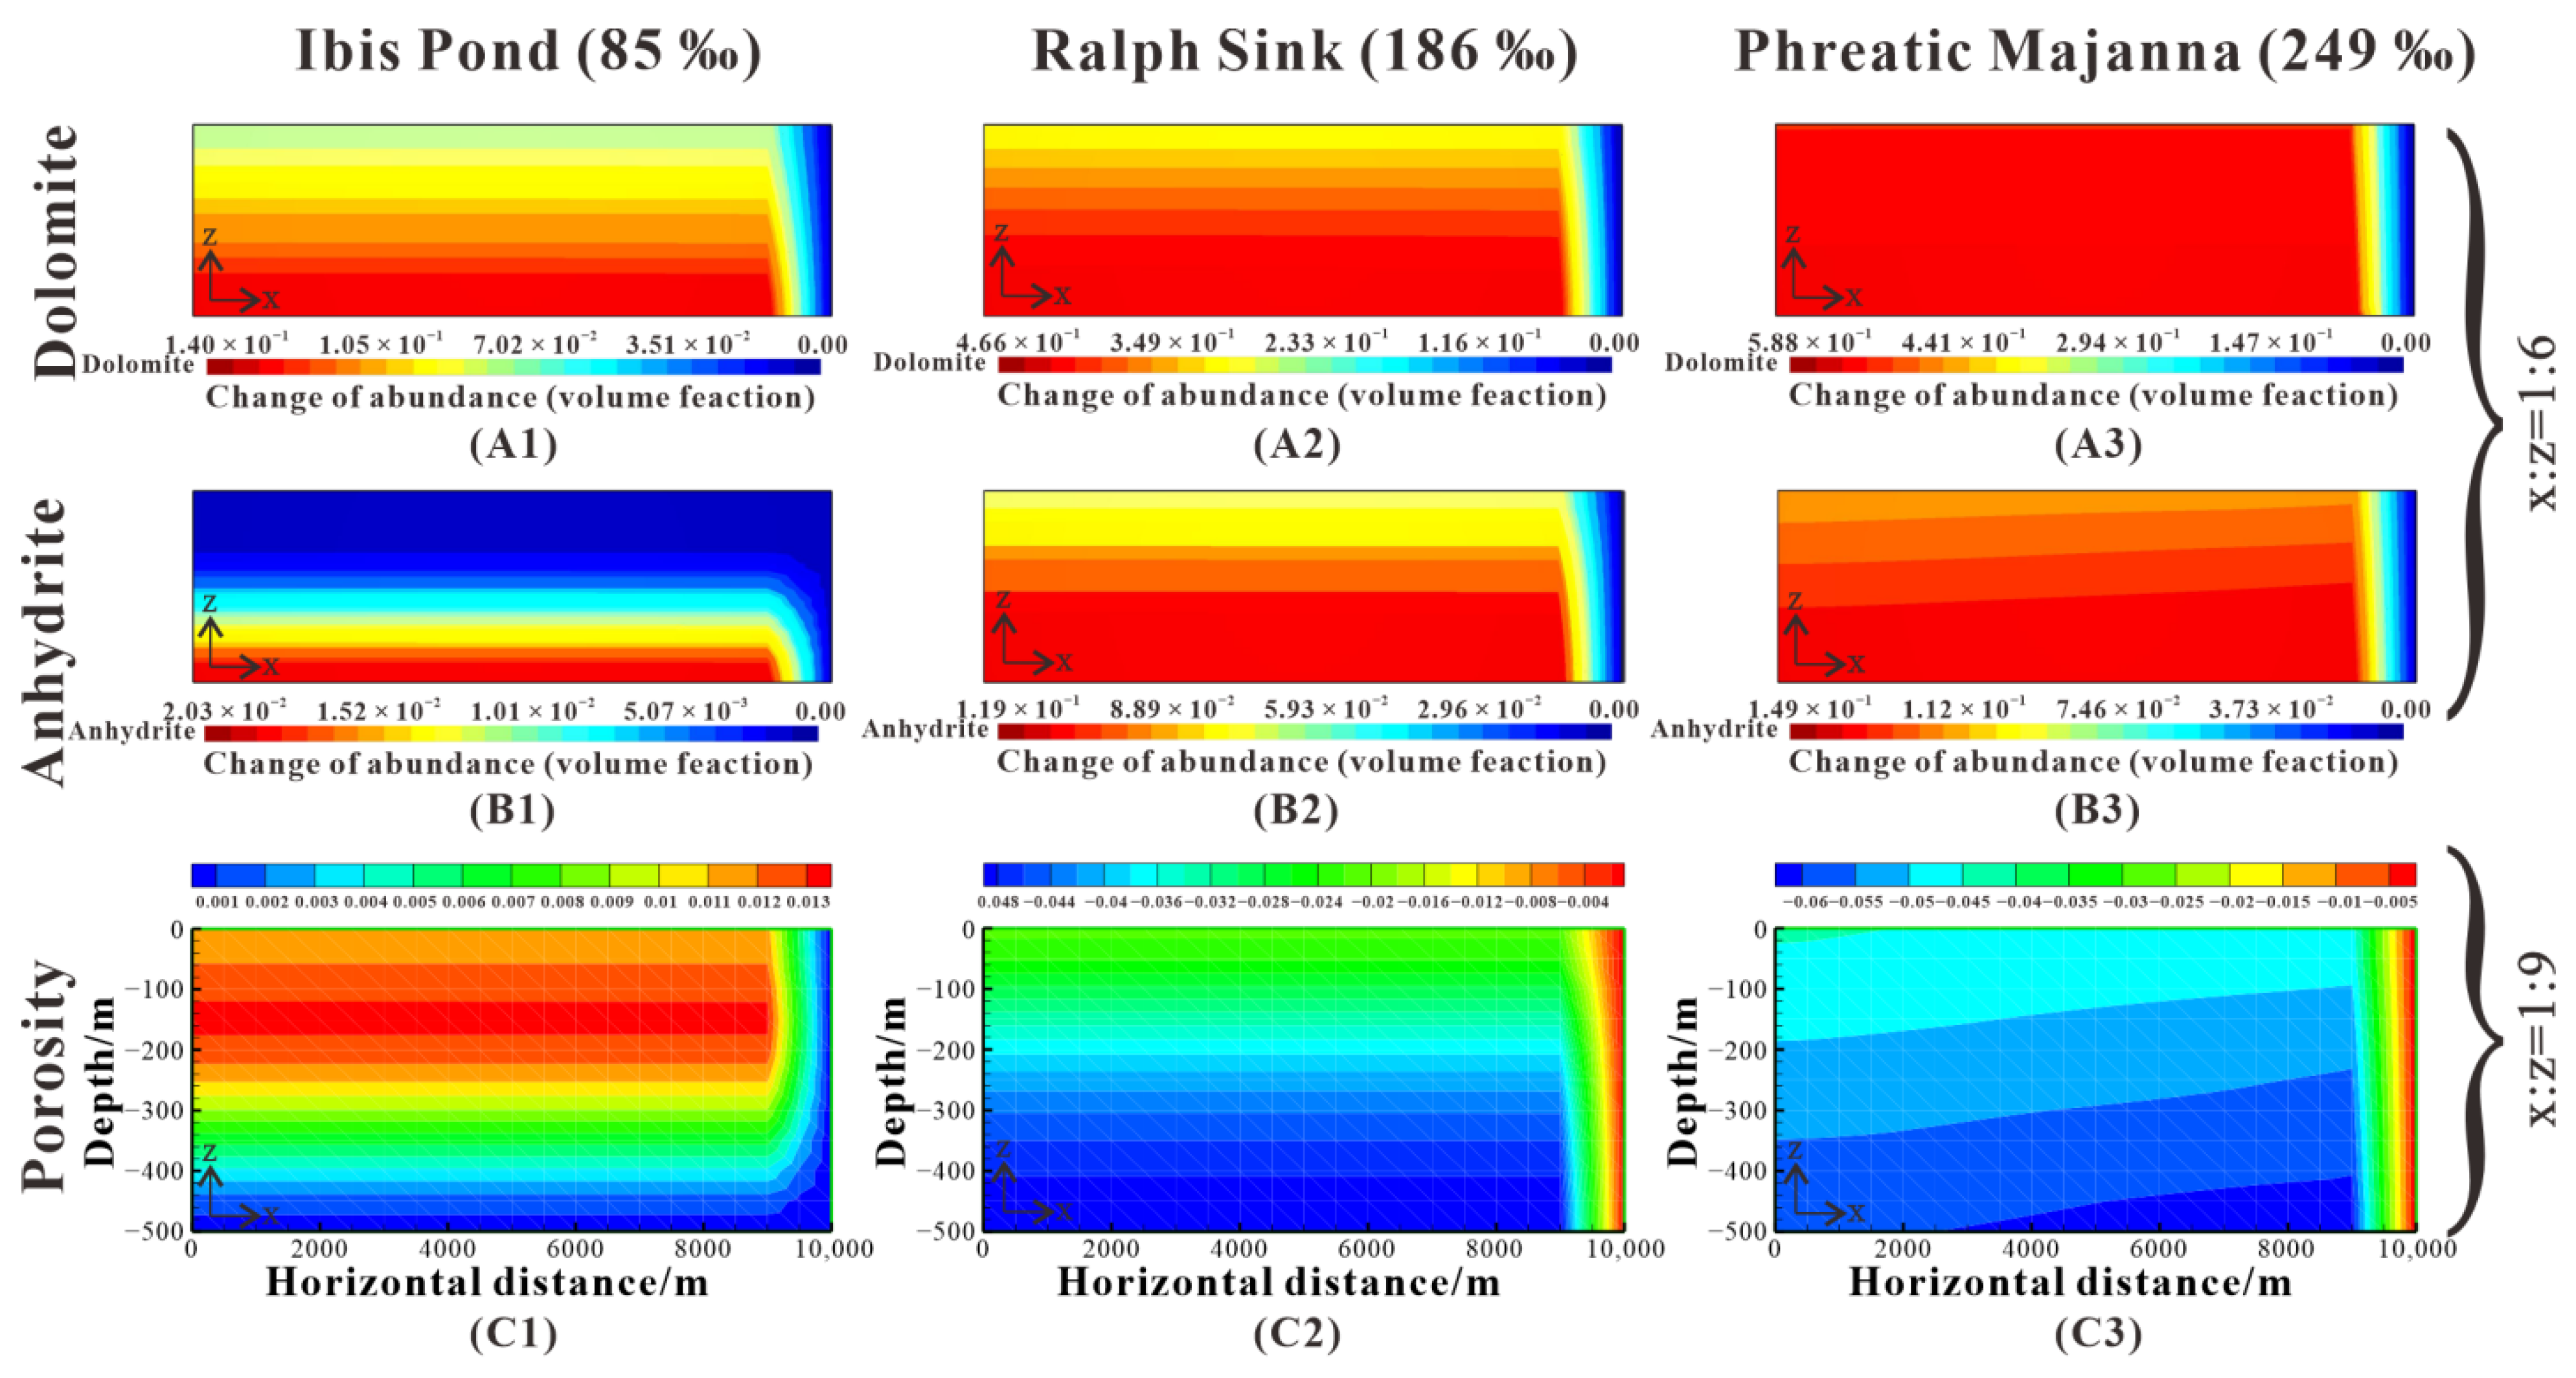
Comparison of dolomite and anhydrite abundance change and porosity change after 5 My for reflux of 85‰ brines (Case 9), 186‰ brines (baseline), and 249‰ brines (Case 10). (A1–A3) show the dolomite abundance change. (B1–B3) show the anhydrite abundance change. (C1–C3) show the porosity change.
Figure 17.
Comparison of dolomite and anhydrite abundance change and porosity change after 5 My for reflux of 85‰ brines (Case 9), 186‰ brines (baseline), and 249‰ brines (Case 10). (A1–A3) show the dolomite abundance change. (B1–B3) show the anhydrite abundance change. (C1–C3) show the porosity change.
Figure 18.
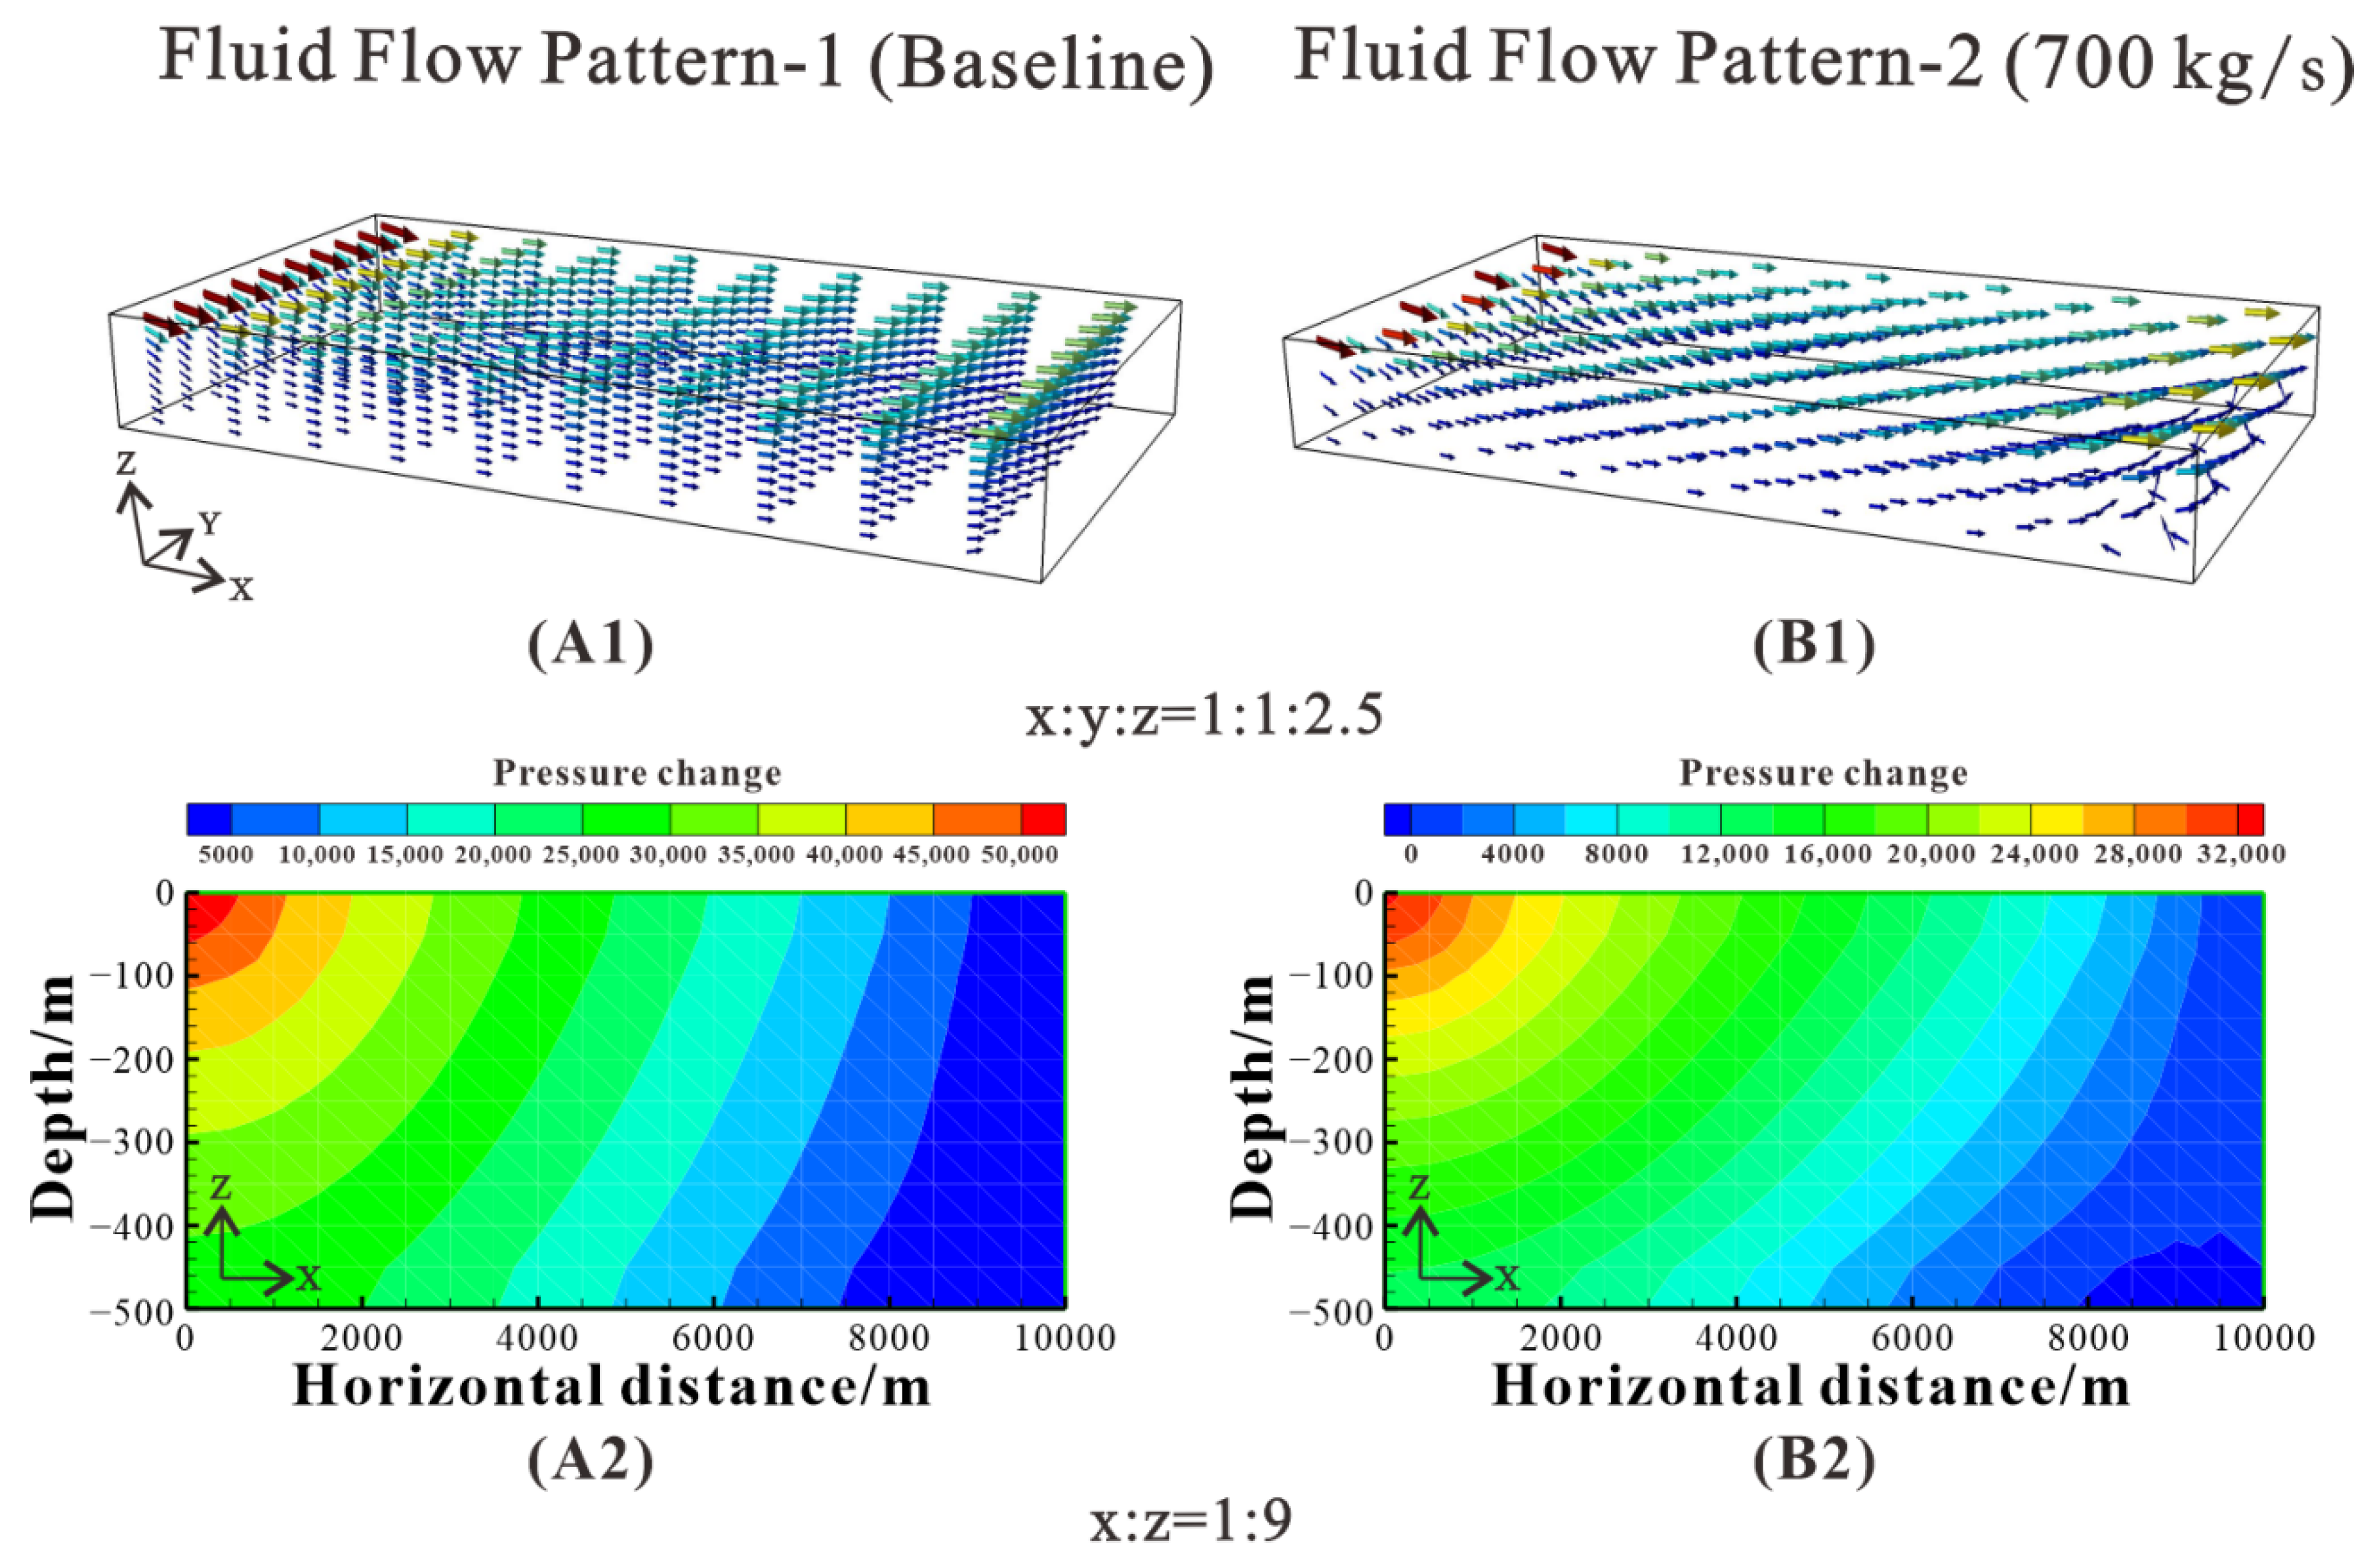
Two different fluid flow patterns. (A1) Fluid flow pattern-1 corresponding to dolomitization pattern-1 after 1 y. (B1) Fluid flow pattern-2 corresponding to dolomitization pattern-2 after 1 y. (A2) Pressure change of the model corresponding to fluid flow pattern-1 after 1 y. (B2) Pressure change of the model corresponding to fluid flow pattern-2. The fluid flow patterns are derived from the Petrasim graphical interface after 1 y.
Figure 18.
Two different fluid flow patterns. (A1) Fluid flow pattern-1 corresponding to dolomitization pattern-1 after 1 y. (B1) Fluid flow pattern-2 corresponding to dolomitization pattern-2 after 1 y. (A2) Pressure change of the model corresponding to fluid flow pattern-1 after 1 y. (B2) Pressure change of the model corresponding to fluid flow pattern-2. The fluid flow patterns are derived from the Petrasim graphical interface after 1 y.
Figure 19.
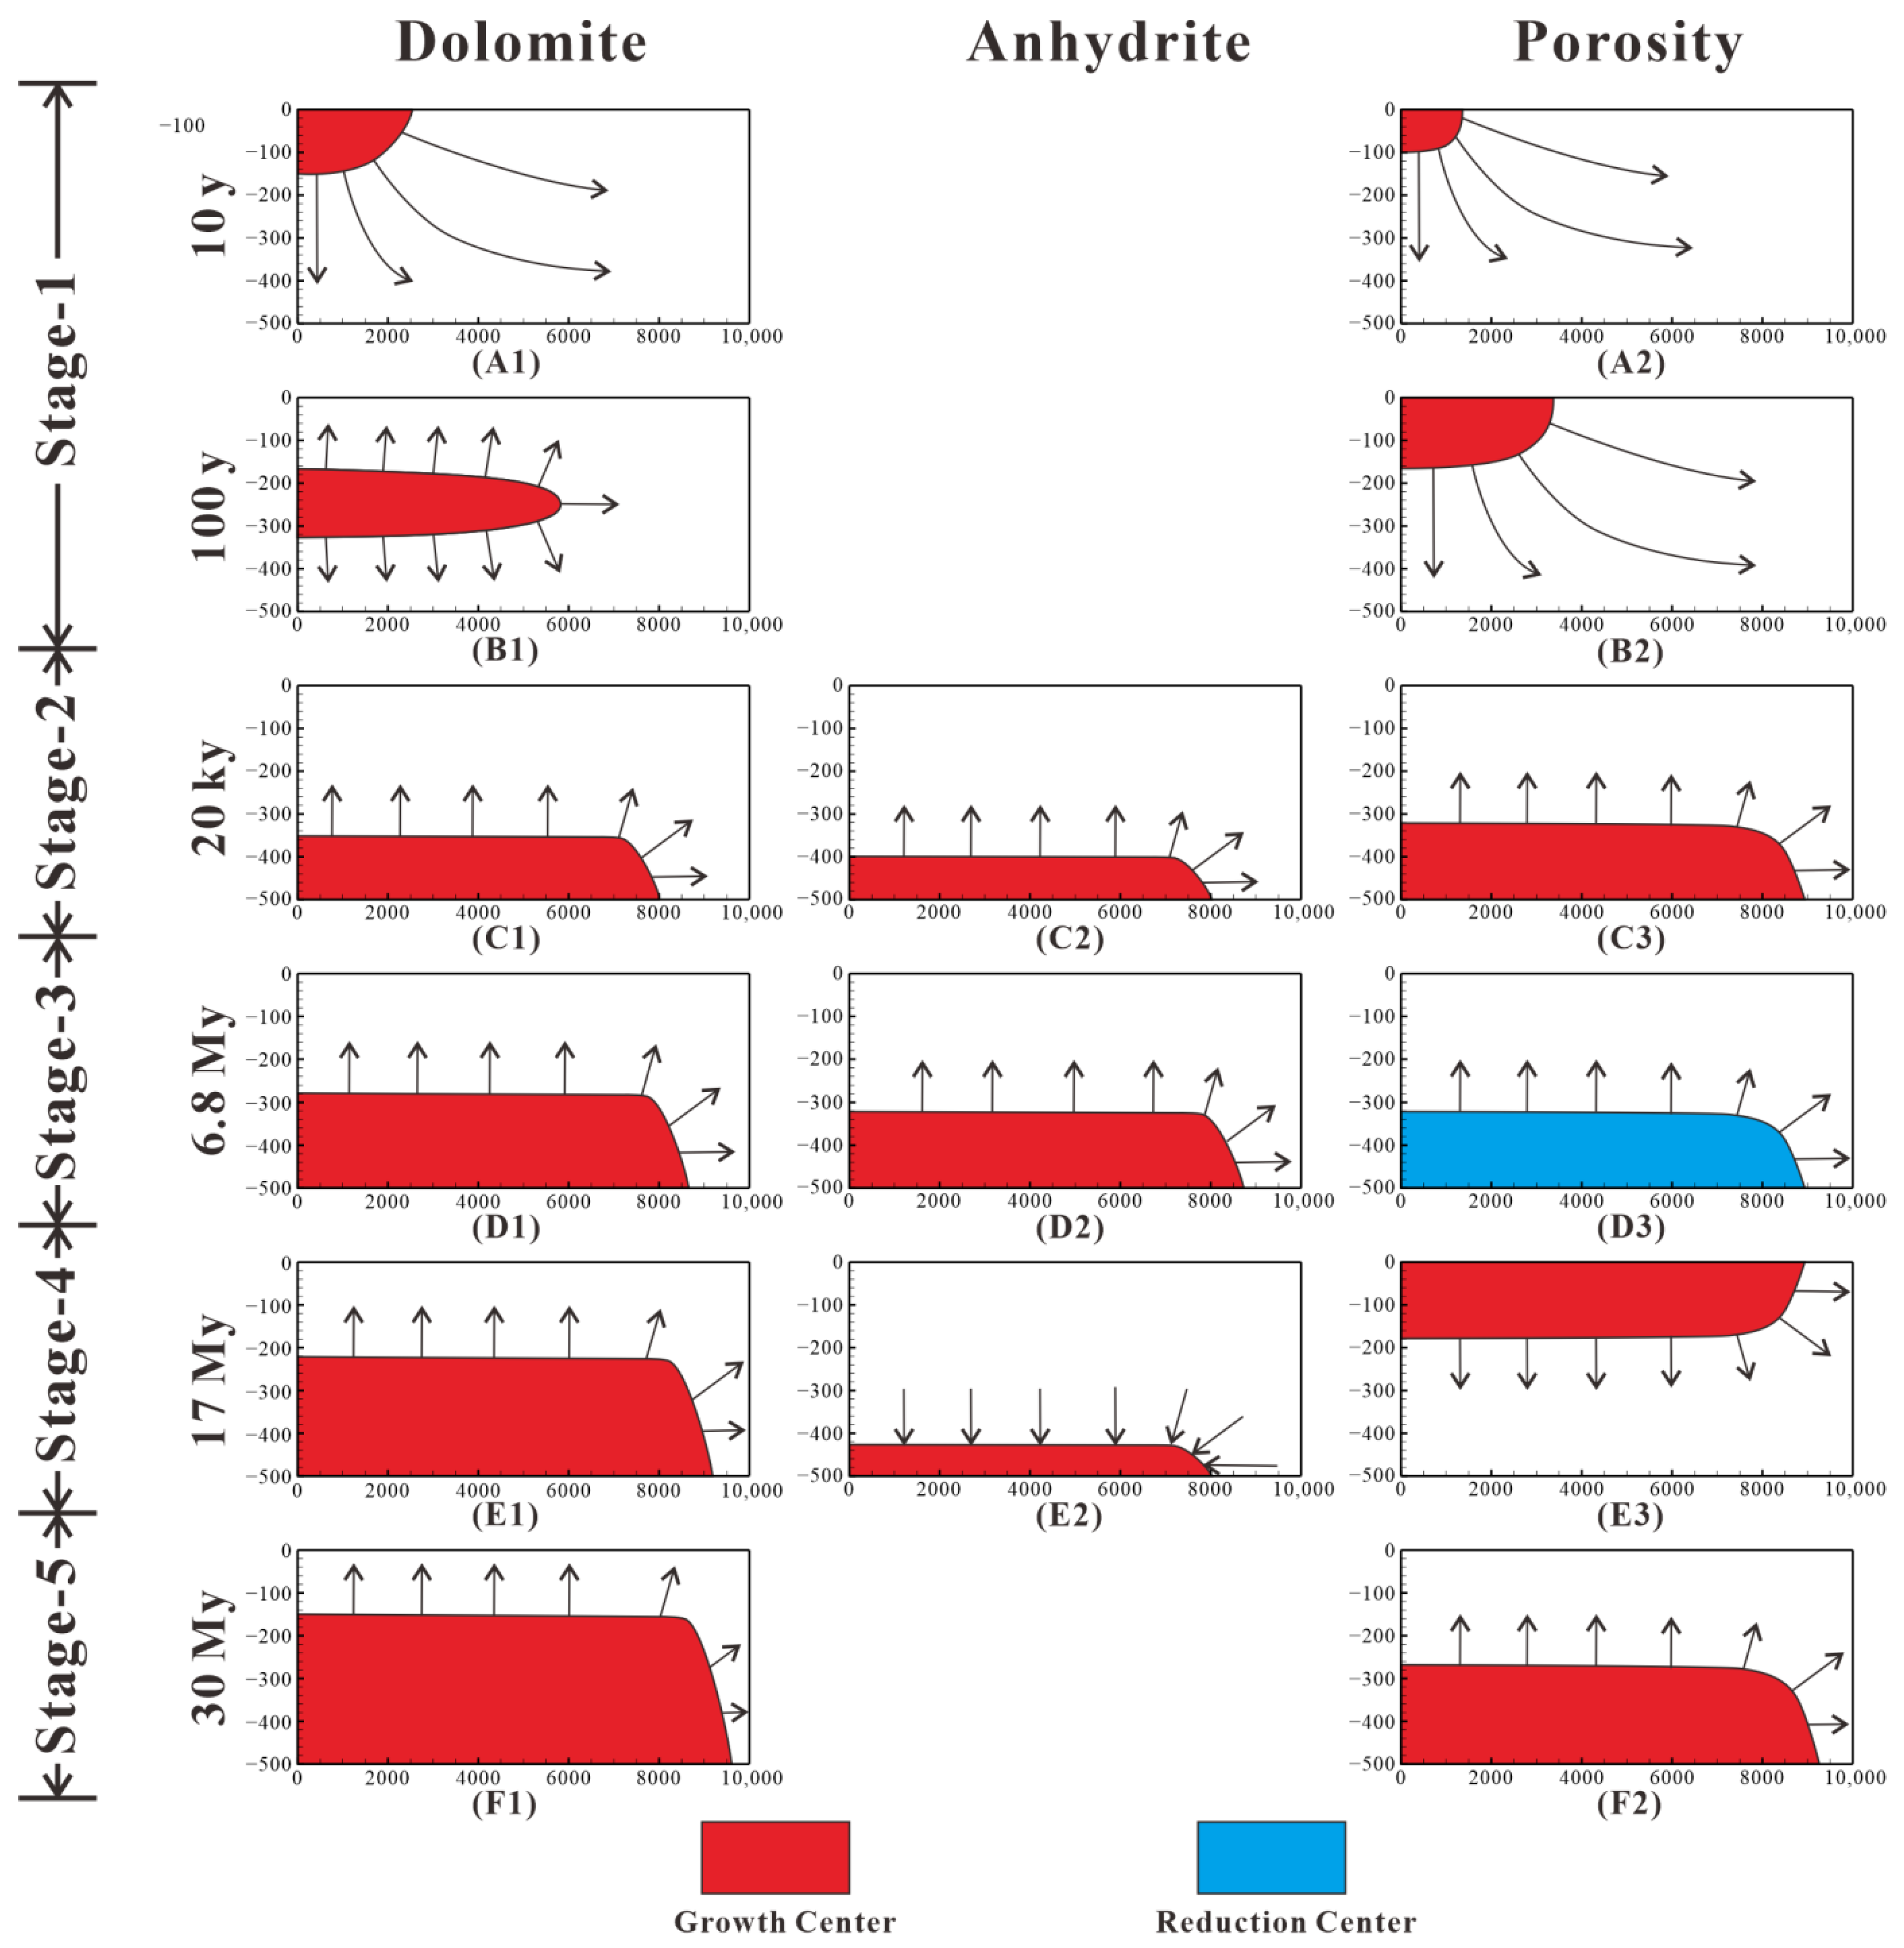
Pattern diagram of dolomitization evolution over time in cross-section, including temporal and spatial evolution of dolomite, anhydrite, and porosity. The evolution model of dolomitization is divided into five stages. The growth center is shown in red, and reduction center is shown in blue. (A1,B1,C1,D1,E1,F1) show the location of growth center of dolomite over time. (C2,D2,E2) show the location of growth center of anhydrite over time; (A2,B2,C2,D2,E2,F2) show the location of growth/reduction center of porosity over time.
Figure 19.
Pattern diagram of dolomitization evolution over time in cross-section, including temporal and spatial evolution of dolomite, anhydrite, and porosity. The evolution model of dolomitization is divided into five stages. The growth center is shown in red, and reduction center is shown in blue. (A1,B1,C1,D1,E1,F1) show the location of growth center of dolomite over time. (C2,D2,E2) show the location of growth center of anhydrite over time; (A2,B2,C2,D2,E2,F2) show the location of growth/reduction center of porosity over time.
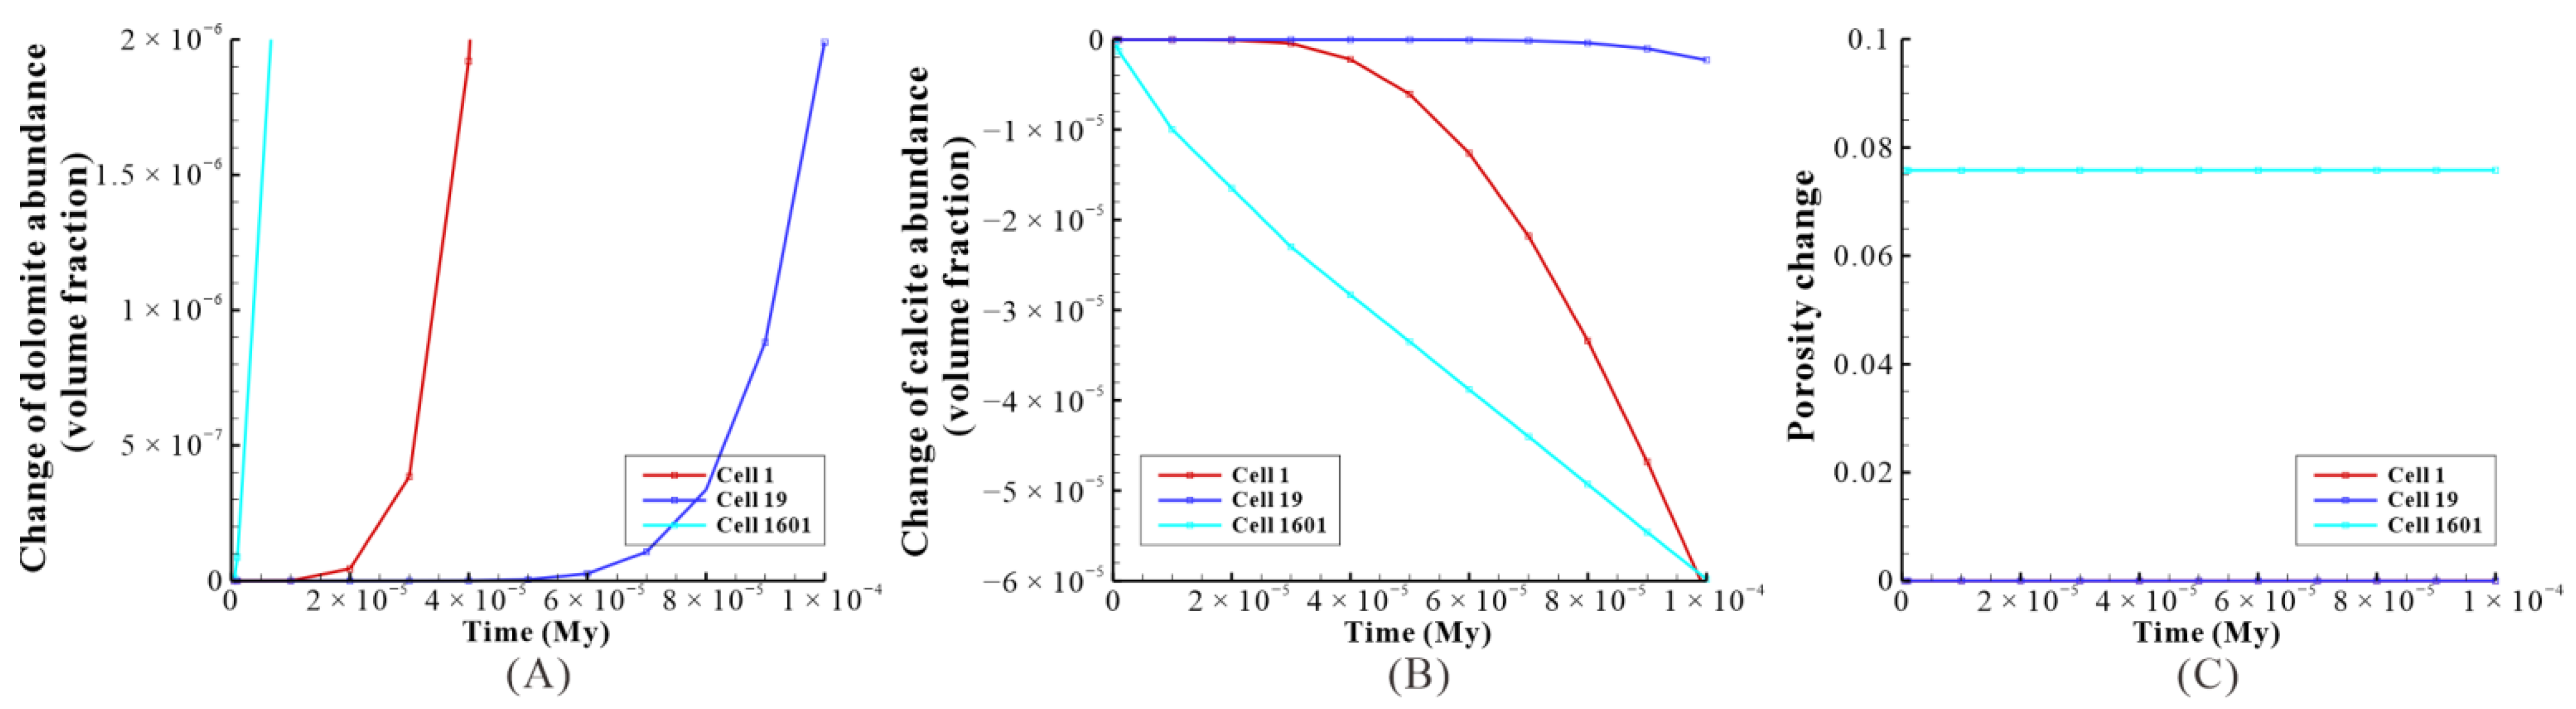
Figure 20.
The effect of reflux dolomitization on the three cells of the model: a case study of baseline within 100 y. (A) The change of dolomite abundance of the three cells; (B) the change of calcite abundance of the three cells; (C) the porosity change of the three cells.
Figure 20.
The effect of reflux dolomitization on the three cells of the model: a case study of baseline within 100 y. (A) The change of dolomite abundance of the three cells; (B) the change of calcite abundance of the three cells; (C) the porosity change of the three cells.
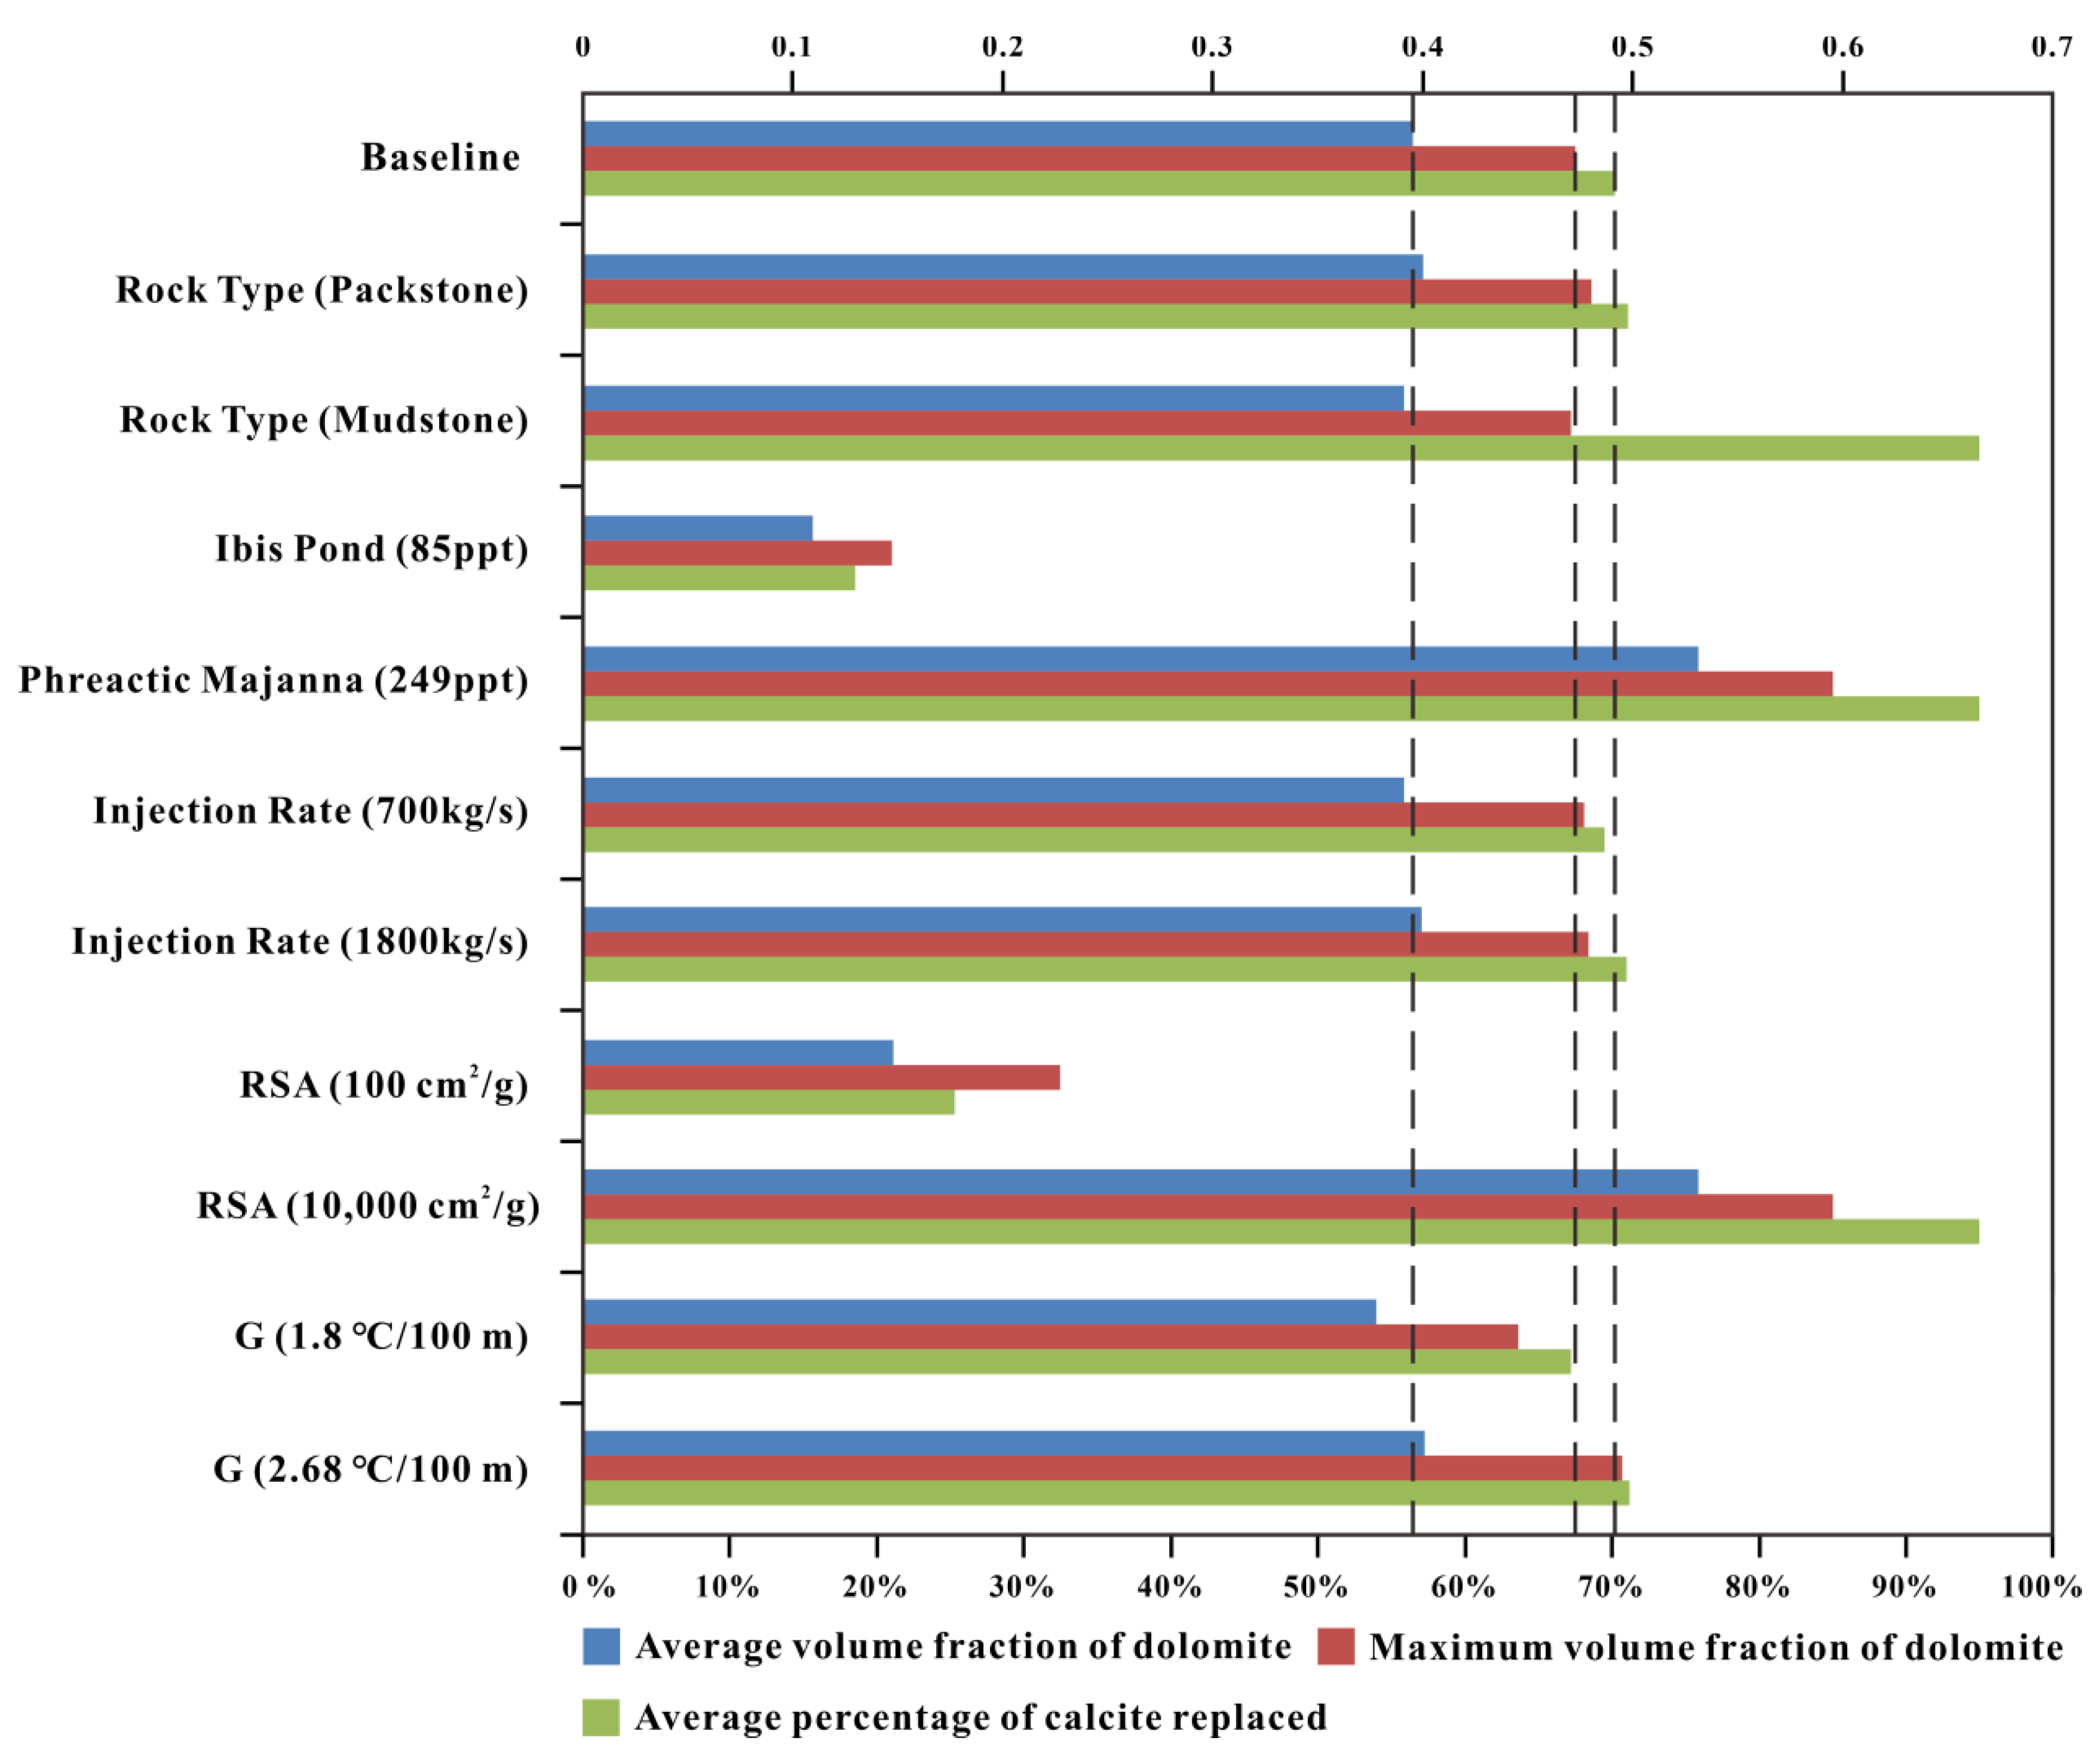
Figure 21.
Comparison of results for all simulations of reflux dolomitization in terms of average volume fraction of dolomite (blue bars), maximum volume fraction of dolomite (red bars), and average percentage of calcite replaced (green bars) in the 3D model in 5 My.
Figure 21.
Comparison of results for all simulations of reflux dolomitization in terms of average volume fraction of dolomite (blue bars), maximum volume fraction of dolomite (red bars), and average percentage of calcite replaced (green bars) in the 3D model in 5 My.
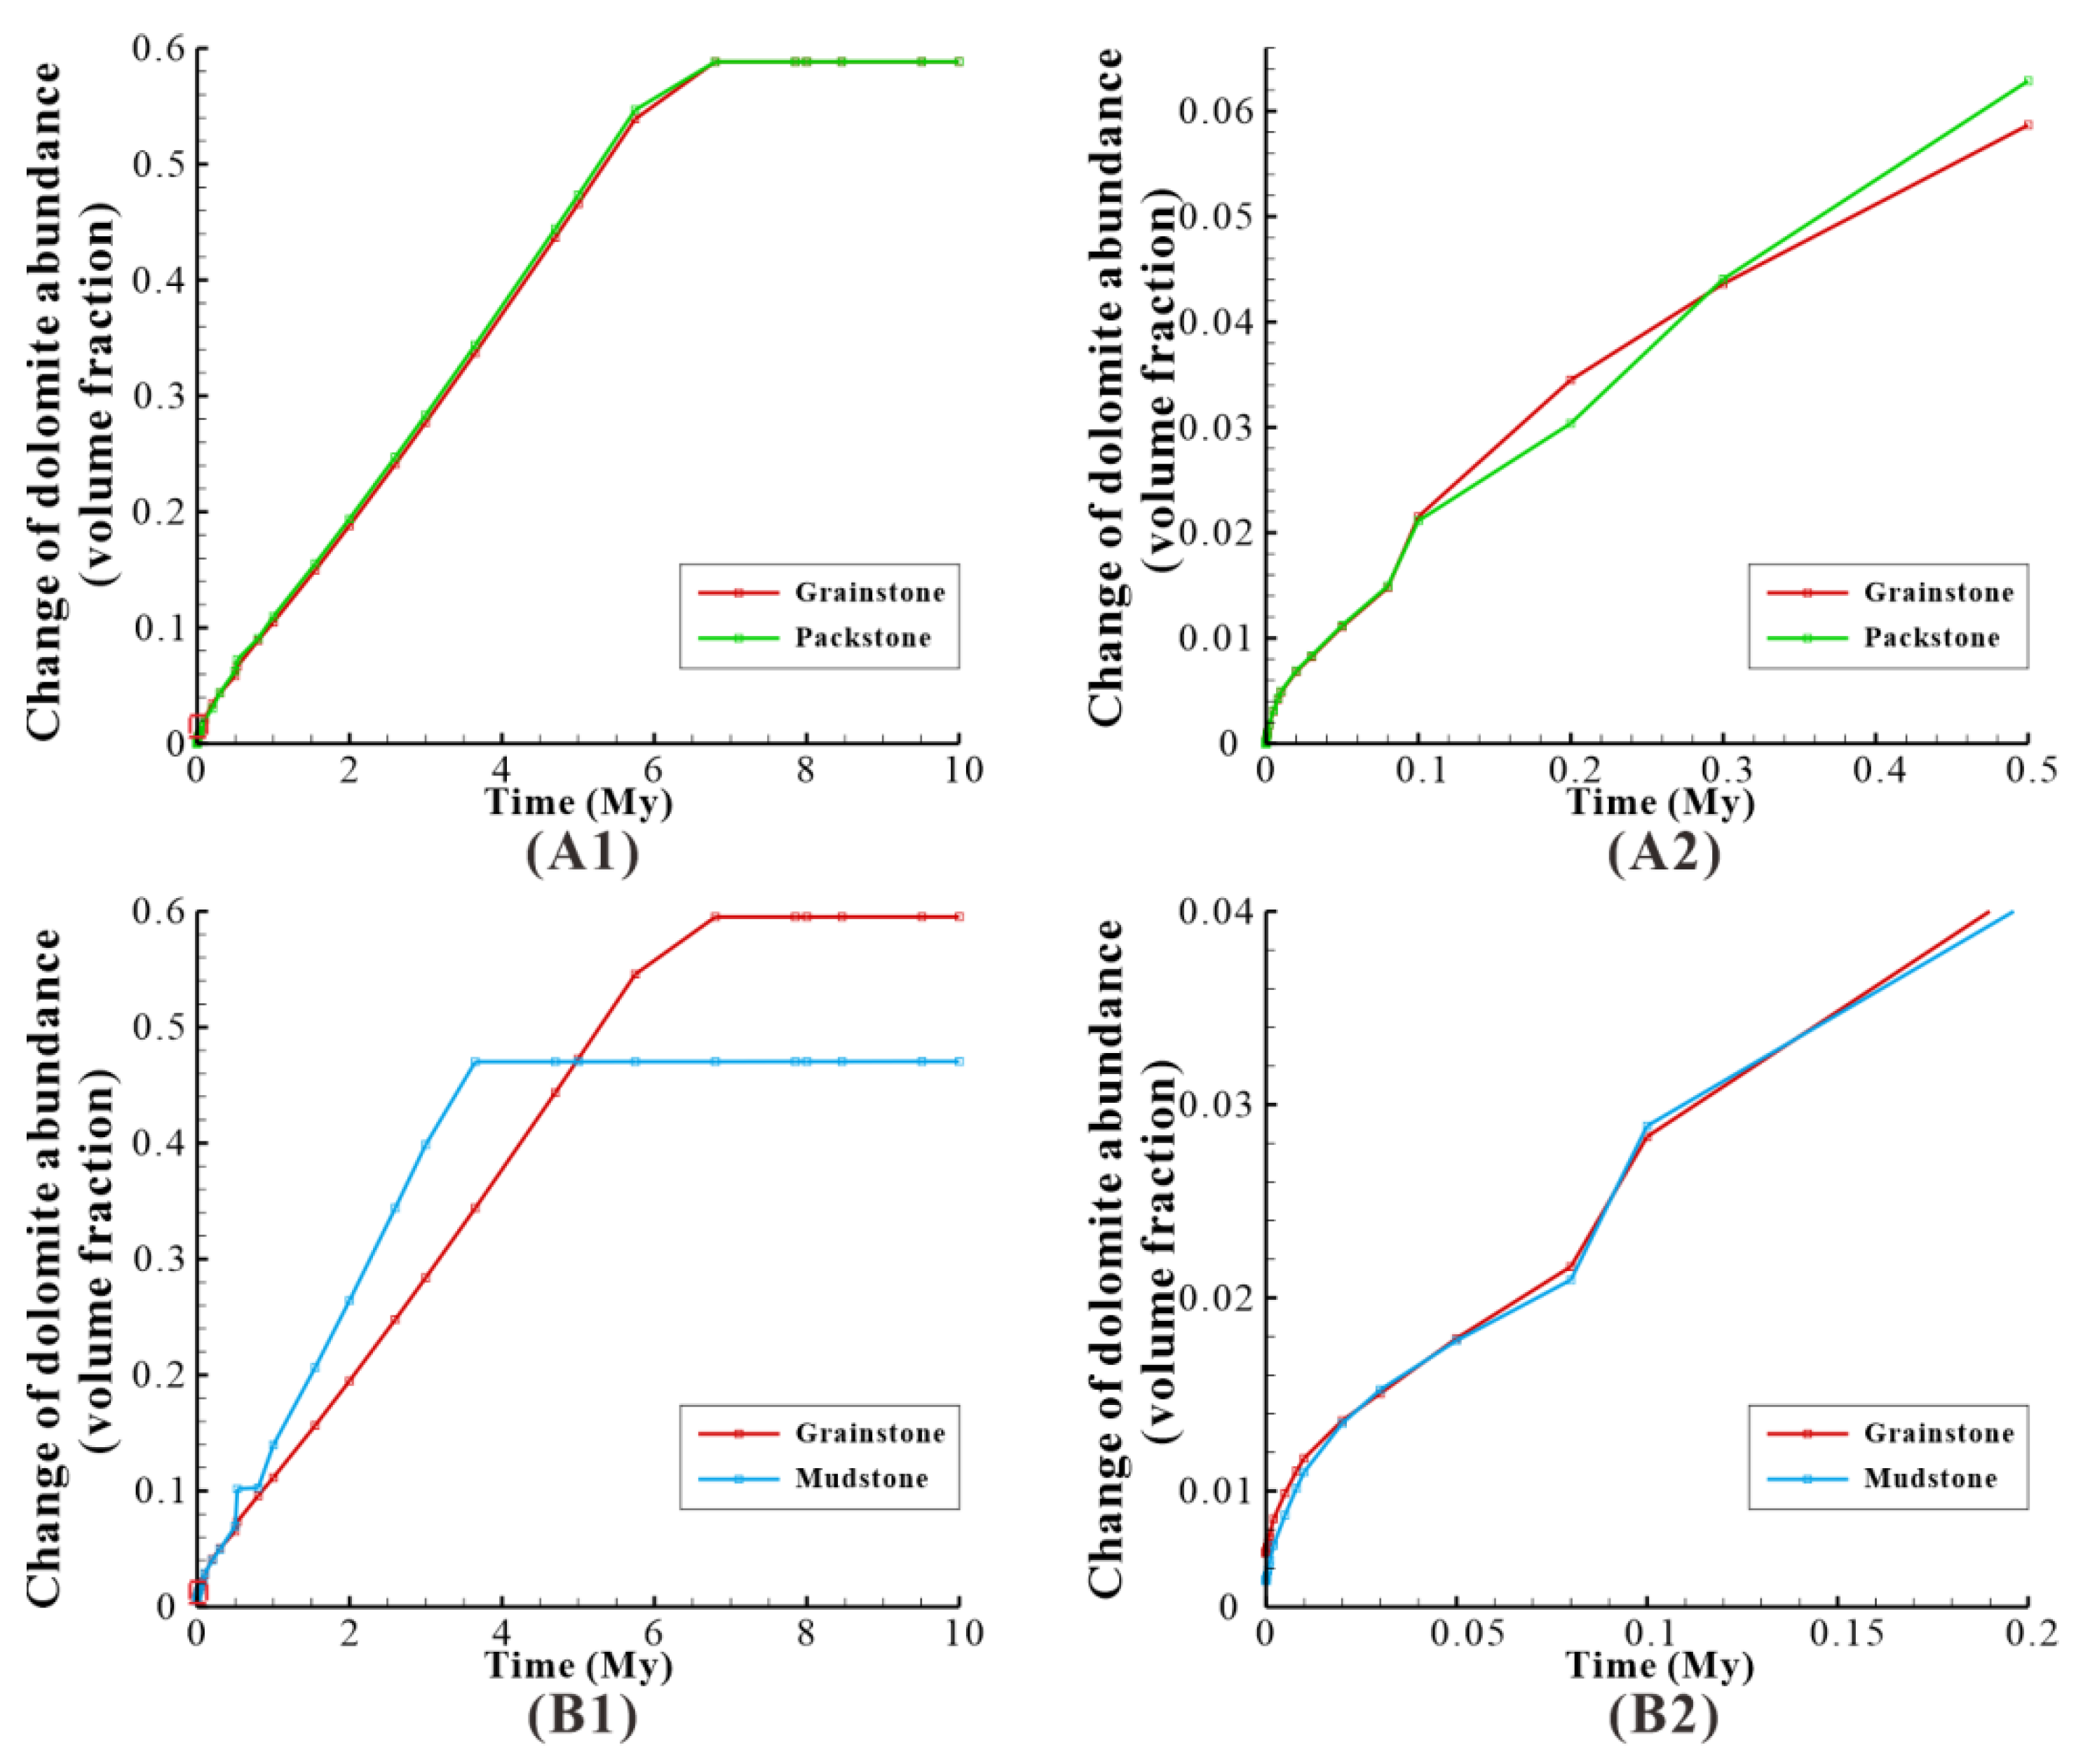
Figure 22.
The effect of reflux dolomitization on Cell 1 of the model for different rock fabrics. (A1) Dolomite abundance change of “grainstone” and “packstone”; the red dotted rectangle represents local magnification. (A2) is the local magnification of (A1). (B1) Dolomite abundance change of “grainstone” and “mudstone”; the red dotted rectangle represents local magnification. (B2) is the local magnification of (B1).
Table 1.
Constants specified to calculate porosity (modified from [
57]).
Table 1.
Constants specified to calculate porosity (modified from [
57]).
| Rock Type | P0 | P1 | b |
|---|
| Grainstone | 0.4 | 0.01 | 0.55 |
| Packstone | 0.4 | 0.01 | 0.55 |
| Mudstone | 0.6 | 0.01 | 0.6 |
Table 2.
Porosity–permeability relations of different classes of carbonate rock fabric (modified from [
1]).
Table 2.
Porosity–permeability relations of different classes of carbonate rock fabric (modified from [
1]).
| Rock Class | Rock Fabric | Porosity-Permeability Relationship |
|---|
| Class 1 | Limestone and dolomitized grainstones; large-crystalline-grain-dominated dolopackstones | k = (45.35 × 10⁸) × Φ8.357 |
| Class 2 | Grain-dominated packstones; fine- to medium-grain-dominated dolopackstones; medium crystalline mud-dominated dolostones | k = (2.040 × 10⁶) × Φ6.380 |
| Class 3 | Mud-dominated limestones; fine crystalline mud-dominated dolostones | k = (2.884 × 10³) × Φ4.275 |
Table 3.
The porosity and permeability of different layers with different rock types.
Table 3.
The porosity and permeability of different layers with different rock types.
| Layer | Grainstone | Packstone | Mudstone |
|---|
| Φ/% | kh/m2 | Φ/% | kh/m2 | Φ/% | kh/m2 |
|---|
| Layer 1 | 0.318035349 | 2.56572 × 10⁻¹⁰ | 0.318035349 | 1.36591 × 10⁻¹² | 0.461208553 | 1.05477 × 10⁻¹³ |
| Layer 2 | 0.326623872 | 3.2211 × 10⁻¹⁰ | 0.326623872 | 1.61903 × 10⁻¹² | 0.474949899 | 1.19582 × 10⁻¹³ |
| Layer 3 | 0.335451857 | 4.04466 × 10⁻¹⁰ | 0.335451857 | 1.91934 × 10⁻¹² | 0.489109731 | 1.35584 × 10⁻¹³ |
| Layer 4 | 0.344525981 | 5.07974 × 10⁻¹⁰ | 0.344525981 | 2.27565 × 10⁻¹² | 0.503700795 | 1.53739 × 10⁻¹³ |
| Layer 5 | 0.353853105 | 6.38086 × 10⁻¹⁰ | 0.353853105 | 2.69849 × 10⁻¹² | 0.518736222 | 1.74338 × 10⁻¹³ |
| Layer 6 | 0.363440285 | 8.01668 × 10⁻¹⁰ | 0.363440285 | 3.20032 × 10⁻¹² | 0.534229547 | 1.97712 × 10⁻¹³ |
| Layer 7 | 0.373294771 | 1.00736 × 10⁻¹⁰ | 0.373294771 | 3.79596 × 10⁻¹² | 0.550194714 | 2.24235 × 10⁻¹³ |
| Layer 8 | 0.383424016 | 1.26604 × 10⁻¹⁰ | 0.383424016 | 4.50302 × 10⁻¹² | 0.566646092 | 2.54334 × 10⁻¹³ |
| Layer 9 | 0.393835681 | 1.59141 × 10⁻¹⁰ | 0.393835681 | 5.34245 × 10⁻¹² | 0.583598489 | 2.88492 × 10⁻¹³ |
| Layer 10 | 0.40453764 | 2.00072 × 10⁻¹⁰ | 0.40453764 | 6.33911 × 10⁻¹² | 0.601067164 | 3.27259 × 10⁻¹³ |
Table 4.
Aqueous species included in reactive transport simulations of reflux dolomitization.
Table 4.
Aqueous species included in reactive transport simulations of reflux dolomitization.
| Primary Aqueous Species | |
| Na+ | Ca2+ | Mg2+ | K+ | H+ |
| Cl− | SO42− | HCO3− | H2O | |
| Secondary Aqueous Species | |
| CaCl+ | CaCl2 (aq) | CaCO3 (aq) | CaHCO3+ | CaOH+ |
| CaSO4 (aq) | CO2 (aq) | CO32− | H2SO4 (aq) | HCl (aq) |
| HSO4− | KCl (aq) | KHSO4 (aq) | KOH (aq) | KSO4− |
| Mg4(OH)44+ | MgCl+ | MgCO3+ (aq) | MgHCO3+ | MgOH+ |
| MgSO4− (aq) | NaCl (aq) | NaCO3− | NaHCO3 (aq) | NaOH (aq) |
| NaSO4− | OH− | | | |
Table 5.
Chemical composition (mmol) of formation water and brine used in this study.
Table 5.
Chemical composition (mmol) of formation water and brine used in this study.
| Concentration (mmol) | Initial Formation Water ▲ | Ibis Pond * | Ralph Sink * | Phreatic Majanna * |
|---|
| Na+ | 485 | 1260 | 3180 | 4451 |
| Cl− | 566 | 1460 | 3693 | 5350 |
| K+ | 10.6 | 25.56 | 65.6 | 103.8 |
| Ca2+ | 53.95 | 24.44 | 22.2 | 12.22 |
| Mg2+ | 4.855 | 137.2 | 339 | 597.8 |
| HCO3− | 0.3101 | 0.7 | 1.67 | 1.655 |
| SO42− | 23.47 | 77.8 | 137.2 | 211.1 |
| pH | 5.7 | 7.7 | 7.1 | 6.7 |
| Log PCO2 | −2.0 | −3.2 | −2.3 | −2.1 |
| Mg/Ca molar | 0.09 | 5.6 | 15.3 | 48.9 |
| Salinity(‰) | 36 | 85 | 186 | 249 |
Table 6.
Calculated saturation indices (Log Q/K) of major carbonate minerals for brines used in
Table 4 (modified from [
3]).
Table 6.
Calculated saturation indices (Log Q/K) of major carbonate minerals for brines used in
Table 4 (modified from [
3]).
| Mineral | Ibis Pond | Ralph Sink | Phreatic Majanna |
|---|
| Aragonite | 0.14 | −0.26 | −0.31 |
| Calcite | 0.32 | −0.07 | −0.49 |
| Dolomite | 1.74 | 1.46 | 1.22 |
| Magnesite | 0.58 | 0.7 | 0.87 |
| Gypsum | −0.19 | −0.08 | −0.03 |
| Anhydrite | −0.37 | −0.16 | −0.03 |
| Halite | −1.67 | −0.7 | −0.19 |
Table 7.
Parameter settings for three-dimensional flow models.
Table 7.
Parameter settings for three-dimensional flow models.
| Model No. | Rock Fabric | RSA (cm2/g) | G (°C/100 m) | Injection Rate (kg/s) | Brine Type |
|---|
| Baseline | Grainstone | 1000 | 2.1 | 1200 | Ralph Sink |
| Case 1 | Packstone | - | - | - | - |
| Case 2 | Mudstone | - | - | - | - |
| Case 3 | - | 100 | - | - | - |
| Case 4 | - | 10,000 | - | - | - |
| Case 5 | - | - | 1.8 | - | - |
| Case 6 | - | - | 2.68 | - | - |
| Case 7 | - | - | - | 700 | - |
| Case 8 | - | - | - | 1800 | - |
| Case 9 | - | - | - | - | Ibis Pond |
| Case 10 | - | - | - | - | Phreatic Majanna |


