
Implementing Digital Edge Enhancers on Improved High-Resolution Aeromagnetic Signals for Structural-Depth Analysis around the Middle Benue Trough, Nigeria

Abstract
:1. Introduction
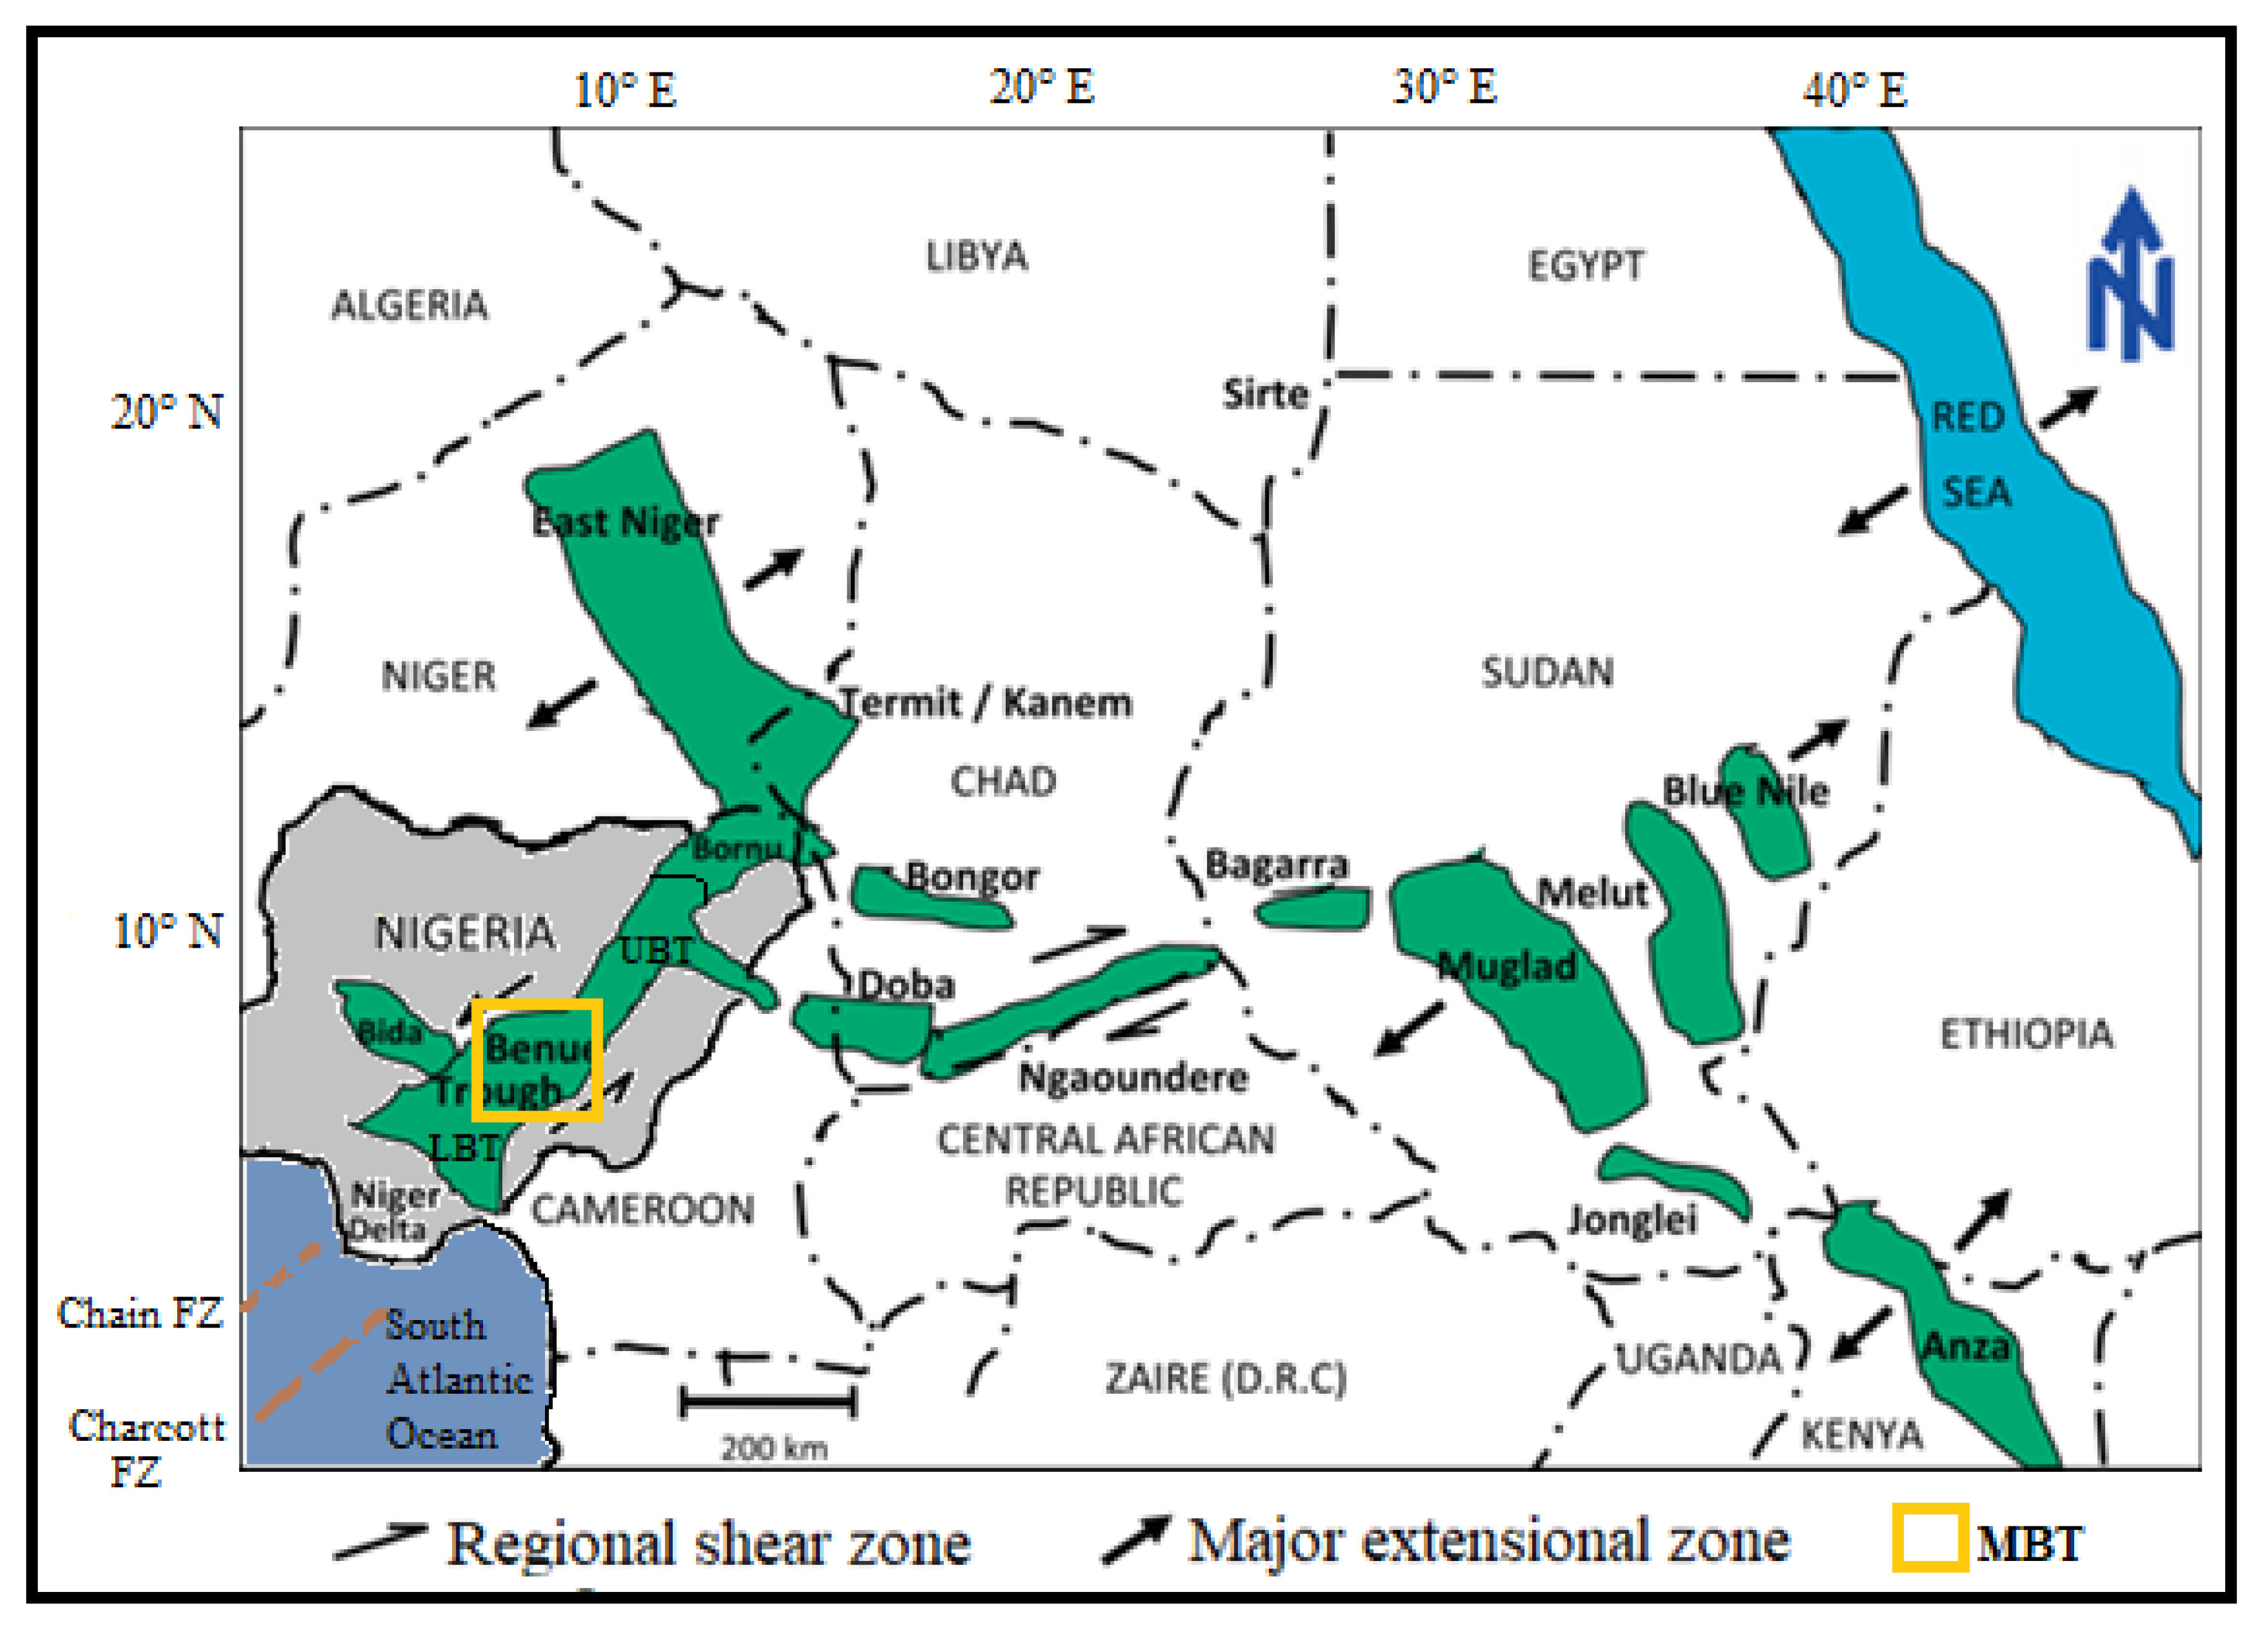
2. Geologic Setting
3. Materials and Methods
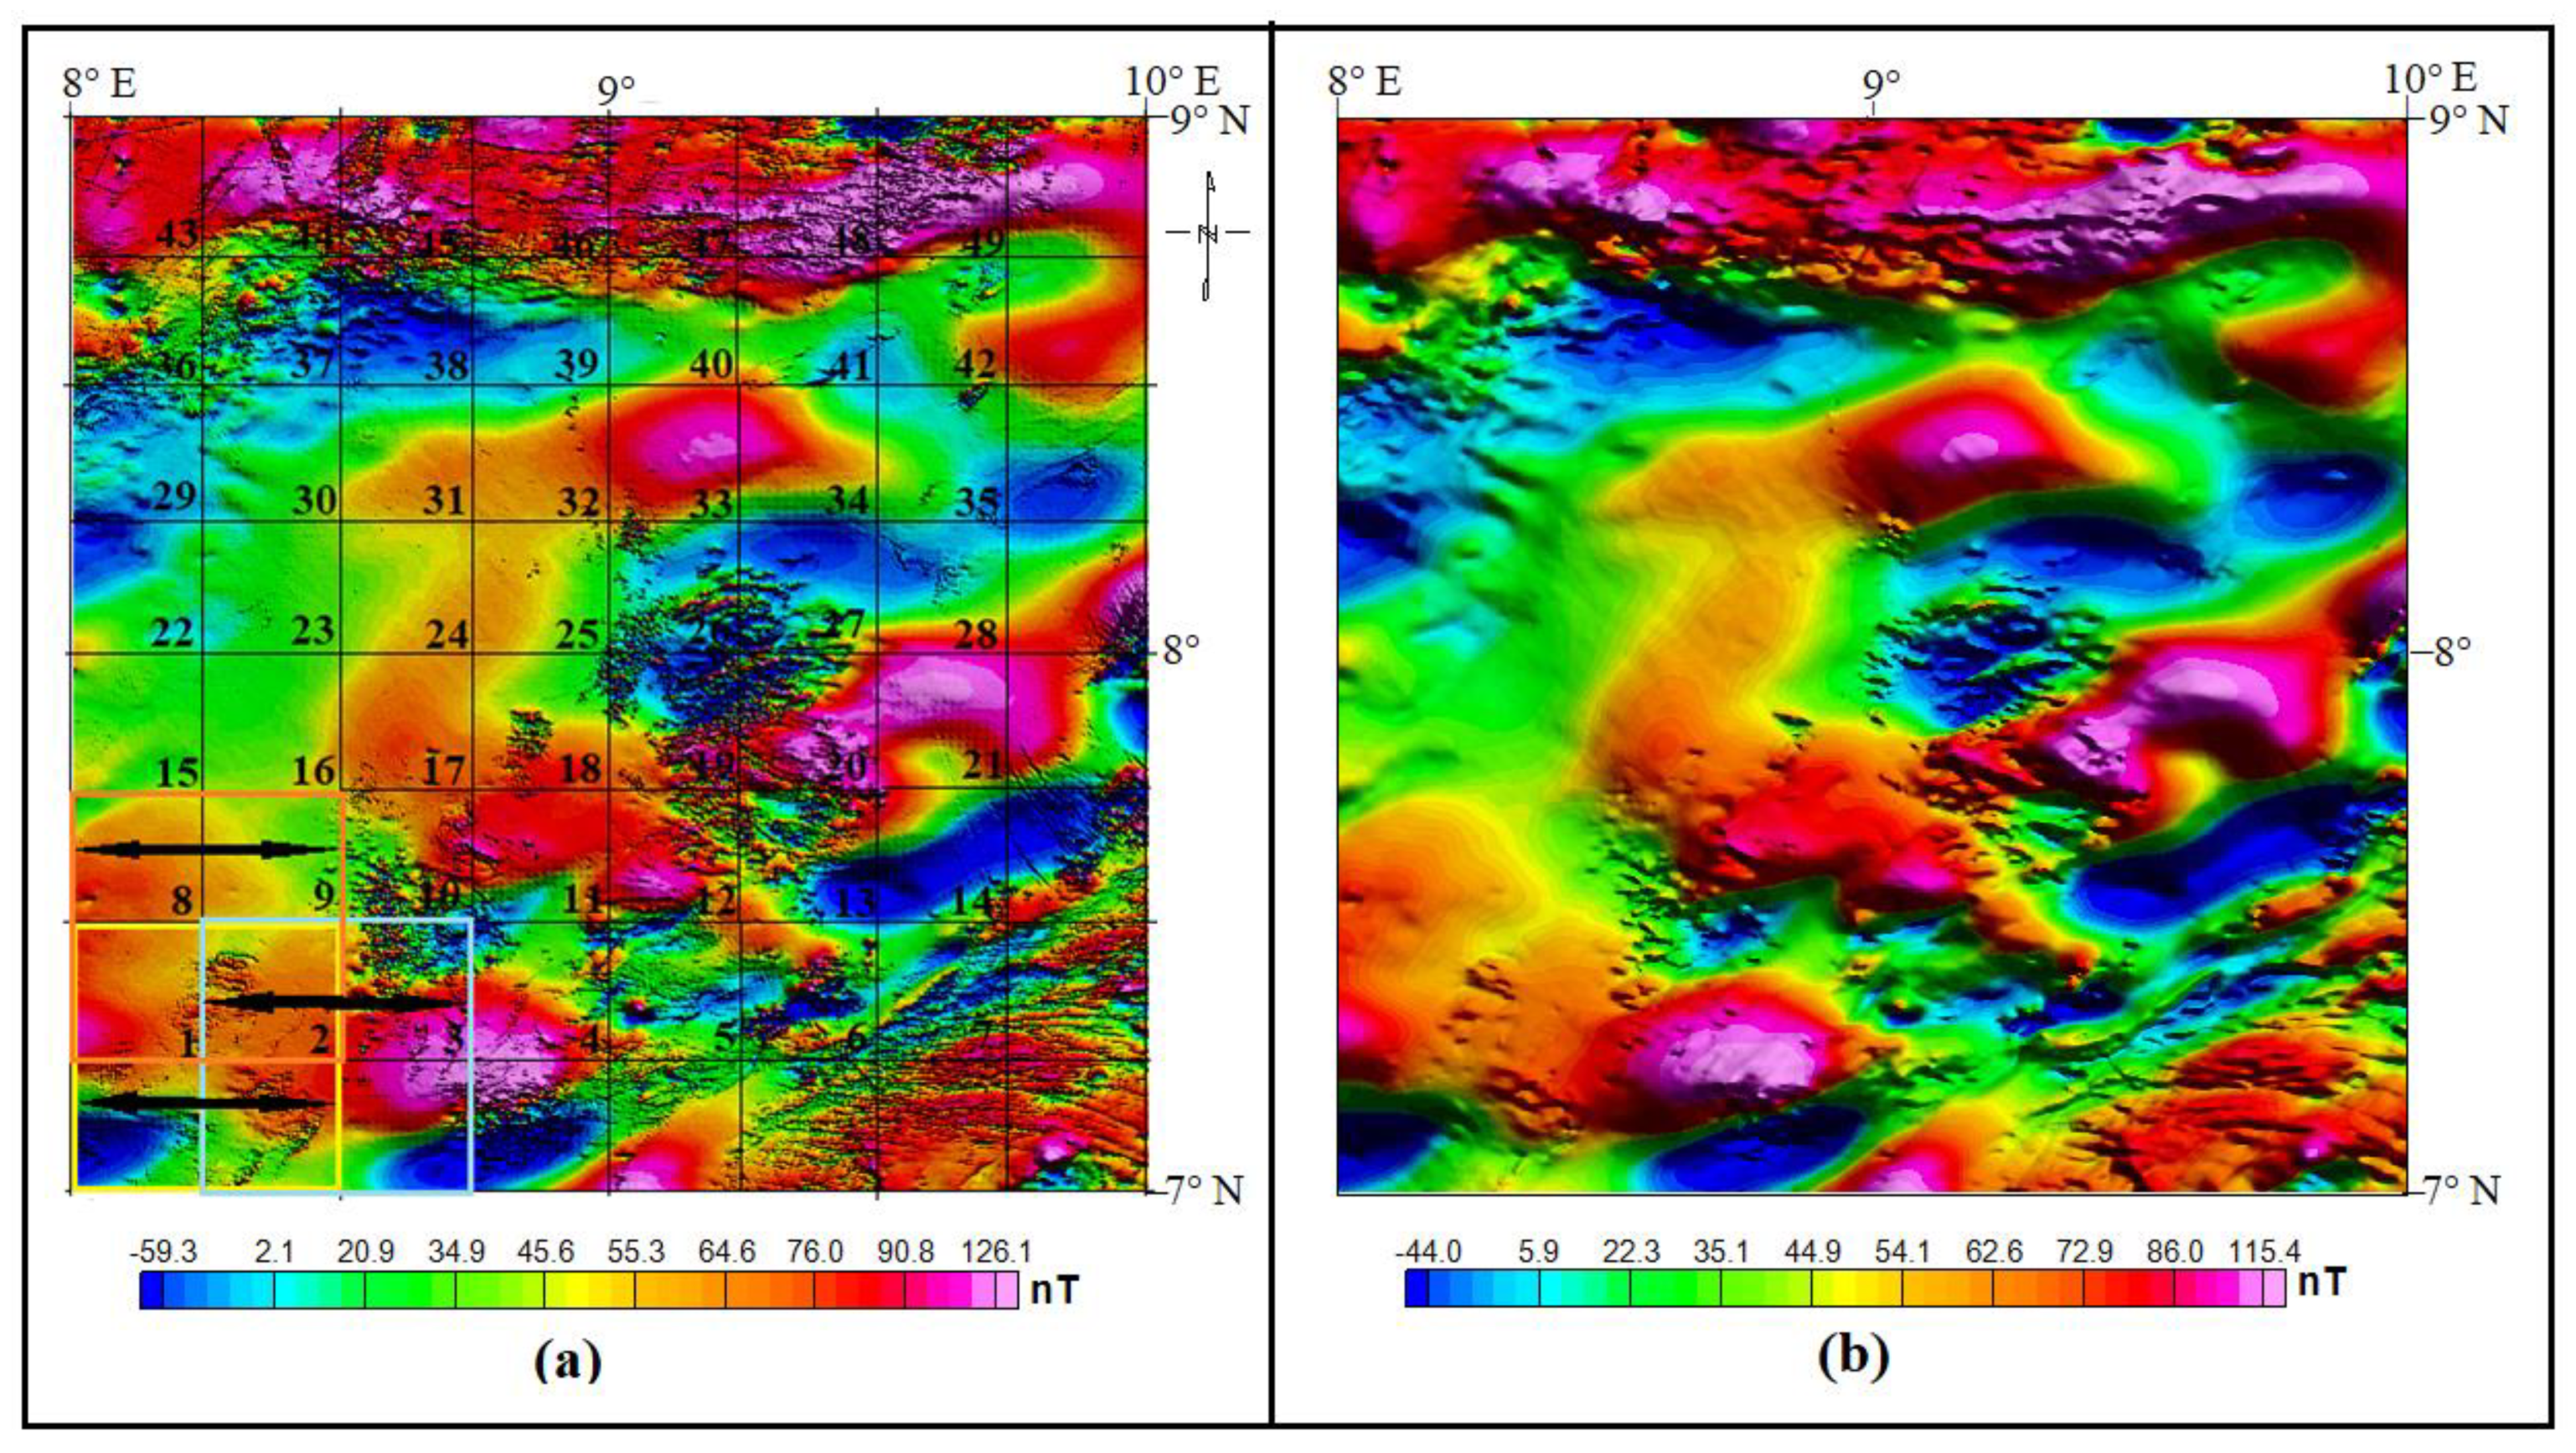
3.1. Acquisition of the High-Resolution Aeromagnetic Data (HRAD)
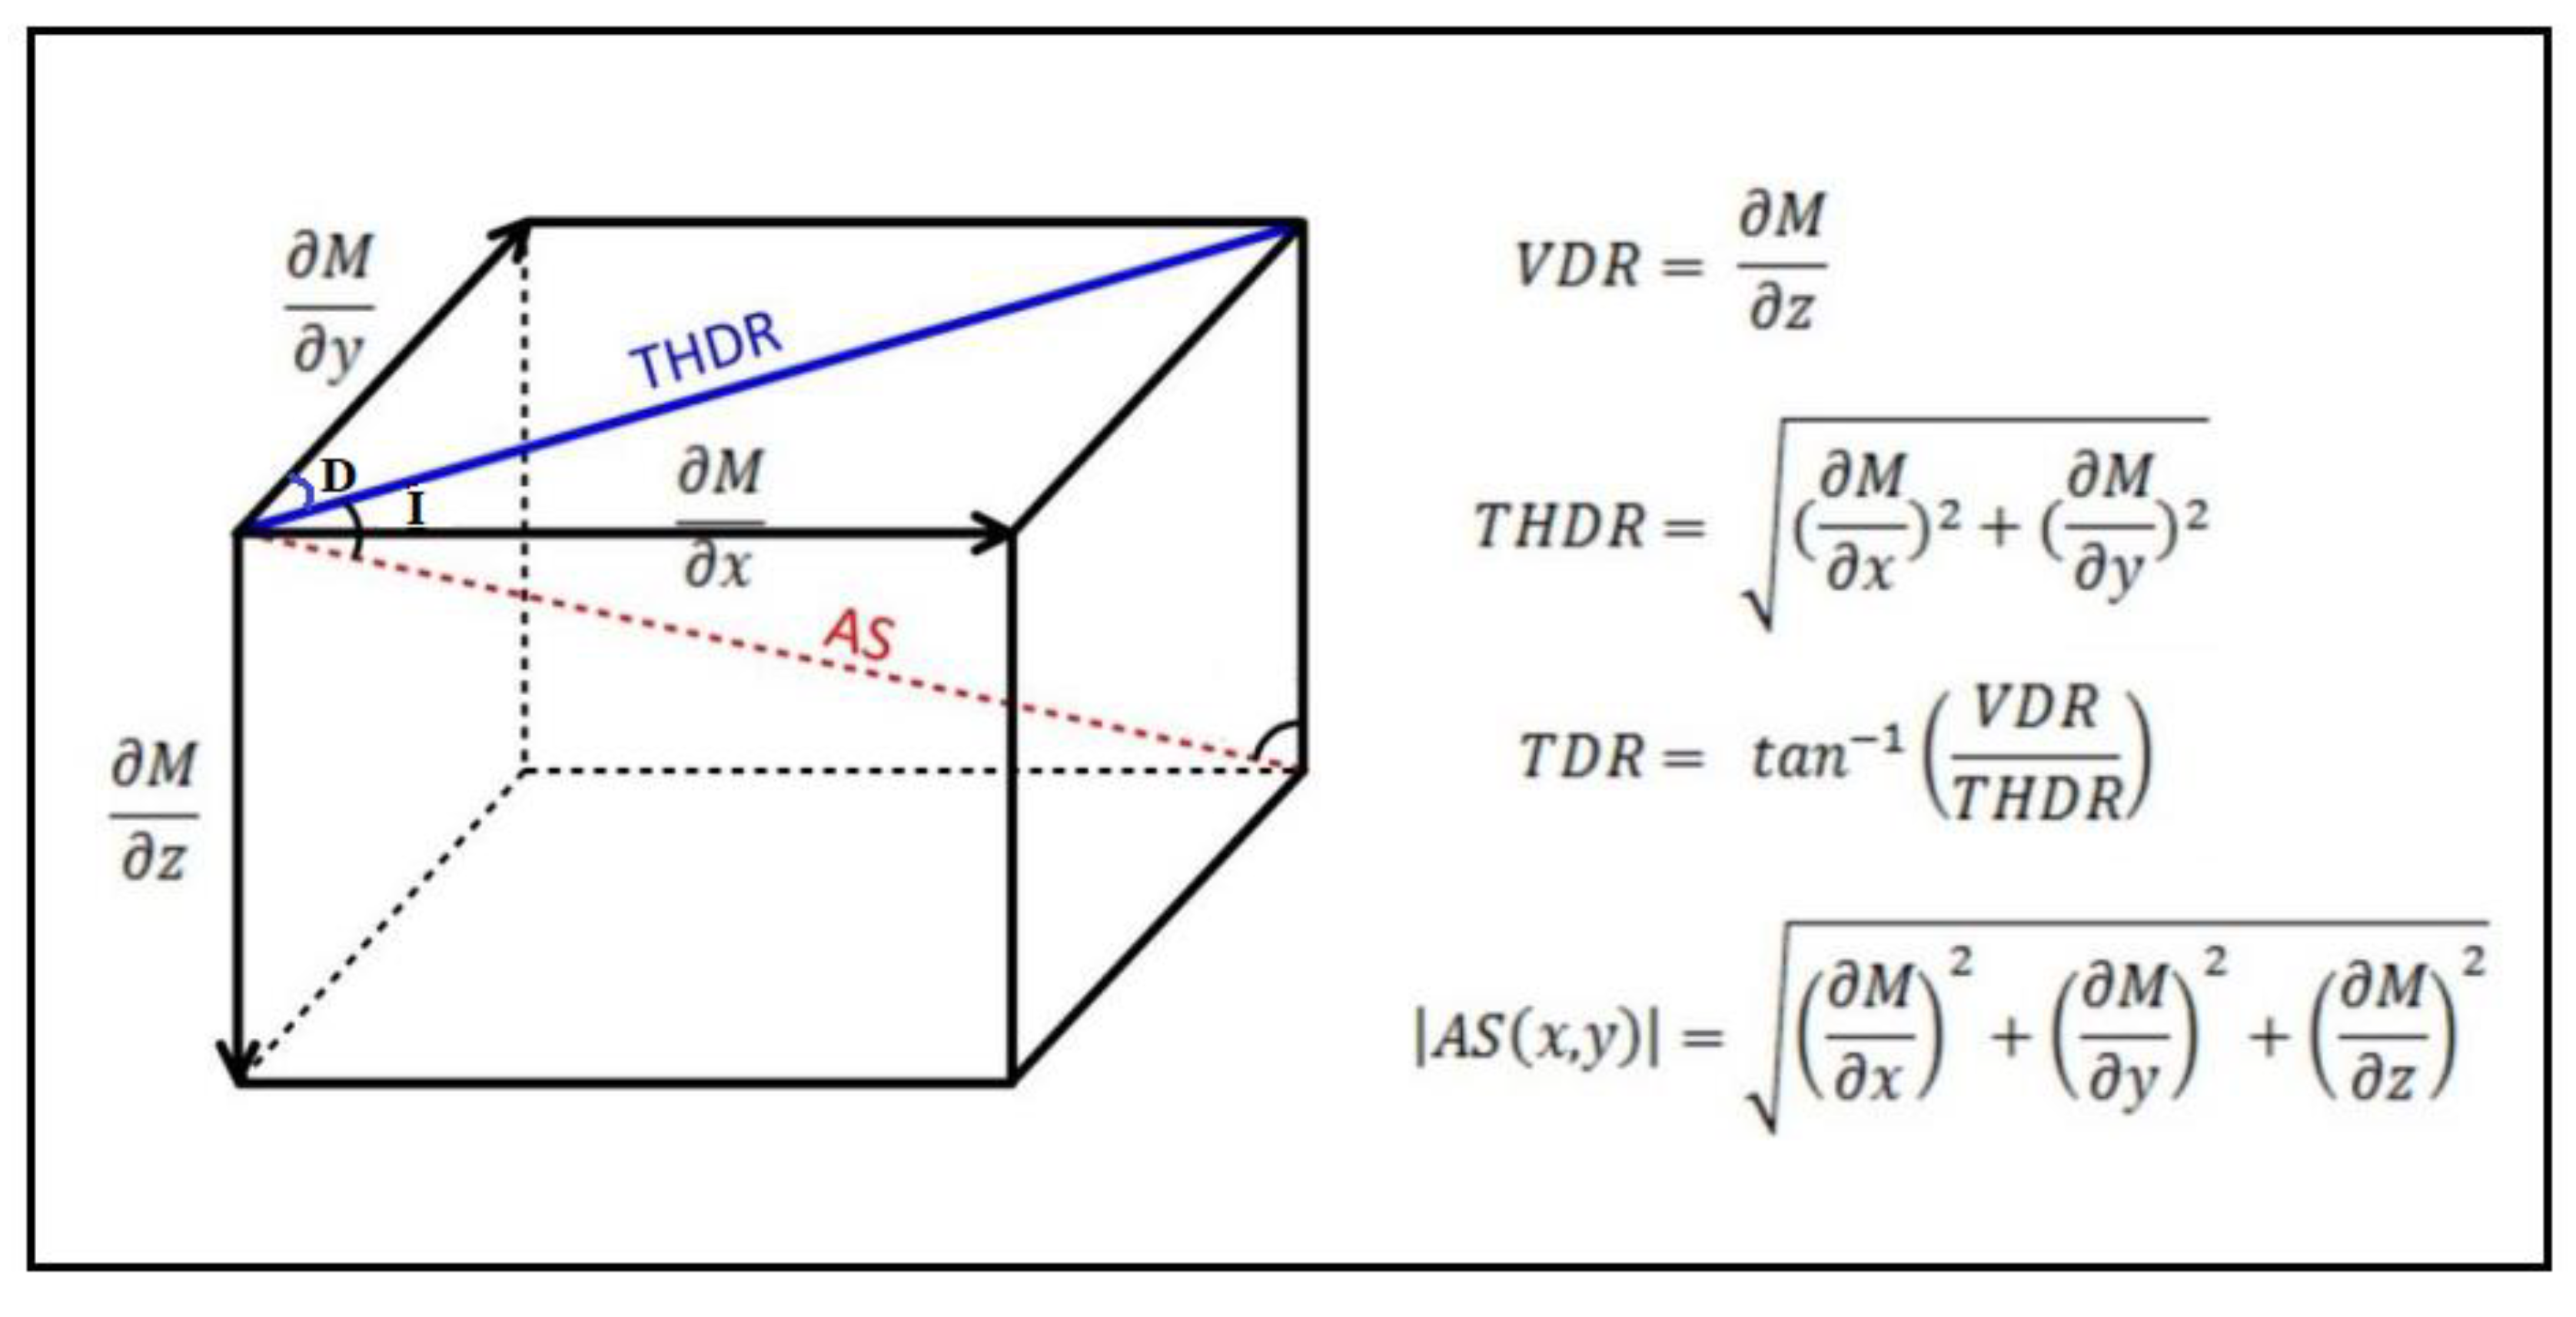
3.2. Edge Detector Operations
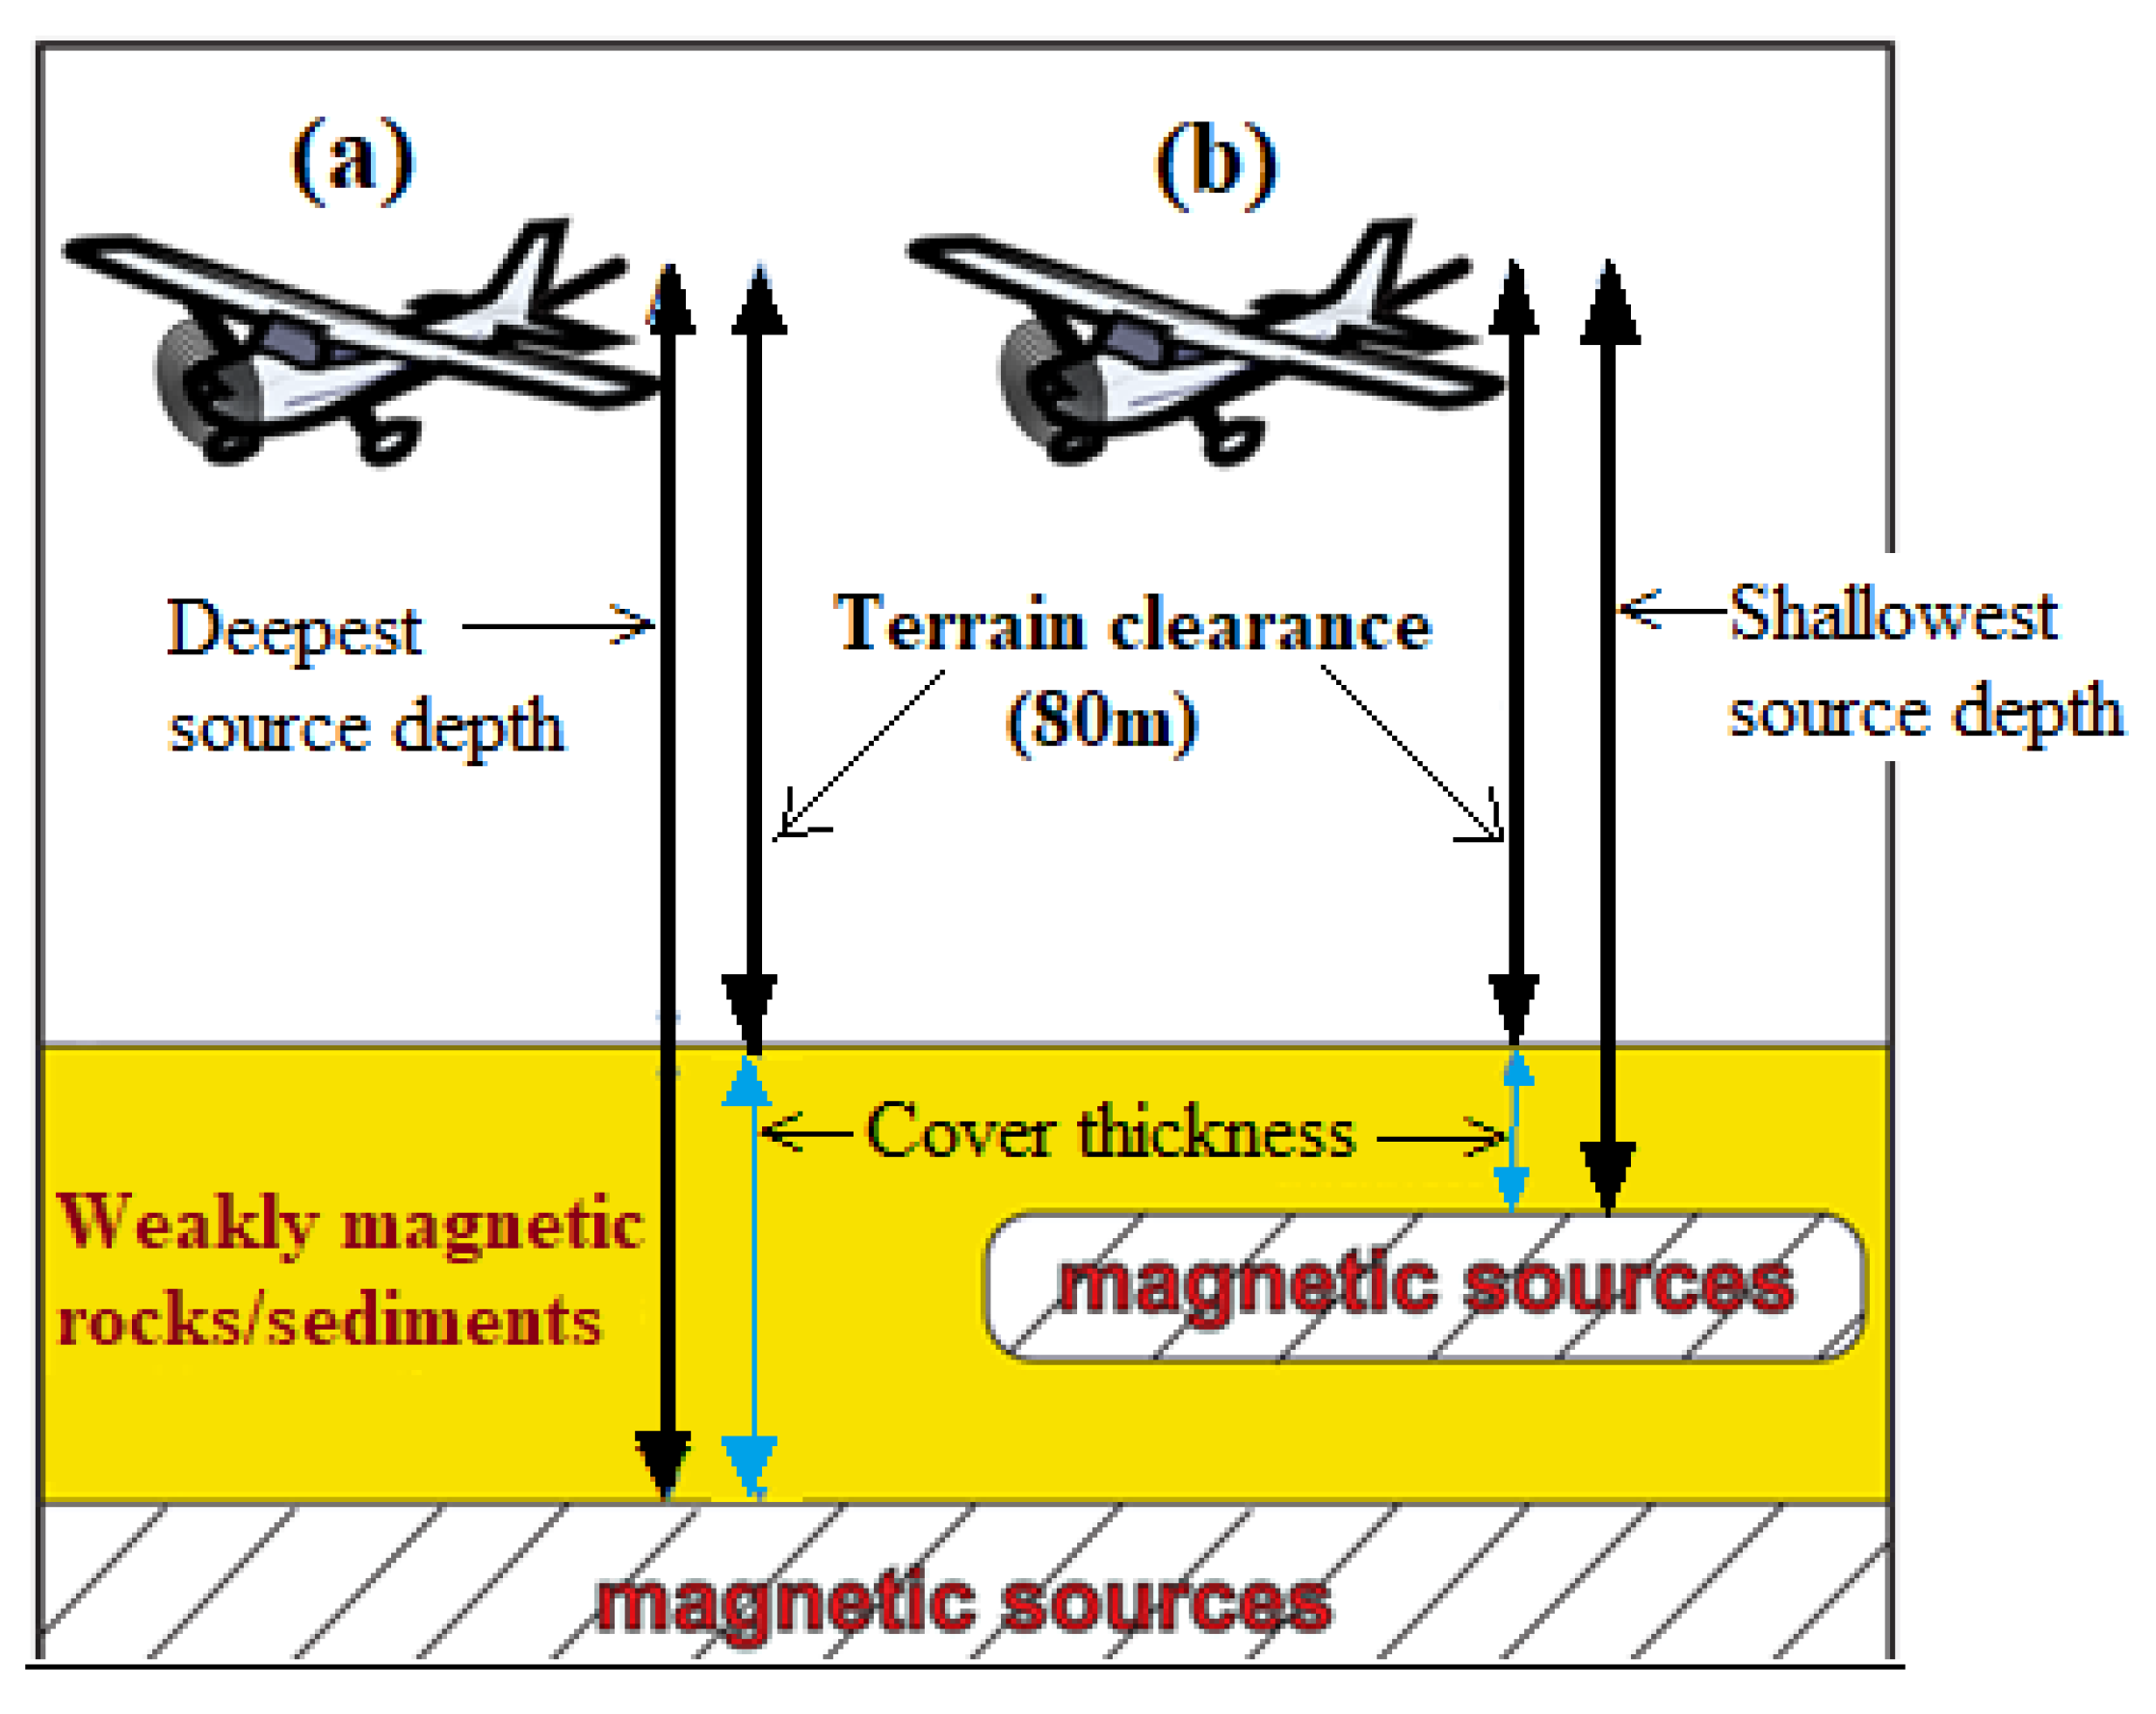
3.3. Spectral Depth Analysis
4. Results
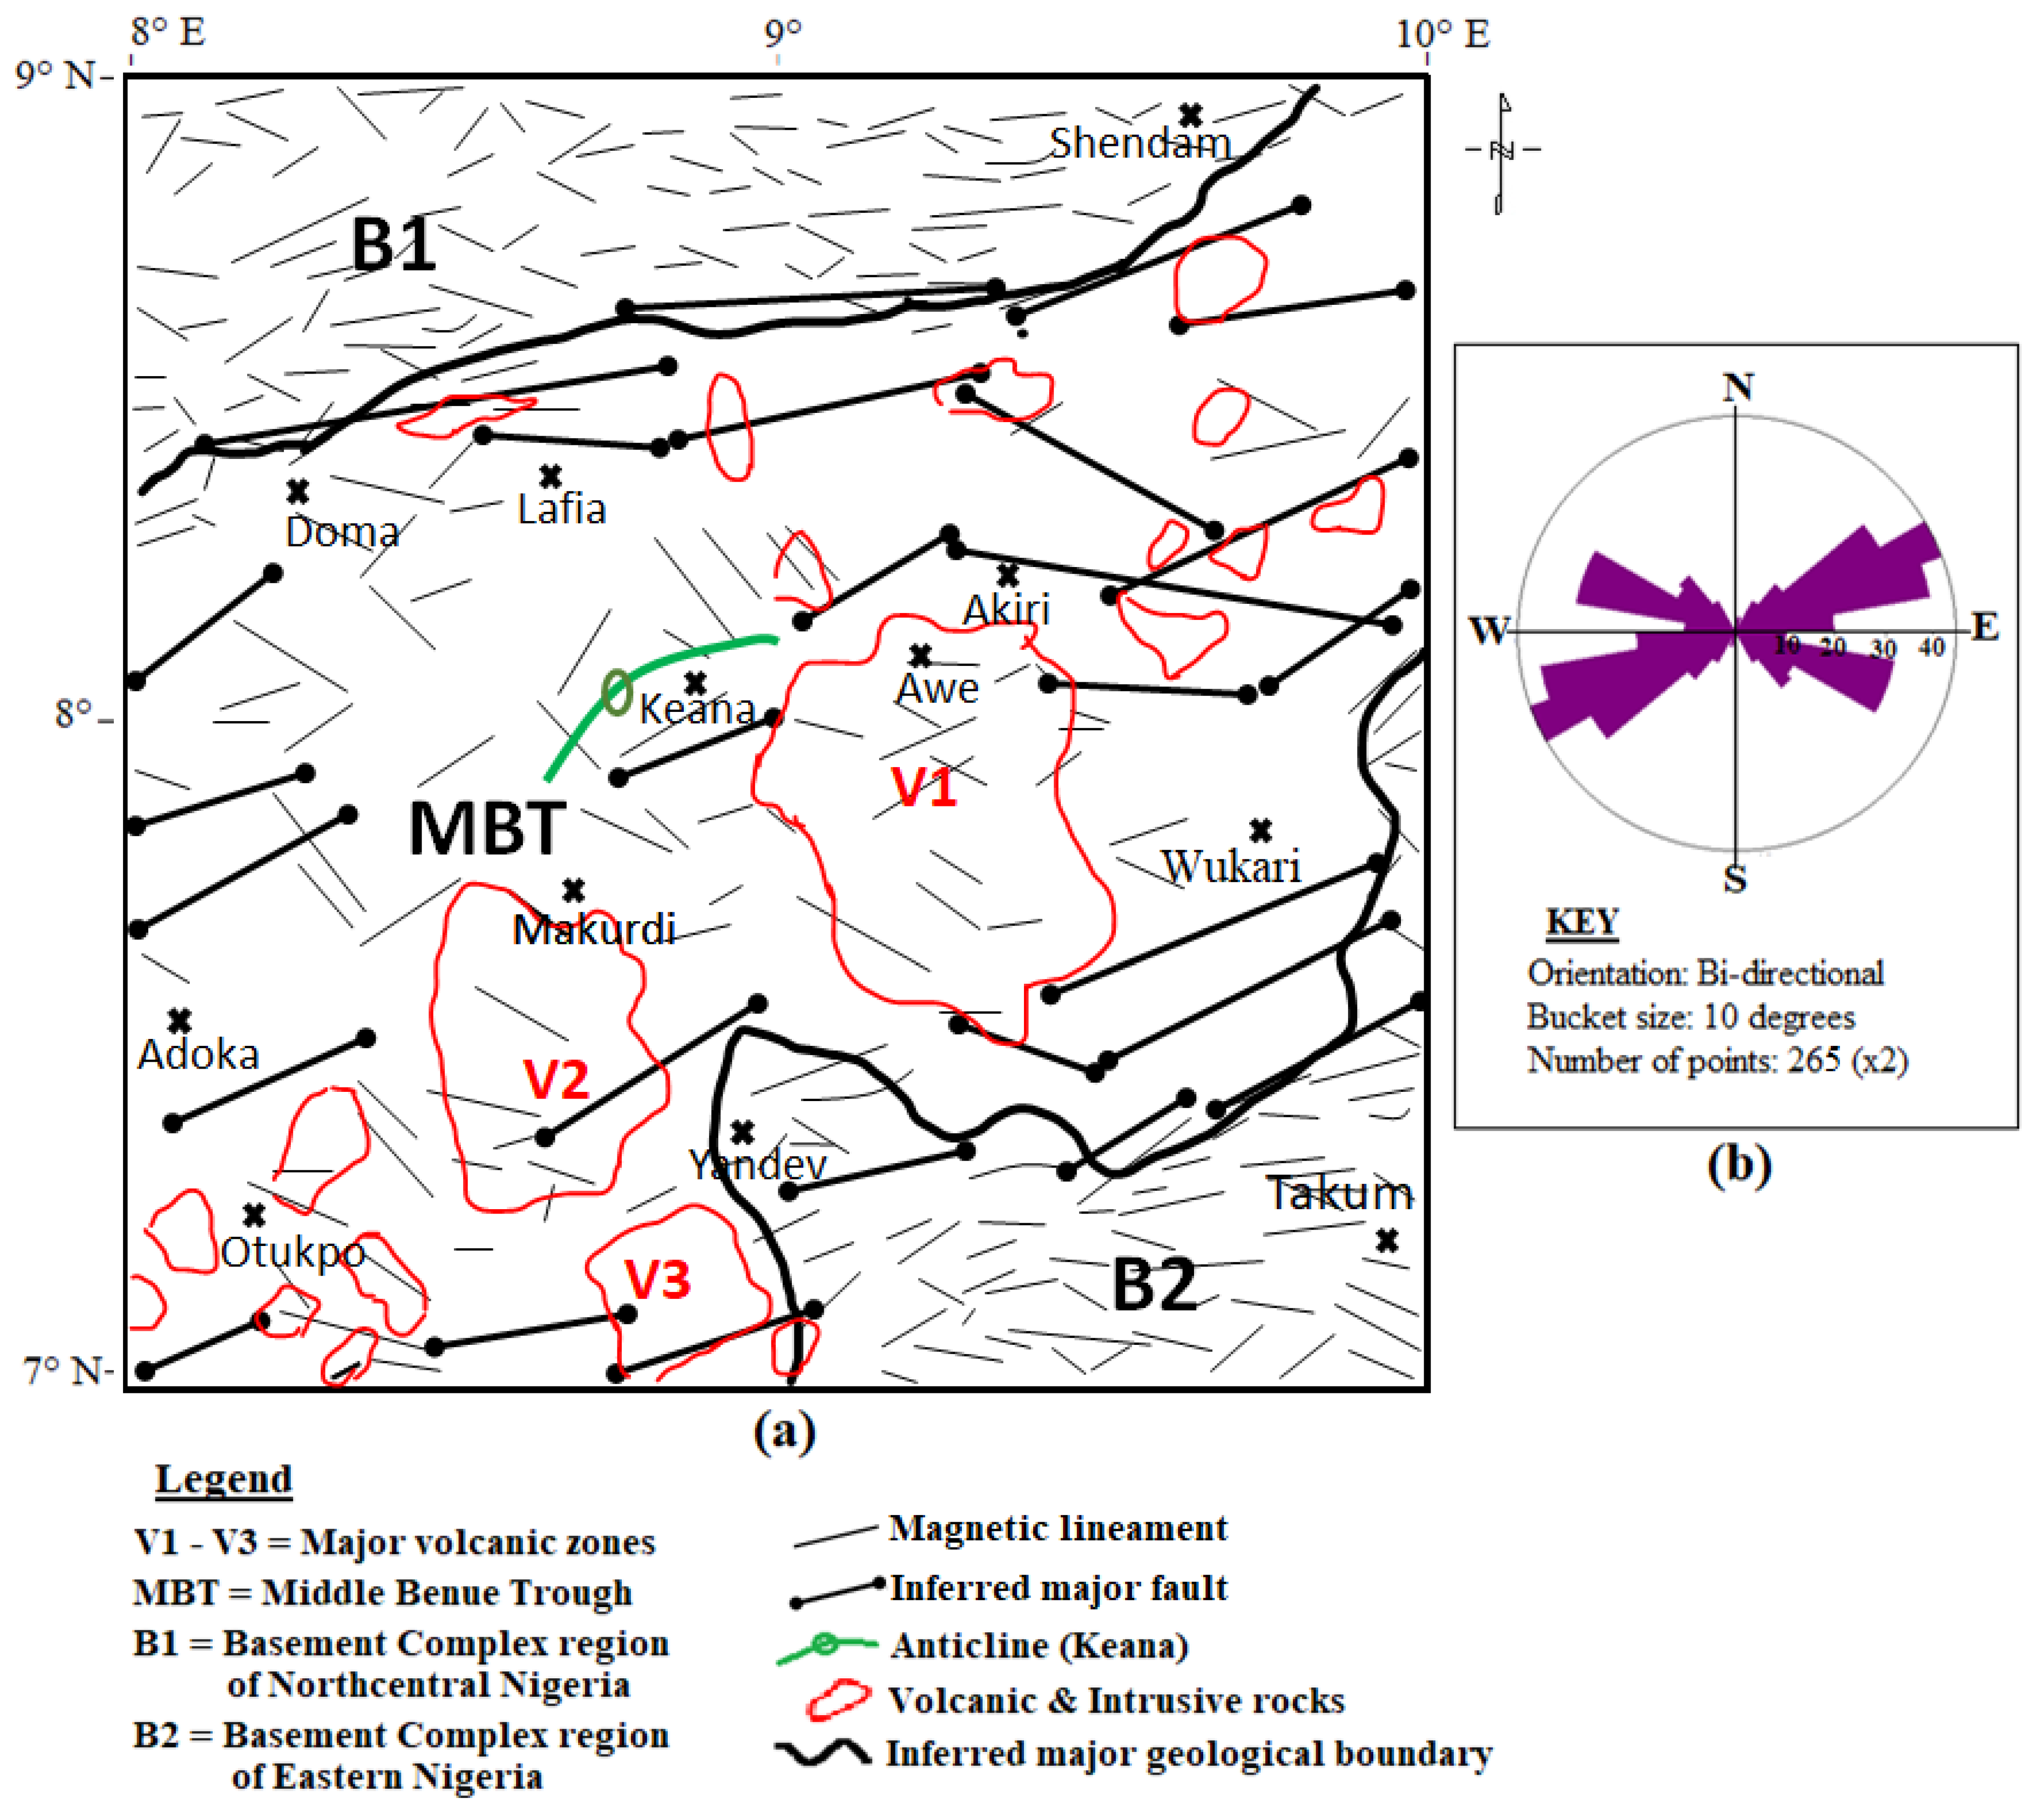
4.1. Mapping of Intrusive and Volcanic Rocks (Intrasedimentary Features)
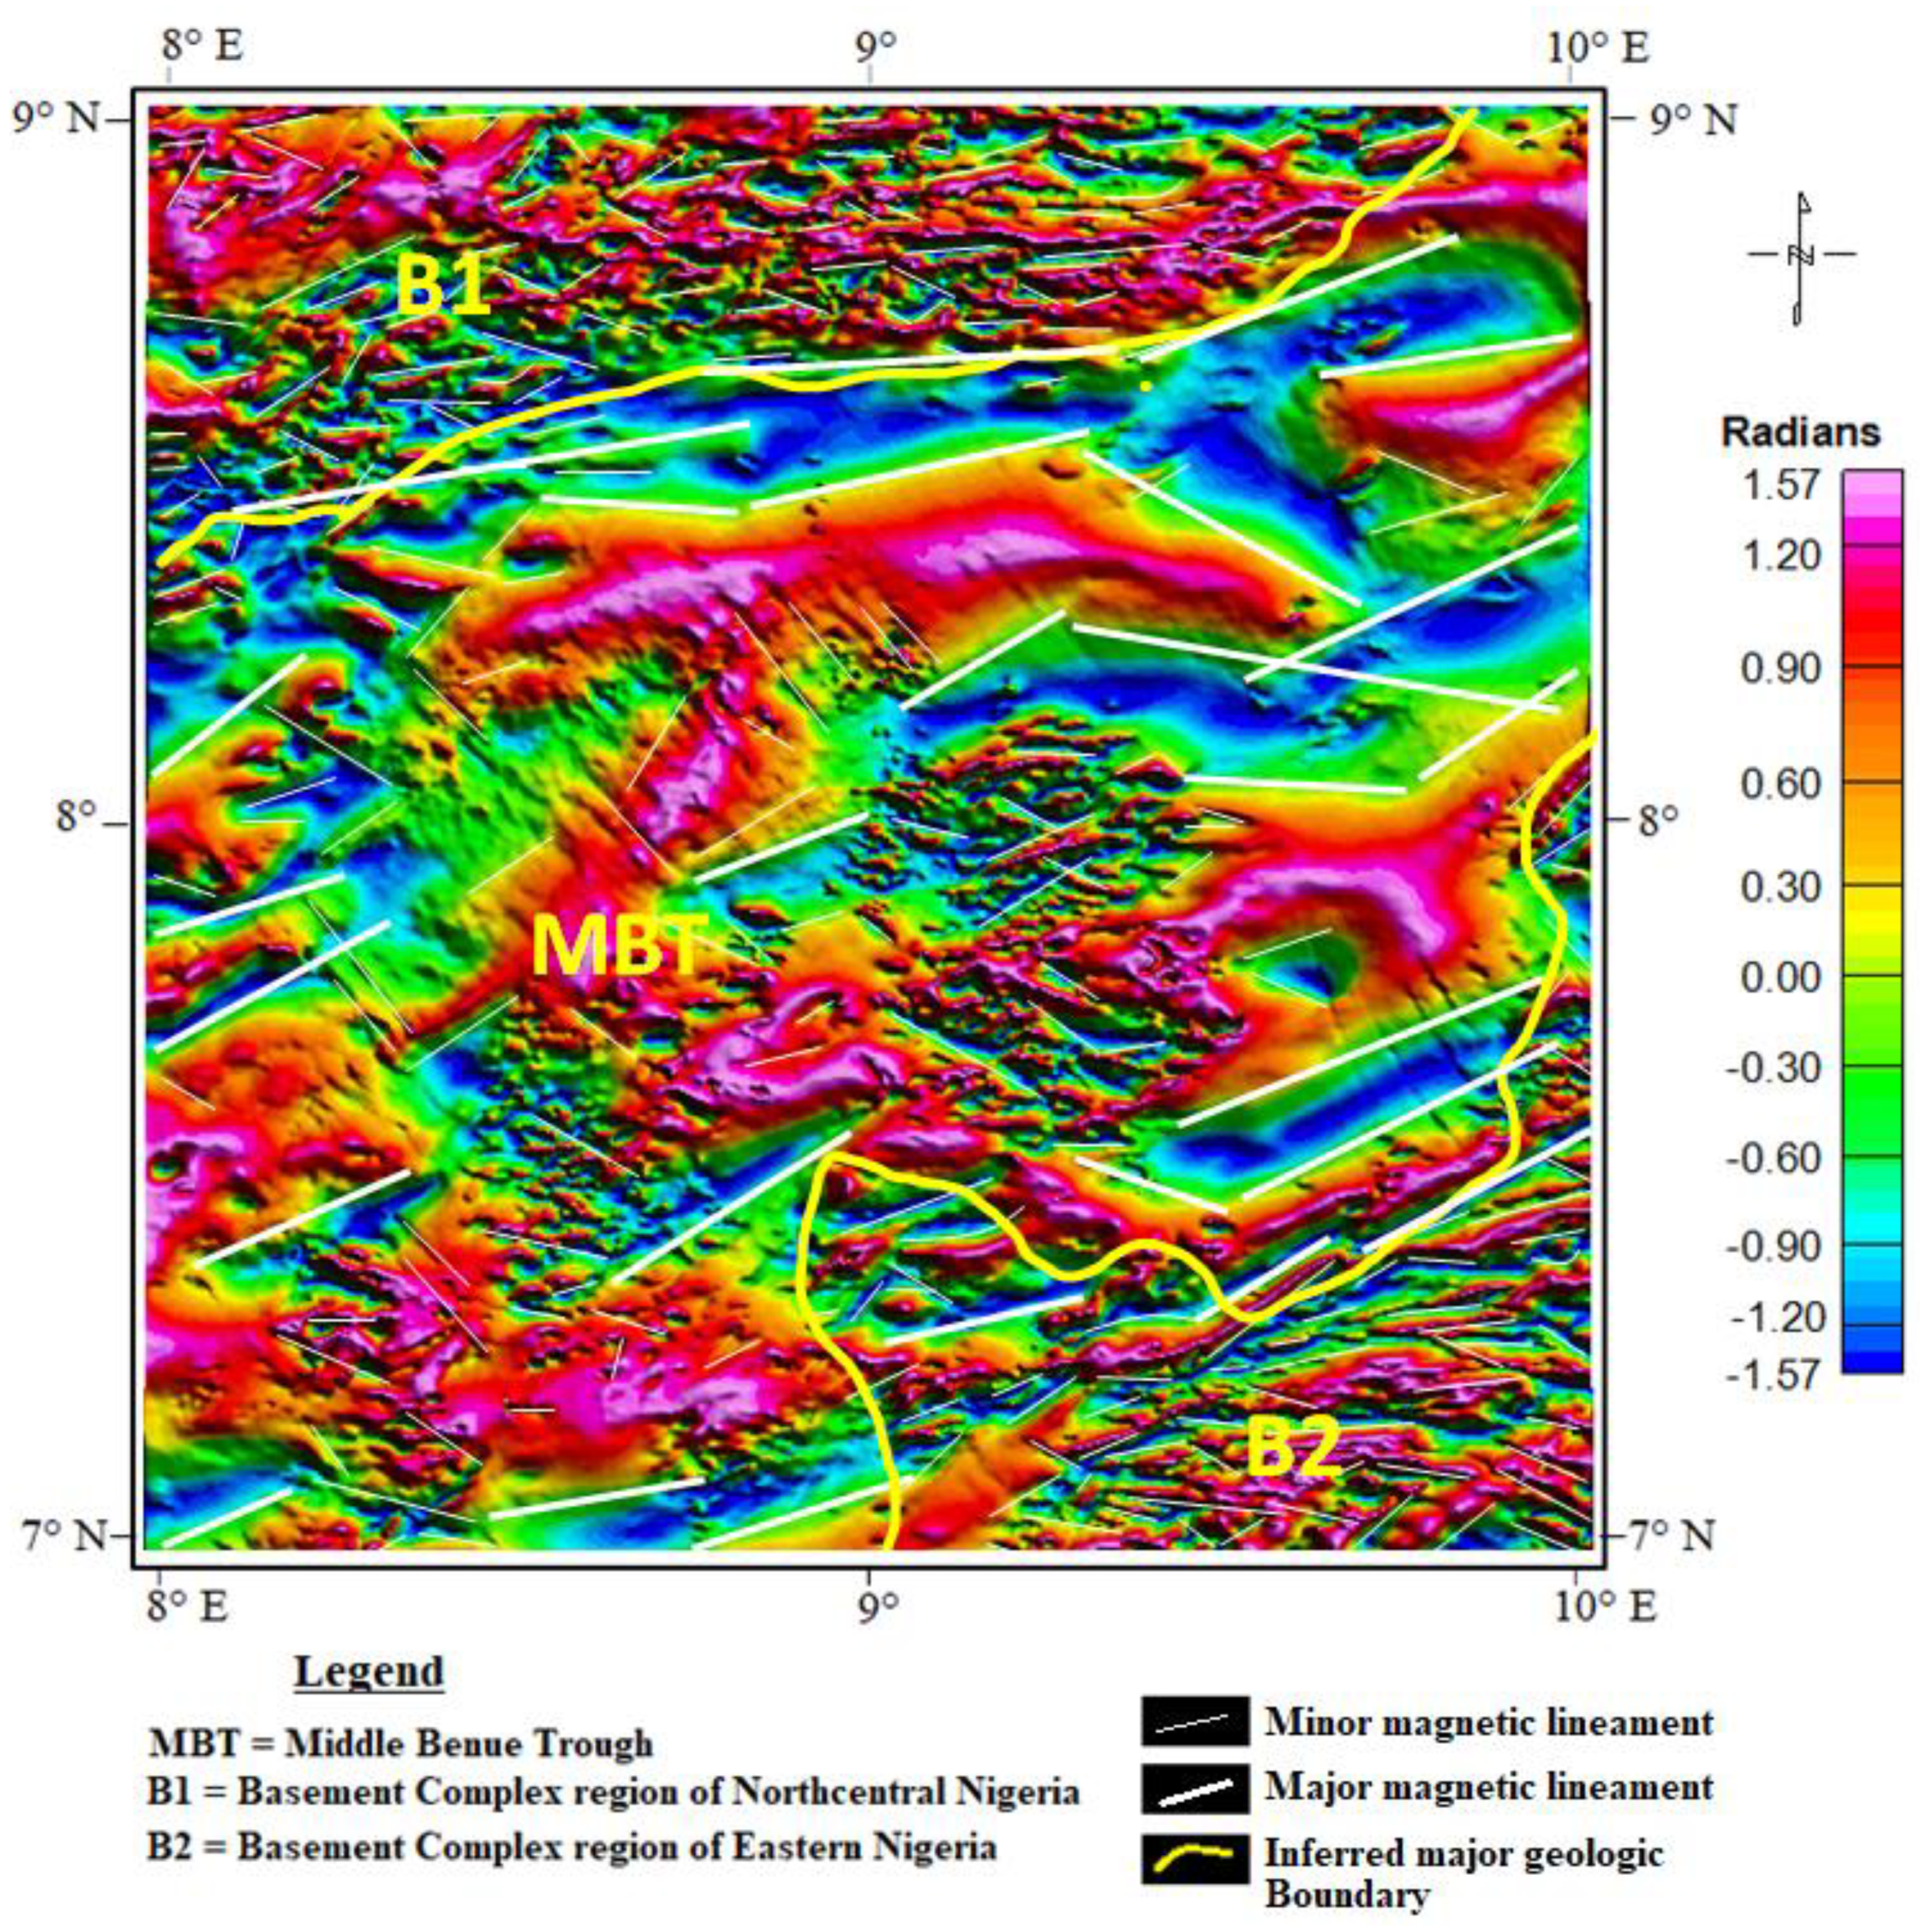
4.2. Structural Delineation
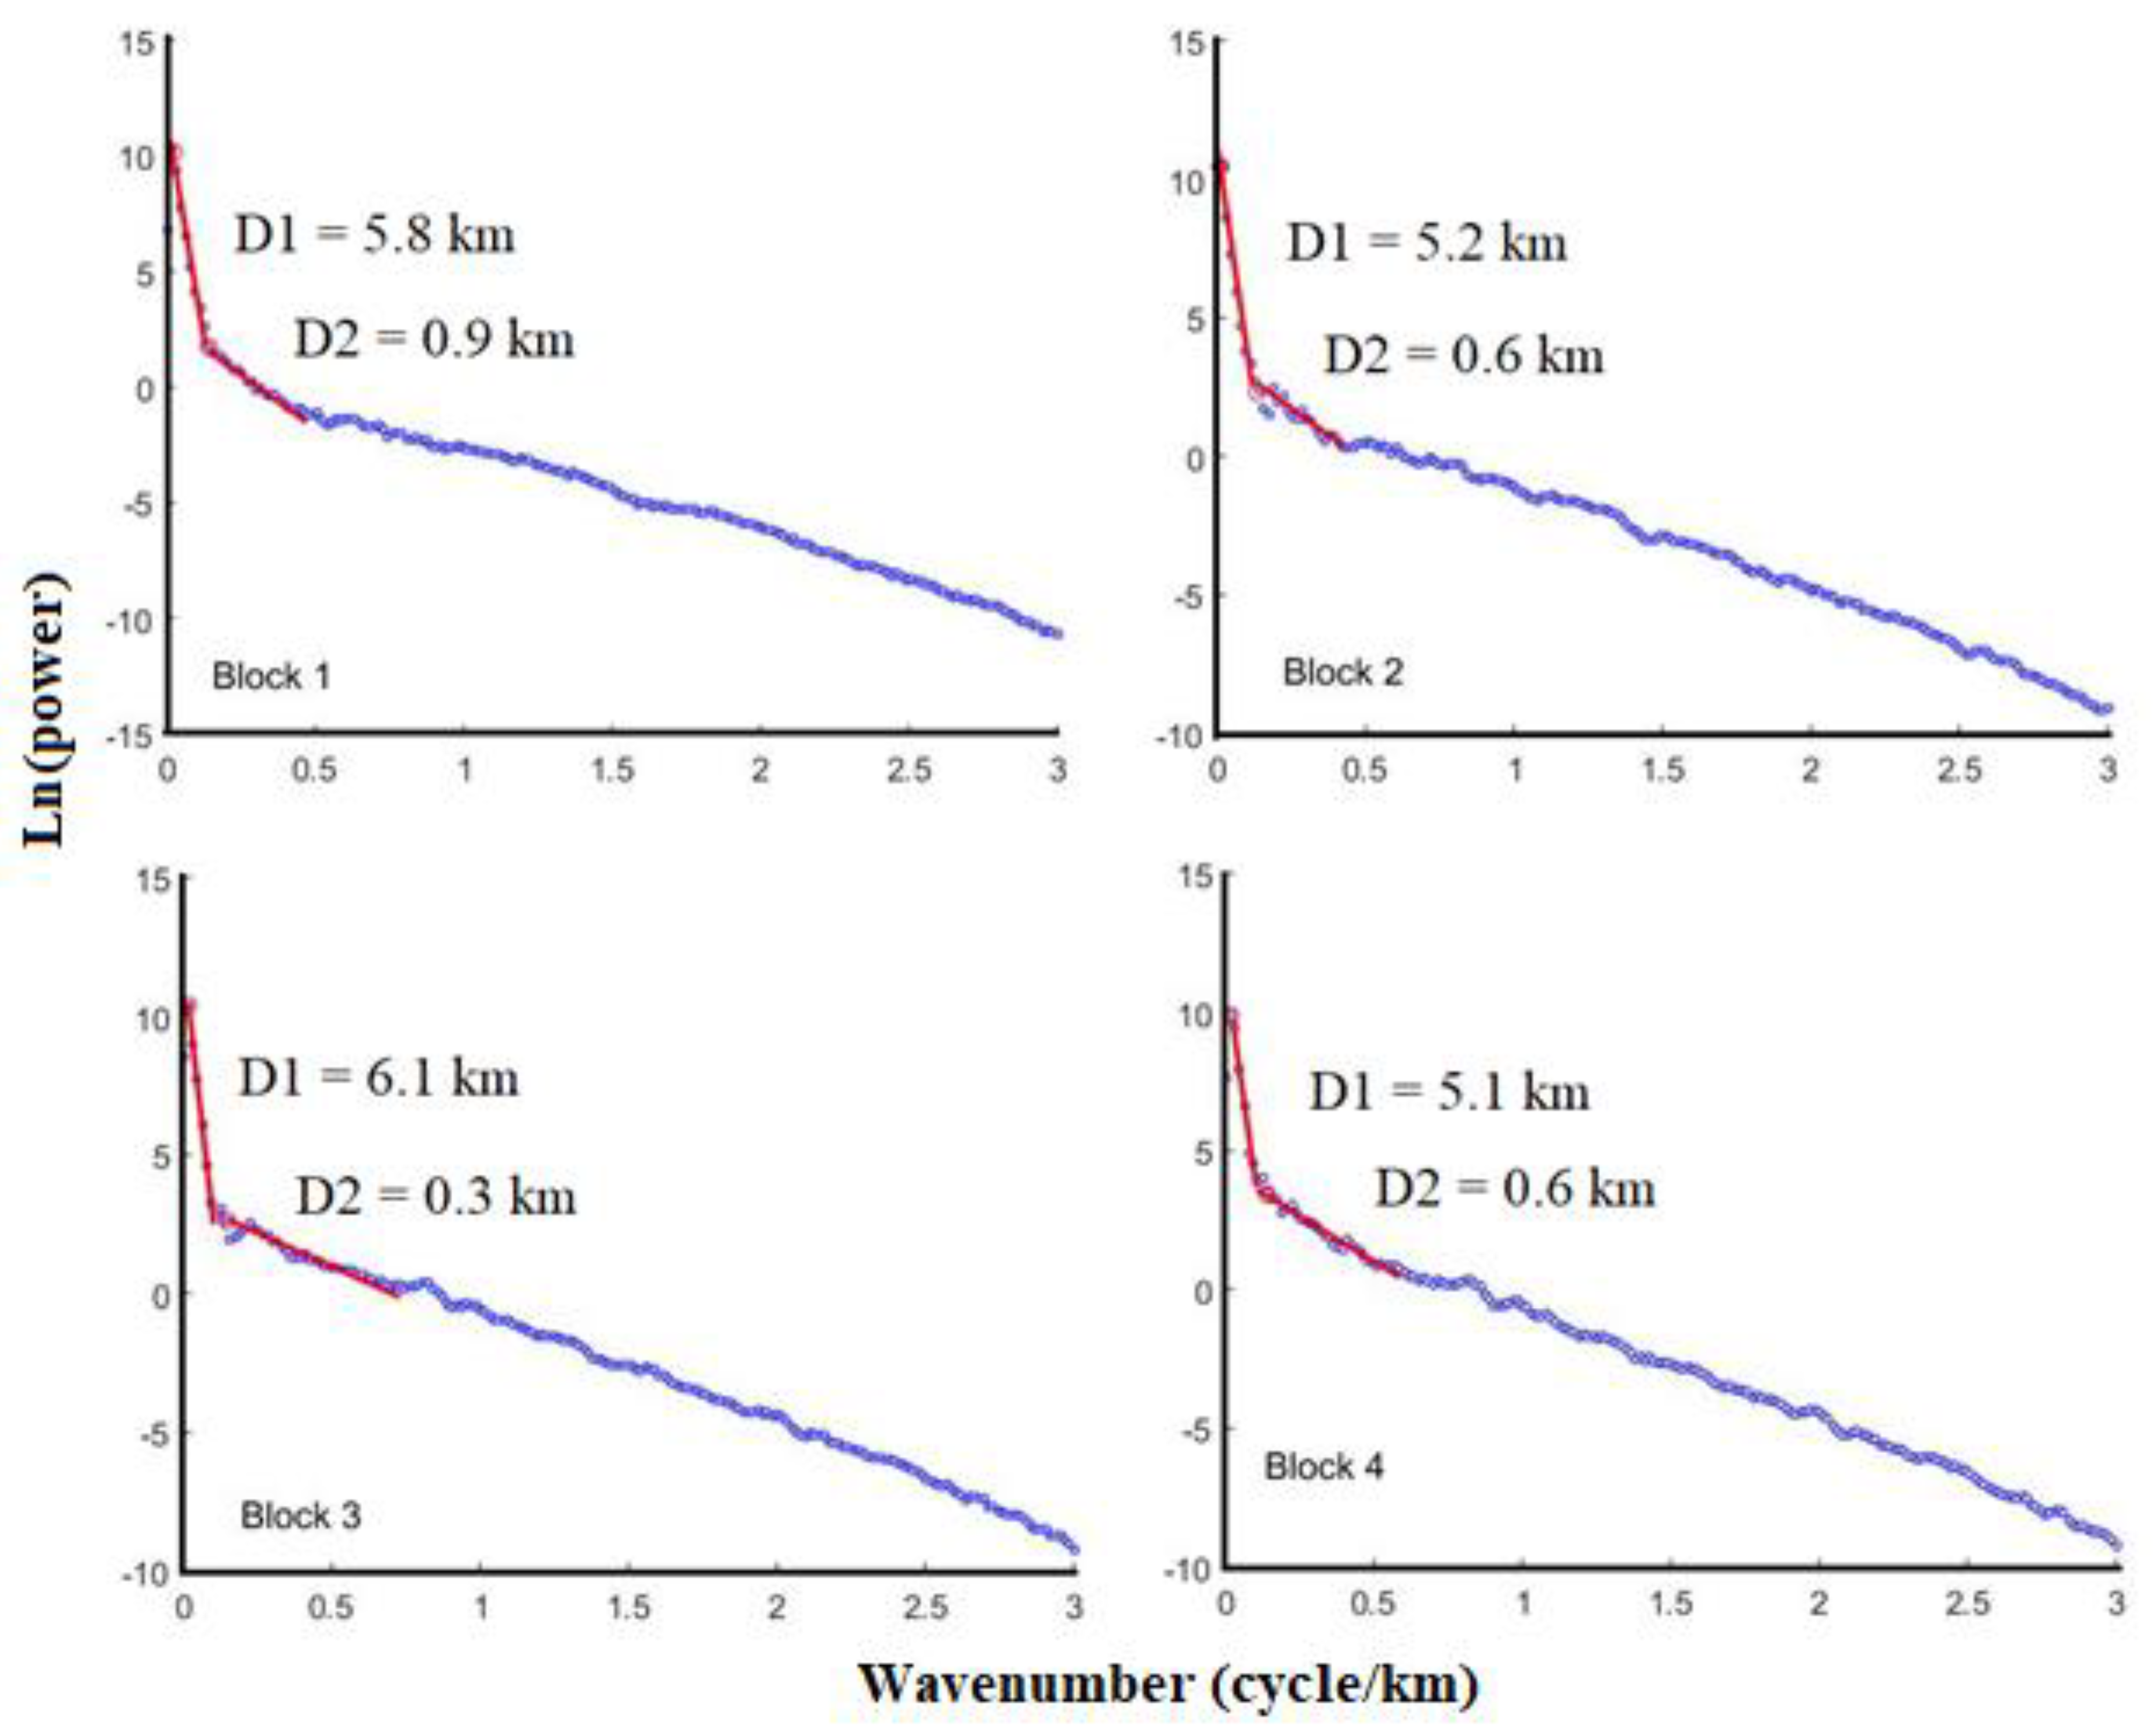
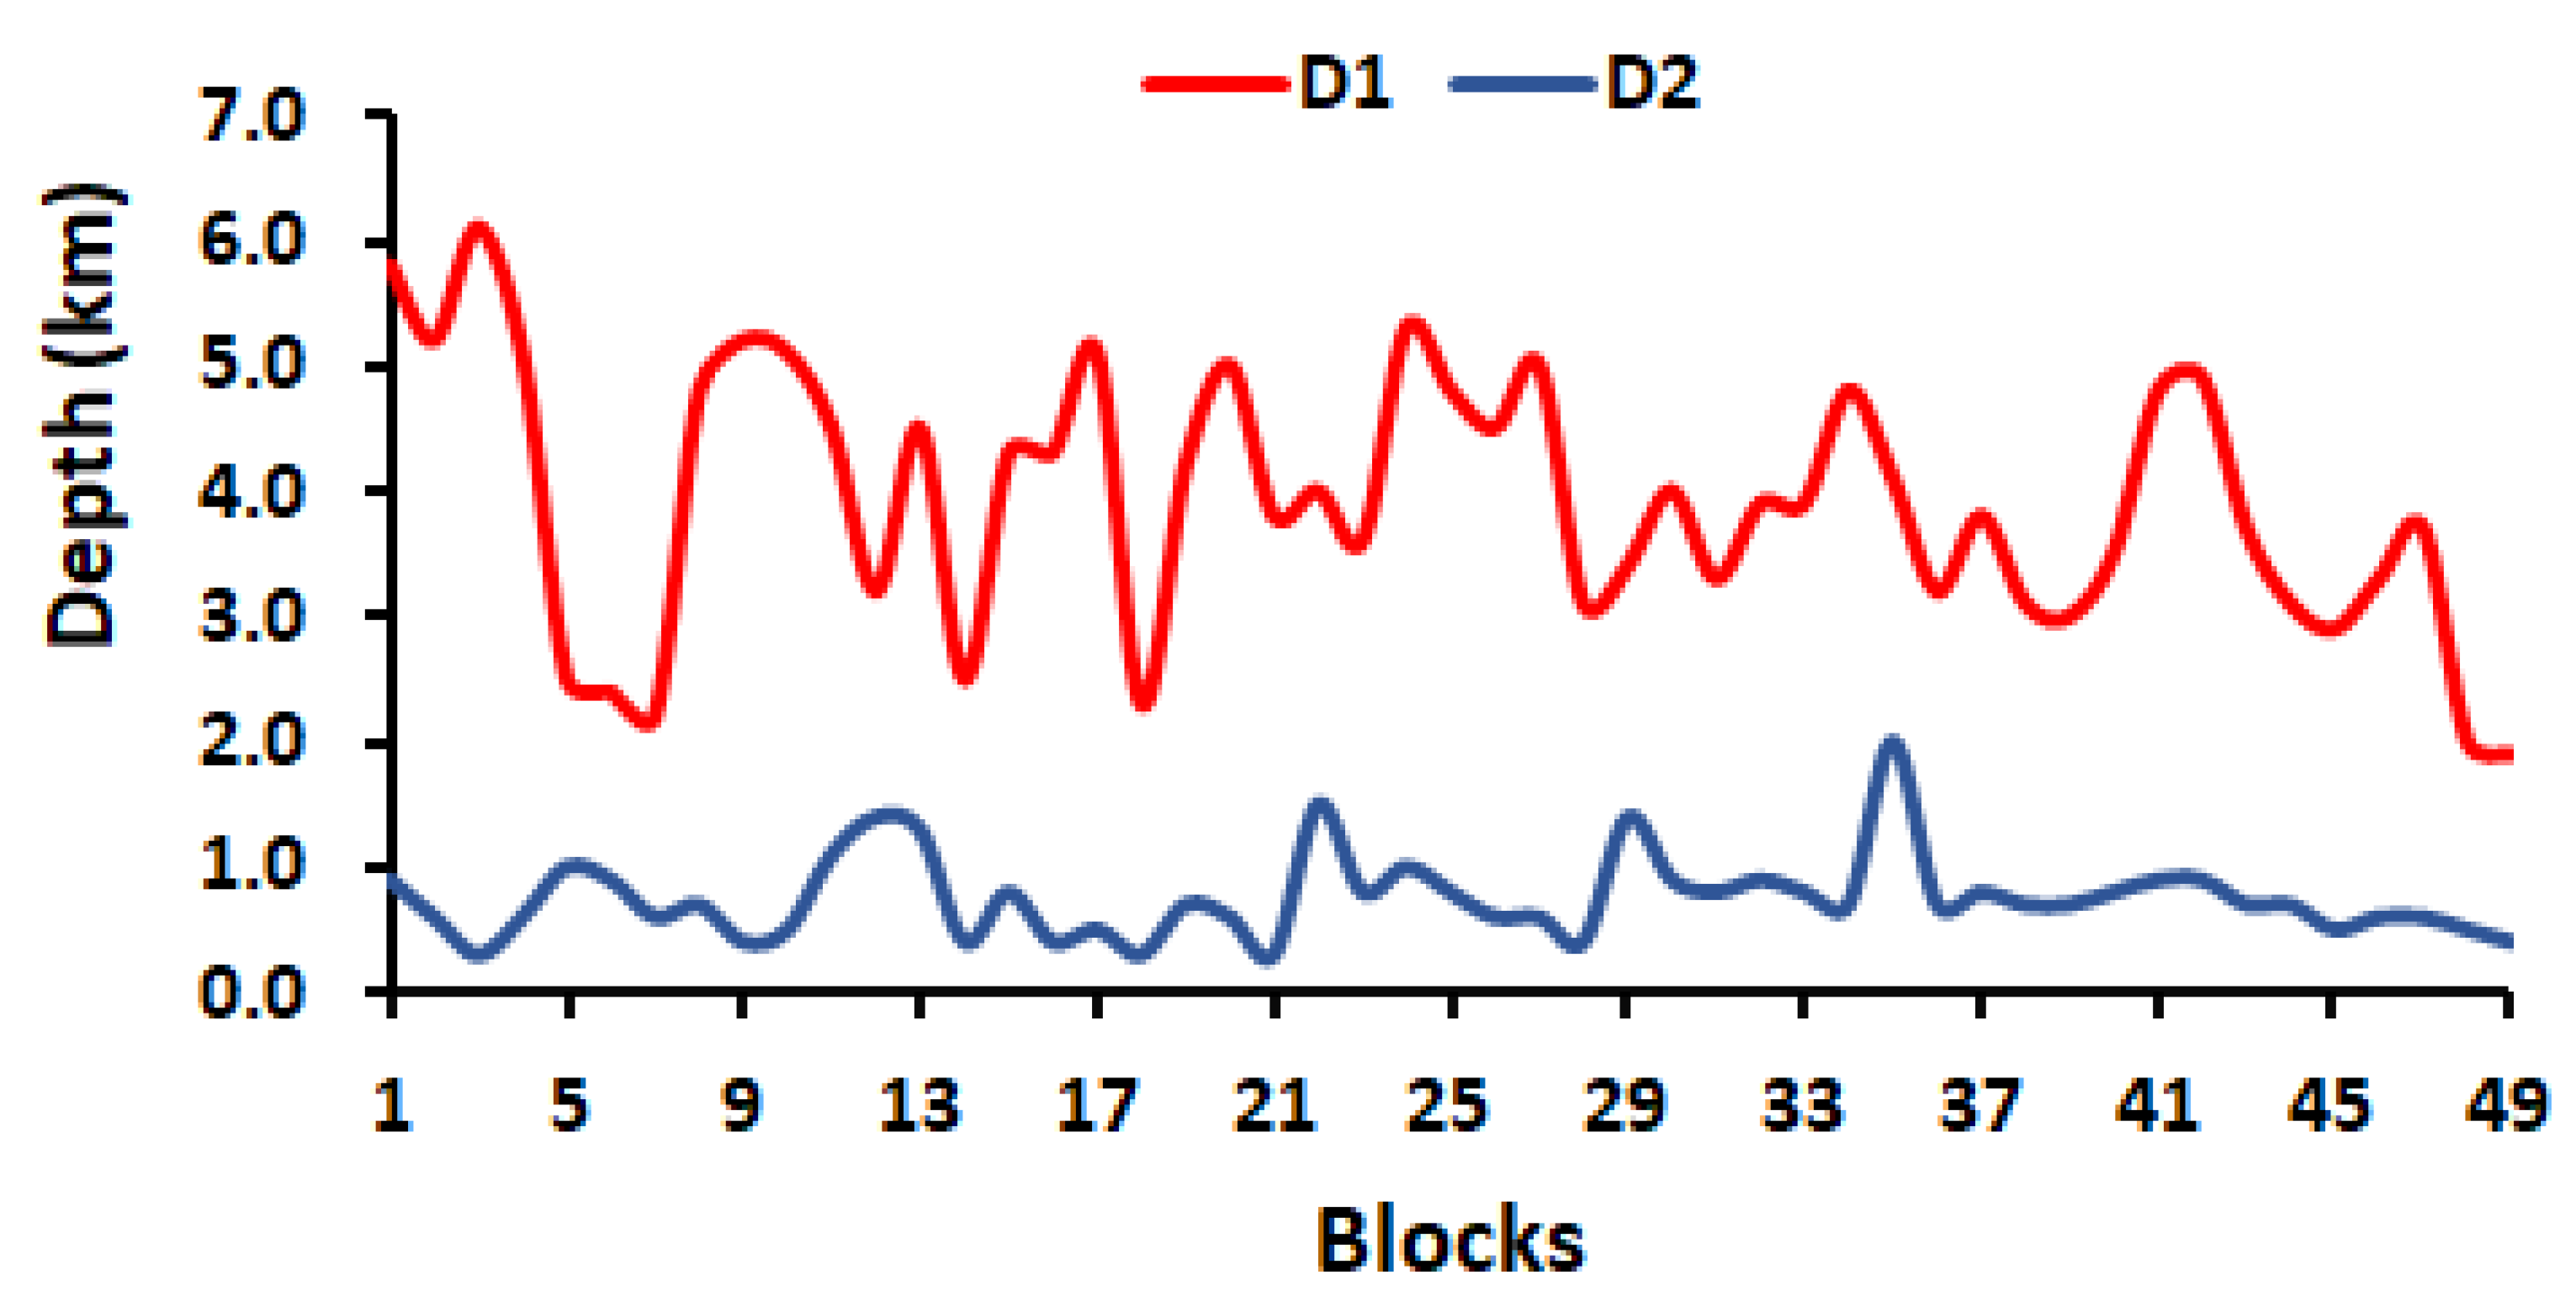
4.3. Results of Spectral Depth Analysis
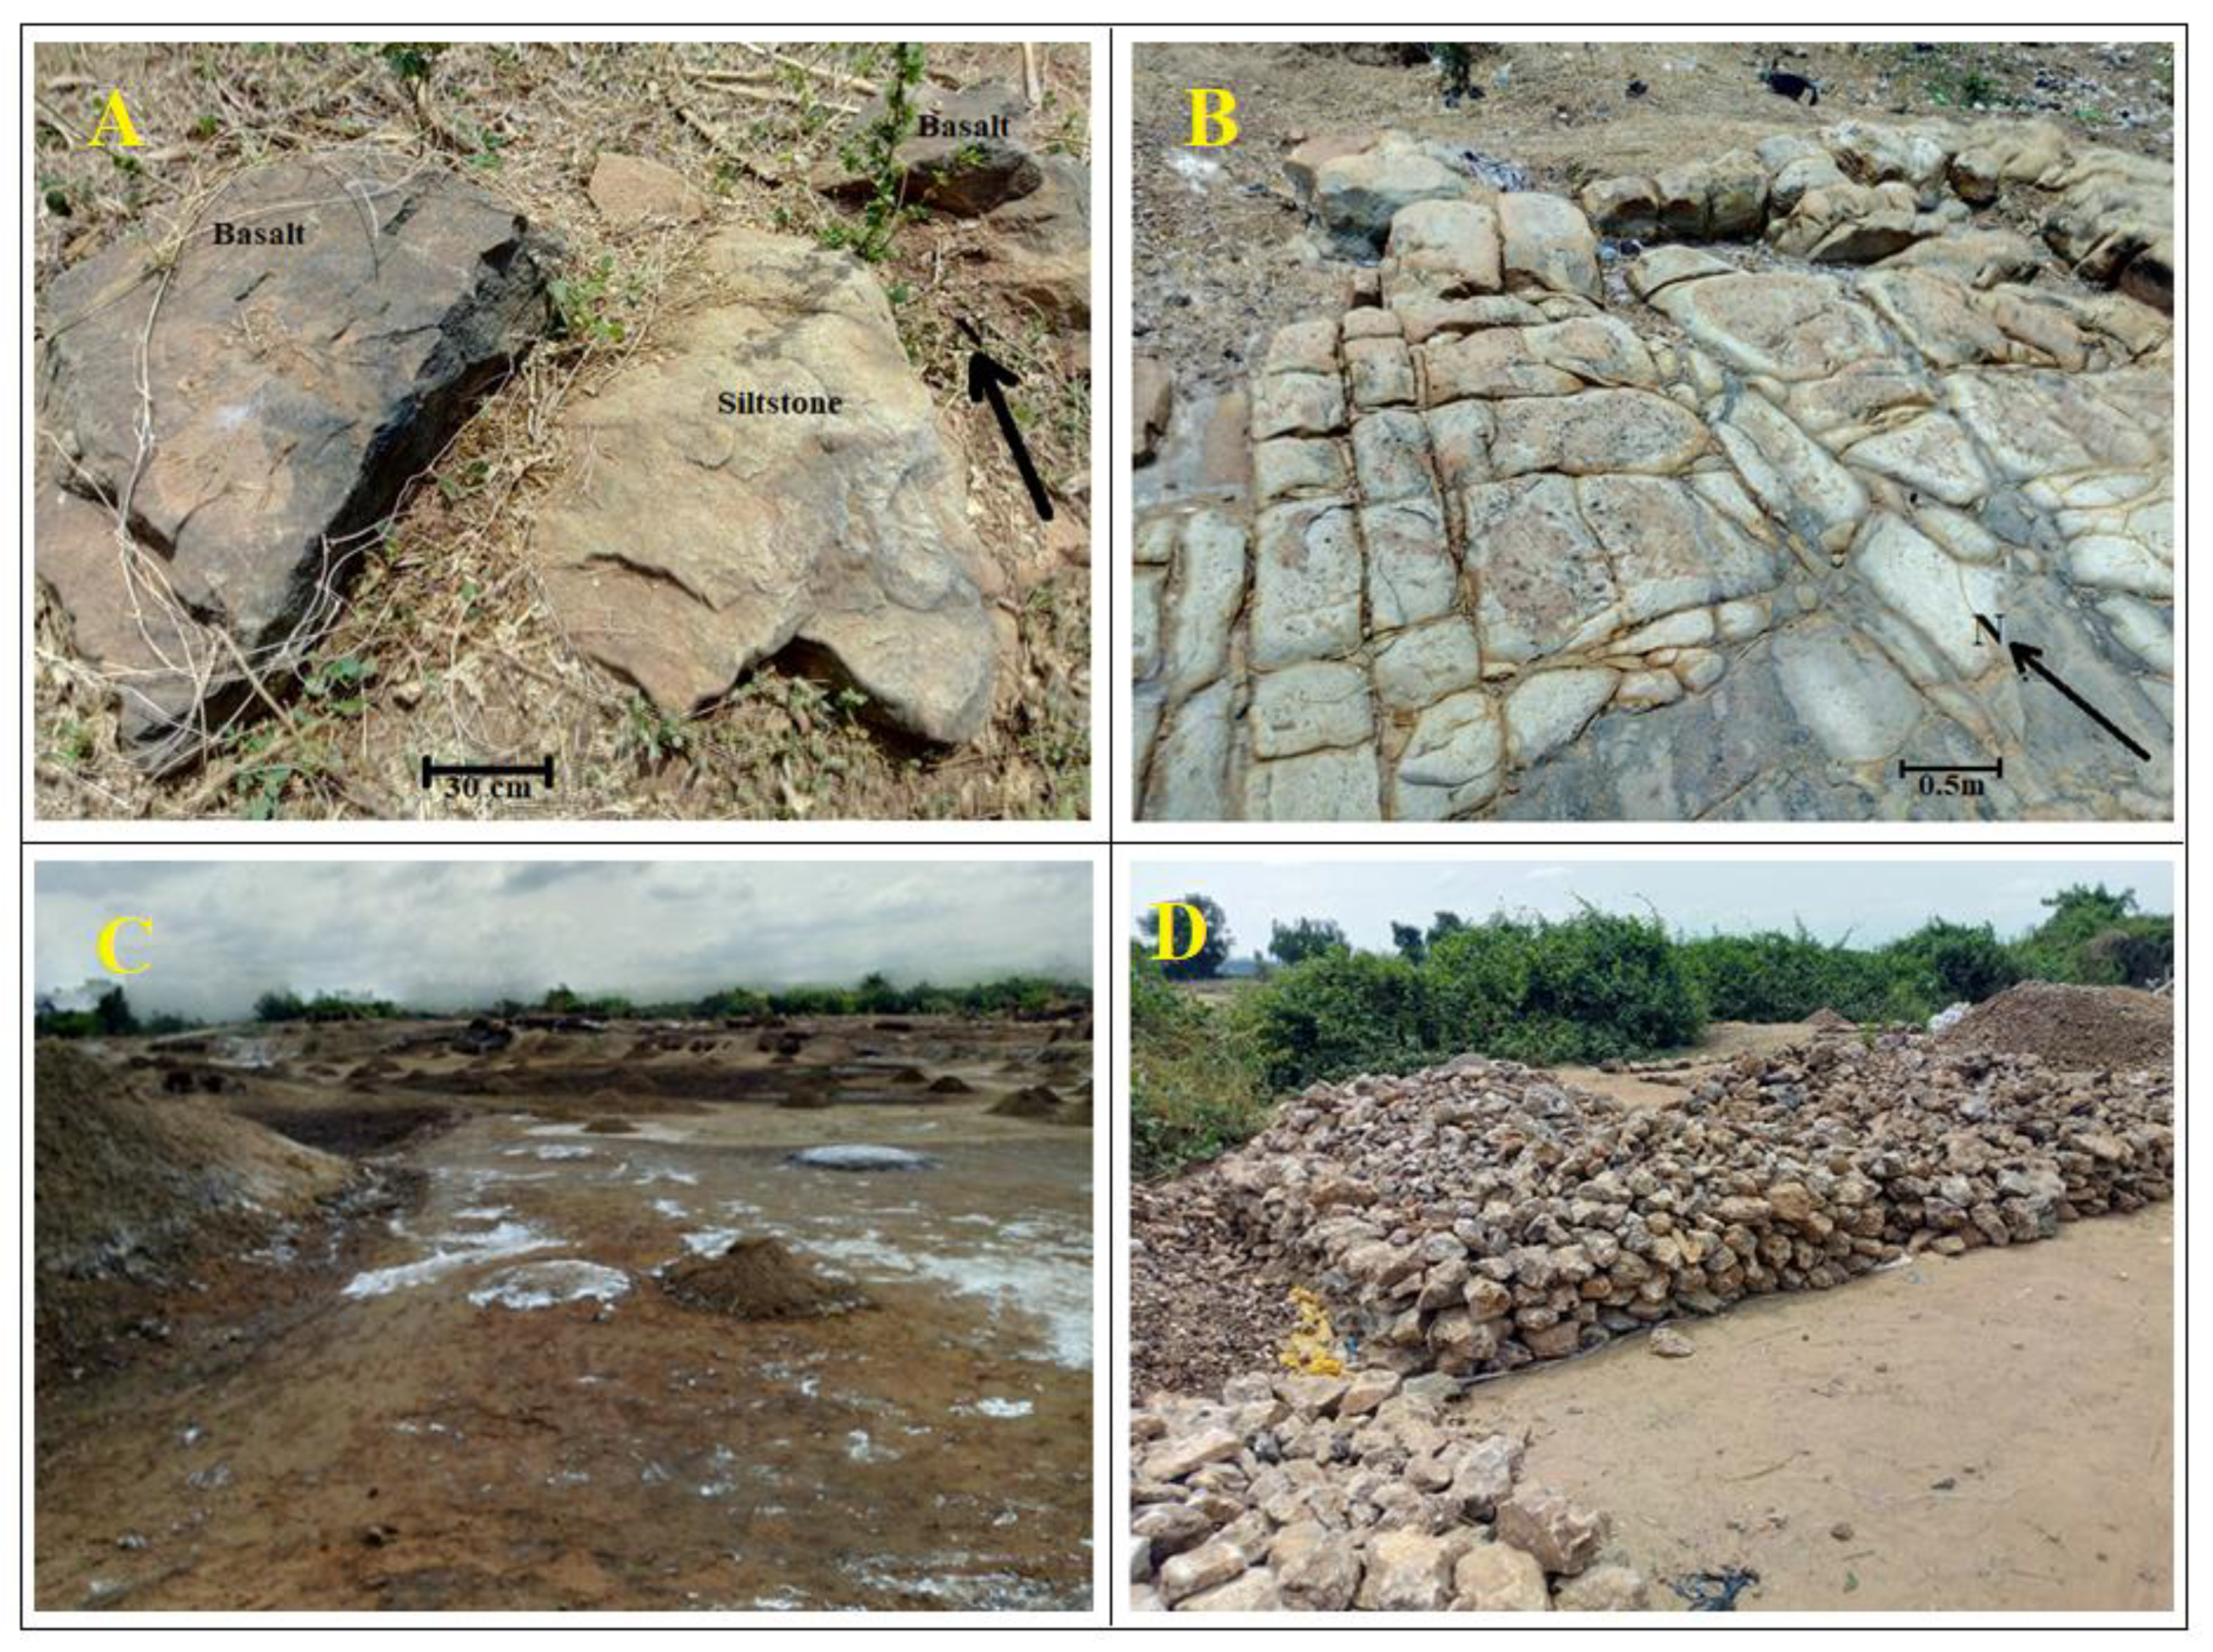
4.4. Field Observations
5. Discussion
5.1. Tectonism and Magmatism
5.2. Depth Delineations
6. Conclusions
Author Contributions
Funding
Data Availability Statement
Acknowledgments
Conflicts of Interest
References
- Anudu, G.K.; Stephenson, R.A.; Macdonald, D.I.M. Using high-resolution aeromagnetic data to recognise and map intra-sedimentary volcanic rocks and geological structures across the Cretaceous middle Benue Trough, Nigeria. J. Afr. Earth Sci. 2014, 99, 625–636. [Google Scholar] [CrossRef]
- Ekwok, S.E.; Akpan, A.E.; Achadu, O.-I.M.; Eze, O.E. Structural and lithological interpretation of aero-geophysical data in parts of the Lower Benue Trough and Obudu Plateau, Southeast Nigeria. Adv. Space Res. 2021, 68, 2841–2854. [Google Scholar] [CrossRef]
- Ejiga, G.E.; Yusoff, I.; Ismail, N.E.H.; Usman, U.A. Utilizing the Magnetic Source Edge Detection (MSED) method in mapping geologic features within a sedimentary basin. In National Geoscience Conference (NGC2019), Sabah, Malaysia. War. Geol. 2019, 45, 358–360. [Google Scholar]
- Cordell, L.; Grauch, V.J.S. Mapping basement magnetization zones from aeromagnetic data in the San Juan basin, New Mexico. In The Utility of Regional Gravity and Magnetic Anomaly Maps; Hinzc, W.J., Ed.; Society of Exploration Geophysicists: Tulsa, OK, USA, 1985; pp. 181–197. [Google Scholar]
- Miller, H.G.; Singh, V. Potential field tilt—A new concept for location of potential field sources. J. Appl. Geophys. 1994, 32, 213–217. [Google Scholar] [CrossRef]
- Roest, W.R.; Verhoef, J.; Pilkington, M. Magnetic interpretation using the 3-D analytic signal. Geophysics 1992, 57, 116–125. [Google Scholar] [CrossRef]
- Verduzco, B.; Fairhead, J.D.; Green, C.M.; MacKenzie, C. New insights into magnetic derivatives for structural mapping. Lead. Edge 2004, 23, 116–119. [Google Scholar] [CrossRef]
- Wijns, C.; Perez, C.; Kowalczyk, P. Theta map: Edge detection in magnetic data. Geophysics 2005, 70, L39–L43. [Google Scholar] [CrossRef]
- Pham, L.T.; Van Vu, T.; Le Thi, S.; Trinh, P.T. Enhancement of potential field source boundaries using an improved logistic filter. Pure Appl. Geophys. 2020, 177, 5237–5249. [Google Scholar] [CrossRef]
- Pham, L.T.; Eldosouky, A.M.; Oksum, E.; Saada, S.A. A new high resolution filter for source edge detection of potential field data. Geocarto Int. 2020, 1–18. [Google Scholar] [CrossRef]
- Nelson, J.B. Calculation of the magnetic gradient tensor from total field gradient measurements and its application to geophysical interpretation. Geophysics 1988, 53, 957–966. [Google Scholar] [CrossRef]
- Christensen, A.N.; Dransfield, M.H. Airborne vector magnetometry over banded iron-formations. In SEG Technical Program Expanded Abstracts 2002; Society of Exploration Geophysicists: Houston, TX, USA, 2002; pp. 13–16. [Google Scholar]
- Zhang, J.; Zeng, Z.; Zhao, X.; Li, J.; Zhou, Y.; Gong, M. Deep Mineral Exploration of the Jinchuan Cu-Ni Sulfide Deposit Based on Aeromagnetic, Gravity, and CSAMT Methods. Minerals 2020, 10, 168. [Google Scholar] [CrossRef] [Green Version]
- Shebl, A.; Abdellatif, M.; Elkhateeb, S.O.; Csámer, Á. Multisource Data Analysis for Gold Potentiality Mapping of Atalla Area and Its Environs, Central Eastern Desert, Egypt. Minerals 2021, 11, 641. [Google Scholar] [CrossRef]
- Oruç, B. Edge detection and depth estimation using a tilt angle map from gravity gradient data of the Kozaklı-Central Anatolia region, Turkey. Pure Appl. Geophys. 2011, 168, 1769–1780. [Google Scholar] [CrossRef]
- Arisoy, M.; Dikmen, Ü. Edge detection of magnetic sources using enhanced total horizontal derivative of the Tilt angle. Bull. Earth Sci. Appl. Res. Cent. Hacet. Univ. 2013, 34, 73–82. [Google Scholar]
- Ibraheem, I.M.; Haggag, M.; Tezkan, B. Edge Detectors as Structural Imaging Tools Using Aeromagnetic Data: A Case Study of Sohag Area, Egypt. Geosciences 2019, 9, 211. [Google Scholar] [CrossRef] [Green Version]
- Reeves, C. Aeromagnetic Surveys; Principles, Practice & Interpretation 2005; Geosoft: Singapore, 2005; Available online: www.geosoft.Com (accessed on 10 December 2019).
- Kumar, R.; Bansal, A.R.; Ghods, A. Estimation of Depth to Bottom of Magnetic Sources Using Spectral Methods: Application on Iran’s Aeromagnetic Data. J. Geophys. Res. Solid Earth 2020, 125, e2019JB018119. [Google Scholar] [CrossRef]
- Spector, A.; Grant, F.S. Statistical models for interpreting aeromagnetic data. Geophysics 1970, 35, 293–302. [Google Scholar] [CrossRef]
- Abdullahi, M.; Kumar, R.; Singh, U.K. Magnetic basement depth from high-resolution aeromagnetic data of parts of lower and middle Benue Trough (Nigeria) using scaling spectral method. J. Afr. Earth Sci. 2019, 150, 337–345. [Google Scholar] [CrossRef]
- Ekwok, S.E.; Akpan, A.E.; Ebong, E.D.; Eze, O.E. Assessment of depth to magnetic sources using high resolution aeromagnetic data of some parts of the Lower Benue Trough and adjoining areas, Southeast Nigeria. Adv. Space Res. 2021, 67, 2104–2119. [Google Scholar] [CrossRef]
- Kumar, R.; Bansal, A.R.; Anand, S.P.; Rao, V.K.; Singh, U.K. Mapping of magnetic basement in Central India from aeromagnetic data for scaling geology. Geophys. Prospect. 2018, 66, 226–239. [Google Scholar] [CrossRef] [Green Version]
- Obaje, N.G. Geology and Mineral Resources of Nigeria. In Geology and Mineral Resources of Nigeria; Springer: Heidelberg, Germany, 2009; pp. 1–221. [Google Scholar]
- Fairhead, J.D.; Binks, R.M. Differential opening of the Central and South Atlantic Oceans and the opening of the West African rift system. Tectonophysics 1991, 187, 191–203. [Google Scholar] [CrossRef]
- Benkhelil, J. The origin and evolution of the Cretaceous Benue Trough (Nigeria). J. Afr. Earth Sci. (Middle East) 1989, 8, 251–282. [Google Scholar] [CrossRef]
- Burke, K.C.; Whiteman, A.J. Uplift rifting and the breakup of Africa. In Implications of Continental Drift to the Earth Sciences; Tarling, D.H., Runcon, S.K., Eds.; Academic Press: London, UK, 1973; pp. 735–755. [Google Scholar]
- Burke, K.; Dessauvagie, T.; Whiteman, A. Geological history of the Benue valley and adjacent areas. Afr. Geol. 1972, 1, 187–206. [Google Scholar]
- Wright, J.B. Origins of the Benue Trough; A Critical Review. In Geology of Nigeria; Kogbe, C.A., Ed.; Elizabethan Press: Lagos, Nigeria, 1976; pp. 309–317. [Google Scholar]
- Grant, N.K. South Atlantic, Benue Trough, and Gulf of Guinea Cretaceous Triple Junction. Geol. Soc. Am. Bull. 1971, 82, 2295–2298. [Google Scholar] [CrossRef]
- Cratchley, C.R.; Louis, P.; Ajakaiye, D.E. Geophysical and geological evidence for the Benue-Chad Basin Cretaceous rift valley system and its tectonic implications. J. Afr. Earth Sci. 1984, 2, 141–150. [Google Scholar] [CrossRef]
- Schull, T.J. Rift basins of interior Sudan: Petroleum exploration and discovery. AAPG Bull. 1988, 72, 1128–1142. [Google Scholar]
- Nigeria Geological Survey Agency (NGSA). Geologic Map of Nigeria; Authority of Federal Republic of Nigeria: Abuja, Nigeria, 2011.
- Offodile, M.E. The Geology of the Middle Benue, Nigeria; Paleontological Institute, University Uppsala: Uppsala, Sweden, 1976; Volume 4, pp. 1–166. [Google Scholar]
- Ofoegbu, C.O. A review of the geology of the Benue Trough, Nigeria. J. Afr. Earth Sci. (1983) 1985, 3, 283–291. [Google Scholar] [CrossRef]
- Seequent, L. Putting Nigeria on the Map. 2010. Available online: https://www.seequent.com/putting-nigeria-on-the-map/ (accessed on 5 February 2021).
- Paine, J.W. A comparison of methods for approximating the vertical gradient of one-dimensional magnetic field data. Geophysics 1986, 51, 1725–1735. [Google Scholar] [CrossRef]
- Oruç, B.; Keskinsezer, A. Structural setting of the northeastern Biga Peninsula (Turkey) from tilt derivatives of gravity gradient tensors and magnitude of horizontal gravity components. Pure Appl. Geophys. 2008, 165, 1913–1927. [Google Scholar] [CrossRef]
- Phillips, J.D. Processing and Interpretation of Aeromagnetic Data for the Santa Cruz Basin-Patagonia Mountains Area, South-Central Arizona; US Department of the Interior, US Geological Survey: Washington, DC, USA, 2002. [Google Scholar]
- MacLeod, I.N.; Jones, K.; Dai, T.F. 3-D analytic signal in the interpretation of total magnetic field data at low magnetic latitudes. Explor. Geophys. 1993, 24, 679–688. [Google Scholar] [CrossRef]
- Nabighian, M.N. The analytic signal of two-dimensional magnetic bodies with polygonal cross-section: Its properties and use for automated anomaly interpretation. Geophysics 1972, 37, 507–517. [Google Scholar] [CrossRef]
- Li, X. Understanding 3D analytic signal amplitude. Geophysics 2006, 71, L13–L16. [Google Scholar] [CrossRef]
- Hahn, A.; Kind, E.G.; Mishra, D.C. Depth estimation of magnetic sources by means of Fourier amplitude spectra. Geophys. Prospect. 1976, 24, 287–306. [Google Scholar] [CrossRef]
- Negi, J.G.; Agrawal, P.K.; Rao, K.N.N. Three-dimensional model of the Koyna area of Maharashtra State (India) based on the spectral analysis of aeromagnetic data. Geophysic 1983, 48, 964–974. [Google Scholar] [CrossRef]
- Ogunmola, J.K.; Ayolabi, E.A.; Olobaniyi, S.B. Structural-depth analysis of the Yola Arm of the Upper Benue Trough of Nigeria using high resolution aeromagnetic data. J. Afr. Earth Sci. 2016, 124, 32–43. [Google Scholar] [CrossRef]
- Blakely, R.J. Potential Theory in Gravity and Magnetic Applications; Cambridge University Press: Cambridge, UK, 1996. [Google Scholar]
- Nwogbo, P.O. Spectral prediction of magnetic source depths from simple numerical models. Comput. Geosci. 1998, 24, 847–852. [Google Scholar] [CrossRef]
- Ajayi, C.O.; Ajakaiye, D.E. The origin and peculiarities of the Nigerian Benue Trough: Another look from recent gravity data obtained from the Middle Benue. Tectonophysics 1981, 80, 285–303. [Google Scholar] [CrossRef]
- Leu, L.-K. Use of reduction-to-the-equator process for magnetic data interpretation. In Geophysics; Soc Exploration Geophysicists: Tulsa, OK, USA, 1982. [Google Scholar]
- Ajayi, C.O.; Ajakaiye, D.E. Structures deduced from gravity data in the Middle Benue, Nigeria. J. Afr. Earth Sci. (1983) 1986, 5, 359–369. [Google Scholar] [CrossRef]
- Lar, U.A.; Sallau, A.K. Trace element geochemistry of the Keana brines field, middle Benue trough, Nigeria. Environ. Geochem. Health 2005, 27, 331–339. [Google Scholar] [CrossRef] [PubMed]
- Kearey, P.; Brooks, M.; Hill, I. An Introduction to Geophysical Exploration, 3rd ed.; Blackwell Scientific Publication: Oxford, UK, 2002. [Google Scholar]
- Guiraud, R.; Maurin, J.-C. Early Cretaceous rifts of Western and Central Africa: An overview. Tectonophysics 1992, 213, 153–168. [Google Scholar] [CrossRef]
- Ogunmola, J.K.; Gajere, E.N.; Ayolabi, E.A.; Olobaniyi, S.B.; Jeb, D.N.; Agene, I.J. Structural study of Wamba and Environs, north-central Nigeria using aeromagnetic data and NigeriaSat-X image. J. Afr. Earth Sci. 2015, 111, 307–321. [Google Scholar] [CrossRef]
- Maurin, J.C.; Benkhelil, J.; Robineau, B. Fault rocks of the Kaltungo lineament, NE Nigeria, and their relationship with Benue Trough tectonics. J. Geol. Soc. 1986, 143, 587–599. [Google Scholar] [CrossRef]
- Wright, J.B. Fracture systems in Nigeria and initiation of fracture zones in the South Atlantic. Tectonophysics 1976, 34, 43–47. [Google Scholar] [CrossRef]
- de Castro, D.L.; Bezerra, F.H.R.; Sousa, M.O.L.; Fuck, R.A. Influence of Neoproterozoic tectonic fabric on the origin of the Potiguar Basin, northeastern Brazil and its links with West Africa based on gravity and magnetic data. J. Geodyn. 2012, 54, 29–42. [Google Scholar] [CrossRef]
- Ajakaiye, D.E.; Hall, D.H.; Ashiekaa, J.A.; Udensi, E.E. Magnetic anomalies in the Nigerian continental mass based on aeromagnetic surveys. Tectonophysics 1991, 192, 211–230. [Google Scholar] [CrossRef]
- Ford, S.O. The Economic Mineral Resources of the Benue through. Earth Evol. Sci. Springer Nat. 1981, 2, 154–163. [Google Scholar]
- Offodile, M.E. The geology and tectonics of Awe brine field. J. Afr. Earth Sci. (1983) 1984, 2, 191–202. [Google Scholar] [CrossRef]
- Uma, K.O. The brine fields of the Benue Trough, Nigeria: A comparative study of geomorphic, tectonic and hydrochemical properties. J. Afr. Earth Sci. 1998, 26, 261–275. [Google Scholar] [CrossRef]
- Ajakaiye, D.E. Geophysical investigations in the Benue Trough—A review. Earth Evol. Sci. 1981, 2, 126–136. [Google Scholar]
- Oyawoye, M.O. The Basement complex of Nigeria. In African Geology; Dessauvagie, T.F.J., Whiteman, A.J., Eds.; Ibadan University Press: Ibadan, Nigeria, 1972; pp. 67–99. [Google Scholar]


| Block | D1 (km) | D2 (km) | Block | D1 (km) | D2 (km) |
|---|---|---|---|---|---|
| 1 | 5.8 | 0.9 | 26 | 4.5 | 0.6 |
| 2 | 5.2 | 0.6 | 27 | 5.0 | 0.6 |
| 3 | 6.1 | 0.3 | 28 | 3.1 | 0.4 |
| 4 | 5.1 | 0.6 | 29 | 3.4 | 1.4 |
| 5 | 2.5 | 1.0 | 30 | 4.0 | 0.9 |
| 6 | 2.4 | 0.9 | 31 | 3.3 | 0.8 |
| 7 | 2.2 | 0.6 | 32 | 3.9 | 0.9 |
| 8 | 4.8 | 0.7 | 33 | 3.9 | 0.8 |
| 9 | 5.2 | 0.4 | 34 | 4.8 | 0.7 |
| 10 | 5.1 | 0.5 | 35 | 4.1 | 2.0 |
| 11 | 4.5 | 1.1 | 36 | 3.2 | 0.7 |
| 12 | 3.2 | 1.4 | 37 | 3.8 | 0.8 |
| 13 | 4.5 | 1.3 | 38 | 3.1 | 0.7 |
| 14 | 2.5 | 0.4 | 39 | 3.0 | 0.7 |
| 15 | 4.3 | 0.8 | 40 | 3.5 | 0.8 |
| 16 | 4.3 | 0.4 | 41 | 4.8 | 0.9 |
| 17 | 5.1 | 0.5 | 42 | 4.9 | 0.9 |
| 18 | 2.3 | 0.3 | 43 | 3.7 | 0.7 |
| 19 | 4.2 | 0.7 | 44 | 3.1 | 0.7 |
| 20 | 5.0 | 0.6 | 45 | 2.9 | 0.5 |
| 21 | 3.8 | 0.3 | 46 | 3.3 | 0.6 |
| 22 | 4.0 | 1.5 | 47 | 3.7 | 0.6 |
| 23 | 3.6 | 0.8 | 48 | 2.0 | 0.5 |
| 24 | 5.3 | 1.0 | 49 | 1.9 | 0.4 |
| 25 | 4.8 | 0.8 | - | - | - |
Publisher’s Note: MDPI stays neutral with regard to jurisdictional claims in published maps and institutional affiliations. |
© 2021 by the authors. Licensee MDPI, Basel, Switzerland. This article is an open access article distributed under the terms and conditions of the Creative Commons Attribution (CC BY) license (https://creativecommons.org/licenses/by/4.0/).
Share and Cite
Ejiga, E.G.; Ismail, N.E.H.; Yusoff, I. Implementing Digital Edge Enhancers on Improved High-Resolution Aeromagnetic Signals for Structural-Depth Analysis around the Middle Benue Trough, Nigeria. Minerals 2021, 11, 1247. https://doi.org/10.3390/min11111247
Ejiga EG, Ismail NEH, Yusoff I. Implementing Digital Edge Enhancers on Improved High-Resolution Aeromagnetic Signals for Structural-Depth Analysis around the Middle Benue Trough, Nigeria. Minerals. 2021; 11(11):1247. https://doi.org/10.3390/min11111247
Chicago/Turabian StyleEjiga, Eko Gerald, Noer El Hidayah Ismail, and Ismail Yusoff. 2021. "Implementing Digital Edge Enhancers on Improved High-Resolution Aeromagnetic Signals for Structural-Depth Analysis around the Middle Benue Trough, Nigeria" Minerals 11, no. 11: 1247. https://doi.org/10.3390/min11111247
APA StyleEjiga, E. G., Ismail, N. E. H., & Yusoff, I. (2021). Implementing Digital Edge Enhancers on Improved High-Resolution Aeromagnetic Signals for Structural-Depth Analysis around the Middle Benue Trough, Nigeria. Minerals, 11(11), 1247. https://doi.org/10.3390/min11111247