Article

Meso-Cenozoic Exhumation of the Linqing Sub-Basin, Bohai Bay Basin: Implications for Cratonic Destruction

1
Institute of Global Environmental Change, Xi’an Jiaotong University, Xi’an 712000, China
2
State Key Laboratory of Petroleum Resource and Prospecting, China University of Petroleum, Beijing 102249, China
*
Author to whom correspondence should be addressed.
Minerals 2021, 11(11), 1176; https://doi.org/10.3390/min11111176
Submission received: 16 September 2021 / Revised: 20 October 2021 / Accepted: 20 October 2021 / Published: 24 October 2021
(This article belongs to the Section Mineral Geochemistry and Geochronology)

Abstract

:
The relationship between the tectonic event of the Linqing Sub-basin and the destruction of the North China Craton (NCC) is an important factor to consider when studying geodynamic mechanisms in eastern China. In the current study, we present a low-temperature apatite thermochronological analysis of 14 samples to study the tectonic event of the Linqing Sub-basin. Our data showed that the apatite fission track (AFT) ages were in the range of 53.5–124.4 Ma, and the average track lengths were 8.00–11.24 μm. The grain ages showed that 10 samples had mixed ages and were characterized by discordant distribution. The minimum ages decomposed from AFT ages mainly ranged from 105.3 to 40.8 Ma. We identified a break-in-slope from the depth-minimum age profile, which was related to the Meso-Cenozoic tectonic event. The AFT age data could be decomposed into three age groups, namely, P3 (394.8–215.7 Ma), P2 (124.6–83.4 Ma), and P1 (70.7–40.8 Ma), indicating three significant tectonic events in the NCC. P3 is related to the uplift of the NCC at 445.0–315.0 Ma and deformation and magmatism at 320.0–200.0 Ma. P2 corresponds to the Mesozoic tectonic activities, such as the closure of the Mongol–Okhotsk Ocean, the turning of the Izanagi plate and mantle convection. P1 mainly corresponds to the Izanagi–Pacific ridge, the closure of the Tethys Ocean, and the rotation of the Philippine Sea plate in the Cenozoic. Our study provides evidence for the destruction of the NCC, and has significance for the understanding of the deep mechanism.

1. Introduction

The North China Craton (NCC) is one of the world’s oldest Archean cratons, with crustal remnants as old as 3800 Ma [1]. Evidence from geophysics [2,3,4] and geochemistry [5,6,7] suggests that the lithosphere of the eastern NCC was thinned by over 100 km during the Meso-Cenozoic. The Linqing Sub-basin of the Bohai Bay Basin (BBB), located in the center of lithosphere thinning in the eastern NCC (Figure 1), experienced mantle transformation, magmatic activity and basin evolution during multiple stages of tectonothermal events [8,9,10]. The low-temperature thermochronology method has been used to study the tectonothermal events of the BBB [11,12,13,14]. However, due to the deep burial of Cenozoic strata in the BBB, where burial depths are as great as 10,000 m [15], AFT samples in most areas have undergone partial annealing or even complete reset under the influence of temperature. Data that do not pass the χ2 test a statistical deconvolution of sample grain age distributions cannot be used to reconstruct the thermal history [16,17].
Several researchers have suggested that decomposition age and minimum age can be used to study tectonic events [18,19]. In this paper, we analyzed 14 low-temperature apatite datasets from four boreholes in the Linqing Sub-basin (including six data items from our previous research [20]). Empolying the BinomFit software [21,22], we used the decomposition of fission-track grain age and minimum age to assess the tectonic events of the Linqing Depression. This paper provides a geothermal basis that can be used to further our understanding of the tectonic evolution in the BBB. It also provides important thermal information regarding the destruction of the NCC.
Figure 1. (a) Location of the North China Craton and the Bohai Bay Basin (BBB), yellow color. (b) Geological map of the Bohai Bay Basin (after Xu et al., 2020 [20]). Uplifts: Cangxian Uplift (CX.U), Chengning Uplift (CN.U), Neihuang Uplift (NH.U), Xingheng Uplift (XH.U); Depressions: Bozhong Depression (BZ.D), Huanghua Depression (HH.D), Jiyang Depression (JY.D), Jizhong Depression (JZ.D), Liaohe Depression (LH.D), Linqing Depression (LQ.D); Faults: ① northern part of the Tanlu Deep Fracture Zone; ② Lanliao Deep Fracture Zone; ③ Shulu–Handan Deep Fracture Zone.
Minerals 11 01176 g001

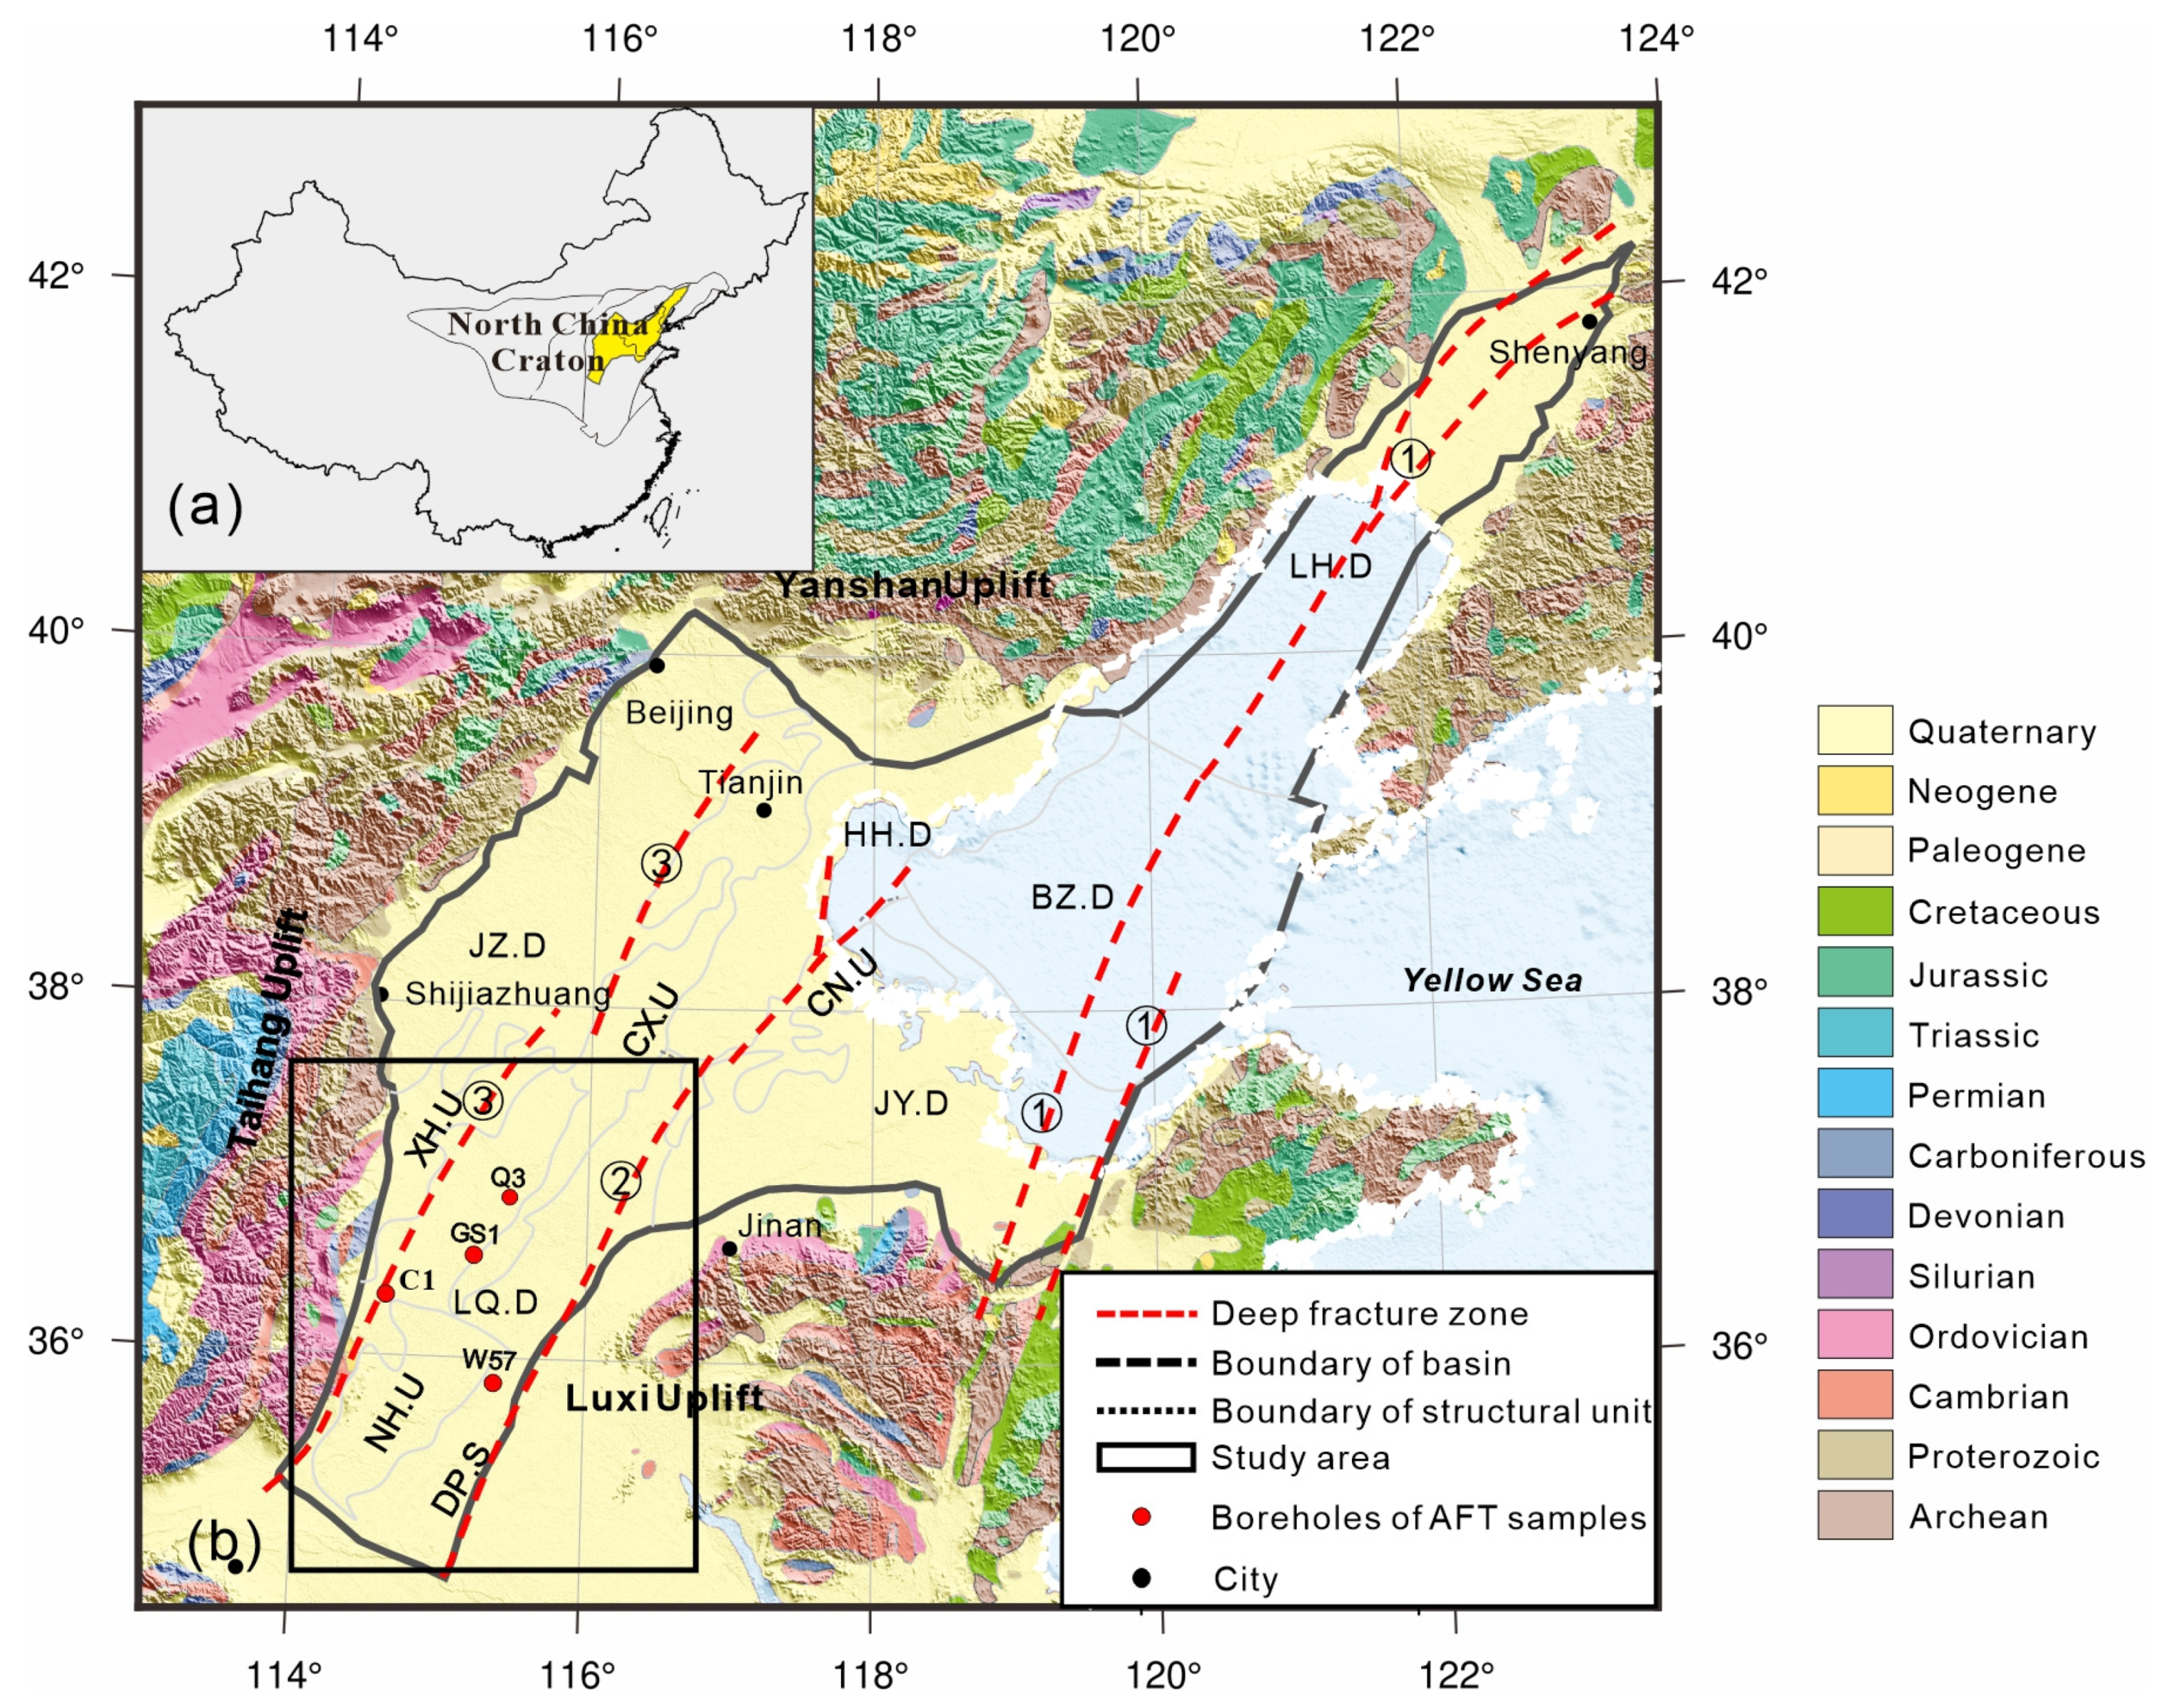
2. Geological Setting

The NCC was formed in the collision between the west and east plates along the central belt at about 1.85 Ga, followed by a long-term stable cratonic stage with a lithosphere thickness of up to 200 km [23,24,25,26,27]. Lithosphere loss occurred in the eastern part of the NCC during the late Mesozoic, and the loss can exceed 120 km [7], manifesting as mantle transformation, crustal activation, a large amount of magma events, and the formation of the Mesozoic basins [28].
BBB is a Meso-Cenozoic basin in the eastern block of the NCC (Figure 1). In the BBB, NNE- and NE-trending deep fault zones, namely, the Tanlu Deep Fracture Zone, Lanliao Deep Fracture Zone, and Shulu–Handan Deep Fracture Zone, show right-lateral movement during the Cenozoic, from east to west [15] (Figure 1). The internal vertical structure of the BBB is complex. According to the relationship between the sedimentary layers and the characteristics of structural deformation field, the phanerozoic can be divided into five structural layers: the Indosinian structural layer, early Yanshanian structural layer, middle Yanshanian structural layer, late Yanshanian structural layer and Cenozoic structural layer [29]. The basement of the BBB is composed of sedimentary and crystalline metamorphic rocks. The Paleogene sequence is composed of lacustrine and alluvial rocks, and the sedimentary depth can reach 2000–7000 m. The thickness of the Neogene–Quaternary sequence is 1000–3000 m, and it mainly consists of fluvial and alluvial fan deposits [15].
The Linqing Depression, part of the BBB, is a complex Mesozoic-Cenozoic fault subsidence area. It belongs to the second-class negative tectonic unit of the BBB in tectonic division, and is located at the southwest, bordered by the Huanghua Depression and Cangxian Uplift in the north, the Neihuang Uplift in the south, the Taihang Mountain Uplift in the west, and the Luxi Uplift in the east (Figure 1).
The Linqing Sub-basin was integrated with the North China plate in the Paleozoic, and then folded and faulted due to the westward subduction of the Pacific plate in the late Permian [30]. In the late Early Triassic, the Linqing Sub-basin uplifted on a small scale under the influence of the Indosinian movement, after which the basin continued to deposit. During the late Cretaceous, the NCC was destroyed, and the Linqing Sub-basin was uplifted and denuded under the strong compression and strike slip caused by the subduction of the Pacific plate [23,31]. Since the Paleogene, the Linqing Sub-basin has been in the stage of rift basin development [32]. The early stage was a rifting stage with new faults, depressions, and uplifts, and the late stage was controlled by the regional depression stage. Different types of rocks have been deposited in Linqing Sub-basin since the Paleozoic with thicknesses of up to 7000 m (Figure 2) [31,33,34]. The basement of the depression is Archaean, and the unmetamorphic Paleozoic and Cenozoic cap rocks are above it. The lithology of the Taishan Group in the Archean is mainly monzogranite. The Paleozoic consists of marine carbonate and clastic rocks in the Cambrian–Middle Ordovician and marine and continental clastic rocks in the Carboniferous–Permian. The Triassic is absent in the Mesozoic, which is composed of the Jurassic and Cretaceous, and is unconformably above the underlying rocks. The Cenozoic is mainly composed of lacustrine clastic rocks, including the Palaeocene Kongdian Formation (Ek), Eocene Shahejie Formation (Es), Oligocene Dongying Formation (Ed), Miocene Guantao Formation (Ng), Pliocene Minghuazhen Formation (Nm), and Quaternary.

3. Methods and Samples

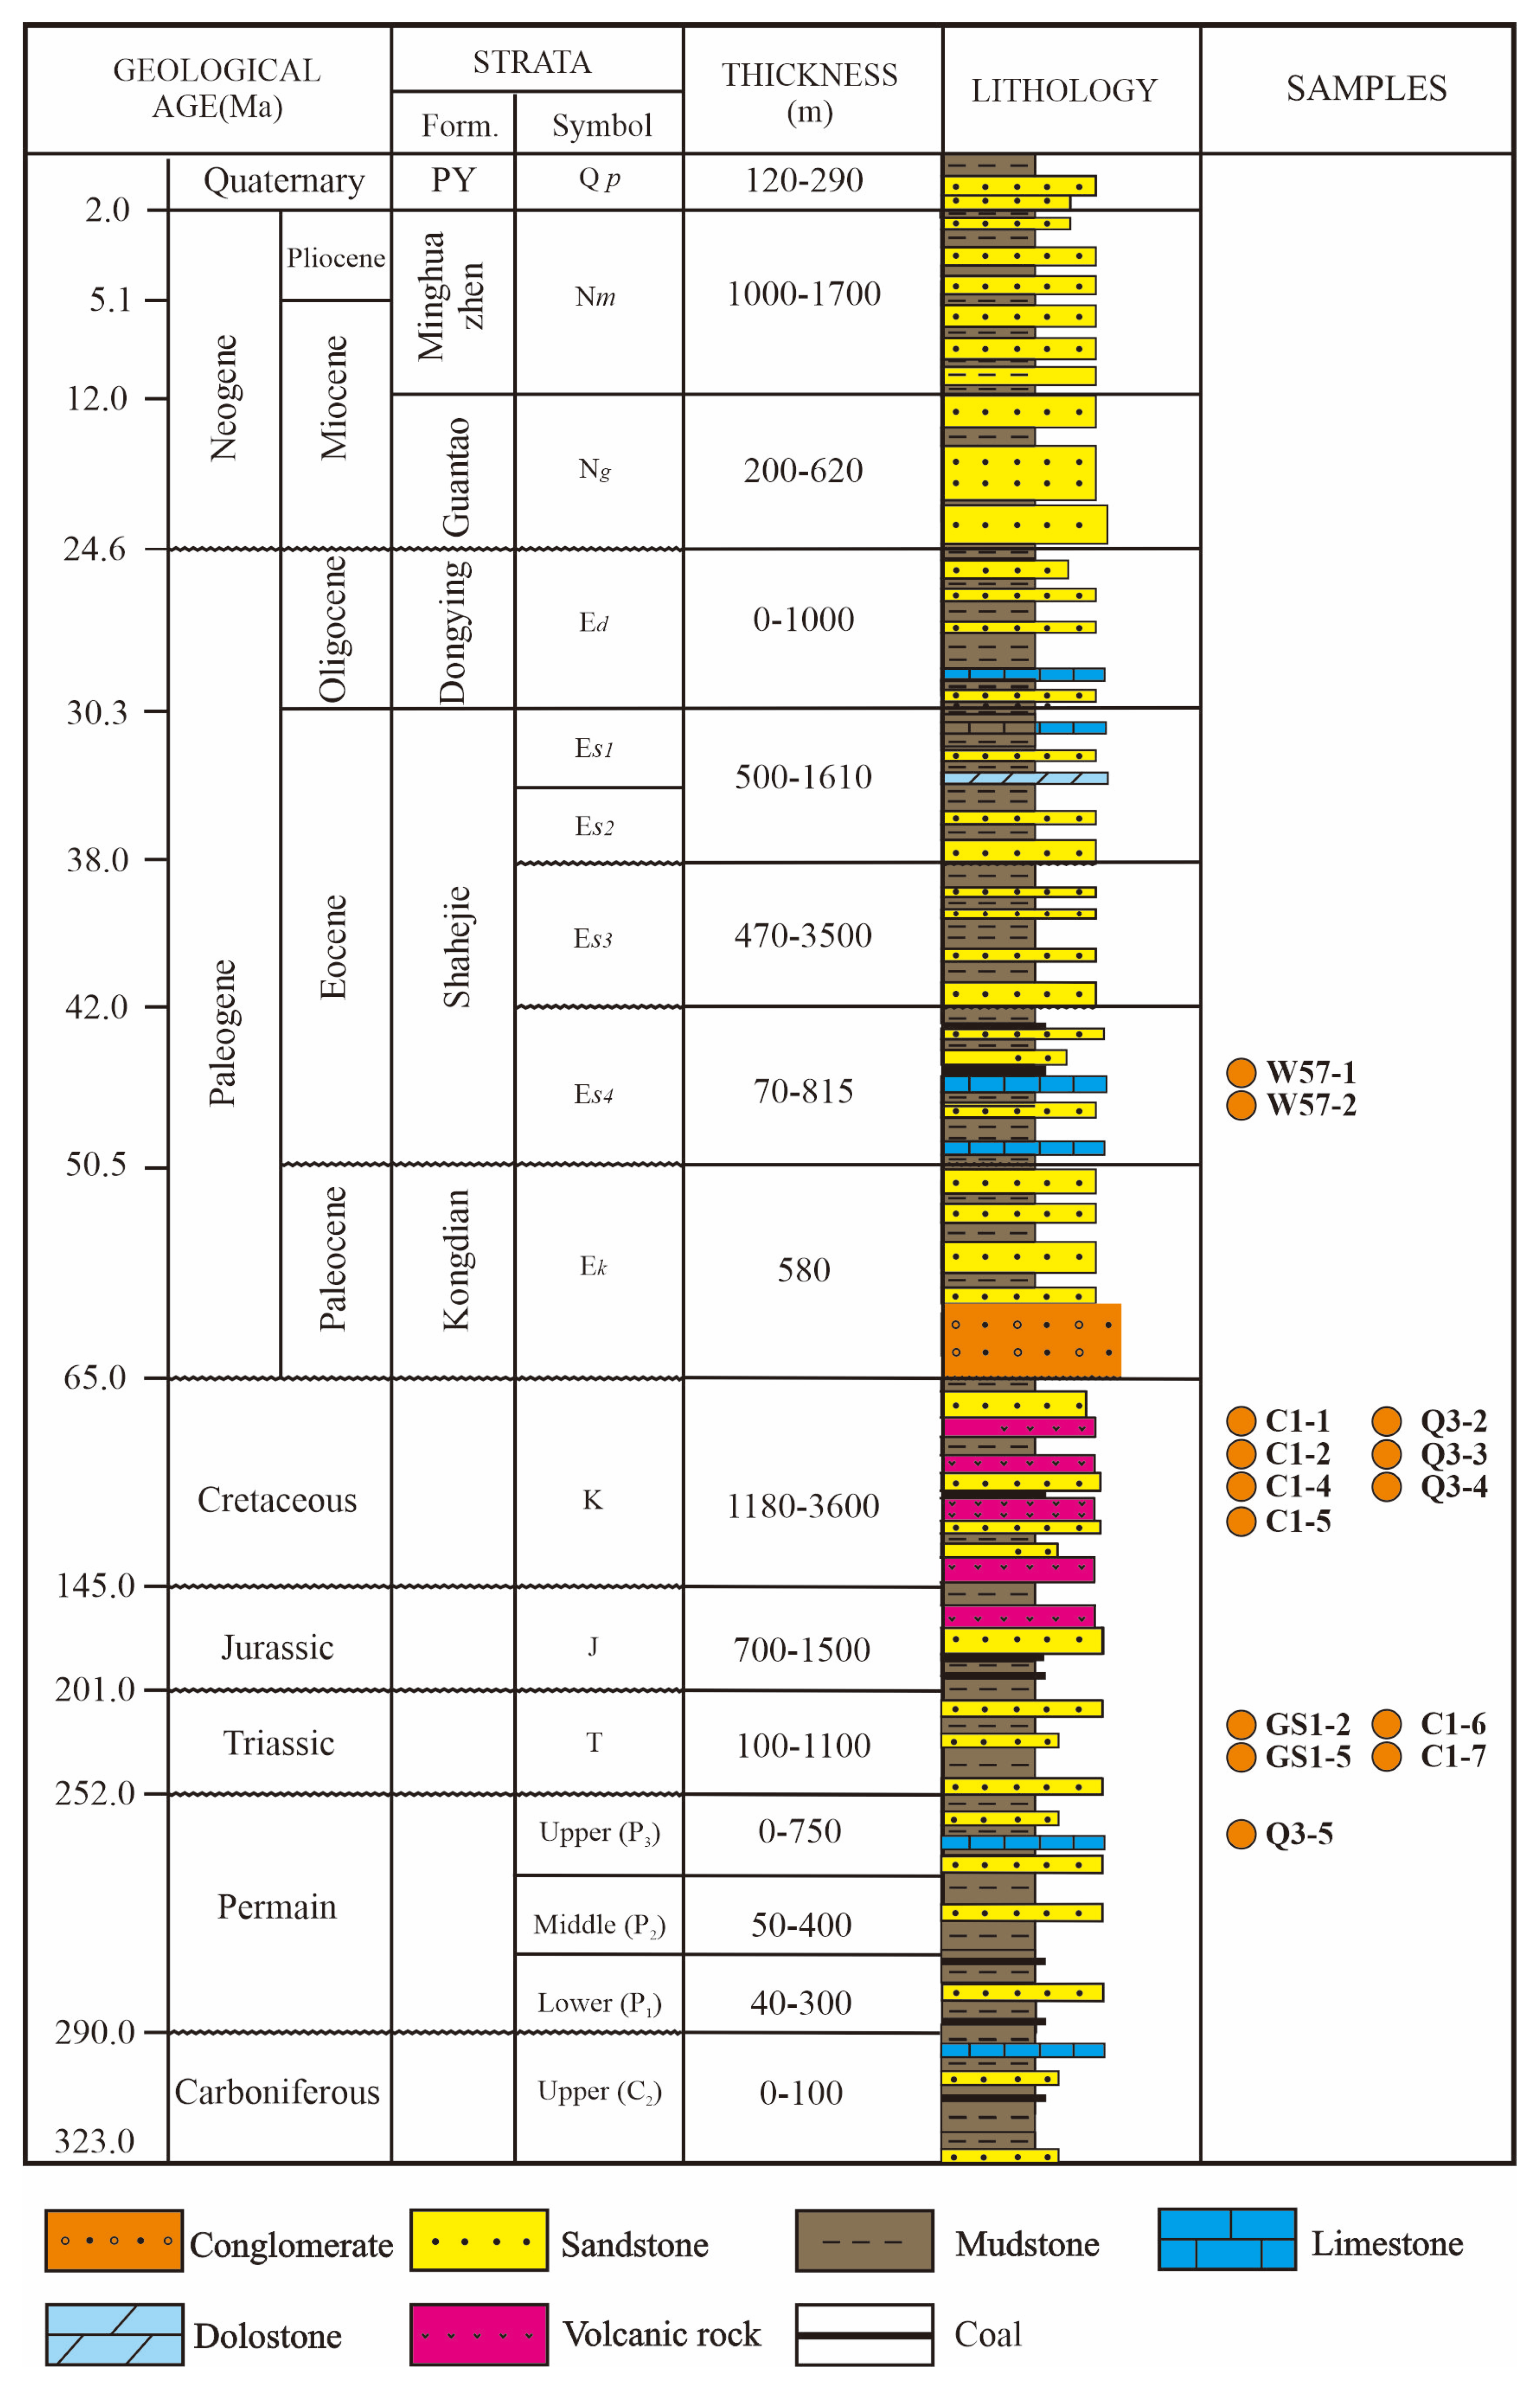
3.1. Measurement of AFT and Samples

The external detector method (EDM) was used in this study for apatite fission track (AFT) dating. Fission-track age can be calculated from the ratio of spontaneous (ρs) to induced (ρi) track densities according to the standard fission-track age equation [35]. The spontaneous tracks can be revealed by etching the polished mount in dilute HNO3 at room temperature for 20 s after mineral separation from the host rock. The induced tracks on a mica external detector are revealed by etching after irradiation. The measurements of AFT were prepared and counted in the low-temperature thermochronology laboratories of the China University of Petroleum in Beijing. Neutron irradiations were carried out in the radiation center of Oregon State University, USA. The details of the experimental methods are described in the Supplementary Materials (Supplementary Materials, Text S1).
We collected 14 core samples from four boreholes for the AFT study. The measurement results are in Table 1. The formations involved the Permian, Triassic, Cretaceous, and Eocene formations. Boreholes GS1, C1, and Q3 are in the west of the Linqing sub-basin; W57 is in the southeast in the Dongpu Sag (Figure 1).

3.2. Estimation of Paleo-Temperature

Vitrinite reflectance data (Ro) can be used to estimate the maximum temperature (Tmax) [36]. The relationship between Tmax and Ro can be expressed as follows:
Tmax = ( ln ( Ro ) + 1.68 ) / 0.0124
In the study area, we collected 38 Ro data from PetroChina Huabei Oilfield Company (Supplementary Material, Table S1). Tmax was calculated from the measured Ro data (Ro data of C1 and W57 are references from the adjacent wells Q4 and W146, respectively) (Figure 3).

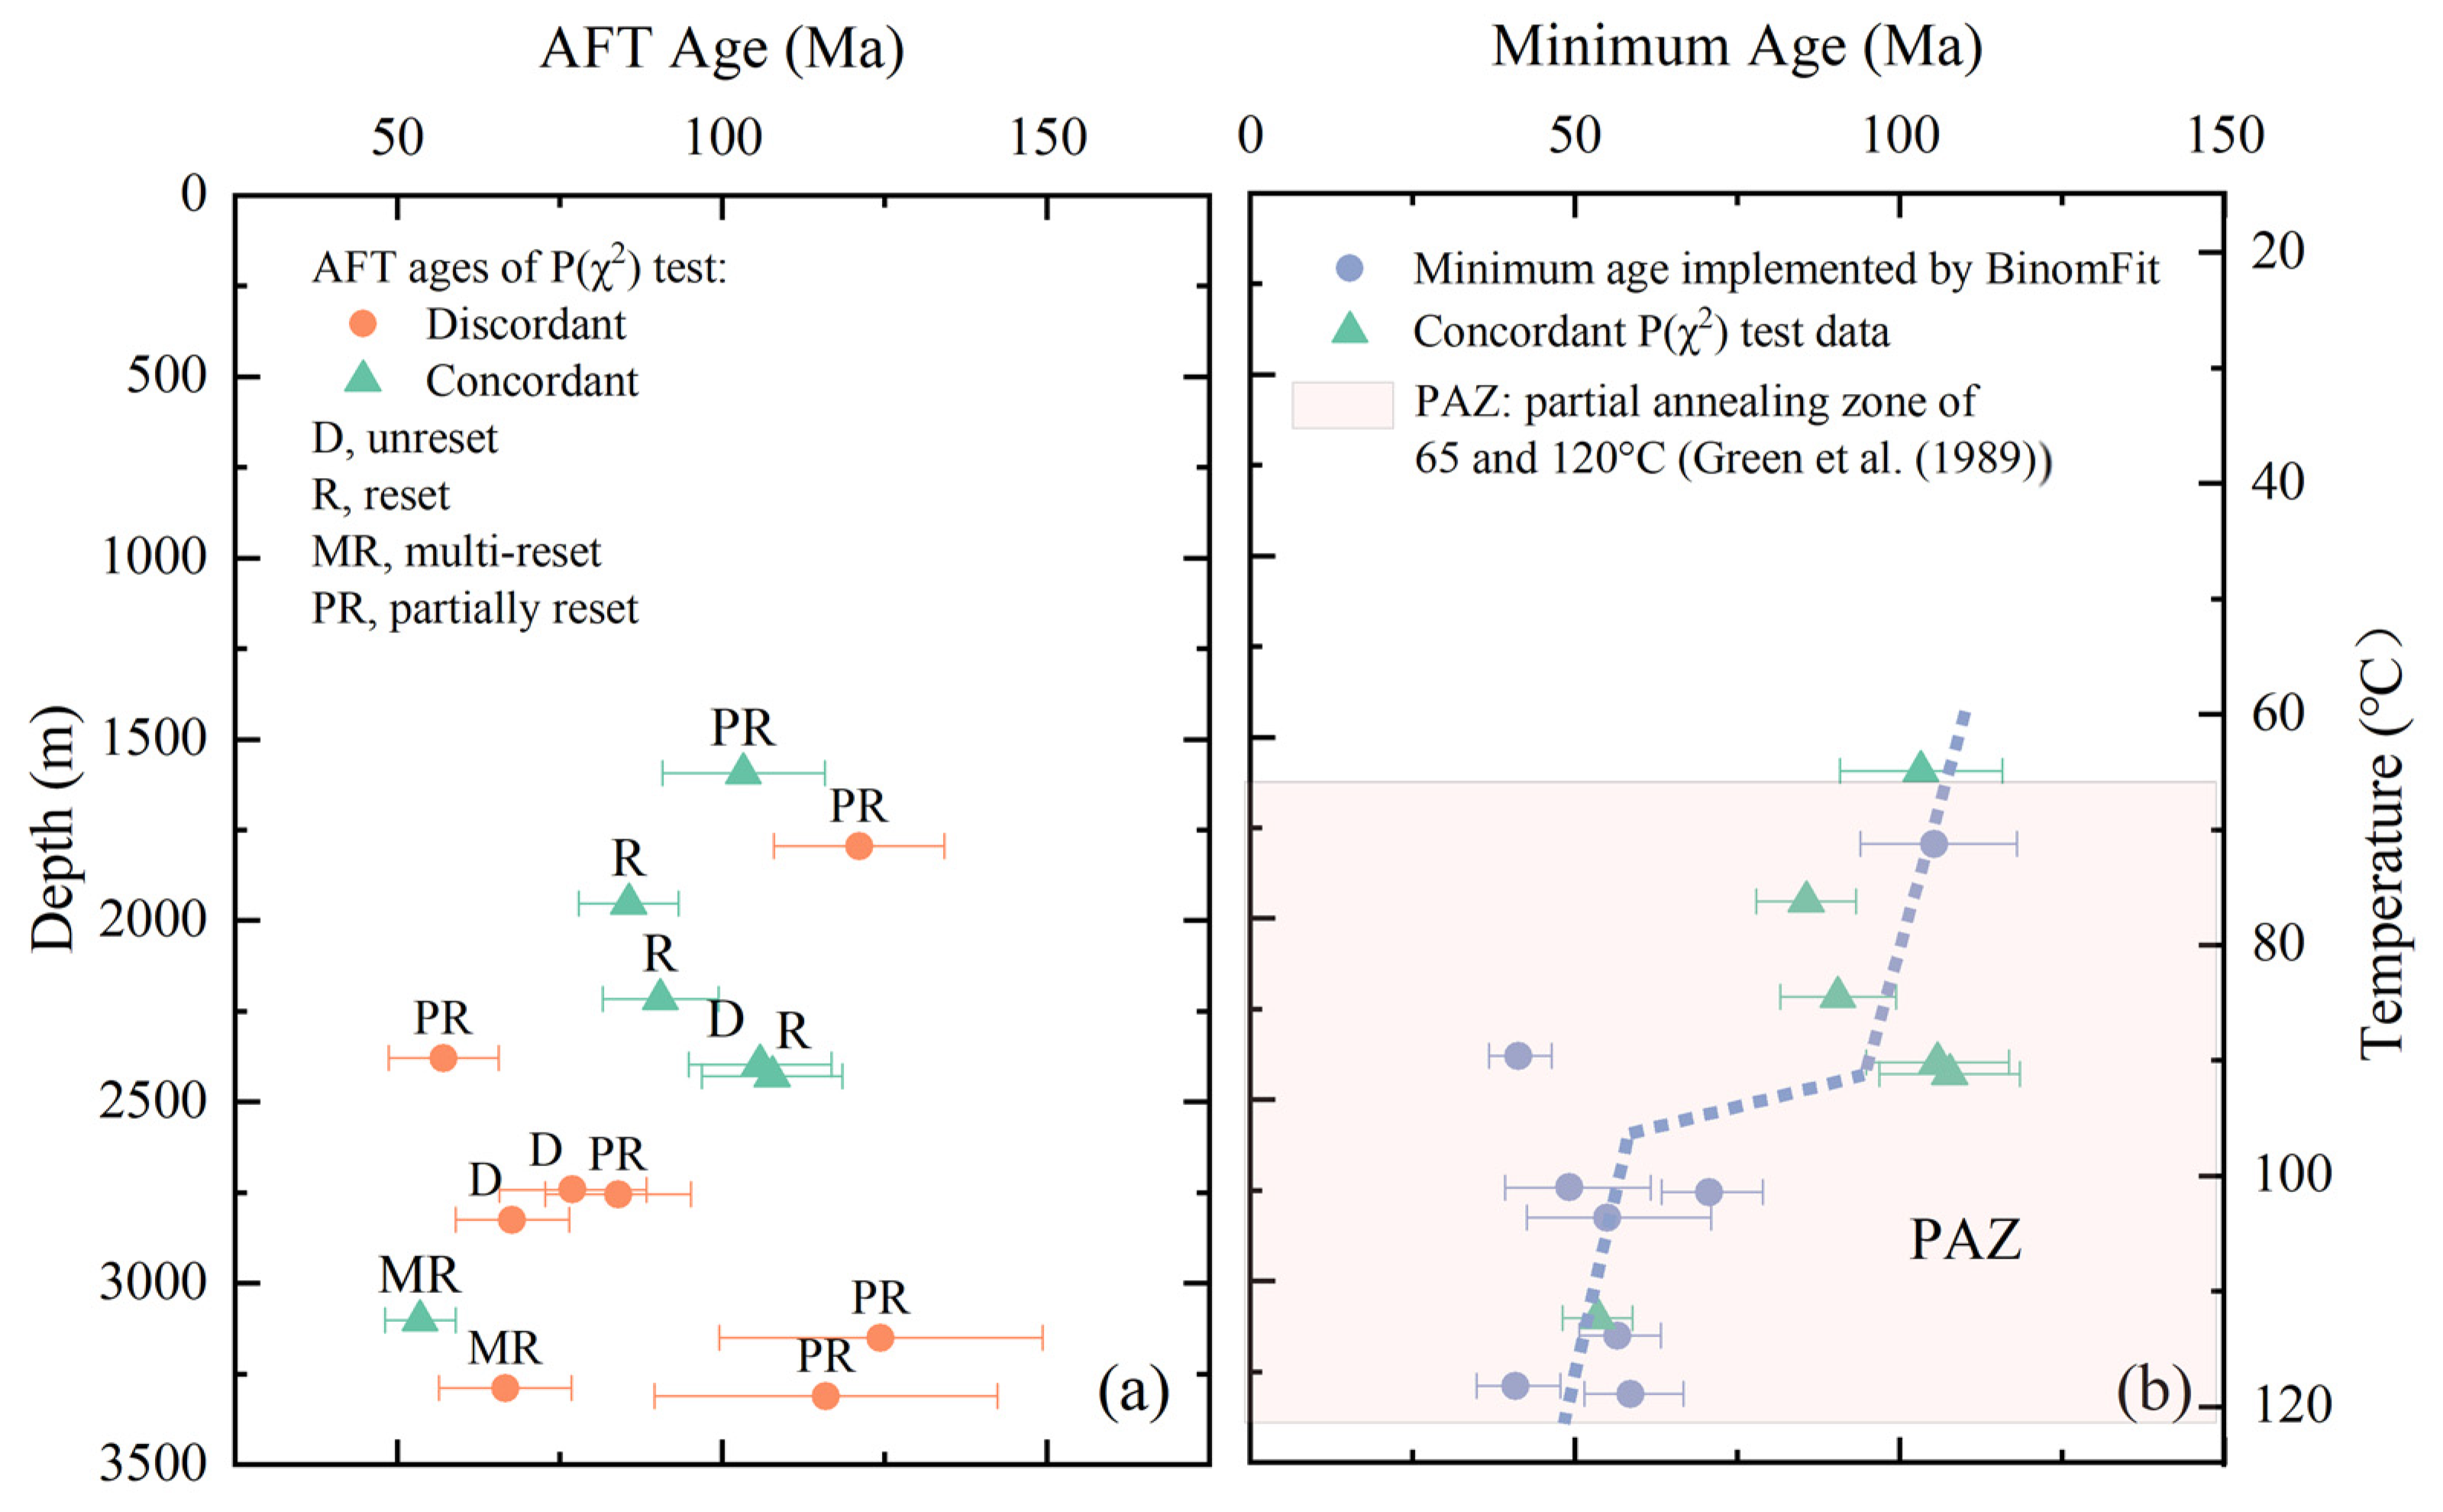
3.3. Method of AFT Grain-Age Distribution Analysis

AFT analytical results from sedimentary rock samples can exhibit significant variance, because individual apatite grains possess nonuniform sources and cooling histories [37]. The grain age distribution is “over-discrete”; that is, the variation in age is larger than the expected analysis error. The χ2 test, a statistical deconvolution of sample grain age distributions, is generally used to interpret AFT data [16,17].
A binomial peak-fitting method [19,38] was implemented for the decomposition of fission-track grain age distributions using BinomFit [21,22]. The relationship between the peak age(s) and the depositional age of the sample were taken in to account, allowing us to categorize the samples into four types of AFT grain age distributions [18]. Type D indicates unreset samples which contain one or more peak ages that are older than the depositional age and the recorded age(s) of the source region. Type R indicates reset samples which present a single-peak age younger than the depositional age of the sample; hence, these grains are considered to have been fully reset to a younger age. Type MR indicates reset samples which contain more than one peak, but which are nonetheless all younger than the depositional age. Type PR indicates partially reset samples containing multiple peaks that are both younger and older than the depositional age, which means that only a fraction of the grain ages was reset.

4. Results

A total of fourteen samples from four boreholes in the Linqing Depression are summarized in Table 1. AFT ages range from 124.4 ± 24.9 to 53.5 ± 5.4 Ma, with mean track lengths ranging from 8.00 ± 2.51 to 11.24 ± 1.27 μm. Among these samples, the grain ages of 10 samples are mixed, and the χ2 test values are less than 5%. All samples are designated as reset (R), mixed reset (MR), partially reset (PR), and unreset (D) (Table 2, Tables S2 and S3).
For borehole GS1, the AFT ages of the Triassic samples GS1-2 and GS1-5 are 121.1 ± 13.1 and 57.1 ± 8.5 Ma, respectively. The two samples show a decrease in AFT age with depth, and are younger than the corresponding depositional age (Figure 3). The P(χ2) values of these samples are 1.41% and 0, respectively (Table 1). Most single grain ages of GS1-2 and GS1-5 are scattered and are younger than the stratigraphic age (Figure 4). Sample GS1-2 from Triassic sandstone is interpreted as partially reset with AFT peak ages of 215.7 and 105.3 Ma (Table 2 and Figure 4). Sample GS1-5 is interpreted as partially reset with three peak ages of 261.0, 93.1, and 41.3 Ma. These characteristics show that the samples have undergone considerable, but not total, annealing after deposition in the Linqing Sub-basin. The information from the Ro data indicates that the Permian and Carboniferous strata in well GS1 experienced a maximum paleo-temperature of ca. 200 °C but could not induce the apatite grains in shallow formations to anneal.
For borehole C1, six samples from Triassic and Cretaceous Formations were analyzed (Table 1, Figure 3 and Figure 4). Sample C1-1 has a pooled age of 103.3 ± 12.5 Ma and is interpreted as partially reset with AFT peak ages of 124.6 and 58.6 Ma. Samples C1-2, C1-4, and C1-5 are reset with pooled ages of 85.6 ± 7.7, 90.5 ± 8.9, and 107.7 ± 10.8, respectively. Samples C1-6 and C1-7 are interpreted as mixed reset with minimum peak ages 47.8 and 40.8 Ma and have older peak ages of 83.4 and 93.4 Ma, respectively. Referring to the Ro data from the close well Q4, we deduced that the maximum paleo-temperature experienced by the Cretaceous and Triassic Formations of well C1 could be less than ca. 75 °C and ca. 120 °C, respectively (Figure 3). The lowest two samples could have induced the apatite grains to anneal.
For borehole Q3, the AFT pooled age of the Cretaceous sample Q3-2 is 105.8 ± 11.0 Ma, older than the stratigraphic age (Figure 3). Most single-grain AFT ages in Q3-2 are older than their stratigraphic age (~80 Ma), suggesting no significant postdepositional annealing (Figure 4). The AFT central ages of the three deep samples (Q3-3, Q3-4, and Q3-5) are 84.0 ± 11.2, 124.4 ± 24.9, and 116.0 ± 26.4 Ma, respectively, with increasing depth, which are younger than their stratigraphic ages (Figure 3). Most single-grain ages of these samples are very scattered and are younger than the stratigraphic age (Figure 4). Sample Q3-2 is Cretaceous sandstone and is considered unreset duo to its peak age of 102.2 Ma. Samples Q3-3, Q3-4, and Q3-5 are partially reset, with minimum peak ages of 70.7, 56.6, and 58.6 Ma, respectively. The older aged peaks in all three samples range between 394.8 and 277.6 Ma. The calculated results from Ro data indicate that the maximum paleo-temperature of the Cretaceous and Permian Formations of the well Q3 is approximately 110–120 °C (Figure 3), which is closer to the AFT closure temperature (ca.125 °C). These characteristics indicate that these samples have undergone considerable annealing.
For borehole W57, the AFT central ages of the Eocene samples W57-1 and W57-2 are 67.7 ± 8.8 and 77.0 ± 11.3 Ma, respectively, older than their depositional ages with most grains showing significantly older AFT ages than their host stratigraphic ages of ca. 50–48 Ma (Figure 3 and Figure 4). The two samples show a decrease in AFT age with depth. The P(χ2) values of these samples are 2.26% and 2.46%, respectively (Table 1). Samples W57-1 and W57-2 are considered unreset. They have central ages and the youngest peak ages (55.0 to 49.2 Ma) that are older than the depositional age. They also have old age peaks of 106.4 to 102.7 Ma. The information from the Ro data indicates that the Eocene Formation in well W57 experienced a maximum paleo-temperature of 80–130 °C. Zuo et al. (2017) suggested that this area experienced two heating stages: the first heating stage was from the Shahejie 3 Formation to the Dongying Formation depositional periods, and the second one was from the Guantao Formation depositional period to present day [39]. The high temperature could have induced the apatite grains in these formations to anneal. These characteristics suggest they have not undergone substantial postdepositional annealing, and therefore, their provenance can be studied.

5. Discussion

5.1. Minimum Age and the Recent Cooling Event

The minimum ages of the samples all have similar annealing properties, and thus, constrain the most recent cooling [18]. Galbraith and Laslett (1993) introduced the term “minimum age”, which can be viewed as the pooled age of the largest concordant fraction of young grain ages [19].
According to BinomFit, the optimal ages of AFT decomposition ages show that the minimum ages of these samples are mainly between 105.3–40.8 Ma. The youngest ages of the samples from boreholes Gs1, Q3, and C1 are younger than the deposition age (Figure 3, Figure 4 and Figure 5), indicating that these samples underwent thermal annealing after deposition. The multicomponent age structure suggests that the samples only experienced partial annealing, and the final annealing did not completely reset the previous thermal information. The youngest age can represent the age of the latest structural thermal reset event.
Figure 5a shows the relationship between AFT ages and depth for the variously reset samples. The trend of concordant samples (P(χ2) > 5%) is relatively flat, and the trend of discordant samples (P(χ2) < 5%) is steeper. In Figure 5b, we replaced the discordant apatite fission-track ages in Figure 5a with minimum ages decomposed by BinomFit. It can be seen that the minimum age is consistent with the trend of concordant samples. The samples in the deep part of the formation (<~2500 m) have undergone significant annealing behavior and have similar annealing properties. The ages are concentrated in about 70–40 Ma, which represents the latest structural thermal reset event of the Linqing Depression.
Given the present-day thermal gradient of ca. 31 °C/km for the Linqing Depression [40], depths between 1600 and 3300 m presently lie within the range of the AFT partial annealing zone [41] (Figure 5). The distribution of minimum ages shows a trend similar to that of AFT ages of natural samples of basin boreholes [42], which shows that the age becomes younger as the profile depth increases. These minimum ages are often younger than the sedimentary age [43]. We identified a break in slope from the depth-minimum age profile (Figure 5b). The break in slope is commonly indicative of a distinct cooling episode and reflects a Meso-Cenozoic cooling event. The results are consistent with our tectono-thermal history results [20], indicating that there was a cooling event at 110–80 Ma.

5.2. Implications for Cratonic Destruction

In this study, most of the AFT age data did not pass the P(χ2) test, and the results from BinomFit decomposition showed that the samples could be decomposed into three age groups, i.e., P3 (394.8–215.7 Ma), P2 (124.6–83.4 Ma) and P1 (70.7–40.8 Ma) (Figure 6).
The P3 group of AFT samples is 394.8–215.7 Ma. The largest age data is 394.8 Ma from Q3-5, and may be closely related to the uplift of the NCC at ~445.0–315.0 Ma. The other four data range from 286.8 to 215.7 Ma and may be correlated with deformation and magmatism at ~320.0–200.0 Ma. During the early Paleozoic, the NCC remained relatively stable and experienced no deformation, as indicated by the shallow oceanic sediments covering the basement of the NCC. Then, the NCC experienced uplift lasting for ~120.0 Ma (445.0–315.0 Ma), the direction of plate motion changed from southwards to northwards, and the proto-Tethys Ocean was formed (~445.0–315.0 Ma) [44,45]. During the period of ~320.0–200.0 Ma, the NCC experienced deformation and magmatism along the northern and southern margins [46]. This tectonic setting maybe related to closure of the Paleo-Asian and Paleo-Tethys Oceans. The final closure of the Paleo-Asian Ocean was about 250 Ma [47,48,49]. The closure of the Paleo-Asian Ocean in NE China was along the Solonker–Xar Moron–Changchun–Yanji suture, and this was likely completed in the Late Permian, although associated activity continued into the Triassic [50]. The closure of the Paleo-Tethys Ocean most likely occurred during the Late Triassic [51]. These tectonic activities simply reactivated the cratonic margin, and are not the main reason for the destruction of the NCC.
Figure 6. (a) Grain age components of apatite fission track from the Linqing Depression P1–P3 are age peaks in Table 2. (b) Tectonic evolution of the Linqing Depression, stress environment [46,52,53,54,55]; basin evolution [32,46,56,57]; plate activity [46,50,51,56,58,59,60,61]; mantle activity [13,15,46,52].
Minerals 11 01176 g006
The P2 group of 124.6–83.4 Ma corresponds to the Mesozoic tectonic activities, such as the closure of the Mongol–Okhotsk Ocean, the turning of the Izanagi plate, and mantle convection. From ca. 200 Ma, the Izanagi plate began to subduct towards the NCC [56,59,62]. From ca. 150.0 Ma, the Izanagi plate changed the subduction direction from W to NW and caused the closure of the Mongol–Okhotsk Ocean. From ca. 137.0 Ma, the Izanagi plate began to retreat and caused a compressive stress environment. Subsequently, at ca. 110.0 Ma, the subduction direction of the Izanagi plate changed to NNW, and the NCC experienced long-term uplift and erosion. During ca. 120.0–100 Ma, the heat flow was about 84–88 mW/m2, and the lithospheric strength was about 2.09 × 10¹² N/m [13,20,63,64,65]. The subduction and rollback of the Pacific plate maybe the dominant mechanisms that caused lithospheric weakening, high heat flow, and the destruction and lithospheric thinning of the eastern NCC in the late Early Cretaceous [66,67,68,69,70,71].
The P1 group of 70.7–40.8 Ma mainly corresponds to the tectonic activities of the Cenozoic, such as the Izanagi–Pacific ridge, the closure of the Tethys Ocean, and the rotation of the Philippine Sea plate. The Cenozoic rifting and volcanic activity in eastern China are related to the retreat and subduction of the Pacific plate [72,73,74]. In the early Cenozoic, duo to the young age of the Izanagi–Pacific midocean ridge beneath the Northeast Asia, the study area developed Cenozoic rifting and Neogene volcanic activities [75,76]. Cenozoic tectonics in eastern China are also related to the crustal escape caused by Indo-Asian collision [77]. During 48.0–34.0 Ma, due to the rotation and subduction of the Philippine sea plate, the BBB experienced an NS stress environment [56,58]. Studies of tectono-thermal history suggested that the BBB once again experienced high heat flow and lithospheric thinning in the Paleogene [13,63,64,78]. These researchers suggested that the lithosphere of the ENCC was again thinned to ca. 60 km without causing craton destruction.

6. Conclusions

The main conclusions of this study of the Meso-Cenozoic exhumation in the Linqing Sub-basin are as follows:
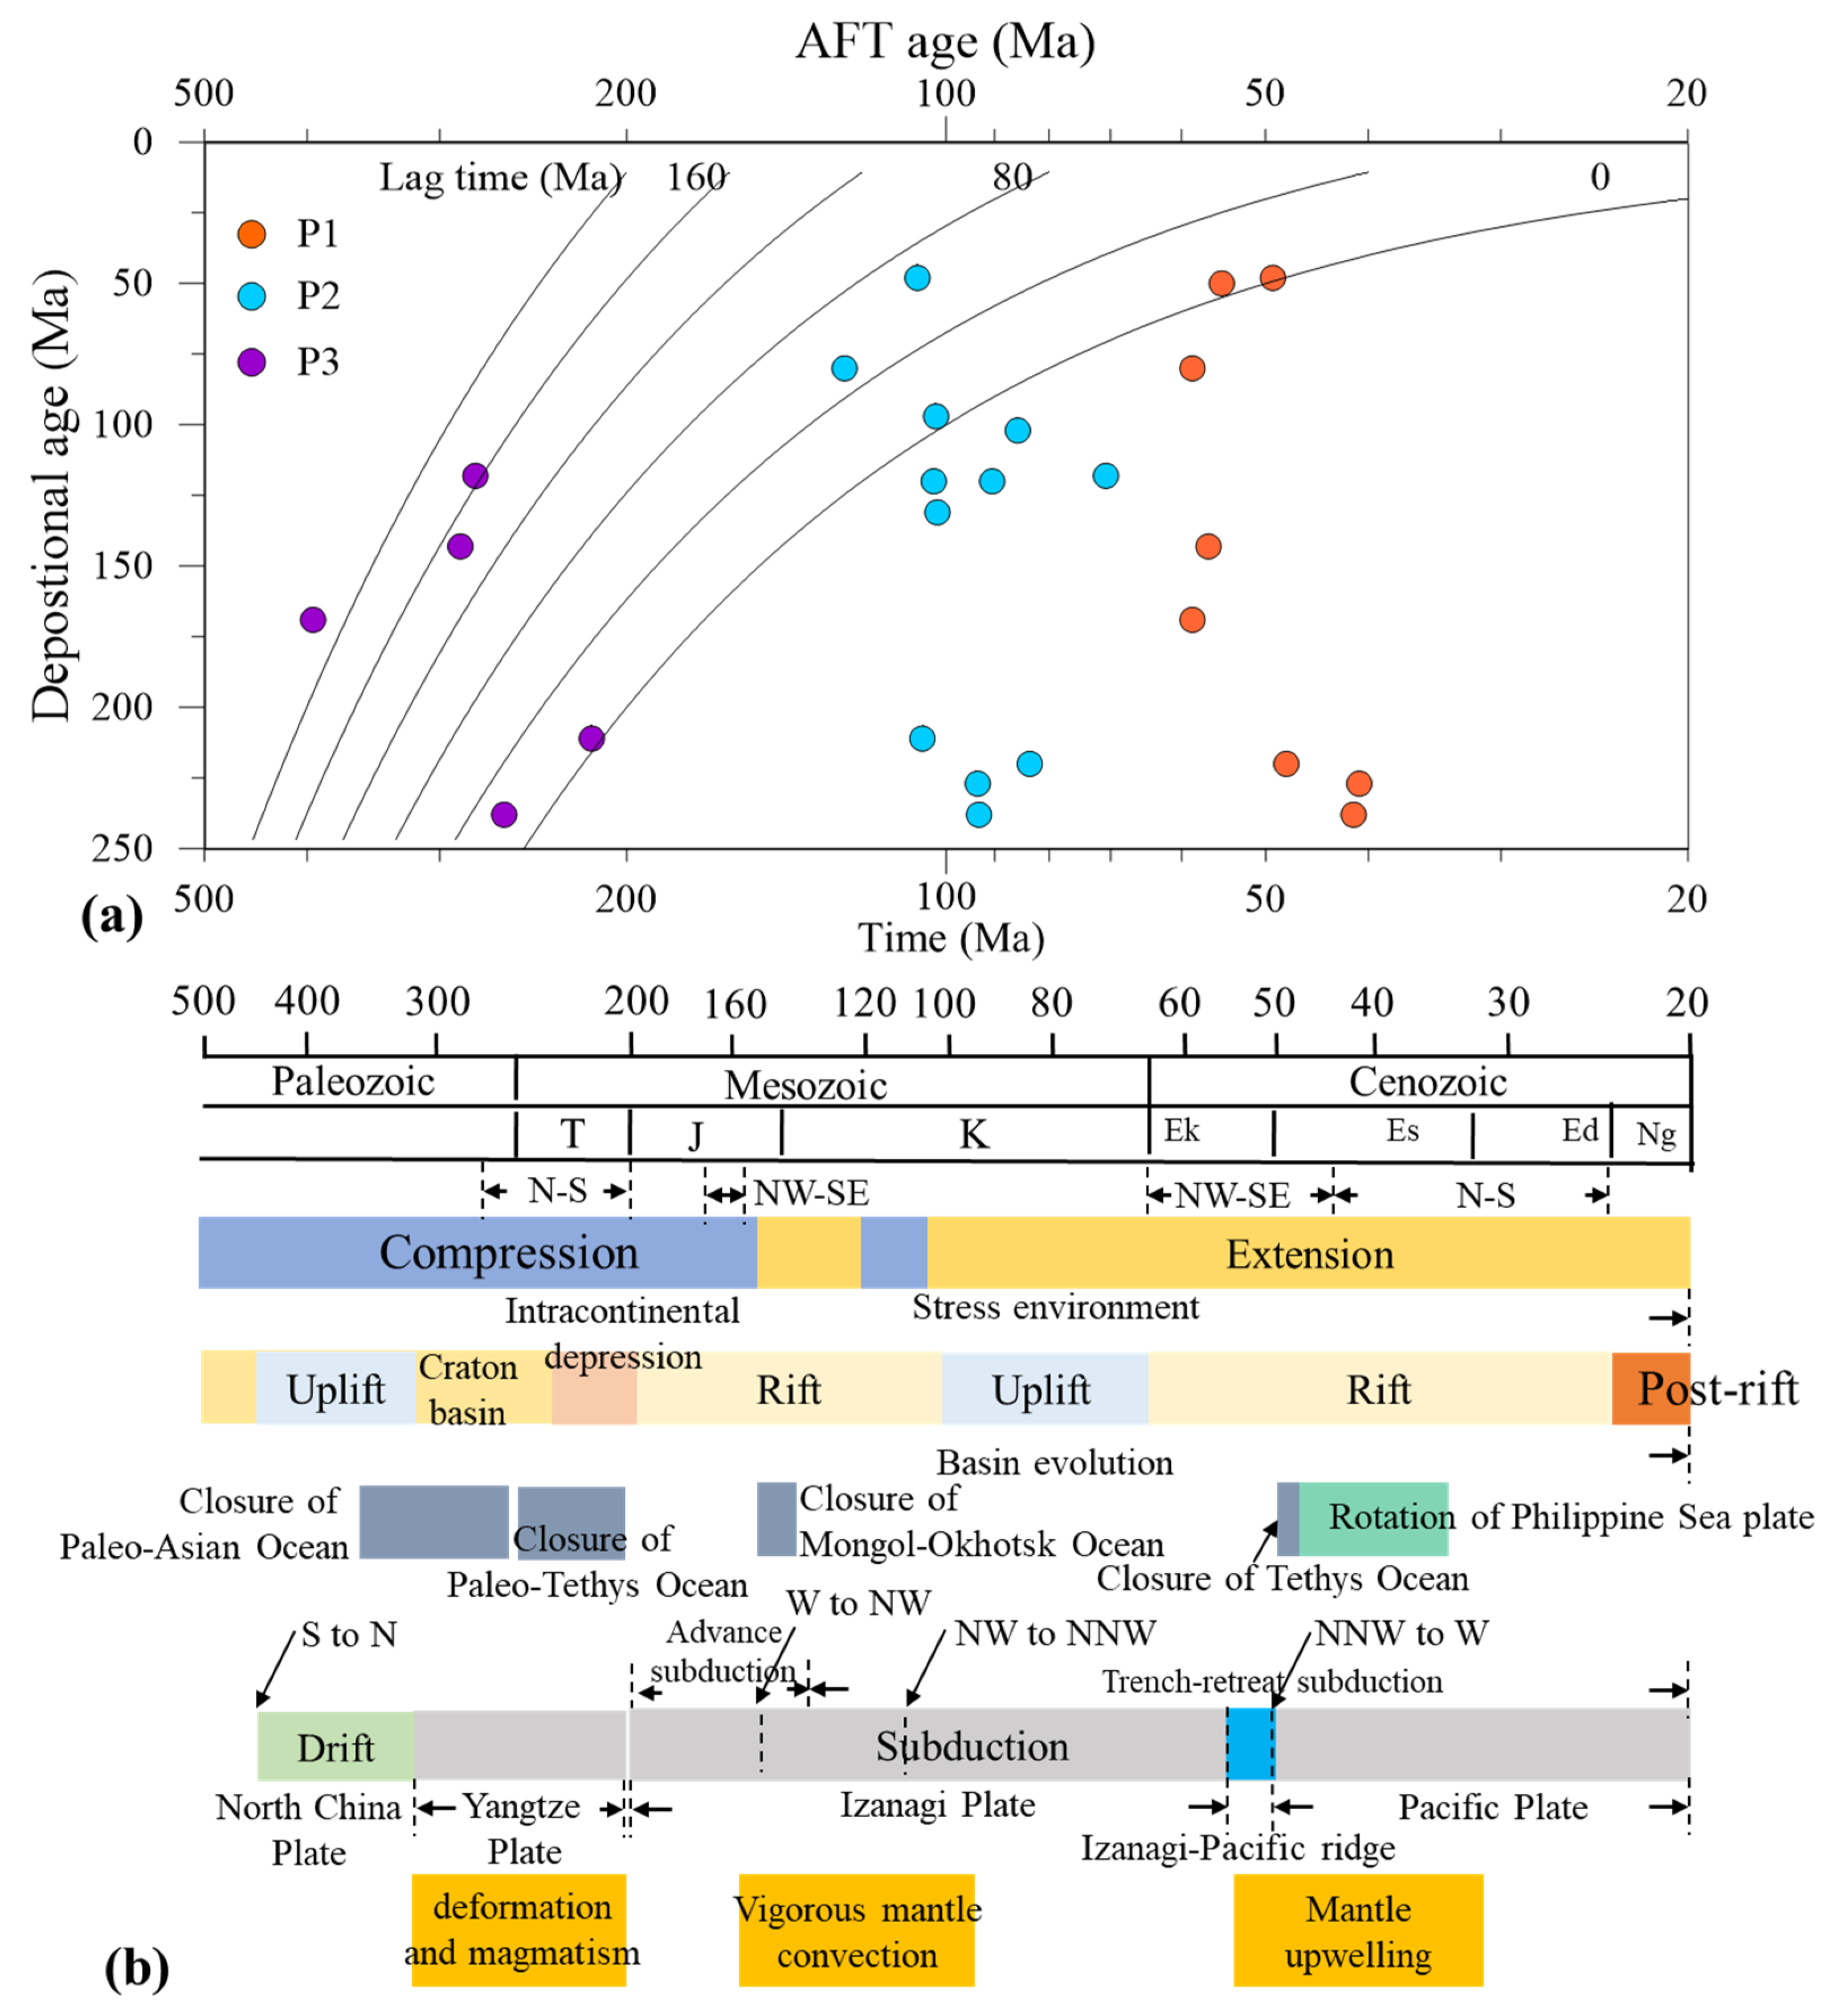
  • AFT ages range from 124.4 ± 24.9 to 53.5 ± 5.4 Ma with mean track lengths ranging from 8.00 ± 2.51 to 11.24 ± 1.27 μm. Most of the AFT age data did not pass the P(χ2) test and could be divided into three age groups: P3 (394.8–215.7 Ma), P2 (124.6–83.4 Ma), and P1 (70.7-40.8 Ma).
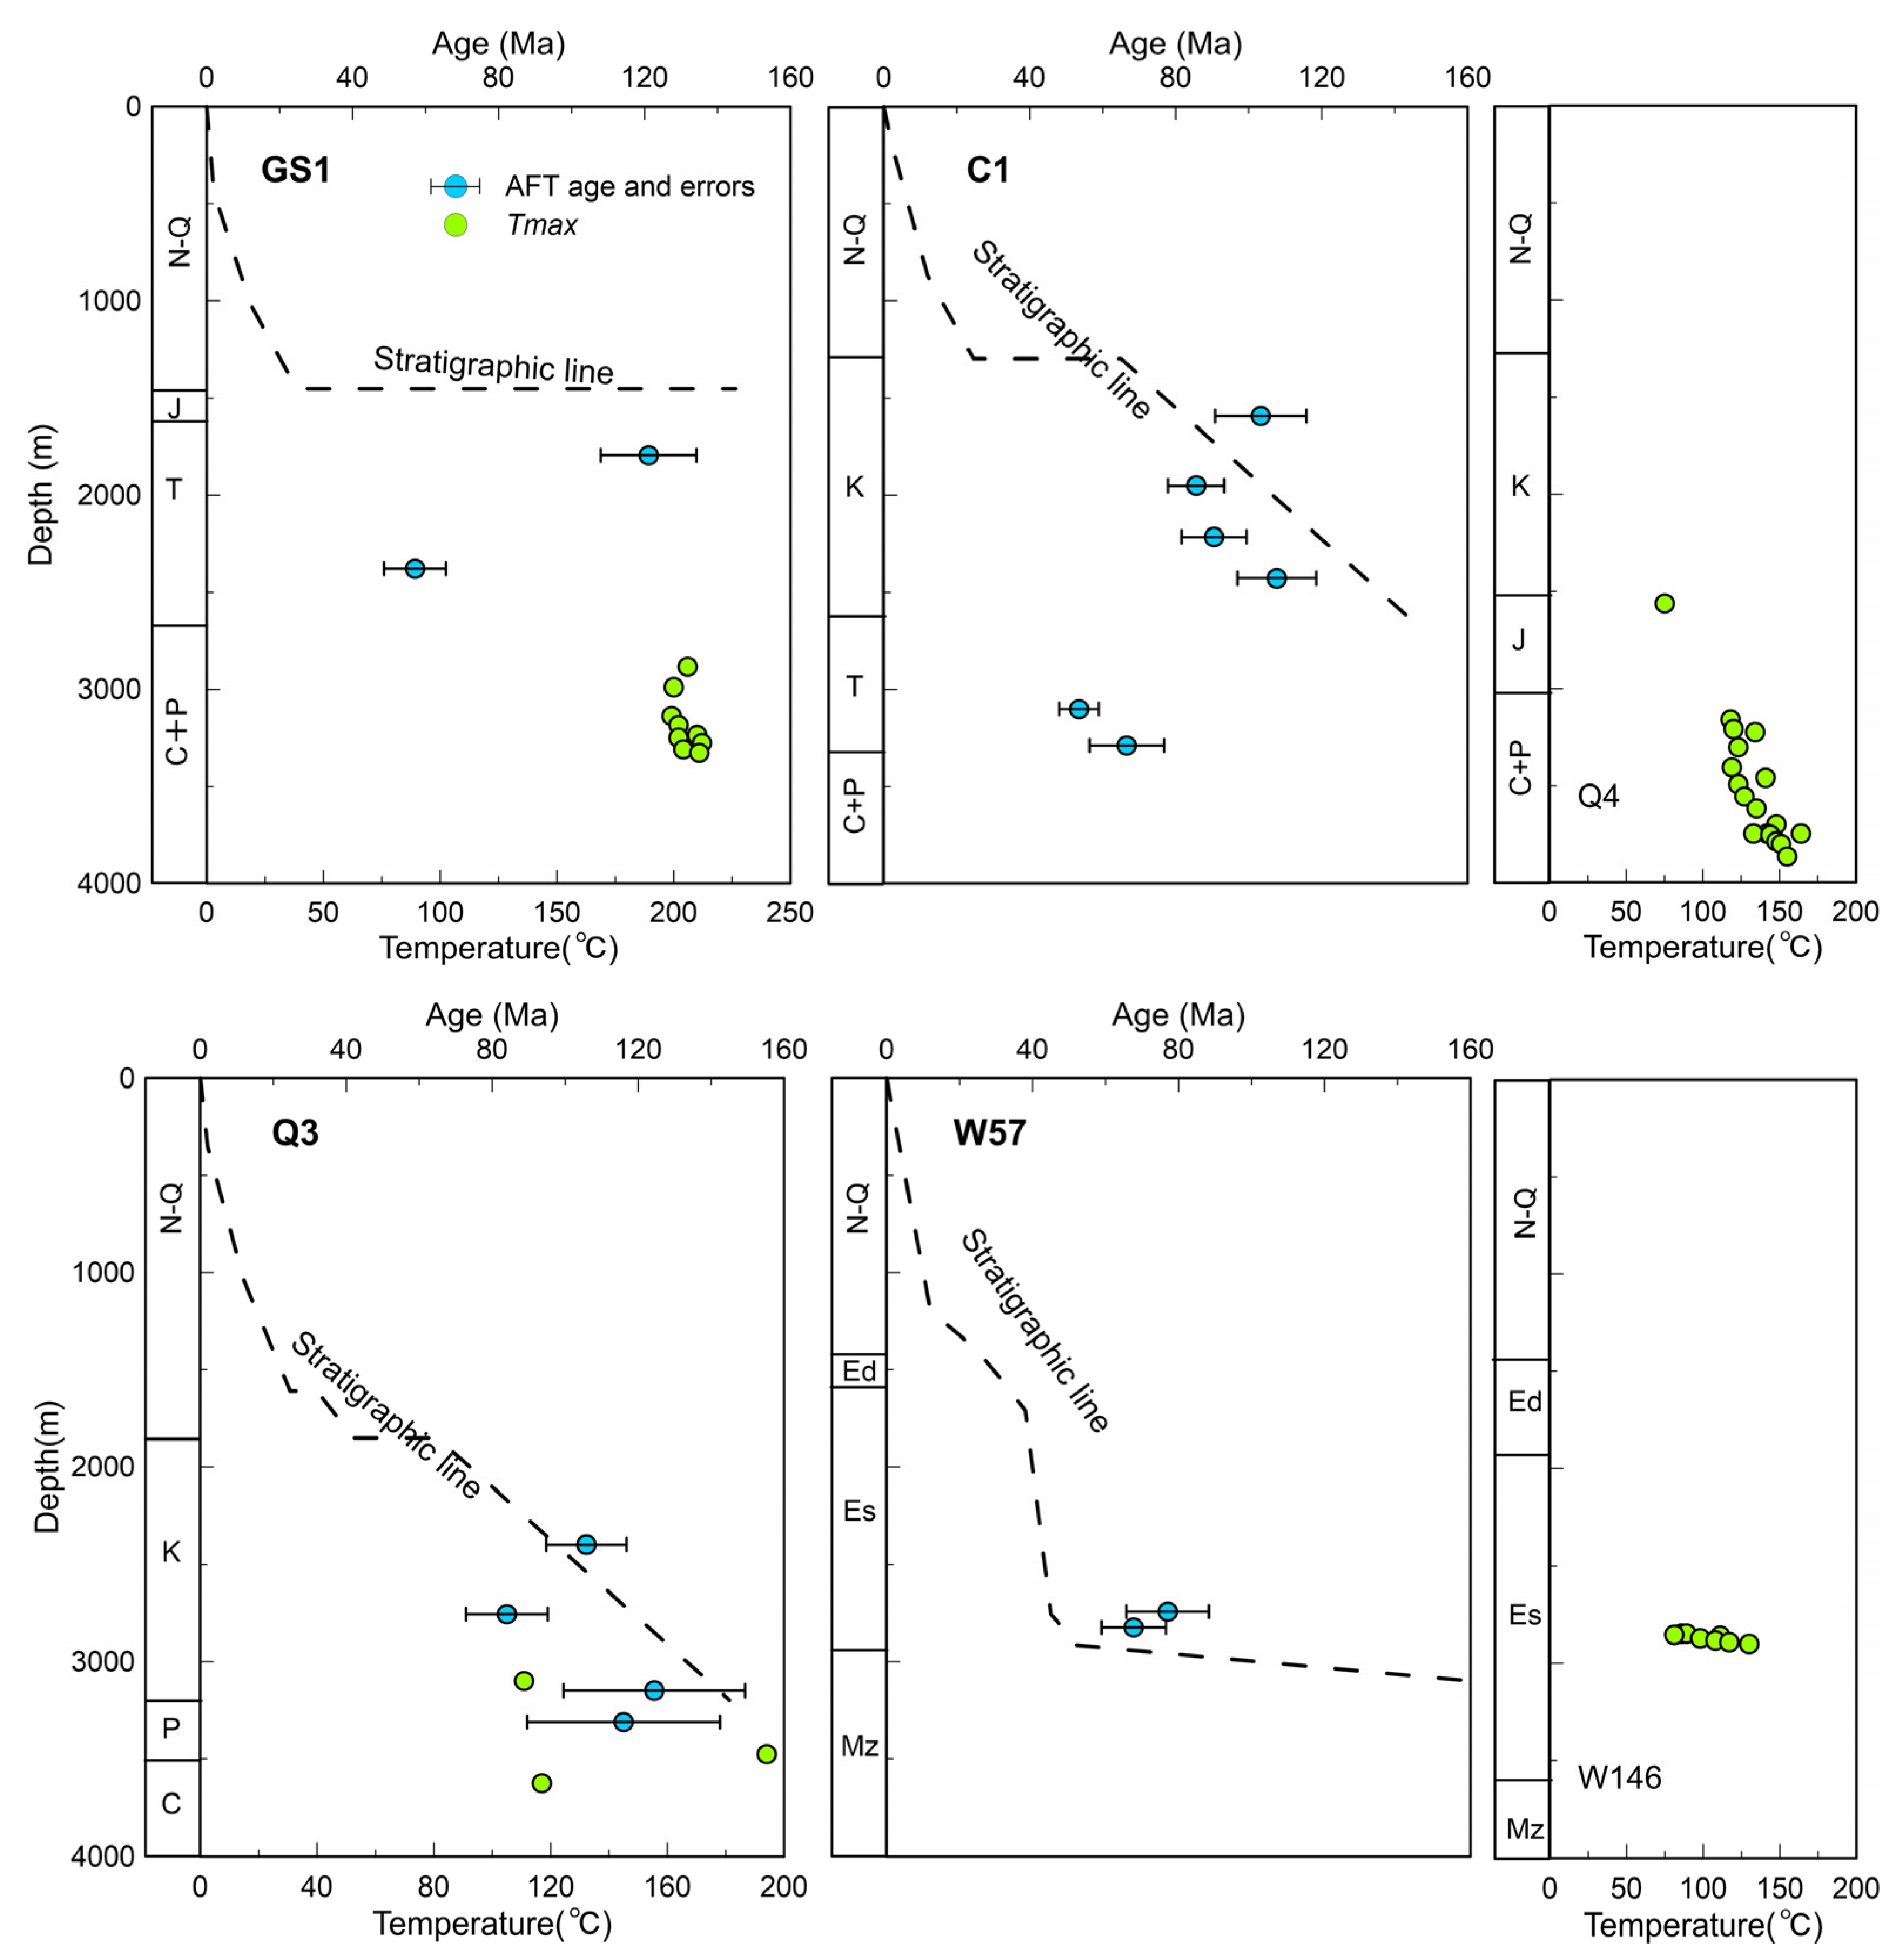
  • The minimum ages are concentrated in ca. 70.0−40.0 Ma, which represents the latest structural thermal reset event of the Linqing Depression. The break in slope observed from the depth-minimum age profile is commonly indicative of a distinct cooling episode and reflects a Meso-Cenozoic cooling event.
  • Three peak age groups are correlated with the tectonic activities of the Paleozoic, Mesozoic, and Cenozoic.

Supplementary Materials

The following are available online at https://www.mdpi.com/article/10.3390/min11111176/s1, Text S1: Apatite fission track (AFT) analysis-External Detector Method [79,80]. Table S1: Ro data from PetroChina Huabei Oilfield Company. Table S2: Apatite Fission-Track Age Data of individual sample. Table S3: Apatite Fission-Track Length Data of individual sample.

Author Contributions

Conceptualization, N.Q. and W.X.; methodology, N.Q. and J.C.; software, J.C. and W.X.; validation, N.Q., J.C. and W.X.; investigation, W.X.; resources, N.Q. and W.X.; data curation, J.C. and W.X.; writing—original draft preparation, W.X.; writing—review and editing, N.Q. and J.C.; visualization, W.X.; supervision, N.Q.; project administration, N.Q. and W.X.; funding acquisition, N.Q. and W.X. All authors have read and agreed to the published version of the manuscript.

Funding

This research was funded by NATIONAL NATURAL SCIENCE FOUNDATION OF CHINA, grant number 91114202, 41590855 and 41804079, NATURAL SCIENCE FOUNDATION OF SHAANXI PROVINCE, grant number 2020JQ-032.

Acknowledgments

Our heartfelt gratitude is given to the editors and reviewers for their scientific and linguistic revisions of the manuscript.

Conflicts of Interest

The authors declare no conflict of interest.

References

  1. Liu, D.; Wilde, S.A.; Wan, Y.; Wu, J.; Zhou, H.; Dong, C.; Yin, X. New U-Pb and Hf isotopic data confirm Anshan as the oldest preserved segment of the North China Craton. Am. J. Sci. 2008, 308, 200–231. [Google Scholar] [CrossRef]
  2. Huang, Z.; Li, H.; Zheng, Y.; Peng, Y. The lithosphere of North China Craton from surface wave tomography. Earth Planet. Sci. Lett. 2009, 288, 164–173. [Google Scholar] [CrossRef]
  3. Tian, Y.; Zhao, D.; Sun, R.; Teng, J. Seismic imaging of the crust and upper mantle beneath the North China Craton. Phys. Earth Planet. Inter. 2009, 172, 169–182. [Google Scholar] [CrossRef]
  4. Zhu, J.; Cao, J.; Li, X.; Zhou, B. The Reconstruction of Preliminary Three dimensional Earth’s Model and Its Implications in China and Adjacent Regions. Acta Geophys. Sin. 1997, 40, 647–658. [Google Scholar]
  5. Zheng, J.; Lu, F.; O’Reilly, S.; Griffin, W.; Zhang, M. Comparison between Palaeozoic and Cenozoic lithospheric mantle in the eastern part of the North China block. Acta Geol. Sin. 1999, 73, 47–56. [Google Scholar]
  6. Griffin, W.L.; Andi, Z.; O’Reilly, S.Y.; Ryan, C.G. Phanerozoic Evolution of the Lithosphere Beneath the Sino-Korean Craton. In Mantle Dynamics and Plate Interactions in East Asia; Flower, M., Chung, S., Lo, C., Lee, T., Eds.; American Geophysical Union: Washington, DC, USA, 1998; pp. 107–126. [Google Scholar]
  7. Menzies, M.A.; Fan, W.; Zhang, M. Palaeozoic and Cenozoic lithoprobes and the loss of >120 km of Archaean lithosphere, Sino-Korean craton, China. In Magmatic Processes and Plate Tectonics; Prichard, H.M., Alabaster, T., Harris, N.B.W., Neary, C.R., Eds.; Special Publication No. 76; Geological Society Special Publication: London, UK, 1993; Volume 76, pp. 71–81. [Google Scholar]
  8. Yang, J.; Wu, F.; Wilde, S.A. A review of the geodynamic setting of large-scale Late Mesozoic gold mineralization in the North China Craton: An association with lithospheric thinning. Ore Geol. Rev. 2003, 23, 125–152. [Google Scholar] [CrossRef]
  9. Zhu, R.; Chen, L.; Wu, F.; Liu, J. Timing, scale and mechanism of the destruction of the North China Craton. Sci. China Earth Sci. 2011, 54, 789–797. [Google Scholar] [CrossRef]
  10. Chang, J.; Qiu, N.; Liu, S.; Cai, C.; Xu, Q.; Liu, N. Post-Triassic multiple exhumation of the Taihang Mountains revealed via low-T thermochronology: Implications for the paleo-geomorphologic reconstruction of the North China Craton. Gondwana Res. 2019, 68, 34–49. [Google Scholar] [CrossRef]
  11. Chang, J.; Qiu, N.; Zhao, X.; Shen, F.; Liu, N.; Xu, W. Mesozoic and Cenozoic tectono-thermal reconstruction of the western Bohai Bay Basin (East China) with implications for hydrocarbon generation and migration. J. Asian Earth Sci. 2018, 160, 380–395. [Google Scholar] [CrossRef]
  12. Hu, S.; O’Sullivan, P.B.; Raza, A.; Kohn, B.P. Thermal history and tectonic subsidence of the Bohai Basin, northern China: A Cenozoic rifted and local pull-apart basin. Phys. Earth Planet. Inter. 2001, 126, 221–235. [Google Scholar] [CrossRef]
  13. Qiu, N.; Zuo, Y.; Chang, J.; Li, W. Geothermal evidence of Meso-Cenozoic lithosphere thinning in the Jiyang sub-basin, Bohai Bay Basin, eastern North China Craton. Gondwana Res. 2014, 26, 1079–1092. [Google Scholar] [CrossRef]
  14. Qiu, N.; Zuo, Y.; Xu, W.; Li, W.; Chang, J.; Zhu, C. Meso-Cenozoic Lithosphere Thinning in the Eastern North China Craton: Evidence from Thermal History of the Bohai Bay Basin, North China. J. Geol. 2016, 124, 195–219. [Google Scholar] [CrossRef]
  15. Qi, J.; Yang, Q. Cenozoic structural deformation and dynamic processes of the Bohai Bay basin province, China. Mar. Pet. Geol. 2010, 27, 757–771. [Google Scholar] [CrossRef]
  16. Green, P.F. A new look at statistics in fission-track dating. Nucl. Tracks 1981, 5, 77–86. [Google Scholar] [CrossRef]
  17. Galbraith, R.F. On statistical models for fission track counts. J. Int. Assoc. Math. Geol. 1981, 13, 471–478. [Google Scholar] [CrossRef]
  18. Brandon, M.T.; Roden-Tice, M.K.; Garver, J.I. Late Cenozoic exhumation of the Cascadia accretionary wedge in the Olympic Mountains, northwest Washington State. Geol. Soc. Am. Bull. 1998, 110, 985–1009. [Google Scholar] [CrossRef]
  19. Galbraith, R.F.; Laslett, G.M. Statistical models for mixed fission track ages. Nucl. Tracks Radiat. Meas. 1993, 21, 459–470. [Google Scholar] [CrossRef]
  20. Xu, W.; Qiu, N.; Chang, J.; Zhou, Y.; Xiao, Y.; Liu, S. Mesozoic–Cenozoic thermal evolution of the Linqing Sub-basin, Bohai Bay Basin (eastern North China Craton): Constraints from vitrinite reflectance data and apatite fission track thermochronology. Geol. J. 2020, 55, 5049–5061. [Google Scholar] [CrossRef]
  21. Brandon, M.T. Decomposition of fission-track grain-age distributions. Am. J. Sci. 1992, 292, 535–564. [Google Scholar] [CrossRef]
  22. Brandon, M.T. Decomposition of mixed grain age distributions using Binomfit. Track 2002, 24, 13–18. [Google Scholar]
  23. Zhao, G.; Sun, M.; Wilde, S.A.; Li, S. Late Archean to Paleoproterozoic evolution of the North China Craton: Key issues revisited. Precambrian Res. 2005, 136, 177–202. [Google Scholar] [CrossRef]
  24. Kusky, T.; Li, J.; Santosh, M. The Paleoproterozoic North Hebei Orogen: North China craton’s collisional suture with the Columbia supercontinent. Gondwana Res. 2007, 12, 4–28. [Google Scholar] [CrossRef]
  25. Yang, J.H.; Wu, F.Y.; Wilde, S.A.; Belousova, E.; Griffin, W.L. Mesozoic decratonization of the North China block. Geology 2008, 36, 467–470. [Google Scholar] [CrossRef]
  26. Zhu, R.; Yang, J.; Wu, F. Timing of destruction of the North China Craton. Lithos 2012, 149, 51–60. [Google Scholar] [CrossRef]
  27. Wu, F.Y.; Xu, Y.G.; Gao, S.; Zheng, J.P. Lithospheric thinning and destruction of the North China Craton. Acta Petrol. Sin. 2008, 24, 1145–1174. [Google Scholar]
  28. Gao, S.; Rudnick, R.L.; Yuan, H.; Liu, X.; Liu, Y.; Xu, W.; Ling, W.; Ayers, J.; Wang, X.; Wang, Q. Recycling lower continental crust in the North China craton. Nature 2004, 432, 892–897. [Google Scholar] [CrossRef]
  29. Zhou, L.H.; Li, S.Z.; Liu, J.Z. Pre-Tertiary Tectonic Evolution and Buried Hill-Type Oil-Gas Development and Reservation under the Bohai Bay Basin; China Science and Technology Press: Beijing, China, 2003; pp. 2–22. [Google Scholar]
  30. Zhang, G. Structure and tectonics of Mesozoic basins in north and NE China. Acta Pet. Sin. 1997, 18, 7–13. [Google Scholar]
  31. Sun, Y.; Xu, S.; Zhang, S.; Li, Y.; Li, H.; Meng, T.; Liu, J. Evolution of the Mesozoic Source Rocks in the West Linqing Depression. Nat. Gas Geosci. 2015, 26, 1910–1916. [Google Scholar]
  32. Qi, J.F.; Zhang, Y.W.; Lu, K.Z.; Yang, Q. Cenozoic tectonic evolution in Bohai Bay Basin province. J. Univ. Pet. China 1995, 19, 1–6. [Google Scholar]
  33. Luo, Y.L. Linqing Depression Evaluation of Upper Paleozoic Oil and Gas Resources. Master’s Thesis, China University of Petroleum, Qingdao, China, 2011. [Google Scholar]
  34. Guo, H.; Xia, B.; Chen, G.; Wang, R.; Ding, J.; Wang, J. Geochemical and geotectonic features of Miocene basalts in Linqing Sag. Acta Pet. Sin. 2005, 26, 5–11. [Google Scholar]
  35. Naeser, C.W. The use of apatite and sphene for fission track age determinations. Geol. Soc. Am. Bull. 1967, 78, 1523–1526. [Google Scholar] [CrossRef]
  36. Barker, C.E.; Pawlewicz, M.J. Calculation of Vitrinite Reflectance from Thermal Histories and Peak Temperatures: A comparison of methods. In Vitrinite Reflectance as a Maturity Parameter: Applications and Limitations; Mukhopadhyay, P.K., Dow, W.G., Eds.; ACS Symposium Series 570; American Chemical Society: Washington, DC, USA, 1994; pp. 216–229. [Google Scholar]
  37. Barnes, J.B.; Ehlers, T.A.; McQuarrie, N.; O’Sullivan, P.B.; Pelletier, J.D. Eocene to recent variations in erosion across the central Andean fold-thrust belt, northern Bolivia: Implications for plateau evolution. Earth Planet. Sci. Lett. 2006, 248, 118–133. [Google Scholar] [CrossRef]
  38. Galbraith, R.F.; Green, P.F. Estimating the component ages in a finite mixture. Int. J. Radiat. Appl. Instrum. Part D Nucl. Tracks Radiat. Meas. 1990, 17, 197–206. [Google Scholar] [CrossRef]
  39. Zuo, Y.; Ye, B.; Wu, W.; Zhang, Y.; Ma, W.; Tang, S.; Zhou, Y. Present temperature field and Cenozoic thermal history in the Dongpu depression, Bohai Bay Basin, North China. Mar. Pet. Geol. 2017, 88, 696–711. [Google Scholar] [CrossRef]
  40. Gong, Y.L. The Thermal Structure and Thermal Evolution of Bohai Bay Basin Eastern China. Ph.D. Thesis, Nanjing University, Nanjing, China, 2003. [Google Scholar]
  41. Green, P.F.; Duddy, I.R.; Laslett, G.M.; Hegarty, K.A.; Gleadow, A.J.W.; Lovering, J.F. Thermal annealing of fission tracks in apatite 4. Quantitative modelling techniques and extension to geological timescales. Chem. Geol. Isot. Geosci. Sect. 1989, 79, 155–182. [Google Scholar] [CrossRef]
  42. Wolf, R.A.; Farley, K.A.; Kass, D.M. Modeling of the temperature sensitivity of the apatite (U–Th)/He thermochronometer. Chem. Geol. 1998, 148, 105–114. [Google Scholar] [CrossRef]
  43. Gleadow, A.J.; Brown, R.W. Fission-track thermochronology and the long-term denudational response to tectonics. In Geomorphology and Global Tectonics; Wiley: New York, NY, USA, 2000; pp. 57–75. [Google Scholar]
  44. Liu, J.; Zhao, Y.; Liu, A.; Zhang, S.; Yang, Z.; Zhuo, S. Origin of Late Palaeozoic bauxites in the North China Craton: Constraints from zircon U–Pb geochronology and in situ Hf isotopes. J. Geol. Soc. 2014, 171, 695–707. [Google Scholar] [CrossRef]
  45. Wang, Q.; Deng, J.; Liu, X.; Zhao, R.; Cai, S. Provenance of Late Carboniferous bauxite deposits in the North China Craton: New constraints on marginal arc construction and accretion processes. Gondwana Res. 2016, 38, 86–98. [Google Scholar] [CrossRef]
  46. Wang, Y.; Zhou, L.; Liu, S.; Li, J.; Yang, T. Post-cratonization deformation processes and tectonic evolution of the North China Craton. Earth-Sci. Rev. 2018, 177, 320–365. [Google Scholar] [CrossRef]
  47. Xiao, W.; Windley, B.F.; Sun, S.; Li, J.; Huang, B.; Han, C.; Yuan, C.; Sun, M.; Chen, H.A. Tale of Amalgamation of Three Permo-Triassic Collage Systems in Central Asia: Oroclines, Sutures, and Terminal Accretion. Annu. Rev. Earth Planet. Sci. 2015, 43, 477–507. [Google Scholar] [CrossRef] [Green Version]
  48. Jepson, G.; Glorie, S.; Konopelko, D.; Gillespie, J.; Danišík, M.; Mirkamalov, R.; Mamadjanov, Y.; Collins, A.S. Low-Temperature Thermochronology of the Chatkal-Kurama Terrane (Uzbekistan-Tajikistan): Insights Into the Meso-Cenozoic Thermal History of the Western Tian Shan. Tectonics 2018, 37, 3954–3969. [Google Scholar] [CrossRef]
  49. Jepson, G.; Glorie, S.; Konopelko, D.; Mirkamalov, R.; Danišík, M.; Collins, A.S. The low-temperature thermo-tectonic evolution of the western Tian Shan, Uzbekistan. Gondwana Res. 2018, 64, 122–136. [Google Scholar] [CrossRef]
  50. Wilde, S.A. Final amalgamation of the Central Asian Orogenic Belt in NE China: Paleo-Asian Ocean closure versus Paleo-Pacific plate subduction—A review of the evidence. Tectonophysics 2015, 662, 345–362. [Google Scholar] [CrossRef]
  51. Song, P.; Ding, L.; Li, Z.; Lippert, P.C.; Yang, T.; Zhao, X.; Fu, J.; Yue, Y. Late Triassic paleolatitude of the Qiangtang block: Implications for the closure of the Paleo-Tethys Ocean. Earth Planet. Sci. Lett. 2015, 424, 69–83. [Google Scholar] [CrossRef] [Green Version]
  52. He, L. Numerical modeling of convective erosion and peridotite-melt interaction in big mantle wedge: Implications for the destruction of the North China Craton. J. Geophys. Res. Solid Earth 2014, 119, 3662–3677. [Google Scholar] [CrossRef]
  53. He, L. Thermal regime of the North China Craton: Implications for craton destruction. Earth-Sci. Rev. 2015, 140, 14–26. [Google Scholar] [CrossRef]
  54. Sun, W.D.; Ling, M.X.; Wang, F.Y.; Ding, X.; Hu, Y.H.; Zhou, J.B.; Yang, X.Y. Pacific plate subduction and Mesozoic geological event in eastern China. Bull. Mineral. Petrol. Geochem. 2008, 27, 218–225. [Google Scholar]
  55. Wu, Z.; Hou, X.; Li, W. Discussion on Mesozoic basin patterns and evolution in the eastern North China Block. Geotecton. Metallog. 2007, 31, 385–399. [Google Scholar]
  56. Liu, S.; Gurnis, M.; Ma, P.; Zhang, B. Reconstruction of northeast Asian deformation integrated with western Pacific plate subduction since 200 Ma. Earth-Sci. Rev. 2017, 175, 114–142. [Google Scholar] [CrossRef] [Green Version]
  57. Qi, J.; Yu, F.; Lu, K. Conspectus on Mesozoic basins in Bohai Bay province. Earth Sci. Front. 2003, 10, 199–206. [Google Scholar]
  58. Huang, J.; Zhao, D. High-resolution mantle tomography of China and surrounding regions. J. Geophys. Res. Solid Earth 2006, 111, B9305. [Google Scholar] [CrossRef]
  59. Kusky, T.M.; Windley, B.F.; Wang, L.; Wang, Z.; Li, X.; Zhu, P. Flat slab subduction, trench suction, and craton destruction: Comparison of the North China, Wyoming, and Brazilian cratons. Tectonophysics 2014, 630, 208–221. [Google Scholar] [CrossRef]
  60. Müller, R.D.; Seton, M.; Zahirovic, S.; Williams, S.E.; Matthews, K.J.; Wright, N.M.; Shephard, G.E.; Maloney, K.T.; Barnett-Moore, N.; Hosseinpour, M.; et al. Ocean Basin Evolution and Global-Scale Plate Reorganization Events Since Pangea Breakup. Annu. Rev. Earth Planet. Sci. 2016, 44, 107–138. [Google Scholar] [CrossRef]
  61. Whittaker, J.M.; Müller, R.D.; Leitchenkov, G.; Stagg, H.; Sdrolias, M.; Gaina, C.; Goncharov, A. Major Australian-Antarctic Plate Reorganization at Hawaiian-Emperor Bend Time. Science 2007, 318, 83–86. [Google Scholar] [CrossRef]
  62. Windley, B.F.; Maruyama, S.; Xiao, W.J. Delamination/thinning of sub-continental lithospheric mantle under Eastern China: The role of water and multiple subduction. Am. J. Sci. 2011, 310, 1250–1293. [Google Scholar] [CrossRef] [Green Version]
  63. Qiu, N.; Xu, W.; Zuo, Y.; Chang, J. Meso–Cenozoic thermal regime in the Bohai Bay Basin, eastern North China Craton. Int. Geol. Rev. 2015, 57, 271–289. [Google Scholar] [CrossRef]
  64. Qiu, N.; Zuo, Y.; Xu, W.; Chang, J. Meso-Cenozoic thermal structure of the lithosphere in the Bohai Bay Basin, eastern North China Craton. Geol. J. 2015, 51, 794–804. [Google Scholar] [CrossRef]
  65. Xu, W.; Li, Y.; Cheng, L. Meso-Cenozoic rheological structure of the Linqing Depression: Implications for cratonic destruction. Geol. J. 2021, 56, 1281–1290. [Google Scholar] [CrossRef]
  66. Zhu, R.; Xu, Y.; Zhu, G.; Zhang, H.; Xia, Q.; Zheng, T. Destruction of the North China Craton. Sci. China Earth Sci. 2012, 55, 1565–1587. [Google Scholar] [CrossRef]
  67. Zhang, J.; Zheng, Y.; Zhao, Z. Geochemical evidence for interaction between oceanic crust and lithospheric mantle in the origin of Cenozoic continental basalts in east-central China. Lithos 2009, 110, 305–326. [Google Scholar] [CrossRef]
  68. Niu, Y. Generation and Evolution of Basaltic Magmas: Some Basic Concepts and a New View on the Origin of Mesozoic- Cenozoic Basaltic Volcanism in Eastern China. Geol. J. China Univ. 2005, 11, 9–46. [Google Scholar]
  69. Zheng, J.P.; Sun, M.; Griffin, W.L.; Zhou, M.F.; Zhao, G.C.; Robinson, P.; Tang, H.Y.; Zhang, Z.H. Age and geochemistry of contrasting peridotite types in the Dabie UHP belt, eastern China: Petrogenetic and geodynamic implications. Chem. Geol. 2008, 247, 282–304. [Google Scholar] [CrossRef]
  70. Xu, Y. Diachronous lithospheric thinning of the North China Craton and formation of the Daxin’anling–Taihangshan gravity lineament. Lithos 2007, 96, 281–298. [Google Scholar] [CrossRef]
  71. Zheng, J.P.; Griffin, W.L.; O’Reilly, S.Y.; Yu, C.M.; Zhang, H.F.; Pearson, N.; Zhang, M. Mechanism and timing of lithospheric modification and replacement beneath the eastern North China Craton: Peridotitic xenoliths from the 100 Ma Fuxin basalts and a regional synthesis. Geochim. Cosmochim. Acta 2007, 71, 5203–5225. [Google Scholar] [CrossRef]
  72. Yang, T.; Moresi, L.; Zhao, D.; Sandiford, D.; Whittaker, J. Cenozoic lithospheric deformation in Northeast Asia and the rapidly-aging Pacific Plate. Earth Planet. Sci. Lett. 2018, 492, 1–11. [Google Scholar] [CrossRef]
  73. He, L. Wet plume atop of the flattening slab: Insight into intraplate volcanism in East Asia. Phys. Earth Planet. Inter. 2017, 269, 29–39. [Google Scholar] [CrossRef]
  74. Liu, Q.; He, L.; Chen, L. Tectono-thermal modeling of Cenozoic multiple rift episodes in the Bohai Bay Basin, eastern China and its geodynamic implications. Int. J. Earth Sci. 2018, 107, 53–69. [Google Scholar] [CrossRef]
  75. Chen, Y.; Zhang, Y.; Graham, D.; Su, S.; Deng, J. Geochemistry of Cenozoic basalts and mantle xenoliths in Northeast China. Lithos 2007, 96, 108–126. [Google Scholar] [CrossRef]
  76. Li, S.; Zhao, G.; Dai, L.; Zhou, L.; Liu, X.; Suo, Y.; Santosh, M. Cenozoic faulting of the Bohai Bay Basin and its bearing on the destruction of the eastern North China Craton. J. Asian Earth Sci. 2012, 47, 80–93. [Google Scholar] [CrossRef]
  77. Liu, M.; Cui, X.; Liu, F. Cenozoic rifting and volcanism in eastern China: A mantle dynamic link to the Indo–Asian collision? Tectonophysics 2004, 393, 29–42. [Google Scholar] [CrossRef]
  78. Jiang, S.; Zuo, Y.; Yang, M.; Feng, R. Reconstruction of the Cenozoic tectono-thermal history of the Dongpu Depression, Bohai Bay Basin, China: Constraints from apatite fission track and vitrinite reflectance data. J. Pet. Sci. Eng. 2021, 205, 108809. [Google Scholar] [CrossRef]
  79. Dunkl, I. TRACKKEY: A windows program for calculation and graphical presentation of fission track data. Comput. Geosci. 2002, 28, 3–12. [Google Scholar] [CrossRef] [Green Version]
  80. Hurford, A.; Green, P. The zeta age calibration of fission-track dating. Chem. Geol. 1983, 41, 285–317. [Google Scholar] [CrossRef]
Figure 2. Generalized stratigraphic column of the Linqing Sub-basin (modified from Xu et al., 2020 [20]).
Minerals 11 01176 g002
Figure 3. The relationship between the Tmax (maximum paleo-temperature)/AFT age and depth of the wells GS1, C1, Q3, and W57 in the Linqing Sub-basin. The Tmax of C1 and W57 refer to the Ro data from the close wells Q4 and W146, respectively. Carboniferous (C), Permain (P), Trassic (T), Jurassic (J), Cretaceous (K), Neogene (N), Quaternary (Q), Mesozoic (Mz), Shahejie formation (Es), Dongying formation (Ed).
Minerals 11 01176 g003
Figure 4. Best-fit Gaussian peaks for a composite probability density plot. Trassic (T), Jurassic (J), Cretaceous (K), Shahejie formation (Es4), P1, P2 and P3 are three age groups.
Minerals 11 01176 g004
Figure 5. Age–depth relationship for apatite fission-track ages from the Linqing Depression. (a) Central or pooled ages of apatite fission track. (b) Minimum ages decomposed by BinomFit. The trend line is shown in grey. “T” signs from dots is errors of ages.
Minerals 11 01176 g005
Table 1. Apatite fission-track data from borehole samples in the Linqing Sub-basin.
Sample No.Depth (m)Form.Nρs (105/cm2) (Ns)ρi (105/cm2) (Ni)ρd (105/cm2) (Nd)P(χ2) (%)Age (Ma) (±1σ)L(μm) (n)
GS1-21795T2326.875 (638)21.273 (505)12.42 (7397)1.41121.1 ± 13.111.0 ± 1.16 (131)
GS1-52379.5T2026.33 (359)47.453 (647)12.65 (7397)057.1 ± 8.510.46 ± 1.58 (10)
C1-1 *1593.5K1832.995 (236)28.661 (205)12.14 (7397)11.7103.3 ± 12.511.07 ± 1.39 (104)
C1-2 *1952K2321.604 (735)24.249 (825)12.98 (7397)64.485.6 ± 7.711.24 ± 1.27 (132)
C1-4 *2215.5K2329.604 (501)29.722 (503)12.28 (7397)44.0390.5 ± 8.911.18 ± 1.13 (119)
C1-5 *2428K2332.58 (473)28.172 (409)12.61 (7397)21.15107.7 ± 10.810.24 ± 1.13 (90)
C1-6 *3101T1925.089 (360)42.094 (604)12.09 (7397)13.0753.5 ± 5.49.90 ± 1.20 (53)
C1-7 *3288.6T2223.879 (316)40.277 (533)12.33 (7397)0.0160.1 ± 8.210.01 ± 1.20 (35)
Q3-22396.5K2821.837 (413)18.664 (353)12.23 (7397)27.04105.8 ± 11.010.34 ± 1.16 (58)
Q3-32755K2024.218 (344)27.667 (393)12.37 (7397)0.1484.0 ± 11.210.15 ± 1.18 (15)
Q3-43150K2220.848 (634)19.894 (605)12.56 (7397)0115.6 ± 22.310.68 ± 2.22 (13)
Q3-53311J1722.559 (333)19.443 (287)12.70 (7397)0116.0 ± 26.48.00 ± 2.51 (6)
W57-12824.8Es42029.109 (247)41.365 (351)12.74 (7397)2.2667.7 ± 8.88.69 ± 1.70 (34)
W57-22742Es41927.896 (201)35.529 (256)12.47 (7397)2.4677.0 ± 11.39.14 ± 1.47 (33)
Note: * AFT data refer to Xu et al., 2020 [20]. N, number of confined tracks. L, track length. ρs, ρi, and ρd are the densities of spontaneous, induced and dosimeter tracks, respectively. Ns, Ni, and Nd are the numbers of spontaneous, induced and dosimeter tracks, respectively. P(χ2) is the chi-square probability (Galbraith, 1981 [17]). When P(χ2) > 5%, the pooled age is adopted. When P(χ2) < 5%, the central age is adopted.
Table 2. Apatite fission-track age populations.
SampleDepthDepo Age
(Ma)
TypePeak 1
(Ma)
1S
(±)
Frac.%Peak 2
(Ma)
1S
(±)
Frac.%Peak 3
(Ma)
1S
(±)
Frac.%
Gs1-21795.0211PR---105.311.4/12.877.0215.765.3/92.923.0
Gs1-52379.5238PR41.34.5/5.170.893.121.2/27.320.1261.084.7/124.29.2
C1-11593.580PR58.616.4/22.719.9124.618.2/21.380.1---
C1-21952.0102R---85.67.3/8.0100---
C1-42215.5120R---90.58.3/9.2100---
C1-52428.0131R---101.99.8/10.8100---
C1-63101.0220MR47.85.6/6.376.483.416.9/21.123.6---
C1-73288.6227MR40.85.9/6.954.993.420.3/25.945.1---
Q3-22396.597D---102.210.1/11.2100---
Q3-32755.0118PR70.77.4/8.285.5---277.677.8/107.314.5
Q3-43150.0143PR56.65.9/6.653.3---286.840.9/47.546.7
Q3-53311.0169PR58.67.1/8.163.7---394.871.8/87.236.3
W57-12824.850D55.012.4/1667.2102.740.3/66.032.8---
W57-22742.048D49.210/12.540.3106.419.3/23.559.7---
Notes: Deop Age = depositional age. Peaks 1–3 are age peaks calculated with BinomFit [22] for samples that do not pass P(χ2) at 5%; 1S is the 68% confidence interval for the peak; Frac. (%) is the fraction of the age component in the total single grain age distribution of a sample.
Publisher’s Note: MDPI stays neutral with regard to jurisdictional claims in published maps and institutional affiliations.

