Article

Preliminary Risk Assessment of Dam Failure at the Location of the Cukaru Peki Deposit, Bor (Serbia)

Faculty of Mining and Geology, University of Belgrade, 11060 Belgrade, Serbia
Minerals 2021, 11(10), 1126; https://doi.org/10.3390/min11101126
Submission received: 3 September 2021 / Revised: 30 September 2021 / Accepted: 3 October 2021 / Published: 14 October 2021

Abstract

:
Industrial waste landfills, as evidenced by frequent accidents occurring in recent years, are regarded as one of the most hazardous facilities in the world. For the adequate management of a landfill, risk assessments of dam failures should be performed before operations begin. This paper deals with the preliminary risk assessment used for the tailings and pyrite concentrate storage facilities, as well as the drainage waters reservoir, which are currently at the development and construction stage in the Cukaru Peki deposit located in eastern Serbia. The research was conducted to establish the facts and level of risk at an early stage to allow for timely prevention of potential accidents and bring operational practice in line with design requirements. The annual failure probability was estimated using a semi-empirical method, based on the dam stability factor. While, the framework proposed by the New Zealand Society on Large Dams was applied to assess the consequences of potential failures. The risk was assessed as a function of accident probability and the severity of possible consequences, and a 7 × 7 risk matrix was applied for analysis and evaluation. The level of dam failure risk at the location of the Cukaru Peki deposit was preliminarily assessed as moderate and conditionally tolerable, based on a low estimated probability of accident and a significant severity of consequences. Once the operation of these facilities starts risk assessments should be regularly updated, in order to maintain this level, and in accordance with the current situation, the modelling of specific accident scenarios should be included.

1. Introduction

The process of non-ferrous ore processing generates large amounts of tailings, the reuse of which is very limited and sporadic. Generally, the most common type of tailings management is its permanent disposal, which leads to the formation of many landfills, which in terms of their size, represent one of the largest man-made facilities.
Apart from their size, tailings storage sites are a priori considered as facilities that involve the highest risks due to:
  • High environmental load—dam failure and leakage or escape of wastes, which frequently contain hazardous substances that can lead to permanent environmental pollution, and endanger the lives of the adjacent population; and
  • Fragile stability—the finest fractions of deposited waste material are usually used for embankment filling. While, the construction process runs in parallel with mining operations so that each new layer rests on the previous one, not allowing enough time for consolidation.
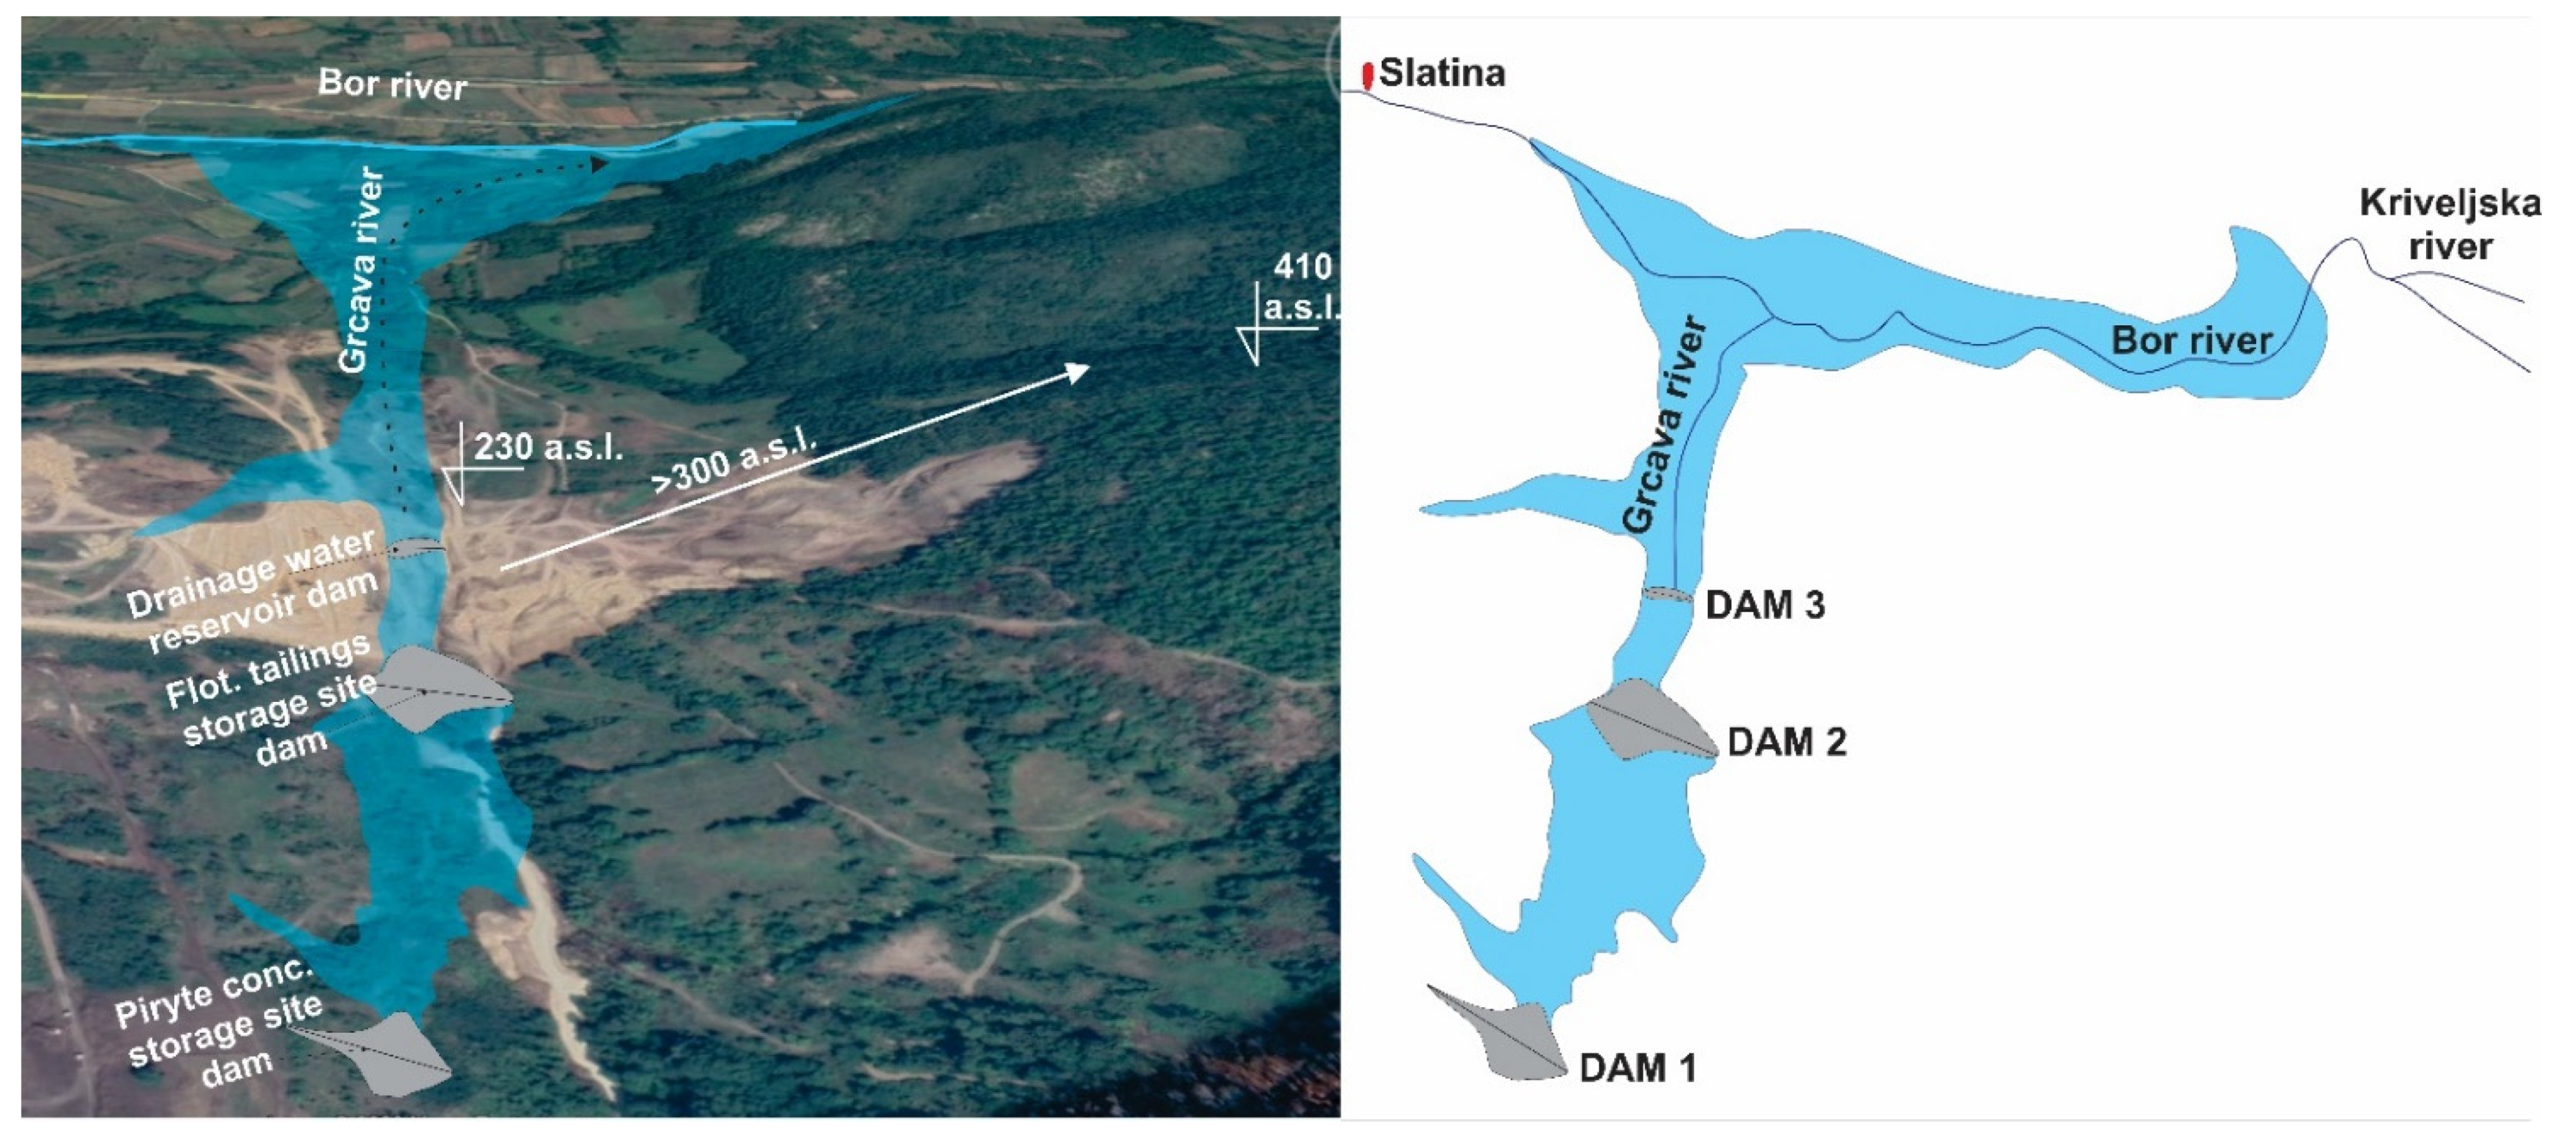
Such claims are evidenced by very frequent dam failures recorded in the past, including those with catastrophic consequences, such as the 1985 Stava tailings dam failure in northern Italy [1], the 1966 dam failure at the flotation tailings facility of the lead and zinc mine Sgurigrad in Bulgaria [2], and the failure of the tailings dam at the iron ore mine complex in Brumadinho, Brazil. The latter incident occurred on 25 January 2019 [3], and destroyed hundreds of lives, causing major environmental damage that has been noticeable to this day. The Baia Mare tailings dam failure which resulted in cyanide spill into rivers (Romania, 2000) [4], and the Aznalcollar tailings dam collapse (Spain, 1988) [5,6] were the main reasons for publishing The Mine Waste Directive (EU Directive 2006/21/EC) [7].
During the design stage, a tailings storage facility is considered a low-risk facility as it is assumed to be designed in accordance with high safety standards and regulatory requirements. However, there is always a certain level of operational risk, in terms of possible accidental situations that may occur during operation [8]. Accidental situations can be minor, such as insignificant operational incidents, e.g., unscheduled downtime of equipment for embankment backfilling, or large-scale accidents during which the dam may break, leak large amounts of waste or cause flooding [9].
For this reason, it is very important to assess the risks associated with tailings storage facilities already at the planning stage, in order to take measures to prevent accidents from the very beginning, and to educate the local population on how to act in emergency situations. The estimated preliminary level of risk is a good basis for future assessments when landfill operations begin.
Studies that examine the risks associated with tailings facilities became topical in the early 1980s, but were largely reduced to the assessment of the risks related to dam failures at water reservoirs and tailings storage facilities [10]. Frequent accidental situations and increasing environmental awareness over the last few years have drawn attention to the fact that, in terms of risk assessment, it is necessary to differentiate between these two types of facilities and to include tailings storage facility risk assessment as an obligation prescribed by law in many countries. Studies on risk assessments during the design stage are almost non-existent both in Serbian and international journals, and preliminary classification of tailings storage facilities according to danger severity is usually based on the size of the designed facility.
The approach that is closest to the procedure for the preliminary risk assessment of a landfill about which there are not sufficient data is a risk screening tool for a large portfolio of landfills. This tool is based on the estimation of accident probability, the population exposed to risk, and the estimation of impact on business operations based on available input data on a landfill, such as service life, climate conditions, accumulation space capacity, also, data on dam type, current dam height, the method of superstructure, geotechnical conditions, liquefaction potential, whether or not technical observations of the dam were carried out regularly, etc. This tool makes it possible to analyze four accident scenarios: Dam instability in static conditions, dam instability in dynamic conditions, leakage and flowing of water over the crest of the dam [11]. This kind of approach is very detailed and all-encompassing. However, when it comes to a landfill in the stage of design and construction, a preliminary risk assessment is the faster and cheaper way to assess risk, with the obligation to update and verify it before the exploitation starts.
When it comes to the risk assessment of water dams, one of the most widely used classifications in practice is the classification of dams according to height and volume, as indicated by the International Commission on Large Dams (ICOLD) [12]. The framework proposed by the US Department of Defence applies the same input parameters for dam classification, and determines three categories of dams-small, medium and large [13]. Somewhat more comprehensive are classifications, which in addition to size, consider the potential environmental hazards that accidents may cause. Therefore, the French Committee for Large Dams proposed three categories of hazards that, based on dam size, determine the level of economic and environmental risk, risk to human life and the scope of potential social unrest [12]. Considering that such classifications are primarily intended for water retention dams, and due to significant differences between water and tailings dams [14,15,16,17], their application in industrial waste landfills shows great limitations, and in such cases, when preliminary risk assessments are made, it is necessary to include more parameters.
In terms of the practice of risk assessment for landfills in Serbia, the only official document that partially refers to this field is the Decree on the conditions and procedure for issuing a permit for waste management, as well as on the criteria, characterization, classification and reporting on mining waste (“Official Gazette of the Republic of Serbia” No. 53/2017). According to this Decree, a mining waste landfill may be classified as category A, where based on risk assessment, there is a possibility of an accident happening in the course of its lifespan or after it is closed down, if the waste that is disposed of at it is characterized as hazardous, or if it contains substances or mixtures that are classified as hazardous [18]. By means of this Decree, the main provisions of the Decree 2006/21/EC were made part of Serbian legislation [7]. The goal of establishing a landfill’s category is to define the policy of protection against accidents. Another official document in Serbian practice which partially refers to landfill risk assessment is “Instructions on the Making of Technical Documentation on the Hydraulic Consequences of Demolition or Dam Failure at Tailing Landfills”, where guidelines are provided for the prevention of accidents and risk management at landfills of this type in the Republic of Serbia [19]. This documentation is actually the investor’s legal obligation, and an integral part of the Project of observation and notification in the area endangered by dam failure.

2. Study Area

This paper aims to assess the preliminary risk of dam failure during the operation of the new copper and gold deposit located in eastern Serbia, which is currently at its design and construction stage.
The Cukaru Peki deposit, one of the richest deposits of copper and gold, is located near the town of Bor in Serbia, and its lifespan is estimated at 13 years with a maximum projected production capacity of 3,300,000 t/year of dry ore [20], as shown in Figure 1.
During deposit exploitation, the construction of four dams is planned to create sufficient storage areas for the disposal of flotation tailings, pyrite concentrate, neutralization mud from the plant for neutralization of acidic wastewater, and for the collection of drainage water. These facilities will be interconnected and located in the valley of the river Grcava, not far from the confluence of the Grcava and Borska rivers, as shown in Figure 2.
The most upstream facility is the neutralization mud disposal site, where the pyrite concentrate storage site is connected, and followed by the flotation tailings storage site further on, which is the largest storage facility at the location in question. The last facility in the series is the drainage water reservoir dam.
For the needs of this paper, the pyrite concentrate storage site, the flotation tailings storage sites and the drainage water reservoir will be analysed as a single facility built of a series of dams with crest elevations at declining altitudes. The neutralization mud disposal site is excluded from risk assessment, as it has a short service life (<1 year). The first year and a half of Mine operation will be a running-in period, and with the production running at reduced capacity, which implies a reduced operation of the neutralization mud disposal site. After this initial period, the neutralization mud will be disposed of into the flotation tailings storage facility. Bearing in mind these facts, it is unlikely that this disposal site will have any impact on accident occurrences. Table 1 shows basic data on dams at the Cukaru Peki deposit site that are subject to risk assessment.
The data in Table 1 show that dam altitudes gradually decline, following the terrain layout, where it may be noticed that the pyrite concentrate storage dam is located at the highest altitude above sea level, while the water reservoir dam is positioned at the lowest elevation point. It is planned to construct stepped earth embankment dams that will reach their maximum elevation during the first stage. In order to ensure multiple environmental protection and accident prevention, the following measures are anticipated [20]:
  • Waterproofing of all landfills with HDPE foils to prevent both surface and groundwater pollution by seepage waters;
  • Construction of a protective concrete channel around the landfills in order to prevent the inflow of torrential water into the landfills;
  • Construction of overflow facilities and sufficiently large flood retention areas as protection against heavy rainfall;
  • Positioning of facilities at a sufficient distance from larger settlements; and
  • Installation of alarm and alert systems to warn the local population in case of dam failure.
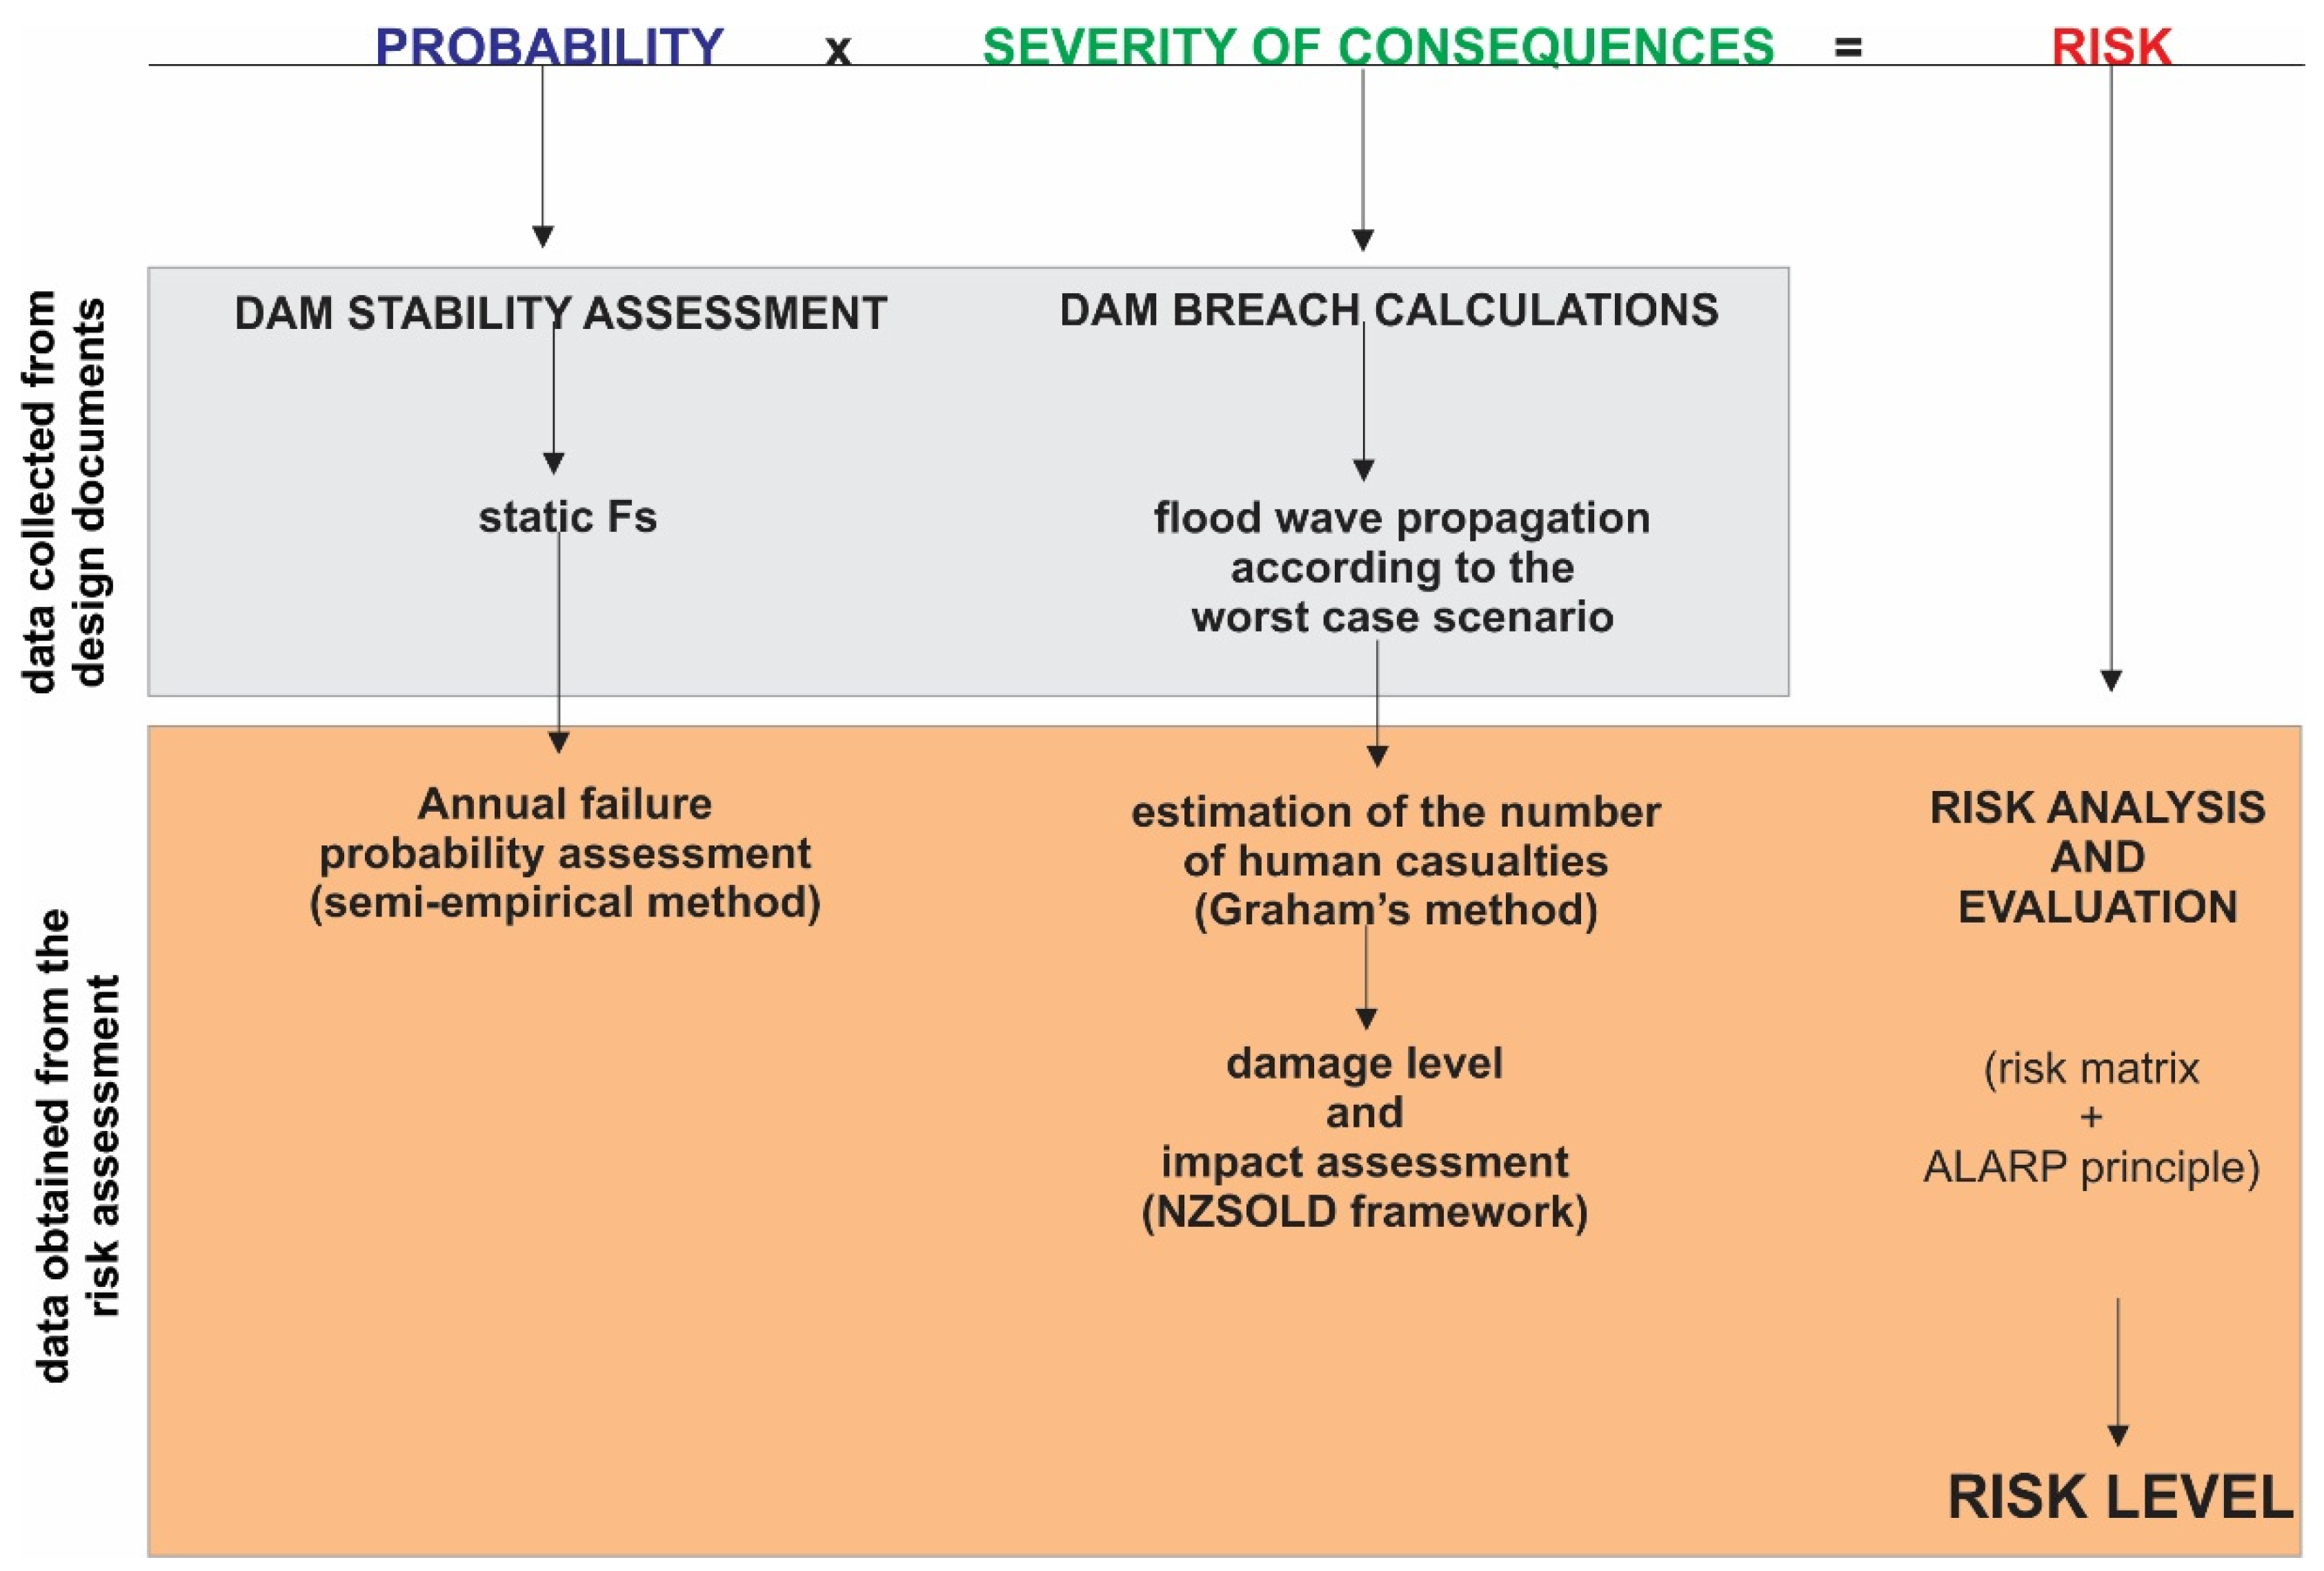
All these facts indicate an initially low risk of operation if proper maintenance of facilities is provided.

3. Methodology

According to the traditional definition, risk is a function of the probability of occurrence of a given threat and the severity of consequences that arise from such occurrence [21,22,23].
As this paper deals with the assessment of dam failure risks at the Cukaru Peki deposit during its operation, the modelling of potential types of accidents is not possible at the design and construction stage. This is a result of the lack of relevant input data on the existing conditions of dams, the found position of the accumulation space, liquefaction potential of the disposed of waste, geomechanical properties of dams, width of the beach, height of the freeboard, etc. For that reason, the following methodology was chosen for preliminary risk assessment:
1.
Estimation of the annual failure probability on the basis of calculated safety factors;
2.
Forecasting of dam failure modes and flood wave spreading according to the worst-case scenarios;
3.
Estimation of dam failure consequences, namely;
(a)
Estimating the number of human casualties;
(b)
Damage level estimates;
(c)
Impact assessment; and
4.
Risk analysis and evaluation using a risk matrix.

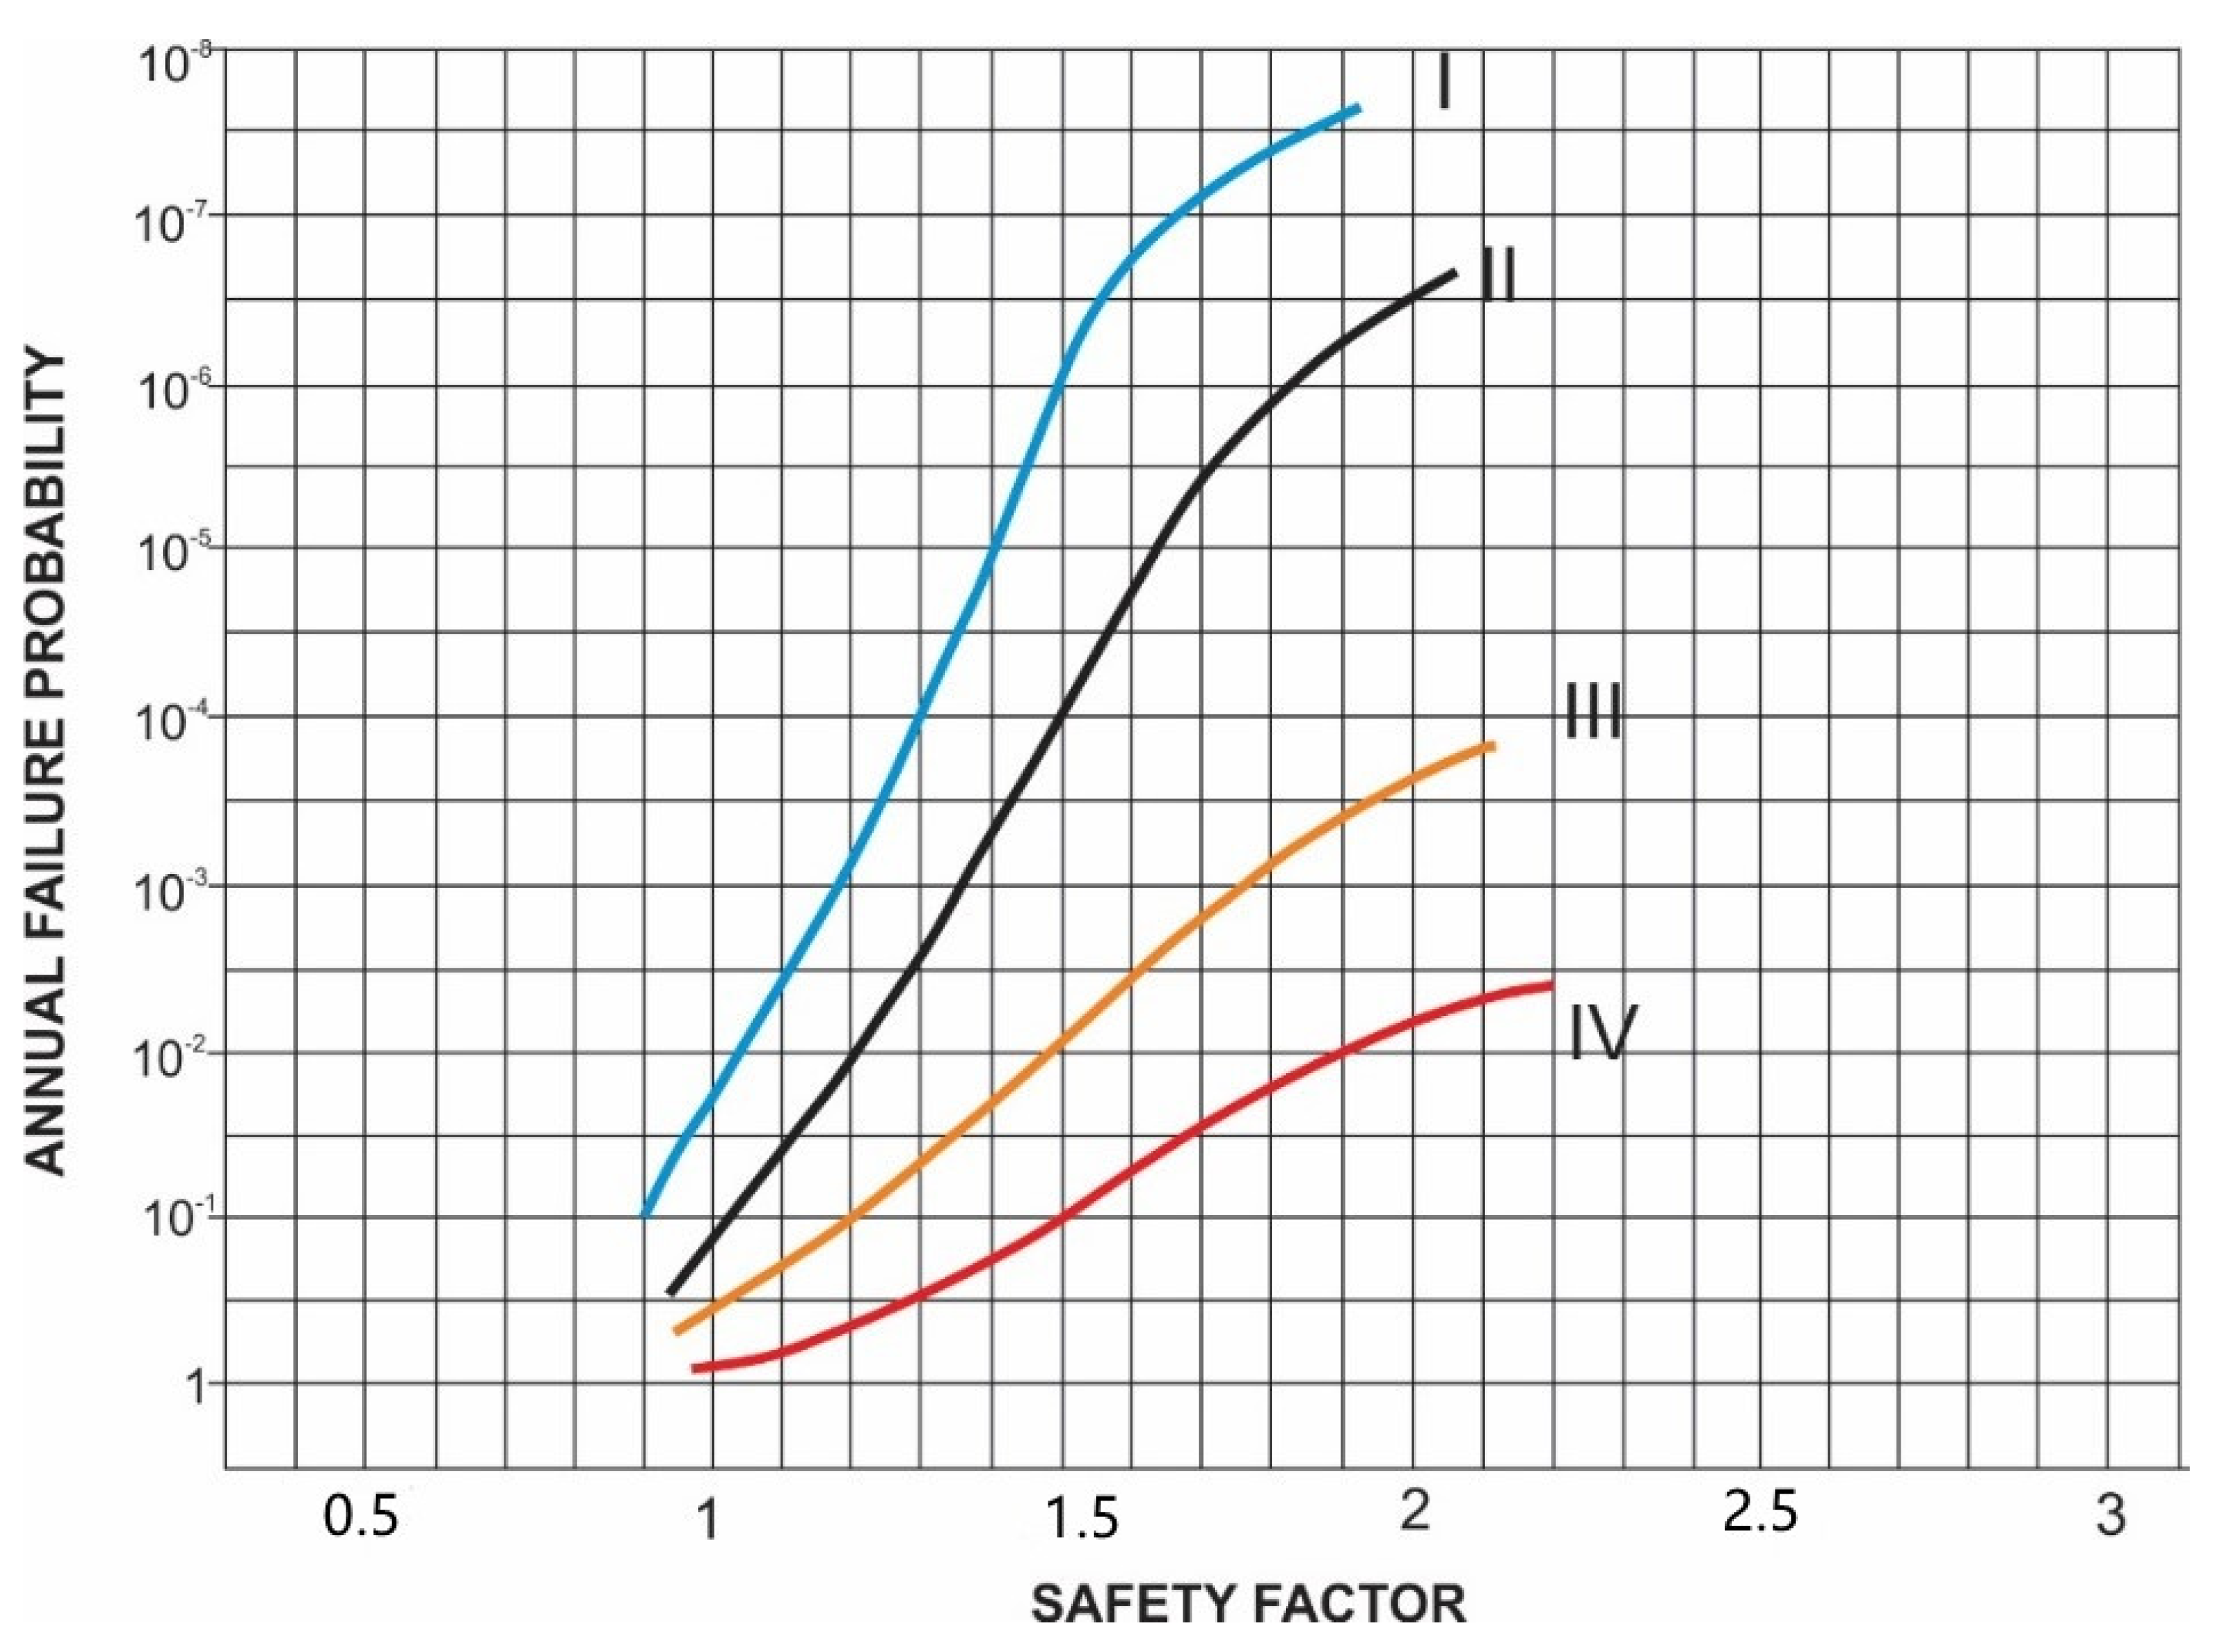
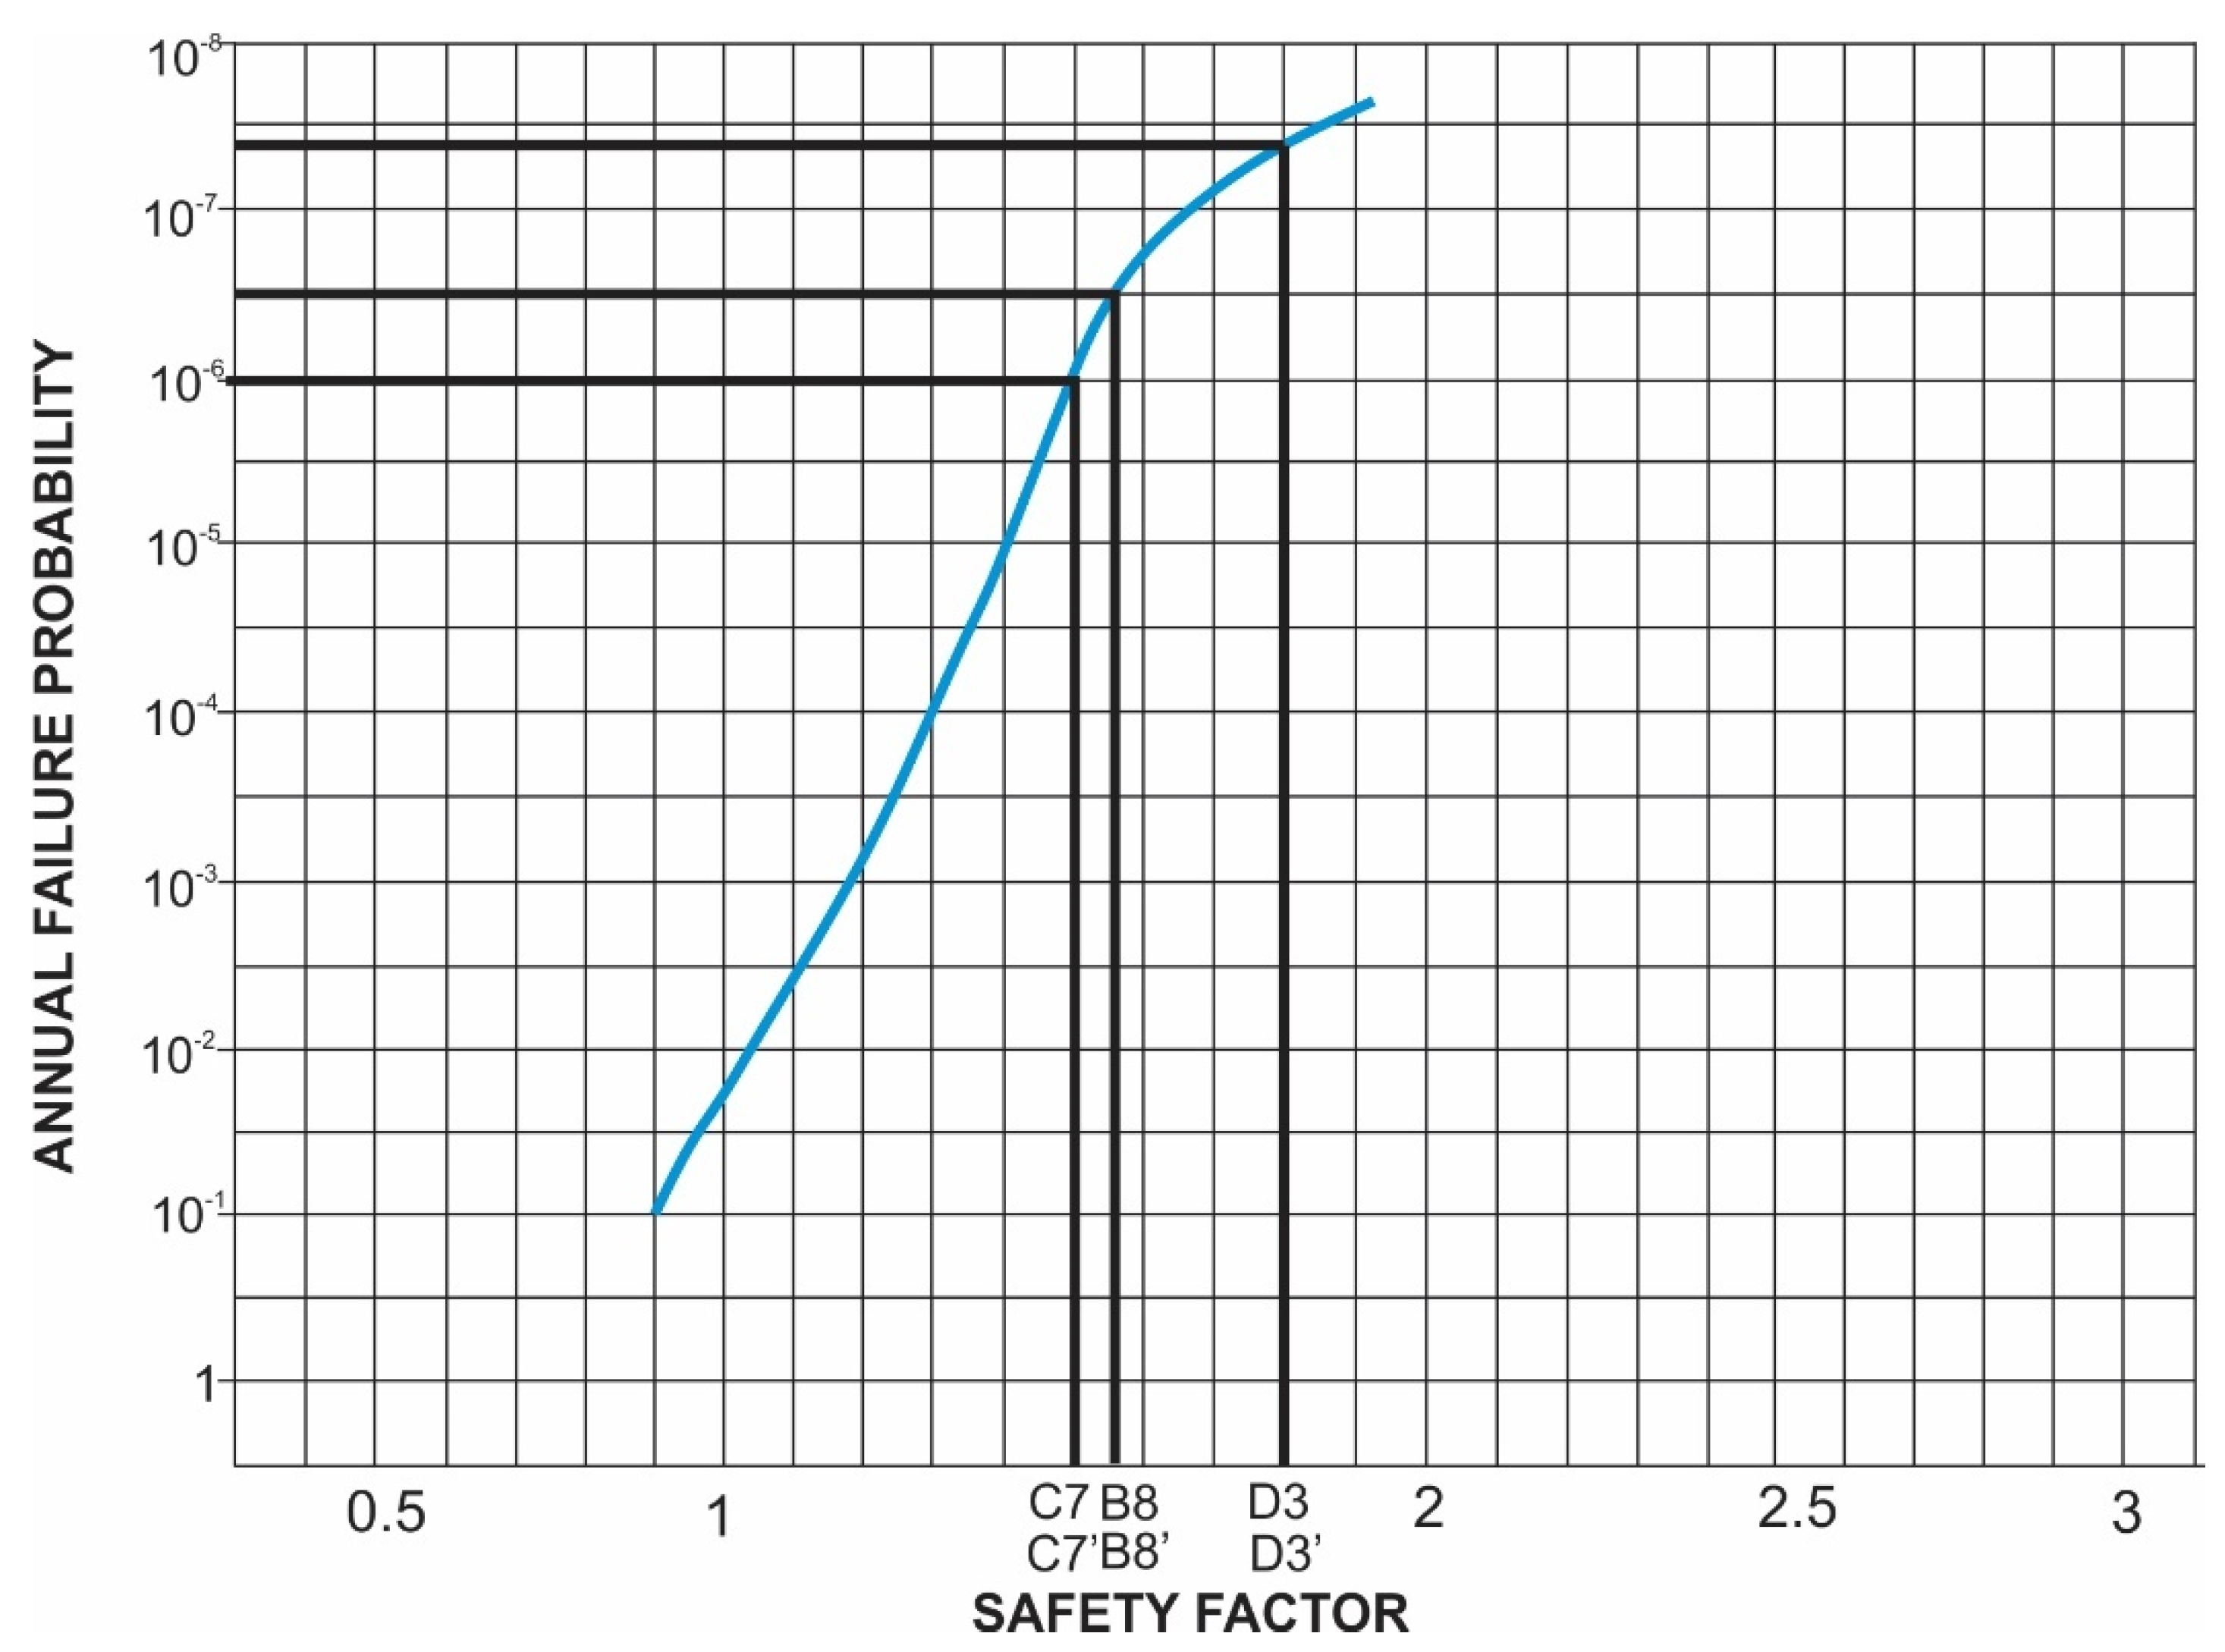
3.1. Estimation of the Annual Failure Probability

A semi-empirical method was chosen to estimate the annual failure probability due to slope instability, which involves estimating the probability based on the static safety factor (Fs). This method proposes the classification of facilities into one of four categories according to the level of supervision, management, and design documents [24]:
1.
Category I—Structures that are paid the greatest possible attention during design, construction and utilisation. Generally speaking, it may be expected that the structures from this category will have significant potential consequences if an accident happens.
2.
Category II—Structures that have been designed, constructed and utilised in accordance with standard engineering procedures. Structures with usual properties belong to this category.
3.
Category III—Structures that have not been designed in accordance with standards. This category includes certain temporary structures or structures with minor potential consequences in case of an accident.
4.
Category IV—temporary structures with little or no engineer support.
Each category is represented in the diagram by the corresponding curve and the annual probability is obtained when the value on the y-axis is read at the intersection of the values of the safety factor (x-axis) and the facility curve, as shown in Figure 3 [24].
Based on thus established criteria, it may be concluded that high-capacity industrial waste landfills, such as copper ore flotation tailings, fall into the first or second category, while certain temporary landfills, like temporary wastewater precipitators, may be classified into categories III and IV. This conclusion arises from the fact that copper ore flotation tailings usually have large dimensions, designed in accordance with the standards, and managed with great responsibility.
For design purposes, dam stability was calculated with the SLIDE v5.0 programme developed by ROCSCIENCE Inc., Toronto, Canada, in conditions of limit equilibrium, according to the Janbu method in static conditions [25]. The obtained safety factors will be used to estimate the annual failure probability due to slope instability.

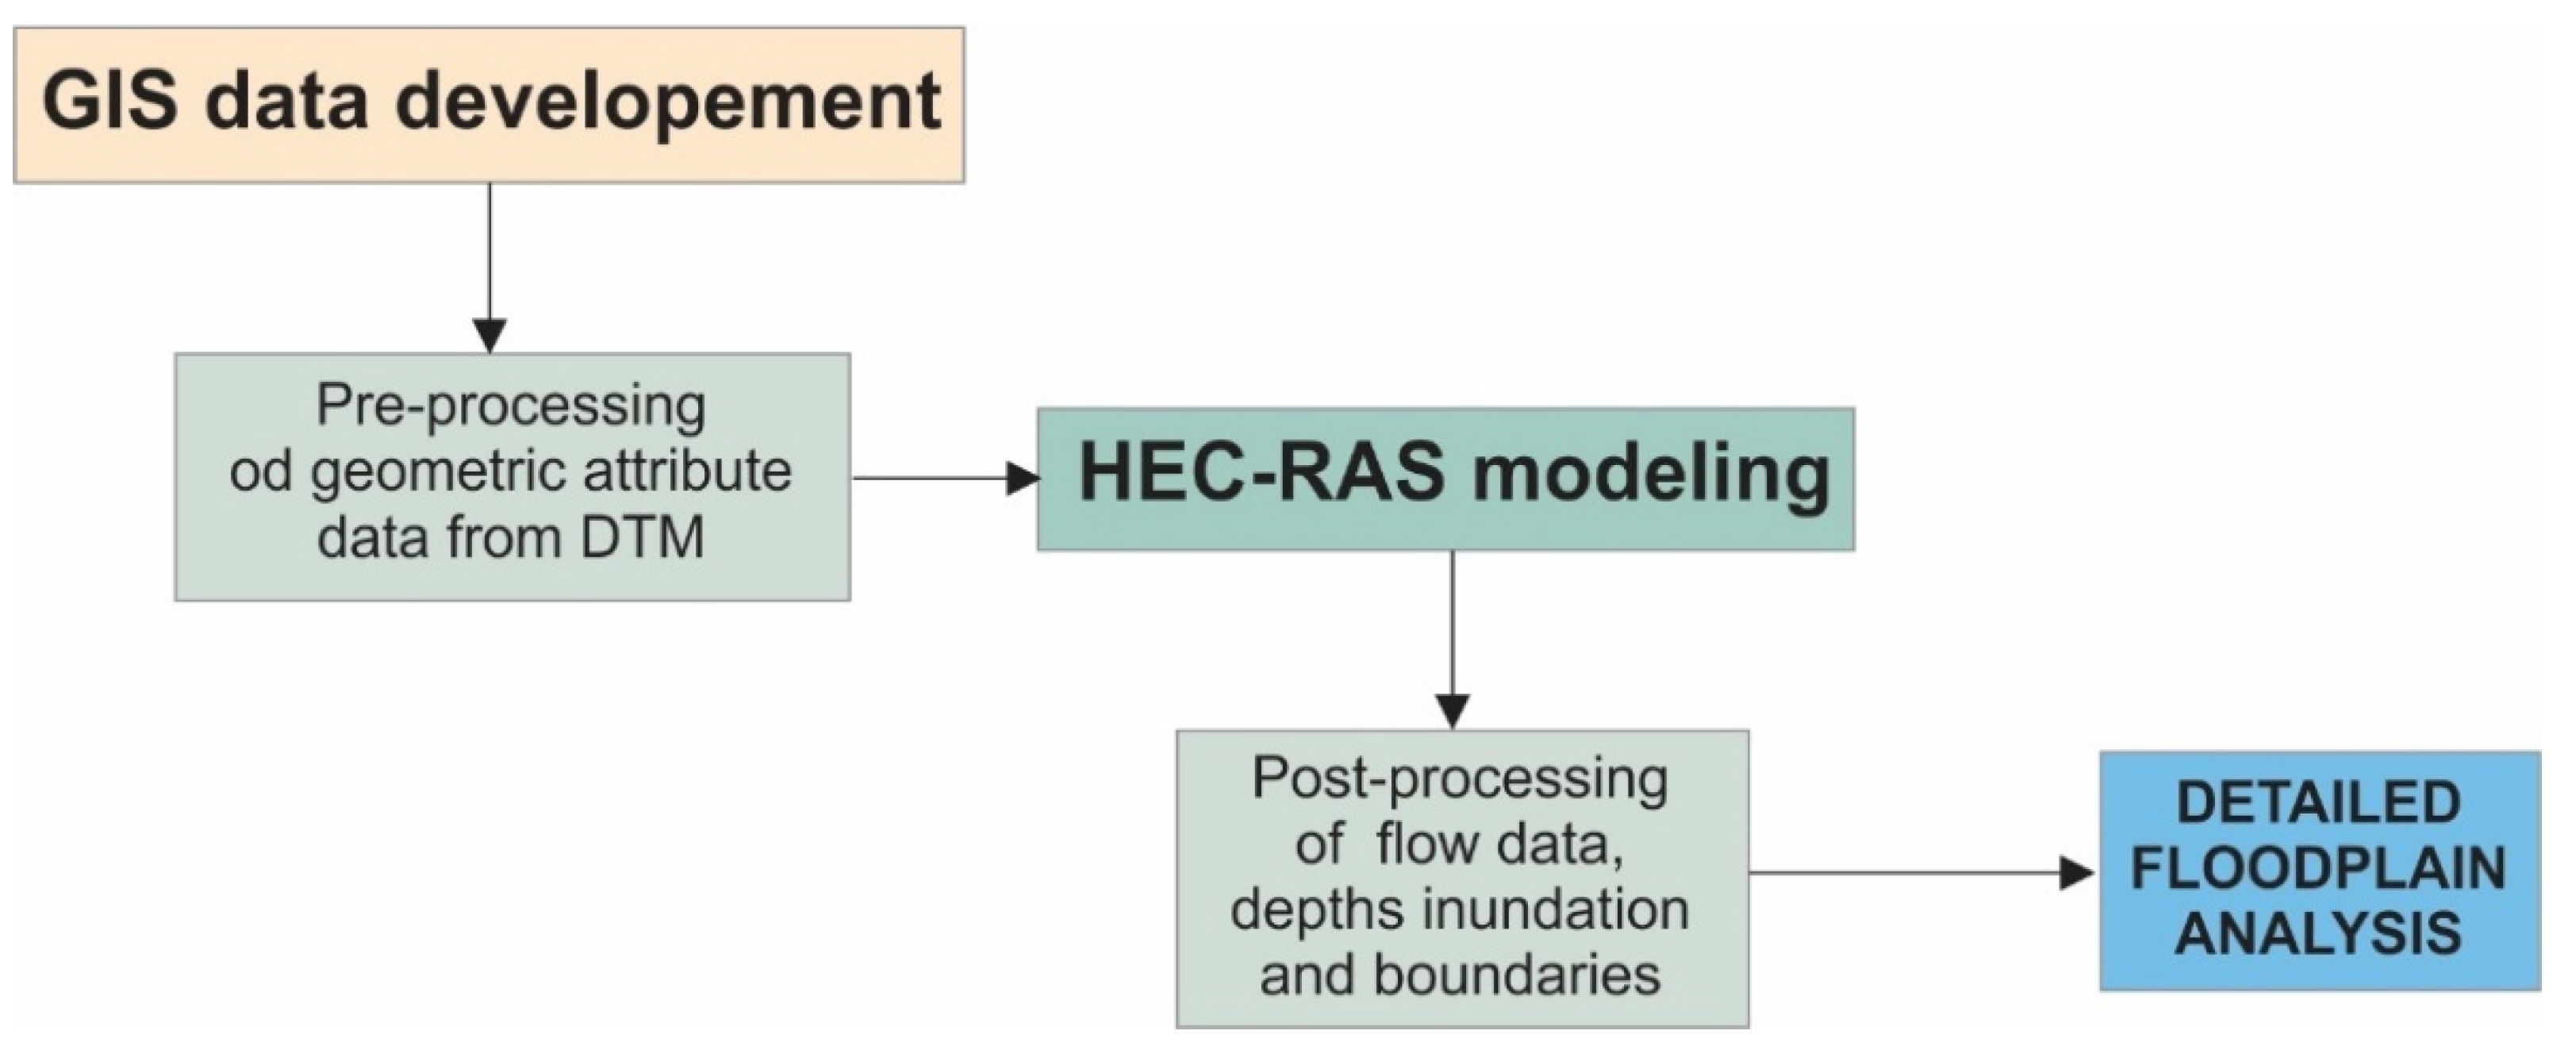
3.2. Forecasting of Dam Failure Modes and Flood Wave Spreading According to the Worst-Case Scenarios

According to the Regulation on the Monitoring and Information System (“Official Gazette of the FRY”—Confidential Gazette No. 54/94) [26], dam breach calculations represent a legal obligation and are an integral part of design documents, thus all data on flood wave propagation in the event of dam failure are available and will be used for this risk assessment. The USACE Hydrological Engineering Canter’s River Analysis System, Version 4.0 (HEC-RAS) program, developed by USACE HEC, Davis, CA, USA, based on hydrodynamic numerical models, was used to calculate dam failure and flood wave propagation [27]. The methodology according to which hydrodynamic calculations were conducted is shown in Figure 4.
Given that the model HEC-RAS is integrated into the GIS environment via its module HEC–GeoRAS, for the pre-processing and post-processing of input data, that is, the results of the calculation, for the complete section of the flood wave, this possibility was used and serves the purpose of generating geometric data on the model [27,28].

3.3. Estimation of Dam Failure Consequences

3.3.1. Estimating the Number of Human Casualties

Graham’s method was chosen to estimate the number of human casualties. This method is based on fixed mortality rates and on the assumption that a flood wave will be certainly formed as a result of dam failure. This method was chosen as the best-suited for this purpose, since it is intended for conventional earth dams, which is the case with the dams at the location of the Cukaru Peki deposit. Three key parameters were used to estimate the mortality rate [29]:
  • Flood severity;
  • Warning time; and
  • Understanding of flood severity.
The values of these parameters, presented in Table 2, were used to obtain the mortality rate, which is then multiplied by the number of people on the flood wave route, thus obtaining the number of potential human casualties in case of dam failure as an output parameter.

3.3.2. Damage Level and Impact Assessment

A framework proposed by the New Zealand Society on Large Dams (NZSOLD) was used to assess the level of damage and the scale or magnitude of accident impact [30]. According to this framework, impact assessment is performed in two stages. In the first stage, the overall damage of an accident is classified into one of four categories, according to the damage to residential buildings, infrastructure, environment and the time required for restoration, as demonstrated in Table 3. After that, based on the adopted level of damage, the population exposed to risk and the number of potential casualties, it will be possible to adopt the class of potential impact, as shown in Table 4. The impact level assessed in this way is assigned an appropriate numerical rank to enable risk evaluation.

3.4. Risk Analysis and Evaluation

The risk matrix is a technique that is in accordance with the IEC: 31010: 2019 standard [31], and thus very successfully applied to risk analysis. Therefore is ideal for preliminary risk assessment as the input risk parameters can be assigned descriptive values and equivalent numerical values [32]. Failure probability values are proposed in the columns, while levels of consequences are given in the rows. By crossing the values of these two parameters, the level of risk can be obtained. In this paper, the 7 × 7 matrix was applied, from which the mean value can be easily extracted, and which provides a large selection of descriptive levels of probability and severity of consequences. In addition to the risk matrix, the As Low As Reasonably Practical (ALARP) principle was used to evaluate the assessed risk, which is based on the assessment of risk acceptability, and according to which every risk outside the zone of broadly acceptable risk and the zone of unacceptable risk belongs to the zone of conditionally acceptable risk, that is, tolerable risk [33,34,35]. A scheme of the risk assessment procedure presented in this paper is given in Figure 5.

4. Risk Assessment and Discussion of Results

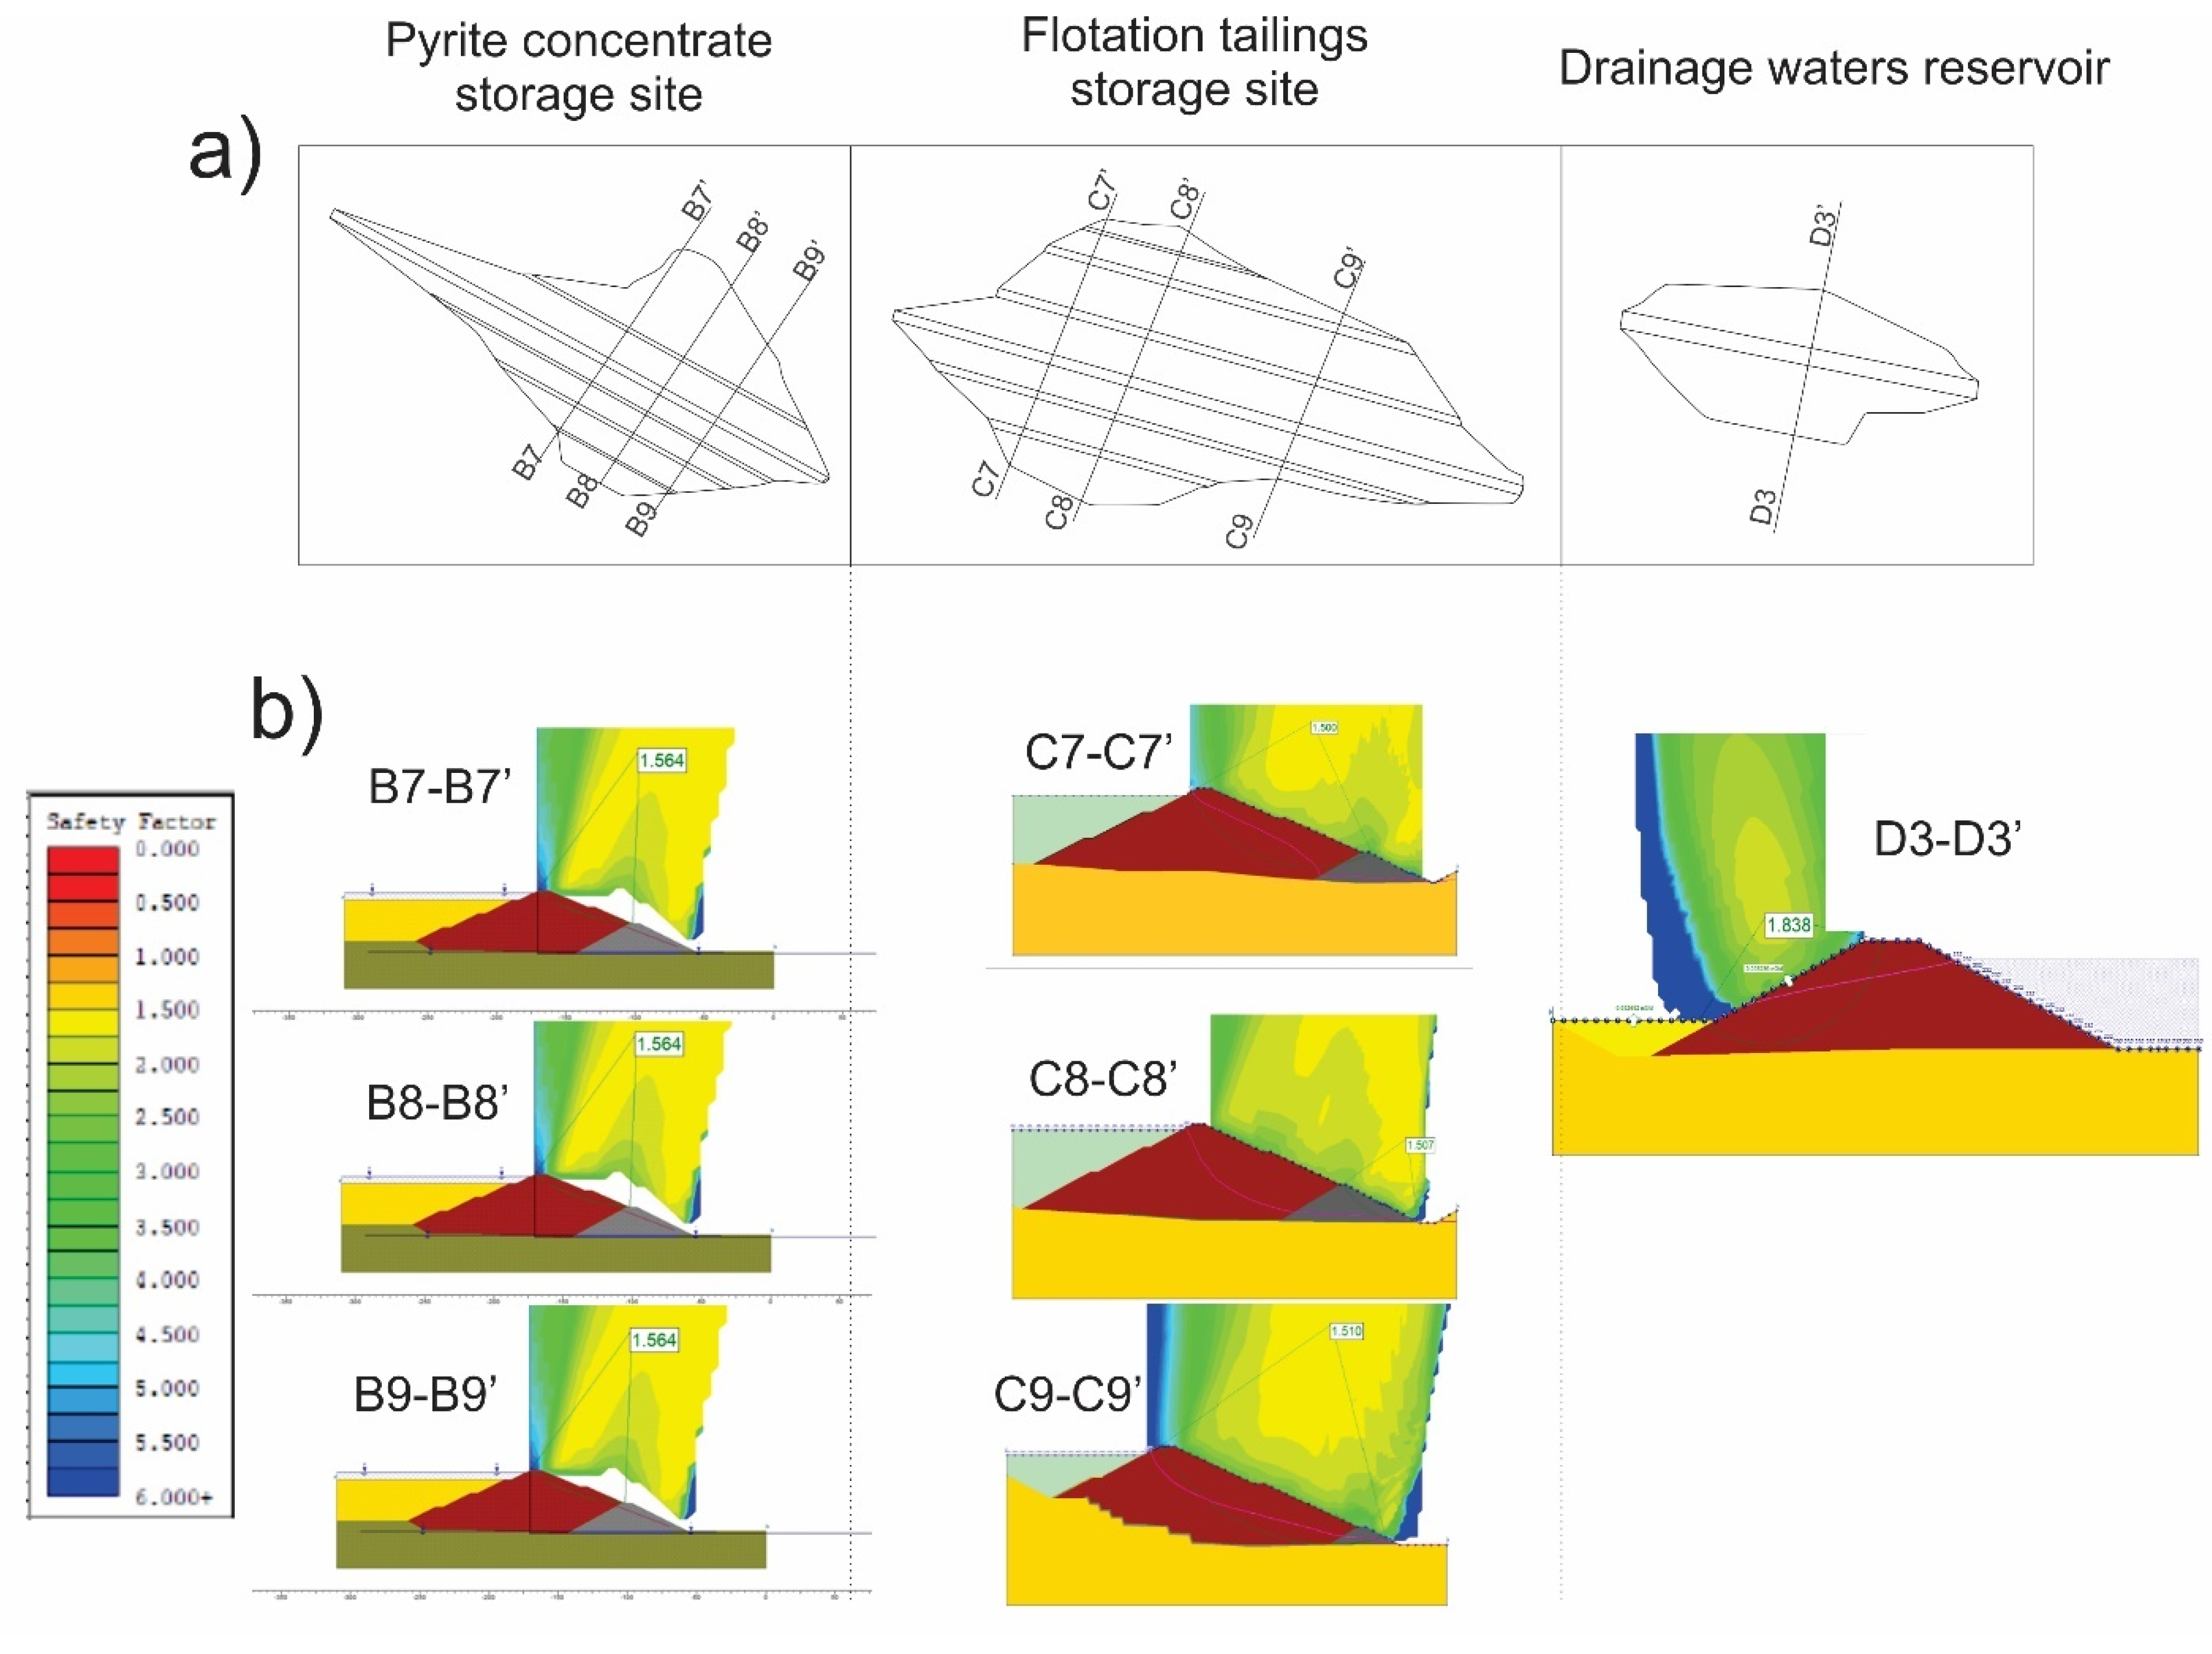
4.1. Annual Failure Probability

Figure 6 shows the profile and cross-section of all the dams used for stability calculations. Table 5 represents the obtained values of the static Fs. It may be noted that if we consider the recommended minimum values of Fs at static load, according to the local SRPS.U.C5.020 standard, all calculated factors are satisfactory.
Based on the proposed facility categories, whose annual failure probability is being considered, the storage sites and the drainage water reservoir at the location of the Cukaru Peki deposit empirically belong to the first category of facilities, given that these are high-capacity facilities and will be managed with great responsibility. If the value of Fs in static conditions is considered for the profile that showed the lowest safety factor of all the analysed ones (profile C7’-C7, flotation tailings dam), according to Figure 7, the highest annual probability of failure due to embankment slope instability is 1 × 10⁻⁶, which is interpreted as a "low" probability with a weight factor of 3, as shown in Table 6.

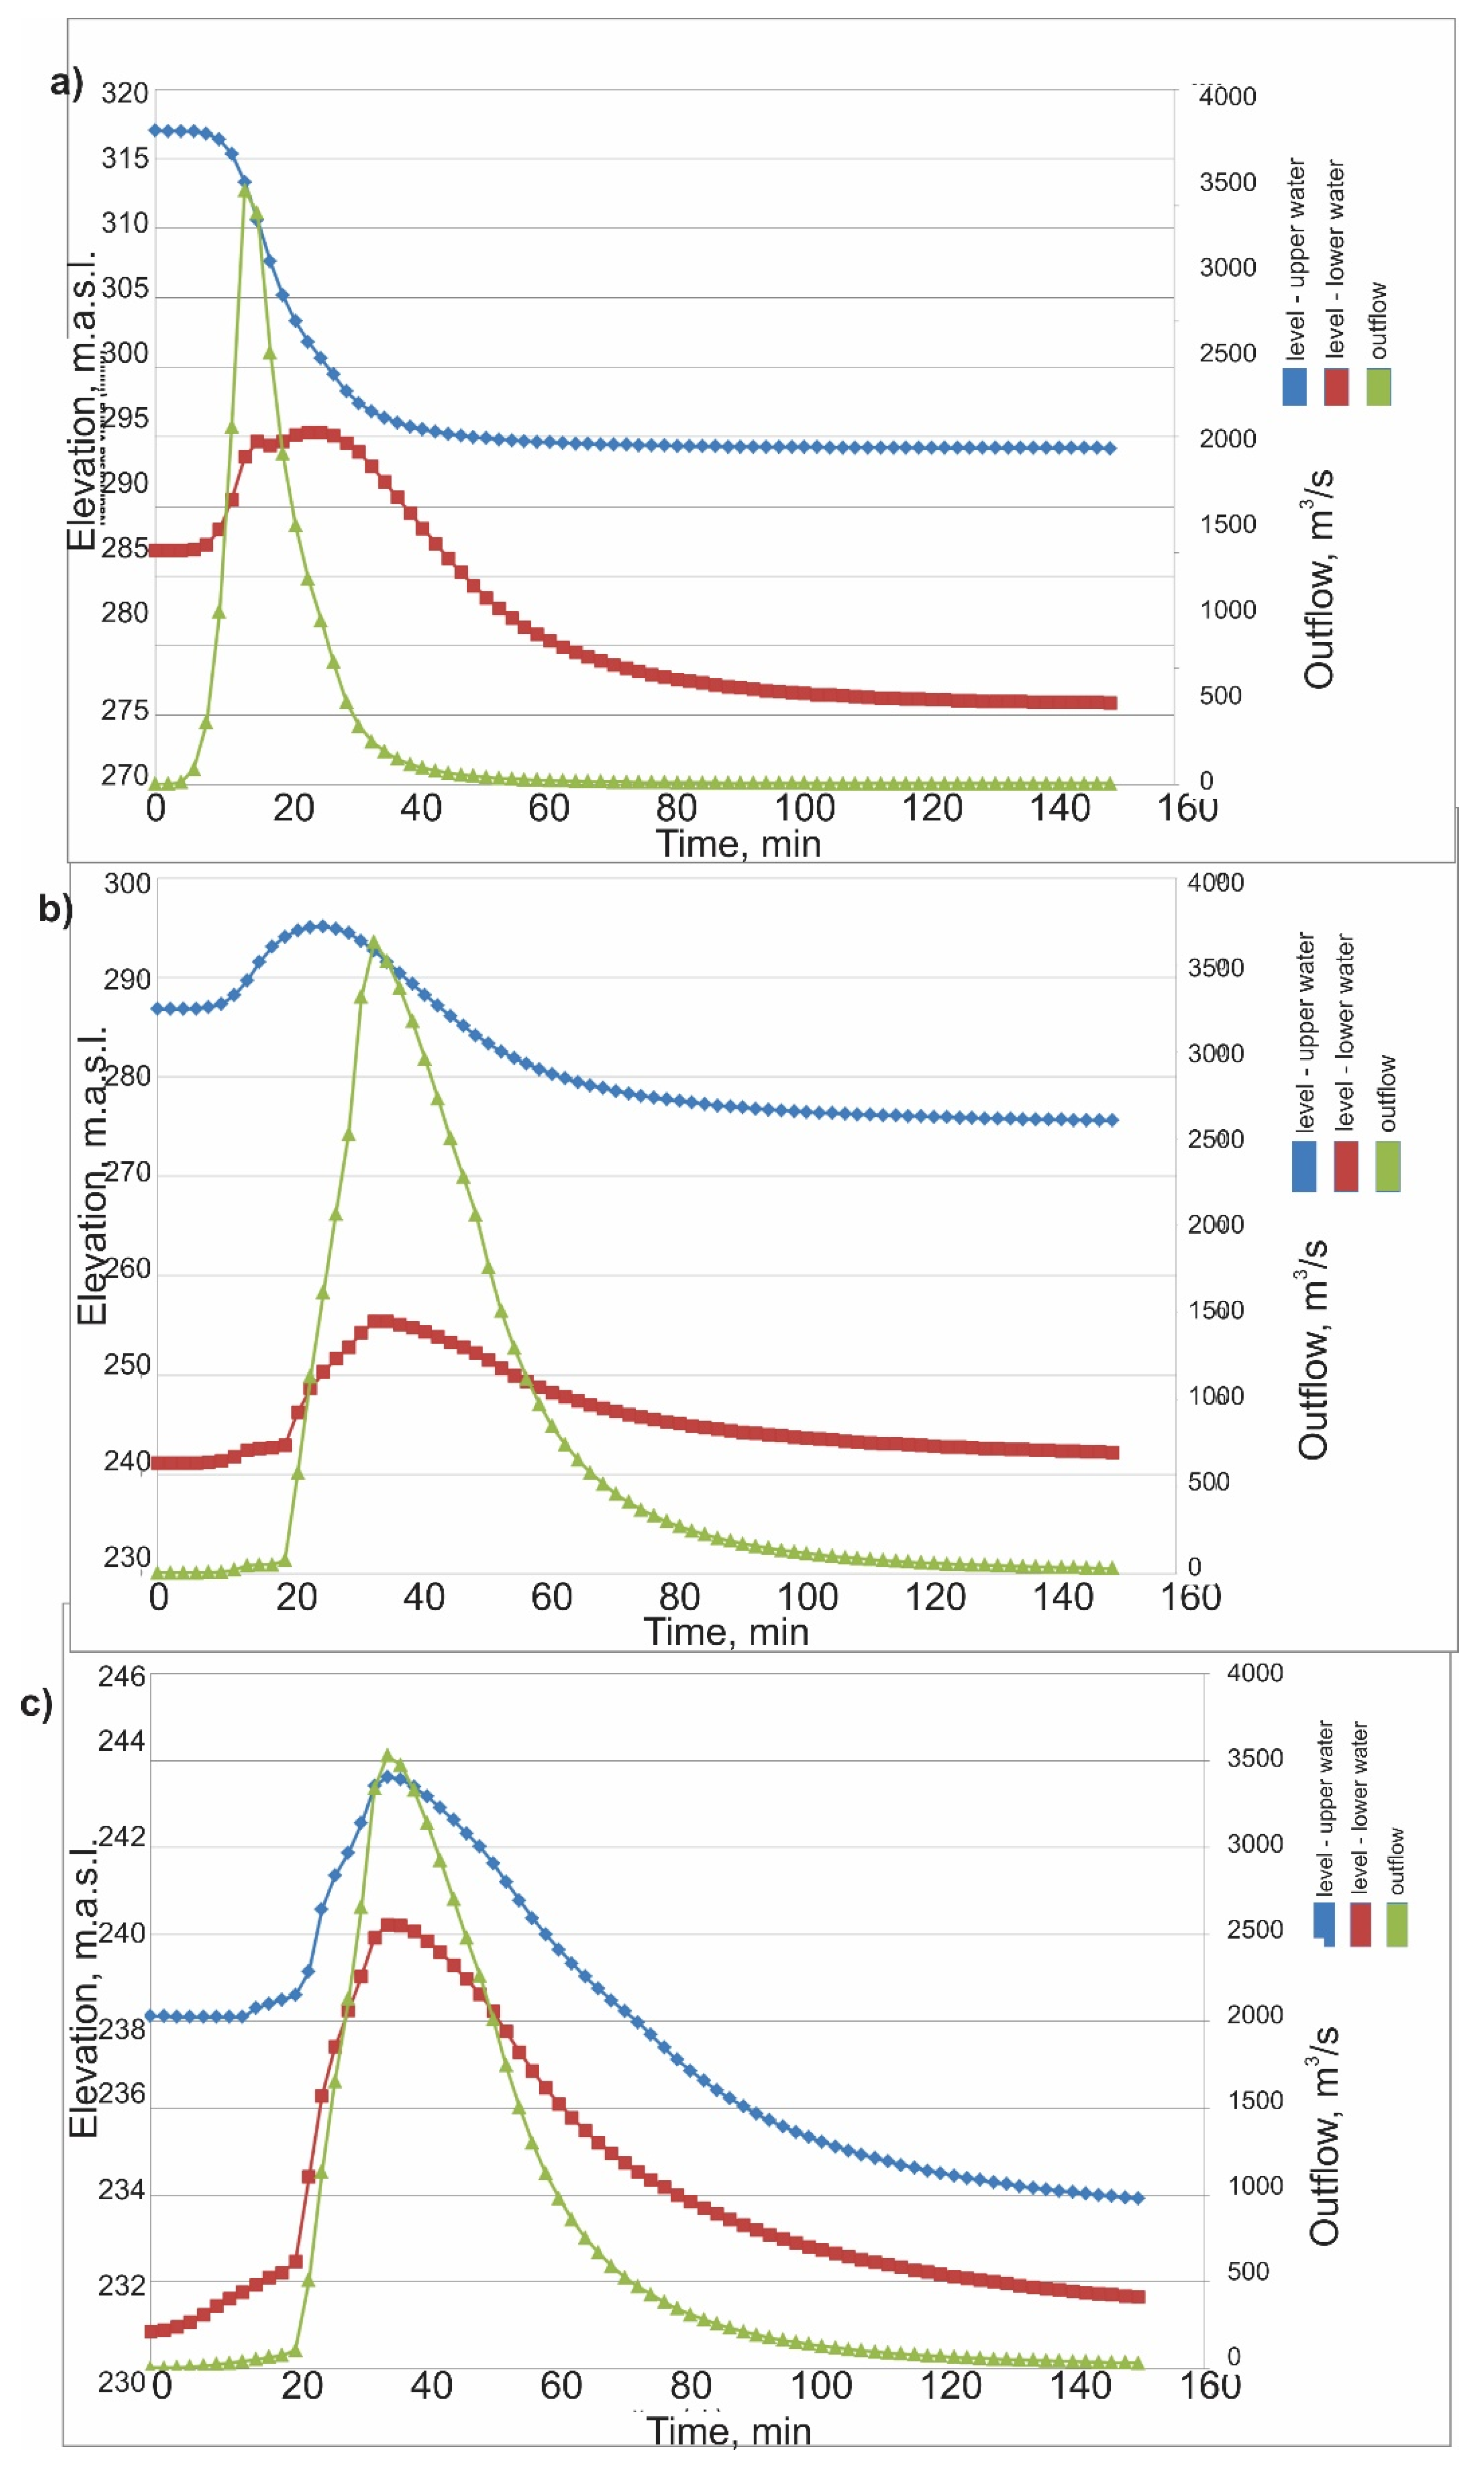
4.2. Prediction of Dam Failure in the Worst-Case Scenario

Taking into consideration the arrangement of the dams and the layout of the terrain, it can be assumed that in a worst-case scenario, a sequential dam failure may occur, namely the failure of all three dams in a series. The breach of the upstream dam initiates the failure of the middle dam, which would subsequently induce the breach of the downstream dam, producing a domino effect.
The calculation of dam breach probabilities shows that the upstream dam, which provides the storage of pyrite concentrate, will break at the moment when the level of accumulated material is at the level of the dam crest (317 m above sea level). The total time needed for complete development of the ultimate dam breach is 30 minutes. Due to the inflow of water from the upstream dam, there is an inevitable increase in water levels in the flotation tailings storage site, and when the level of accumulated material reaches 294 m above sea level, which is the crest level of the flotation tailings dam, the progressive formation of breach through the body of the dam will be initiated. The duration of breach development is about 30 minutes. The breach of the water reservoir dam, which is the downstream dam, begins when the previous two dams are breached and the overflow of the material over the dam occurs. The breach development in this dam, as in the previous two cases, takes 30 minutes. All calculations were made under the assumption that safety spillways work at full capacity [20].
In order to assess the severity of the consequences, it is necessary to predict the characteristics of the flood wave. Using dam breach modelling, it was possible to determine the following facts [20]:
  • The largest spillage of accumulated material would occur from the flotation tailings storage site—5.9 Mm3 (about 70% of the total amount of the tailings disposed of at the storage site);
  • In the event of a breach of the pyrite concentrate dam, 3.78 Mm3 (about 85% of the total amount of the diluted mixture disposed of at the storage site) would flow out, while in the event of breach of the drainage water dam, 15,000 m3 of water would flow out (about 36% of the total volume of water stored in the reservoir);
  • The maximum wave flow occurs immediately after the formation of breach in the dams, after which the wave flow will be less turbulent; and
  • The breach of dams occurs gradually.
Figure 8 shows the hydrographs and levelgrams, which emerge at the cross section of the dam for the pyrite concentrate storage site (dam 1), the flotation tailings dam (dam 2) and the dam for leachate accumulation.
When analyzing Figure 8, where hydrographs and levelgrams at the cross sections of failing dams are shown, it is possible to see the characteristics of the waves appearing at cross sections of the dams on the Grcava river in case of a sequential failure of these dams. Dam 1 fails at the moment t = 0, dam 2 fails consequently at the moment t = 22 minutes, and dam 3 fails at the moment t = 24 minutes. Dam 1 begins to fail at the moment in which the calculations begin, dam 2 begins to fail when the level of water exceeds the level of the dam’s crest, which is 294.00 m above sea level. While dam 3 begins to fail at the moment when the water level exceeds the level of this dam’s crest, which is 238.00 m above sea level. The maximum flow that appears at the intersection of dam 1 is 1583 m3/s, at the intersection of dam 2 it is 3602 m3/s, and at the intersection of dam 3 it is 3525 m3/s. The shape of the obtained diagrams shows that the maximum flows are attained at the moment of the completion of the development of breaches in the bodies of the dams. After that time, the change in waterflow was considerably slighter as it reflects a gradual emptying of the accumulations through the breach with a constant cross section.
At the design stage, it is difficult to predict exactly the amount of material outflow, given that the exact conditions of dams are still unknown, so that the calculated estimates of material outflow must be taken with a grain of salt. Such large quantities of outflow have been recorded in the past, most often in accidents due to liquefaction, while in accidents caused by other types of failures (internal erosion, overtopping, seismic and static instability, etc.), an average of one third of the accumulated material has leaked [37,38,39]. Therefore, in future risk assessments, once the storage facilities start operating and when conditions are created for modelling specific accident scenarios, the question of outflow quantities should be addressed in detail.
Figure 9 shows the anticipated flood wave route with the most critical hydraulic consequences. This route is generally highly expected considering that the wave would have a turbulent flow only in the immediate vicinity of the dam, after which it is likely to expect that the bed of the Grcava river will receive this wave. The wave takes on all the characteristics of its flow according to the one-dimensional flow model and has a laminar flow. After the confluence of the river Grcava and the river Borska, the wave would continue downstream along its course and intensely flood the surroundings until the junction with the Kriveljska river. It is anticipated that the wave would continue to flow in a calmer course, without resistance, all the way to Vrazogrnci. Therefore, the place of the confluence of the Kriveljska and Borska rivers was taken as the downstream border of the flood zone.
On the right bank of the river Grcava, the topography of the terrain shows a slightly hilly relief with altitudes of 300 m above sea level, more to the east, and gentle slopes to the west, as shown in Figure 9. This means that even if the wave had the potential to flow out of the Grcava riverbed, the surface configuration is such that it will direct the flow downstream towards the Borska river.

4.3. Assessment of Consequences Caused by Dam Failure

4.3.1. Estimating the Number of Human Casualties

One of the most important arguments, in favour of the fact that the considered storage sites and the water reservoir can be categorised as low-risk facilities, is their distance from larger settlements. On the flood wave route, there are only a couple of residential houses not far from the confluence of the Grcava and Borska rivers. By a rough analysis of orthophoto images from the geodetic networks of the Republic of Serbia (http://www.geomreze.rgz.gov.rs/) (accessed on 11 July 2021), it is possible to locate about 10 houses with accompanying structures. If we consider that each household has an average of four members, a total of 40 people could be potentially affected by the flood wave. The settlement of Slatina is positioned upstream and at a sufficient distance from the route so that it cannot be considered endangered in any case.
The employees working on construction and maintenance of the reservoir, and landfills should be included in the population group, which is directly exposed to the accident. According to the project design documents, the plan is to employ a total of 16 workers in 4 shifts. Therefore, there will be four workers per each shift [20].
According to Graham’s methodology developed to estimate human casualties, the severity of flood, in the event of dam failure at the Cukaru Peki deposit, can be estimated as “medium” when some of the buildings suffer serious damage, particularly homes, although there remain buildings where people can seek refuge. Bearing in mind that the progression of a dam failure breach may last 30 minutes, that the time elapsed between the formation of a breach in the first dam and the beginning of the formation of a breach in the last of the series of dams, is 24 minutes, and that the wave takes 46 minutes to reach the first endangered houses, it is possible to adopt a warning time of 15–60 min (“some form of warning”).
Since the population exposed to risk includes residents of areas with a rich mining history, as well as the employees of the mine itself who are a priori well-informed about possible accidents and their potential consequences, the understanding of the severity of the flood may be estimated as “complete”. In line with the input parameters adopted in this way, according to Table 2, the average mortality rate is 0.02, i.e., the minimum is 0.005, and the maximum is 0.04. When the adopted mortality rate is applied to the number of persons exposed to risk (44 in total), it may be concluded that in the case of the movement of the wave along the planned route, there would be on average 1 casualty, i.e., the maximum would be fewer than 2 casualties.

4.3.2. Estimating the Level of Damage

Flood wave forecasts show that structures, such as the Bor-Zajecar Highway, are positioned within the flood zone, along with individual residential buildings located in the vicinity of the confluence of the Grcava and Borska rivers. In the event of a dam failure, these facilities would suffer significant damage. There are no other major infrastructure facilities or critical infrastructure facilities, such as hospitals, state administration bodies, national monuments and educational institutions.
In the event of a dam failure, the cost of restoration would be inevitable and would include the restoration of the storage sites, the water reservoir, the local road used to transport machinery, and the tunnels, as well as cleaning the surrounding terrain. The time required for restoration is estimated to be in the order of several months. Besides, in case of dam failure, the mine would suspend operations for a certain period of time until the conditions for safe disposal are created again, which would lead to additional costs.
This area is rich in streams and ravines. All watercourses belong to the basin of the river Veliki Timok. Surface water and groundwater flow into the Brestovacka and Borska rivers, and then into the Veliki Timok, a tributary of the Danube River. It may be noted that in case of a dam breach, among major watercourses, the most susceptible to risk are the rivers Grcava, Borska and Kriveljska. Mine waters from Cerovo, Veliki Krivelj and partly from the Bor Mine flow into the Kriveljska River. After partial treatment, a certain quantity of mine waters from the Bor Mine are discharged into the Borska River. Over time, the Borska River has become one of the most polluted rivers in Serbia, and the land on its banks belongs to the category of hazardous waste [40,41]. According to these facts, these rivers can be considered as "dead" rivers and the damage already caused would be only slightly increased in the event of a dam breach. The quality of water in the river Grcava is good but in the event of a dam breach its quality would be endangered. Groundwater quality is directly related to the quality of surface waters. No significant groundwater sources used for water supply have been recorded in the zone of possible impact on groundwater.
As a result of mining activities, the quality of land has already been degraded. In addition to the Bor mines as the main polluters, the proximity of busy roads also represents a significant source of land degradation. Basically, the land in the vicinity of the deposit itself has a low production capacity where broadleaf forests and pastures are the dominant habitat (oak, ash, and hornbeam forests). Arable land is not intensively cultivated, and judging by the weeds, some fields are abandoned. There are no protected areas at this location. Potential air pollution due to material spillage into the environment may be expected a few days after the accident under the influence of wind and should not generate long-term effects.
Considering the previously stated facts, and in line with the he NZSOLD Damage Assessment Framework, in the event of dam failure at the Cukaru Peki deposit, it can be concluded as follows:
  • Number of residential houses exposed to risk: 10;
  • Damage to critical infrastructure (economy)—“Significant damage to at least one infrastructure facility”;
  • Time required to restore damaged facilities “Up to 3 months”;
  • Environmental damage “significant “; and
  • Time required for restoration “several months”.
The level of damage due to a dam failure at the location of the Cukaru Peki deposit, according to the proposed classification in the Table 3 is "moderate".

4.3.3. Assessing the Extent of Potential Impact

Based on the adopted damage level, the population exposed to risk and the number of human casualties, it was possible to classify the potential impact from the Table 4.
Given that in this case, according to a rough estimate, the population at risk is 44 people, and the previously estimated level of damage is moderate, the potential impact is classified as medium to high. Since the maximum number of human casualties is less than 2, according to Graham’s method, the ultimate level of potential impact to be caused by a dam failure at the location of the Cukaru Peki deposit may be classified as “medium”. The severity of consequences can finally be estimated as rank 4.

4.4. Risk Analysis and Evaluation

According to the risk matrix 7 × 7, shown in Figure 10, and based on a low estimated probability of accident, rank 3, and a significant severity of consequences, rank 4, a moderate risk of rank 12 was obtained, which, according to the ALARP, system belongs to a conditionally acceptable or tolerable risk.

5. Conclusions

It may be concluded that, in the past, human error was the most common cause of all recorded accidents at landfills. Analyses show that accidents at landfills generally occurred due to certain flaws in design, construction or operation [9]. Although a well-designed landfill can be considered as a low-risk facility, this does not mean that it can withstand inadequate operation or management. For that reason, risk assessments should be performed before the operations start, and then regularly updated to duly eliminate all flaws or shortcomings that might have been made during construction or operation, in order to prevent any potential accidents from occurring at an early stage.
In case of the landfills with accumulation at the location of the Cukaru Peki deposit, a preliminary risk assessment was applied, which lay a good foundation for future risk assessments when their utilisation begins. According to one example of a worst-case scenario, the annual probability of failure of all three dams due to static slope instability was estimated as “low”, being rank 3. Based on the route of the flood wave, which is modelled using the HEC-RAS v4.0 software, it was approximately concluded that around 40 people would be exposed to risk, and on average, one person would die, or in other words, in the worst possible case, there would be less than two casualties. The estimated level of risk, which was estimated using the NZSOLD framework is moderate, and this points to a medium-to-high overall potential impact of an accident caused by dam failure (rank 4). According to the risk matrix 7 × 7, the preliminary risk was evaluated as moderate (rank 12), and as such, it may be considered as conditionally acceptable.
When mine operations start, a more detailed risk assessment will require a modelling of more specific dam failure scenarios, in accordance with the observed conditions of the dams and actual conditions of operation, after which it will be possible to assess the probability of occurrence of dam failure and the severity of consequences. Four basic types of dam failures are proposed as the ones with the most frequent occurrence at industrial waste landfills [42]:
  • Liquefaction as the most extreme type of dam failure with the shortest time of manifestation;
  • Dam overtopping when stored material overflows the crest, which usually occurs as the consequence of an extreme inflow of precipitation into the storage site;
  • Seismic instability of slopes due to high shear stress in the dam body; and
  • Internal erosion.
Moreover, the risk assessments should be regularly updated during service life, based on the existing condition of the facilities, and based on changes in environmental conditions. Special attention should be paid to the characteristics of the flood wave, primarily the amount of leaked material and the distance travelled as critical parameters in the process of a realistic assessment of consequences.

Funding

This research received no external funding.

Data Availability Statement

The data presented in this study are available upon request from the corresponding author.

Conflicts of Interest

The author declares no conflict of interest.

References

  1. Luino, F.; De Graff, J.V. The Stava mudflow of 19 July 1985 (Northern Italy): A disaster that effective regulation might have prevented. Nat. Hazards Earth Syst. Sci. 2012, 12, 1029–1044. [Google Scholar] [CrossRef] [Green Version]
  2. Panteleeva, M.; Chamova, R.; Radeva, N.; Romanova, H. Anthropogenic Disasters on Bulgarian Territory: Chemical Accidents on Land and at Sea. J. IMAB–Annu. Proceeding Sci. Pap. 2021, 27, 3718–3722. [Google Scholar]
  3. Rotta, L.H.S.; Alcantara, E.; Park, E.; Negri, R.G.; Lin, Y.N.; Bernardo, N.; Mendes, T.S.G.; Souza Filho, C.R. The 2019 Brumadinho tailings dam collapse: Possible cause and impacts of the worst human and environmental disaster in Brazil. Int. J. Appl. Earth Obs. Geoinf. 2020, 90, 102119. [Google Scholar] [CrossRef]
  4. Kovac, C. Cyanide spill threatens health in Hungary. BMJ Br. Med J. 2000, 320, 536. [Google Scholar] [CrossRef] [Green Version]
  5. Grimalt, J.O.; Ferrer, M.; Macpherson, E. The mine tailings accident in Aznalcollar. Sci. Total Environ. 1999, 242, 3–11. [Google Scholar] [CrossRef]
  6. McDermott, R.K.; Sibley, J.M. The Aznalcóllar tailings dam accident—A case study. Min. Resour. Eng. 2000, 9, 101–118. [Google Scholar] [CrossRef]
  7. Directive 2006/21/EC of the European Parliament and of the Council of 15 March 2006 on the Management of Waste from Extractive Industries and Amending Directive 2004/35/EC—Statement by the European Parliament, the Council, and the Commission. Available online: https://eur-lex.europa.eu/legal-content/EN/TXT/?uri=CELEX%3A32006L0021 (accessed on 18 August 2021).
  8. Government of Western Australia, Department of Mines and Petroleum, Guide to the Preparation of a Design Report for Tailings Storage Facilities (TSFs). Available online: https://www.dmp.wa.gov.au/Documents/Safety/MSH_G_TSFs_PreparationDesignReport.pdf (accessed on 18 August 2021).
  9. Lyu, Z.; Chai, J.; Xu, Z.; Qin, Y.; Cao, J. A comprehensive review on reasons for tailings dam failures based on case history. Adv. Civ. Eng. 2019, 2019, 4159306. [Google Scholar] [CrossRef]
  10. Pytel, W. Risk assessment of mine tailings/waste surface ponds. In Proceedings of the First International Seminar on the Reduction of Risk in the Management of Tailings and Mine Waste, Perth, Australia, 29 September–1 October 2010; pp. 229–242. [Google Scholar]
  11. Singh, R.; Herza, J. Development of a preliminary risk assessment tool for a portfolio of TSFs with limited and uncollated dat—In Sustainable and Safe Dams around the World; CRC Press: Boca Raton, FL, USA, 2019; pp. 3420–3436. [Google Scholar]
  12. International Committee on Large Dams (ICOLD). Small Dams Design, Surveillance, and Rehabilitation–Bulletin No 143; ICOLD: Paris, France, 2011; Available online: https://fdocuments.in/document/icold-small-dams-sept-2011.html (accessed on 28 May 2021).
  13. Department of the Army—Office of the Chief of Engineers, Washington DC. Recommended Guidelines for Safety Inspection of Dams, No. ER 1110-2-106, 26 Sept. 1979. Available online: https://mde.state.md.us/programs/water/DamSafety/Documents/www.mde.state.md.us/assets/document/damsafety/COE/Guidelines%20for%20Safety%20Inspections%20of%20Dams.pdf (accessed on 28 May 2021).
  14. McLeod, H.; Murray, L. Tailings dam versus water dam, what is the design difference? In Proceedings of the ICOLD Symposium on Major Challenges in Tailings Dams, Paris, France, 15 June 2003; International Commission on Large Dams: Paris, France, 2003; Volume 15, p. 12. [Google Scholar]
  15. Jovanovic, M. Problems of Numerical Simulation of Flood Waves Caused by Tailings Dam Failure. In Proceedings of the South Congress, Budva, Montenegro; 1997. [Google Scholar]
  16. Blight, G.E. Geotechnical Engineering for Mine Waste Storage Facilities; CRC Press, Taylor & Francis Group: London, UK, 2009. [Google Scholar]
  17. Dalpatram, A. Estimation of dam break discharges. In Proceedings of the Workshop on Dam Break Analysis Applied to Tailings Dams, Denver, CO, USA, 25 August 2011. [Google Scholar]
  18. Decree on the Conditions and Procedure for Issuing a Permit for Waste Management, as Well as on the Criteria, Characterization, Classification, and Reporting on Mining Waste (Official Gazette No. 53/2017). Available online: https://www.pravno-informacioni-sistem.rs/SlGlasnikPortal/eli/rep/sgrs/vlada/uredba/2017/53/1/reg (accessed on 24 August 2021).
  19. Jovanović, M. Instructions for the Preparation of Technical Documentation on the Hydraulic Consequences of Tailings Dams Failures; Society for Large Dams of Serbia: Belgrade, Serbia, 2005. [Google Scholar]
  20. Mining and Metallurgy Institute Bor (MMI Bor). Detailed Mining Design—Mineral Processing and Disposal of Tailings and Pyrite Concentrate from Cukaru Peki Deposit—Upper Zone; Serbia Zijin Mining doo Bor: Bor, Serbia, 2020. [Google Scholar]
  21. Einstein, H.H. Landslide Risk Assessment Procedure. In Proceedings of the Fifth International Symposium on Landslides, Lausanne, Switzerland, 10–15 July 1988; Bonnard, C., Ed.; Balkema: Rotterdam, The Netherlands, 1988; Volume 2, pp. 1075–1090, ISBN 9061918391. [Google Scholar]
  22. Garatwa, W.; Bollin, C. Disaster Risk Management—A Working Concept. Deutsche Gesellschaft für Technische Zusammenarbeit (GTZ), Eschborn. 2002. Available online: http://www2.gtz.de/dokumente/bib/02-5001.pdf (accessed on 17 June 2021).
  23. Robertson, A.; Shaw, S. Failure Modes & Effects Analysis (FMEA). Infomine, Vancouver. 2003. Available online: http://generalpurposehosting.com/guides/http%20%20%20technology.infomine.com%20enviromine%20Issues%20cls_FMEA.pdf (accessed on 17 June 2021).
  24. Silva, F.; Lambe, T.W.; Marr, W.A. Probability and risk of slope failure. J. Geotech. Geoenviron. Eng. 2008, 134, 1691–1699. [Google Scholar] [CrossRef] [Green Version]
  25. Rocscience Inc. SLIDE 5.0, 2D Limite Equilibrium Slope Stability Analysis. Available online: www.roscience.com (accessed on 21 August 2021).
  26. Regulation on the Monitoring and Information System, Special Issue No. 1. 1990; “Official Gazette of the SRS”, National Assembly of the Republic of Serbia, Serbia.
  27. US Army Corps of Engineers, HEC-GeoRAS, GIS Tools for Support of HEC-RAS Using ArcGIS, Version 4, User’s Manual, Hydrologic Engineering Center, Davis, USA. Available online: https://www.hec.usace.army.mil/software/hec-georas/documentation/HEC-GeoRAS4_UsersManual.pdf (accessed on 24 August 2021).
  28. Ackerman, C.T. HEC-GeoRAS: Linking GIS to hydraulic analysis using ARC/INFO and HEC-RAS. In Hydrologic and Hydraulic Modeling Support with Geographic Information Systems; US Army of Corps: Davis, CA, USA, 2000. [Google Scholar]
  29. Graham, W.J. Risk-Based Dam Safety Prioritization—A Method for Easily Estimating the Loss of Life from Dam Failure, Draft; U.S. Department of Interior Bureau of Reclamation Dam Safety Office: Denver, CO, USA, 1999. Available online: https://www.usbr.gov/ssle/damsafety/TechDev/DSOTechDev/DSO-99-06.pdf (accessed on 28 May 2021).
  30. MBIE, Impact Summary: Regulatory Framework for Dam Safety, Ministry of Business, Innovation and Employment (MBIE), New Zealand. 2021. Available online: https://www.mbie.govt.nz/dmsdocument/13916-impact-summary-regulatory-framework-for-dam-safety-proactiverelease-pdf (accessed on 23 September 2021).
  31. Institute for Standardization of Serbia. Risk Management—Risk Assessment Techniques; SRPS EN IEC 31010:2019; European Standard: Belgrade, Serbia, 2019. [Google Scholar]
  32. Garvey, P.R.; Lansdowne, Z.F. Risk matrix: An approach for identifying, assessing, and ranking program risks. Air Force J. Logist. 1998, 22, 18–21. [Google Scholar]
  33. Working Group. The Tolerability of Risk from Nuclear Power Stations; No. CB (2)1635/11-12(01); Health and Safety Executive (HSE): London, UK, 1992. [Google Scholar]
  34. Jones-Lee, M.; Aven, T. ALARP—What does it really mean? Reliab. Eng. Syst. Saf. 2011, 96, 877–882. [Google Scholar] [CrossRef]
  35. Pike, H.; Khan, F.; Amyotte, P. Precautionary principle (PP) versus as low as reasonably practicable (ALARP): Which one to use and when. Process. Saf. Environ. Prot. 2020, 137, 158–168. [Google Scholar] [CrossRef]
  36. Institute for Standardization of Serbi. Dams—Technical Requirements for Design; SRPS.U.C5.020:1980; Pure National Standard: Belgrade, Serbia, 1980. [Google Scholar]
  37. Rico, M.; Benito, G.; Diez-Herrero, A. Floods from tailings dam failures. J. Hazard. Mater. 2008, 154, 79–87. [Google Scholar] [CrossRef] [PubMed] [Green Version]
  38. Concha Larrauri, P.; Lall, U. Tailings Dams Failures: Updated Statistical Model for Discharge Volume and Runout. Environments 2018, 5, 28. [Google Scholar] [CrossRef] [Green Version]
  39. Quelopana, H. Released Volume Estimation for Dam Break Analysis. Tailings Manag. 2019, 6, 1–12. [Google Scholar]
  40. Avramović, L.; Stevanović, Z.; Bugarin, M.; Jonović, R.; Marković, R.; Gardić, V.; Jonović, M.; Đorđević, J. Characterization of soil in the coastal area of the Bor River abstract. Zaštita Materijala 2016, 57, 378–382. [Google Scholar] [CrossRef] [Green Version]
  41. Milijasevic, D.; Milanovic, A.; Brankov, J.; Radovanovic, M. Water quality assessment of the Borska Reka River using the WPI (water pollution index) method. Arch. Biol. Sci. 2011, 63, 819–824. [Google Scholar] [CrossRef]
  42. Taguchi, G. Fault Tree Analysis of Slurry and Dewatered Tailings Management—A Framework. Ph.D. Dissertation, University of British Columbia, Vancouver, BC, Canada, 2014. [Google Scholar]
Figure 1. Map of Serbia with the location of the Cukaru Peki deposit (not to scale).
Minerals 11 01126 g001
Figure 2. Outline of the Cukaru Peki deposit with its immediate surroundings (scale 1:10,000).
Minerals 11 01126 g002
Figure 3. The method for the evaluation of annual failure probability [24]. Reproduced with permission from publisher Journal of Geotechnical and Geoenvironmental Engineering, F. Silva, T. W. Lambe, W. A. Marr, Probability and risk of slope failure. Journal of Geotechnical and Geoenvironmental Engineering 2008, Vol. 134, No. 12, pp. 1691–1699.
Minerals 11 01126 g003
Figure 4. A general diagram of the course of calculation organization.
Minerals 11 01126 g004
Figure 5. The scheme of the preliminary risk assessment procedure.
Minerals 11 01126 g005
Figure 6. Results of stability analysis: (a) Position of the profiles used for stability analysis and (b) cross-sections of the dams [20]. Reproduced with permission from author and publisher Mining and Metallurgy Institute Bor (MMI Bor), Serbia Zijin Mining doo Bor, Detailed Mining Design—Mineral Processing and Disposal of Tailings and Pyrite Concentrate from Cukaru Peki Deposit—Upper Zone, Bor, 2020.
Minerals 11 01126 g006
Figure 7. Functional dependence of safety factors and annual failure probability according to the semi-empirical method [24]. Reproduced with permission from publisher Journal of Geotechnical and Geoenvironmental Engineering, F. Silva, T. W. Lambe, W. A. Marr, Probability and risk of slope failure. Journal of Geotechnical and Geoenvironmental Engineering 2008, Vol. 134, No. 12, pp. 1691–1699.
Minerals 11 01126 g007
Figure 8. Flow and stage hydrographs: (a) dam 1, (b) dam 2, (c) dam 3 [20]. Reproduced with permission from author and publisher Mining and Metallurgy Institute Bor (MMI Bor), Serbia Zijin Mining doo Bor, Detailed Mining Design—Mineral Processing and Disposal of Tailings and Pyrite Concentrate from Cukaru Peki Deposit—Upper Zone, Bor, 2020.
Minerals 11 01126 g008
Figure 9. Route of the flood wave outlined on the basis of the blue zone obtained with HEC-RES software; on the left side: A display of topography of the terrain along which the flood wave moves, from the starting point of the flood wave; on the right side: A drawing of the flood zone, viewed from above, not to scale [20]. Reproduced with permission from author and publisher Mining and Metallurgy Institute Bor (MMI Bor), Serbia Zijin Mining doo Bor, Detailed Mining Design—Mineral Processing and Disposal of Tailings and Pyrite Concentrate from Cukaru Peki Deposit—Upper Zone, Bor, 2020.
Minerals 11 01126 g009
Figure 10. 7 × 7 risk matrix.
Minerals 11 01126 g010
Table 1. Dimensions of the disposal sites and of the reservoir [20]. Reproduced with permission from author and publisher Mining and Metallurgy Institute Bor (MMI Bor), Serbia Zijin Mining doo Bor, Detailed Mining Design–Mineral Processing and Disposal of Tailings and Pyrite Concentrate from Cukaru Peki Deposit–Upper Zone, Bor, 2020.
DamLevel of Upbuild, m a.s.l.Height, mBackfilling Level of Accumulation Area, m a.s.l.Volume‚ × 103 m3Volume of Settling Pond, m3Service Life, Years
Pyrite concentrate storage site31745315443131,40012.5
Flotation tailings storage site29459292967231,40011
Drainage waters reservoir233623241doesn’t exist12
Table 2. Proposed mortality rates for the calculation of potential human casualties in the event of dam failure [29]. Reproduced with permission from publisher Bureau of Reclamation Dam Safety Office Denver, Colorado, A Procedure for Estimating Loss of Life Caused by Dam Failure, U.S. Department of Interior, Bureau of Reclamation Dam Safety Office Denver, Colorado, September 1999.
Severity of FloodWarning Time (min)Understanding of Flood SeverityMortality Rate
(Human Casualty Rate)
AverageRange
LargeWithout warningnot applicable0.750.3–1.00
15 to 60incomplete
complete
* No suitable data
More than 60Incomplete
complete
MediumWithout warningNA0.150.03–0.35
15 to 60Incomplete0.050.01–0.08
Complete0.020.005–0.04
More than 60Incomplete0.030.005–0.06
Complete0.010.002–0.02
SmallWithout warningNA0.010–0.02
15 to 60Incomplete0.0070–0.015
Complete0.0020–0.004
More than 60Incomplete0.00030–0.0006
Complete0.00020–0.0004
Table 3. Determination of assessed damage levels by [30] is licensed under CC BY 4.0.
Damage LevelResidential
Houses
Infrastructure 1EnvironmentTime Required for Restoration
DamageTime Required to Restore to Operation 2
Catastrophic>50 houses destroyed 3Extensive damage to several major infrastructure facilities>1 year.Extensive damageMany years
Major4–49 houses destroyed and a number of houses damagedExtensive damage to more than one infrastructure facilityUp to 1 year.Significant damage and high costs of restorationSeveral years
Moderate1–3 houses
destroyed and
some damaged
Significant damage to at least one infrastructure facilityUp to 3 monthsSignificant damage but easily recoverableSeveral months
MinimalMinor damageMinor damage to major infrastructure facilitiesUp to 1 weekShort-term damageFrom several days to several weeks
1 Includes facilities such as power supply transmission lines, transportations systems, telocommunication facilities, wastewater treatment facilities, fire stations, police stations, hospitals, industrial plants, dams, etc. 2 Time required to repair the damage sufficiently to return to normal operational state. 3 “Destroyed” implying inadequate for living - inhabitable.
Table 4. Determination of potential impact by [30] is licensed under CC BY 4.0.
Damage LevelPopulation Exposed to Risk
01–1011–100100
CatastrophicHighHighHighHigh
MajorMediumMedium/high
(note 4)
HighHigh
ModerateLowLow/medium/high (note 3 and 4)Medium/high
(note 4)
Medium/high
(note 2 and 4)
MinimalLowLow/medium/high (note 1, 3 and 4)Low/medium/high (note 1, 3 and 4)Low/medium/high (note 1, 3 and 4)
Note: 1: With a population exposed to risk of 5 or more people, it is unlikely that potential impact will be low. 2: With a population exposed to risk of more than 100 people, it is unlikely that potential impact will be medium. 3: With one human casualty, the potential impact is moderate. 4: With two or more human casualties, the potential impact is high.
Table 5. The calculated static Fs [20]. Reproduced with permission from author and publisher Mining and Metallurgy Institute Bor (MMI Bor), Serbia Zijin Mining doo Bor, Detailed Mining Design—Mineral Processing and Disposal of Tailings and Pyrite Concentrate from Cukaru Peki Deposit—Upper Zone, Bor, 2020.
DamProfileFsAllowed Fs According to SRPS U.C5 Standard for Static Load [36]
Pyrite concentrate storage siteB7-B7’1.585≥1.5 1
B8-B8’1.564
B9-B9’1.568
Flotation tailings storage siteC7-C7’1.500
C8-C8’1.507
C9-C9’1.510
Drainage waters reservoirD3-D3’1.838≥1.3 2
1 For embankment dams over 15 m high; 2 For embankment dams less than 15 m high.
Table 6. Interpretation of annual failure probability due to static slope instability.
Quantity ValueQuality ValueWeight Factor
≤1 × 10⁻²Very likely7
1 × 10⁻² < x ≤ 1 × 10⁻³Very high6
1 × 10⁻³ < x ≤ 1 × 10⁻⁴High5
1 × 10⁻⁴ < x ≤ 1 × 10⁻⁵Medium4
1 × 10⁻⁵ < x ≤ 1 × 10⁻⁶Low3
1 × 10⁻⁶ < x ≤ 1 × 10⁻⁷Very low2
≥1 × 10⁻⁷Very unlikely1
Publisher’s Note: MDPI stays neutral with regard to jurisdictional claims in published maps and institutional affiliations.

