
Study on Sulfide Oxidation in a Clay Matrix by the Hyphenated Method

 , ,
, , 
Abstract
:1. Introduction
2. Materials and Methods
2.1. Characterization of Sulfides and the Clayey Matrix
- Kaolin USP Ref: K1512 (Sigma-Aldrich);
- Pyrite, naturally occurring mineral, grains of approx. 1.5–4.8 mm, Ref: 42633 (Alfa-Aesar);
- Chalcopyrite, naturally occurring mineral, grains of approx. 1.5–4.8 mm, Ref: 42533 (Alfa Aesar).
- an alumina crucible for sample sizes up to 0.2000 g;
- the sample mass ranged from 40 to 50 mg;
- a dynamic air atmosphere (20.9% O2) with a flow rate of 50 mL·min−1;
- helium as the protection gas at a flow rate of 25 mL min−1;
- a maximum temperature of 1200 °C; and
- a heating rate of 10 °C min−1.
2.2. Analysis Methodology
3. Results and Discussion
3.1. Properties of Sulfides
3.2. Influence of Humidity and Temperature
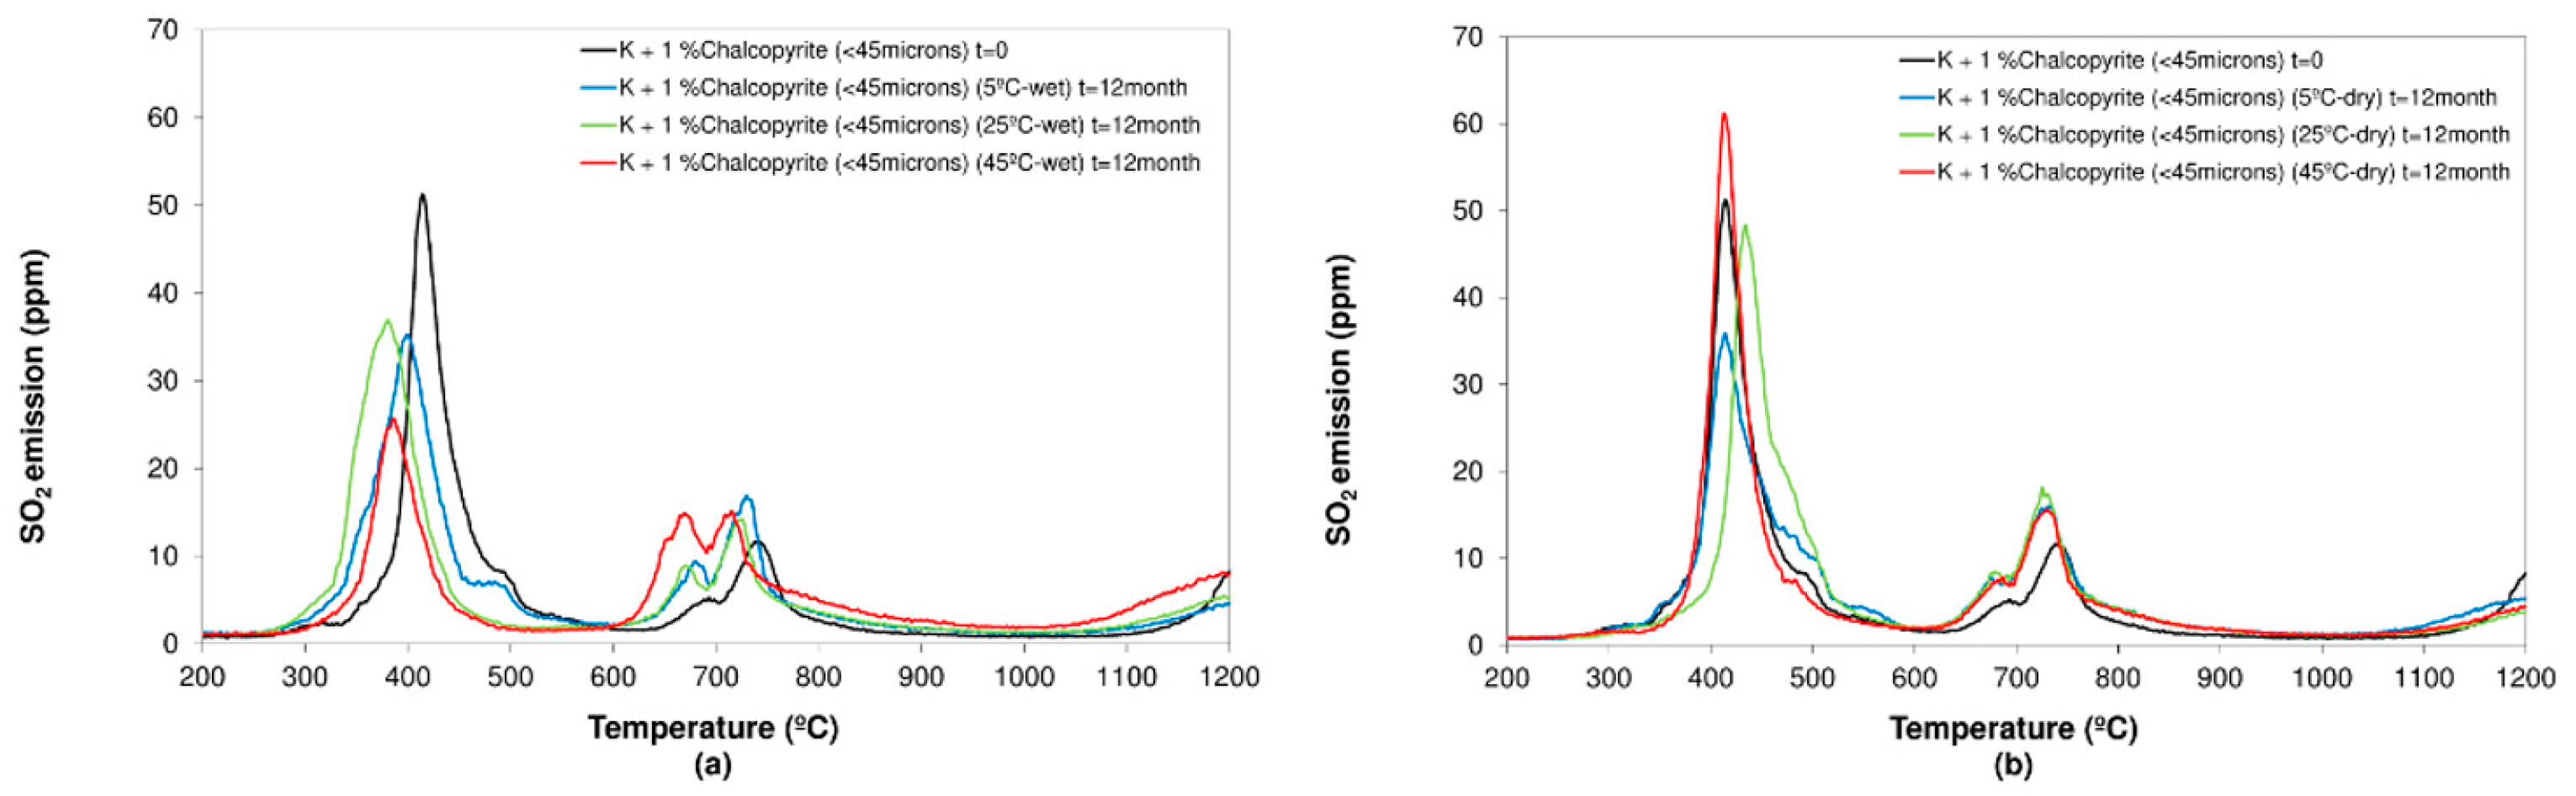
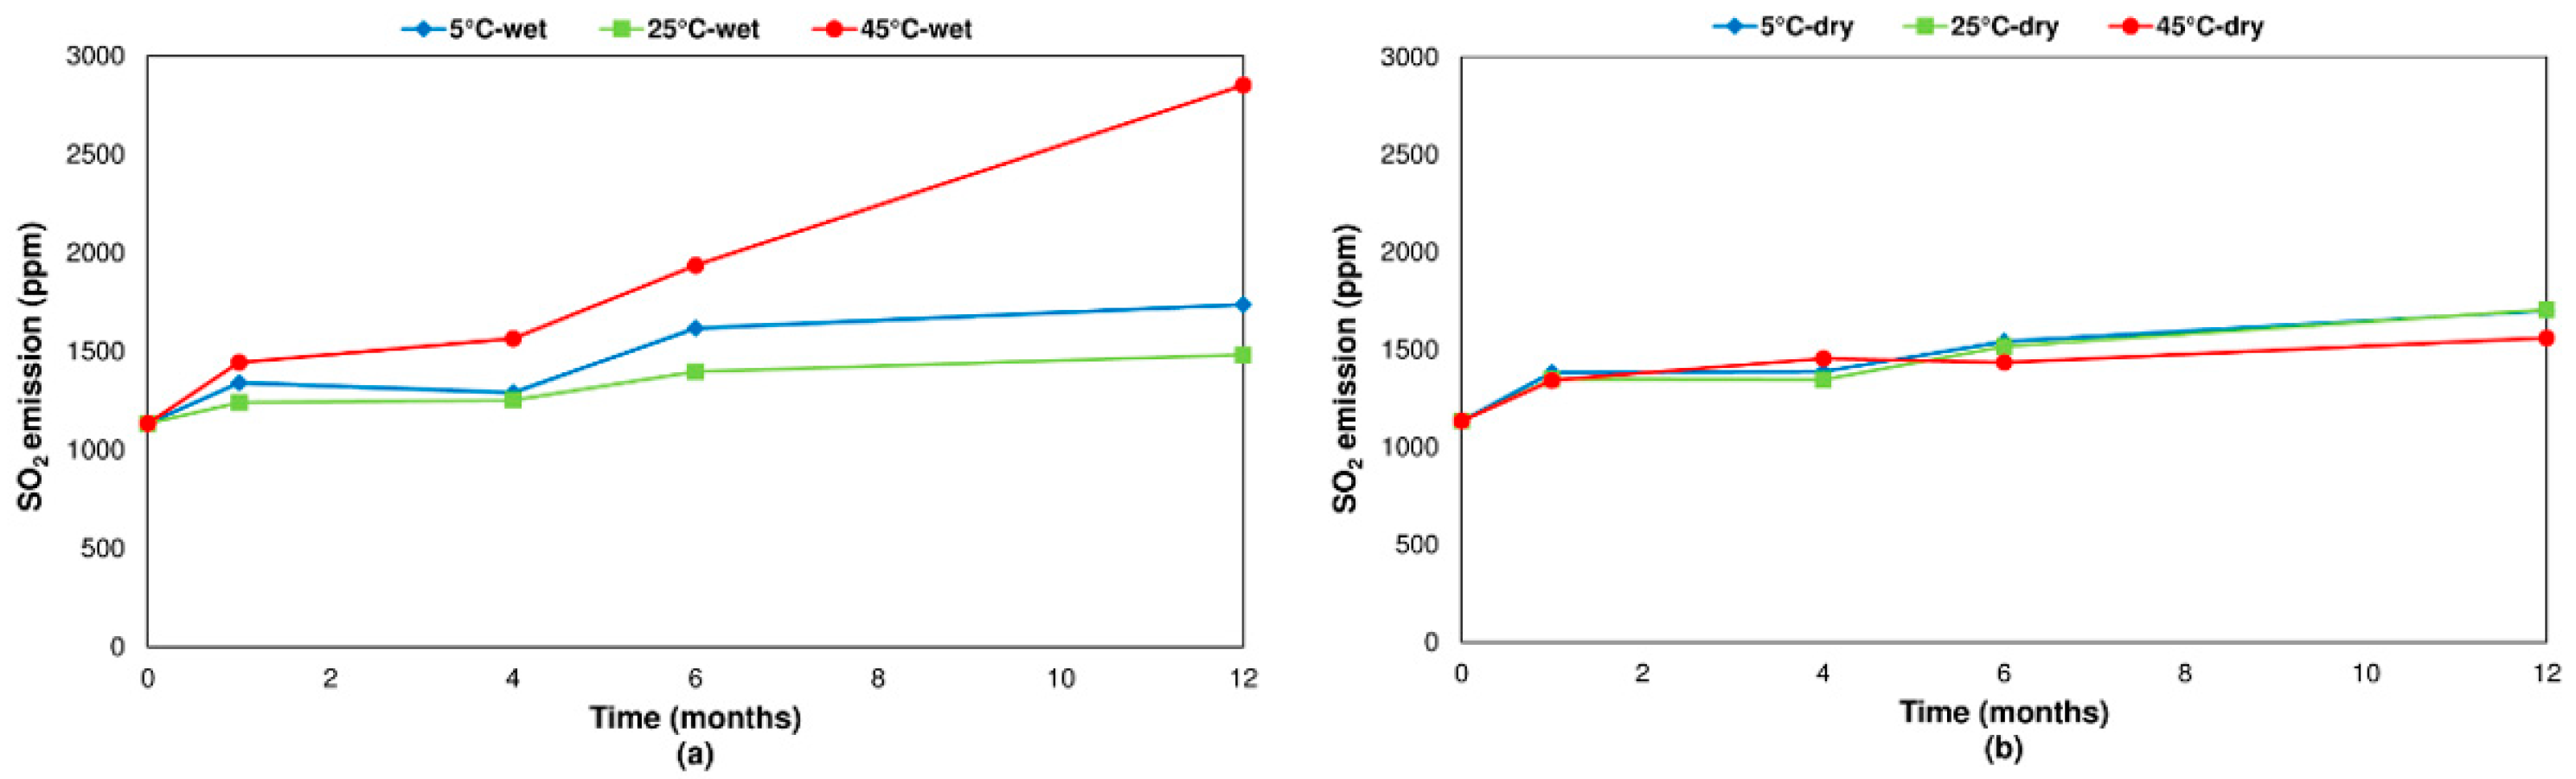
3.2.1. Chalcopyrite
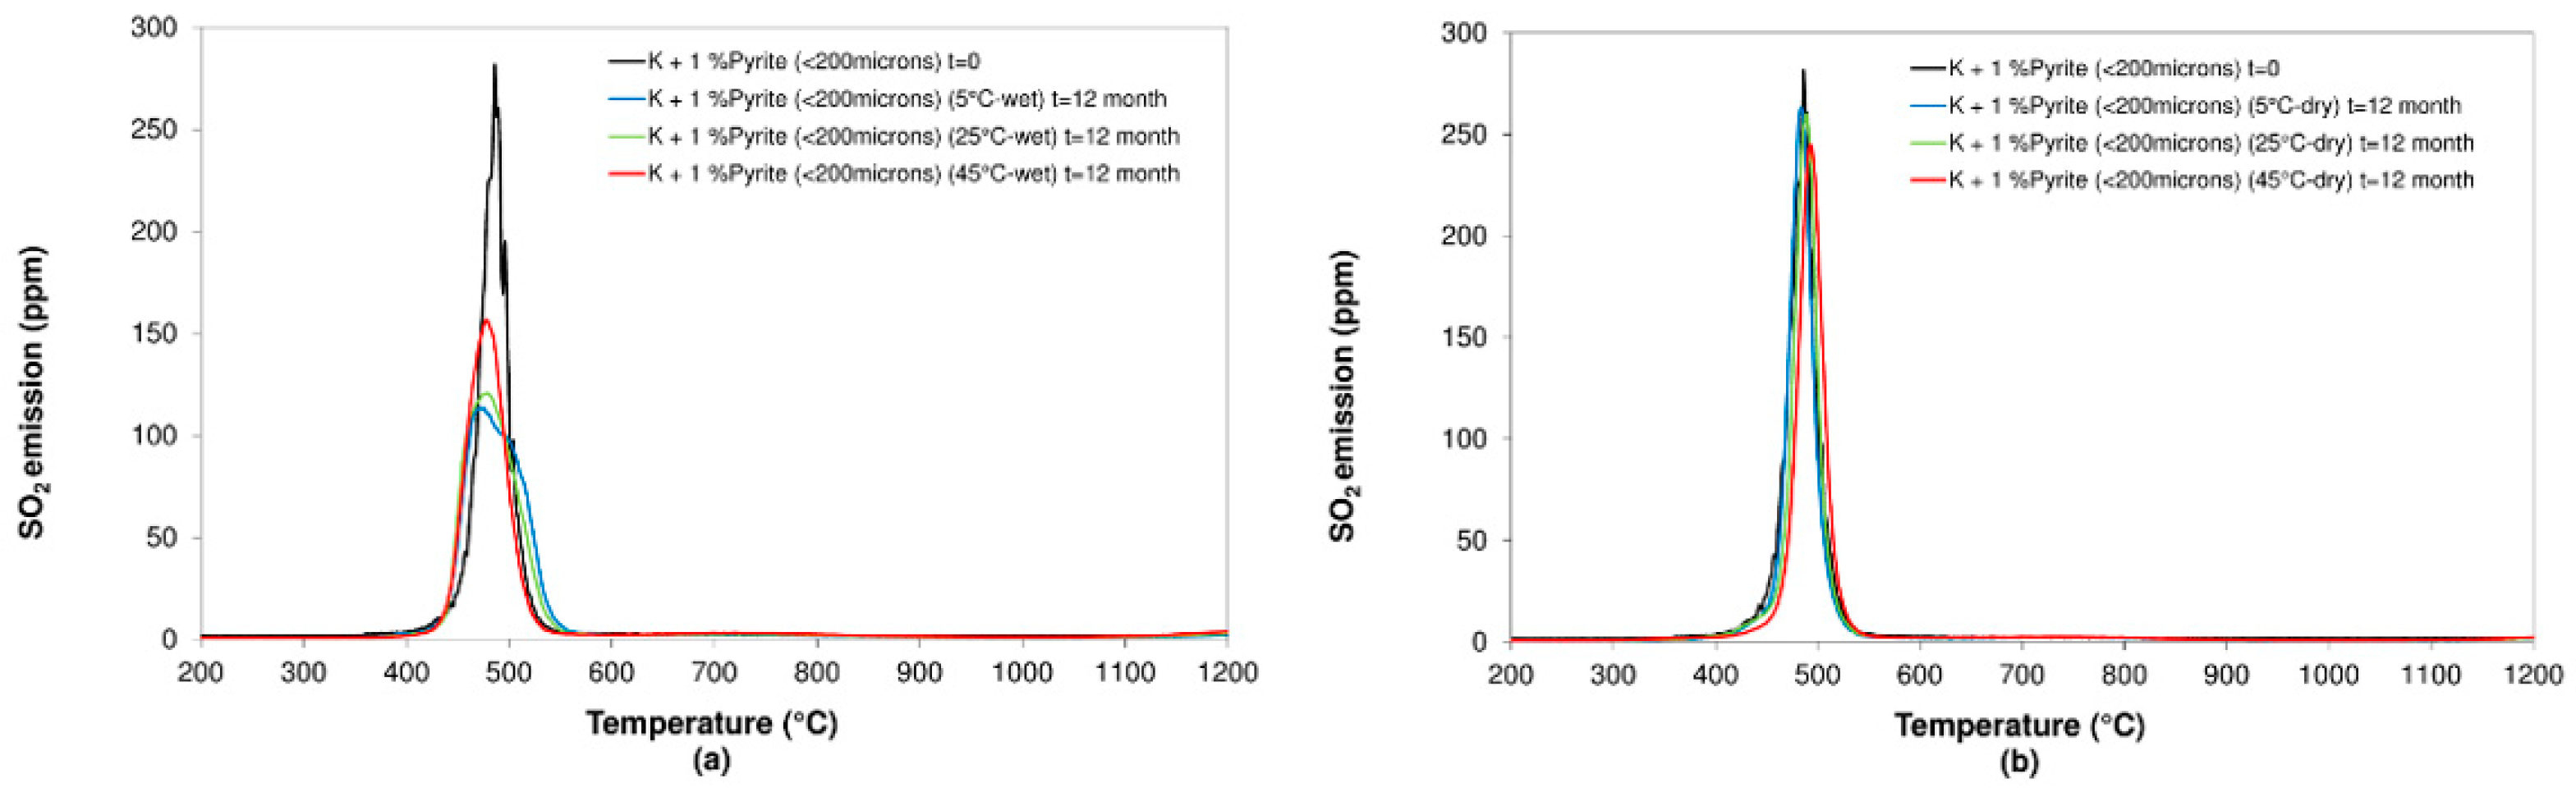
3.2.2. Pyrite
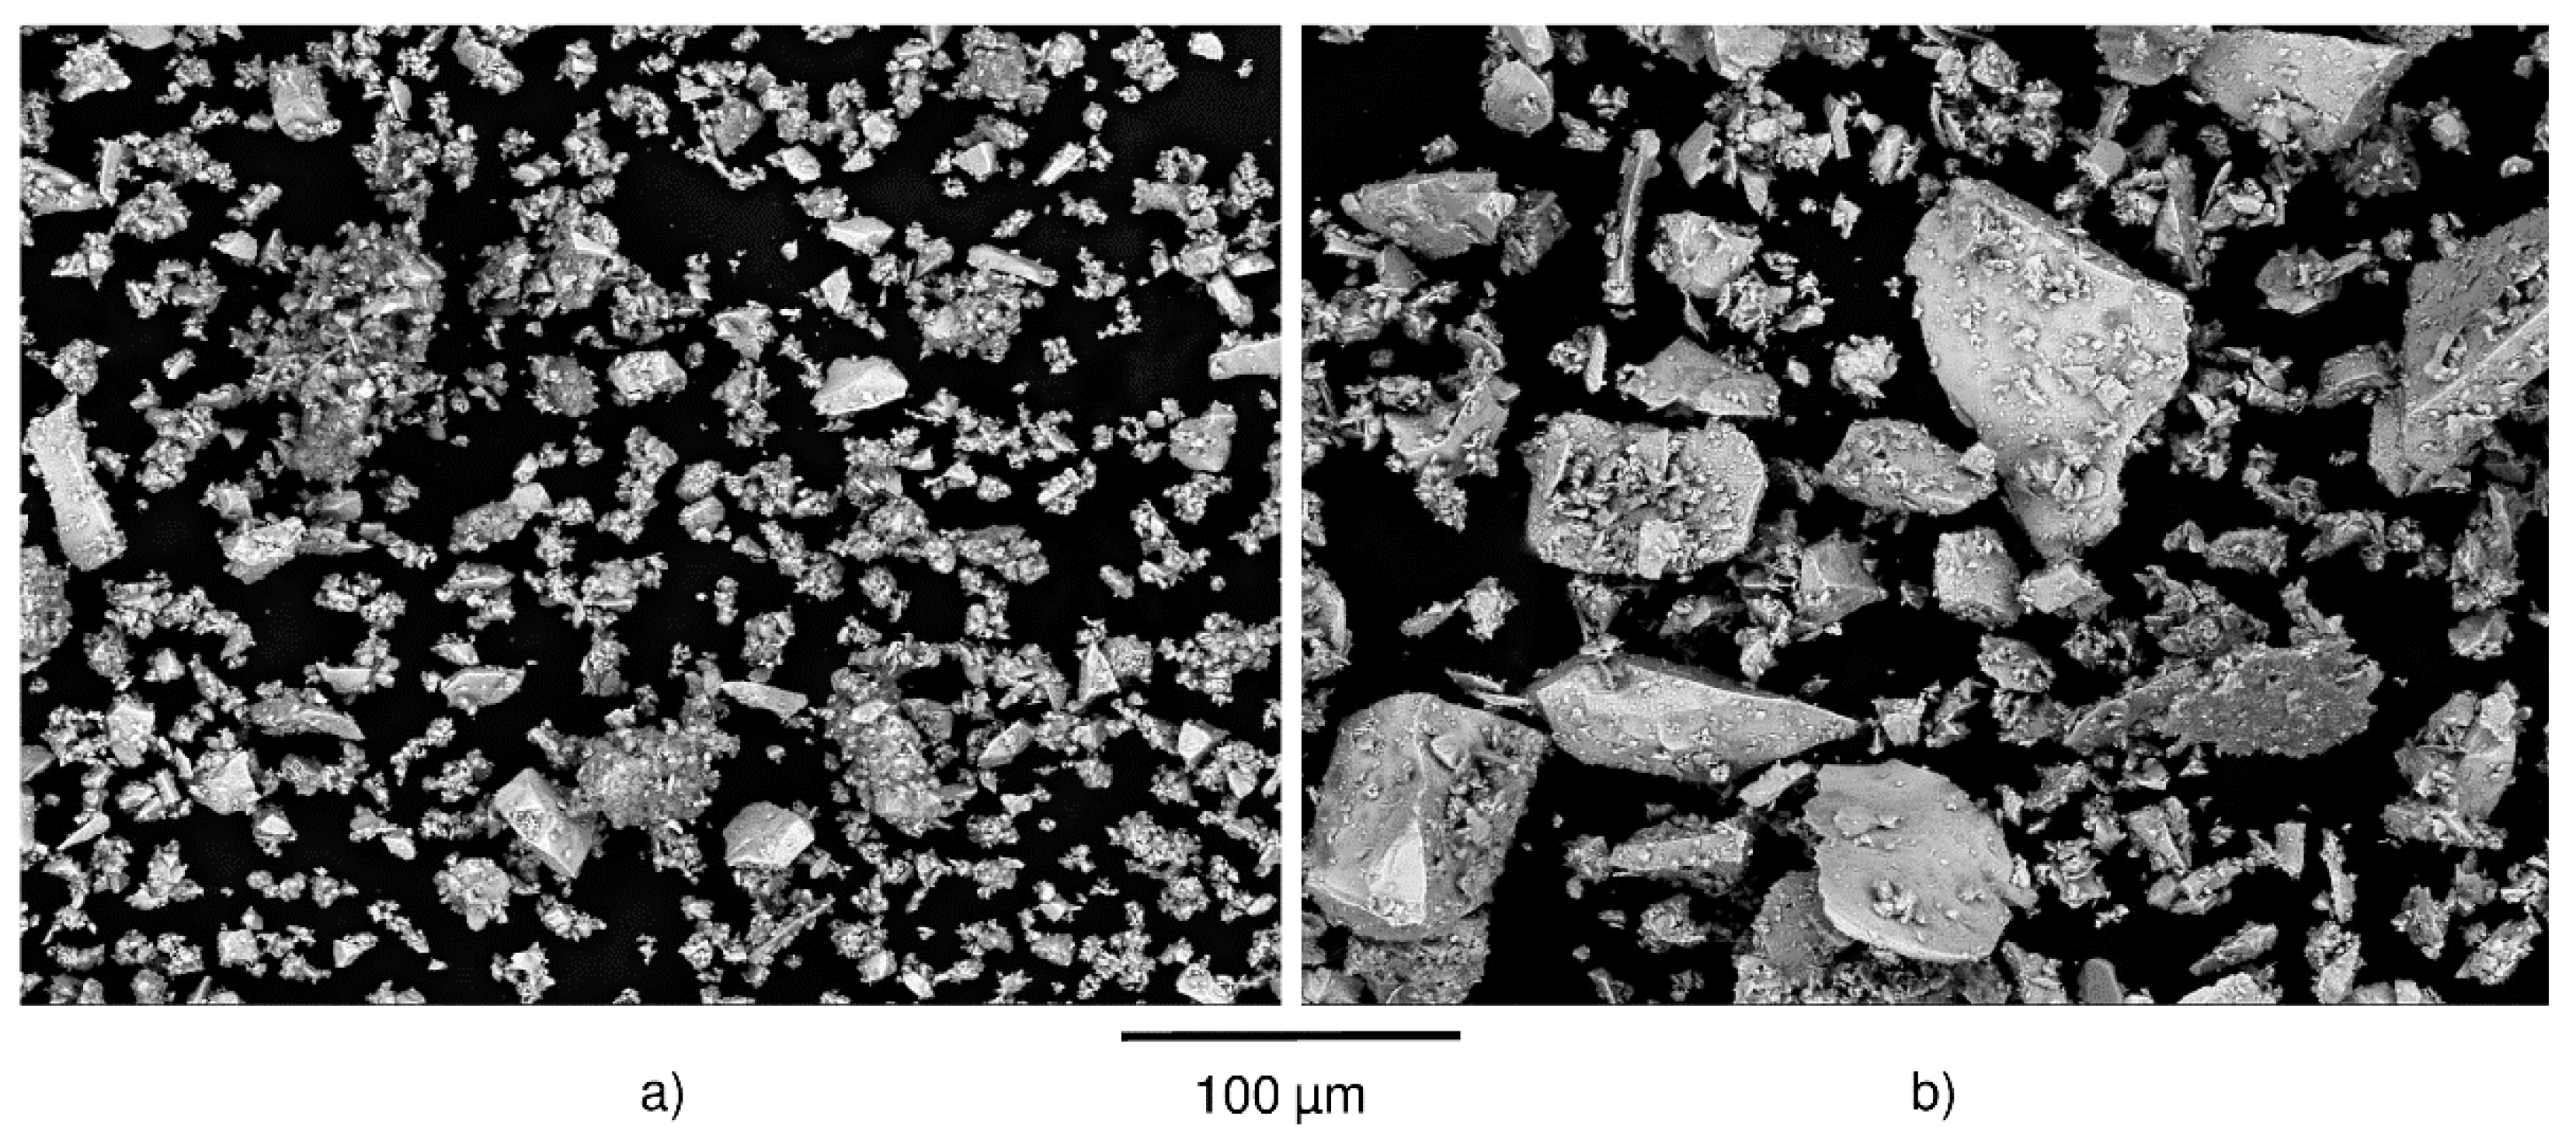
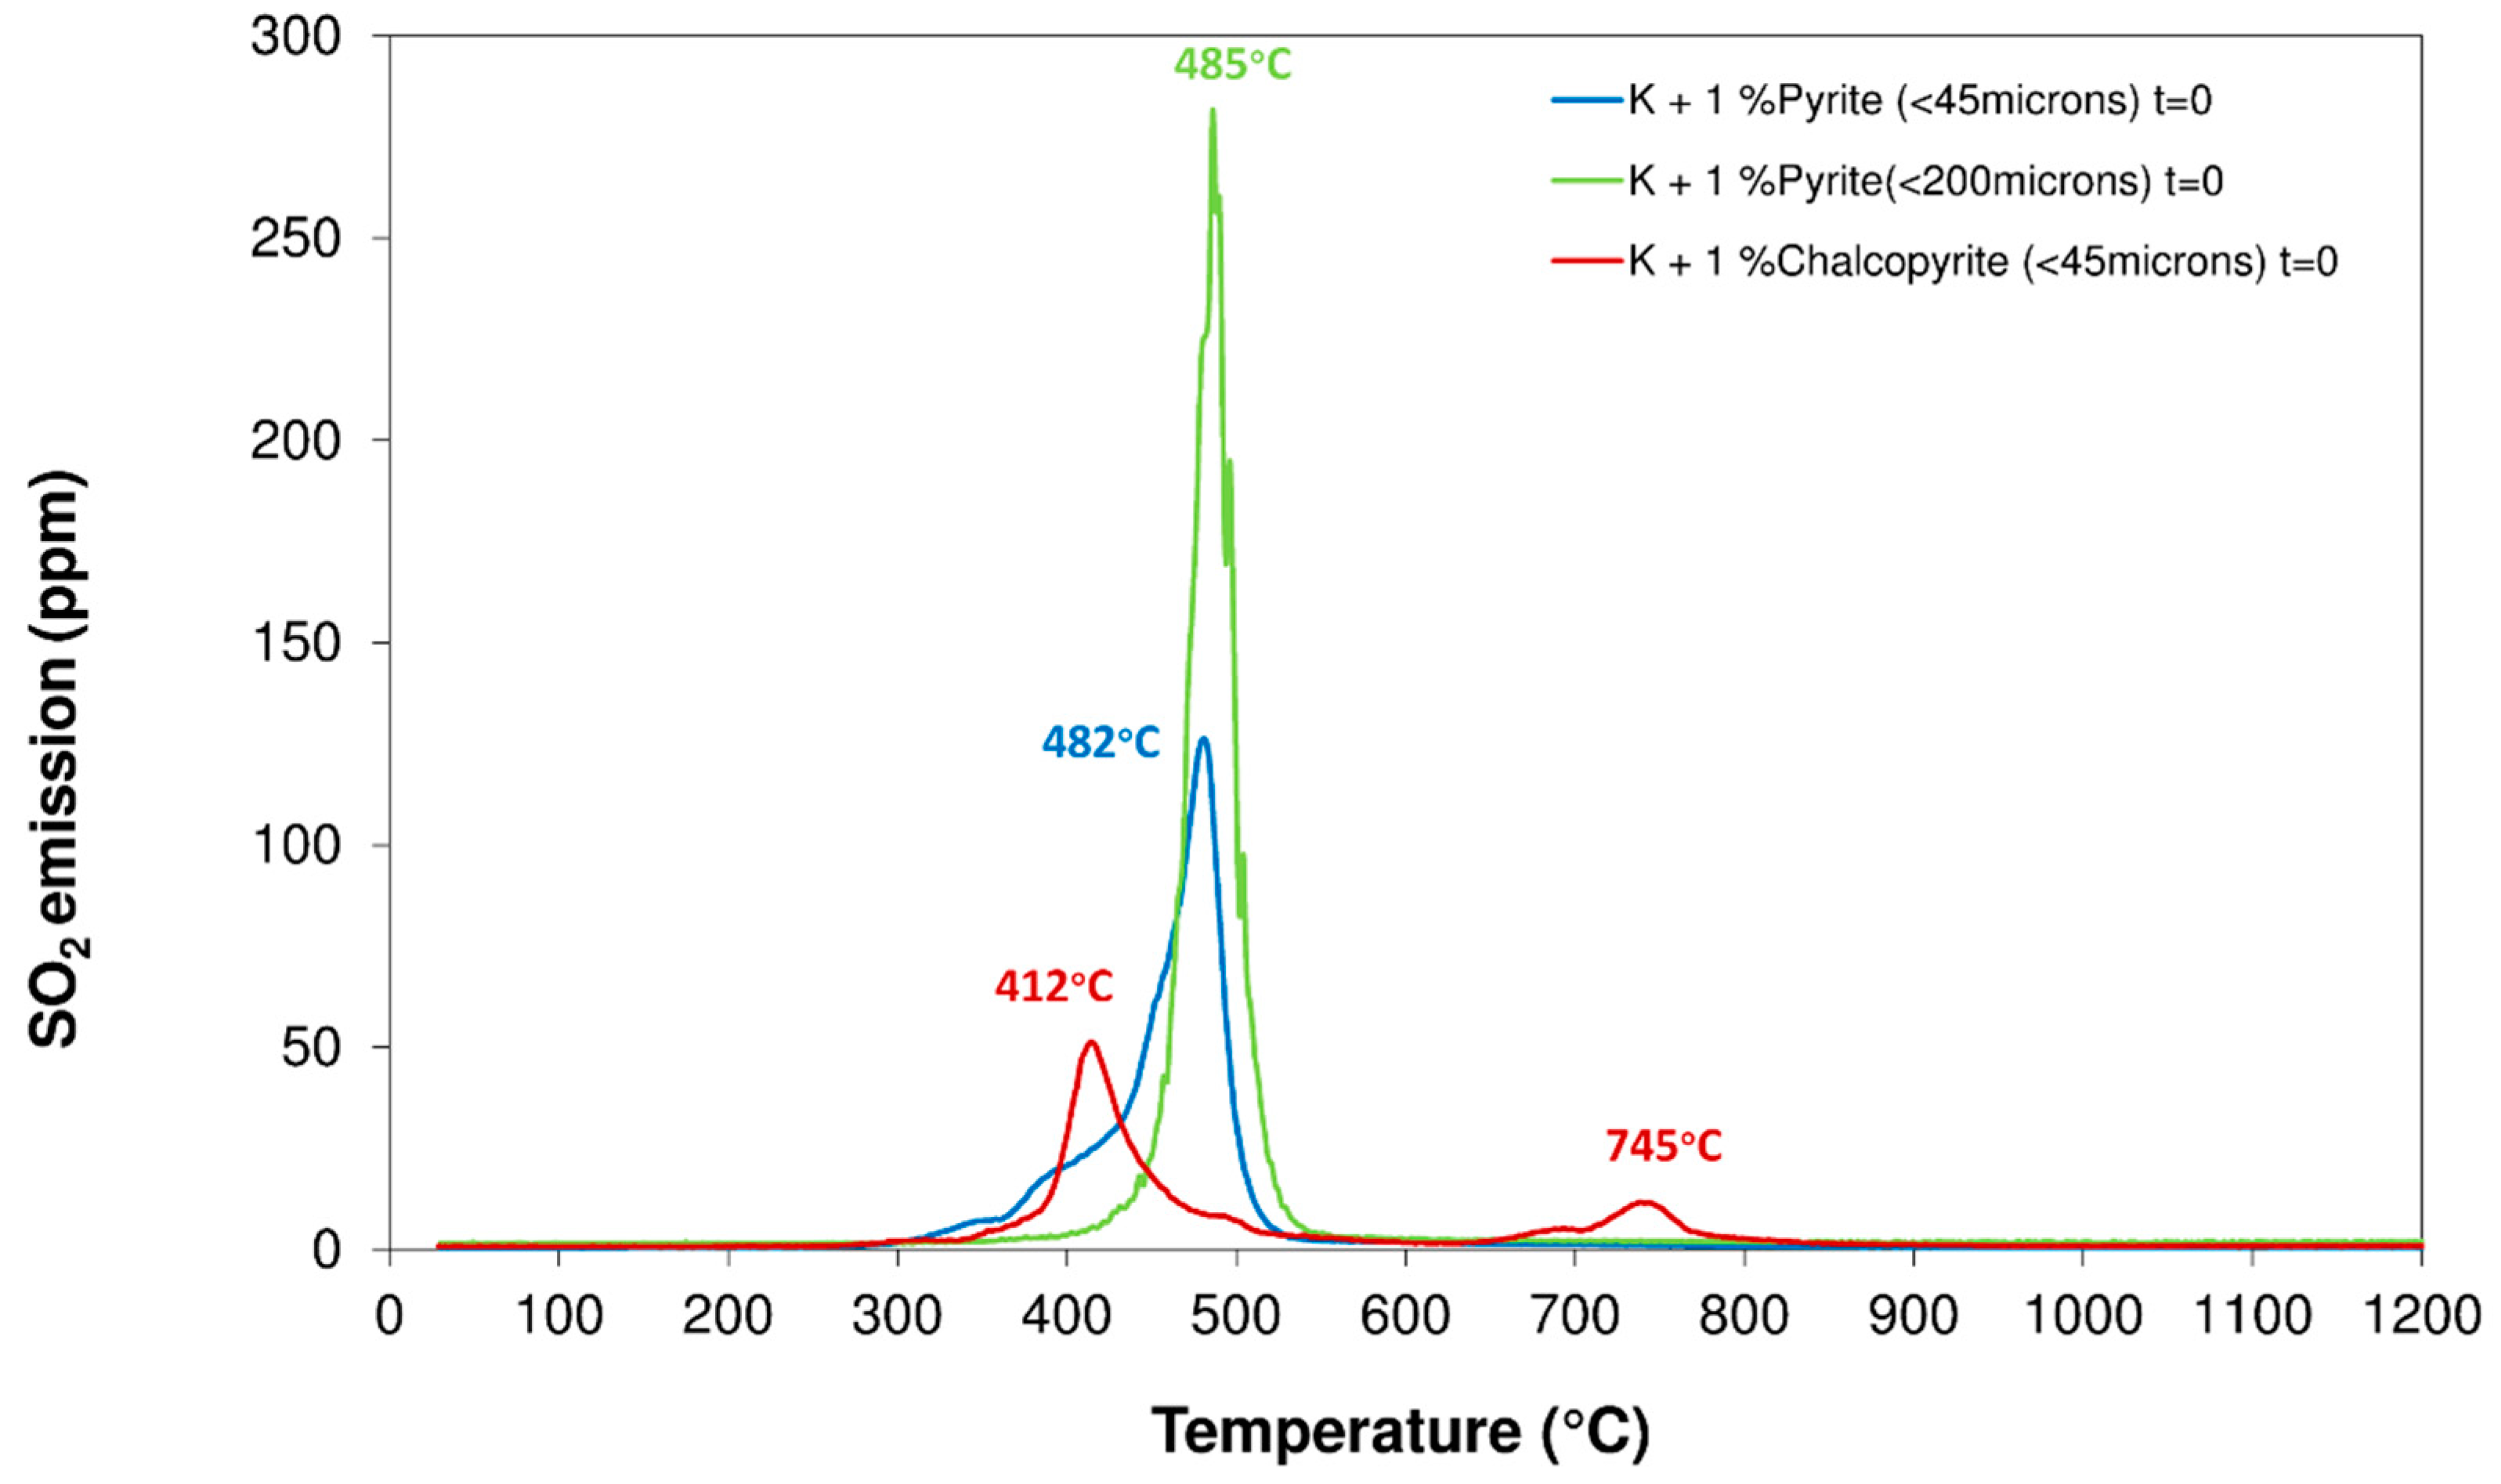
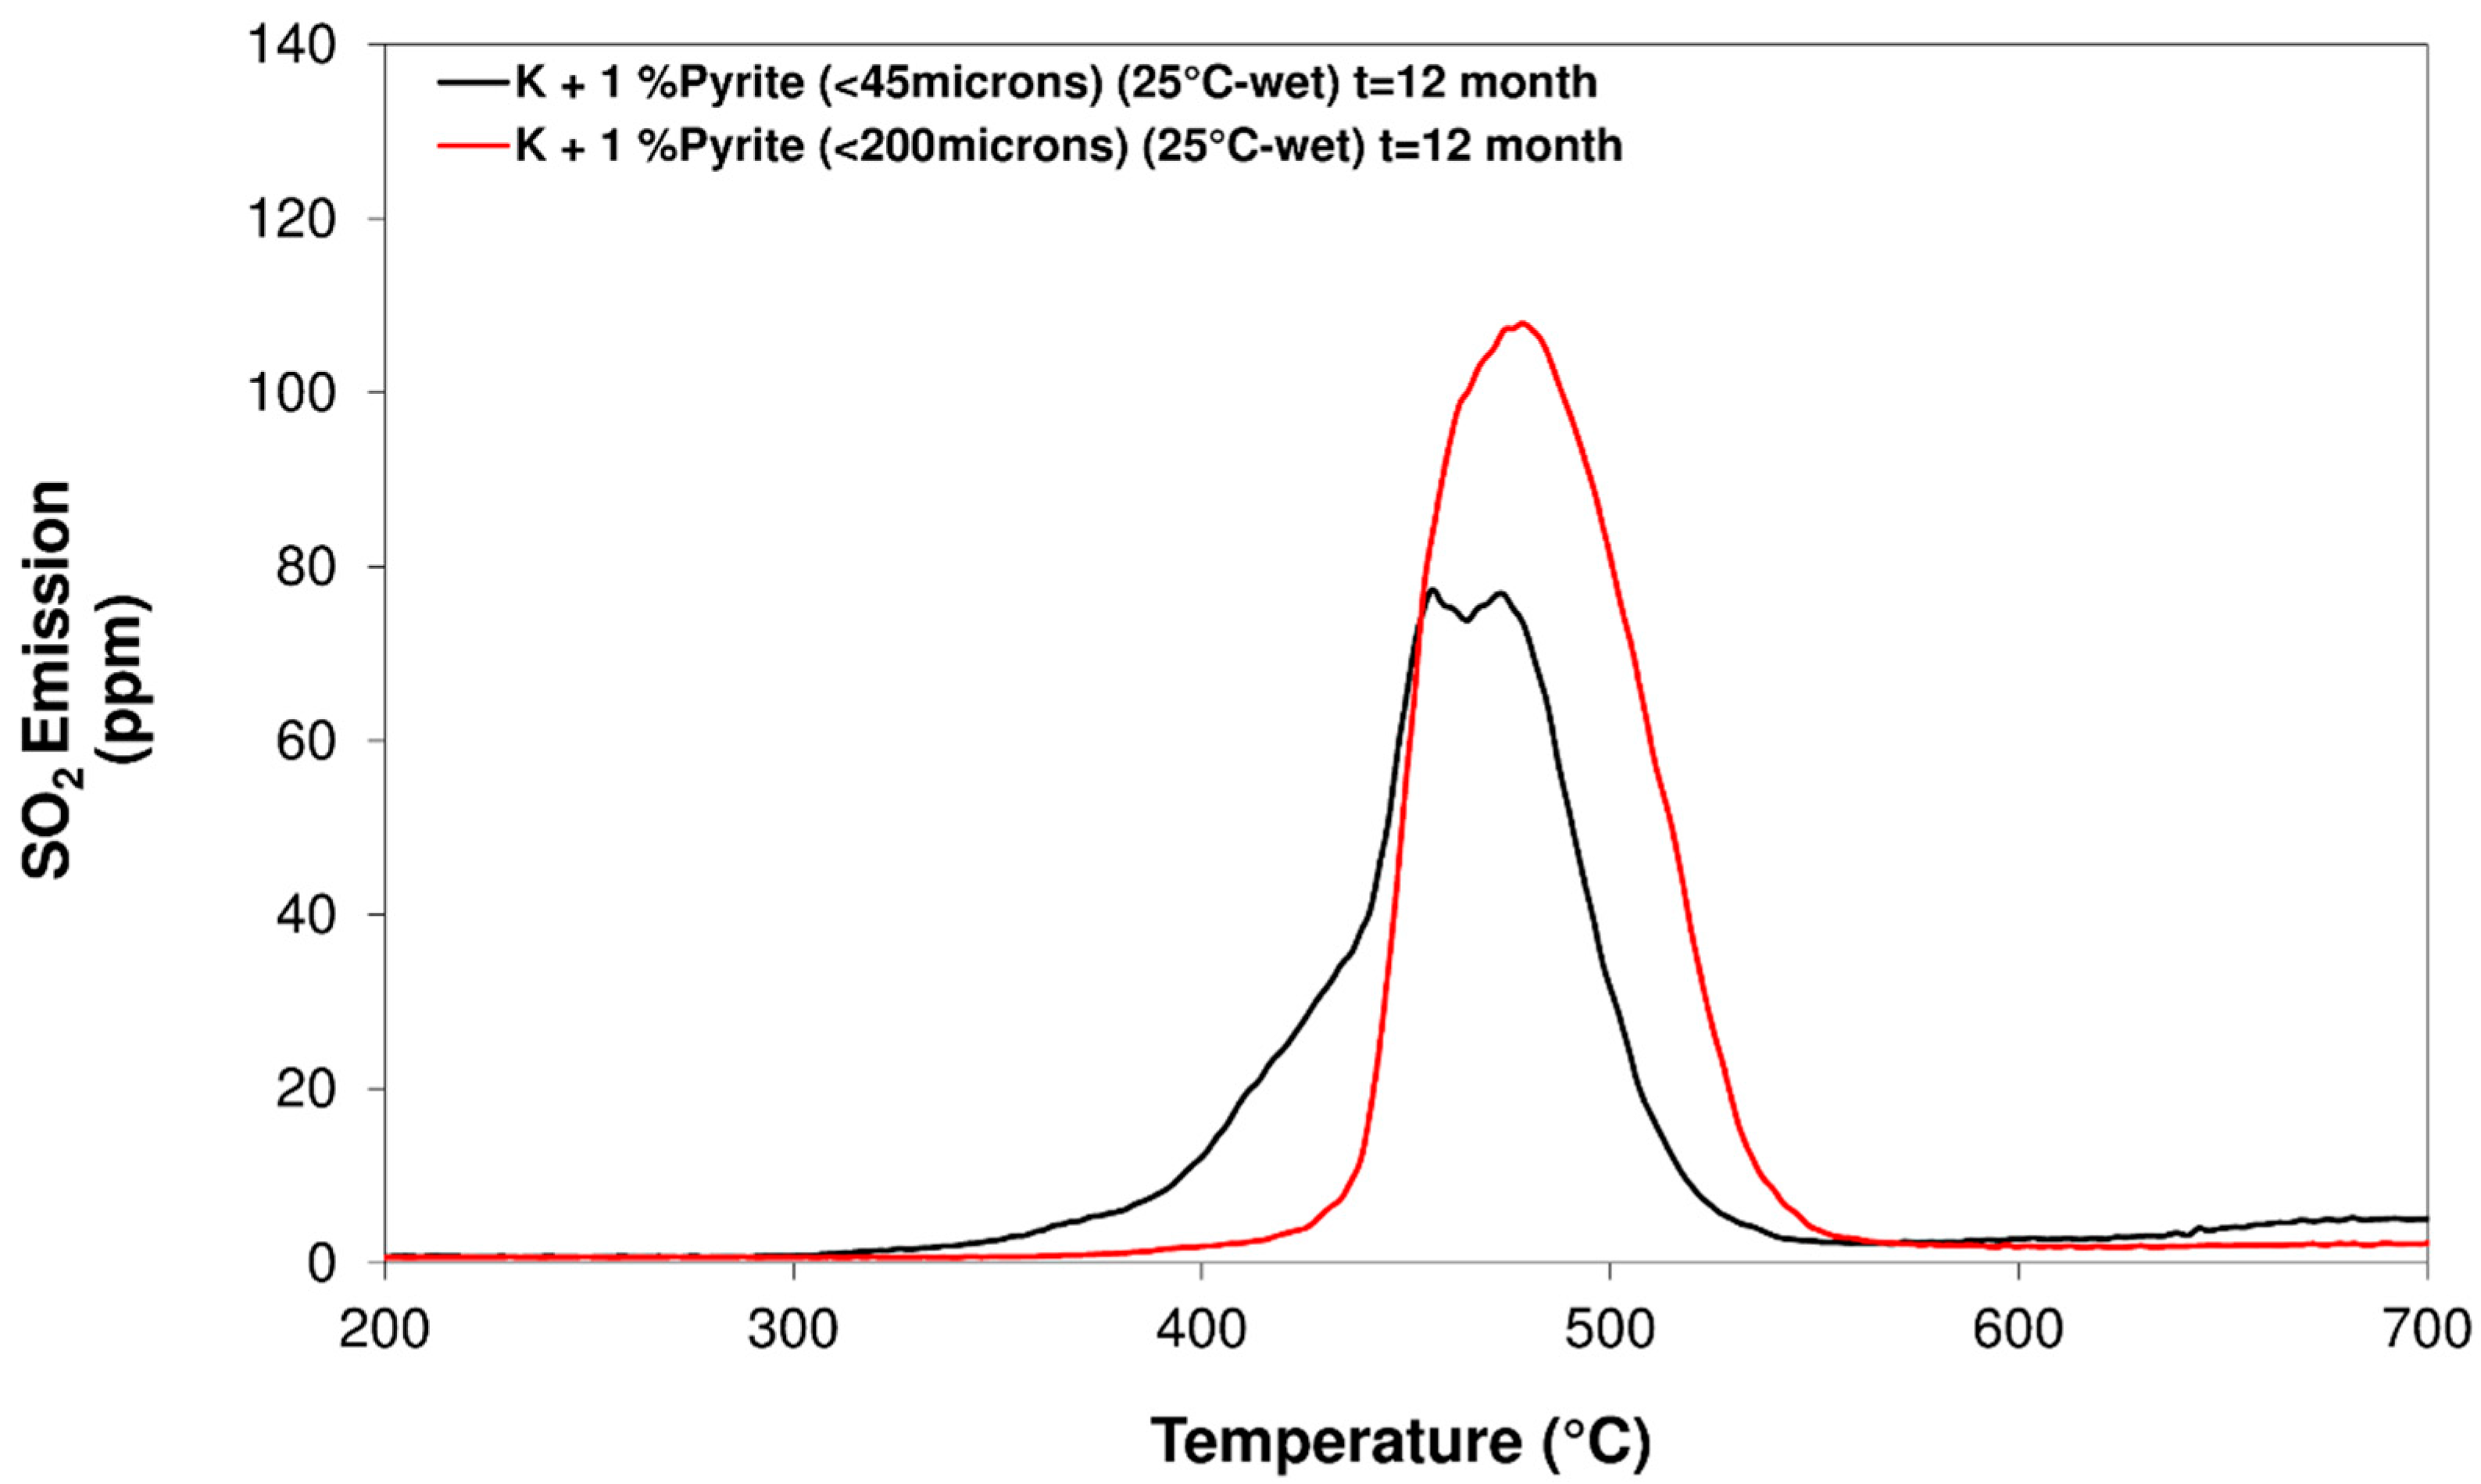
3.3. Influence of Particle Size Distribution
4. Conclusions
- The EGA technique allows us to register the sulfur dioxide emissions of minerals such as chalcopyrite and pyrite when applying a heat treatment. Different SO2 emissions were observed due to the oxidation and decomposition stages of sulfides and sulfates formed during the pyrolysis process.
- By using hyphenated techniques, it is possible to detect, distinguish, and quantify sulfides in clayey matrices even when these are present in low concentrations.
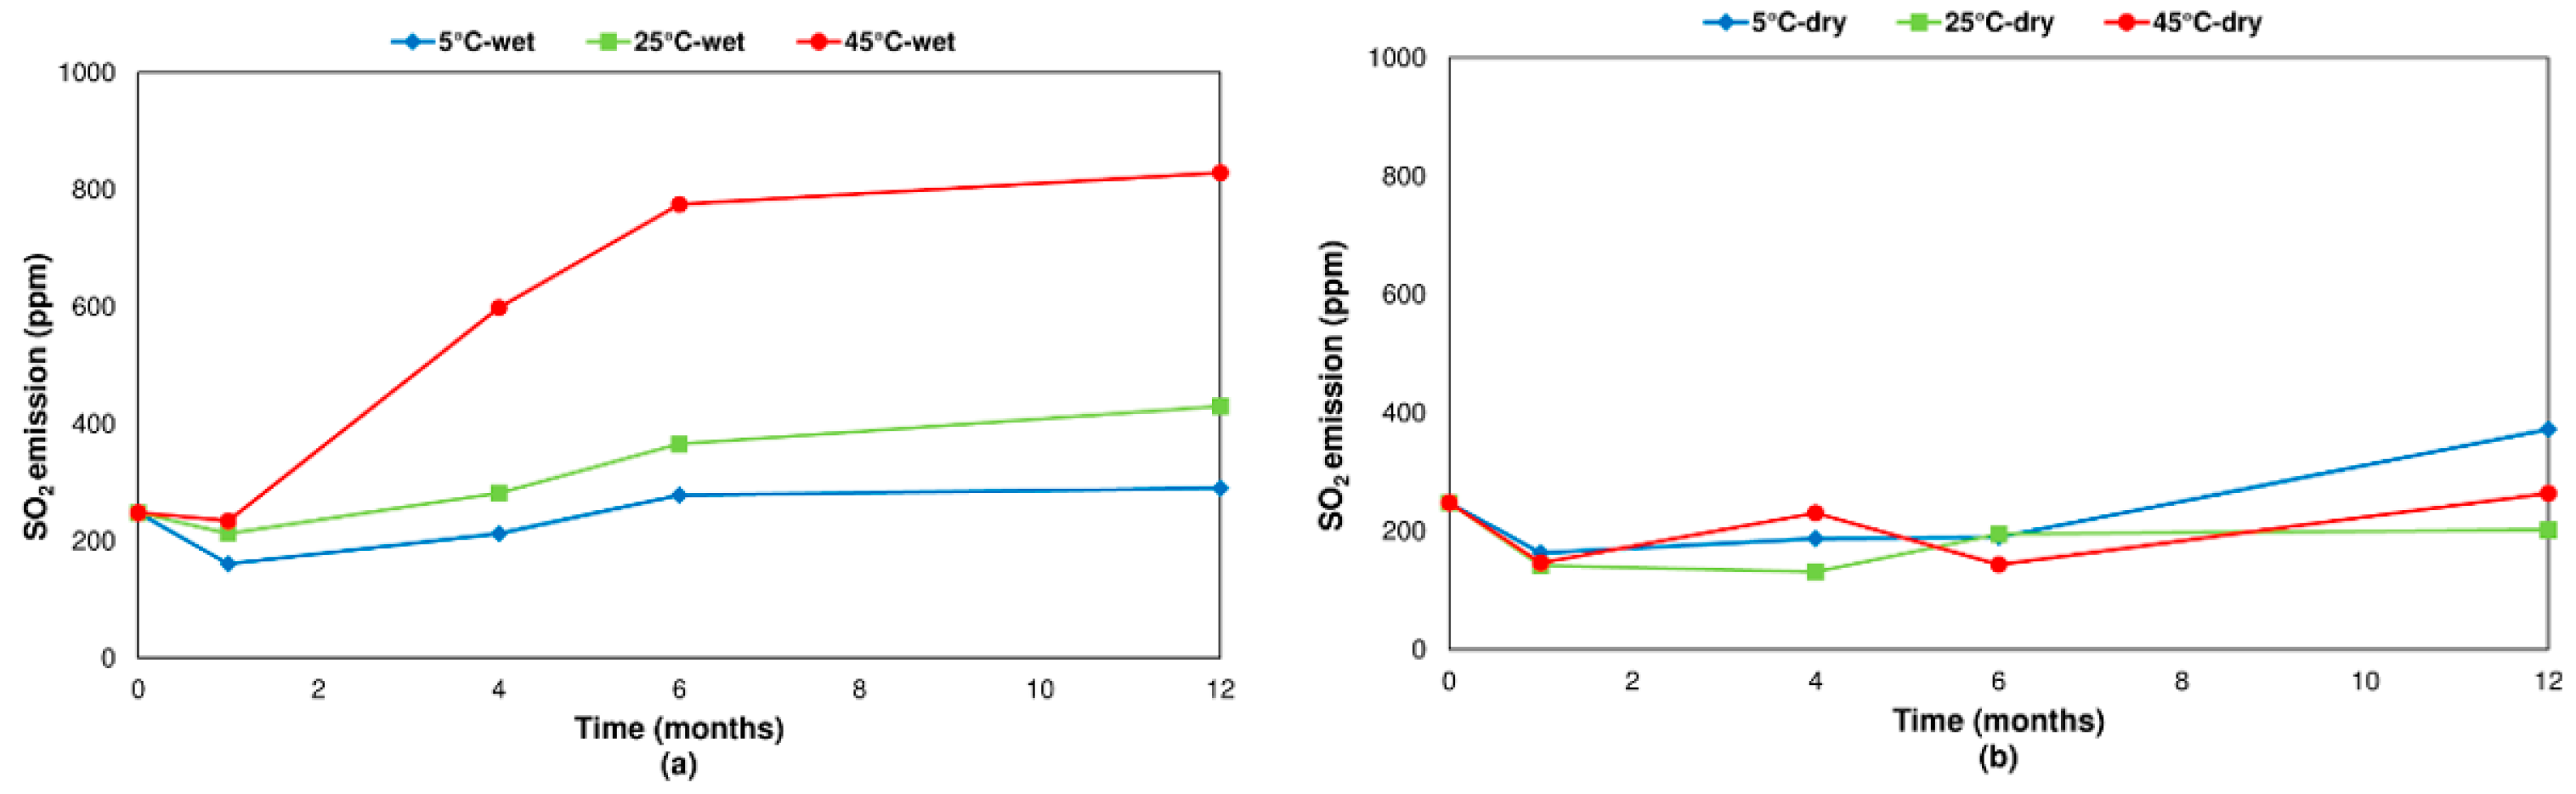
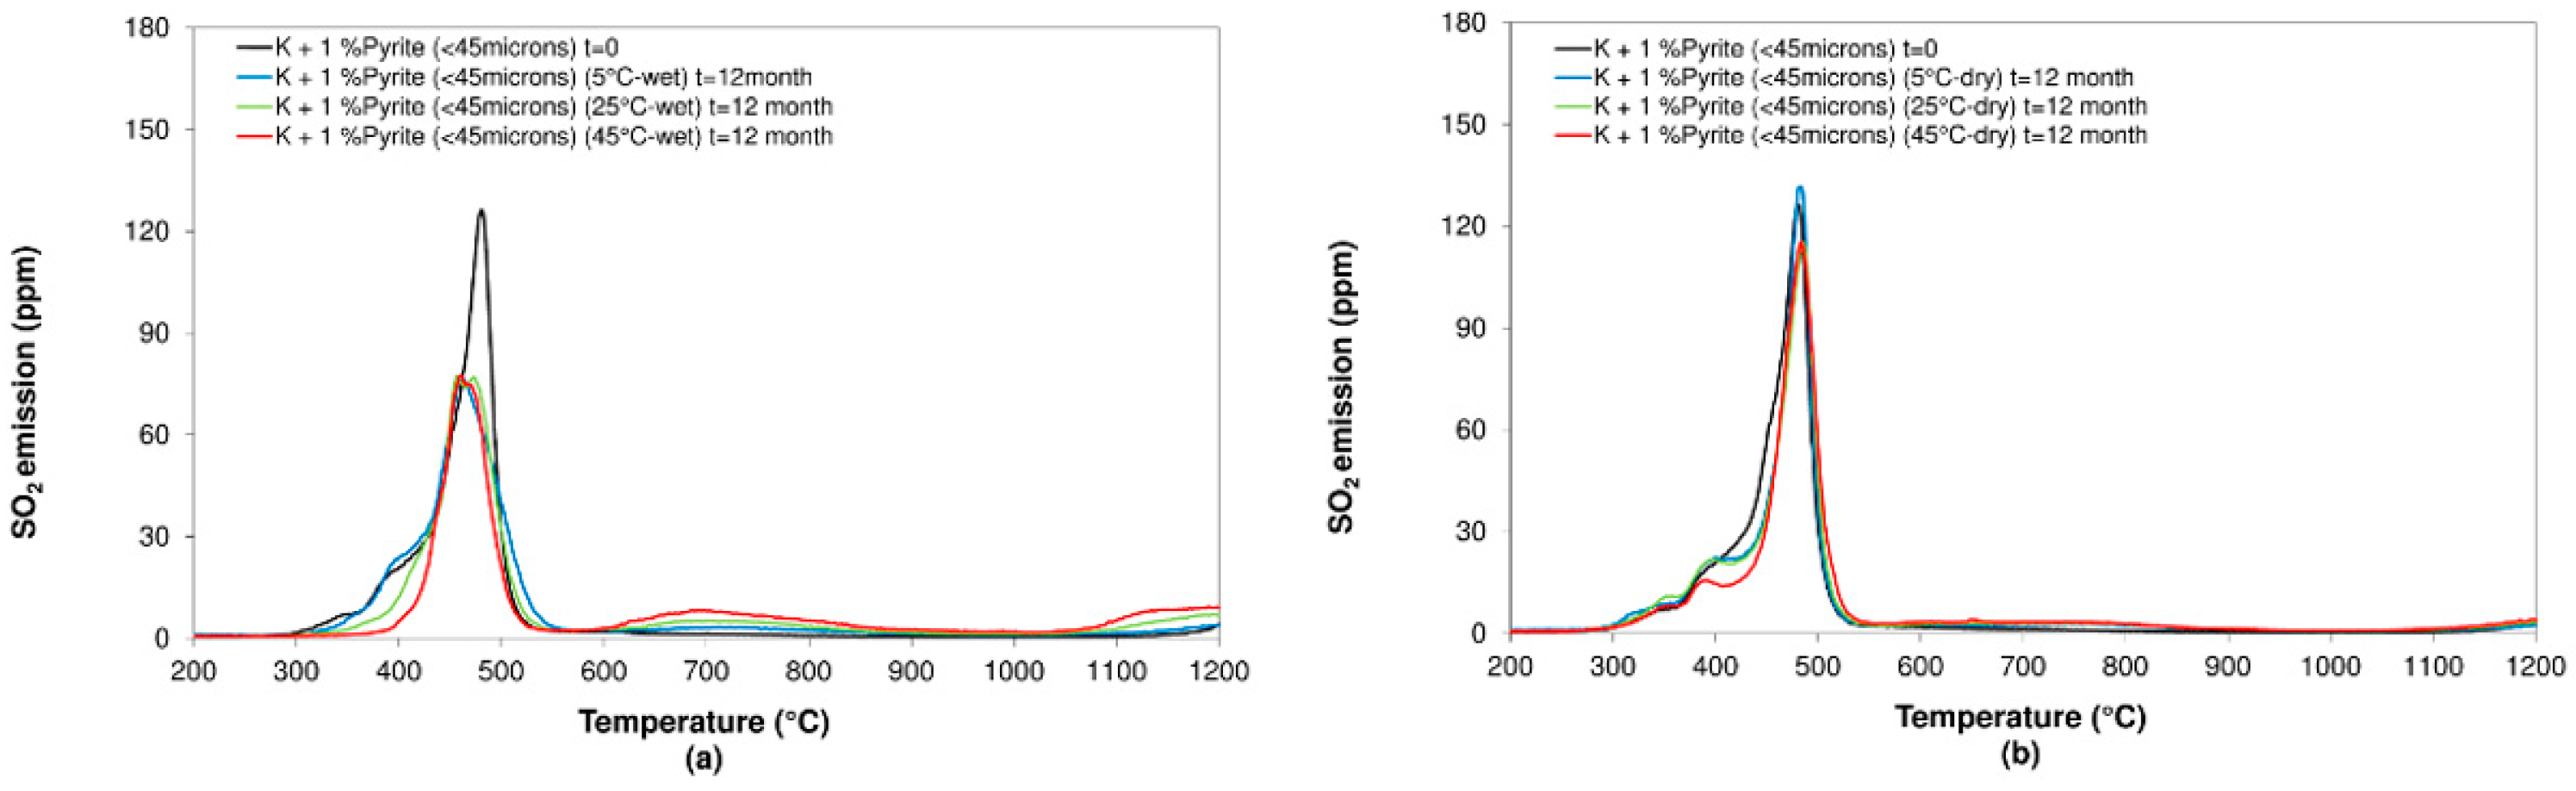
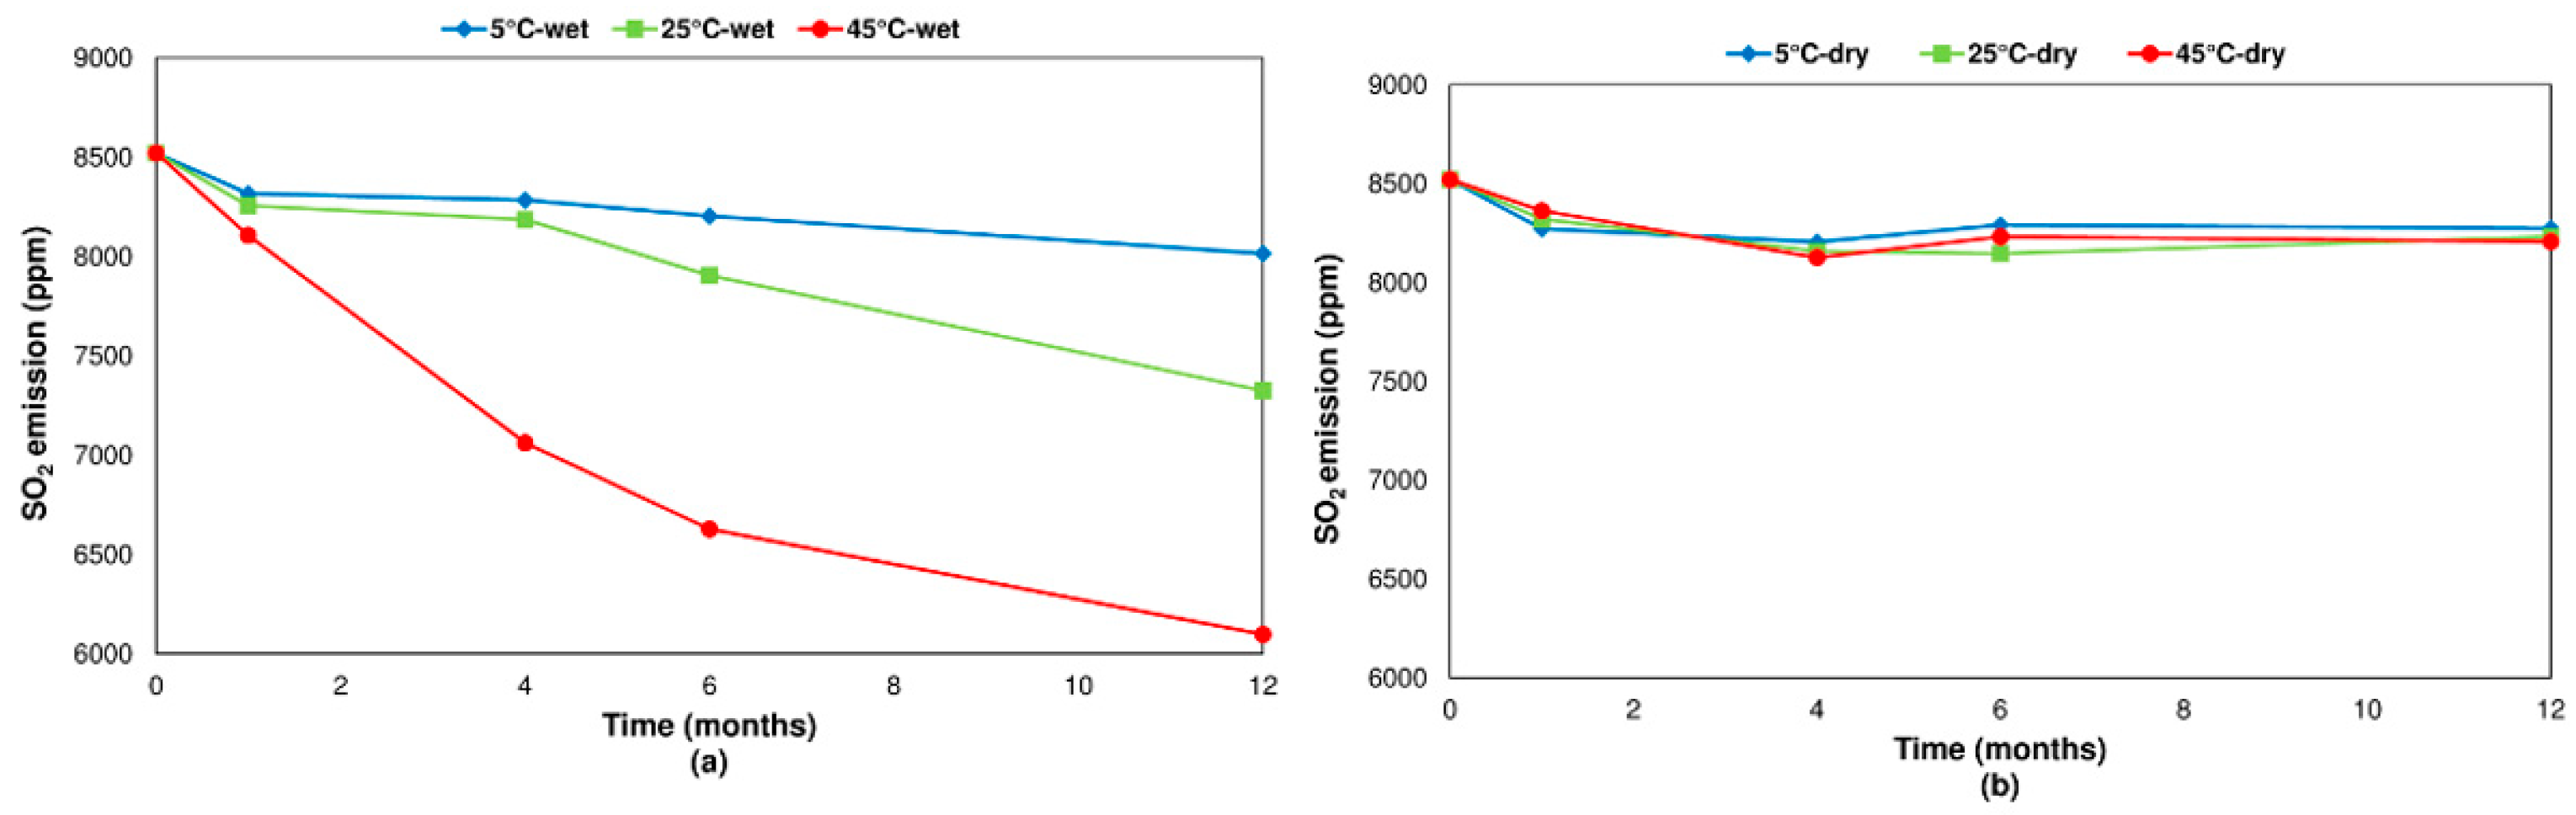
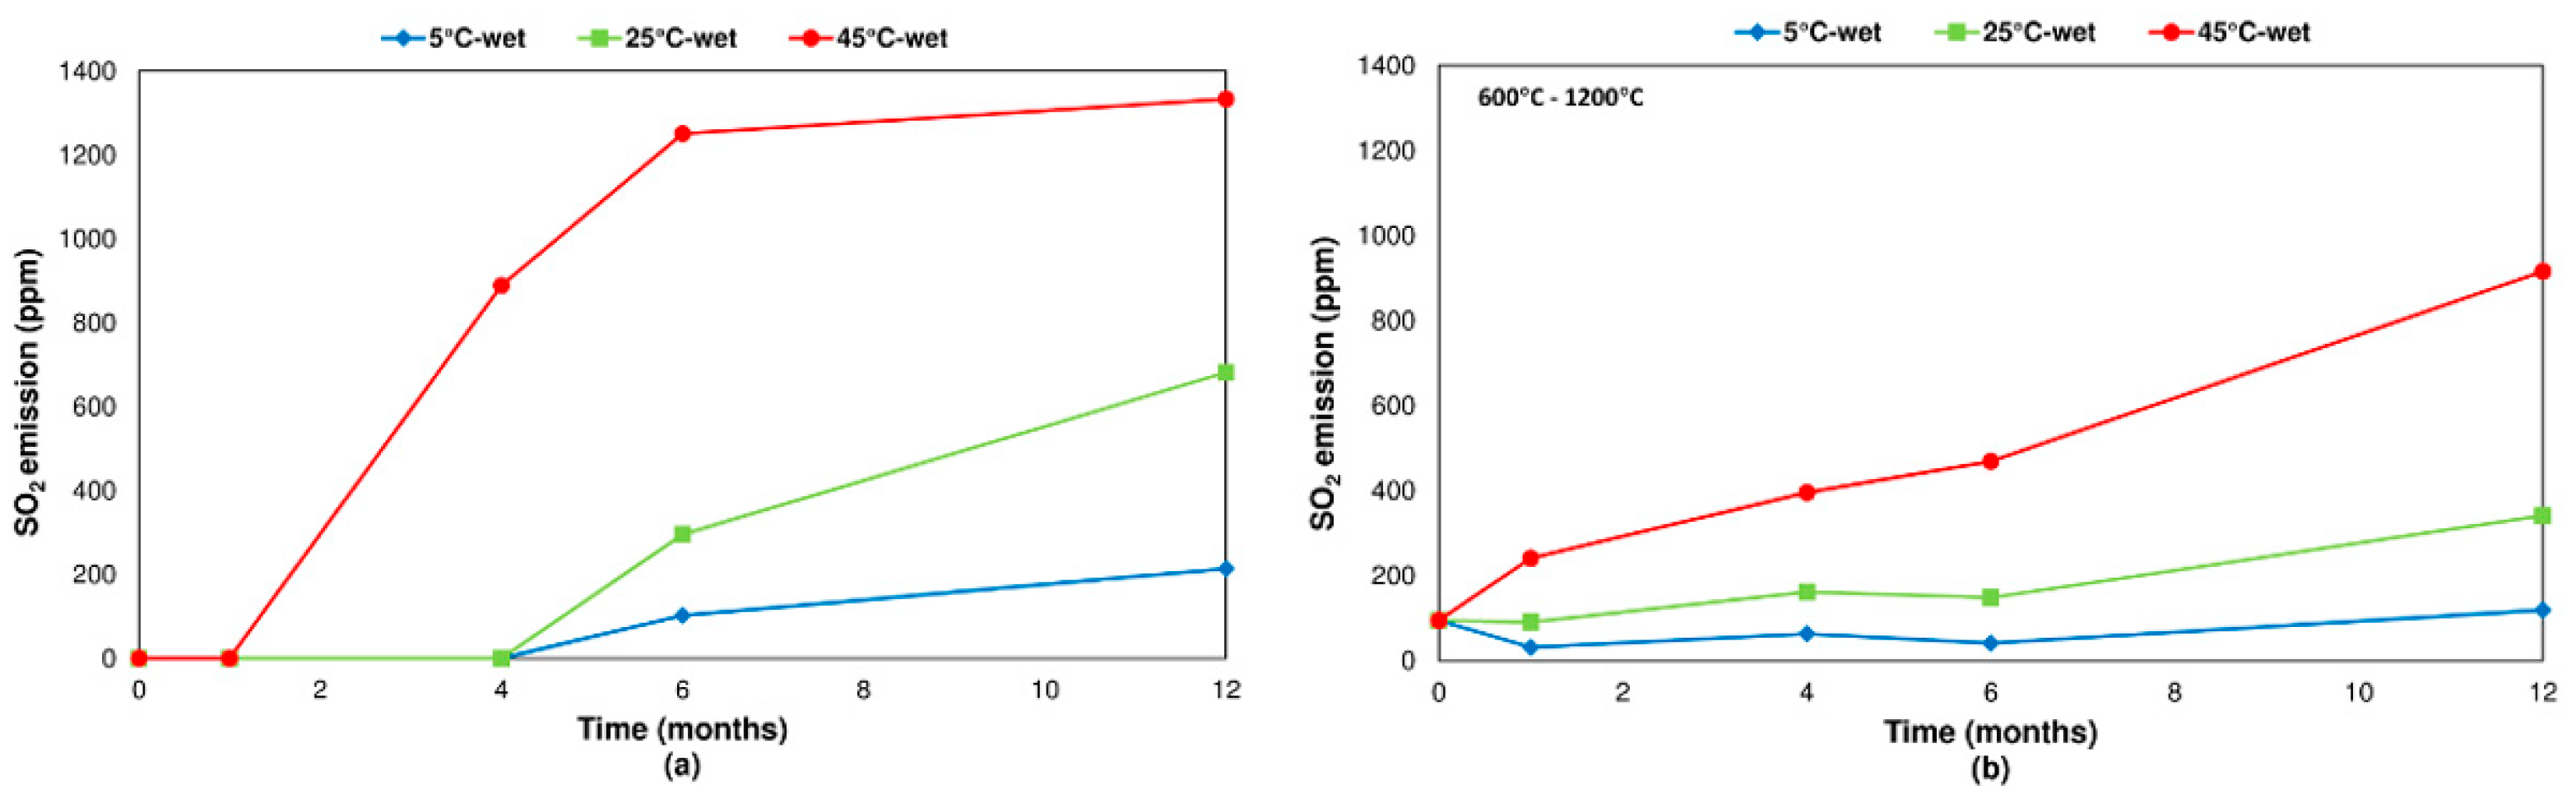
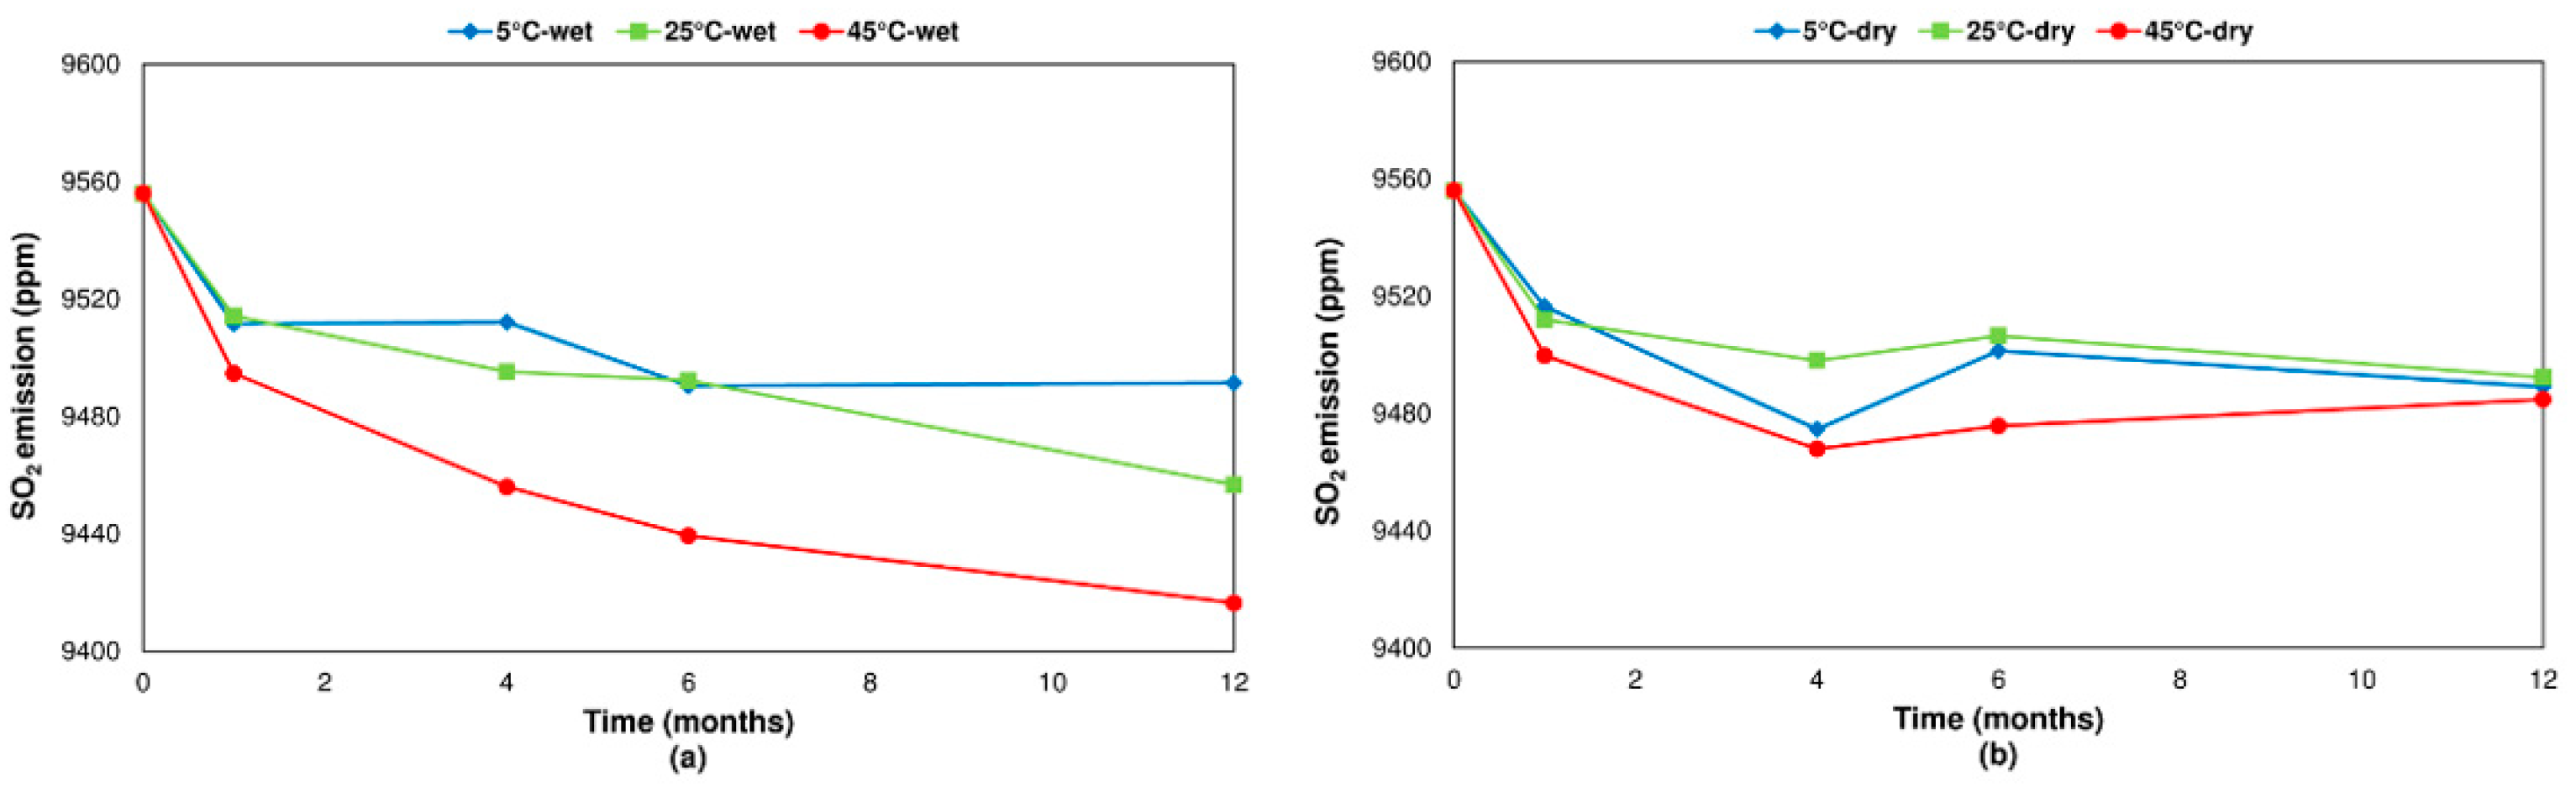
- Concerning the influence of environmental conditions on the oxidation and decomposition processes, it was observed that samples stored at dry ambient temperature do not show significant differences. However, when the samples were stored in a high humidity environment, we observed a reduction in the sulfur dioxide emission in the range of temperatures from 200 °C to 600 °C, where sulfides are oxidizing and decomposing. On the other hand, an increase in SO2 emissions was registered in the range of temperatures from 600 °C to 1200 °C because of sulfate decomposition. These effects are significantly more intense when samples are stored at a higher temperature (45 °C).
- Regarding the influence of the particle size, it was found, by observing changes in SO2 emission profiles, that the reactivity and oxidation process of pyrite is related to the particle size. However, when changing the particle size of the pyrite, no notable differences were observed in the total SO2 emission independently of the environmental conditions of temperature and humidity.
- To avoid defects derived from the industrial process, not only the concentration of sulfur but also the mineralogy and the environmental conditions to which the raw materials are exposed must be considered. This is because the environmental conditions of humidity and temperature have an important influence on the oxidation and degradation processes of the sulfides present in the raw ceramic materials.
Author Contributions
Funding
Conflicts of Interest
References
- Vaughan, D.J.; Corkhill, C.L. Mineralogy of Sulfides. Elements 2017, 13, 81–87. [Google Scholar] [CrossRef]
- Jerz, J.K.; Rimstidt, J. Pyrite oxidation in moist air. Geochim. Cosmochim. Acta 2004, 68, 701–714. [Google Scholar] [CrossRef]
- Zhu, J.; Xian, H.; Lin, X.; Tang, H.; Du, R.; Yang, Y.; Zhu, R.; Liang, X.; Wei, J.; Teng, H.H.; et al. Surface structure-dependent pyrite oxidation in relatively dry and moist air: Implications for the reaction mechanism and sulfur evolution. Geochim. Cosmochim. Acta 2018, 228, 259–274. [Google Scholar] [CrossRef]
- Jeridi, K.; López-Galindo, A.; Setti, M.; Jamoussi, F. The use of Dynamic Evolved Gas Analysis (DEGA) to resolve ceramic defects. Appl. Clay Sci. 2014, 87, 292–297. [Google Scholar] [CrossRef]
- Amorós, J.L. Defectos de Fabricación de Pavimentos y Revestimientos Cerámicos; Asociación de Investigación de las Industrias Cerámicas: Castelló, Spain, 1991; ISBN 8460400409. [Google Scholar]
- Zhang, X.; Kou, J.; Sun, C. A comparative study of the thermal decomposition of pyrite under microwave and conventional heating with different temperatures. J. Anal. Appl. Pyrolysis 2018, 138, 41–53. [Google Scholar] [CrossRef]
- Guevremont, J.M.; Elseinow, A.R.; Bebie, J.; Schoonen, M.A.A.; Strongin, D.R. Structure sensitivity of pyrite oxidation; comparison of the (100) and (111) planes. Am. Miner. 1998, 83, 1353–1356. [Google Scholar] [CrossRef]
- Elsetinow, A.R.; Guevremont, J.M.; Strongin, D.R.; Schoonen, M.A.A.; Strongin, M. Oxidation of {100} and {111} surfaces of pyrite: Effects of preparation method. Am. Mineral. 2000, 85, 623–626. [Google Scholar] [CrossRef]
- Hu, G.; Dam-Johansen, K.; Wedel, S.; Hansen, J.P. Decomposition and oxidation of pyrite. Prog. Energy Combust. Sci. 2006, 32, 295–314. [Google Scholar] [CrossRef]
- Rimstidt, D.D.; Vaughan, D.J. Pyrite oxidation: A state-of-the-art assessment of the reaction mechanism. Geochim. Cosmochim. Acta 2003, 67, 873–880. [Google Scholar] [CrossRef]
- Dos Santos, E.C.; de Mendonça Silva, J.C.; Duarte, H.A. Pyrite Oxidation Mechanism by Oxygen in Aqueous Medium. J. Phys. Chem. C 2016, 120, 2760–2768. [Google Scholar] [CrossRef] [Green Version]
- Gazulla, M.F.; Gómez-Tena, M.P.; Orduña, M.; Zumaquero, E.; Vicente, S. Sulphur analysis in geological materials based on coupled analytical techniques: Electric furnace-IC and TG-DSC-FTIR-QMS. In Proceedings of the International Conference on Mineral Resources-Certified Reference Materia, Ulán Bator, Mongolia, 29 January 2007. [Google Scholar]
- Thomas, P.S.; Hirschausen, D.; White, R.E.; Guerbois, J.P.; Ray, A.S. Characterisation of the oxidation products of pyrite by Thermogravimetric and Evolved Gas analysis. J. Therm. Anal. Calorim. 2003, 72, 769–776. [Google Scholar] [CrossRef]
- Gazulla, M.F.; Gómez-Tena, M.P.; Orduña, M.; Zumaquero, E.; Vicente, S. Development of new methods of sulphur analysis in geological samples based on coupled analytical techniques: Electric kiln-IC and TG-DSC-FTIR-QMS. In Proceedings of the XIV Euroanalysis, Antwerpen, Belgium, 9–14 September 2007. [Google Scholar]
- Madarász, J.; Varga, P.P.; Pokol, G. Evolved gas analyses (TG/DTA–MS and TG–FTIR) on dehydration and pyrolysis of magnesium nitrate hexahydrate in air and nitrogen. J. Anal. Appl. Pyrolysis 2007, 79, 475–478. [Google Scholar] [CrossRef]
- Sabatini, F.; Nacci, T.; Degano, I.; Colombini, M.P. Investigating the composition and degradation of wool through EGA/MS and Py-GC/MS. J. Anal. Appl. Pyrolysis 2018, 135, 111–121. [Google Scholar] [CrossRef]
- Scaccia, S. TG–FTIR and kinetics of devolatilization of Sulcis coal. J. Anal. Appl. Pyrolysis 2013, 104, 95–102. [Google Scholar] [CrossRef]
- Johnson, D.J.; Powell, J.R.; Chapman, P. Analysis of pyrite by TGA/high resolution evolved gas analysis. In Proceedings of the 9th International Conference on Fourier Transform Spectroscopy, Calgary, AB, Canada, 23–27 August 1993; Bertie, J.E., Wieser, H., Eds.; International Society for Optics and Photonics: Bellingham, WA, USA, 1994; Volume 2089, p. 544. [Google Scholar]
- Mullens, J.; Yperman, J.; Carleer, R.; Franco, D.; Van Poucke, L.; Van der Biest, J. Sulphur determination (TPR) and evolved gas analysis (TGA-FTIR) of Kortemark Clay. Appl. Clay Sci. 1993, 8, 91–99. [Google Scholar] [CrossRef]
- Parsons, A.J.; Inglethorpe, S.D.J.; Morgan, D.J.; Dunham, A.C. Evolved gas analysis (EGA) of brick clays. J. Therm. Anal. Calorim. 1997, 48, 49–62. [Google Scholar] [CrossRef]
- Paulik, J.; Paulik, F.; Arnold, M. Simultaneous TG, DTG, DTA and EGA technique for the determination of carbonate, sulphate, pyrite and organic material in minerals, soil and rocks. J. Therm. Anal. Calorim. 1984, 29, 345–351. [Google Scholar] [CrossRef]
- Hammack, R.W. Evolved Gas Analysis—A New Method for Determining Pyrite, Bicarbonate, and Alkaline Earth Carbonates. In Proceedings of the 8th Ann. W.v. Surface Mine Drainage Task Force Symp., Morgantown, WV, USA, 7–8 April 1987. [Google Scholar]
- Zumaquero Silvero, E.; Gilabert Albiol, J.; Díaz-Canales, E.M.; Ventura, M.J.; Gómez-Tena, M.P. Application of Evolved Gas Analysis Technique for Speciation of Minor Minerals in Clays. Minerals 2020, 10, 824. [Google Scholar] [CrossRef]
- Gomez, M.P.; Gazulla, M.F.; Zumaquero, E.; Orduna, M. Use of coupled TG-DSC-QMS-FTIR thermal analysis techniques in characterizating clays and ceramic compositions used in ceramic tile manufacture. Quantification of carbon compounds. Boletín Soc. Española Cerámica Vidr. 2007, 46, 259–266. [Google Scholar]
- Gómez-Tena, M.P.; Zumaquero, E.; Machí, C.; García-Ten, J. Application of the EGA (evolved gas analysis) technique in the study of variables that affect SO2 emissions during the thermal treatment of ceramic compositions for tiles. In Proceedings of the 9th Mediterranean Conference on Calorimetry and Thermal Analysis, Marseille, France, 15–18 June 2009. [Google Scholar]
- Gómez-Tena, M.P.; Machí, C.; Gilabert, J.; Zumaquero, E. Methodologies for the detection and quantification of pyrite in clay raw materials. In Proceedings of the Congreso Mundial de la Calidad del Azulejo y del Pavimento Ceramico. Qualicer, Castellón de la Plana, Spain, 17–18 February 2014. [Google Scholar]
- Gazulla, M.F.; Gómez, M.P.; Orduña, M.; Rodrigo, M. New methodology for sulfur analysis in geological samples by WD-XRF spectrometry. X-ray Spectrom. 2008, 38, 3–8. [Google Scholar] [CrossRef]
- Földvári, M. Handbook of Thermogravimetric System of Minerals and Its Use in Geological Practice; Geological Institute of Hungary: Budapest, Hungary, 2011; ISBN 978-963-671-288-4. [Google Scholar]
- Prasad, S.; Pandey, B.D. Thermoanalytical Studies on Copper—Iron Sulphides. J. Therm. Anal. Calorim. 1999, 58, 625–637. [Google Scholar] [CrossRef]
- Dunn, J.G. The oxidation of sulphide minerals. Thermochim. Acta 1997, 300, 127–139. [Google Scholar] [CrossRef]
- Yang, Y.; Liu, J.; Liu, F.; Wang, Z.; Zhang, Z. Comprehensive evolution mechanism of SOx formation during pyrite oxidation. Proc. Combust. Inst. 2019, 37, 2809–2819. [Google Scholar] [CrossRef]
- Szargan, R.; Kartio, I.; Nesbitt, H.W.; Schaufuß, A.G.; Bancroft, G.M.; Laajalehto, K. Reactivity of surface chemical states on fractured pyrite. Surf. Sci. 2002, 411, 321–328. [Google Scholar]
- Schaufuß, A.G.; Nesbitt, H.; Kartio, I.; Laajalehto, K.; Bancroft, G.; Szargan, R. Incipient oxidation of fractured pyrite surfaces in air. J. Electron Spectrosc. Relat. Phenom. 1998, 96, 69–82. [Google Scholar] [CrossRef]
- Bancroff, G.M.; Mycroft, J.R.; Nesbitt, H.W.; Pratt, A.R.; Knipe, S.W. X-ray photoelectron spectroscopic study of water adsorption on iron sulphide minerals. Geochim. Cosmochim. Acta 2002, 59, 1079–1090. [Google Scholar]
- Chandra, A.; Gerson, A. The mechanisms of pyrite oxidation and leaching: A fundamental perspective. Surf. Sci. Rep. 2010, 65, 293–315. [Google Scholar] [CrossRef]
- Chander, S.; Zhou, R.; Briceno, A. Effect of sample storage on the kinetics of pyrite oxidation. Mining, Met. Explor. 1994, 11, 141–147. [Google Scholar] [CrossRef]
- Dunn, J.; De, G.; O’Connor, B. The effect of experimental variables on the mechanism of the oxidation of pyrite: Part 2. Oxidation of particles of size 90–125 μm. Thermochim. Acta 1989, 155, 135–149. [Google Scholar] [CrossRef]
- Nordstrom, D.K.; Southam, G. Chapter 11. Geomicrobiology of sulfide mineral oxidation. Geomicrobiology 1997, 361–390. [Google Scholar] [CrossRef]
- Warner, N.A.; Ingraham, T.R. Decomposition pressures of ferric sulphate and aluminum sulphate. Can. J. Chem. 1960, 38, 2196–2202. [Google Scholar] [CrossRef]


| Sample | Crystalline Structure | Purity (%) | %S |
|---|---|---|---|
| Kaolin | Kaolinite (Al2Si2O5(OH)4) | <98 | 0.039 |
| Pyrite | Pyrite (FeS2) | <98 | 52.3 |
| Chalcopyrite | Chalcopyrite (CuFeS2) | <98 | 34.2 |
Publisher’s Note: MDPI stays neutral with regard to jurisdictional claims in published maps and institutional affiliations. |
© 2021 by the authors. Licensee MDPI, Basel, Switzerland. This article is an open access article distributed under the terms and conditions of the Creative Commons Attribution (CC BY) license (https://creativecommons.org/licenses/by/4.0/).
Share and Cite
Zumaquero, E.; Gilabert, J.; Díaz-Canales, E.M.; Gazulla, M.F.; Gómez-Tena, M.P. Study on Sulfide Oxidation in a Clay Matrix by the Hyphenated Method. Minerals 2021, 11, 1121. https://doi.org/10.3390/min11101121
Zumaquero E, Gilabert J, Díaz-Canales EM, Gazulla MF, Gómez-Tena MP. Study on Sulfide Oxidation in a Clay Matrix by the Hyphenated Method. Minerals. 2021; 11(10):1121. https://doi.org/10.3390/min11101121
Chicago/Turabian StyleZumaquero, Eulalia, Jessica Gilabert, Eva María Díaz-Canales, María Fernanda Gazulla, and María Pilar Gómez-Tena. 2021. "Study on Sulfide Oxidation in a Clay Matrix by the Hyphenated Method" Minerals 11, no. 10: 1121. https://doi.org/10.3390/min11101121
APA StyleZumaquero, E., Gilabert, J., Díaz-Canales, E. M., Gazulla, M. F., & Gómez-Tena, M. P. (2021). Study on Sulfide Oxidation in a Clay Matrix by the Hyphenated Method. Minerals, 11(10), 1121. https://doi.org/10.3390/min11101121