Abstract
This review article discusses the latest advances on molten phase monitoring in metallurgical processes by using Laser-Induced Breakdown Spectroscopy (LIBS). LIBS is an analytical laser-based technique, where a pulsed laser is focused on a sample to create a plasma. The optical emission from the plasma can be transferred through open-path optical configuration or via an optical fiber to a spectrometer to receive analytical information in the form of elemental composition. Thus, a relatively long-distance analysis can be performed using LIBS. Several modern experimental arrangements, patents and industrial notes are assessed, and the literature is reviewed. The review includes applications of LIBS to analyze steel, iron, aluminum, copper, slags, metal melts, and other materials. Temperature, pressure, and atmospheric composition are crucial parameters of any melting process. Hence, past studies on molten phases describing these parameters have been discussed. Finally, the review addresses the last technological advances for these types of applications. It also points out the need of development in some fields and some limitations to overcome. In addition, the review highlights the use of modern machine learning and data processing techniques to increase the effectiveness of calibration and quantification approaches. These developments are expected to improve the performance of LIBS systems already implemented at an industrial scale and ease the development of new applications in pyrometallurgical processes to address the stringent market and environmental regulations.
1. Introduction
Geological materials, metals, non-metals, and fuel minerals are the most important resources of the current industrial civilization. Ever since the Bronze Age, humankind has depended on metals that are essential materials for the well-being and development of our civilization. Gold, silver, and copper were the first metals used by humans, as they were found in a state called “native state”, meaning they were ready to be used [1]. Afterward, with the advent of technology, complex ores were refined to produce metals. Extraordinary growth of pyrometallurgy began in the second half of the 19th century. Considering copper metal as an example, the global annual production of copper at the beginning of that century was only 400,000 tons. By the 2000s, copper production was approximately 25 times the previous amount [2]. In this context, more than 90% of extracted copper comes from mines, while the remaining 10% is recycled and processed using pyrometallurgy.
1.1. Need for Process Monitoring and Sensing
Pyrometallurgical processes are intensively used for refining metals such as steel, aluminum, copper, zinc, lead, molybdenum, and others. Conceptually, the pyrometallurgical processes consist of the chemical transformation in the molten phase, which is based on the oxidation of impurities and reduction in valuable metals. Phase separation takes place during these reactions, where the heaviest metallic phase is separated from oxidized compounds contained in the slag, which floats on the molten material. The monitoring of the chemical composition of the molten phases (slag and metal) is a very important issue for optimizing the process and achieving proper use of resources, energy, and desired refining products [3]. Nevertheless, online analytical assessment is a challenging task because of harsh environmental conditions for sensors and equipment added to the miscellaneous form of the sample [4,5,6,7]. Conventionally, in most pyrometallurgical production processes, the sampling takes place manually utilizing a lance and a small mold (hollow tube). The molten sample is cooled down and preprocessed to make it eligible for further analysis by conventional analytical instrumentation such as spark-optical emission spectroscopy (OES), X-ray fluorescence (XRF), inductively coupled plasma optical emission spectroscopy (ICP-OES), and atomic absorption spectroscopy (AAS) in a dedicated lab facility. Analytical procedures are performed by a specialized lab technician under strict quality-control procedures. The entire analytical process, including sample collection, preprocessing, and analyzing, is time consuming and cost intensive. Therefore, analytical delays and lack of real-time monitoring for process control are current challenges in the pyrometallurgical industries of any metal processing [7,8]. In this scenario, furnace operators determine the action to be performed for adequate processing of the molten metal using their experience, basing their decisions on very few physical parameters, such as the temperature and color of the molten phase. This can result in substantial quality issues, loss of product, and environmental problems. For process monitoring and control, it is essential to incorporate online analytical technologies, gained mostly from the steel and aluminum industry, where much progress in the sensors dedicated to molten phase analysis has been achieved.
Currently, there is prominent demand for the assessment of the chemical composition of molten metals and molten alloys in real time. This need is based on the possibility of increasing the cost effectiveness of the process compared to individual sampling and off-site evaluation. Most current techniques are based on the detection of radiation from the molten bath; nevertheless, these are not able to measure specific metal concentrations in both phases. In this context, laser-based techniques, such as LIBS, bear great analytical potential due to their highly energetic radiation source capable of creating a plasma, long-distance analysis, and enhanced suitability for metal analysis.
In this review article, different aspects related to molten phase monitoring by LIBS are discussed, such as the advantages, variables of optimization, instrumentation developments, and data processing.
1.2. Measurement Technologies for Melting Processes
In general, instruments can be classified into two categories depending on the kind of approach they use: active or passive. Active approaches refer to those that start with a source of some form of radiation that collides with the molten material, producing radiative signals that are measured to evaluate the molten phase properties. Some of these techniques are laser-induced breakdown spectroscopy (LIBS), laser-induced fluorescence (LIF), diffuse reflectance spectroscopy (DRS), and Raman spectroscopy, among others. Passive approaches are those based on collecting and analyzing radiation from the system, such as radiometry and hyperspectral image techniques. The latter do not require stimulation or direct contact with the sample. However, there are some technical challenges associated with sensors in molten phase environments that need to be addressed, such as
- High-temperature conditions: Measurement components and equipment are affected by ambient temperatures near the molten process. Specifically, optical-based devices suffer from alignment losses when exposed to temperature changes. In this context, high strength (“heavy duty”) and isolated devices are needed. Nevertheless, ambient temperatures, corrosive atmospheres, and dust produce accelerated deterioration and failure of these devices.
- Distance: Equipment and molten sample need to be adequately separated to ensure equipment safety. Nevertheless, there is a limited number of techniques that can ensure precise measurements without endangering the equipment. Relatively long distances produce sensitivity loss and influence detection limits. On the other hand, the proximity of the sensors increases the detrimental effect of the heat. Therefore, the housing of the equipment must be specifically designed to ensure the safety of the optical elements.
- Spectral background: The spectral background in molten conditions follows Planck’s law, describing the black body emission of light. This issue requires special attention in data treatment for avoiding spectral interferences of the continuous emission of molten samples. Additionally, the fluctuation caused due to the temperature, must be considered for better sensitivity and detection limits.
- Slag phase interference: Estimation of chemical composition in molten phases implies the spectral characterization of the interaction surface. The surface chemical composition is different from that of the complete sample. Thus, spectral techniques are limited to the acquisition of chemical composition in the lighter phase, located in the upper part of a molten bath, e.g., slag measurement. This phase impedes the analysis of the phases located below the slag. Overcoming this drawback is possible by using immersion and non-immersion probes, depending on whether the investigation is carried out on the surface or inside the molten material. Nevertheless, immersion probes suffer from rapid deterioration, and short-term maintenance is needed. In this sense, it will require major effort to expand the limited capacity of optical sensors to obtain the so-called deep profile of the sample.
- Data processing: Chemical reactions in the molten phase are rapid. High-frequency sampling is, therefore, required for following all chemical changes. This implies the need for fast data acquisition and processing.
1.3. Why do We Need a Review?
LIBS spectroscopic information, instrumentation, and data analysis from different molten metal processes are still emerging. There are few review articles on this topic (discussed briefly in the following section); hence, it is important to address the literature dating from the invention of equipment to its use for monitoring pyrometallurgical processes along with recent developments.
In 2005, Fergus reviewed the literature of sensors that are employed to evaluate the quality of molten aluminum in foundry processes. The author compiled the literature related to LIBS and galvanic cell-based chemical sensors for alloy composition studies, reduced pressure test (RPT) and solid electrolyte-based hydrogen sensors for determining gas content in the molten phase, and electromagnetic and acoustic-based technologies used for detecting inclusions in molten aluminum [9]. On the other hand, Dong et al. reviewed the progress of metallurgical LIBS technologies developed in China [10]. However, the review presents a very localized revision of cases with little discussion of the compiled literature. In this context, an in-depth review of LIBS applied to the monitoring of molten processes is lacking.
Some book chapters [11], reports [12], and other review articles [13,14,15] mention LIBS applications in the context of specific metal and slag analyses.
Hudson et al. produced a more suitable review article focused on this topic [16]. However, this article evaluated applications of LIBS in molten metal processing with the limited literature that was available until 2015.
Taking into account the steady increase in research publications and patents in this area over the past years, we have focused this review on studies related to LIBS and molten metals. Moreover, we supply literature from several book chapters, journal articles, technical notes of companies and patents that provide a clear understanding and deeper insights of LIBS applications in all molten phases of steel, iron, aluminum, zinc, copper, different types of metallic slags, other low melting point metals, rare earth metals, and mineral wools. We have clustered references in the following categories of application: steel- and iron-based melt, aluminum, slags, other metals, and materials. The number of references associated with each category is summarized in Table 1, and their distribution with the time of publication is depicted in Figure A1. As can be seen, the use of LIBS in the analysis of steel and iron-based melts has received significant attention, with an important number of publications between 2002 and 2006. The analysis of molten aluminum has been thoroughly studied and an increase in publications was seen between 2012 and 2016, which was also maintained between 2017 and 2021. The study of slag was also started in early 2000, but as compared to aluminum, the intensity was very low. The application of LIBS to other molten phase materials and minerals has slowly attracted attention during the last twenty years.

Table 1.
Categories of LIBS applications summarized in this review.
2. Laser-Induced Breakdown Spectroscopy (LIBS)
Conceptually, laser-induced breakdown spectroscopy (LIBS) is an atomic emission spectroscopic method that involves a high-power laser pulse focused on a target sample. When the focused beam hits the target, a plasma is created, the light emitted from the plasma contains elemental signatures of the sample [17,18,19,20,21,22,23]. This is an active instrument, especially suitable for in situ applications.
LIBS-based techniques have the following advantages:
- i.
- Multi-elemental analysis can be performed from metals to non-metals.
- ii.
- They require minimum or no-sample preparation.
- iii.
- The sample can be measured regardless of whether it is solid, liquid, or gaseous.
- iv.
- They can be applied to any material irrespective of its conducting or non-conducting properties.
- v.
- Fast measurement capability.
- vi.
- Single-shot analysis ability.
- vii.
- Since they are laser-based techniques, visual line of sight is sufficient, enabling the employment of LIBS in harsh environments, where human intervention or reach is difficult.
The instrumentation consists of an excitation source (a high-energy pulsed laser), time-gated spectrometers, and optical arrangement for collecting and collimating radiation. Several laser devices such as nanosecond, picosecond and femtosecond lasers are capable of producing plasma with powers exceeding in the order of gigawatts per pulse [17,24,25]. However, for the molten phase application nanosecond lasers are suitable such as Nd-YAG, excimer laser, and many more. The description of detectors is provided in the subsequent section. The LIBS spectral data analysis starts with line assignments, normalization, and calibration of the spectra (discussed elaborately in Section 2.1).
2.1. Optimization of LIBS
LIBS measurement involves several parameters to be selected such as instrumental, physical, chemical factors, and data processing. Some of these parameters need to be optimized before the measurements for molten metal analysis and these are mentioned in this section.
- Detector choice: It is mandatory to use detectors (detectors such as the linear array gated CCD (charge-coupled device), ICCD (intensified CCD) that produce time-resolved plasma measurements. Temporal parameters of detectors such as delay time, integration time, and accumulation of multiple laser shots should ensure that emission lines result distinguishable from background noise, i.e., a reasonable signal-to-noise ratio is obtained.
- Spectral region: At higher temperatures, thermal radiation from molten samples begins to interfere with the visible regions of LIBS. Apparently, wavelengths over 500 nm contribute to the background signal [26]. The efficient collection and transmission of the radiation emanating from the plasma generated on the melt surface is an important aspect to consider for achieving high sensitivity [27]. A solution to this problem is to increase the light amplification at shorter wavelengths in the UV regions [28].
- Line selection: The selection of specific spectral lines is an important factor since interference from adjacent, closely overlapping spectral lines of other elements can hinder calibration results. Thus, the use of high-resolution spectrometers is desirable [28]. The involvement of self-absorption lines also makes the calibration nonlinear. Therefore, the upper limit of linearity before self-absorption should be carefully quantified to be within the required concentration range, which improves limits of detection (LOD) [29]. For these reasons, the selection of strong spectral intensity lines for calibration sometimes leads to saturation effects and non-linear spectral behavior.
- Averaging/accumulation of spectra: Changes in molten surface composition and plasma variations induce intensity fluctuations of LIBS signals. These fluctuations are usually addressed by averaging or accumulating LIBS signals, which enhances the signal-to-noise ratio along with improvement in repeatability and reliability. However, there are some instances where averaging may not be suitable. One of these cases is the analysis of liquid steel with slag under stirring, where the spectral differentiation of both phases is important. Gruber et al. suggested acquiring multiple single-shot spectra and excluding the slag-related spectra by monitoring Ca [30]. Therefore, the selection of spectra needs to be addressed on a case-by-case basis.
- Surrounding atmosphere and matrix effect: When stoichiometric ablation and detection is disturbed by physical and chemical properties of the sample, the resulting spectrum is considered to be under influence of matrix effect. The composition of plasma is dependent not only on the stoichiometry of the sample but as well as thermal, optical properties of the sample, surface of the sample and laser parameters. The atmosphere surrounding the molten sample can influence the chemical composition of the surface. In the case of molten aluminum alloy, oxidation can occur in the presence of air. Consequently, the selection of argon is recommended for avoiding oxidation and increasing the emission line-to-background ratio [31]. The argon purging also reduces the involvement of ambient atmosphere emission lines in the LIBS plasma avoiding matrix effects related to it. Moreover, this selection ensures the repeatability of measurements with better figures of merit [29]. In some reports, argon was also used for displacing slag-related components on the surface.
- Spectral normalization: Spectral normalization can reduce the uncertainties related to plasma fluctuations. One of the normalization methods is the so-called ratio method, in which the ratio between intensities of the analytical spectral lines (IEl) and the internal standard reference lines (IRef) is calculated, which compensates for the changes in plasma conditions, such as plasma temperature [32]. The internal standard reference lines are matrix-related lines that are considered to be constant throughout the measurement process. However, one should be cautious in selecting proper reference lines. If the upper energy levels of spectral and reference lines of elements are close, then the line intensity ratio (IEl/IRef) becomes temperature independent. The use of expanded spectral region detectors, such as echelle spectrograph, is advantageous in such scenarios because more lines may be available for the selection of reference lines. This method has been adopted by most of the researchers in the field of LIBS of metals in the molten phase [28,30,31,33].
- Laser Fluence: Depending on the type of measurement and analysis, the laser fluence must be optimized taking into account the different phases of the metals. At higher temperatures, the interaction of the laser with the sample produces higher ablation rates and leads to higher intensities that could saturate the detector. Hence, the use of optimized laser energy for solid slag at high temperatures is necessary to obtain relevant spectra for analysis [34].
- Optical arrangements: The laser focusing on the sample surface is crucial in a LIBS setup. If the system comprises an open-path arrangement, the use of longer focal length lenses is advantageous for focusing. By increasing the Rayleigh length, the influence of fluctuations of the focal distance is reduced [35]. Sometimes, aerosol condensation spreads in the surroundings of the molten sample, which causes pre-breakdown of plasmas; thus, a careful focus on the surface sample is highly desired [36].
- Calibration: The liquid metal concentration must be verified with experiments established in the solid phase, before and after melting. Ideally, all measurements should be carried out under the same conditions. However, in practice, system parameters may occasionally vary, resulting in different plasma conditions and rendering calibration curves invalid.
Kondo performed a comparison of the generated plasma from solid (room temperature) and molten steel [37]. The results showed little significant difference in electron temperature of the plasma between both phases of a metal. In this context, the ablated mass from the molten metal was greater than that of the solid state. Another study reported the comparison of stainless steel before and after melting at 1420 °C. It was observed that some peaks were absent in the LIBS spectra of the molten sample, and others decreased in signal intensity compared to those of the solid phase at the same melting temperature [38]. In this circumstance, the proper selection of elemental species in both of the phases is critical.
Calibration curves correlate the concentrations with either linear or non-linear trends. Many experimental factors influence the correlation causing deviations in calibration curves, making them non-linear. The region where the calibration curve remains linear is called linear dynamic range (LDR) or level of linearity (LOL) [17]. The causes for the non-linearity of calibration curves can be (a) spectral interference from other species in the vicinity of the central wavelength of the analyte (due to improper choice of the emission line), (b) inconsistency in the inclusion of background emission with analyte emission, and (c) saturation and self-absorption of the signals. More details can be found in the literature [17,18,39].
The LIBS calibration of some volatile impurities such as Na in molten aluminum presents bad agreement with standard methods such as OES. As Na has a higher vapor pressure, and it evaporates with heat [40]. This problem can be reduced using double-pulse or multiple-pulse LIBS strategies [41].
2.2. Developments in LIBS Sensors for Monitoring Molten Phase
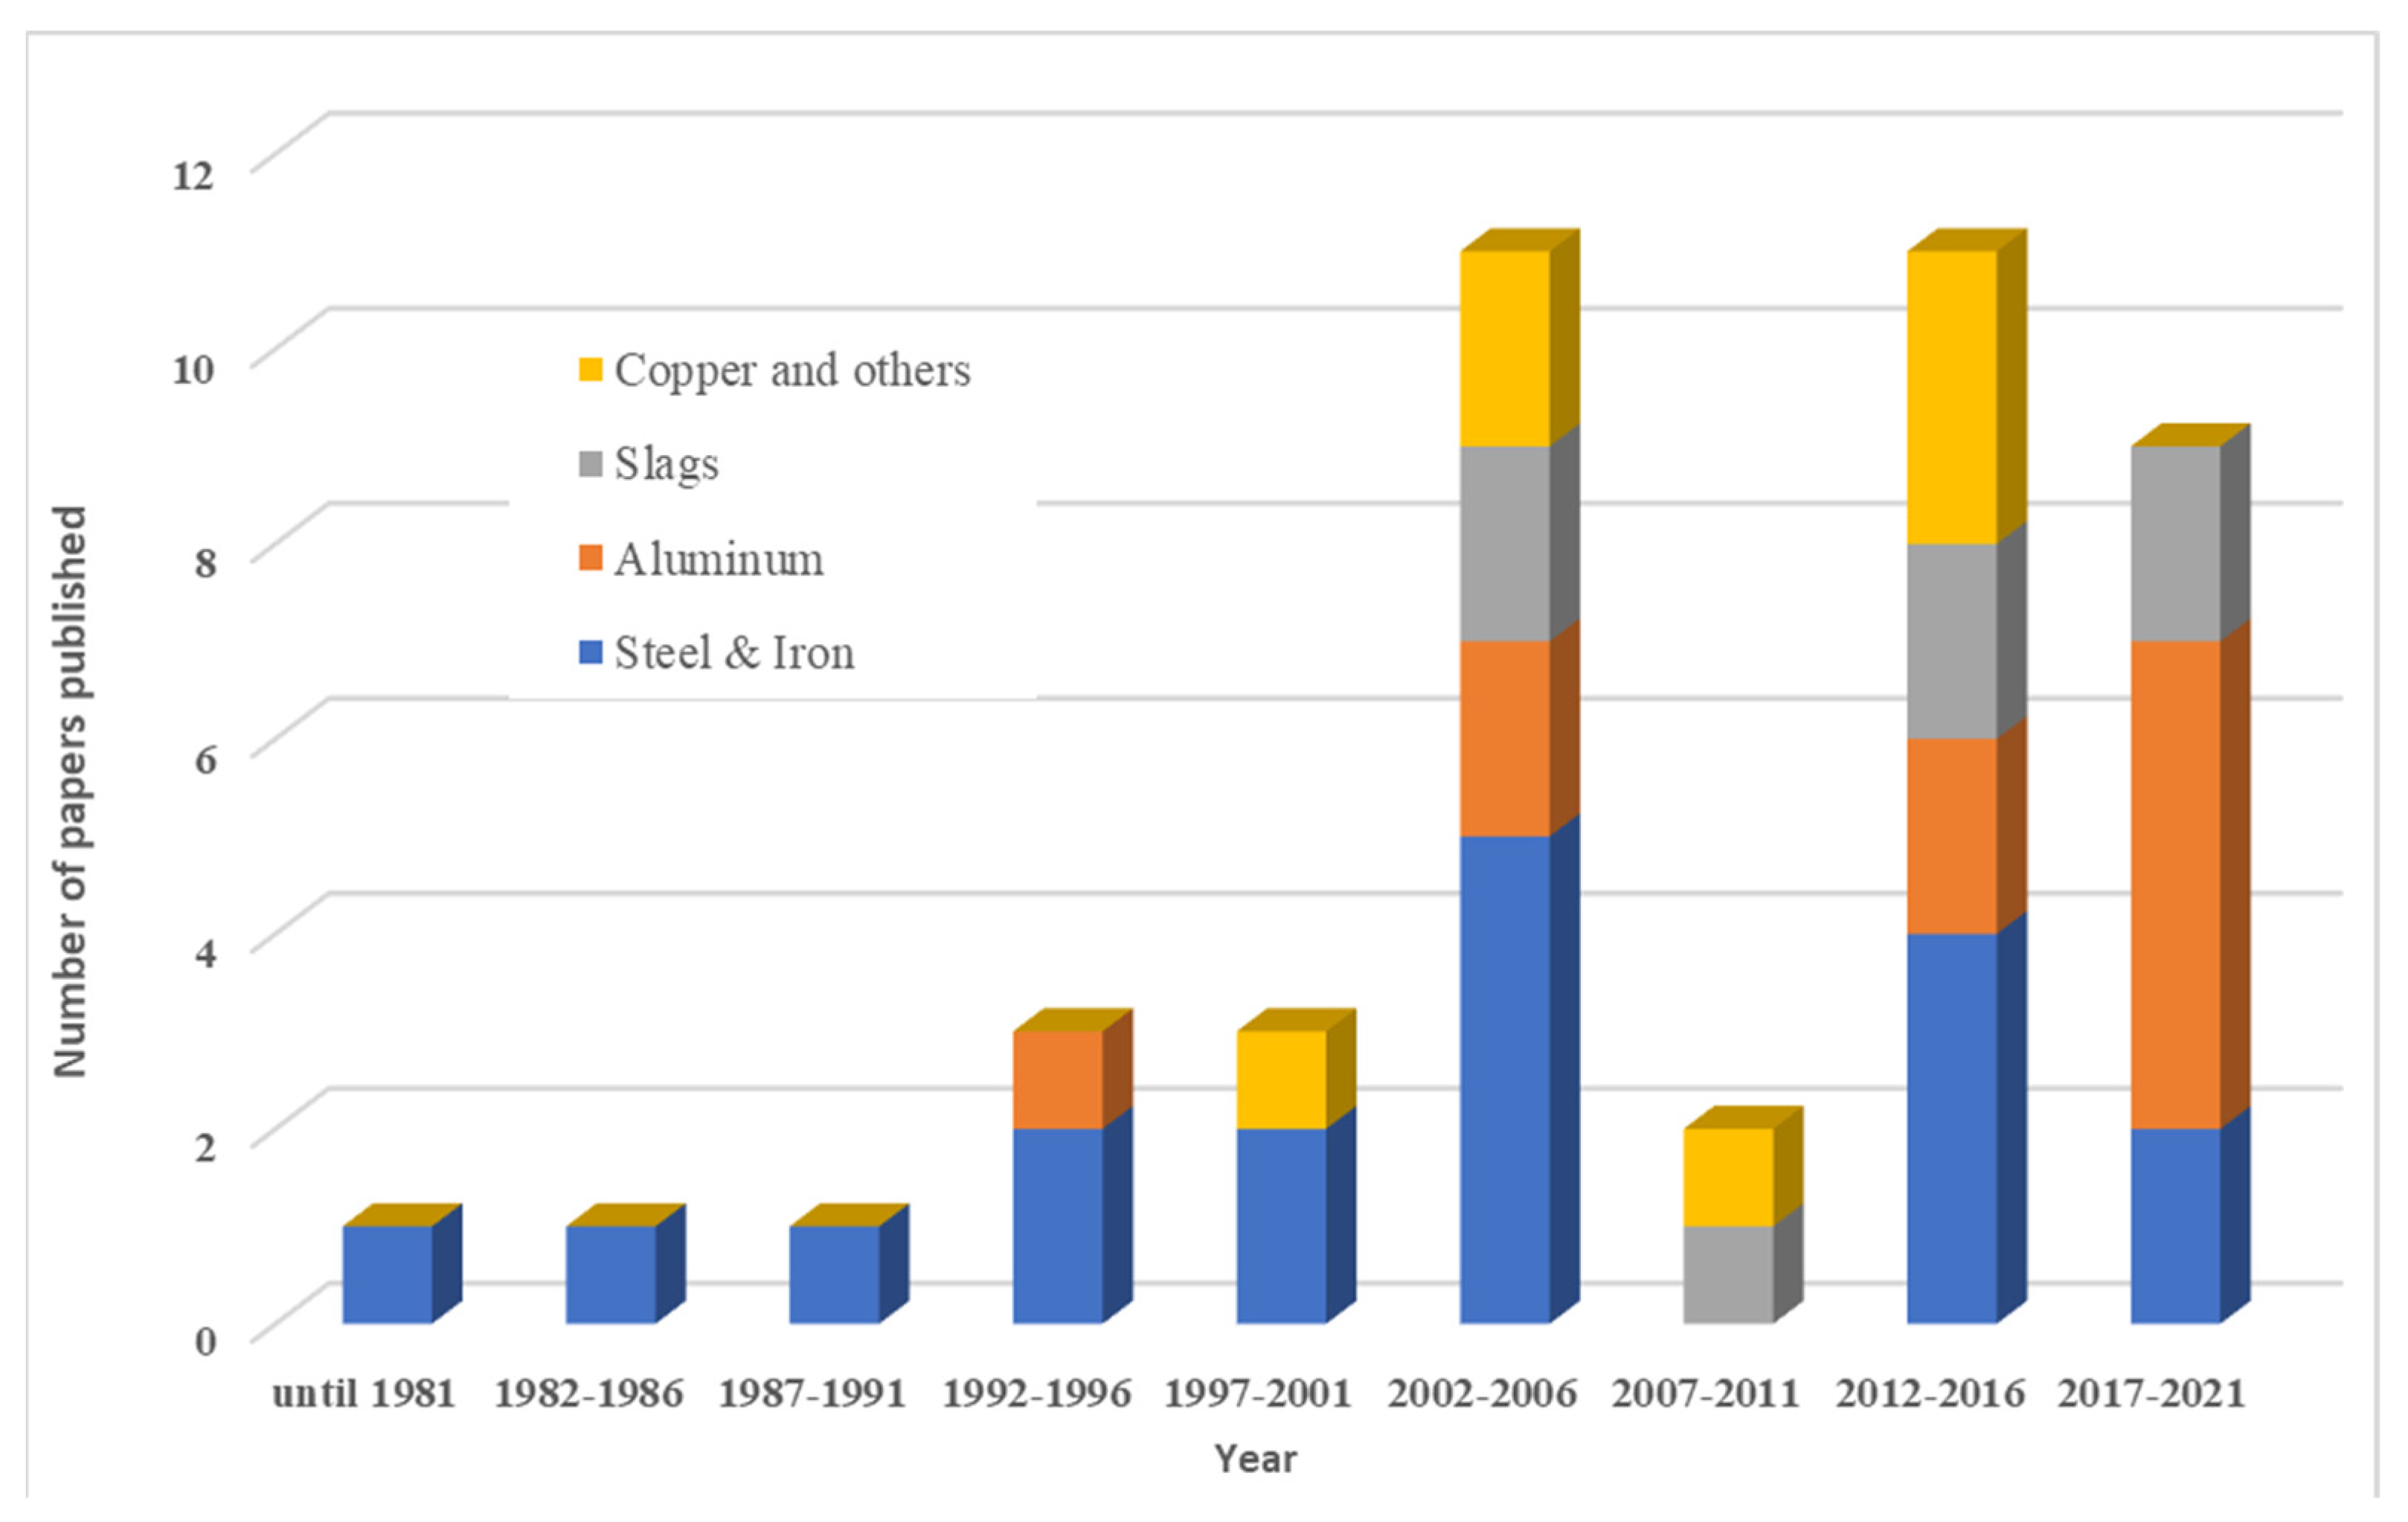
In this section, the development of LIBS sensors/systems for the determination of the elemental composition of the molten phase are presented. The kind of information obtained from molten metal can be categorized into surface and internal, depending on the location of the information source. A basic representative diagram is shown in Figure 1. Figure 1A depicts a laser focusing on the surface of the liquid, where elemental composition information of slags and impurities can be obtained. Figure 1B describes the acquisition of LIBS signals emanating from inside the molten metal, where an opening is maintained by a constant flow of argon gas, while the excess of gas is expelled through an outlet vent tube. The analysis of the internal regions can be performed in a vent from the bottom or in a lateral window of the furnace. To acquire a better understanding, the discussion is divided into four sections based on the research availability of the different metals. These sections are: (a) steel and iron based, (b) aluminum, (c) slags, and (d) other metals and minerals.
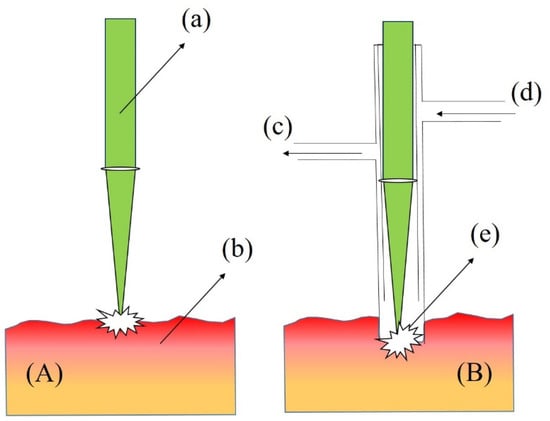
Figure 1.
Basic schematic diagram of LIBS investigation of the molten metal, obtaining spectrochemical information by focusing a laser pulse (A) on the surface, (B) inside melt using a tube with the provision of purging inert gas in and out to maintain opening for the interaction. The parts of the diagram are (a) pulsed laser, (b) melting pool of metal, (c) outlet gas, (d) inlet gas, and (e) laser-induced plasma.
2.2.1. Steel and Iron-Based Melt
The first report of LIBS investigation in molten steel was appeared in 1966 [42]. Ruby laser pulses at 694.3 nm were utilized to study liquid steel produced in laboratory induction furnaces. Two calibration graphs were constructed in each solid and liquid phase of steel using the ratios of Ni/Fe and Cr/Fe. Atomic lines of Ni (341.5 nm); Cr (396.4 nm), and Fe (376.6 nm) were chosen for this study. After almost two decades, Ozaki et al. investigated carbon, silicon, and manganese on the surface of molten iron in an alumina crucible heated by an induction coil, maintaining differently shaped containment atmospheres such as conic and cylindrical atmospheres [43]. They demonstrated that the utilization of intensity ratios with internal standards minimizes the influence of surface fluctuations on the final result. Additionally, the effects of various controlled atmosphere devices with different shapes on the analysis of elemental intensity ratios and the influence of CO2 gas flow on C(I) at 193.1 nm were studied. Fe(II) at 271.4 nm was considered as an internal standard reference line. Other spectral lines of Mn(II), Si(I), C(I) at 293.3, 212.4, and 193.1 nm were chosen, respectively, to determine the intensity ratios using the internal standard line to monitor the process.
In 1991, the LIBS was first time utilized as an industrial application. The system was utilized to monitor liquid steel. The measurements demonstrated a detection limit for the carbon of approximately 200 µg/g [44]. The same research group trademarked the name LIESA (Laser-Induced Emission Spectral Analysis), and manufactured instruments based on LIBS methodology at the Krupp steel plant in Essen, Germany [32]. In this work, the concentration of carbon using the C(I) line at 193.1 nm was measured and a Fe(II) line at 193.2 nm was selected as a reference to calculate the associated ratio. The calibration was performed with the help of standard XRF analysis. The employed spectrometer was sealed with nitrogen to avoid absorption of UV region lines by atmospheric oxygen. From the sidewall of the converter, a tube was connected to the molten metal and flushed with argon to prevent metal from flowing into the tube. Through the same opening, laser-plasma was also created in the melt.
Aragón et al. evaluated the carbon concentration in molten steel in a laboratory crucible with a conventional, fixed experimental setup involving laser focus, light emission harvesting, and pure argon gas [45]. The argon gas jet-flow was used to prevent the signal contamination from atmospheric CO2 as well as to purge the oxides formed on the surface of the sample. The limit of detection achieved for carbon was 250 µg/g.
Palanco et al. used a 1064 nm laser as an excitation source, with temperatures ranging from 25 to 1200 °C in the lab oven [46]. They studied stainless-steel samples and their properties such as sample crater morphology, depth profiling, and the formation of oxide layers [44]. In another investigation, calibration curves of Ni and Cr were generated by successive addition of the corresponding elements into the molten steel [38]. Gruber et al. monitored the real-time concentration of elemental contents in molten steel using the ratio between the intensity of elements (viz. Cr, Cu, Mn, and Ni) and reference lines of Fe [28]. Focusing lens systems, laser, and fiber optics were mounted in an integrated system on a rugged aluminum board, while the remaining parts of the system consisted of a laser power unit and a spectrometer, kept at a 12 m distance. In another investigation, they reported the contents of Cr, Mn, and Ni in a vacuum degassing vessel using the ratios Cr (434.5 nm)/Fe (440.5 nm), Mn (323.1 nm)/Fe (322.2 nm), and Ni (341.5)/Fe (340.8 nm) [30]. Furthermore, the authors performed real-time measurements in a vacuum induction melting furnace. In a technical report, the same group used a dedicated system with a trademark name VAI-CON® Chem, achieving continuous and simultaneous measurement of composition and temperature of molten steel in metallurgical vessels [47].
The calibration of carbon, phosphorus, sulfur, nickel, and chromium in molten steel was carried out by Peter et al. in a 100 kg induction furnace achieving a remarkable LOD below 21 µg/g by using emission wavelengths in the VUV region [27]. Using a self-designed open-path LIBS device, the surface composition of molten steel was demonstrated in the laboratory setup. Hubmer and co-workers developed a laboratory induction furnace for producing steel melt at ~1600 °C in an argon atmosphere, simulating an argon oxygen decarburization (AOD) converter. Calibration was performed by computing intensity ratios of Ni (341.48 nm)/Fe (358.12 nm) and Cr (267.72 nm)/Fe (259.94 nm) [31].
Kondo et al. investigated the solid and molten steel plasma properties [37]. Electron temperature and density were determined in both phases, where very small differences between electron temperatures were found in both phases. However, the electron number density of the solid state was 46% higher than the liquid steel under the same experimental conditions. Emission line profiles of the elements were found to broaden in the case of solid steel plasma compared to those of the molten phase. This was attributed to a higher number of laser photons being absorbed by the solid target than in the molten target.
Sun et al. performed semi-quantitative analyses of Cr, Ni, Si, and Mn in synthetic molten steel using a custom-built LIBS instrument that contained two platforms [48]. The first platform was the frontal part that could be operated at an angle of 45 degrees. This platform consisted of the laser, lens optic arrangements, and a temperature shield. The laser power supply unit, computer, spectrometer, and its electronics were in a second control platform. This group adopted a system that comprises a Cassegrain telescope in addition to a double pulse laser to study the quantitative analysis of Si, Mn, Cr, Ni, and V in samples of molten steel in a 1 kg capacity laboratory furnace [41] (Figure 2A). To perform the calibration, univariate and partial least squares (PLS) regression were utilized and compared, where PLS offered better repeatability and accuracy with root mean squared error of prediction (RMSEP) values of approximately 5%. To counter the fluctuation in spectra caused by argon purging, the internal standard ratio method was used. In addition, the system was tested in an industrial oven (Figure 2B) for estimation of C, Si, and Mn.

Figure 2.
Molten metal analyzing LIBS system developed by Sun et al. [41]. (A) Schematic diagram of LIBS system and laboratory photograph and (B) steel plant photographs consisting of sealed LIBS setup and refractory lance tip immersed in the ladle of molten steel. (Reprinted from Spectrochimica Acta Part B: Atomic Spectroscopy, vol. 112, Sun, L., Yu, H., Cong, Z., Xin, Y., Li, Y., and Qi, L. In situ analysis of steel melt by double-pulse laser-induced breakdown spectroscopy with a Cassegrain telescope, p. 40–48, 2015. Copyright (2015), with permission from Elsevier).
Xiaomei et al. studied the compensation of calibration errors in carbon determination in ferroalloys by performing calibration at different temperatures [49]. At a temperature of 1620 K, the estimated carbon content in the molten sample was found to be in good agreement with the solid sample. Moreover, Qiang et al. developed a LIBS-IR thermometry system to determine the constituent element information and temperature of molten carbon steel [50]. Cr and Mn calibration was carried out by calculating ratios with iron spectral lines as internal standards. Certified carbon steel samples were used to calibrate LIBS data and temperature measurements were compared using a pyrometer. Zhao et al. determined concentrations of Cu, Ti, Mo, Al, and Cr in molten steel by estimating ratios with internal standard reference lines of Ni [51]. The temperature was maintained at 1700 °C using a vacuum induction furnace for melting the standard steel alloys.
2.2.2. Aluminum
In this section, LIBS application for molten aluminum analysis is presented. Numerous research articles related to elemental compositions of main constituents, impurities, and inclusions in molten aluminum and alumina have been addressed.
In 1996, Paksy et al. implemented quantitative analyses in the molten phase of aluminum alloy by focusing laser pulses on the surface with the help of a stable optical system design, where the emission was collected at the right angles to the direction of incident laser light [29]. Good agreement in calibration curves for both solid and liquid phases of aluminum alloy was obtained utilizing the lines of Mn (294.9 nm) and Al (281.06 nm) in a lab crucible furnace. Although both calibration curves were linear, they possessed different slopes. Finally, they concluded that different excitation mechanisms were responsible for the differences between the solid and molten phases.
Rai et al. developed a fiber optic LIBS probe to monitor molten aluminum [52,53]. A single fiber was used to transport the laser pulse to the probe and collect the emission signal back in the same path with the fiber. The probe consisted of a collimation-collection lens, a gas inlet–outlet arrangement, and a thermocouple, which can be adjusted to be inserted in a molten sample for measurements. The authors reported successful fiber-optic probe tests in a laboratory furnace and a pilot furnace. Although the system design is intended to perform molten material analysis, its application is limited due to the constraints of the lower laser power of fiber.
There has been a great deal of research accomplished by Energy Research Company (ERCo) using LIBS-related technology for molten material analysis [54,55]. A dedicated trademark LIBS system, OnSpec®, was developed for molten metal analysis [56]. They tested LIBS prototype instruments at different aluminum plant facilities and compared the monitored LIBS concentrations of Si, Fe, Mg, Cu, Mn, Zn, Ti, Cr, Sr, and Ni with the OES laboratory analysis of industrial plant samples after the measurements with the laser.
The comparison of LIBS analytical performance with any standard analytical technique on the same sample at the same time is challenging, particularly for the validation of experiments. Frequently, the solid standard metal (before melting) may not possess the same elemental distribution as its molten phase. This may be due to the vaporization and formation of oxides, or due to some others. To understand the true distribution of elements in and after melting, experiments were performed with LIBS and Spark-OES by Gudmundsson et al. [40,57]. The investigation included the estimation of trace elements such as Fe, Si, Cr, Mn, and Ti ranging between 20 and 3000 µg/g in the molten aluminum using a commercial LIBS analyzer. The acquisition of LIBS was performed by ladle robotic feeding. Subsequently, the sample was treated and shaped cylindrically using iron molds for further Spark-OES measurements. They also performed an on-site analysis of 14 elements viz., Fe, Si, Cu, Ni, Ti, Cr, Mn, Sn, V, Ga, Zn, Sb, Mg, and Na from a casting line in molten Al within a primary smelter (Figure 3) [40]. Furthermore, they reported real-time repeatability in comparison with OES, stability of intensities, and concentrations of elements for 2.5 h [58]. The measurement stability was steady because the liquid surface was not modified (because the liquid surface resettles) by the LIBS analysis, while in the case of OES the solid sample surface may be modified by the analysis. The measurement of stability was assessed for the elements Fe, Si, Ga, V, Ti, Cu, Mn, and Cr. The non-repeatability of the concentration of the elements Zn, Mg, Na, and Sb was attributed to their high vapor pressure, while increments in Ni concentration may be due to the melting of the thermocouple used for temperature measurement, which was made of Nickel.
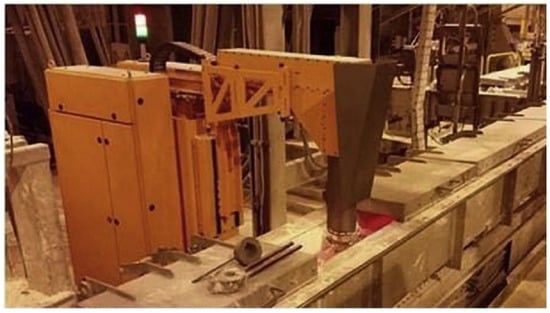
Figure 3.
Molten aluminum monitoring industrial LIBS analyzer developed by Gudmundsson et al. [40]. (Reprinted from. Spectrochimica Acta Part B: Atomic Spectroscopy, vol. 158, Gudmundsson, S. H., Matthiasson, J., Björnsson, B. M., Gudmundsson, H., and Leosson, K, Quantitative in situ analysis of impurity elements in primary aluminum processing using laser-induced breakdown spectroscopy, p. 105646, 2019. Copyright (2019), with permission from Elsevier.)
Sun et al. introduced a method called molecular ratio to calculate the ratio of NaF to AlF3 in aluminum reduction cells, which is constant at high temperatures [59]. First, the molecular ratio was determined for solid samples from different cells after being analyzed by XRF. Then, LIBS was applied to construct a calibration model with predetermined samples using XRF. It is worth noting that in reduction cells, the difference in densities causes liquid aluminum and liquid electrolytes to be divided into two layers, where aluminum sits at the bottom and the rest forms an upper layer. A tubular lance was inserted into the layers and the spectra were acquired. The strong magnetic field was generated by the cell-influenced xenon flashlamp-pumped laser, which resulted in poor spectra. Since the laser energy was nearly halved, the molecular ratio was determined using univariate and PLSR models for solid phase, which was not the same as liquid phase. However, the spectra of molten aluminum were found to be stronger than the solid phase, while the spectra related to molten electrolytes were similar to its solid phase. In another investigation led by Lu et al. from the same research group [60], the input variables were screened by PCA and PLS. These variables were utilized for various multiple regression models such as multiple linear regression (MLR), PLS, artificial neural networks (ANN), and support vector machine (SVM). The PLS-ANN and PCA-SVM models achieved good predictions with RMSEs 0.1 and 0.136, respectively.
Apart from the identification of elemental composition, the ability of LIBS for real-time analysis of solid inclusions in liquid aluminum has also been demonstrated [61,62]. Solid or liquid phase particles that appear due to external influences were termed as inclusions. Liquid aluminum was oxidized due to the influence of external ambient air, resulting in inclusions appearing as oxide particles in it. Detailed information about the causes of inclusions, inclusion effects, measurement methods, and the application of LIBS for the detection of inclusion can be found elsewhere [63]. Calibration curves for boron and titanium were constructed by the inclusion of varying quantities of TiB2 particles in molten aluminum by using a laboratory furnace [64].
2.2.3. Slags
Literature related to different molten metal slags was collected and incorporated in this section to provide clear insights into the type of information and analysis that has been carried out for molten slag samples.
Kraushaar et al. analyzed CaO, SiO2, and Fe using LIBS on slag samples from steel converters against standards that were calibrated using XRF. They obtained good repeatability, namely, these standards showed relative standard deviation (RSD) less than 1.0% [65]. Sturm et al. analyzed slag samples in a vacuum degasser station for steel and determined the mass fractions of CaO, SiO2, and Al2O3 by calibrating with borate bead analysis (BBA) and XRF [66]. They carried out the stability test of LIBS using the ratio of silicon line to the zeroth-order position of the reflected beam with data collected for more than 8 weeks. In 2014, the same research group studied major constituents viz., CaO, Fe, SiO2, MgO, Mn, and Al2O3 in liquid slags of steel by constructing linear, or quadratic, calibration models of the mass fraction ratios in terms of the ratios between the area of spectral lines and internal standard lines [67]. The system (Figure 4) was successfully tested in an industrial plant for 3 months working 24/7.
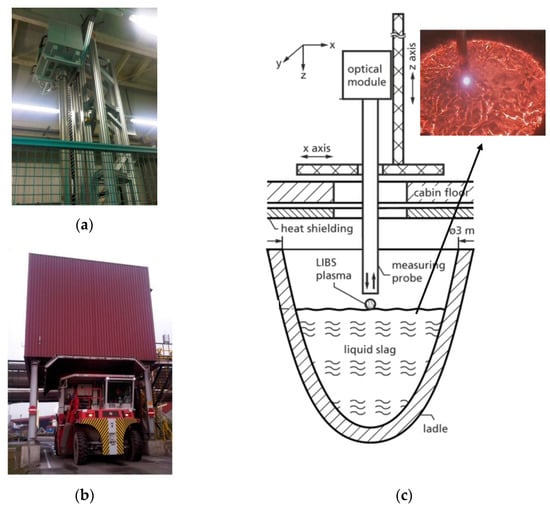
Figure 4.
Schematic representation of system used by Sturm et al. [67]. (a) Measuring cabin consisting of aLIBS system, (b) slag transporter below the measuring cabin carrying ladle and (c) LIBS setup diagram (consist inset picture of camera view) reprinted (adapted) with permission from (Sturm, V., Fleige, R., de Kanter, M., Leitner, R., Pilz, K., Fischer, D., … and Noll, R. (2014). Laser-induced breakdown spectroscopy for 24/7 automatic liquid slag analysis at a steel works. Analytical Chemistry, 86(19), 9687–9692). Copyright (2014) American Chemical Society.
López-Moreno et al. proposed a mathematical method for determining the composition of samples at high temperatures using low-temperature data of steel slags at 12 m and utilizing a LIBS system consisting of Newtonian telescopic arrangements [68]. The accuracy was validated by XRF analysis at room temperature. Transfer functions and basicity index were calculated with the ratios of Si/Ca and Mg/Ca. The article has discussed the limitations of this approach because the data with temperatures higher than 850 °C undergo a non-linear trend.
To study the application of LIBS for measuring the steel slag constituent elements in blast furnaces, a set of preliminary tests were performed at the pilot test facilities of the Centre de Recherches Métallurgiques (CRM) group in Belgium [27]. A feasibility study was performed for measuring Si, Mn, and C with an accuracy of 10% relative to XRF measurements. Later, industrial tests were performed and monitored for one week. During these tests, continuous measurements were performed for more than four hours. Using LIBS, the temperature of molten metal was also measured. Petersson et al. performed LIBS and XRF analyses on solid steel slags to quantitatively determine major components (CaO, MgO, SiO2, Al2O3, FeO, and MnO) in a laboratory arrangement [34]. However, when studying the hot slag sample obtained from the ladle, the temperature ranges between 1200 and 1400 °C, and the system was cooling at a rate of 210 °C/min. In their investigation, using 2000 laser pulses and a through statistical analysis, the content of iron in the slag was characterized as Fe (oxide), Fe (metallic), and Fe (outliers).
François et al. studied the feasibility of analyzing slag components from secondary copper production. The limits of detection (LODs) obtained for SiO2, FeO, Al2O3, ZnO, and CuO in synthetic copper slags were 1.5 wt%, 1.0 wt%, 970 ppm, 1490 ppm, and 116 ppm, respectively. The reference values were established using Wavelength Dispersive Spectroscopy/Electron Probe Microanalysis (WDS-EPMA) as the gold standard method. LIBS measurements were performed on the molten phase [35].
2.2.4. Other Metals and Minerals
Very few dedicated reports, compared to the other reviewed applications, were found describing molten zinc and copper. In this section, we review the literature related to some additional metals and minerals in the melting phase.
Czekkel et al. used several certified zinc and aluminum reference materials in the molten phase and demonstrated the possibility of monitoring the process using ratios [69]. Baril et al. utilized a laboratory-scale zinc bath, a capacity of 100 kg, to demonstrate the feasibility of monitoring the concentration of Al and Fe in molten zinc located in galvanizing baths. A spectral region spanning from 301 to 310 nm and centered at 305 nm was considered to monitor the emission lines of Zn, Al, and Fe. The calibration curves were obtained using LIBS intensity ratios of Fe/Zn, Al/Zn with the effective concentration of Fe and Al using ICP-AES, respectively [70]. A European project, titled Zincana [71], dedicated to the in situ analysis of hot-dip galvanizing baths, presents a detailed report containing information on various relevant aspects, such as the optimization of experimental arrangements in developing galvaLIBS. They also provided fundamental knowledge for monitoring dissolved elements, such as Zn, Fe, and Al along with impurities such as Pb, Sb, and Sn, which are unwanted elements in the coating. Finally, they reported difficulties in transferring technology from a laboratory setting to the industrial domain due to lack of standard CRM, which mimic the same concentration distribution; experimental conditions; inconsistency in the measurements of Al and Fe compositions; and unreliable measurements of slag.
In 2002, Panne et al. achieved online monitoring of Ti, Fe, Mn, Mg, Ca, Si, Na, and Al in molten minerals that are relevant in mineral wool production [36]. Additionally, LIBS intensities of these elements were validated using careful manual sampling with XRF. However, there were minor differences observed when comparing LIBS intensity curves with XRF, but the trend seems to be adequate for use of LIBS as an online monitoring tool.
Vaculovič et al. studied the influence of temperature on plasma emissions from pure low temperature melting metals such as Bi, Ga, In, Pb, Sn, and Zn [72]. The studies were carried out by increasing the temperature of the furnace starting from 35, 100, 250, 400, 300, and 500 °C for Bi and Sn only. Emission line intensities of Bi were found to be decreasing as a function of temperature, while Sn intensities were increasing.
Darwiche et al. detected boron in molten silicon in an induction-based graphite crucible at a concentration of 6 ppm. They observed in the solid phase of silicon, a limit of detection of 0.2 ppm for boron [73].
The application of LIBS in the copper pyrometallurgical process has been less reported compared to the other molten metals. Dutouquet et al. performed experiments by melting copper bars and monitoring the emission of heavy metal particles from the exhaust duct of a foundry [74]. The calibration was carried out using standard ICP-AES methods. Two types of measurements were performed, involving direct and indirect analysis, the former one involved laser interrogates on the filter and the latter involved focusing the laser on aerosol for detecting copper particulate emissions.
Xin et al. monitored constituents (Mg, Y, Pr, and Zr) in real-time in an industrial domain by using LIBS [75]. The calibration of these elements in the solid phase yielded RMSE values lower than 0.037%, but the liquid phase produced fluctuating results. Even when argon gas was purged on the surface of the molten sample, the presence of smoke and slags caused focusing instabilities, resulting in RSD values of calibration of liquid phase with 20% fluctuations.
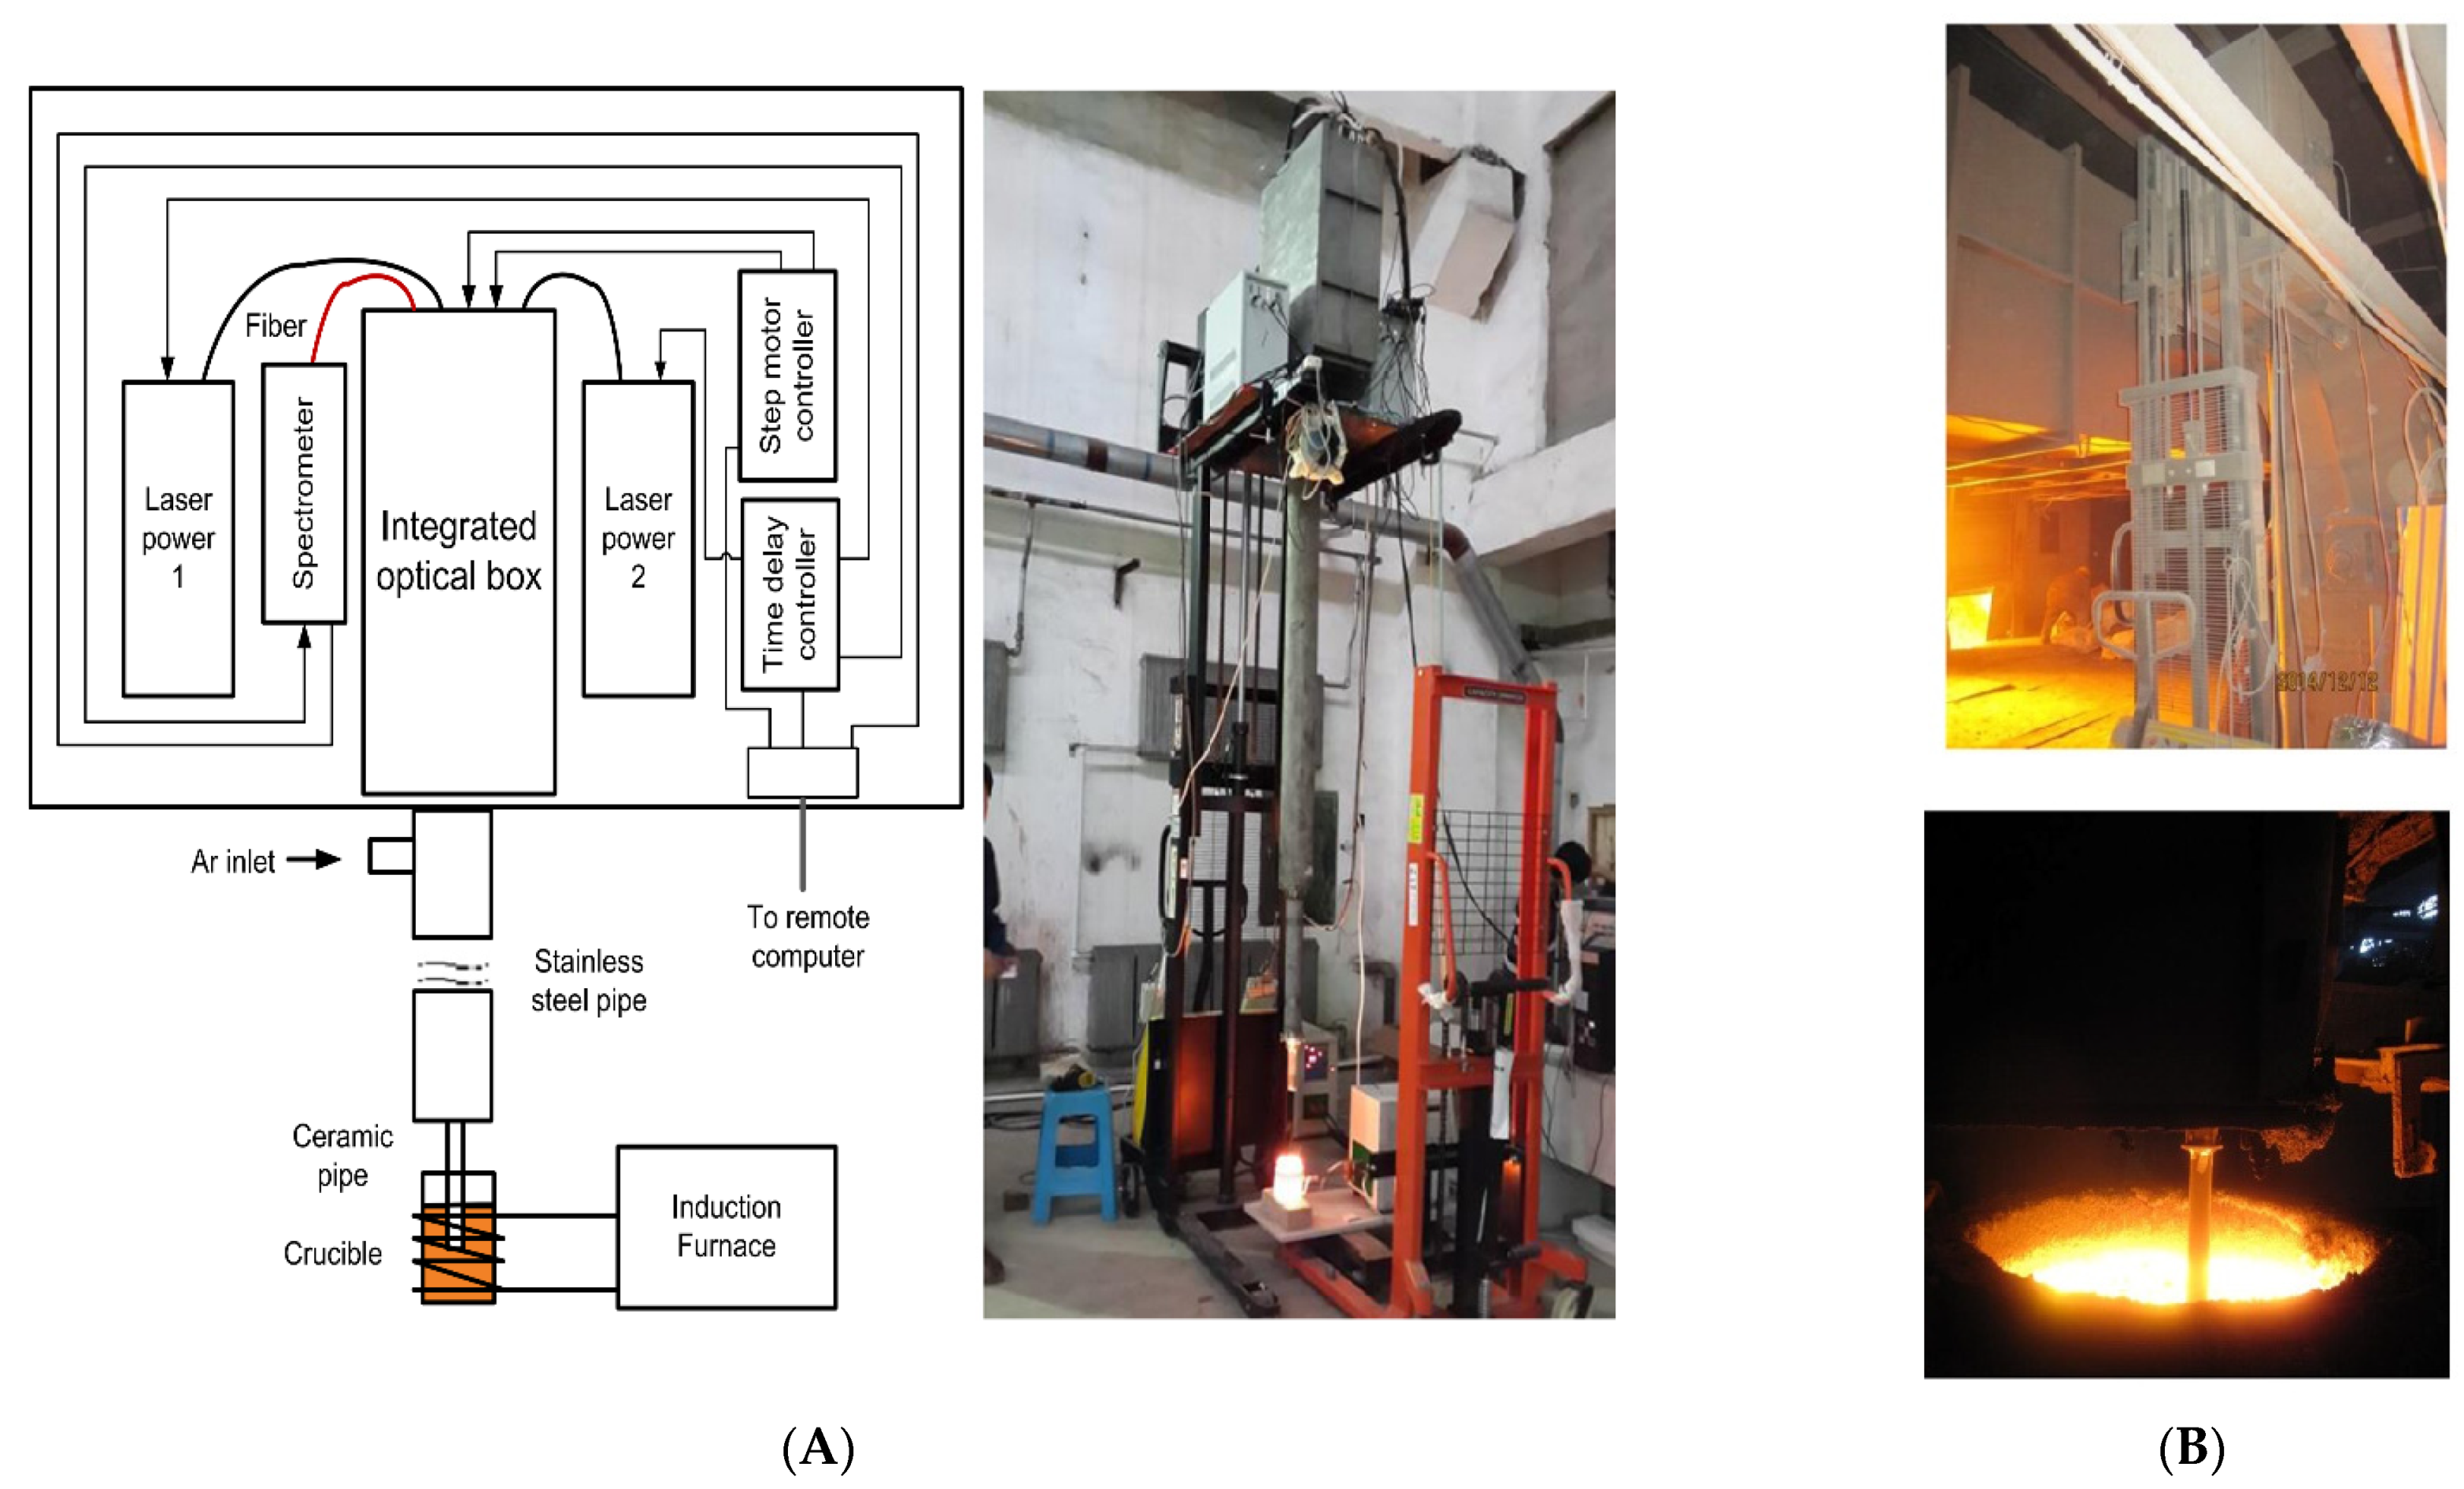
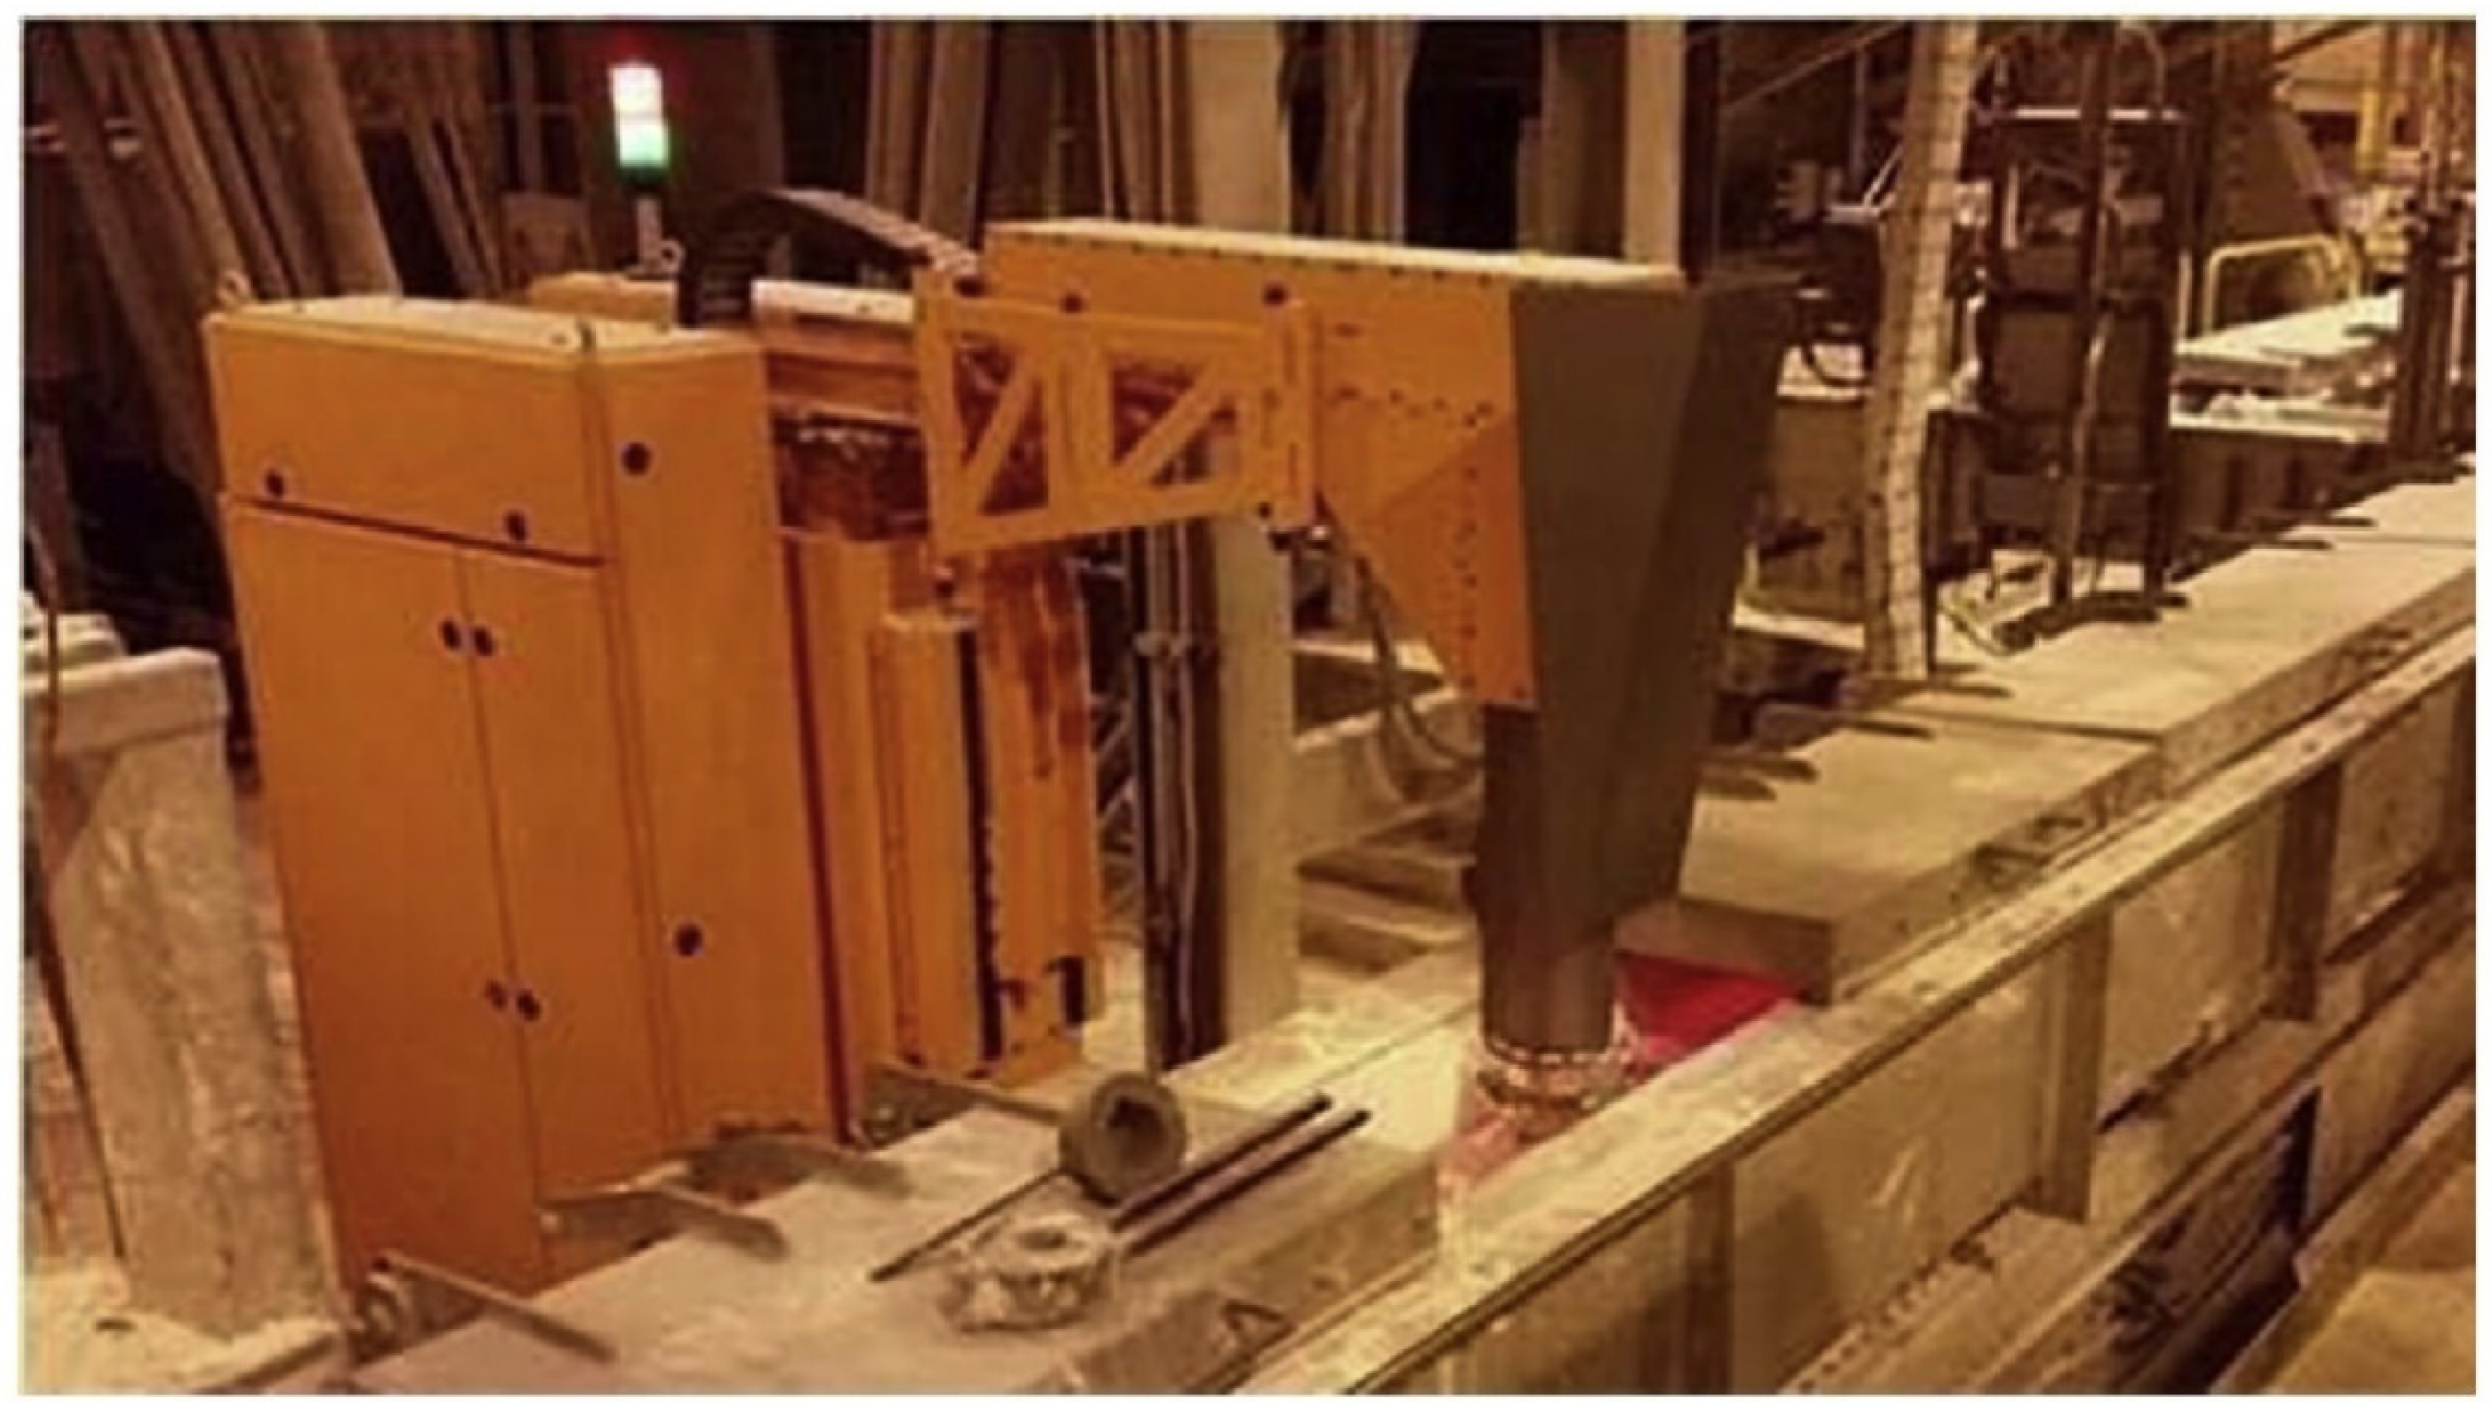
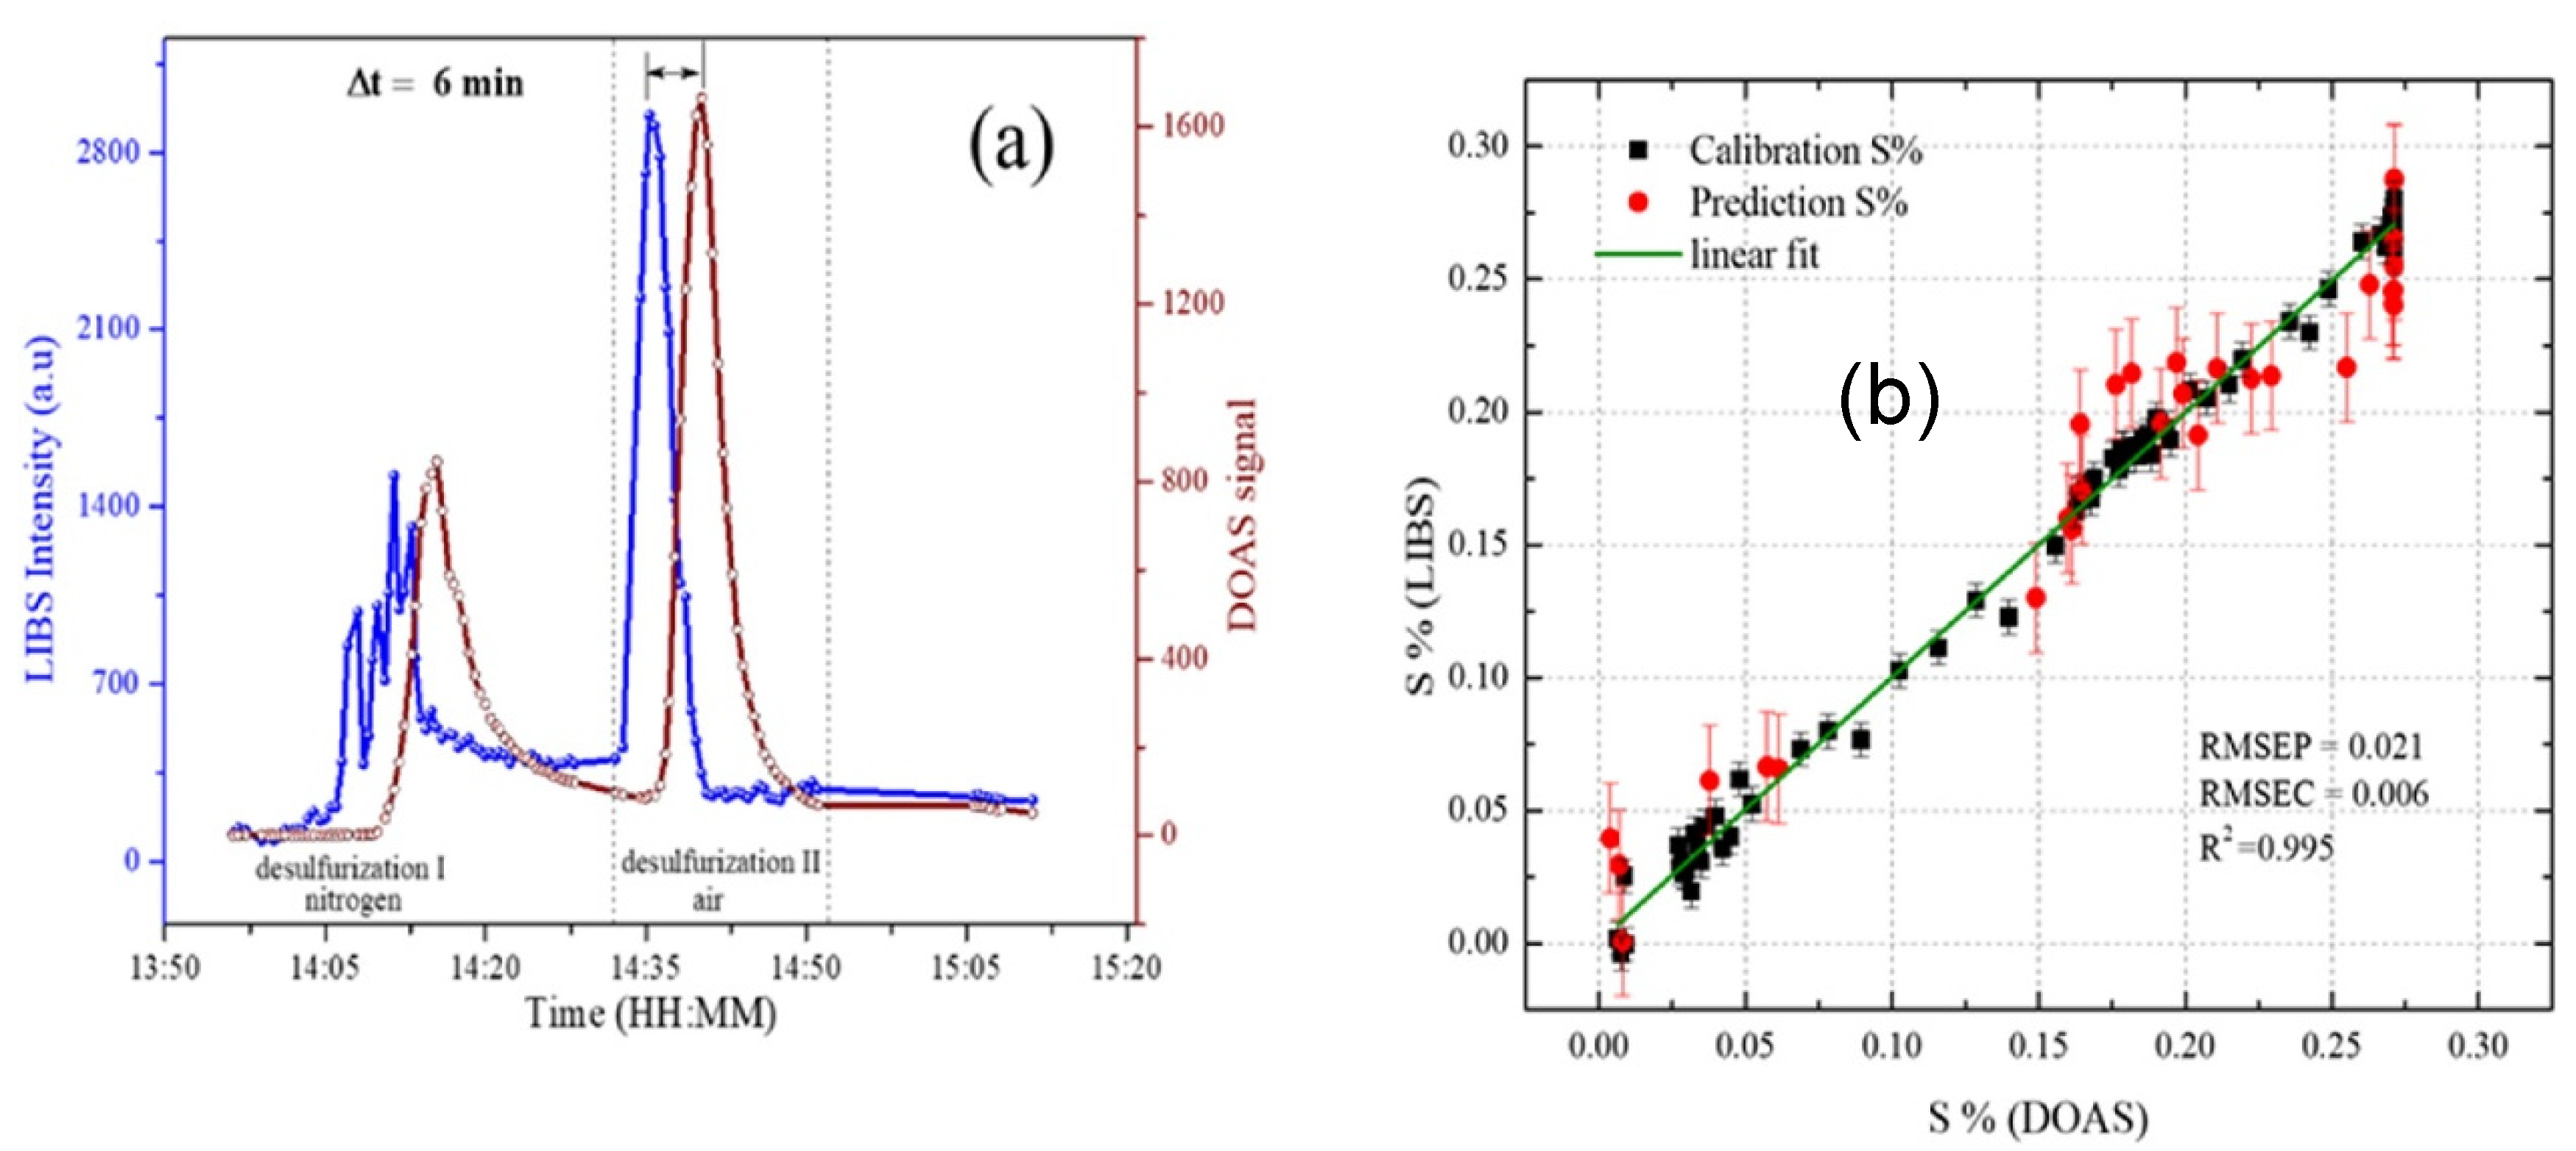
To the best of our knowledge, there are no reports of investigation related to molten copper analysis. We report our preliminary investigation on industrial copper blister samples using a high-power laser operated in standoff mode [76] as shown in Figure 5. Blister copper is unrefined copper, possessing a purity of around 98.5% and it is derived from copper smelting after the conversion step. In this work, the desulfurization process of the molten copper blister was monitored simultaneously with LIBS and differential optical absorption spectroscopy (DOAS). DOAS provided information of SO2 gas released from the chemical reaction, while LIBS provided combined information of molten liquid and gaseous phase. The main advantage of LIBS was its fast monitoring capability when compared to DOAS, where a delay of several minutes was observed due to the time-consuming process of gas transportation into the absorption cell, as shown in Figure 6a. The prediction of sulfur was also performed using LIBS using PLS considering DOAS as a reference method as shown in Figure 6b.
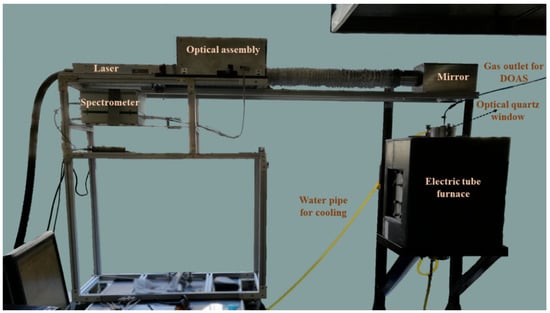
Figure 5.
LIBS experimental setup developed for measuring plasma emissions from molten copper blister samples developed by the Departamento de Química Analítica e Inorgánica, Facultad de Ciencias Químicas, Universidad de Concepción.
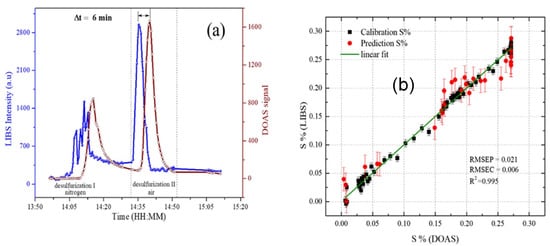
Figure 6.
The monitoring results of desulfurization in the pyrometallurgical process of the copper blister by Myakalwar et al. [76]: (a) Signal of LIBS (921.29 nm) of sulfur and DOAS signal of SO2 gas during desulfurization of blister copper. (b) PLS prediction results of sulfur in molten phase using LIBS using DOAS as gold standard method. (Reprinted from Analytica Chimica Acta, vol. 1178, Myakalwar, A.K., Sandoval, C., Sepúlveda, B., Fuentes, R., Parra, R., Balladares, E., Vásquez, A., Sbarbaro, D., and Yáñez, J., Laser induced breakdown spectroscopy for monitoring the molten phase desulfurization process of blister copper, 338805, 2021). Copyright (2021), with permission from Elsevier.).
3. Probes and Systems for Molten Metal Monitoring Utilizing LIBS
Different dedicated LIBS systems and probes reported in patents and technical reports are reviewed in this section. The first such probe was pioneered by Cremers et al. [77]. This probe had the arrangement to supply inert gas to allow a laser pulse to analyze the surface of steel melt. There are a substantial number of patents on LIBS systems and probes for analyzing molten metals, which are summarized in Table 2. The probe details and notes facilitate the importance and drawbacks of designs.
Table 2.
Patents on LIBS and Molten material analysis.
A fundamental understanding of the key parameters to be adjusted and spectroscopic knowledge, along with engineering design in the probe development, is highly desirable. The following precautions should be observed while designing a probe:
- The inner faces of the probe walls should not absorb the laser or plasma light while delivering and returning signals to the probe. Losses should be minimized when sending signals to the spectrometer. In addition, the lens optics inside the probe should be protected from heat.
- Immersive probes must be submerged into molten material vertically, which increases the pressure. This effect should be compensated by the probe.
- Molten metals, especially aluminum, absorb oxygen from the ambient and form oxide layers on their surface. Hence, it is important to purge with the noble gases along the probe to obtain clean spectroscopic measurements.
- Temperatures involved in pyrometallurgical processes of metals are very high. Steel is treated at 1500 °C [26], aluminum at 660 °C [52], copper at 1250 °C [76,85] and silicon at 1410 °C [73]. These metals undergo different pyrometallurgical processes at different temperatures. The developed probe should withstand such temperatures and extremely harsh environments.
- Autofocusing is a crucial factor to compensate the effect of the fluctuating surface or the turbulence inside the melt. Technologies such as ultrasonic laser ranging can be utilized for measuring the distance and compensate any deviation from a target value.
- Probe orientation influences the position of the laser focus and pressure values inside the probe. If the argon purge is utilized in the wrong orientation, the pressure will change and molten material will be likely to enter inside the probe, causing damage. The spectral information obtained by the interrogation of laser pulses on the surface of molten metal pool sometimes is not representative of the melt. Materials such as silicon and aluminum often undergo nitridation or oxidation due to the development of slag surfaces. Because of the accumulation of several impurities, slag does not possess a similar chemical composition as the metal [87]. The use of immersive probes for inspecting the composition of the molten sample is an alternative and has been mostly adopted during the past three decades.
4. Non-Conventional Calibration Model Schemes for Molten Metal Analysis
The current methodology of calibration consists of establishing the concentration of molten materials with measurements before or after melting the solid sample. However, the calibration and prediction datasets should ideally be taken from the molten phase. Due to the inability and limitation of measurements using offline standard methods, under the same high-temperature conditions of metal molten phase, researchers rely on certified or calibration samples at room temperature. Thus, to obtain the calibration curves, some mathematical models have been proposed to transfer information from the room temperature to the high-temperature domain. This differs from standard conventional calibration methodologies, which are described in this section.
Lopez-Moreno et al. introduced a mathematical method called linear transfer function for measuring the constituents of steel slags at high temperature, using a calibration curve obtained with samples at room temperature [68]. This method was linear until the temperature of 850 °C; beyond this temperature, the method has not shown linearity. Likewise, the investigation of Hubmer et al. showed that the calibration curves of molten metal may not follow strict straight lines at high temperatures [31]. On the other hand, Matiaske et al. proposed calibration transfer functions by determining calibration coefficients between solid and liquid materials. They assumed that the ratios of the intensities of spectral lines of elements emanating from the same solid and liquid phase of the material were constant and not affected experimentally [89].
To reduce the need for large quantities of standard samples for calibration in industrial scenarios, Yang et al. proposed a so-called transfer learning scheme, which predicted the spectral information of a sample at higher temperature by constructing a regression model based on data obtained at room temperature [90]. The scheme was based on weight adjustment in an iterative way, where support vector regression was utilized as a model structure. At each iteration, weights of the two distinct domains were adjusted and weak learners were combined. Weak learners are simple models with a slightly better accuracy than random guessing. In the end, utilizing the weighted combination of weak learners, predictions of test samples were performed. Using this scheme, they analyzed chromium concentration in steel alloy samples. Furthermore, Chang et al. adopted quantitative feature-based transfer learning for chromium regression in high-temperature steel alloy samples [91]. Together, the LIBS data of calibration-certified steel alloy samples at room temperature and the spectral information of uncalibrated samples at high temperature were transferred into a multi-dimensional feature space by performing kernel function mapping. A regression model was prepared based on training. Utilizing the same associated parameters used in the training step, the spectral data at high temperatures were mapped into the high-dimensional feature kernel Hilbert space for testing the samples. The experimental investigation reported a decrease in mean relative error from 32.31% to 6.08%.
5. Recommendations
Fundamental knowledge of the pyrometallurgical process of the metals is needed before implementing LIBS experimentation. Special attention should be devoted to the optical and mechanical design of the LIBS system/probe for handling extreme heat and corrosive environments. The focusing of molten metal should be implemented carefully to avoid fluctuations in the LIBS signal. Precise line assignments of the relevant elemental species describing the molten process are necessary. The ratios between elemental species can provide important information related to the process. Calibrating with a gold-standard reference method is advantageous to establish LIBS as a reliable analytical method.
6. Conclusions
In this review, the requirement of LIBS as an analytical spectral sensor for molten metal monitoring was presented. Several advantages of LIBS were highlighted, such as the non-contact measurement, and its ability for delivering online monitoring and in situ measurements. These advantageous features were compared to other existing stand-on laboratory techniques, such as ICP-AES, XRF, and Spark-OES. Optimization and implementation of LIBS for metals in molten form were discussed in detail. The literature related to molten steel and iron, aluminum, slags, other metals, and minerals was reviewed in chronological order to understand the progress yearly. Half a century of experience in the development of LIBS systems for metals based on steel and iron has been determinant for the fast development of systems working on aluminum and slags. Other applications in the zinc and copper industries have received less attention in the past, primarily due to economic reasons for scaling up. Several immersive, non-immersive probes and open-path LIBS arrangements were analyzed. The review also shows the emergent use of state-of-the-art machine learning algorithms to improve the calibration of LIBS systems. This knowledge should promote further progress, aiming to apply LIBS in the pyrometallurgical industry to address the demanding quality of products, environmental factors, and economic conditions imposed by the regulatory agencies and the market.
Author Contributions
A.K.M. contributed to writing, critical discussion, correction, literature search and review; C.S. contributed to corrections; M.V. contributed to corrections; B.S. contributed critical discussion and artwork; D.S. contributed to critical discussion and correction; J.Y. contributed to writing, critical discussion, correction, literature review and supervision. All authors have read and agreed to the published version of the manuscript.
Funding
This research was funded by Agencia Nacional de Investigación y Desarrollo (ANID) ANILLO ACM 170008; FONDECYT Postdoctoral Award N° 3200371, FONDECYT 1191572.
Data Availability Statement
Data sharing is not applicable to this review article.
Conflicts of Interest
There are no conflicts to declare.
Appendix A
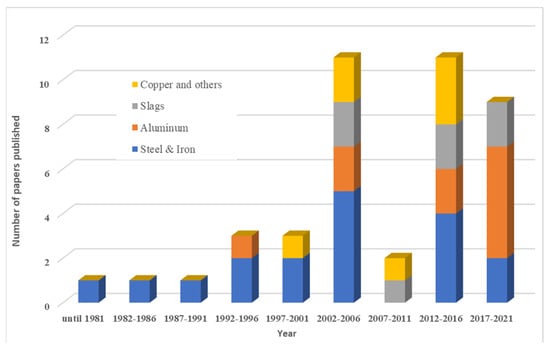
Figure A1.
Number of publications on LIBS and molten-phase metals in time intervals of their submission.
References
- Themelis, N.J. Pyrometallurgy near the end of the 20th century. JOM 1994, 46, 51–57. [Google Scholar] [CrossRef]
- Martinez-Alier, J. Mining conflicts, environmental justice, and valuation. J. Hazard. Mater. 2001, 86, 153–170. [Google Scholar] [CrossRef]
- Arnórsson, Ú.K. Probe for Portable Laser Induced Breakdown Spectroscopy of Molten Aluminum and Cryolite. Bachelor’s Thesis, Reykjavík University, Reykjavík, Iceland, 2014. Available online: http://hdl.handle.net/1946/20479 (accessed on 18 June 2021).
- Vásquez, A.; Pérez, F.; Roa, M.; Sanhueza, I.; Rojas, H.; Parra, V.; Balladares, E.; Parra, R.; Torres, S. A Radiometric Technique for Monitoring the Desulfurization Process of Blister Copper. Sensors 2021, 21, 842. [Google Scholar] [CrossRef]
- Reyes, G.; Diaz, W.; Toro, C.; Balladares, E.; Torres, S.; Parra, R.; Vásquez, A. Copper Oxide Spectral Emission Detection in Chalcopyrite and Copper Concentrate Combustion. Processes 2021, 9, 188. [Google Scholar] [CrossRef]
- Arias, L.; Balladares, E.; Parra, R.; Sbarbaro, D.; Torres, S. Sensors and Process Control in Copper Smelters: A Review of Current Systems and Some Opportunities. Minerals 2021, 11, 1. [Google Scholar] [CrossRef]
- Yañez, J.; Torres, S.; Sbarbaro, D.; Parra, R.; Saavedra, C. Analytical instrumentation for copper pyrometallurgy: Challenges and opportunities. IFAC-PapersOnLine 2018, 51, 251–256. [Google Scholar] [CrossRef]
- Luarte, D.; Myakalwar, A.K.; Velásquez, M.; Álvarez, J.; Sandoval, C.; Fuentes, R.; Yañez, J.; Sbarbaro, D. Combining prior knowledge with input selection algorithms for quantitative analysis using neural networks in laser induced breakdown spectroscopy. Anal. Methods 2021, 13, 1181–1190. [Google Scholar] [CrossRef]
- Fergus, J.W. Sensors for monitoring the quality of molten aluminum during casting. J. Mater. Eng. Perform. 2005, 14, 267–275. [Google Scholar] [CrossRef]
- Dong, F.-Z.; Chen, X.-L.; Wang, Q.; Sun, L.-X.; Yu, H.-B.; Liang, Y.-X.; Wang, J.-G.; Ni, Z.-B.; Du, Z.-H.; Ma, Y.-W. Recent progress on the application of LIBS for metallurgical online analysis in China. Front. Phys. 2012, 7, 679–689. [Google Scholar] [CrossRef]
- Rai, A.K.; Yueh, F.Y.; Singh, J.P.; Rai, D.K. Chapter 11-Laser-Induced Breakdown Spectroscopy of Solid and Molten Material. In Laser-Induced Breakdown Spectroscopy; Singh, J.P., Thakur, S.N., Eds.; Elsevier: Amsterdam, The Netherlands, 2007; pp. 255–285. [Google Scholar]
- Senk, D.; Wiens, O.; Mavrommatis, K.; Sancho, L.; Rivas, O.; Androutsopoulos, N.; Galvao, C.; Laserna, J.; Papamantellos, D.; Palangas, C. In-situ, quick sensing system for measurements of critical components in steelmaking slags (Inquisss). EUR 2007, 22818, 1–157. [Google Scholar]
- Noll, R.; Bette, H.; Brysch, A.; Kraushaar, M.; Mönch, I.; Peter, L.; Sturm, V. Laser-induced breakdown spectrometry—applications for production control and quality assurance in the steel industry. Spectrochim. Acta B 2001, 56, 637–649. [Google Scholar] [CrossRef]
- Bengtson, A. Laser Induced Breakdown Spectroscopy compared with conventional plasma optical emission techniques for the analysis of metals–A review of applications and analytical performance. Spectrochim. Acta B 2017, 134, 123–132. [Google Scholar] [CrossRef]
- Wang, Z.; Deguchi, Y.; Shiou, F.; Yan, J.; Liu, J. Application of laser-induced breakdown spectroscopy to real-time elemental monitoring of iron and steel making processes. ISIJ Int. 2016, 56, 723–735. [Google Scholar] [CrossRef] [Green Version]
- Hudson, S.W.; Craparo, J.; De Saro, R.; Apelian, D. Applications of laser-induced breakdown spectroscopy (LIBS) in molten metal processing. Metall. Mater. Trans. B 2017, 48, 2731–2742. [Google Scholar] [CrossRef]
- Lee, Y.I.; Song, K.; Sneddon, J. Laser-Induced Breakdown Spectrometry; Nova Science Publishers: Hapag, NY, USA, 2000. [Google Scholar]
- Cremers, D.A.; Radziemski, L.J. Handbook of Laser-Induced Breakdown Spectroscopy; Wiley: Hoboken, NJ, USA, 2013. [Google Scholar]
- Singh, J.P.; Thakur, S.N. Laser-Induced Breakdown Spectroscopy; Elsevier Science: Amsterdam, The Netherlands, 2007. [Google Scholar]
- Miziolek, A.W.; Palleschi, V.; Schechter, I. Laser Induced Breakdown Spectroscopy; Cambridge University Press: Cambridge, UK, 2006. [Google Scholar]
- Noll, R. Laser-Induced Breakdown Spectroscopy: Fundamentals and Applications; Springer: Berlin/Heidelberg, Germany, 2012. [Google Scholar]
- Musazzi, S.; Perini, U. Laser-Induced Breakdown Spectroscopy: Theory and Applications; Springer: Berlin/Heidelberg, Germany, 2014. [Google Scholar]
- Álvarez, J.; Velásquez, M.; Myakalwar, A.K.; Sandoval, C.; Fuentes, R.; Castillo, R.; Sbarbaro, D.; Yáñez, J. Determination of copper-based mineral species by laser induced breakdown spectroscopy and chemometric methods. J. Anal. At. Spectrom. 2019, 34, 2459–2468. [Google Scholar] [CrossRef]
- Anubham, S.; Junjuri, R.; Myakalwar, A.; Gundawar, M. An Approach to Reduce the Sample Consumption for LIBS based Identification of Explosive Materials. Def. Sci. J. 2017, 67, 254–259. [Google Scholar] [CrossRef] [Green Version]
- Sreedhar, S.; Kumar, M.A.; Kumar, G.M.; Kiran, P.P.; Tewari, S. Laser-induced breakdown spectroscopy of RDX and HMX with nanosecond, picosecond, and femtosecond pulses. In Proceedings of the Proceedings SPIE 7665, Chemical, Biological, Radiological, Nuclear and Explosives (CBRNE), Orlando, FL, USA, 5 May 2010; p. 76650T. [Google Scholar]
- Monfort, G.; Bellavia, L.; Tonteling, M.; Ojeda, C.; Ansseau, O. On-line measurement of the hot metal temperature and composition in the blast furnace runners by LIBS. J. Appl. Laser Spectrosc. 2014, 1, 6. [Google Scholar]
- Peter, L.; Sturm, V.; Noll, R. Liquid steel analysis with laser-induced breakdown spectrometry in the vacuum ultraviolet. Appl. Opt. 2003, 42, 6199–6204. [Google Scholar] [CrossRef] [Green Version]
- Gruber, J.; Heitz, J.; Strasser, H.; Bäuerle, D.; Ramaseder, N. Rapid in-situ analysis of liquid steel by laser-induced breakdown spectroscopy. Spectrochim. Acta B 2001, 56, 685–693. [Google Scholar] [CrossRef]
- Paksy, L.; Német, B.; Lengyel, A.; Kozma, L.; Czekkel, J. Production control of metal alloys by laser spectroscopy of the molten metals. Part I. Preliminary investigations. Spectrochim. Acta B 1996, 51, 279–290. [Google Scholar] [CrossRef]
- Gruber, J.; Heitz, J.; Arnold, N.; Bäuerle, D.; Ramaseder, N.; Meyer, W.; Hochörtler, J.; Koch, F. In situ analysis of metal melts in metallurgic vacuum devices by laser-induced breakdown spectroscopy. Appl. Spectrosc. 2004, 58, 457–462. [Google Scholar] [CrossRef] [PubMed]
- Hubmer, G.; Kitzberger, R.; Mörwald, K. Application of LIBS to the in-line process control of liquid high-alloy steel under pressure. Anal. Bioanal. Chem. 2006, 385, 219–224. [Google Scholar] [CrossRef] [PubMed]
- Lorenzen, C.J.; Carlhoff, C.; Hahn, U.; Jogwich, M. Applications of laser-induced emission spectral analysis for industrial process and quality control. J. Anal. At. Spectrom. 1992, 7, 1029–1035. [Google Scholar] [CrossRef]
- Guezenoc, J.; Gallet-Budynek, A.; Bousquet, B. Critical review and advices on spectral-based normalization methods for LIBS quantitative analysis. Spectrochim. Acta B 2019, 160, 105688. [Google Scholar] [CrossRef]
- Petersson, J.; Gilbert-Gatty, M.; Bengtson, A. Rapid chemical analysis of steel slag by laser-induced breakdown spectroscopy for near-the-line applications. J. Anal. At. Spectrom. 2020, 35, 1848–1858. [Google Scholar] [CrossRef]
- François, E.; Gazeli, O.; Couris, S.; Angelopoulos, G.N.; Blanpain, B.; Malfliet, A. Laser-induced breakdown spectroscopy analysis of the free surface of liquid secondary copper slag. Spectrochim. Acta B 2020, 170, 105921. [Google Scholar] [CrossRef]
- Panne, U.; Neuhauser, R.; Haisch, C.; Fink, H.; Niessner, R. Remote analysis of a mineral melt by laser-induced plasma spectroscopy. Appl. Spectrosc. 2002, 56, 375–380. [Google Scholar] [CrossRef]
- Kondo, H. Comparison between the characteristics of the plasmas generated by laser on solid and molten steels. Spectrochim. Acta B 2012, 73, 20–25. [Google Scholar] [CrossRef]
- Palanco, S.; Conesa, S.; Laserna, J.J. Analytical control of liquid steel in an induction melting furnace using a remote laser induced plasma spectrometer. J. Anal. At. Spectrom. 2004, 19, 462–467. [Google Scholar] [CrossRef]
- Sneddon, J.; Thiem, T.L.; Lee, Y.I. Lasers in Analytical Atomic Spectroscopy; Wiley: Hoboken, NJ, USA, 1996. [Google Scholar]
- Gudmundsson, S.H.; Matthiasson, J.; Björnsson, B.M.; Gudmundsson, H.; Leosson, K. Quantitative in-situ analysis of impurity elements in primary aluminum processing using laser-induced breakdown spectroscopy. Spectrochim. Acta B 2019, 158, 105646. [Google Scholar] [CrossRef]
- Sun, L.; Yu, H.; Cong, Z.; Xin, Y.; Li, Y.; Qi, L. In situ analysis of steel melt by double-pulse laser-induced breakdown spectroscopy with a Cassegrain telescope. Spectrochim. Acta B 2015, 112, 40–48. [Google Scholar] [CrossRef]
- Runge, E.F.; Bonfiglio, S.; Bryan, F.R. Spectrochemical analysis of molten metal using a pulsed laser source. Spectrochim. Acta 1966, 22, 1678–1680. [Google Scholar] [CrossRef]
- Ozaki, T.; Takahashi, T.; Iwai, Y.; Gunji, K.; Sudo, E. Giant pulse laser direct spectrochemical analysis of C, Si, and Mn in liquid iron. Trans. Iron Steel Inst. Jpn. 1984, 24, 463–470. [Google Scholar] [CrossRef]
- Carlhoff, C. Laserinduzierte Emissionsspektroskopie für die Direktanalyse von flüssigem Stahl im Konverter. Laser Optoelectron. 1991, 23, 50–52. [Google Scholar]
- Aragon, C.; Aguilera, J.; Campos, J. Determination of carbon content in molten steel using laser-induced breakdown spectroscopy. Appl. Spectrosc. 1993, 47, 606–608. [Google Scholar] [CrossRef]
- Palanco, S.; Cabalin, L.; Romero, D.; Laserna, J. Infrared laser ablation and atomic emission spectrometry of stainless steel at high temperatures. J. Anal. At. Spectrom. 1999, 14, 1883–1887. [Google Scholar] [CrossRef]
- Ramaseder, N.; Gruber, J.; Heitz, J.; Baeuerle, D.; Meyer, W.; Hochoertler, J. VAI-CON® Chem—A New Continuous Chemical Analysis System of Liquid Steel in Metallurgical Vessels. Metall. Ital. 2004, 60, 2. [Google Scholar]
- Sun, L.X.; Xin, Y.; Cong, Z.B.; Li, Y.; Qi, L.F. Online compositional analysis of molten steel by laser-induced breakdown spectroscopy. In Proceedings of the Advanced Materials Research; Trans Tech Publications: Bach, Switzerland, 2013; Volume 694, pp. 1260–1266. [Google Scholar]
- Xiaomei, L.; Penghui, C.; Gehua, C.; Jingjun, L.; Ruixiang, L.; Hao, Y. Effect of Melting Iron-Based Alloy Temperature on Carbon Content Observed in Laser-Induced Breakdown Spectroscopy. Plasma Sci. Technol. 2015, 17, 933. [Google Scholar]
- Qiang, Z.; Congyuan, P.; Teng, F.; Xiaokang, D.; Shengbo, W.; Qiuping, W. Composition and Temperature Monitoring of Molten Metal by a Combined LIBS-IR Thermometry System. J. Appl. Spectrosc. 2018, 85, 817–822. [Google Scholar] [CrossRef]
- Zhao, T.; Li, X.; Zhong, Q.; Xiao, H.; Nie, S.; Lian, F.; Sun, S.; Fan, Z. Quantitative Analysis of Vacuum Induction Melting by Laser-induced Breakdown Spectroscopy. J. Vis. Exp. 2019, 148, e57903. [Google Scholar] [CrossRef]
- Rai, A.K.; Yueh, F.Y.; Singh, J.P.; Zhang, H. High temperature fiber optic laser-induced breakdown spectroscopy sensor for analysis of molten alloy constituents. Rev. Sci. Instrum. 2002, 73, 3589–3599. [Google Scholar] [CrossRef]
- Rai, A.K.; Yueh, F.-Y.; Singh, J.P. Laser-induced breakdown spectroscopy of molten aluminum alloy. Appl. Opt. 2003, 42, 2078–2084. [Google Scholar] [CrossRef] [PubMed]
- De Saro, R.; Weisberg, A. Apparatus and Method for In Situ, Real Time Measurements of Properties of Liquids. U.S. Patent No. 6,784,429, 31 August 2004. [Google Scholar]
- De Saro, R. In-Situ, Real-Time Measurement of Melt Constituents in the Aluminum, Glass, and Steel Industries (No. DOE/CH/10974); Energy Research Company: Plainfield, NJ, USA, 2006. Available online: https://www.osti.gov/servlets/purl/882367 (accessed on 18 June 2021).
- Herbert, J.; Fernandez, J.; De Saro, R.; Craparo, J. The Industrial Application of Molten Metal Analysis (LIBS); Springer: Cham, Switzerland, 2019; pp. 945–952. [Google Scholar]
- Gudmundsson, S.H.; Matthiasson, J.; Leosson, K. Quantification of trace elements in molten aluminum with randomized impurity concentrations using laser-induced breakdown spectroscopy. OSA Continuum 2020, 3, 2544–2552. [Google Scholar] [CrossRef]
- Gudmundsson, S.H.; Matthiasson, J.; Leosson, K. Accurate Real-Time Elemental (LIBS) Analysis of Molten Aluminum and Aluminum Alloys. In Proceedings of the Light Metals; Springer: Cham, Switzerland, 2020; pp. 860–864. [Google Scholar]
- Sun, L.; Yu, H.; Cong, Z.; Lu, H.; Cao, B.; Zeng, P.; Dong, W.; Li, Y. Applications of laser-induced breakdown spectroscopy in the aluminum electrolysis industry. Spectrochim. Acta B 2018, 142, 29–36. [Google Scholar] [CrossRef]
- Lu, H.; Hu, X.; Ma, L.; Li, M.; Cao, B. Measurement of the molecular ratio of Aluminum electrolytes using laser-induced breakdown spectroscopy. Spectrochim. Acta B 2020, 164, 105753. [Google Scholar] [CrossRef]
- Hudson, S.W.; Apelian, D. Clean Aluminum Processing: New Avenues for Measurement and Analysis. In Light Metals 2014; Grandfield, J., Ed.; Springer International Publishing: Cham, Switzerland, 2016; pp. 1025–1029. [Google Scholar]
- Hudson, S.; Craparo, J.; De Saro, R.; Apelian, D. Laser-induced breakdown spectroscopy: A new tool for real time melt cognition. Metall. Ital. 2016, 6, 5–8. [Google Scholar]
- Hudson, S.W.; Apelian, D. Inclusion Detection in Molten Aluminum: Current Art and New Avenues for In Situ Analysis. Int. J. Met. 2016, 10, 289–305. [Google Scholar] [CrossRef]
- Hudson, S.; Craparo, J.; De Saro, R.; Apelian, D. TiB 2 Particle Detection in Liquid Aluminum via Laser Induced Breakdown Spectroscopy. In Light Metals 2016; Springer: Berlin/Heidelberg, Germany, 2016; pp. 809–813. [Google Scholar]
- Kraushaar, M.; Noll, R.; Schmitz, H.-U. Slag analysis with laser-induced breakdown spectrometry. Appl. Spectrosc. 2003, 57, 1282–1287. [Google Scholar] [CrossRef]
- Sturm, V.; Schmitz, H.-U.; Reuter, T.; Fleige, R.; Noll, R. Fast vacuum slag analysis in a steel works by laser-induced breakdown spectroscopy. Spectrochim. Acta B 2008, 63, 1167–1170. [Google Scholar] [CrossRef]
- Sturm, V.; Fleige, R.; de Kanter, M.; Leitner, R.; Pilz, K.; Fischer, D.; Hubmer, G.; Noll, R. Laser-Induced Breakdown Spectroscopy for 24/7 Automatic Liquid Slag Analysis at a Steel Works. Anal. Chem. 2014, 86, 9687–9692. [Google Scholar] [CrossRef]
- López-Moreno, C.; Palanco, S.; Laserna, J.J. Quantitative analysis of samples at high temperature with remote laser-induced breakdown spectrometry using a room-temperature calibration plot. Spectrochim. Acta B 2005, 60, 1034–1039. [Google Scholar] [CrossRef]
- Czekkel, J.; Paksy, L.; Lengyel, A.; Bánhidi, O. Quality control of production of alloys in liquid state by laser spectroscopy. IFAC Proc. Vol. 2000, 33, 407–412. [Google Scholar] [CrossRef]
- Baril, E.; St-Onge, L.; Sabsabi, M.; Lucas, J.; Gagné, M. On-line chemical analysis of CGL baths using Laser-Induced Breakdown Spectroscopy. In Proceedings of the 96th Galvanizers Association Meeting, Charleston, SC, USA, 3–6 October 2004. [Google Scholar]
- Giorgi, M.L.; Guirado, S.; Ruiz, J.; Cabalin, L.M.; Vestin, F.; Laserna, J.; Jacques-Beyssen, S.; Simonnet, M.; Sager, M.; Mougeolle, J.M.; et al. Situ Analysis of Hot Dip Galvanizing Baths (Zincana); European Comission: Luxembourg, 2013; Available online: https://op.europa.eu/s/sm9w (accessed on 15 April 2013).
- Vaculovič, T.; Zvěřina, Z.; Otruba, V.; Kanický, V. Laser-induced breakdown spectroscopy of molten metals: Influence of sample temperature. Z. Nat. A 2011, 66, 643–648. [Google Scholar] [CrossRef] [Green Version]
- Darwiche, S.; Benrabbah, R.; Benmansour, M.; Morvan, D. Impurity detection in solid and molten silicon by laser induced breakdown spectroscopy. Spectrochim. Acta B 2012, 74, 115–118. [Google Scholar] [CrossRef]
- Dutouquet, C.; Gallou, G.; Le Bihan, O.; Sirven, J.B.; Dermigny, A.; Torralba, B.; Frejafon, E. Monitoring of heavy metal particle emission in the exhaust duct of a foundry using LIBS. Talanta 2014, 127, 75–81. [Google Scholar] [CrossRef] [Green Version]
- Xin, Y.; Sun, L.-X.; Yang, Z.-J.; Zeng, P.; Cong, Z.-B.; Qi, L.-F. In situ analysis of magnesium alloy using a standoff and double-pulse laser-induced breakdown spectroscopy system. Front. Phys. 2016, 11, 115207. [Google Scholar] [CrossRef]
- Myakalwar, A.K.; Sandoval, C.; Sepúlveda, B.; Fuentes, R.; Parra, R.; Balladares, E.; Vásquez, A.; Sbarbaro, D.; Yáñez, J. Laser induced breakdown spectroscopy for monitoring the molten phase desulfurization process of blister copper. Anal. Chim. Acta 2021, 1178, 338805. [Google Scholar] [CrossRef]
- Cremers, D.; Archuleta, F.; Dilworth, H. Rapid Analysis of Steels Using Laser-Based Techniques; Los Alamos National Lab.: Washington, DC, USA; Armco, Inc.: Middletown, OH, USA, 1985. [Google Scholar]
- Carlhoff, C.; Lorenzen, C.-J.; Nick, K.-P. Method and Apparatus for Optically Coupling an Element Analysis System and a Laser to Liquid Metal in a Melting Vessel. U.S. Patent No. 4,995,723, 26 February 1991. [Google Scholar]
- Carlhoff, C.; Lorenzen, C.-J.; Nick, K.-P. Spectrometer for the Simultaneous Measurement of Intensity in Various Spectral Regions. U.S. Patent No. 4,993,834, 19 February 1991. [Google Scholar]
- Kim, Y.W. Transient Spectroscopic Method and Apparatus for in-Process Analysis of Molten Metal. U.S. Patent No. 4,986,658A, 22 January 1991. [Google Scholar]
- Cates, L.E. Pressurized Port for Viewing and Measuring Properties of a Molten Metal Bath. U.S. Patent No. 5,830,407, 3 November 1998. [Google Scholar]
- Cates, L.E.; Reich, P. Submergible Probe for Viewing and Analyzing Properties of a Molten Metal Bath. U.S. Patent No. 6,071,466, 6 June 2000. [Google Scholar]
- Sabsabi, M.; Héon, R.; Lucas, J.M. Method and Apparatus for In-Process Liquid Analysis by Laser Induced Plasma Spectroscopy. U.S. Patent No. 6,700,660, 2 March 2004. [Google Scholar]
- Zhang, H.; Rai, A.K.; Singh, J.P.; Yueh, F.-Y. Fiber Optic Laser-Induced Breakdown Spectroscopy Sensor for Molten Material Analysis. U.S. Patent No. 6,762,835, 13 July 2004. [Google Scholar]
- Lucas, J.M.; Sabsabi, M.; Héon, R. Method and Apparatus for Molten Material Analysis by Laser Induced Breakdown Spectroscopy. U.S. Patent No. 6,909,505B2, 21 June 2005. [Google Scholar]
- Gruber, J.; Dallinger, M. Immersion Probe for Lips Apparatuses. U.S. Patent No. 2,009,026,234,5A1, 22 October 2009. [Google Scholar]
- Benmansour, M.; Benrabbah, R.; Garandet, J.-P.; Morvan, D. Device for Analysing an Oxidisable Molten Metal Using a Libs Technique. U.S. Patent No. 9,933,368B2, 3 April 2018. [Google Scholar]
- Hudson, S.W.; Apelian, D.; DeSaro, R.; Craparo, J.C. Molten Metal Inclusion Testing. U.S. Patent No. 2,019,012,881,1A1, 2 May 2019. [Google Scholar]
- Matiaske, A.-M.; Gornushkin, I.B.; Panne, U. Double-pulse laser-induced breakdown spectroscopy for analysis of molten glass. Anal. Bioanal. Chem. 2012, 402, 2597–2606. [Google Scholar] [CrossRef]
- Yang, J.; Li, X.; Lu, H.; Xu, J.; Li, H. An LIBS quantitative analysis method for alloy steel at high temperature based on transfer learning. J. Anal. At. Spectrom. 2018, 33, 1184–1195. [Google Scholar] [CrossRef]
- Chang, F.; Lu, H.; Sun, H.; Yang, J. Assessment of the performance of quantitative feature-based transfer learning LIBS analysis of chromium in high temperature alloy steel samples. J. Anal. At. Spectrom. 2020, 35, 2639–2648. [Google Scholar] [CrossRef]


Publisher’s Note: MDPI stays neutral with regard to jurisdictional claims in published maps and institutional affiliations. |
© 2021 by the authors. Licensee MDPI, Basel, Switzerland. This article is an open access article distributed under the terms and conditions of the Creative Commons Attribution (CC BY) license (https://creativecommons.org/licenses/by/4.0/).