Article

Study on the Strength Evolution Characteristics of Cemented Tailings Backfill from the Perspective of Porosity

School of Resources and Safety Engineering, Central South University, Changsha 410083, China
*
Author to whom correspondence should be addressed.
Minerals 2021, 11(1), 82; https://doi.org/10.3390/min11010082
Submission received: 11 December 2020 / Revised: 9 January 2021 / Accepted: 12 January 2021 / Published: 15 January 2021

Abstract

:
At present, the filling mining method is widely used. To study strength evolution laws of cemented tailings backfill (CTB) under different curing ages, in the experiment, mine tailings were used as aggregates, ordinary Portland cement (PC32.5) was used as cementing materials, and different additives (lime and fly ash) were added to make filling samples with the solids mass concentration at 74% and the cement-sand ratios 1:4, 1:6 and 1:8. Based on the nuclear magnetic resonance (NMR) technology, the porosity test of filling samples with curing ages of 3 d, 7 d and 28 d was carried out, and the uniaxial compressive strength test was carried out on the servo universal material testing machine. The relationship between the uniaxial compressive strength and porosity of backfills and the curing age in the three groups was studied, and change laws of the porosity variation and strength growth rate of backfills were analyzed. Based on the variation in porosity, the strength evolution model of the CTB under different curing ages was established, and the model was fitted and verified with test data. Results show that the uniaxial compressive strength, porosity, porosity variation, and strength growth rate of the three groups of backfills gradually increase with the increase of the curing age, the porosity of backfill basically increases with the decrease of the cement–sand ratio, and the porosity of backfill decreases with the increase of the curing age. Porosity variations and relative strength values of the three groups of backfills under different cement-sand ratios obey an exponential function, and the two have a good correlation, indicating that the established filling strength evolution model can well reflect strength evolution laws of the CTB with the change of curing age.

1. Introduction

In the underground mining of metal mines, mining with filling has significant advantages in reducing tailings emissions and controlling surface subsidence [1,2,3], and with the society’s requirements for safe production and environmental protection in mines, filling mining methods are more and more widely used [4]. During the filling process, the backfill formed by the filling slurry after backfilling mined-out areas can play a certain supporting role to the surrounding rock [5,6], which can effectively reduce the deformation and loosening of the surrounding rock in the mining field. Due to the different strengths of the CTB under different curing ages, it will have a certain impact on the stability of the surrounding rock [7], thereby affecting entire underground mine production activities. Therefore, mechanical properties of CTB are one of the important indicators that must be considered [8,9], and an understanding of the strength evolution laws of CTB under different curing ages has important guiding significance for mine production practice.
At present, researchers at home and abroad have conducted a lot of experimental studies on the strength variation laws of backfill. Zhang [10] and Ghirian et al. [11] studied the relationship between the uniaxial compressive strength of CTB and its curing age, and found that the strength of CTB increased with the increase of curing age, and increased with the increase of cement-sand ratio. Li et al. [12] has examined the effects of solid content (SC), cement/tailings (c/t) ratio, and curing time (CT) on rheological and mechanical properties of CTB mixes. Cheng et al. [13] established the exponential function relationship between the uniaxial compressive strength of high concentration cementation filling and curing age by using the fitting approach. Xu [14] and Yilmaz et al. [15] studied the predictability of cemented paste backfill (CPB) uniaxial compressive strength by using electrical resistivity (ER) and ultrasonic pulse velocity (UPV) respectively. Ma et al. [16] introduced the damage mechanics model and damage factor of the backfill to describe strength characteristics and failure process of the CTB, and accurately described the stress-strain curve of the backfill during the loading process. Qiu et al. [17] established the damage constitutive model before the peak stress of the backfill based on the principle of strain equivalence.
With the deepening of research, many researchers have found that different additives have a significant impact on pore properties and mechanical properties of filling materials. Xu et al. [18] studied rheological properties and mechanical properties of (CTB) doped with flocculant (anionic polyacrylamide) over time, and results showed that the flocculant had a negative effect on the rheological behavior and mechanical strength of backfill. Farzaan et al. [19] investigated the thermal conductivity of backfill with and without sodium silicate additive as a new binder. Hu et al. [20] conducted uniaxial compressive strength tests, NMR and scanning electron microscope (SEM) tests on CPB with different air entraining agent (AEA) contents, results showed that: with the addition of AEA, the strength of the backfill first increases and then decreases. At the same time, an appropriate amount of AEA can optimize the pore structure of CPB. Bayram et al.’s [21] study presents the utilisation of granulated marble wastes (MW) as an additive and waste bricks (WB) as replacement and additive to ordinary Portland cement (OPC) for cemented paste backfill (CPB) of sulphide tailings.
Research methods for pore microscopic characteristics of porous materials mainly include nuclear magnetic resonance (NMR) [22,23,24,25,26], computerized tomography (CT) scan [27,28,29,30], scanning electron microscope (SEM) [31,32,33,34], mercury intrusion porosimetry (MIP) [35,36,37,38,39] method and other technologies. Many researchers have discovered that the porosity of the backfill is closely related to the strength, Ai et al. [40] used nuclear magnetic resonance technology to test the porosity of the backfill, and found that the porosity of the backfill has an important influence on macroscopic physical properties of the backfill. Cihangir et al. [41] studied the short-term and long-term strength and microstructure development of CPB produced by sodium silicate active slag (SSAS) under different silicate modulus (Ms). Liu et al. [42] studied the pore structure of backfill by using NMR and SEM technologies, and found that with the increase of curing age, the porosity of backfill decreased gradually, and the porosity was negatively correlated with the compressive strength. Hu et al. [43] used NMR and SEM techniques to obtain microscopic characteristics of CPB samples under four different curing conditions, and established the relationship between the water permeability of CPB samples and the uniaxial compressive strength, as well as microscopic characteristics of samples. Li et al. [44] conducted a uniaxial compressive strength test and MIP test on filling samples with a curing age of 28 d, and results showed that there was a certain linear correlation between the compressive strength and porosity of filling samples.
In summary, many researchers have used CT, SEM, HMR, MIP, and other microscopic inspection techniques to test the porosity of the filling material, explore the relationship between microscopic characteristics of pores and the strength. Study effects of different additives and curing ages on the strength of CTB, and building the backfill strength prediction model and damage constitutive model from different angles. However, few researchers have analyzed and discussed evolution laws of filling strength from the perspective of porosity variation. Based on the above research, this study conducted nuclear magnetic resonance test and uniaxial compression test on three groups of backfills under different curing ages, and analyzed change laws of strength, porosity, porosity variation and strength growth rate of different backfills under different curing ages. The porosity variation (ΔP) [45], which can directly reflect the strength evolution process of the backfill, was introduced, and the strength evolution model of CTB based on the porosity variation was established.

2. Materials and Methods

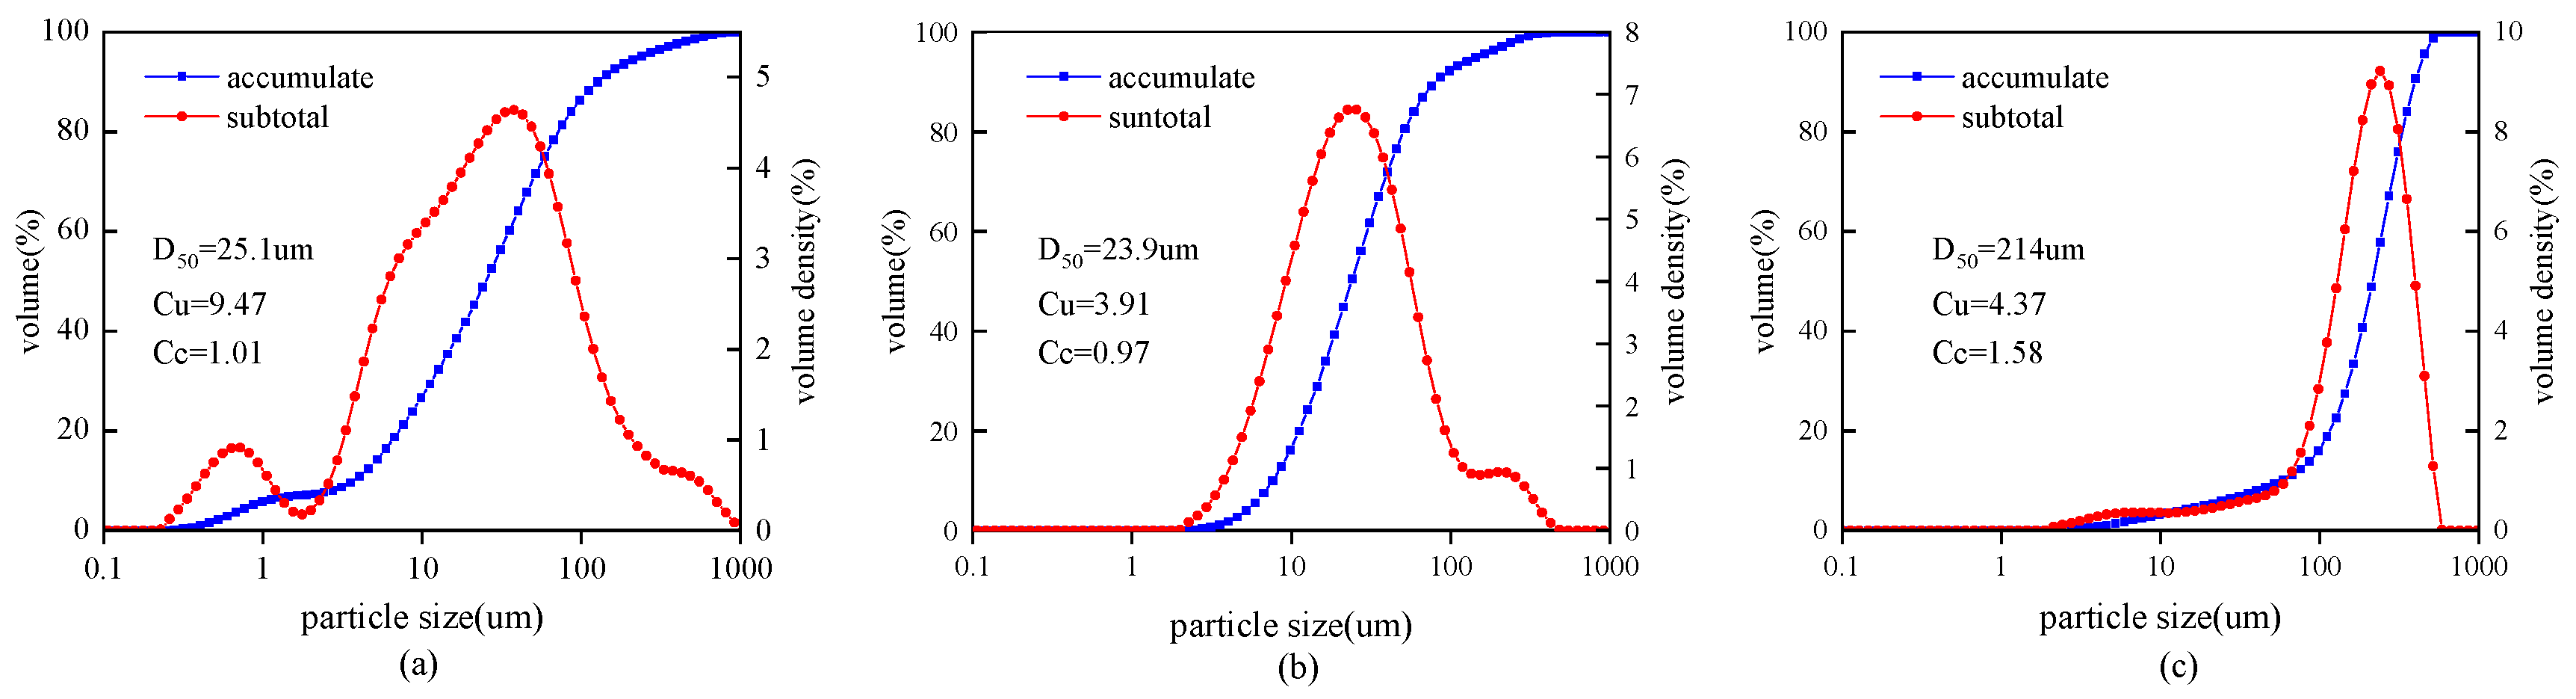
2.1. Experiment Materials

Samples used tailings from a mine as the aggregate, ordinary portland cement (PC32.5) as the cementitious material, and different additives (lime and fly ash) were added. The lime is calcined from CaCO3, with CaO as the main component, the fly ash is the solid waste discharged from coal-fired power plants, with SiO2, Al2O3, and Fe2O3 as main components, and the test water is tap water in the laboratory. Table 1 shows the basic physical parameters of tailings and Table 2 shows the main chemical composition of the materials. Figure 1 shows the material particle size distribution and accumulation curve.

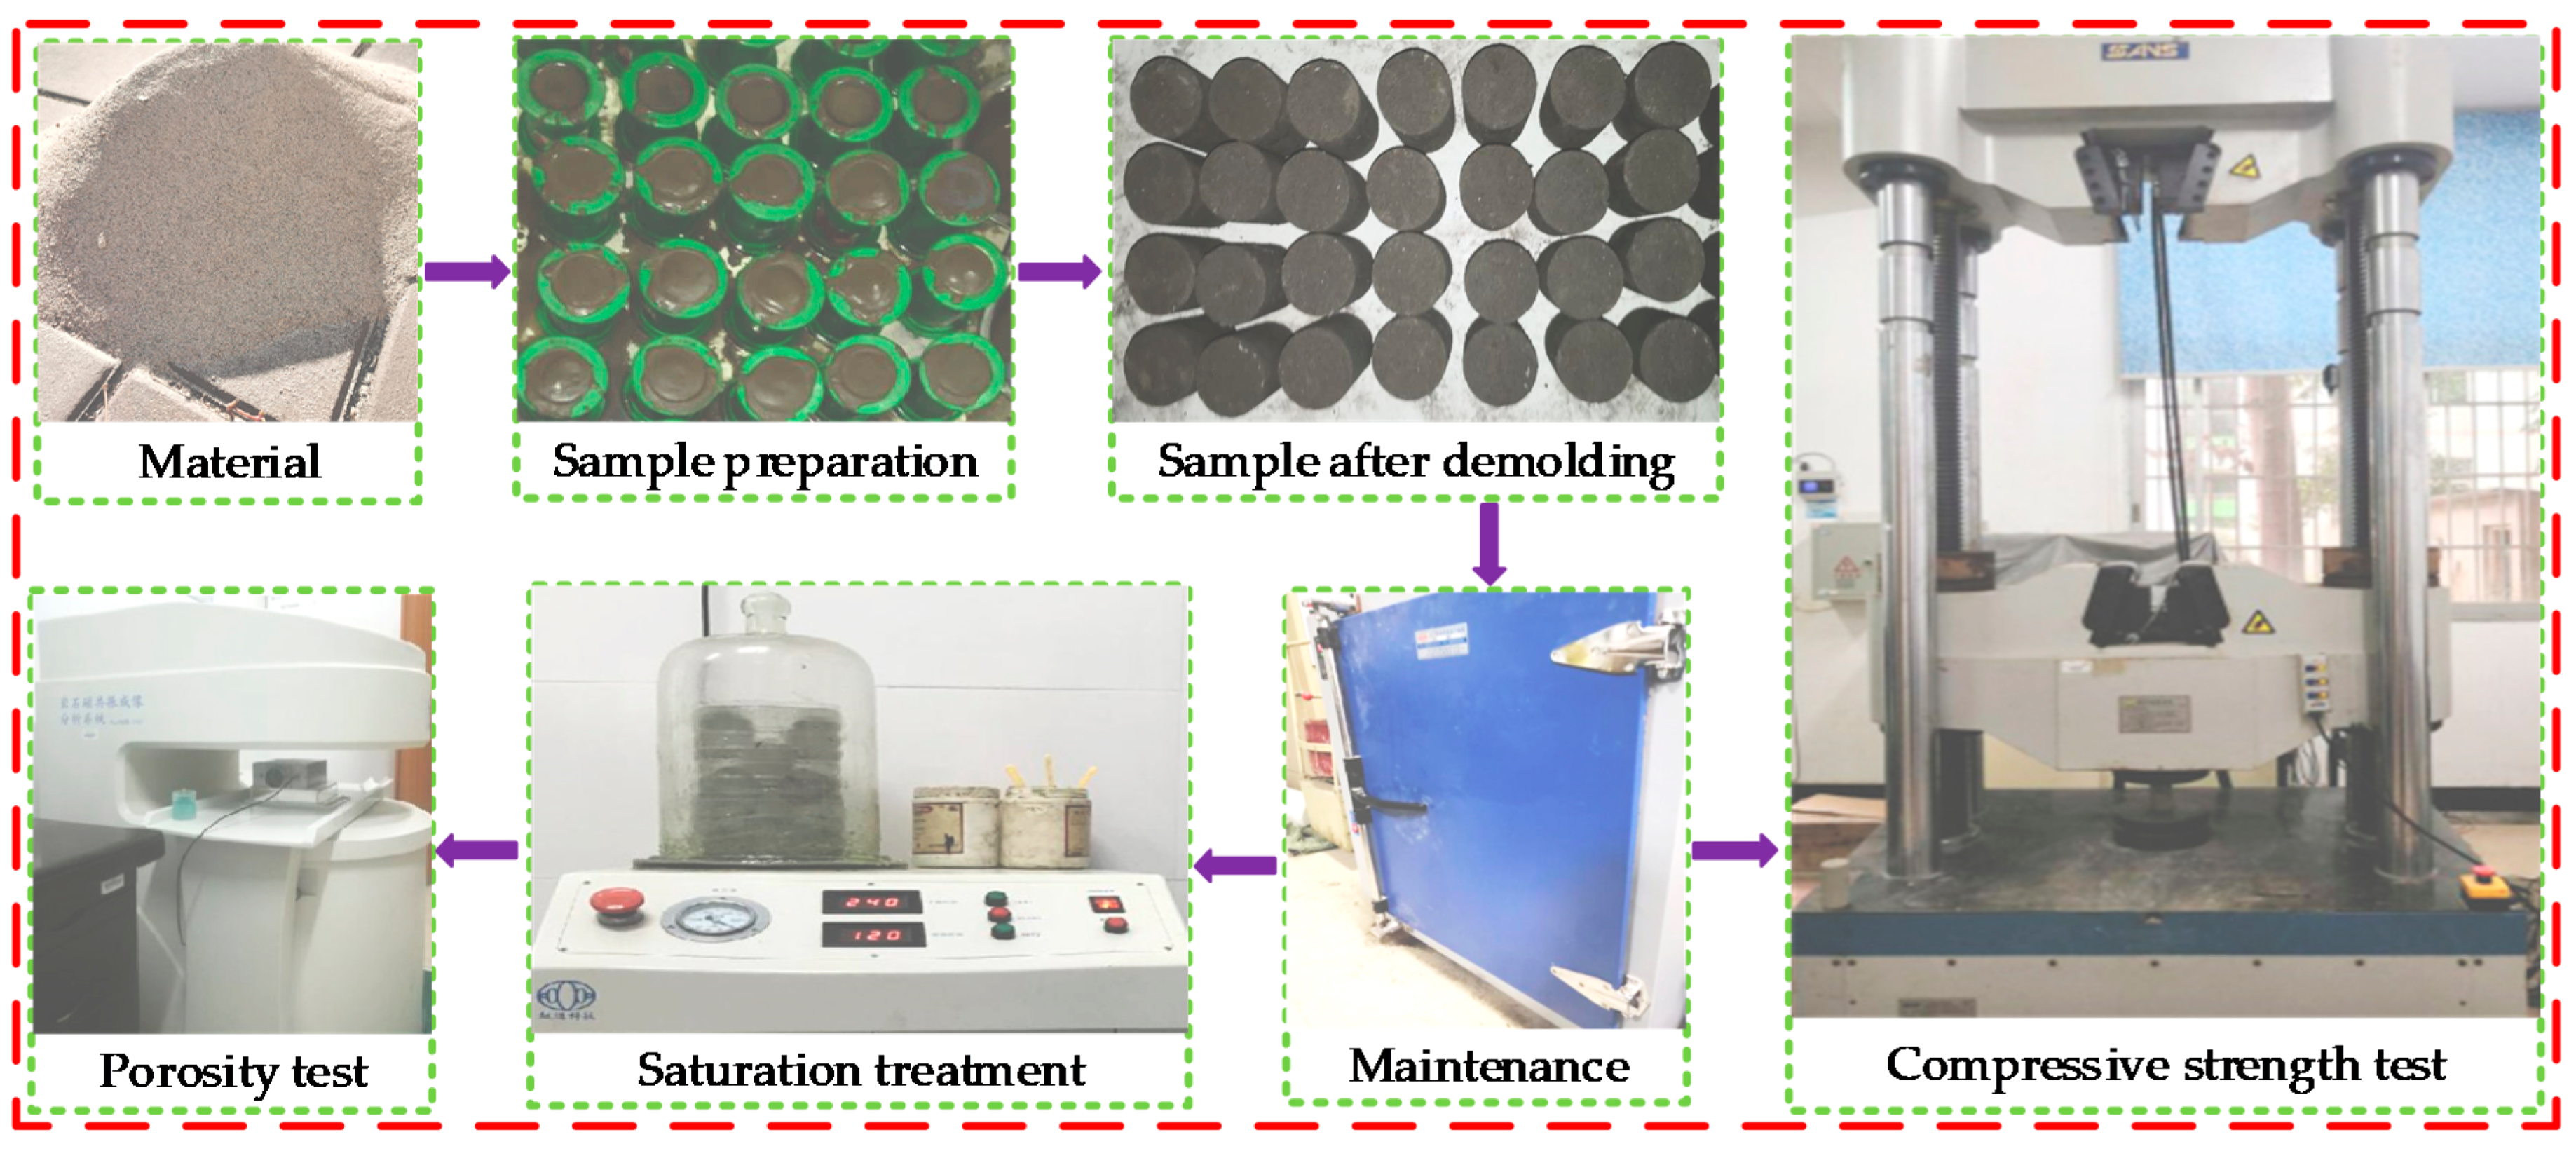
2.2. Sample Preparation

In the experiment, different cement-sand ratios and different additives were selected as factor variables. Filling samples with a mass concentration of 74% and ratios of cement to sand of 1:4, 1:6, and 1:8 were made, respectively. Then, different fillings of different materials were tested. Samples were grouped and numbered: only adding cement for group A, adding cement and lime (adding 5% of cement amount) for group B, and adding cement and fly ash (adding 10% of cement amount) for group C. Sample specifications refered to “Rock Test Regulations for Water Conservancy and Hydropower Engineering” [46] and “Hydraulic Concrete Test Regulations” [47], and a cylinder with a diameter of 50 mm and a height of 100 mm was made. Manufacturing steps are as follows:
(1)
Mold cleaning. Take out the mold and clean it, and apply a layer of lubricating oil on the inside to facilitate later demolding.
(2)
Raw material weighing. According to the design of the test plan, weigh the amount of tailings, cement, additives and tap water solution needed for the test.
(3)
Stir to fill the mold. Mix the measured raw materials thoroughly for 5 min, and then fill the prepared mold with a glass rod.
(4)
Stripping and curing. After curing the backfill for one day, carry out the demolding number, and then put the filling sample into the standard concrete curing box (temperature 20 °C, relative humidity 99%) for curing.

2.3. Experimental Test

Take out filling samples after curing ages of 3 d, 7 d, and 28 d from the curing box in batches. Since the strength of the filler will decrease after being saturated with water, samples will be divided into two groups and one group will be tested for strength, the other group will be tested for porosity.
Uniaxial compressive strength tests were carried out on filling samples using a SNA420 universal servo testing machine, and, due to the low strength of the backfill, force control was adopted to pressurize the backfill, and the loading speed of force was selected as 100 N/S.
An Ainimr-150 rock nuclear magnetic resonance imaging analysis system was used for porosity testing. The magnetic field intensity range of which is 0.3 T ± 0.05 T, the radio frequency pulse frequency range is 2 MHz~49.9 MHz, and the accuracy is 0.1 MHz. The backfill needs to be saturated with water prior to porosity testing. The dry and wet pumping times of the core vacuum saturation instrument were set as 240 min and 120 min [48], respectively, and then soaked in distilled water for 1 h (to ensure that the backfill is fully saturated) for porosity testing. Table 3 shows major Carr–Purcell–Meiboom–Gill (CPMG) sequence parameters for porosity test of backfill, and the specific test process is shown in Figure 2.

3. Results

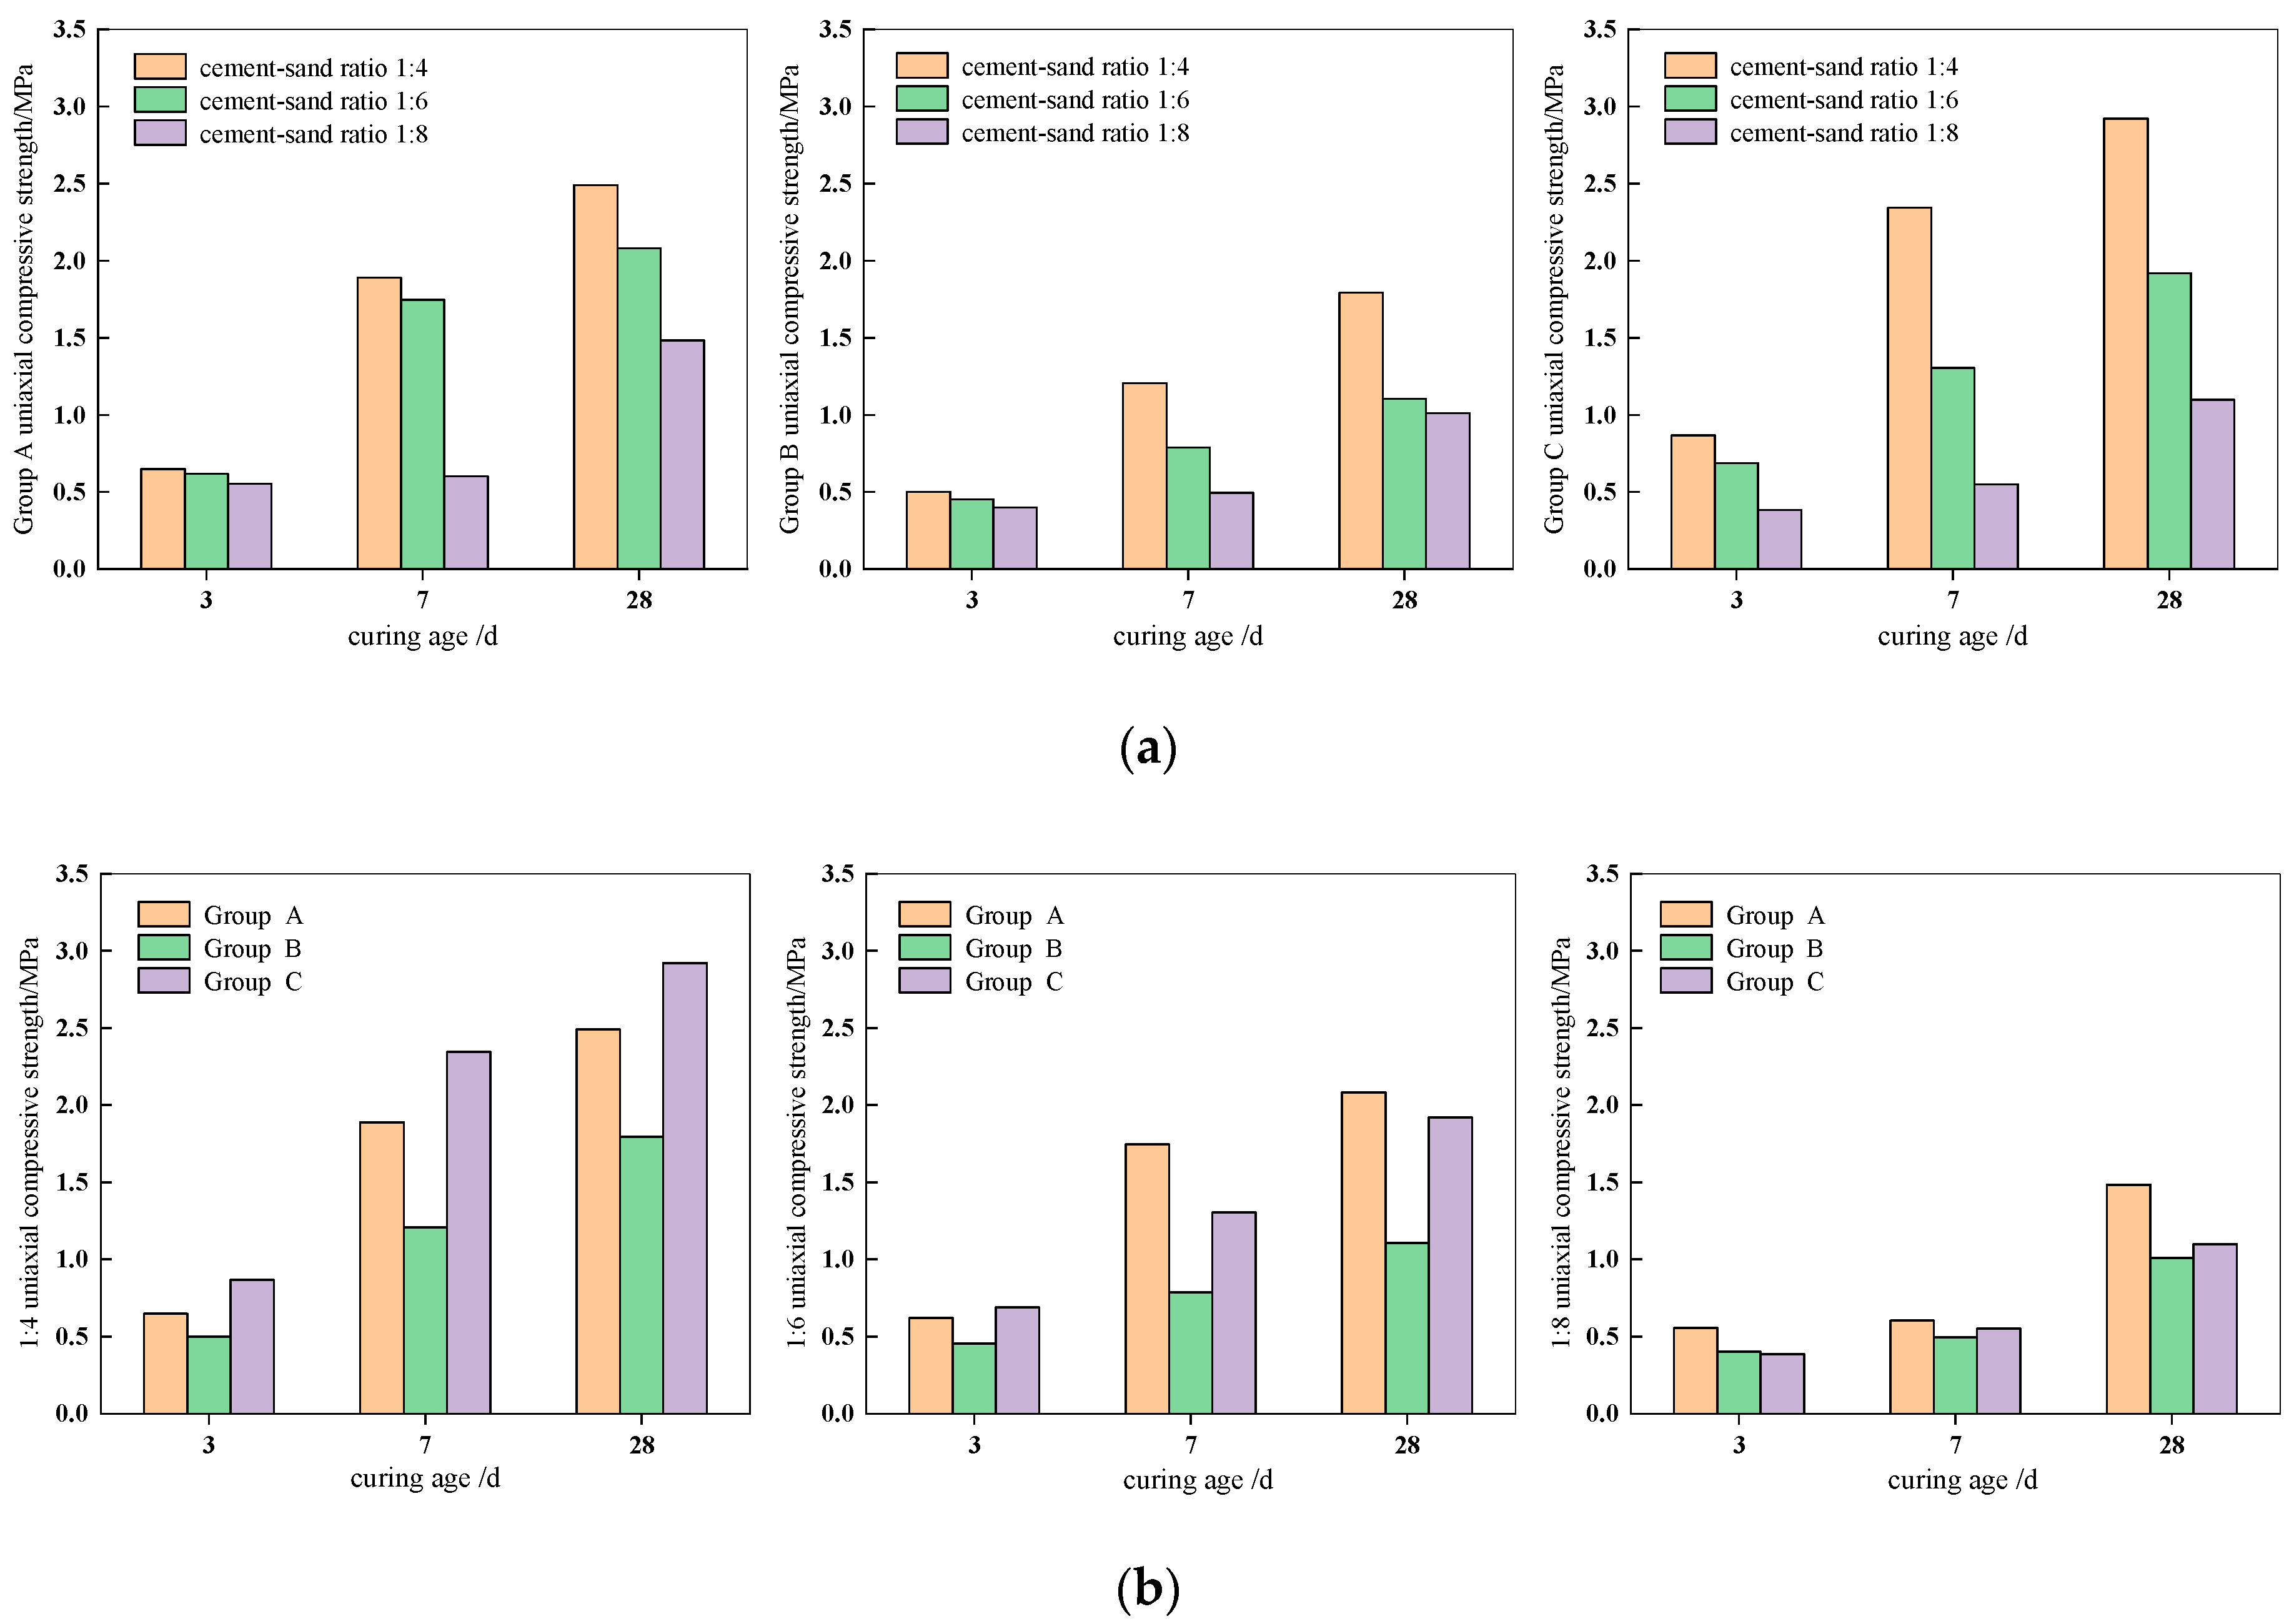
3.1. Strength Analysis of Backfill

According to test results of the uniaxial compressive strength of filling samples at different curing ages, the load-bearing strength of filling samples under different curing ages can be obtained. Table 4 shows test results of the uniaxial compressive strength testing of filling samples, and the strength of the three groups of backfills is shown in Figure 3.
It can be seen from Figure 3a that the strength of backfill in groups A, B and C increases with the increase of the curing age, and decreases gradually with the decrease of cement-sand ratio. When the curing age is from 3 d to 7 d, the strength of backfills with the cement-sand ratio of 1:4 and 1:6 increases significantly, while the ratio of 1:8 increases slowly. Among them, the group C has the highest strength when the ratio is 1:4 and the curing age is 28 d, which is 2.921 MPa. In the backfill of group A, when the curing age is 3 d, the strength is relatively close under different cement-sand ratios, and strengths with a ratio of 1:4 and 1:6 are 1.890 MPa and 1.746 MPa respectively at 7 d, which is significantly greater than the ratio of 1:8. In the backfill of group B, when the curing age is 3 d and 7 d, strengths with a cement-sand ratio of 1:8 is not obvious, which are 0.401 MPa and 0.494 MPa. The strengths of 1:6 and 1:8 are, respectively, 1.104 MPa and 1.010 MPa when the curing age is 28 d, which is significantly lower than the ratio of 1:4. In the backfill of group C, the strength decreases stepwise with the decrease of the cement-sand ratio, when the curing age is 7 d and 28 d, strengths with a ratio of 1:4 are 2.343 MPa and 2.921 MPa, respectively, which is obviously larger than the ratio of 1:6 and 1:8.
It can be seen from Figure 3b that when the curing age is 3 d, strengths of backfill in the three groups are basically the same with different cement-sand ratios, the group B is basically lower than that of A and C groups as the curing age increases, it shows that adding lime has a certain deteriorating effect on the filling strength. When the cement-sand ratio is 1:4, the strength of backfill is always in the order of group C > group A > group B with the increase of curing age, and when the curing age is 7 d and 28 d, strengths of group B are 1.206 MPa and 1.794 MPa, respectively, significantly smaller than A and C groups. When the cement-sand ratio is 1:6, the strength of group A is higher than that of group B and group C at 7 d and 28 d curing age. When the cement-sand ratio is 1:8, the strength of backfill increases with the curing age, and there is always in the order of group A > group C > group B. When the curing age is 7 d, the strength of the three groups is relatively close, and the strength of group A is 1.483 MPa at 28 d, which is higher than that of group B and group C.

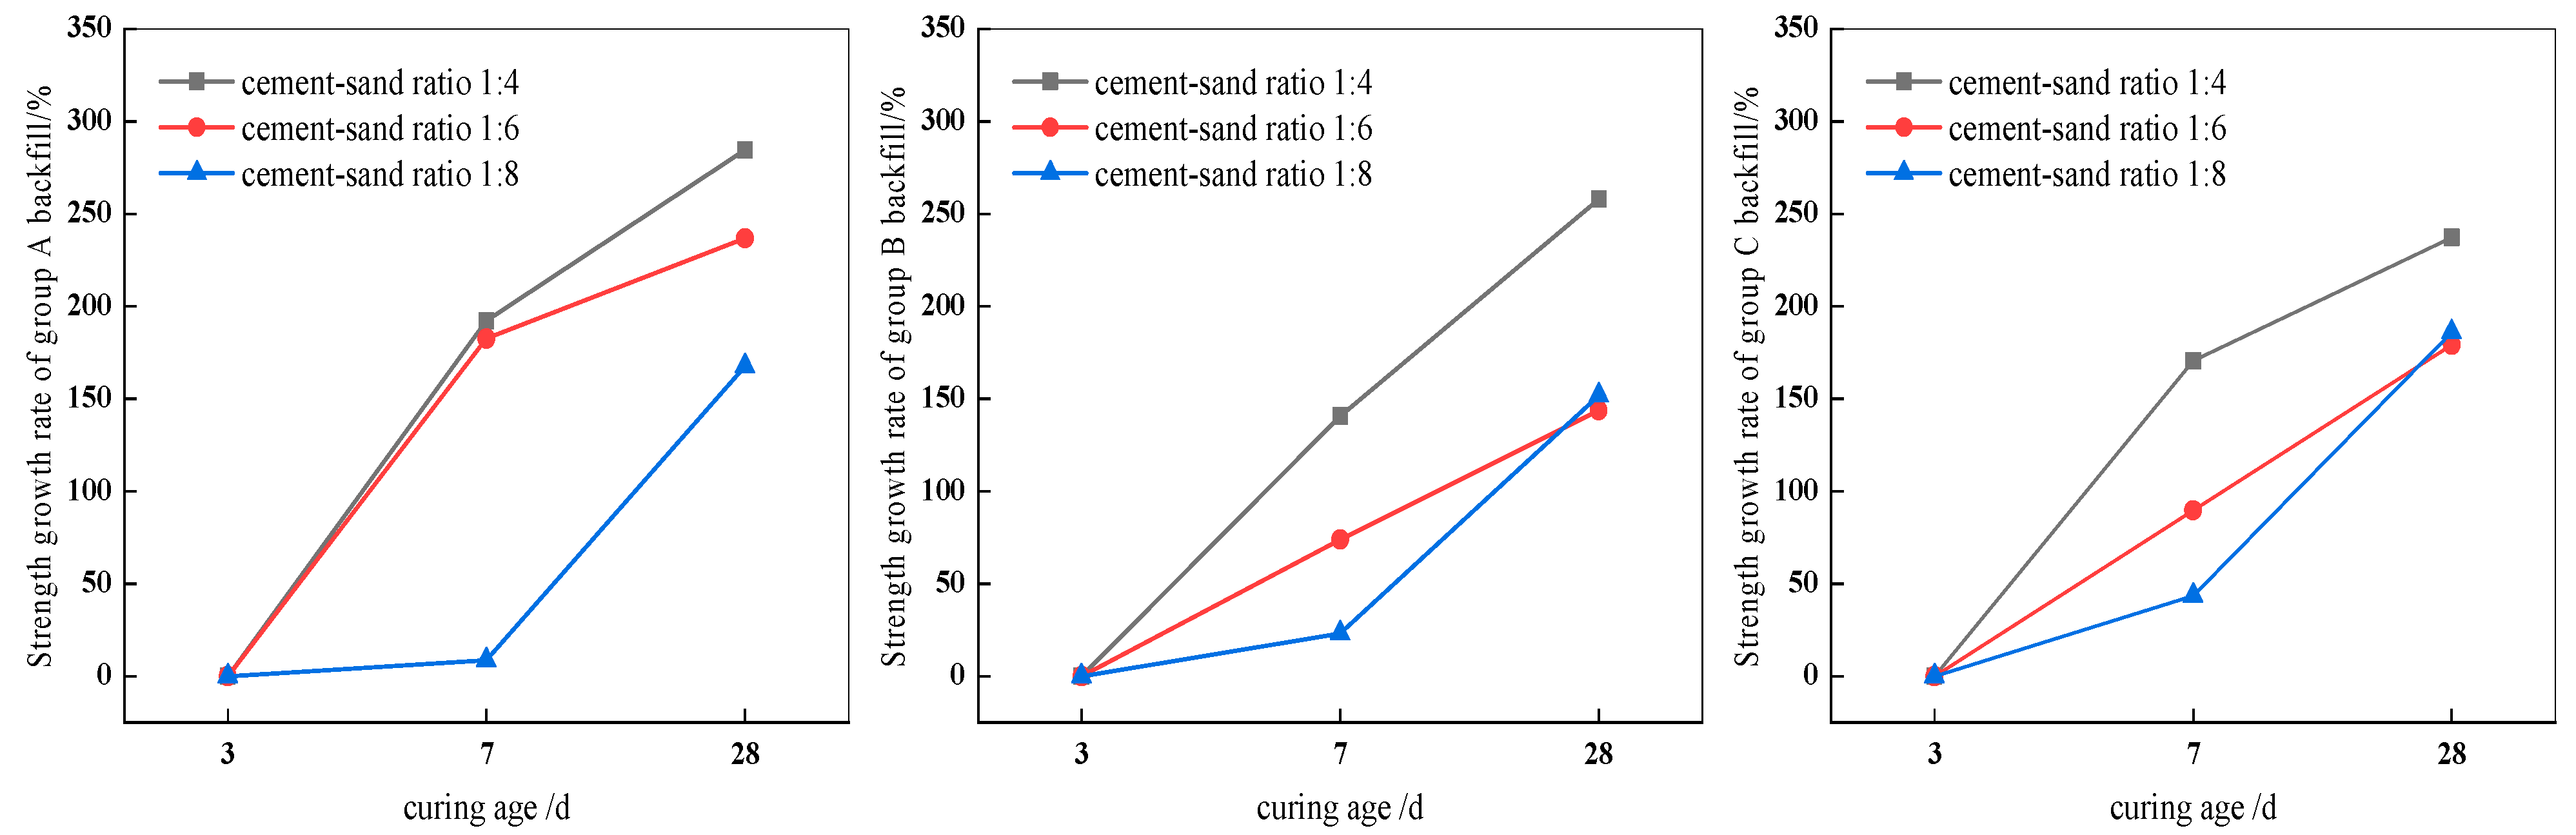
3.2. Strength Growth Rate Analysis

Strengths of the three groups of backfills under different cement-sand ratios all increase with the increase of the curing age. η is defined as the growth rate of the filling strength and F(3) as the initial strength value of the backfill. Figure 4 shows the relationship between the curing age and strength growth rates of the three groups of backfills. The strength growth rate of the backfill η is:
η = F ( d ) F ( 3 ) F ( 3 ) × 100 % ( d 3 )
where F(d) is the strength of the backfill at the curing age of d days; F(3) is the strength of backfill at the curing age of 3 d.
It can be seen from Figure 4 that the strength growth rates of the three groups of backfills under different cement-sand ratios gradually increases with the increase of the curing age, reflecting that the filling strength gradually increases with the increase of the curing age. Among them, the strength growth rate of the backfill with a cement-sand ratio of 1:4 is always higher than those of ratios of 1:6 and 1:8. When the curing age is 28 d, the strength growth rate of group A with a ratio of 1:4 is the highest, reaching 284.7%. Strength growth rates of the three groups of backfills gradually decreases with the decrease of the cement-sand ratio when the curing age changes from 3 d to 7 d. In the backfill of group A, strength growth rates with the cement-sand ratio of 1:4 and 1:6 during the curing age from 3 d to 7 d are relatively close. In backfill of Group B and Group C, the strength growth rate with a cement-sand ratio of 1:8 is greater than that of the ratio of 1:6 when the curing age is 28 d.

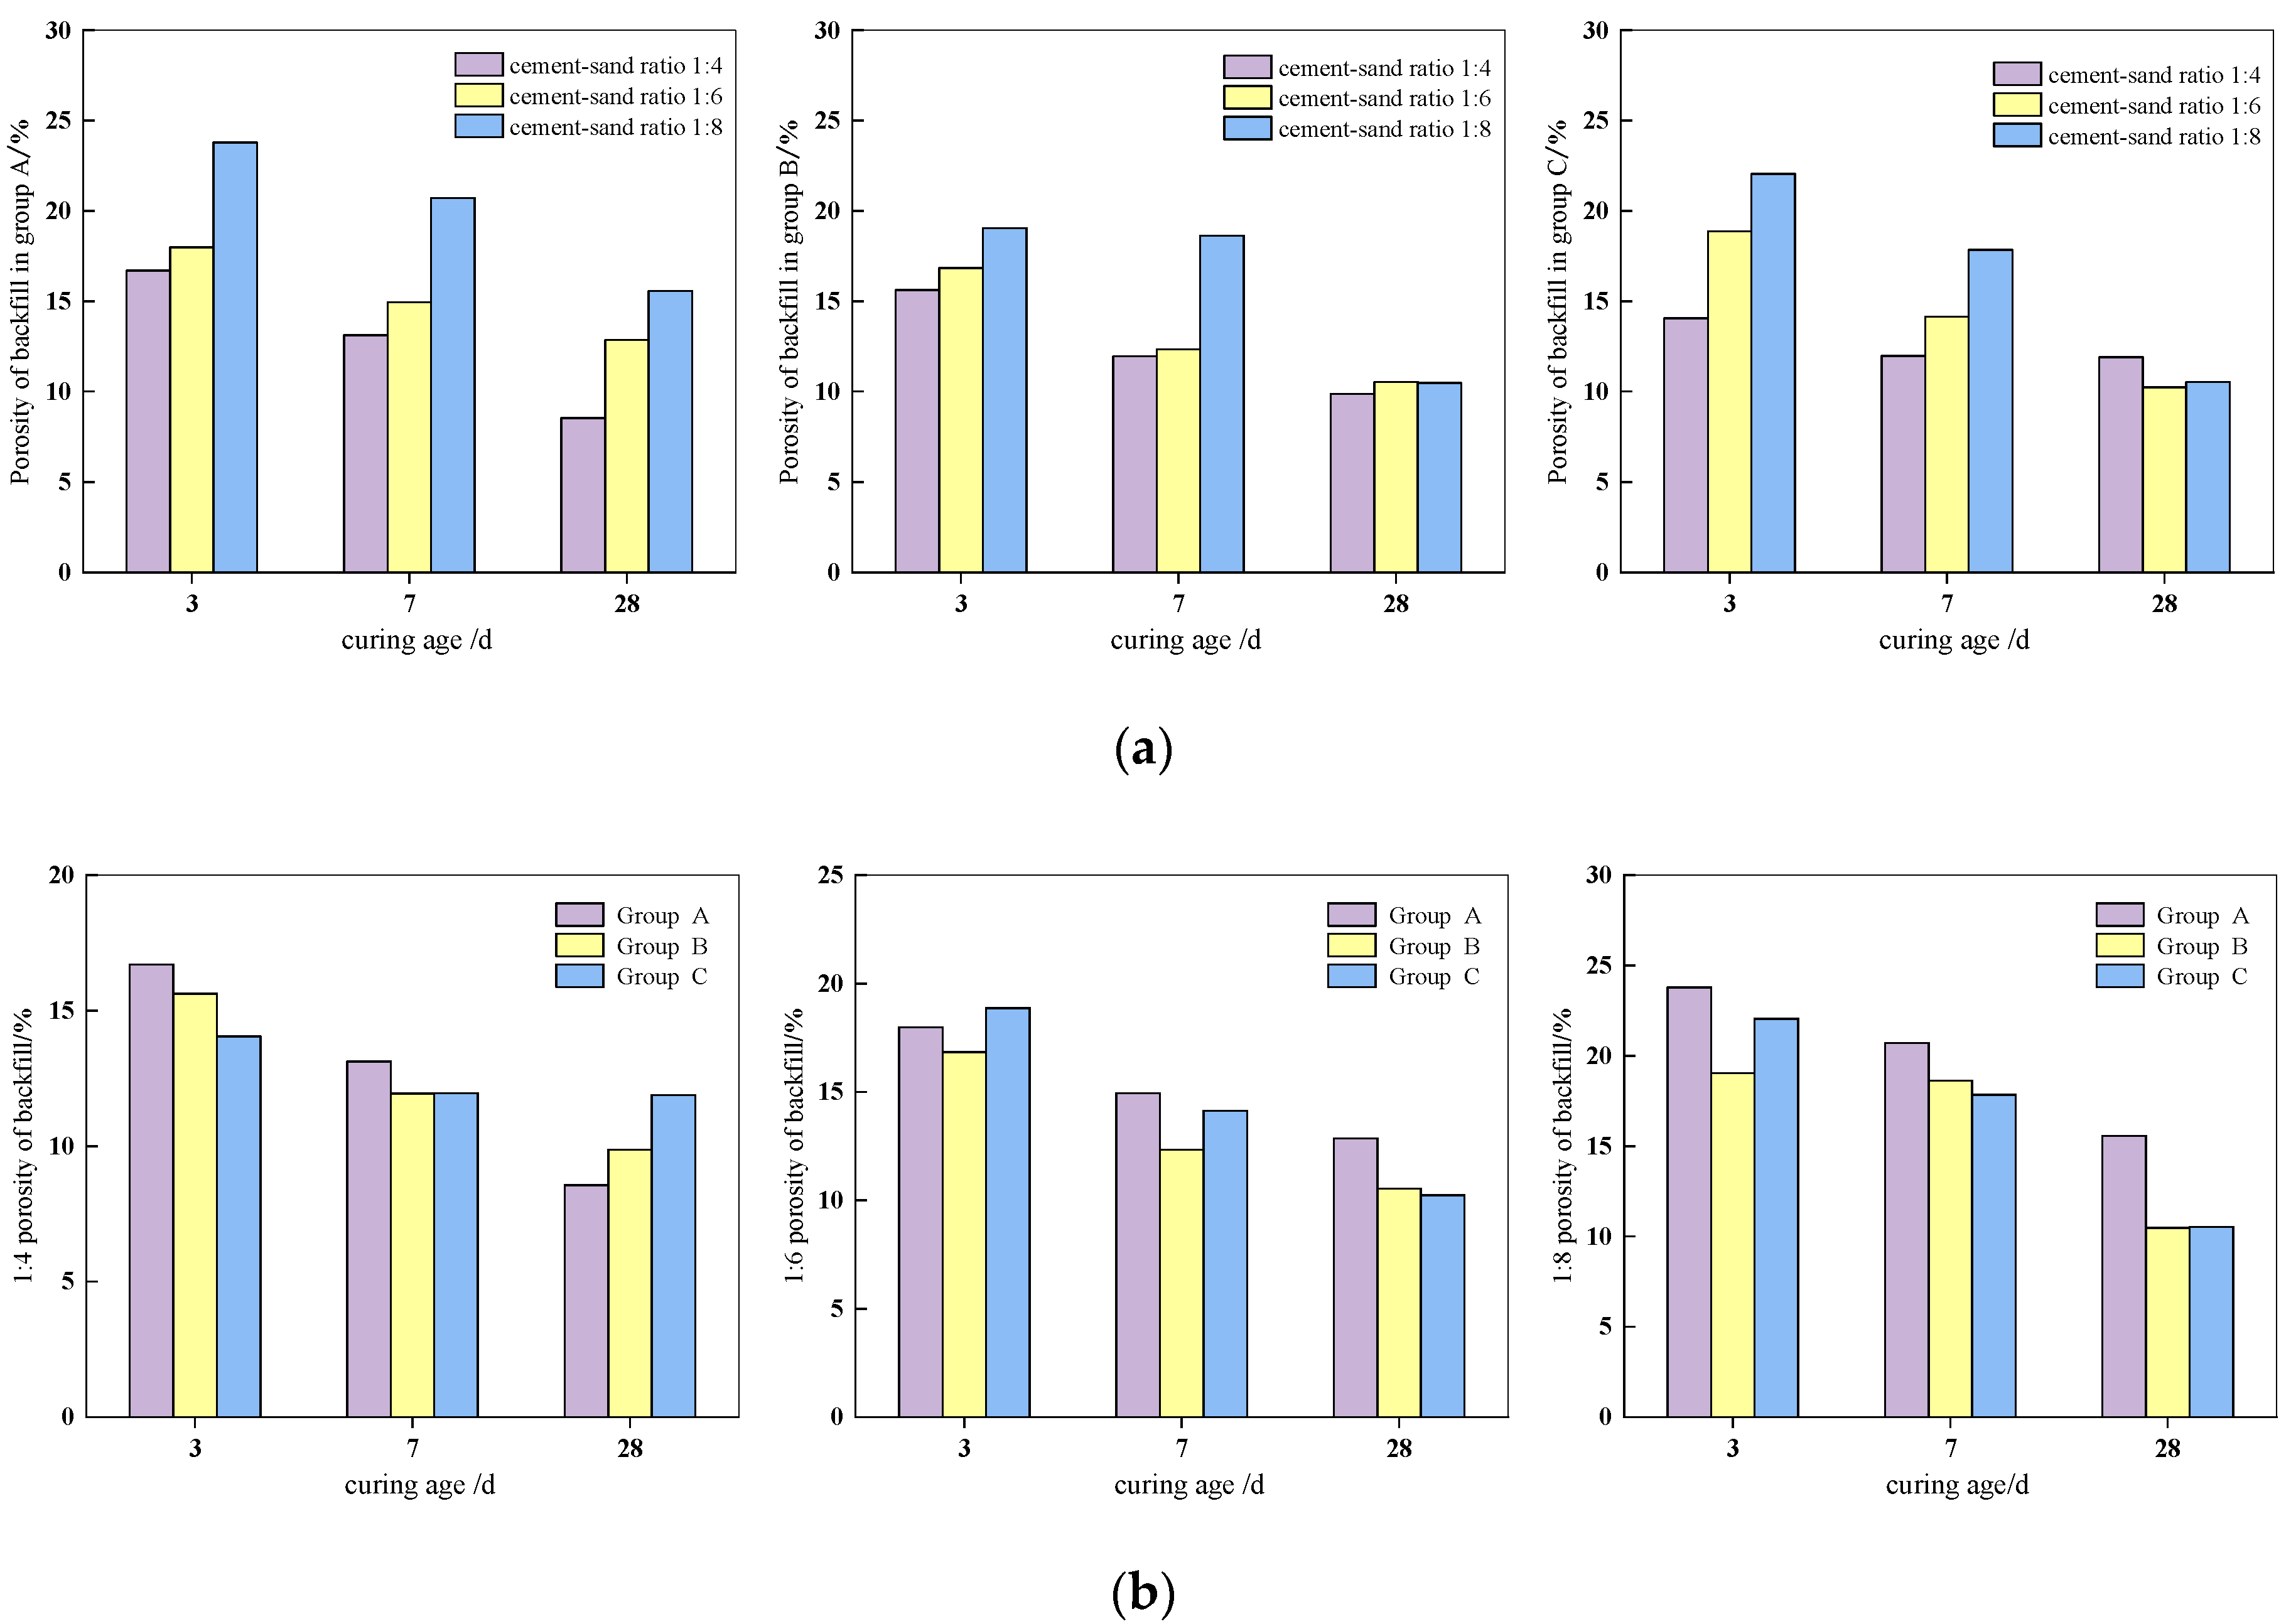
3.3. Porosity Analysis

To obtain the porosity of the backfill under different conditions, the study used an AniMR-150 rock nuclear magnetic resonance instrument to test the porosity of the saturated filling sample, and made statistics on test results. Analysis results are shown in Table 5 and Figure 5.
It can be seen from Figure 5a that the porosity of the three groups of backfills gradually decreases with the increase of the curing age, and the reason is that, as the curing age increases, hydration products inside the backfill increase continuously, internal pores are filled, and pores gradually decrease. In the case of the same curing age, the porosity of the backfill basically increases with the decrease of the cement-sand ratio. Among them, the group A has the largest porosity when the cement-sand ratio is 1:8 and the curing age is 3 d, which is 23.778%. In the backfill of group A, when the curing age is 3 d, the porosity with a cement-sand ratio of 1:4 and 1:6 is close, at 16.705% and 17.981%, which are significantly smaller than that of the ratio of 1:8. The porosity increases stepwise as the ratio decreases at 28 d. In the backfill of group B, when the curing age is 7 d, the porosity with a cement-sand ratio of 1:8 is significantly greater than that of the ratio of 1:4 and 1:6. When the curing age is 28 d, the porosity with different ratios is basically the same, 9.871%, 10.539% and 10.489%, respectively. In the backfill of group C, when the curing age is 28 d, the porosity with different cement-sand ratios is relatively close, and the porosity with a cement-sand ratio of 1:4 is greater than that of the ratio of 1:6 and 1:8.
It can be seen from Figure 5b that under the same conditions of the cement-sand ratio and the curing age, the porosity of the three groups of backfills is not much different. When the cement-sand ratio is 1:4, the porosity of the backfill of group A decreases fastest with the increase of the curing age. When the curing age is 3 d, the porosity is group A > group B > group C, and the porosity is group C > group B > group A at 28 d. When the cement-sand ratio is 1:6, the porosity of the backfill in group C decreases fastest with the increase of curing age. When the curing age is 3 d and 7 d, the porosity in group B is lower than that of group A and C. When the curing age is 28 d, the porosity in group B and C is close, which is 10.539% and 10.236%, respectively. When the cement-sand ratio is 1:8, the porosity of backfill in group A increases with the curing age, which is greater than that of group B and C. When the curing age is 28 d, the porosity in group B and C is basically the same, which is 10.489% and 10.528%, respectively, being significantly smaller than that of group A.

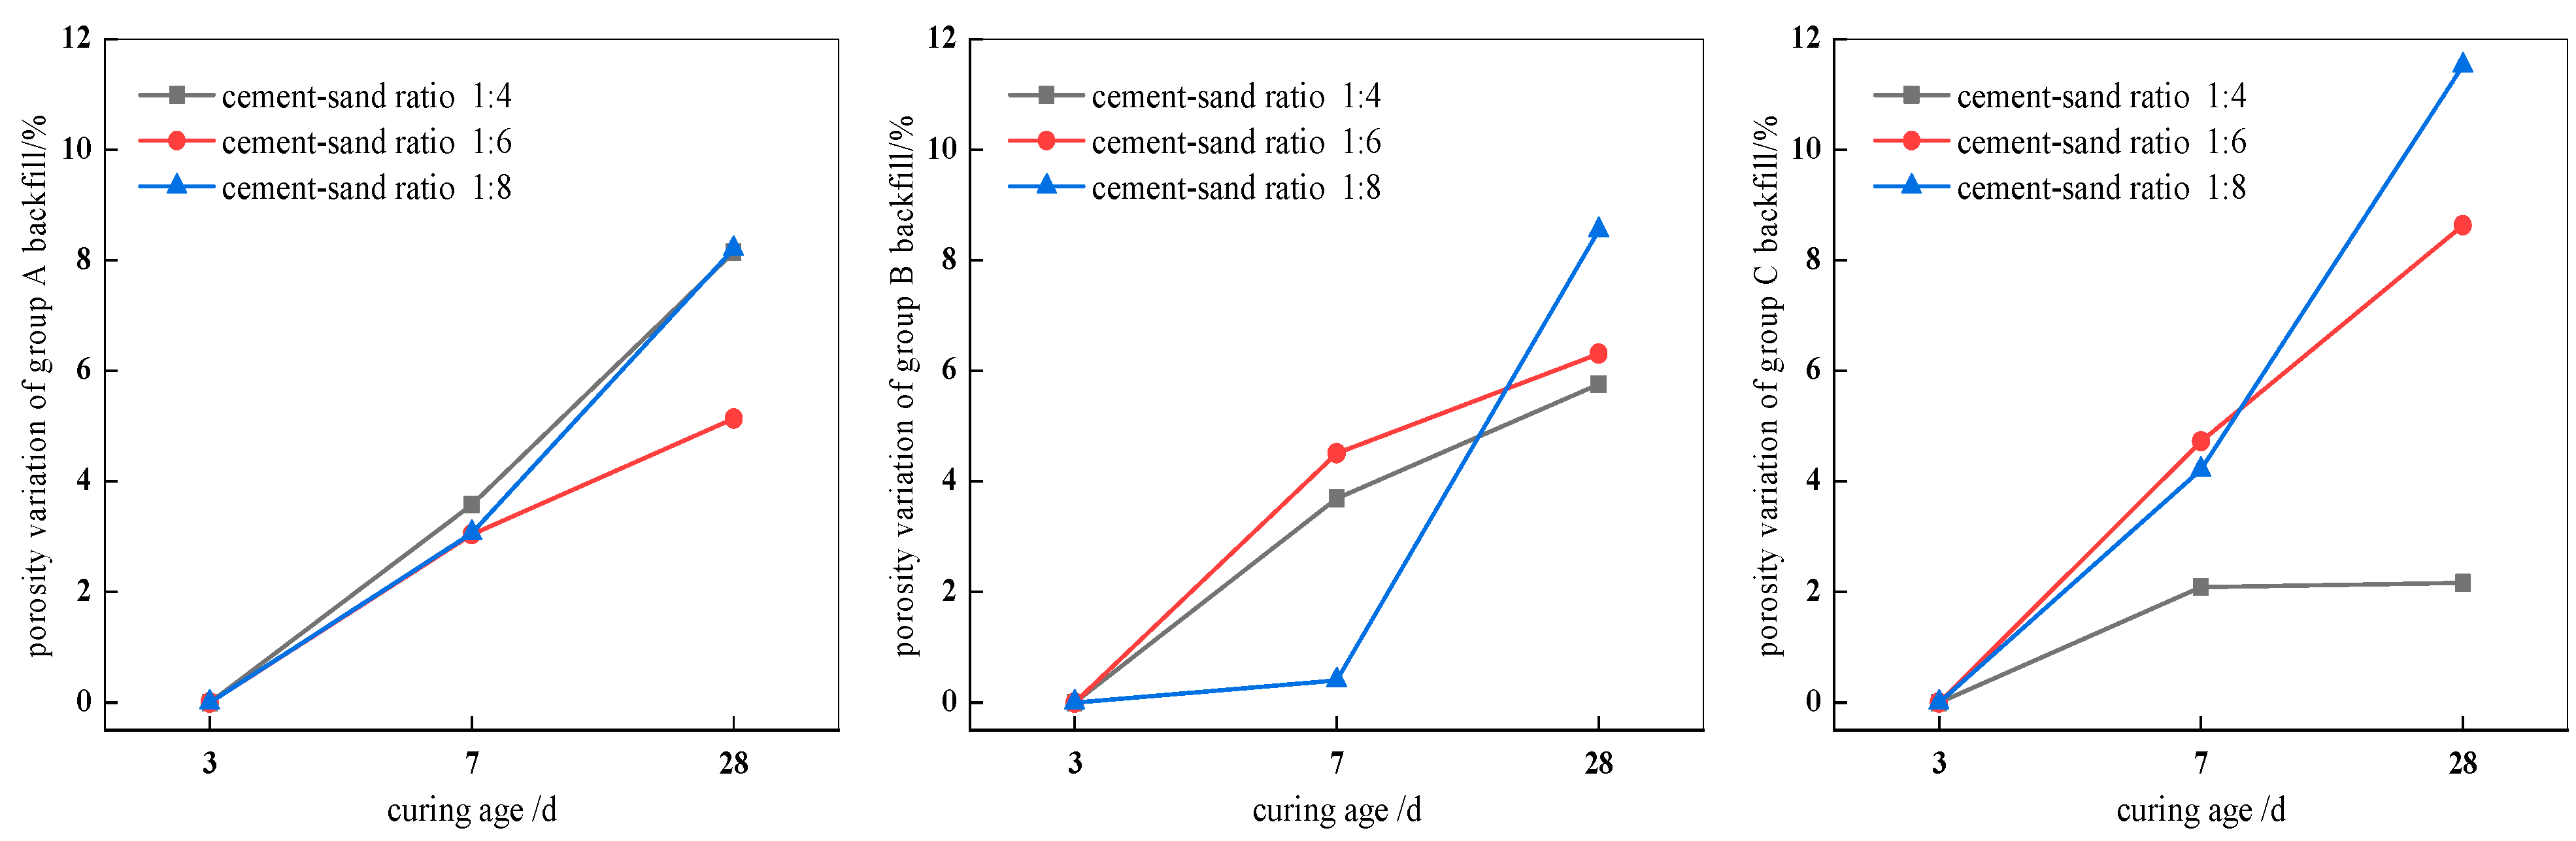
3.4. Analysis of Porosity Variation

According to the analysis of the above test results, the porosity of the backfill decreases with an increase of the curing age. The porosity variation is defined as ΔP and P(3) is the initial porosity of backfill. Figure 6 shows the relationship between the curing age and the variation in porosity of the backfill. The porosity variation ∆P is:
Δ P = P ( 3 ) P ( d ) ( d 3 )
where P(3) is the porosity of the backfill at the curing age of 3 d; P(d) refers to the porosity of backfill at the curing age of d days.
It can be seen from Figure 6 that with the increase of the curing age, the porosity variation of backfill in all three groups increases gradually, which reflects that the filling porosity decreases gradually with the increase of curing age. When the curing age is from 3 d to 28 d, the porosity variation of backfill in group C with a cement-sand ratio of 1:8 is the largest, which is 11.520%. In the backfill of group A, when the curing age is from 3 d to 7 d, the porosity variation of backfill with different cement-sand ratios is no much different. When the curing age is from 7 d to 28 d, the porosity variation with a cement-sand ratio of 1:4 and 1:8 is higher than that for a cement-sand ratio 1:6. In the backfill of group B, when the curing age is from 3 d to 7 d, the porosity variation of the backfill with a cement-sand ratio of 1:8 increases slowly, but from 7 d to 28 d, the porosity variation increases rapidly, and the porosity variation with a cement-sand ratio of 1:8 is 8.549% at 28 d, which is larger than that of cement-sand ratios of 1:4 and 1:6. In the backfill of group C, when the curing age is from 3 d to 28 d, the porosity variation of the backfill with a cement-sand ratio of 1:4 is always lower than that of the cement-sand ratio of 1:6 and 1:8. When the curing age is 28 d, the porosity variation with different cement-sand ratios is 2.160%, 8.631% and 11.520%, respectively.

4. Strength Evolution Model of Backfill

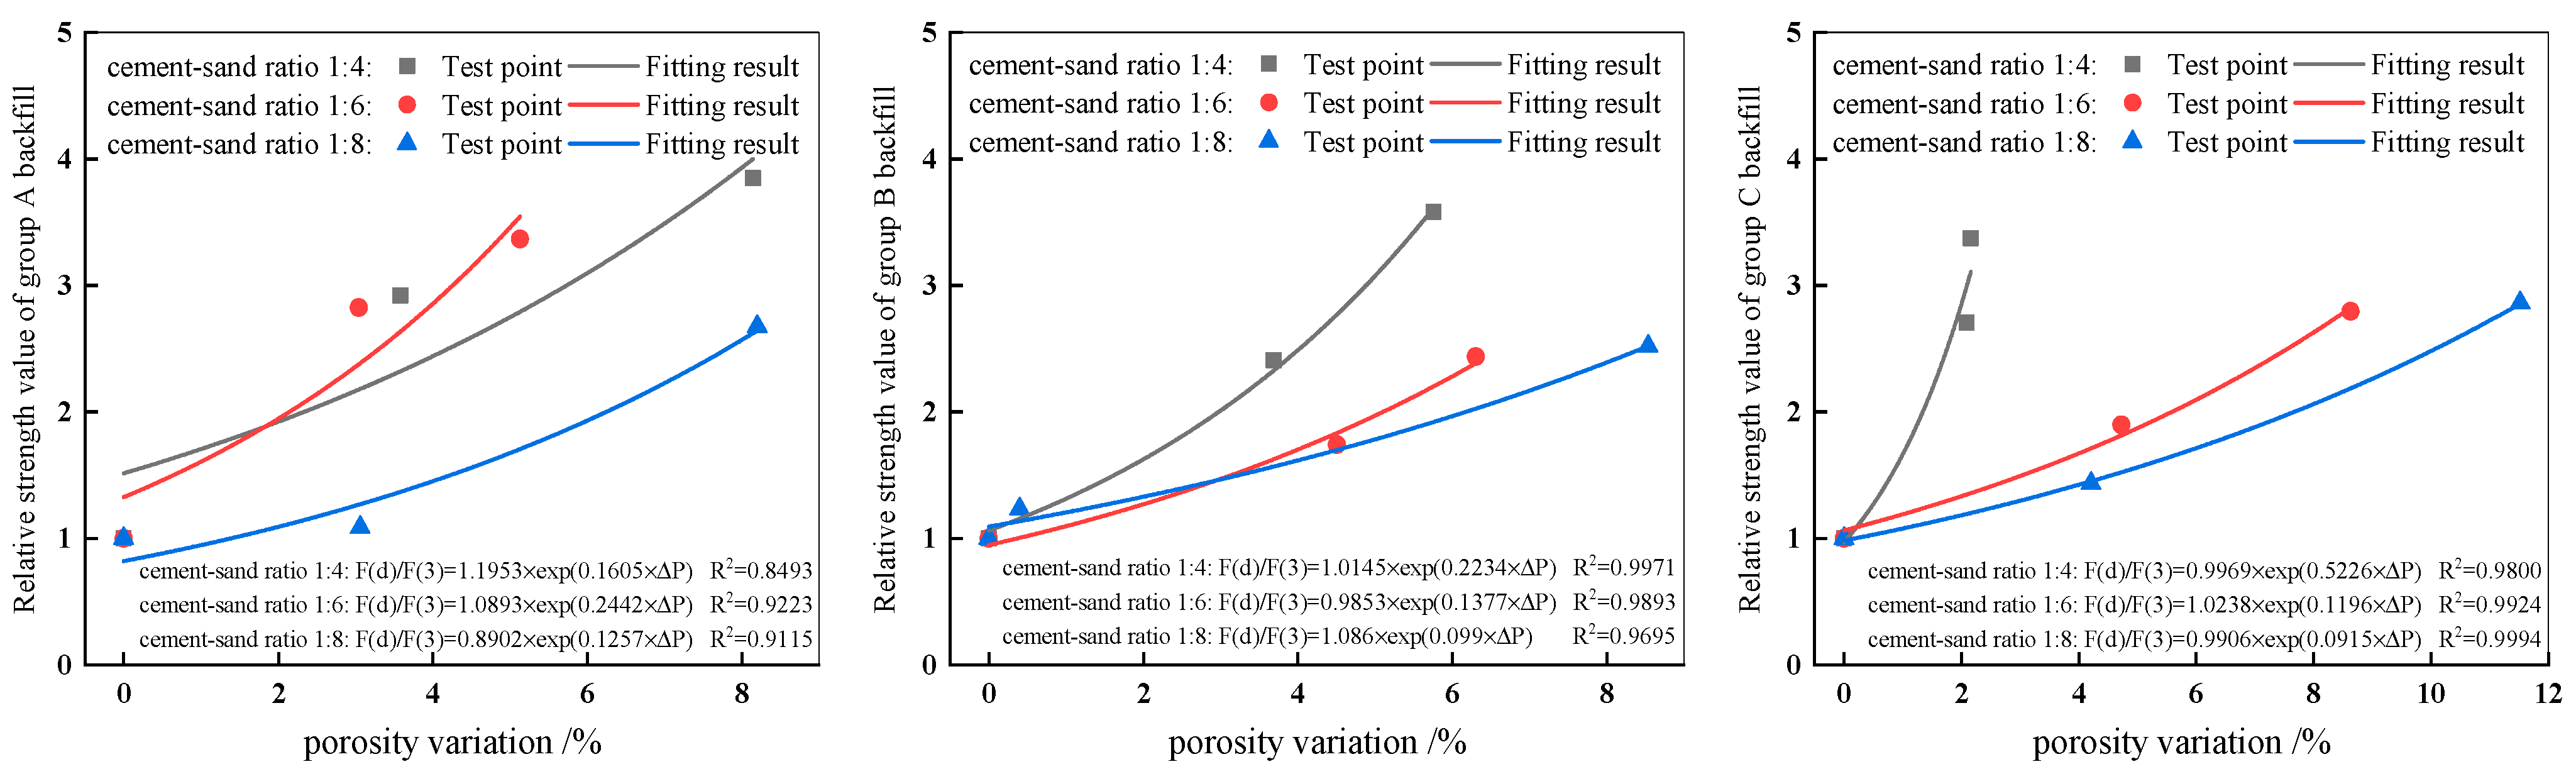
4.1. Filling Strength Evolution Model Based on Porosity Variation

From the above analysis, it can be seen that the curing age has a significant impact on the porosity and strength of the backfill, and the growth rate of the filling strength gradually increases with the increase of the curing age. If the growth rate of the filling strength during the unit curing age is approximately constant, then the growth rate of the filling strength from d days to d+∆d days for the curing age is:
F ( d + Δ d ) F ( d ) F ( d ) = k 1 Δ d ( k 1 > 0 , d 3 )
where k1 is the strength growth rate of backfill during the unit curing age.
Transform to
F ( d + Δ d ) F ( d ) Δ d = k 1 F ( d )
Which is
d F ( d ) d ( d ) =   k 1 F ( d )  
Integrate Equation (5), and get
ln C 1 F ( d ) = k 1 d
Let d = 3, get
C 1 = exp ( 3 k 1 ) F ( 3 )
Substitute Equation (7) into Equation (6), and get
ln [ exp ( 3 k 1 ) F ( 3 ) F ( d ) ] = k 1 d
Transform to
exp ( 3 k 1 ) F ( 3 ) F ( d ) = exp ( k 1 d )
The porosity variation of the backfill increases gradually with the increase of the curing age, let the change rate of porosity within a unit curing age be approximately constant. The porosity variation of the backfill from d days to d + ∆d days is:
P ( d + Δ d ) P ( d ) = k 2 Δ d ( k 2 > 0 , d 3 )
where k2 the porosity variation rate of the backfill during the unit curing age.
Transform to
P ( d + Δ d ) P ( d ) Δ d = k 2
Which is
d P ( d ) d ( d ) = k 2
Integrate Equation (12), and get
P ( d ) + C 2 = k 2 d
Let d = 3, get
C 2 = 3 k 2 P ( 3 )
Substitute Equation (14) into Equation (13), and get
P ( d ) 3 k 2 P ( 3 ) = k 2 d
Transform to
d = P ( 3 ) P ( d ) k 2 + 3
Substitute Equation (16) into Equation (9), and get
F ( d ) F ( 3 ) = exp { k 1 k 2 [ P ( 3 ) P ( d ) ] }
Let ΔP = P(3) − P(d), define λ = k1/k2 as the strength evolution factor of the backfill, and F(d)/F(3) as the relative strength value of the backfill. Since the strength growth rate and porosity variation rate of the backfill during the unit curing age are approximately constant, it is necessary to use the test data fitting method to fit and modify the above model. At the same time, taking into account the difference in the influence of different additives and different cement-sand ratios on the strength growth rate of the backfill, the correction coefficient β is introduced to modify the formula, then there is
F ( d ) F ( 3 ) = β exp [ λ ( Δ P ) ]
According to Equation (18), the relationship between porosity variation and the relative strength value of a backfill follows an exponential function, and the model is also applicable to backfills with different additions and ratios.

4.2. Verification of Filling Strength Evolution Model

To verify the rationality of the model, the model was fitted with experimental data, Fitting results are shown in Figure 7, and specific values of fitting parameters β, λ, and R2 of the filling strength evolution model are shown in Table 6.
It can be seen from Figure 7 that with the change of the curing age, the porosity variation of the backfill has a good correlation with the relative strength value, and the model can well reflect the difference between the porosity variation of the backfill and the relative strength value. The relationship indicates the correctness and applicability of the established backfill strength evolution model.

5. Discussion

In this experiment, a certain mine tailing was used as aggregate, ordinary Portland cement (PC32.5) was used as cementing material, and different additives (lime and fly ash) were added to produce filling samples with mass concentration of 74% and cement-sand ratios of 1:4, 1:6, and 1:8, respectively. NMR technology and servo universal material testing machine were used to test the porosity and uniaxial compressive strength of filling samples with curing ages of 3 d, 7 d, and 28 d respectively, and the strength evolution model of CTB with curing ages was established based on the porosity variation. Test conclusions are as follows:
(1)
The strength of backfill in all three groups increases with the increase of curing age, and increases with the increase of cement-sand ratio. Under different cement-sand ratios, filling strength in group B is basically lower than that of group A and C with the increase of curing age, indicating that adding lime has a certain deterioration effect on short term cure strength.
(2)
The porosity of the three groups of filling samples with different lime and sand ratios gradually decreases with the increase of the curing age. Moreover, under the condition of the same curing age, the porosity of filling samples basically decreases with the increase of the cement-sand ratio, indicating that the curing age and the cement-sand ratio have a great influence on the filling porosity.
(3)
The porosity variation and strength growth rate of the three groups of filling samples gradually increase with the increase of curing age. With the increase of curing age, hydration products inside the backfill continue to increase, pores inside the backfill are filled, pore volume gradually decreases, porosity decreases, and strength of backfill increases.
(4)
The porosity variation (ΔP) and the relative strength value F(d)/F(3) in the strength evolution model of the backfill established in the study obey the exponential function relationship, and the two have a high correlation coefficient, which shows that the model can well reflect the relationship between the porosity variation and the relative strength value of the backfill, confirms the correctness of the strength evolution model of the backfill established. Because the model has a good fitting degree in the case of different gray–sand ratios and different additives, the model demonstrates applicability to backfills with different proportions and different additives.

Author Contributions

H.D. and W.Z. conceived and designed the experiments; W.Z. and Y.L. performed the experiments; G.T. and S.Y. contributed materials and theoretical foundations; Y.L. wrote the paper. All authors have read and agreed to the published version of the manuscript.

Funding

This work was financially supported by the National Natural Science Foundation of China under Grant number 51874352.

Institutional Review Board Statement

Not applicable.

Informed Consent Statement

Not applicable.

Data Availability Statement

The source data can be obtained in the article.

Conflicts of Interest

The authors declare no conflict of interest.

References

  1. Jiřina, T.; Jan, Š. Reduction of Surface Subsidence Risk by Fly Ash Exploitation as Filling Material in Deep Mining Areas. Nat. Hazards 2010, 53, 251–258. [Google Scholar] [CrossRef]
  2. Doherty, J.P. A Numerical Study into Factors Affecting Stress and Pore Pressure in Free Draining Mine Stopes. Comput. Geotech. 2015, 63, 331–341. [Google Scholar] [CrossRef]
  3. Li, J.; Zhang, J.; Huang, Y. An Investigation of Surface Deformation After Fully Mechanized, Solid Back Fill Mining. Int. J. Min. Sci. Technol. 2012, 22, 453–457. [Google Scholar] [CrossRef]
  4. Cheng, Z. Comparative Study on strength of mine backfill and specimen of laboratory backfill. Min. Technol. 2012, 12, 25–26. [Google Scholar]
  5. Sun, G.; Cai, S.; Wang, W. Simulation Study on the Mechanical Stability of Subsequent Filling Mining Stope. In Proceedings of the 2nd ISRM International Young Researchers’ Symposium on Rock Mechanics, Beijing, China, 14 October 2011. [Google Scholar]
  6. Sobhi, M.A.; Li, L. Numerical Investigation of the Stresses in Backfilled Stopes Overlying a Sill Mat. J. Rock Mech. Geotech. Eng. 2017, 9, 490–501. [Google Scholar] [CrossRef]
  7. Wang, M. Study on the Interaction Mechanism and Deformation Evolution Law between Cemented Backfill and Surrounding Rock; Wuhan University of Science and Technology: Wuhan, China, 2018. [Google Scholar]
  8. Gan, D.; Shen, M.; Sun, G.; Liu, Z. Analysis of strength characteristics of cementing backfill in mine tailings at high altitude. Chem. Miner. Process. 2016, 45, 46–48. [Google Scholar]
  9. Benzaazoua, M.; Ouellet, J.; Servant, S.; Newman, P.; Verburg, R. Cementitious Backfill with High Sulfur Content Physical, Chemical, and Mineralogical Characterization. Cem. Concr. Res. 1999, 29, 719–725. [Google Scholar] [CrossRef]
  10. Zhang, Q.; Wang, Z.; Rong, S.; Wang, X. Analysis of early strength characteristics and Micro–influencing mechanism of full–tailings cemented backfill in deep well mines. Nonferrous Met. Eng. 2019, 9, 97–104. [Google Scholar]
  11. Ghirian, A.; Fall, M. Long–Term Coupled Behaviour of Cemented Paste Backfill in Load Cell Experiments. Geomech. Geoengin. Int. J. 2016, 11, 237–251. [Google Scholar] [CrossRef]
  12. Li, J.; Yilmaz, E.; Cao, S. Influence of Solid Content, Cement/Tailings Ratio, and Curing Time on Rheology and Strength of Cemented Tailings Backfill. Minerals 2020, 10, 922. [Google Scholar] [CrossRef]
  13. Chen, K.; Su, Z.; Li, L. Study on the growth law of uniaxial compressive strength of high concentration cemented backfill. Coal Eng. 2019, 51, 133–136. [Google Scholar]
  14. Xu, W.; Tian, X.; Cao, P. Assessment of Hydration Process and Mechanical Properties of Cemented Paste Backfill by Electrical Resistivity Measurement. Nondestruct. Test. Eva. 2018, 33, 198–212. [Google Scholar] [CrossRef]
  15. Yilmaz, T.; Ercikdi, B. Predicting the Uniaxial Compressive Strength of Cemented Paste Backfill from Ultrasonic Pulse Velocity Test. Nondestruct. Test. Eva. 2016, 31, 247–266. [Google Scholar] [CrossRef]
  16. Ma, S.; Lv, S.; Liang, W.; Huang, G. Study on strength characteristics of cementing tailings backfill based on damage mechanics model. Min. Res. Dev. 2019, 39, 101–105. [Google Scholar]
  17. Qiu, J.; Yang, L.; Xing, J.; Sun, X.; Wang, Q. Establishment of constitutive model for backfill damage and method for determining its strength. Met. Mine 2016, 5, 48–51. [Google Scholar]
  18. Xu, W.; Tian, M.; Li, Q. Time–Dependent Rheological Properties and Mechanical Performance of Fresh Cemented Tailings Backfill Containing Flocculants. Min. Eng. 2020, 145, 106064. [Google Scholar] [CrossRef]
  19. Abbasy, F.; Hassani, F.P.; Madiseh, S.A.G.; Côté, J.; Nokken, M.R. An Experimental Study on the Effective Parameters of Thermal Conductivity of Mine Backfill. Heat Transf. Eng. 2014, 35, 1209–1224. [Google Scholar] [CrossRef]
  20. Hu, J.H.; Kuang, Y.; Zhou, T.; Zhao, F. Influence of Air Entraining Agent on Strength and Microstructure Properties of Cemented Paste Backfill. IEEE Access 2019, 7, 140899–140907. [Google Scholar] [CrossRef]
  21. Ercikdi, B.; Külekci, G.; Yılmaz, T. Utilization of Granulated Marble Wastes and Waste Bricks as Mineral Admixture in Cemented Paste Backfill of Sulphide–Rich Tailings. Constr. Build. Mater. 2015, 93, 573–583. [Google Scholar] [CrossRef]
  22. Jiang, Z.; Yu, S.; Deng, H.; Deng, J.; Zhou, K. Investigation on Microstructure and Damage of Sandstone under Cyclic Dynamic Impact. IEEE Access 2019, 7, 133145–133158. [Google Scholar] [CrossRef]
  23. Jiang, Z.; Deng, H.; Liu, T.; Tian, G.; Tang, L. Study on Microstructural Evolution of Marble under Cyclic Dynamic Impact Based on NMR. IEEE Access 2019, 7, 138043–138055. [Google Scholar] [CrossRef]
  24. Deng, H.; Yu, S.; Deng, J. Damage Characteristics of Sandstone Subjected to Coupled Effect of Freezing–Thawing Cycles and Acid Environment. Adv. Civ. Eng. 2018, 2018, 1–10. [Google Scholar] [CrossRef] [Green Version]
  25. Deng, H.; Tian, G.; Yu, S.; Jiang, Z.; Zhong, Z.; Zhang, Y. Research on Strength Prediction Model of Sand–Like Material Based on Nuclear Magnetic Resonance and Fractal Theory. Appl. Sci. 2020, 10, 6601. [Google Scholar] [CrossRef]
  26. Qin, Y.; Hu, J.; Yang, D.; Kuang, Y.; Zhao, F.; Zhou, T. Optimization of Transport Performance and Strength of the Filling Slurry in Tailings Reservoir Waste by Adding Air Entraining Agent. Minerals 2020, 10, 730. [Google Scholar] [CrossRef]
  27. Reijonen, H.M.; Kuva, J.; Heikkilä, P. Benefits of Applying X–ray Computed Tomography in Bentonite Based Material Research Focussed on Geological Disposal of Radioactive Waste. Environ. Sci. Pollut. R. 2020, 27, 38407–38421. [Google Scholar] [CrossRef] [Green Version]
  28. Jha, N.K.; Lebedev, M.; Iglauer, S.; Sangwai, J.S.; Sarmadivaleh, M. In Situ Wettability Investigation of Aging of Sandstone Surface in Alkane via X–Ray Microtomography. Energies 2020, 13, 5594. [Google Scholar] [CrossRef]
  29. Cappuccio, F.; Toy, V.G.; Mills, S.; Adam, L. Three–Dimensional Separation and Characterization of Fractures in X–Ray Computed Tomographic Images of Rocks. Front. Earth Sci. 2020, 8. [Google Scholar] [CrossRef]
  30. Sun, W.; Wu, A.; Hou, K.; Yang, Y.; Liu, L.; Wen, Y. Experimental Study on the Microstructure Evolution of Mixed Disposal Paste in Surface Subsidence Areas. Minerals 2016, 6, 43. [Google Scholar] [CrossRef]
  31. Ouellet, S.; Bussière, B.; Aubertin, M.; Benzaazoua, M. Characterization of Cemented Paste Backfill Pore Structure Using SEM and IA Analysis. B. Eng. Geol. Environ. 2008, 67, 139–152. [Google Scholar] [CrossRef]
  32. Mouret, M.; Bascoul, A.; Escadeillas, G. Microstructural Features of Concrete in Relation to Initial Temperature—SEM and ESEM Characterization. Cem. Concr. Res. 1999, 29, 369–375. [Google Scholar] [CrossRef]
  33. Özer, A.K.; Gülaboǧlu, M.; Bayrakçeken, S. Physical Structure and Chemical and Mineralogical Composition of the Mazidagı (Turkey) Phosphate Rock. Ind. Eng. Chem. Res. 2000, 39, 679–683. [Google Scholar] [CrossRef]
  34. Liu, J.; Wu, R. Bleeding Characteristics and Improving Mechanism of Self–Flowing Tailings Filling Slurry with Low Concentration. Minerals 2017, 7, 131. [Google Scholar]
  35. Saki, M.; Siahpoush, S.; Khaz Ali, A.R. A New Generalized Equation for Estimation of Sandstone and Carbonate Permeability from Mercury Intrusion Porosimetry Data. J. Pet. Explor. Prod. Technol. 2020, 10, 2637–2644. [Google Scholar] [CrossRef]
  36. Pasupathy, K.; Berndt, M.; Sanjayan, J.; Rajeev, P.; Cheema, D.S. Durability Performance of Precast Fly Ash—Based Geopolymer Concrete under Atmospheric Exposure Conditions. J. Mater. Civil. Eng. 2018, 30. [Google Scholar] [CrossRef]
  37. Kermani, M.; Hassani, F.P.; Aflaki, E.; Benzaazoua, M.; Nokken, M. Evaluation of the Effect of Sodium Silicate Addition to Mine Backfill, Gelfill—Part 2: Effects of Mixing Time and Curing Temperature. J. Rock Mech. Geotech. Eng. 2015, 7, 668–673. [Google Scholar] [CrossRef] [Green Version]
  38. Yilmaz, E.; Belem, T.; Bussière, B.; Benzaazoua, M. Relationships between Microstructural Properties and Compressive Strength of Consolidated and Unconsolidated Cemented Paste Backfills. Cem. Concr. Compos. 2011, 33, 702–715. [Google Scholar] [CrossRef]
  39. Sun, X.; Hou, Y. Experimental Investigation of the Macroscopic Behavior and Microstructure Property Evolution of Hardened Cement Consolidated Tailings. Minerals 2020, 10, 6. [Google Scholar] [CrossRef] [Green Version]
  40. Ai, K. Research on Water and Pore Evolution of Mine Filling Slurry Based on NUCLEAR Magnetic Resonance; Central South University: Changsha, China, 2014. [Google Scholar]
  41. Cihangir, F.; Ercikdi, B.; Kesimal, A.; Ocak, S.; Akyol, Y. Effect of Sodium–Silicate Activated Slag at Different Silicate Modulus On the Strength and Microstructural Properties of Full and Coarse Sulphidic Tailings Paste Backfill. Constr. Build. Mater. 2018, 185, 555–566. [Google Scholar] [CrossRef]
  42. Liu, L.; Fang, Z.; Qi, C. Experimental Investigation on the Relationship between Pore Characteristics and Unconfined Compressive Strength of Cemented Paste Backfill. Constr. Build. Mater. 2018, 179, 254–264. [Google Scholar] [CrossRef]
  43. Hu, J.; Zhao, F.; Ren, Q.; Kuang, Y.; Zhou, T.; Luo, Z. Microscopic Characterization and Strength Characteristics of Cemented Backfill under Different Humidity Curing Conditions. R. Soc. Open Sci. 2019, 12. [Google Scholar] [CrossRef] [Green Version]
  44. Li, W.; Wang, Z.; Guo, L.; Xu, W. Study on correlation law between early strength and pore structure of tailing cemented backfill sample. China Min. 2018, 27, 143–147. [Google Scholar]
  45. Gao, F.; Xiong, X.; Zhou, K.; Li, J.; Shi, W. Strength degradation model of water–saturated sandstone under freeze–thaw cycle. Geotech. Mech. 2019, 40, 926–932. [Google Scholar]
  46. Changjiang Academy of Sciences. Yangtze River Water Conservancy Commission, Rock Test Rules for Water Conservancy and Hydropower Projects; Changjiang Academy of Sciences: Wuhan, China, 2001. [Google Scholar]
  47. China Institute of Water Resources and Hydropower Research. Nanjing Institute of Water Resources Science, Hydraulic Concrete Test Rules; China Institute of Water Resources and Hydropower Research: Beijing, China, 2006. [Google Scholar]
  48. Hu, J.; Zhao, F.; Kuang, Y.; Yang, D.; Zheng, M.; Zhao, L. Microscopic Characteristics of the Action of an Air Entraining Agent on Cemented Paste Backfill Pores. Alex. Eng. J. 2020, 59, 1583–1593. [Google Scholar] [CrossRef]
Figure 1. Material particle size distribution and accumulation curve. (a) Fly ash; (b) Cement; (c) Tailings.
Minerals 11 00082 g001
Figure 2. Test flow chart.
Minerals 11 00082 g002
Figure 3. Strength diagram of backfill: (a) Filling strength with different cement-sand ratios; (b) Filling strength with different additives.
Minerals 11 00082 g003
Figure 4. The relationship between the curing age and the strength growth rate of backfill.
Minerals 11 00082 g004
Figure 5. Porosity diagram of backfill: (a) Porosity of backfill with different cement-sand ratio; (b) Porosity of backfill with different additives.
Minerals 11 00082 g005
Figure 6. Relationship between curing age and porosity variation of backfill.
Minerals 11 00082 g006
Figure 7. Fitting results of the strength evolution model of the backfill.
Minerals 11 00082 g007
Table 1. Basic physical parameters of tailings.
Tailing TypePercentageLoosen Volume Weight (t∙m−3)Density Volume Weight (t∙m−3)Maximum Porosity
(%)
Minimum Porosity
(%)
Natural Repose Angle (°)
Graded tailings2.7271.4661.7020.4620.37639
Table 2. The main chemical composition of the materials.
CompositionTailingsCementLimeFly Ash
CaO (%)5.53863.33573.5649.235
SiO2 (%)79.2723.5252.14346.304
Al2O3 (%)4.164.2281.46828.448
Fe2O3 (%)5.343.4470.9844.245
MgO (%)0.3862.8332.1350.667
SO3 (%)2.622.8540.1460.848
Na2O (%)0.1420.0260.0370.268
Ti2O (%)0.1280.1460.0351.297
Table 3. CPMG sequence parameters were tested for backfill porosity.
CPMG Sequence Parameters of NMR
TDPRGTWSWRG1RFDDRG1
60018151500 ms2000 KHz20 db0.002 ms3
CPMGSequence Parameters of NMR
SFO1NSP1P2NECH
12 MHz307,943.42 Hz3211 μs23.04 μs1000
TD, PRG, TW, SW, RG1, RFD, DRG1, SF, O1, NS, P1, P2, NECH represent time data, pre-amp regulate gain, time wait, sampling bandwidth, regulate analog gain 1, regulate first data, regulate digital gain1, spectrometer frequency, offset 1, number of sampling, pulse 2, pulse 2, number of echoes, respectively.
Table 4. Uniaxial compressive strength test results of backfill.
GroupsCement-Sand Ratio3 d Strength (MPa)7 d Strength (MPa)7 d Strength Growth Rate (%)28 d Strength (MPa)28 d Strength Growth Rate (%)
Cement
only
(Group A)
1:40.6471.890192.122.489284.70
1:60.6181.746182.522.081236.73
1:80.5540.6028.661.483167.69
Cement and lime
(Group B)
1:40.5011.206140.721.794258.08
1:60.4530.78873.951.104143.71
1:80.4010.49423.191.010151.87
Cement and fly ash
(Group C)
1:40.8662.343170.552.921237.30
1:60.6871.30489.811.919179.33
1:80.3840.55143.491.098185.94
Table 5. Test results of the porosity of backfill.
GroupsCement-Sand Ratio3 d Porosity (%)7 d Porosity (%)7 d Porosity Variation (%)28 d Porosity (%)28 d Porosity Variation (%)
Cement
only
(Group A)
1:416.70513.1243.5818.5578.148
1:617.98114.9393.04212.855.131
1:823.77820.7143.06415.5748.204
Cement and lime
(Group B)
1:415.63011.9433.6879.8715.759
1:616.84512.3374.50810.5396.306
1:819.02818.6280.40010.4898.539
Cement and fly ash
(Group C)
1:414.04511.9562.08911.8852.160
1:618.86714.1414.72610.2368.631
1:822.04817.8364.21210.52811.520
Table 6. Fitting parameter values of filling strength evolution model.
GroupsCement-Stand RatioFitting Parameters
βλR2
Cement
only
(Group A)
1:041.19530.16050.8493
1:061.08930.24420.9223
1:080.89020.12570.9115
Cement and lime
(Group B)
1:041.01450.22340.9971
1:060.98530.13770.9893
1:081.0860.0990.9695
Cement and fly ash
(Group C)
1:040.99690.52260.98
1:061.02380.11960.9924
1:080.99060.09150.9994
Publisher’s Note: MDPI stays neutral with regard to jurisdictional claims in published maps and institutional affiliations.

