Article

Adsorption Characteristics and Controlling Factors of CH4 on Coal-Measure Shale, Hedong Coalfield

1
School of Earth Resources, China University of Geoscience, Wuhan 430074, China
2
Low Carbon Energy Institute, China University of Mining and Technology, Xuzhou 221008, China
3
School of Resources and Earth Science, China University of Mining and Technology, Xuzhou 221116, China
*
Author to whom correspondence should be addressed.
Minerals 2021, 11(1), 63; https://doi.org/10.3390/min11010063
Submission received: 1 December 2020 / Revised: 27 December 2020 / Accepted: 9 January 2021 / Published: 11 January 2021

Abstract

:
Adsorbed gas is one of the crucial occurrences in shale gas reservoirs; thus, it is of great significance to ascertain the adsorption capacity of shale and the adsorption characteristics of CH4. In this investigation, the Taiyuan–Shanxi Formations’ coal-measure shale gas reservoir of the Carboniferous–Permian era in the Hedong Coalfield was treated as the research target. Our results exhibit that the shale samples were characterized by a high total organic carbon (TOC) and over to high-over maturity, with an average TOC of 2.45% and average Ro of 2.59%. The mineral composition was dominated by clay (62% on average) and quartz (22.45% on average), and clay was mainly composed of kaolinite and illite. The Langmuir model showed a perfect fitting degree to the experimental data: VL was in the range of 0.01 cm3/g to 0.77 cm3/g and PL was in the range of 0.23–8.58 MPa. In addition, the fitting degree depicted a linear negative correlation versus TOC, while mineral composition did not exhibit a significant effect on the fitting degree, which was caused by the complex pore structure of organic matter, and the applicability of the monolayer adsorption theory was lower than that of CH4 adsorption on the mineral’s pore surface. An apparent linear positive correlation of VL versus the TOC value was recorded; furthermore, the normalized VL increased with the growth of the total content of clay mineral (TCCM), decreased with the growth of the total content of brittle mineral (TCBM), while there was no obvious correlation of normalized VL versus kaolinite, illite and quartz content. The huge amount of micropores and complex internal structure led to organic matter possessing a strong adsorption capacity for CH4, and clay minerals also promoted adsorption due to the development of interlayer pores and intergranular pores.

1. Introduction

With the increasing consumption of coal, conventional oil and gas resources, countries around the world have increasingly focused on unconventional oil and gas resources [1,2,3,4,5]. Shale gas is one of the significant unconventional resources, which occurs in dark and high-carbon shale with adsorbed, free and dissolved states; the former two are predominant, while the dissolved gas is scarce, mostly to the point of being negligible. At present, the total recoverable shale gas reservoirs in the world are expected to reach 214.5 × 10¹² m3; in this context, China ranks first with 31.6 × 10¹² m3, with Argentina (22.7 × 10¹² m3), Algeria (20 × 1012 m3), United States (17.7 × 10¹² m3) and Canada (16.2 × 10¹² m3) ranking second to fifth, respectively [6]. The United States, Canada and China have realized commercial development successively, confirming the potential of large-scale exploitation.
The proportion of adsorbed gas is approximately 20–85% in shale reservoirs [7]. Shale reservoirs, as a porous medium with strong heterogeneity, possess complex adsorption mechanisms for CH4 [8,9]; thus, it is necessary to investigate the adsorption capacity, characteristics, influencing factors and control mechanism of CH4 on shale reservoirs prior to shale gas development. Ross et al. (2009) and Zhou et al. (2019) concluded that organic pores and structures have high affinity to CH4, as their complex pore structure and huge internal surface area entail a strong gas storage capacity [10,11]; Gasparik et al. (2014) and Jin et al. (2014) demonstrated that the interlayers of smectite, mixed I/S and other clay minerals develop with a mass internal surface area, which is another significant occurrence space [12,13]. The adsorption of CH4 on shale is a physical adsorption process, which is mainly controlled by the intermolecular force, including the London dispersion force, Debye force and Keesom force, also known as the van der Waals force [14,15]. Xiong et al. (2017), Xu et al. (2019) and Zou et al. (2019) reported on the gas adsorption in shale controlled by temperature and pressure and found that adsorption capacity increases with the growth of pressure while decreasing with the growth of temperature [16,17,18]; Chalmers et al. (2012), Fu et al. (2015) and Sun et al. (2018) suggested that total organic carbon (TOC) is the dominant controlling factor of adsorption capacity; in particular, in the micro and nano-pore structures of organic matter, CH4 molecules are adsorbed on the pore surface and are free in the pore center, where is a linear positive correlation of the gas adsorption capacity with the TOC value [19,20,21]. In addition, mineral composition also has a fundamental impact on adsorption capacity, mainly including clay and quartz; the influence mechanism of these materials is complex, exhibiting positive correlation, negative correlation and no correlation [22,23,24,25,26]. Wang et al. (2016) attempted to fit the CH4 adsorption process with the Langmuir, Brunauer–Emmett–Teller, Dubinin–Radushkevich and Dubinin–Astakhov models, respectively, and identified that the fitting degree of the Langmuir and Dubinin–Astakhov models was the best [27].
Previous studies on the influencing factors of adsorption capacity were mostly controlled by TOC; the effect of mineral content was also affected by TOC, resulting in the correlation being unclear or lacking accuracy. In the Hedong Coalfield, the accumulated thickness of the Taiyuan–Shanxi Formations’ coal-measure shale reservoir is large, and the shale gas there is characterized by huge amounts of resources and a high exploitation potential. However, due to the occurrence characteristics, control mechanisms and pore structure characteristics of shale gas reservoirs in this region, they have not been thoroughly identified; as a result, large-scale commercial development has not yet been realized. In this work, we collected drilling shale samples from the study area, employed experimental tests to obtain the TOC, Ro, mineral composition and isotherm adsorption data and analyzed the adsorption characteristics of CH4. The Langmuir model was performed to fit the experimental results; then, VL and PL were calculated. Additionally, VL was normalized by TOC to determine the correlation of the normalized value with the mineral composition while avoiding the influence of organic matter. The results have a certain theoretical significance for the exploitation and development of shale gas and are of great significance for the research of the CH4 adsorption characteristics and mechanism of shale.

2. Samples, Experiments and Methods

2.1. Sample Collection

The shale samples were collected from the Taiyuan–Shanxi Formations of the Carboniferous–Permian era in the Hedong Coalfield, Shanxi Province, China. The study area is located in the central-southern area of the Hedong Coalfield, on the southeast edge of the Ordos Basin and west of the Shanxi Province (Figure 1). The structure of this area is relatively simple; faults and folds are not extremely developed, as the area is dominated by the Lishi–Zijinshan and Guantouhe fault zones, and the structural extension is generally in north–south and northeast–southwest directions and mainly formed with the Yanshannian tectonic movement. The coal-measure shale reservoirs of the Shanxi–Taiyuan Formations make up the target of our investigation, with the characteristics of multiple layers, moderate thicknesses of single layers, a large cumulative thickness, stable distribution, high organic matter content and strong hydrocarbon generation ability. The buried depth is in the range of 1300–1580 m, corresponding to a set of grayish black silty shale and carbonaceous shale that formed in the transitional sedimentary environment under the background of weak reduction land-surface sea sedimentation. The collected samples were utilized for TOC, Ro, X-ray diffraction and isothermal adsorption experiments.

2.2. Isothermal Adsorption Experiments

The materials used in the experiments included shale particles, high-concentration helium (>99%) and high-concentration CH4 (>99%). We employed the IS-300 (Terra Tek, Beaverton, OR, USA) isothermal adsorption instrument (Figure 2) and conducted the experimental tests according to the national standard GB/T 19560-2008, with a maximum test pressure of 12 MPa. The specific experimental procedures were as follows:
  • Firstly, the shale samples were ground into 60–80 mesh (180–250 μm) particles with a weight of 20 g, then dried in 250 °C for 24 h to remove water;
  • After weighing, the samples were placed into the adsorption chamber, the air tightness of the reference chamber and the adsorption chamber were tested by filling with helium, and the total volume of the adsorption system was determined by the gas expansion method;
  • The adsorption system was vacuum-treated for 1 h, then CH4 was injected into the sample chamber, and the stable reference chamber pressure was recorded;
  • The balanced valve between the reference chamber and the adsorption chamber was opened, the balanced pressure was recorded after 6 h, and the total amount of adsorbed gas per unit mass of sample was calculated.
The above steps were repeated and the experimental pressure increased; then, the total adsorption amount and the adsorption gas amount per unit mass at each pressure point were calculated.

2.3. Langmuir Fitting Model

In this investigation, we combined a mathematical simulation and experimental simulation. Huang et al. (2019), Wang et al. (2019) and Li et al. (2020) have concluded that the adsorption of CH4 on shale corresponds to a type-I adsorption isotherm, and the Langmuir model (Equation (1)) is the most widely accepted method for the fitting of CH4 adsorption behavior [15,28,29]. According to the perspective of adsorption kinetics, Langmuir (1916) proposed that gas molecules were mainly adsorbed by monolayer adsorption, with the following assumptions [30]:
  • Under experimental equilibrium, the adsorption and desorption rates of gas molecules are equal, and the probability of the adsorption/desorption of single gas molecules is equal;
  • The solid interface is uniform, and the adsorption heat is a constant which does not change with coverage;
  • The adsorbed molecules can be desorbed in the form of molecular thermal movement, and molecules returning to a gaseous state will not be affected by other molecules;
  • Theoretically, the adsorption equilibrium is dynamic—namely, the amount of molecules in adsorption and desorption is kept at the same order of magnitude, and the total amount of molecules in the two states does not change. The mathematical equation of the Langmuir model is as follows:
V = V L × P P + P L
where V is the CH4 adsorption capacity in cm3/g; VL is the Langmuir volume (the theoretical maximum adsorption capacity) in cm3/g; P is the gas pressure in MPa; and PL is the Langmuir pressure (the pressure at half of the maximum adsorption capacity) in MPa.

3. Results and Discussion

3.1. Organic Geochemical Characteristics and Mineral Composition

The TOC of the samples was in the range of 0.31–5.21%, with an average of 2.45% (Table 1). Schmoker (1981) and Burnaman (2009) proposed that the lower limit of TOC should be higher than 2.0% for shale gas development and that high-quality source rocks form the basis of gas reservoir formation [31,32]. The Ro value was in the range of 2.23–2.87%, with an average of 2.59% (Table 1), corresponding to over to high-over maturity; the hydrocarbon generated by the organic matter was mainly dry gas, reaching the peak of gas generation conforming to the selection conditions of a high-quality gas reservoir. The mineral composition of shale samples was dominated by clay, with contents in the range of 49.2–73.4%, with an average of 62%. Quartz followed with content ranges from 0% to 41% (22.45% on average). In addition, a few samples contained a certain amount of dolomite, pyrite, siderite, gypsum and laumontite. Furthermore, kaolinite was the dominant component in clay, ranging from 58.3% to 100%, with an average of 79.43%; illite followed, ranging from 0% to 36.2%, with an average of 19.85%. It was also found that the Y3-19 sample contained a little chlorite (Table 2).

3.2. Isothermal Adsorption Characteristics of CH4 and the Langmuir Fitting Results

3.2.1. Experimental Results of CH4 Adsorption

The adsorption capacity of CH4 increases with the increase of experimental pressure until the adsorption equilibrium is reached (Figure 3). Microporous and ultra-microporous internal surface adsorption dominates in the range of 0–2 MPa; with strong adsorption potential, the curves rise sharply, and the adsorption type is transferred from the internal surface to the external surface at 2–12 MPa. The adsorption potential is then obviously weakened, and the slope of the curve decreases and tends to balance gradually. The adsorption curves of CH4 on shale conform to the characteristics of type-I adsorption isotherms in BDDT (Brunauer S-Deming L-Deming W-Teller E) classification, also known as the Langmuir adsorption isotherm, which is formed by the adsorption of a monolayer on the shale matrix; the adsorption force of the first layer is much higher than that of other layers.

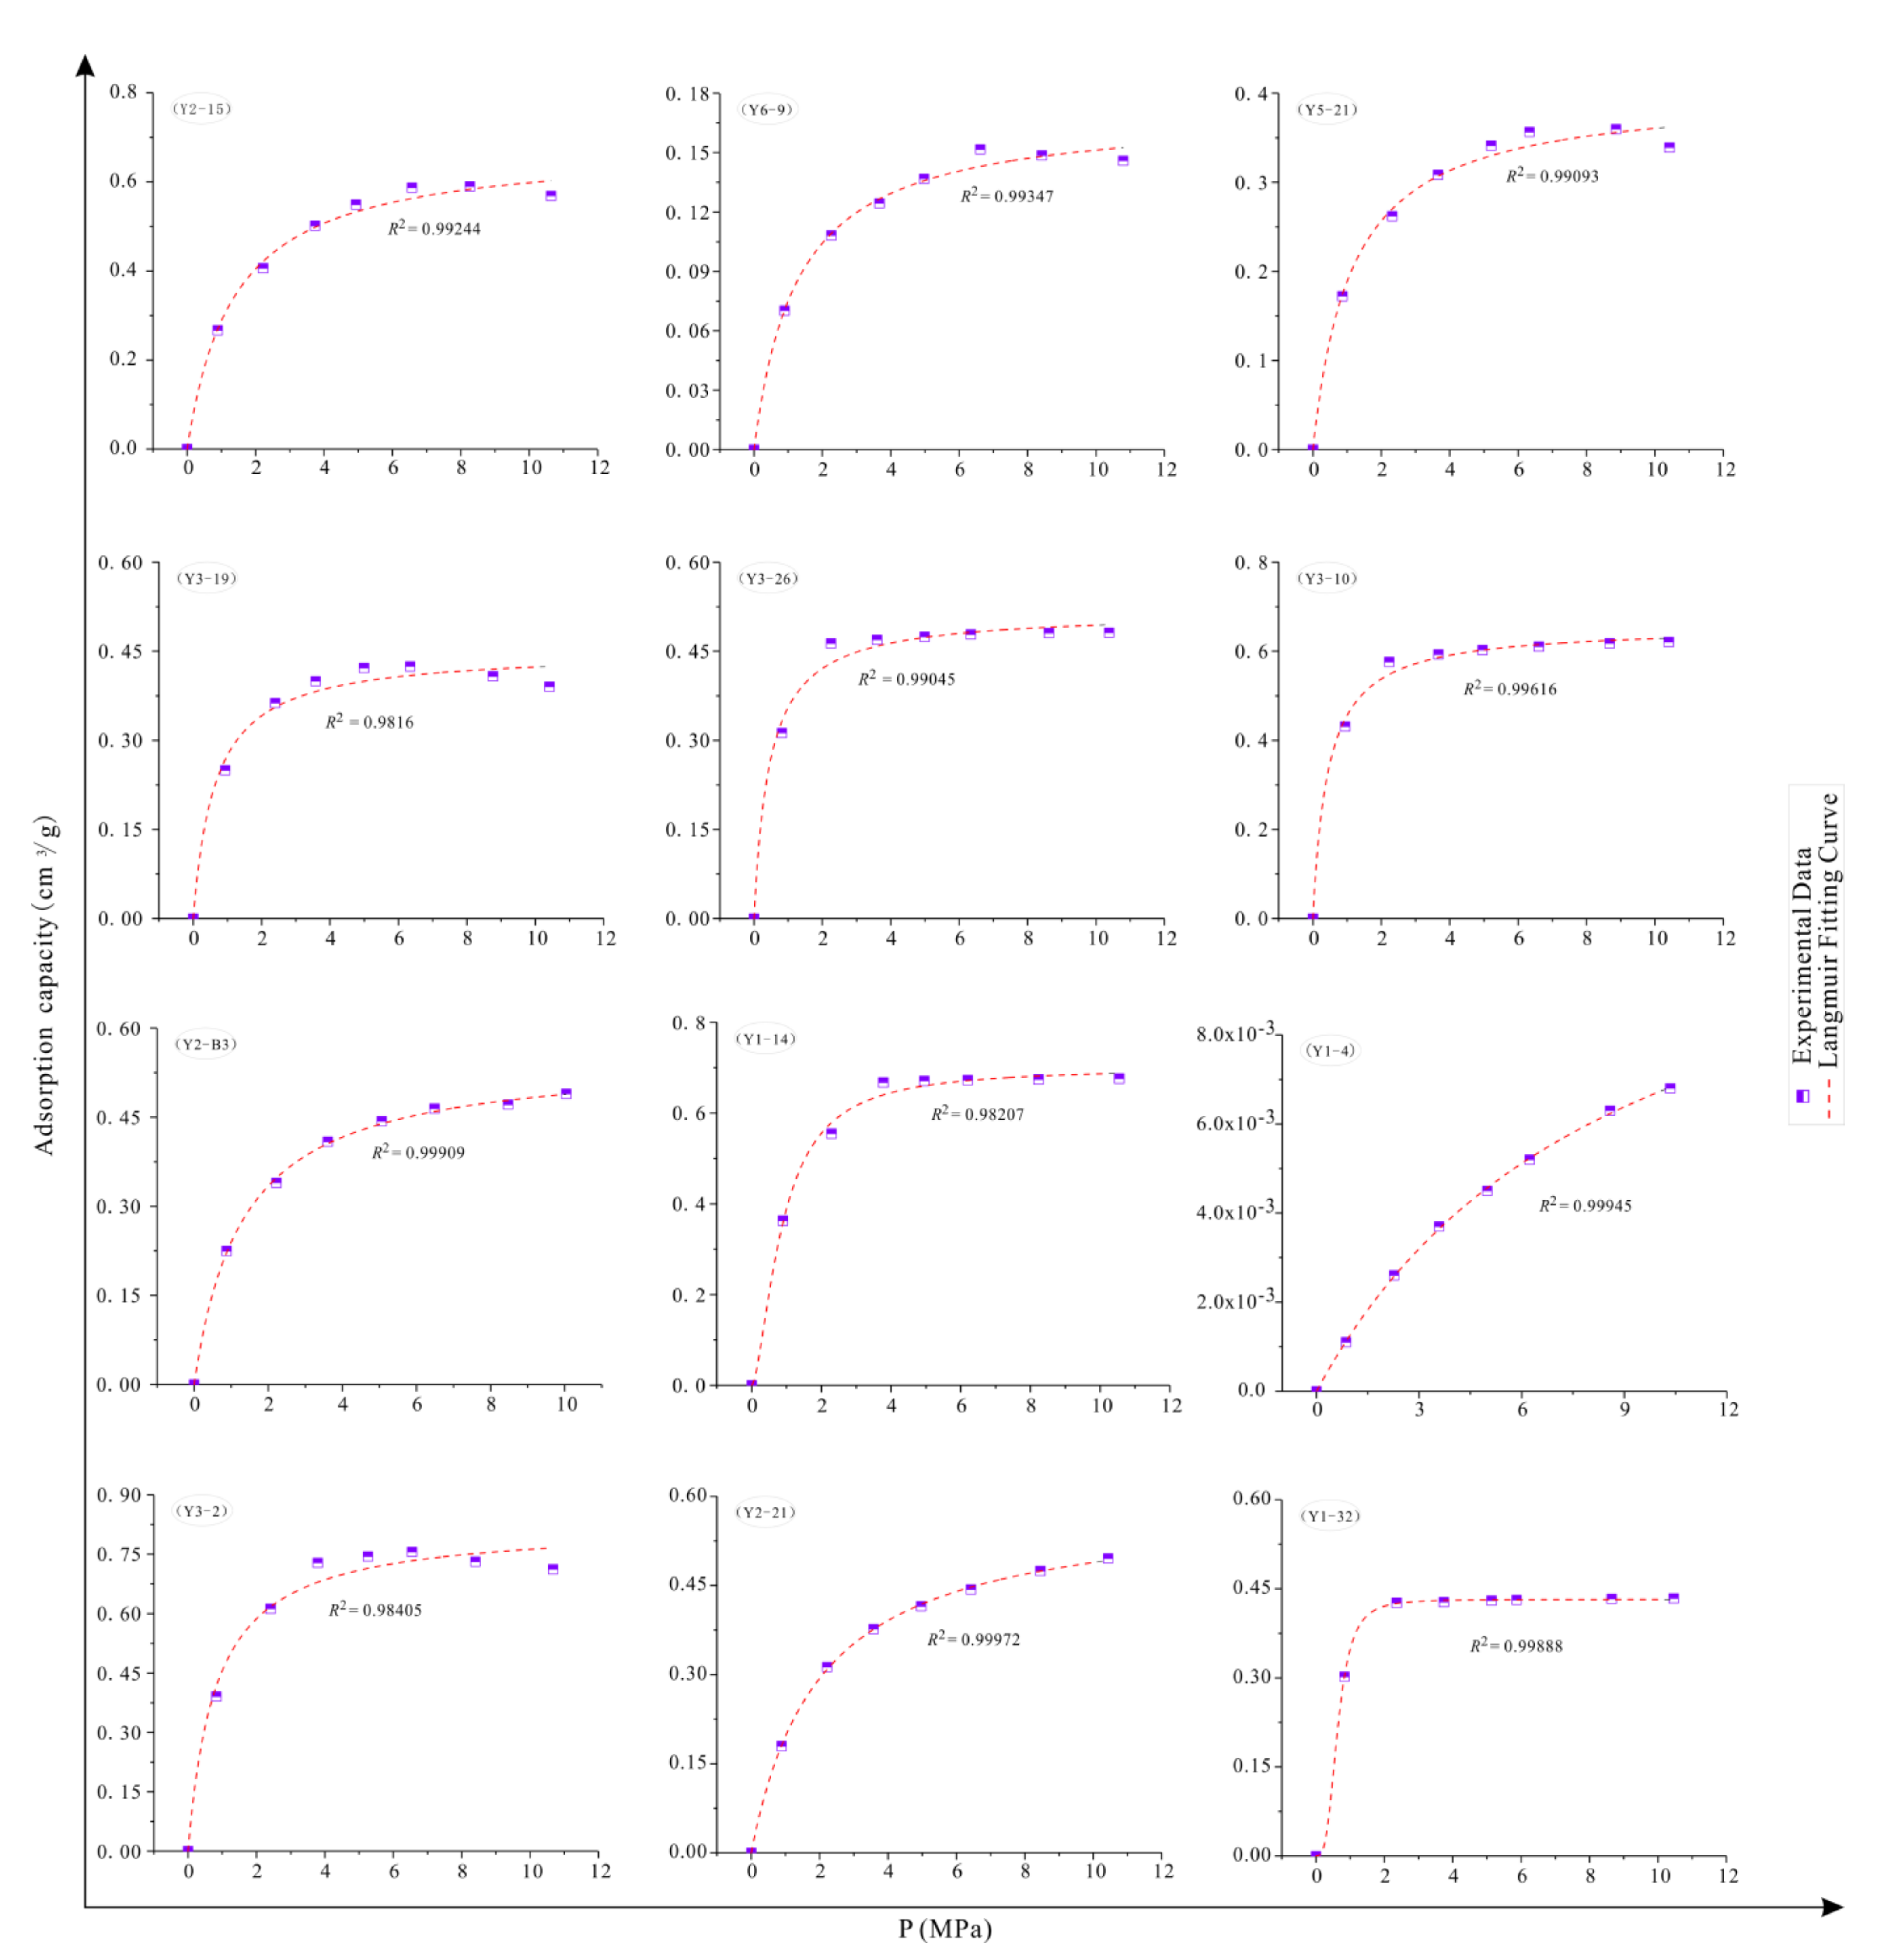
3.2.2. Fitting Results of the Langmuir Model

The maximum adsorption capacity and adsorption curve shape were characterized by VL and PL. The larger the VL, the stronger the adsorption capacity; the lower the PL, the greater the curve winding degree. Figure 3 shows the Langmuir fitting results according to the fitting curves, calculated as VL and PL (Table 3), and the experimental data fitted perfectly, as all of the R2 values were higher than 0.98, ranging from 0.9816 to 0.99972, with an an average of 0.99236 (Table 3 and Figure 3), which indicates high accuracy and high reliability. The VL of the shale samples ranged from 0.01 cm3/g to 0.77 cm3/g, with an average of 0.48 cm3/g, and the PL was in the range of 0.23–8.58 MPa, with an average of 1.25 MPa. Of all samples, the Y1-4 sample had the obvious characteristics of a low VL and high PL, which represented an adsorption curve with a low winding degree; the micropore developed poorly, and resulted in a lower adsorption capacity. By comparison, the adsorption capacities of samples Y1-14 and Y3-2 were the highest.

3.3. Influence of TOC and Mineral Composition on the Fit Degree

A linear negative correlation was recorded for the fitting degree versus TOC (R2 = 0.33623); the fitting degree decreased gradually with an increasing TOC value (Figure 4a). In this work, the organic matter was found to be in a state of over maturity or high-over maturity. In the evolution of organic matter, it experiences the processes of asphaltization, aromatization, cyclocondensation, thermal cracking and demethylation, forming a complex organic matter structure and internal microporous structure. The Langmuir model operates according to the theory of monolayer adsorption, where only one layer of gas molecules is adsorbed on the uniform surface [30]. However, when the surface of the adsorption medium is non-uniform and has a complex microporous structure, adsorption behaviors such as micropore filling and multi-layer will occur. As a consequence, the applicability of the Langmuir model decreases and the fitting degree decreases accordingly. In contrast, the content of clay minerals and brittle minerals exhibits no apparent effect on the fitting degree (Figure 4b–f), which indicates that the intergranular pores, intragranular pores and microfissures tend to be regular under the diagenesis of compaction and cementation, etc. Therefore, the theory of monolayer adsorption is found to be applicable.

3.4. The Impact of TOC and Mineral Composition on VL

In this work, the average TOC value of shale samples was found to reach 2.50% (Table 1), which can therefore be regarded as high-quality source rock. A linear positive correlation was recorded for VL and TOC (R2 = 0.71299), and the adsorption capacity of shale became stronger as the TOC value increased (Figure 5a). Ro was in the range of 2.23–2.87%, with an average of 2.59% (Table 1), which corresponds to over to high-over maturity. The evolution of organic matter was dominated by pyrolysis (demethylation), and the principal pyrolysis product of organic matter is dry gas. Additionally, the previously formed oil cracked to form large amounts of dry gas and reached the peak of gaseous hydrocarbon. Accordingly, a multitude of hydrocarbon-generating pores and complex organic matter structures were formed, greatly increasing the shale adsorption capacity. Hu et al. (2016) and Chen et al. (2019) reported that a high TOC generally corresponds to a high porosity, pore volume and specific surface area, which is especially beneficial to the development of mesopores and indicates that the higher the TOC value, the stronger the shale adsorption capacity [33,34]. Similarly, as depicted in Figure 5a, the TOC value of sample Y1-4 is only 0.31, and its VL value also approaches 0. In contrast, the TOC value of sampleY5-37 reaches 5.21, and the corresponding VL is 1.08 cm3/g, which is obviously higher than that of other samples. This suggests that the porous structure formed when the organic matter evolved to over-maturity; namely, after reaching the peak of gas generation, the adsorption capacity of shale was dominated by TOC. However, Wang et al. (2019) revealed that organic pores did not experience favorable development in scanning electron microscope pictures [15], which implies that, when determining the maturity of a shale gas reservoir, attention should also be paid to the selection of shale gas.
In addition to organic matter pores, intergranular pores, intragranular pores and microfissures are also significant contributors. Figure 5a shows that the interception of the Y axis is not at zero (intercept = 0.06726), meaning that mineral composition also has a certain impact on adsorption capacity rather than only TOC. Under the influence of the TOC value, it is difficult to accurately reflect the correlation of VL with mineral composition. To eliminate the influence of organic matter, the VL is normalized by TOC value: namely, the maximum adsorption capacity corresponding to the unit TOC is obtained, leading to further discussion. VL has a linear positive correlation with TCCM (R2 = 0.3935): the adsorption capacity of shale becomes stronger with the increase of clay content (Figure 5b). The extensive developed interlayer pores and intergranular pores in clay are essential for shale adsorption capacity. The shale gas reservoir was found to be in the late diagenesis stage according to the SY/T 5477-2003 standard in this work. The pores in clay were destroyed by compaction, cementation and recrystallization in the diagenetic process. Fortunately, most of the samples did not contain carbonate, resulting in the effect of cementation being weak, and a proportion of the primary pores was preserved. Furthermore, the performance of different types of clay was distinct: kaolinite and illite, as the main components did not show an obvious correlation (Figure 5d,f). Kaolinite had a weak positive correlation with VL (R2 = 0.00218), while illite showed a weak negative correlation with VL (R2 = 0.03516). During the diagenetic evolution, the clay minerals transformed in the smectite–mixed I/S–illite sequence, accompanied by the expulsion of interlayer water and interlayer cations, and the internal pore structure gradually deteriorated. This is similar to the experimental results of Ji et al. (2012), in which the adsorption capacity of smectite > mixed I/S > kaolinite > chlorite > illite was shown [35].
The total content of brittle minerals (quartz, dolomite, pyrite, siderite, gypsum and laumontite) was not conducive to shale adsorption capacity (Figure 5c). A linear negative correlation was recorded for VL with TCBM (R2 = 0.3935); the pores in brittle minerals were dominated by primary intergranular pores and included a certain amount of secondary dissolved pores and microfissures. The primary pores were poorly preserved under the diagenesis of compaction, cementation and recrystallization, and the content of soluble carbonate in the reservoir was low and unstable, which made it difficult for secondary dissolution pores to develop in other dissolution-resistant minerals. The quartz content was dominant, while no apparent correlation was recorded with VL (Figure 5e). Han et al. (2018) proved that the content of brittle minerals—for instance, quartz—has a negative linear correlation with the specific surface area of micropores and mesopores, while a linear positive correlation is shown with the specific surface area of macropores [36]. The adsorption capacity of shale is controlled by the specific surface area, and the primary contributors are micropores and mesopores; macropores have a negligible impact. This means that the content of brittle minerals is not favorable to the adsorption of CH4 on shale.

3.5. Implications for Shale Gas Exploration and Development

Although China is the most abundant country in terms of shale gas resources, only the Fuling, Zhaotong, Changning and Taiyang blocks have seen successfully realized commercial exploitation; shallow depth reservoirs have been gradually exploited, and a desire was recently expressed to exploit deep gas reservoirs with depths of over 3500 m. However, this is still in the exploration stage due to the production technical and fracturing effects. The Hedong coalfield is an important coal-bearing basin. Coal-measure shale has developed with a high TOC and over maturity, reaching the peak of gas generation. Additionally, the shale reservoir overlaps vertically with coal-measure sandstone and a coal seam, forming multiple sets of gas-bearing systems, leading to great exploration and development potential. Nevertheless, the coal-measure shale is characterized by fast facies transformation, a thin single layer thickness and large cumulative thickness, which increases the difficulty of development to a certain extent. On the other hand, the average clay content is 62, which is far higher than the upper limit (40%) of high-quality gas reservoirs. The expansibility and collapsibility of clay means that it is difficult to ensure the fracturing effect of the reservoir. According to the results of this work and the geological characteristics of the study area, it is concluded that, in the process of shale gas development, reference should be made to the conventional oil and gas development experience to find an interval with a stable sandstone and shale thickness and to try to regard sandstone as the target layer for fracture in order to achieve a favorable fracturing effect and effectively avoid the influence of a high clay content.

4. Conclusions

In this work, TOC, Ro, mineral composition and isotherm adsorption tests were conducted to reveal the maximum adsorption capacity of CH4 on shale and the influencing factors. We have drawn the following conclusions from this study.
  • The coal-measure shale reservoir in the study area has large hydrocarbon generation potential and positive development prospects, with a high TOC and over to high-over maturity. The adsorption curves of CH4 in shale correspond with the characteristics of a type I adsorption isotherm; the adsorption capacity increases with the growth of pressure, and the slope of the curves gradually reduces. The organic structure and internal pore system of the organic matter are complex, and the adsorption behavior of CH4 cannot be fully characterized by monolayer adsorption theory. In contrast, the pore structure in minerals is relatively simple, and the monolayer adsorption theory is more applicable.
  • The adsorption capacity of CH4 on shale is controlled by the coupling of the TOC value and clay content. The pore structure of organic matter is mainly formed by hydrocarbon generation and the expansion of hydrocarbon fluid during kerogen cracking. The adsorption process of CH4 is greatly promoted by the large inner surface area of nano-scale micropores. Additionally, the development of interlayer pores in clay minerals contributes greatly to the pore volume and specific surface area, which is also conducive to the adsorption capacity of CH4 in the shale reservoir. Notably, the average clay mineral content of shale samples is over 60% and the brittleness index is low, which is not conducive to the implementation of hydraulic fracturing and limits the development progress of the reservoir. Further research should focus on promoting reservoir development technology to realize the large-scale commercial development of transitional shale.

Author Contributions

Software, H.D.; writing—review and editing, W.X. and M.W. All authors have read and agreed to the published version of the manuscript.

Funding

Major Project Cultivation of CUMT: 2020ZDPYMS09. Foundation Research Project of National Science and Technology Major Project: 2017ZX05035004-002.

Institutional Review Board Statement

Not applicable.

Informed Consent Statement

Not applicable.

Data Availability Statement

The study did not report any data.

Acknowledgments

The authors gratefully acknowledge the support of the Major Project Cultivation of CUMT (2020ZDPYMS09), the Foundation Research Project of National Science and Technology Major Project (2017ZX05035004-002).

Conflicts of Interest

The authors declare no conflict of interest.

References

  1. Eftekhari, B.; Marder, M.; Patzek, T.W. Field data provide estimates of effective permeability, fracture spacing, well drainage area and incremental production in gas shales. J. Nat. Gas Sci. Eng. 2018, 56, 141–151. [Google Scholar] [CrossRef]
  2. Liu, S.; Wu, C.; Li, T.; Wang, H. Multiple geochemical proxies controlling the organic matter accumulation of the marine-continental transitional shale: A case study of the Upper Permian Longtan Formation, western Guizhou, China. J. Nat. Gas Sci. Eng. 2018, 56, 152–165. [Google Scholar] [CrossRef]
  3. Li, Q.; Li, P.; Pang, W.; Li, D.; Liang, H.; Lu, D. A new method for production data analysis in shale gas reservoirs. J. Nat. Gas Sci. Eng. 2018, 56, 368–383. [Google Scholar] [CrossRef]
  4. Kulga, B.; Ertekin, T. Numerical representation of multi-component gas flow in stimulated shale reservoirs. J. Nat. Gas Sci. Eng. 2018, 56, 579–592. [Google Scholar] [CrossRef]
  5. Kivi, I.R.; Ameri, M.; Molladavoodi, H. Shale brittleness evaluation based on energy balance analysis of stress-strain curves. J. Pet. Sci. Eng. 2018, 167, 1–19. [Google Scholar] [CrossRef]
  6. UNCTAD; World Bank. Community Development Agreements; World Bank Other Operational Studies; World Bank: Washington, DC, USA, 2018. [Google Scholar]
  7. Curtis, J.B. Fractured shale-gas systems. Aapg Bull. 2002, 86, 1921–1938. [Google Scholar]
  8. Hu, Q.; Zhou, W.; Huggins, P.; Chen, W. Pore Structure and Fluid Uptake of the Springer/Goddard Shale Formation in Southeastern Oklahoma, USA. Geofluids 2018, 2018, 5381735. [Google Scholar] [CrossRef]
  9. Chen, F.; Lu, S.; Ding, X.; He, X.; Xing, H. The splicing of backscattered scanning electron microscopy method used on evaluation of microscopic pore characteristics in shale sample and compared with results from other methods. J. Pet. Sci. Eng. 2018, 160, 207–218. [Google Scholar] [CrossRef] [Green Version]
  10. Ross, D.J.; Bustin, R.M. The importance of shale composition and pore structure upon gas storage potential of shale gas reservoirs. Mar. Pet. Geol. 2009, 26, 916–927. [Google Scholar] [CrossRef]
  11. Zhou, J.; Liu, M.; Xian, X.; Jiang, Y.; Liu, Q.; Wang, X. Measurements and modelling of CH4 and CO2 adsorption behaviors on shales: Implication for CO2 enhanced shale gas recovery. Fuel 2019, 251, 293–306. [Google Scholar] [CrossRef]
  12. Gasparik, M.; Bertier, P.; Gensterblum, Y.; Ghanizadeh, A.; Krooss, B.M.; Littke, R. Geological controls on the methane storage capacity in organic-rich shales. Int. J. Coal Geol. 2014, 123, 34–51. [Google Scholar] [CrossRef]
  13. Jin, Z.; Firoozabadi, A. Effect of water on methane and carbon dioxide sorption in clay minerals by Monte Carlo simulations. Fluid Phase Equilibria 2014, 382, 10–20. [Google Scholar] [CrossRef]
  14. Champe, P.C.; Harvey, R.A.; Ferrier, D.R. Biochemistry; Lippincott Williams & Wilkins: Philadelphia, PA, USA, 2005. [Google Scholar]
  15. Wang, M.; Xie, W.; Huang, K.; Dai, X. Fine characterization of lithofacies and pore network structure of continental shale: Case study of the Shuinan Formation in the north Jiaolai Basin, China. J. Pet. Ence Eng. 2019, 175, 948–960. [Google Scholar] [CrossRef]
  16. Xiong, J.; Liu, X.; Liang, L.; Zeng, Q. Adsorption of methane in organic-rich shale nanopores: An experimental and molecular simulation study. Fuel 2017, 200, 299–315. [Google Scholar] [CrossRef]
  17. Xu, H.; Zhou, W.; Hu, Q.; Xianghua, X.; Zhang, C.; Zhang, H. Fluid distribution and gas adsorption behaviors in over-mature shales in southern China. Mar. Pet. Geol. 2019, 109, 223–232. [Google Scholar] [CrossRef]
  18. Zou, J.; Rezaee, R.; Xie, Q.; You, L. Characterization of the combined effect of high temperature and moisture on methane adsorption in shale gas reservoirs. J. Pet. Sci. Eng. 2019, 182, 106353. [Google Scholar] [CrossRef]
  19. Chalmers, G.R.; Bustin, R.M.; Power, I.M. Characterization of gas shale pore systems by porosimetry, pycnometry, surface area, and field emission scanning electron microscopy/transmission electron microscopy image analyses: Examples from the Barnett, Woodford, Haynesville, Marcellus, and Doig units Characterization of Gas Shale Pore Systems. Aapg Bull. 2012, 96, 1099–1119. [Google Scholar]
  20. Fu, H.; Wang, X.; Zhang, L.; Gao, R.; Li, Z.; Xu, T.; Zhu, X.; Xu, W.; Li, Q. Investigation of the factors that control the development of pore structure in lacustrine shale: A case study of block X in the Ordos Basin, China. J. Nat. Gas Sci. Eng. 2015, 26, 1422–1432. [Google Scholar] [CrossRef]
  21. Sun, Y.; Ding, W.; Lu, L.; Li, M.; Chen, P.; Ji, X. Analysis of influence factors of methane adsorption capacity of the Lower Silurian shale. Pet. Sci. Technol. 2018, 36, 2112–2118. [Google Scholar] [CrossRef]
  22. Zhao, J.; Jin, Z.; Jin, Z.; Hu, Q.; Hu, Z.; Du, W.; Yan, C.; Geng, Y. Mineral types and organic matters of the Ordovician-Silurian Wufeng and Longmaxi Shale in the Sichuan Basin, China: Implications for pore systems, diagenetic pathways, and reservoir quality in fine-grained sedimentary rocks. Mar. Pet. Geol. 2017, 86, 655–674. [Google Scholar] [CrossRef]
  23. Li, K.; Zeng, F.; Sheng, G.; Chen, G.; Xia, P. Investigation of fractal characteristics of Taiyuan formation coal-shale from southern Qinshui basin, China, by nitrogen adsorption and desorption analysis. J. Porous Media 2018, 21. [Google Scholar] [CrossRef]
  24. Zhang, M.; Fu, X. Influence of reservoir properties on the adsorption capacity and fractal features of shales from Qinshui coalfield. J. Pet. Sci. Eng. 2019, 177, 650–662. [Google Scholar] [CrossRef]
  25. Liu, H.; Zhang, S.; Song, G.; Xuejun, W.; Teng, J.; Wang, M.; Bao, Y.; Yao, S.; Wang, W.; Zhang, S.; et al. Effect of shale diagenesis on pores and storage capacity in the Paleogene Shahejie Formation, Dongying Depression, Bohai Bay Basin, east China. Mar. Pet. Geol. 2019, 103, 738–752. [Google Scholar] [CrossRef]
  26. Li, F.; Wang, M.; Liu, S.; Hao, Y. Pore characteristics and influencing factors of different types of shales. Mar. Pet. Geol. 2019, 102, 391–401. [Google Scholar] [CrossRef]
  27. Wang, Y.; Zhu, Y.; Liu, S.; Zhang, R. Methane adsorption measurements and modeling for organic-rich marine shale samples. Fuel 2016, 172, 301–309. [Google Scholar] [CrossRef] [Green Version]
  28. Huang, Y.; Dong, L.; Hursthouse, A.; Yu, Y.; Huang, J. Characterization of pore microstructure and methane adsorption of organic-rich black shales in northwestern Hunan, South China. Energy Explor. Exploit. 2019, 38, 473–493. [Google Scholar] [CrossRef] [Green Version]
  29. Li, J.; Lu, S.; Zhang, P.; Cai, J.; Li, W.; Wang, S.; Feng, W. Estimation of gas-in-place content in coal and shale reservoirs: A process analysis method and its preliminary application. Fuel 2020, 259, 116266. [Google Scholar] [CrossRef]
  30. Langmuir, I. Constitution and fundamental properties of solids and liquids. J. Am. Chem. Soc. 1916, 38, 2221–2295. [Google Scholar] [CrossRef] [Green Version]
  31. Schmoker, J.W. Determination of organic-matter content of Appalachian Devonian shales from gamma-ray logs. Aapg Bull. 1981, 65, 1285–1298. [Google Scholar]
  32. Burnaman, M.D.; Xia, W.W.; Shelton, J. Shale gas play screening and evaluation criteria. China Pet. Explor. 2009, 14, 51–64. [Google Scholar]
  33. Hu, J.; Tang, S.; Zhang, S. Investigation of pore structure and fractal characteristics of the Lower Silurian Longmaxi shales in western Hunan and Hubei Provinces in China. J. Nat. Gas Sci. Eng. 2016, 28, 522–535. [Google Scholar] [CrossRef]
  34. Chen, Z.; Song, Y.; Jiang, Z.; Liu, S.; Li, Z.; Shi, D.; Yang, W.; Yang, Y.; Song, J.; Gao, F.; et al. Identification of organic matter components and organic pore characteristics of marine shale: A case study of Wufeng-Longmaxi shale in southern Sichuan Basin, China. Mar. Pet. Geol. 2019, 109, 59–69. [Google Scholar] [CrossRef]
  35. Ji, L.; Zhang, T.; Milliken, K.L.; Qu, J.; Zhang, X. Experimental investigation of main controls to methane adsorption in clay-rich rocks. Appl. Geochem. 2012, 27, 2533–2545. [Google Scholar] [CrossRef]
  36. Han, M.; Han, C.; Han, Z.; Song, Z.; Zhong, W.; Li, H.; Xu, W. Mineral compositional controls on the porosity of black shales from the Wufeng and Longmaxi Formations (Southern Sichuan Basin and its surroundings) and insights into shale diagenesis. Energy Explor. Exploit. 2018, 36, 665–685. [Google Scholar] [CrossRef]
Figure 1. The structural outline map of the Hedong Coalfield and the Taiyuan–Shanxi Formations’ drilling lithology, where DT is the Datong coalfield, QS is the Qinshui coalfield, HX is the Huoxi coal field, NW is the Ningwu coalfield, XS is the Xishan coalfield, CPS is one of the Logging curve types (ANEC APS Near Detector Counts).
Minerals 11 00063 g001
Figure 2. The outline map of the Terratek-300 isotherm adsorption instrument.
Minerals 11 00063 g002
Figure 3. The experimental data of CH4 adsorption isotherm and the Langmuir model fitting results.
Minerals 11 00063 g003
Figure 4. The correlation of fitting degree versus TOC and mineral composition. The fitting degree is the fitting effect of the Langmuir model for isothermal adsorption experimental data, where (a) is the correlation of fitting degree versus TOC, (b) is the correlation of fitting degree versus TCCM, (c) is the correlation of fitting degree versus TCBM, (d) is the correlation of fitting degree versus kaolinite, (e) is the correlation of fitting degree versus quartz and (f) is the correlation of fitting degree versus illite.
Minerals 11 00063 g004
Figure 5. The correlation of VL versus TOC and mineral composition, where VL is the Langmuir volume and normalization VL is the VL normalized by the TOC value. (a) is the correlation of VL versus TOC, (b) is the correlation of VL versus TCCM, (c) is the correlation of VL versus TCBM, (d) is the correlation of VL versus kaolinite, (e) is the correlation of VL versus quartz and (f) is the correlation of VL versus illite.
Minerals 11 00063 g005
Table 1. The organic geochemical characteristics of shale samples. TOC: total organic carbon.
Sample IDTOC (%)Sample IDRo (%)
Y1-40.31Y2-42.8
Y1-144.5Y2-122.87
Y1-221.15Y3-362.35
Y1-322.48Y3-462.42
Y2-53.38Y3-52.44
Y2-151.74Y3-132.23
Y2-211.55Y3-282.65
Y2-B31.71Y5-42.7
Y3-23.39Y5-222.45
Y3-103.17Y5-382.81
Y3-262.86Y5-552.86
Y3-191.83
Y5-212.06
Y5-375.21
Y6-91.45
Table 2. The X-ray diffraction (XRD) test results of the shale samples.
Sample IDXRD Results of Clay (%)XRD Results of Rock (%)
KCITCCMQDolPySidGyLau
Y1-22100 70.4 29.6
Y2-1590 1073.423.4 3.2
Y3-1063.8 36.254.231.414.4
Y3-2691.6 8.456.72.4 3.937
Y3-1958.35.835.960.133.9 1.64.4
Y5-2170 307325.6 1.4
Y5-3781.9 18.15941
Y6-979.8 20.249.221.96.65.73.413.2
TCCM: total content of clay minerals; Q: quartz content; Dol: dolomite content; Py: pyrite content; Sid: siderite content; Gy: gypsum content; Lau: laumontite content; K: kaolinite content; C: chlorite content; I: illite content.
Table 3. The Langmuir fitting results of isothermal adsorption data.
Sample IDVL (cm3/g)PL (MPa)R2
Y1-40.018.580.99945
Y1-140.730.620.98207
Y1-320.450.220.99888
Y2-150.651.140.99244
Y2-210.592.030.99972
Y2-B30.551.280.99909
Y3-20.770.460.98405
Y3-100.640.350.99616
Y3-260.500.290.99045
Y3-190.420.260.9816
Y5-210.390.90.99093
Y6-90.090.550.99347
Publisher’s Note: MDPI stays neutral with regard to jurisdictional claims in published maps and institutional affiliations.

